the Creative Commons Attribution 4.0 License.
the Creative Commons Attribution 4.0 License.
 | 08 Oct 2019
Modelling the response of net primary productivity of the Zambezi teak forests to climate change along a rainfall gradient in Zambia
Maarten C. Braakhekke
Bart Kruijt
Eddy Moors
Iwan Supit
James H. Speer
Royd Vinya
Rik Leemans
Understanding climate change effects on forests is important considering the role forests play in mitigating climate change. We studied the effects of changes in temperature, rainfall, atmospheric carbon dioxide (CO2) concentration, solar radiation, and number of wet days (as a measure of rainfall intensity) on net primary productivity (NPP) of the Zambian Zambezi teak forests along a rainfall gradient. Using 1960–1989 as a baseline, we projected changes in NPP for the end of the 21st century (2070–2099). We adapted the parameters of the dynamic vegetation model, LPJ-GUESS, to simulate the growth of Zambian forests at three sites along a moisture gradient receiving annual rainfall of between 700 and more than 1000 mm. The adjusted plant functional type was tested against measured data. We forced the model with contemporary climate data (1960–2005) and with climatic forecasts of an ensemble of five general circulation models (GCMs) following Representative Concentration Pathways (RCPs) RCP4.5 and RCP8.5. We used local soil parameter values to characterize texture and measured local tree parameter values for maximum crown area, wood density, leaf longevity, and allometry. The results simulated with the LPJ-GUESS model improved when we used these newly generated local parameters, indicating that using local parameter values is essential to obtaining reliable simulations at site level. The adapted model setup provided a baseline for assessing the potential effects of climate change on NPP in the studied Zambezi teak forests. Using this adapted model version, NPP was projected to increase by 1.77 % and 0.69 % at the wetter Kabompo and by 0.44 % and 0.10 % at the intermediate Namwala sites under RCP8.5 and RCP4.5 respectively, especially caused by the increased CO2 concentration by the end of the 21st century. However, at the drier Sesheke site, NPP would respectively decrease by 0.01 % and 0.04 % by the end of the 21st century under RCP8.5 and RCP4.5. The projected decreased NPP under RCP8.5 at the Sesheke site results from the reduced rainfall coupled with increasing temperature. We thus demonstrated that differences in the amount of rainfall received in a site per year influence the way in which climate change will affect forest resources. The projected increase in CO2 concentration would thus have more effects on NPP in high rainfall receiving areas, while in arid regions, NPP would be affected more by the changes in rainfall and temperature. CO2 concentrations would therefore be more important in forests that are generally not temperature- or precipitation-limited; however, precipitation will continue to be the limiting factor in the drier sites.
- Article
(4053 KB) - Full-text XML
-
Supplement
(662 KB) - BibTeX
- EndNote


The tropical Zambezi teak forests represent some of the most important forest types of southern Africa. They are distributed in Angola, Botswana, Namibia, Zambia, and Zimbabwe. These forests are a source of various ecosystem services, including valuable commercial timber produced from Baikiaea plurijuga Harm (Piearce, 1986a, c). Additionally, the Zambezi teak forests play a substantial role in mitigating climate change as carbon sinks (Sarmiento and Gruber, 2002). This role is influenced by climate change through the mechanisms of forests' net primary productivity (NPP). The effects of these climatic changes vary with location, ecosystem types, and climate zones (Wu et al., 2011). While increased temperature stimulates plant productivity to its optimal temperature in some plants (Wu et al., 2011), it also exponentially stimulates autotrophic plant respiration (Burton et al., 2008; Wu et al., 2011). Such increasing temperature effects can either be enhanced or moderated, depending on whether water availability decreases or increases (Chen et al., 2013). Reduced rainfall generally suppresses the productivity of the plants (Wu et al., 2011).
In southern Africa, rainfall has declined (Hoerling et al., 2006; Niang et al., 2014) and dry spells have increased (New et al., 2006) over the last few decades. Model projections indicate that this trend will continue in the future. During the past half century, mean annual temperatures increased by 0.5 ∘C in some parts of Africa (Niang et al., 2014). By the end of the 21st century, southern African mean temperatures are projected to increase by between 3.4 and 4.2 ∘C above the 1981–2000 baseline under the A2 scenario (Niang et al., 2014).
In southern Zambia, maximum temperatures increased by 1 ∘C between 1976 and 2016 (Dube and Nhamo, 2018), and over the past 30 years, the Zambian mean temperatures have increased by 0.6 ∘C (Bwalya, 2010). Thirty-one years of temperature records showed a substantial increase in average seasonal temperatures (October–April) (Mulenga et al., 2017). By the year 2070, Zambia's temperatures are projected to increase by 2.9 ∘C with reference to 1880 (Government of the Republic of Zambia et al., 2007). Between 1976 and 2016, rainfall reduced by 47 mm in southern Zambia (Dube and Nhamo, 2018). Magadza (2011) reported a declining trend in rainfall beginning in the early 1980s, though other researchers did not find significant changes in Zambia's rainfall (Kampata et al., 2008; Mulenga et al., 2017; Stern and Cooper, 2011). Drought and seasonal floods have increased in Zambia and the worst drought was experienced in 1991/1992 (Government of the Republic of Zambia et al., 2007). The latest drought was recorded in the 2007/2008 rainy season (Bwalya, 2010). During the 1978/1979 season, Zambia experienced the wettest conditions ever (Bwalya, 2010). Projections show that by the year 2070, Zambia's rainfall will increase with reference to 2010 (Government of the Republic of Zambia et al., 2007).
In Zambia, the potential effects of climate change on the forests remain uncertain and the response of NPP to climate change could be diverse due to strong heterogeneity and variability in regional contemporary climatic conditions and the differences in projected future climatic conditions. Thus, understanding how terrestrial NPP responds to climate change is important as it subsequently affects various ecosystem services (Piearce, 1986a, c; Sarmiento and Gruber, 2002). In this study, we applied the LPJ-GUESS model (Ahlström et al., 2012; Smith et al., 2001) to quantify the projected future effects of changes in temperature, rainfall, CO2 concentration, solar radiation, and number of wet days on NPP under RCP4.5 and RCP8.5. We projected changes in NPP for the end of the 21st century (2070–2099) with reference to the 1960–1989 period as a baseline. Our overall objective was to assess the future response of the NPP to climate change in the Zambezi teak forests along a rainfall gradient in Zambia.
2.1 Study sites
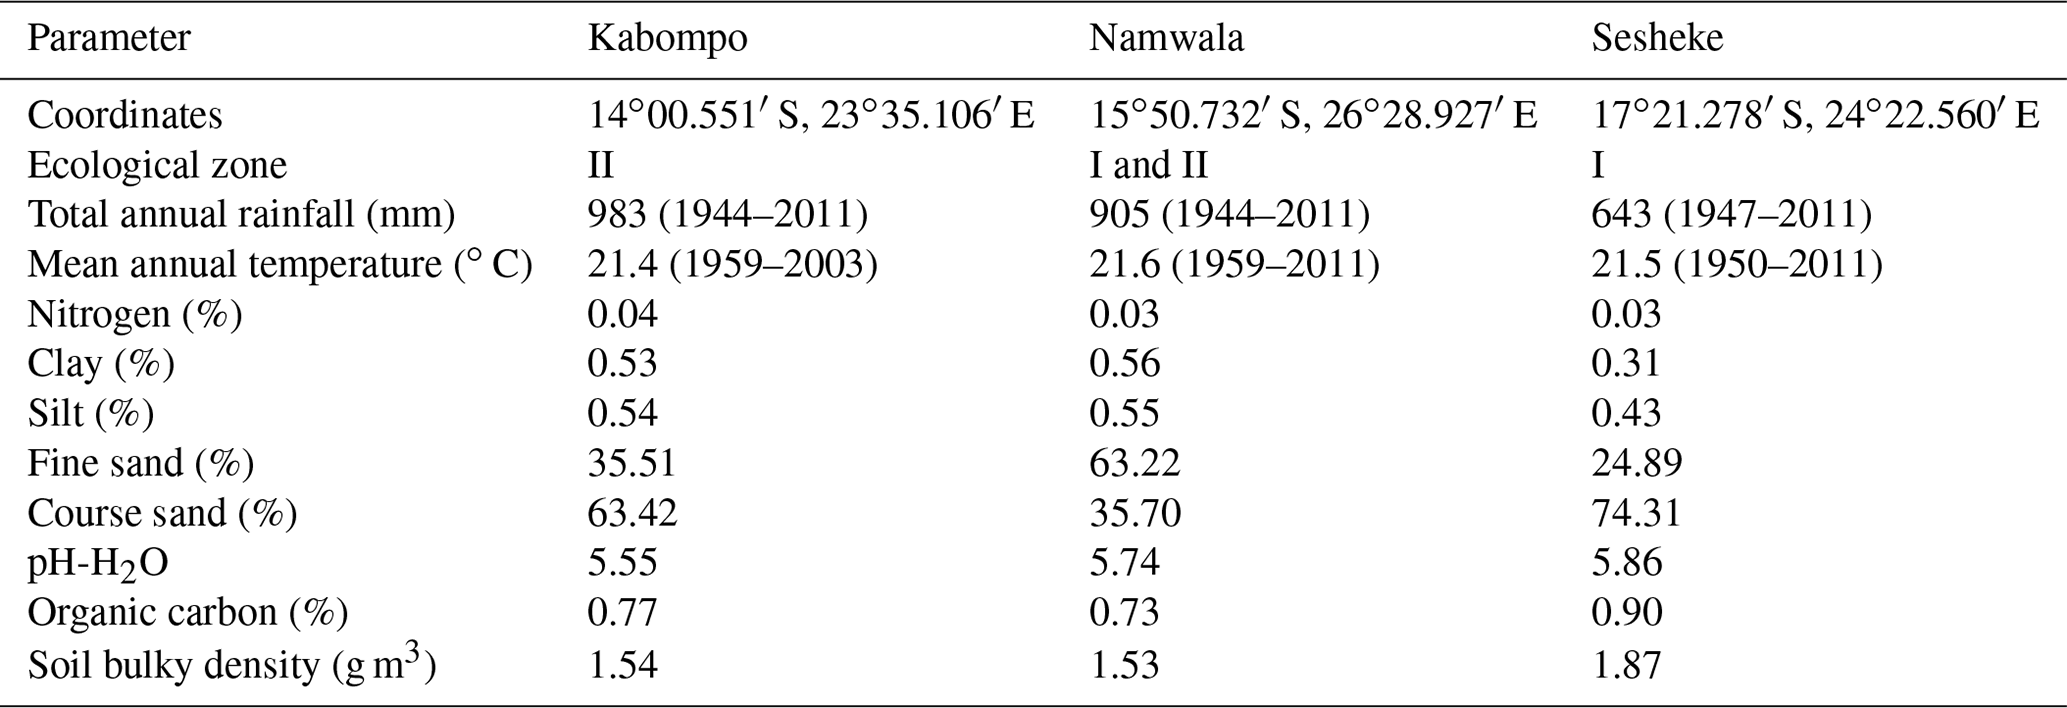
We carried out the study for the Zambian Zambezi teak forests at the Kabompo (14∘00.551′ S, 023∘35.106′ E), Namwala (15∘50.732′ S, 026∘28.927′ E), and Sesheke (17∘21.278′ S, 24∘22.560′ E) sites. At the Sesheke site, the Masese forest reserve was assessed, while at the Namwala site, we assessed the Ila forest reserve. At the Kabompo site, we studied the Kabompo and Zambezi forest reserves. While the Masese forest reserve is found in the drier agro-ecological zone I, the Kabompo and Zambezi forest reserves are located in the wetter ecological zone II. The Ila forest reserve at the Namwala site stretches along ecological zones I and II (Fig. 1 and Table 1).
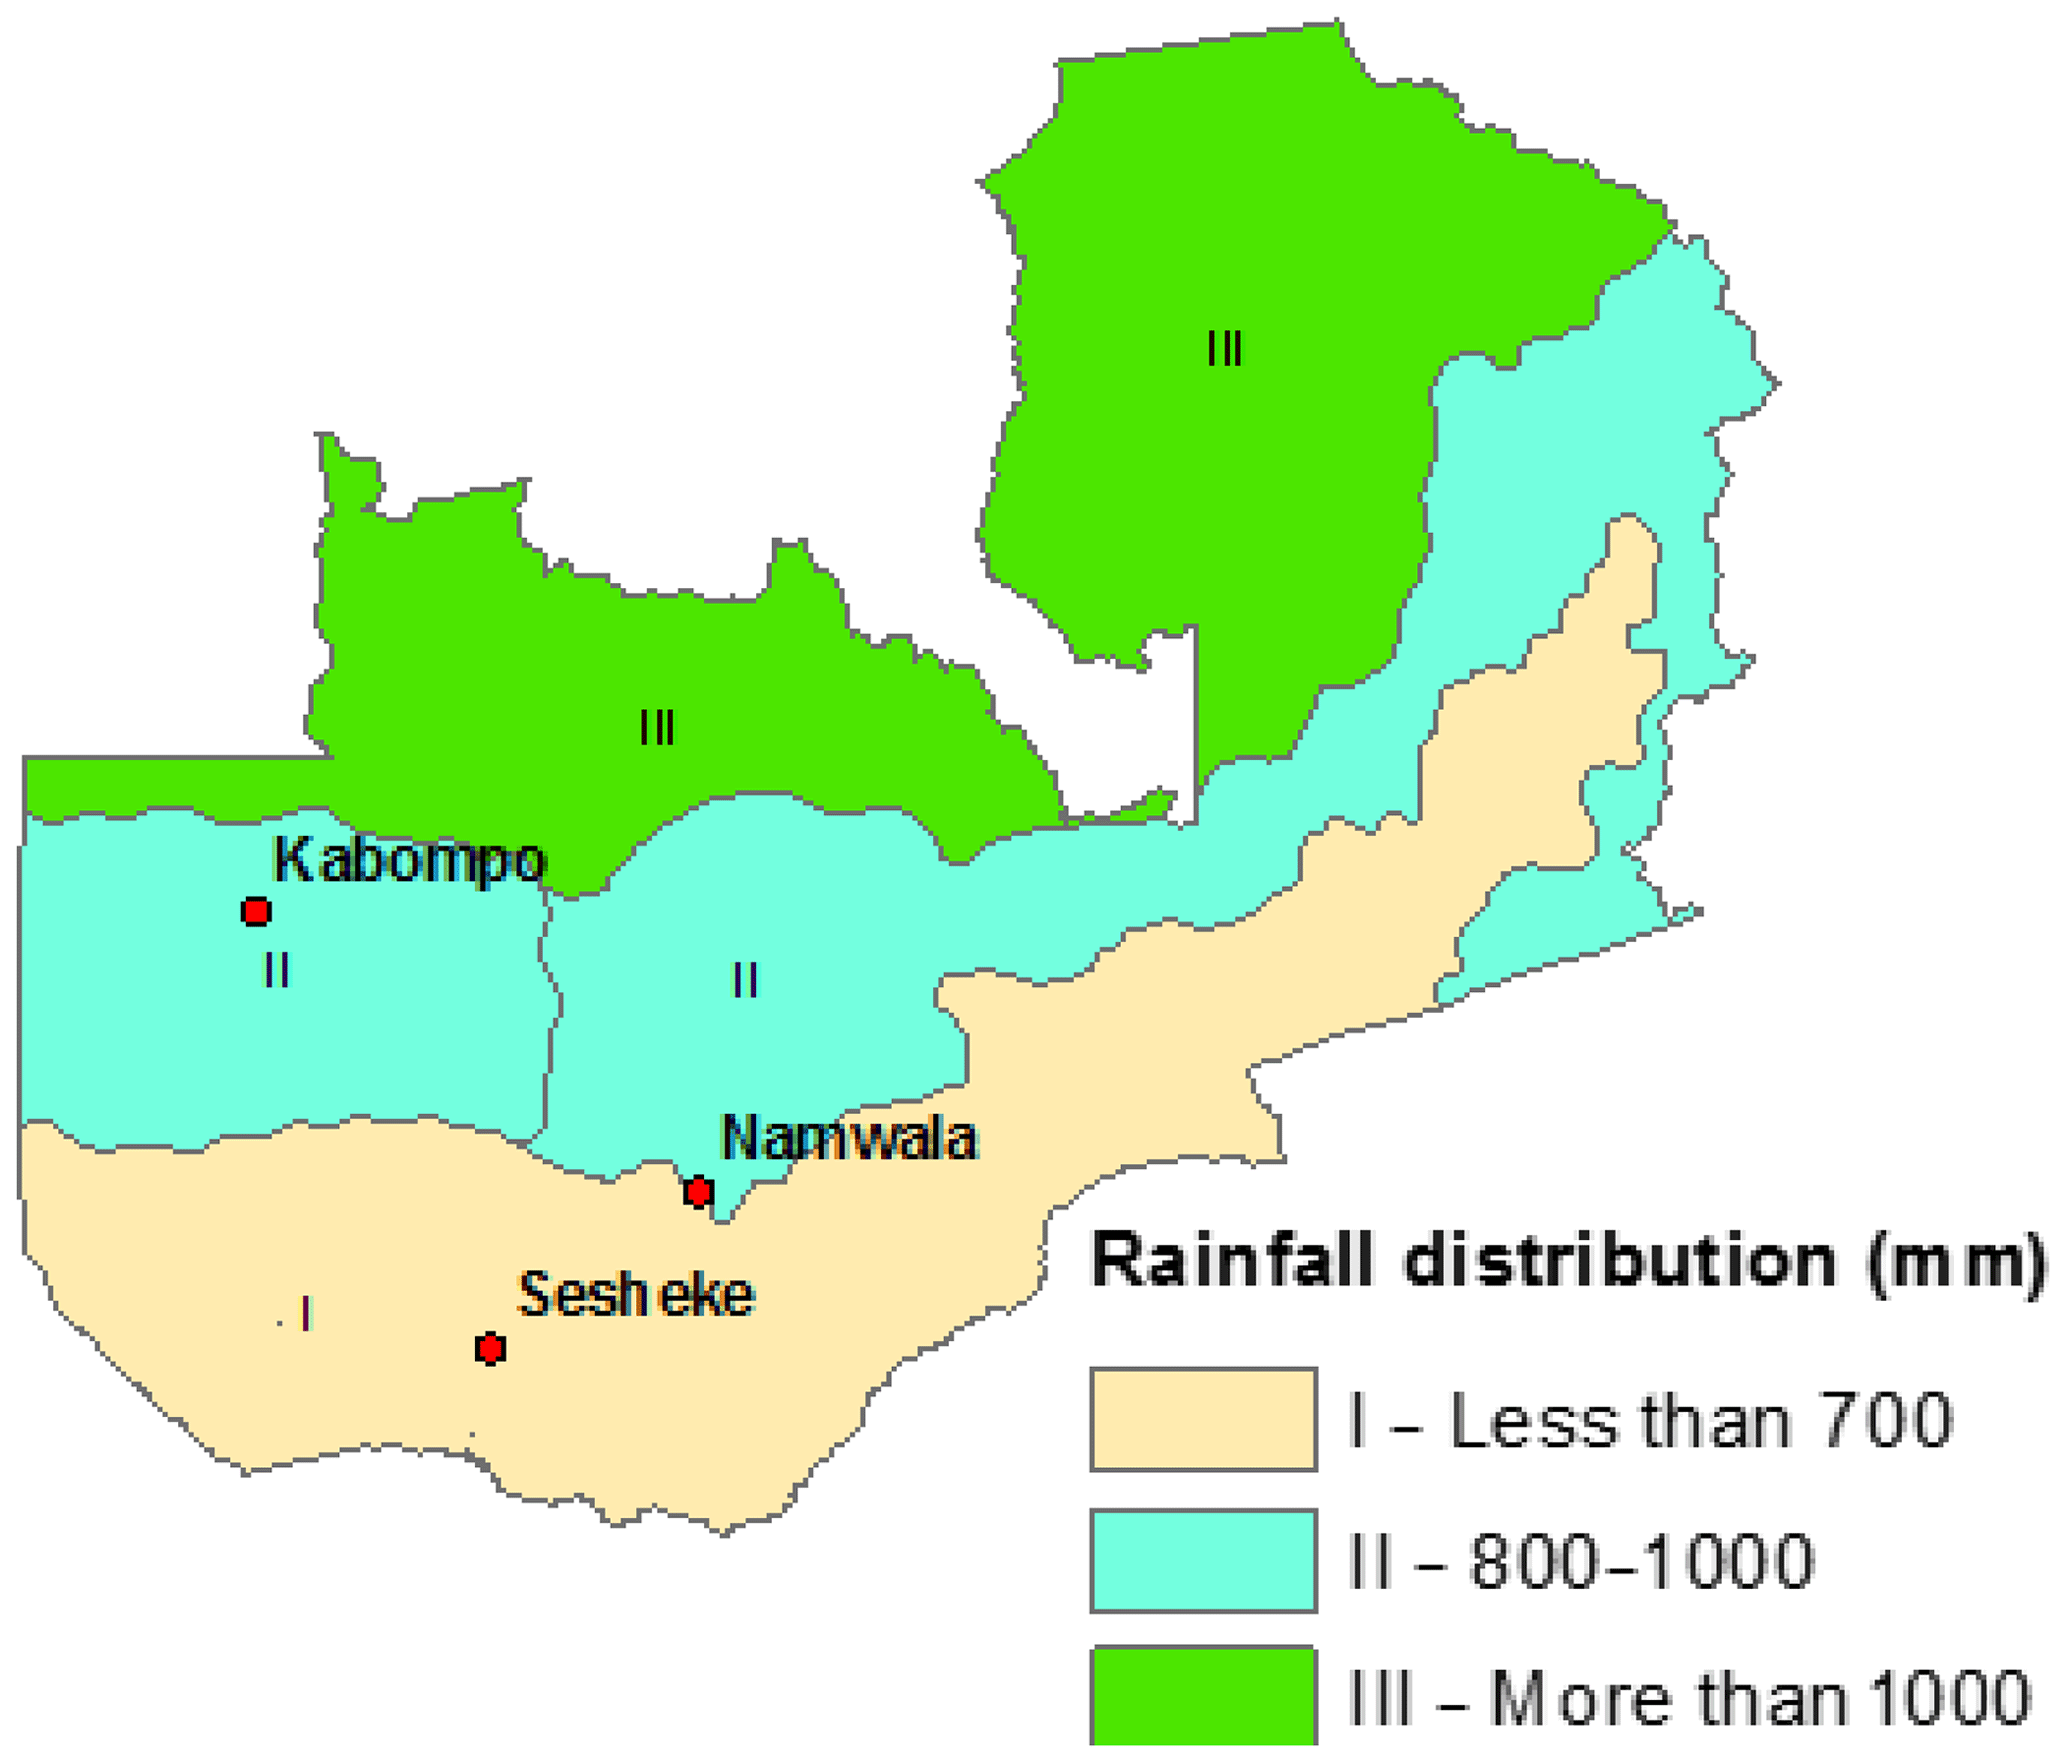
Figure 1Distribution of rainfall and study sites following ecological zones I, II, and III (Sitwala Wamunyima, personal communication, 2014).
Table 1Climate and soil characteristics at Kabompo, Namwala, and Sesheke. For rainfall and temperature, the period covered for average values presented is given in brackets.
2.2 Description of the Zambezi teak forests
The Zambezi teak forests cover 9 % of Zambia's total forest area (Matakala et al., 2015) and store between 15 and 36 t C ha−1 (Ngoma et al., 2018a) across a south–north climatic gradient with annual rainfall ranging from 700 to 1100 mm. They are found in the flat areas covered with a thick layer of Kalahari sands (Government of the Republic of Zambia, 1996). The forests are composed of 80 tree species (Ngoma et al., 2018a, b), but Baikiaea plurijuga Harms is most common (i.e. 50 % of the total surveyed stems) (Ngoma et al., 2018a, b, 2017). These forests are two-storeyed with either a closed or open canopy (Mulolwa, 1986). Trees of the Zambezi teak forests grow up to 20 m high and 120 cm in diameter (Piearce, 1986b), and they tolerate shade. For example, seedlings of Baikiaea plurijuga need some shade to survive (PROTA4U, 2017). Shade-tolerant species are able to dominate a closed forest and seeds are able to germinate in a closed forest. For Baikiaea plurijuga, regeneration is mainly from seeds, though seedlings are usually destroyed by wild animals within the forests (Piearce, 1986a). The forests have a deciduous shrub layer which is locally known as mutemwa and grows up to 3 to 6 m high. During the rainy season the forests have a ground layer of herbs and grasses (Mulolwa, 1986). These herbs and grasses have shallow root systems that develop during the rainy season and die or become dormant during the dry season. The Zambezi teak forests are threatened by deforestation, and between 1975 and 2005 the forests halved in area (Musgrave, 2016) due to logging and agricultural activities, driven by economic and population growth (Matakala et al., 2015; Theilade et al., 2001). Climate change is another threat to the Zambezi teak forests. Following the characteristics of the Zambezi teak forests and the defined plant functional types (PFTs) (Ahlström et al., 2012; Sitch et al., 2003), we used the “deciduous tropical broadleaved rain green” PFT in our study. Deciduous tropical trees shed their leaves during the dry season (see Appendix A in Ngoma et al., 2017, for the Zambezi teak forests in different seasons of the year).
2.3 Soil and tree parameter data sources
We collected data on soil and vegetation parameters from the field survey (Ngoma et al., 2018a, b). We analysed soil parameters down to 1.5 m depth from the plots where we conducted the vegetation survey (Ngoma et al., 2018a). We determined soil texture and bulk density following the method by Sarkar and Haldar (2005) and organic carbon by Walkley and Black (1934) (see Table S1 in the Supplement for details). Data on crown area, tree diameter, and total tree height were collected from the field survey in our previous studies (Ngoma et al., 2018a, b), while data on leaf longevity were determined from specific leaf area (SLA) (Reich et al., 1997) to parameterize the LPJ-GUESS model. We determined SLA from the tree leaves we collected from the trees that we felled to develop allometric equations (Ngoma et al., 2018a, b). Data on vegetation carbon and tree-ring indices for the LPJ-GUESS model validation were taken from the biomass (Ngoma et al., 2018a, b) and dendrochronological (Ngoma et al., 2017) studies respectively.
2.4 Climate data sources
We used RCP4.5 and RCP8.5 with an ensemble of five global circulation models (GCMs): CNRM-CM5, EC-EARTH, HADGEM2-ES, IPSL-CM5A-LR, and MPI-ESM-LR (see Table S2 for full names). The climate data were re-gridded from the original spatial resolution of the climate model to a resolution of 0.5∘ × 0.5∘. We applied the method by Piani et al. (2010) to bias-correct daily rainfall and temperature (minimum and maximum) values from the five GCMs against the WATCH Forcing Data (Weedon et al., 2011). The solar radiation data were bias-corrected following the method by Haddeland et al. (2012) using WATCH forcing data series (1971–2000) as a reference.
Both contemporaneous and projected data on temperature, rainfall, solar radiation, and number of wet days were taken from CMIP5: CNRM-CM5.1 (Voldoire et al., 2013), EC-Earth (Hazeleger et al., 2011), HADGEM2-ES (Collins et al., 2011), IPSL-CM5A-LR (Dufresne et al., 2013), and MPI-ESM-LR (Giorgetta et al., 2016; Jungclaus et al., 2013). Data on CO2 concentration were taken from the Representative Concentration Pathway (RCP) database: RCP4.5 (Clarke et al., 2007; Smith and Wigley, 2006; Wise et al., 2009) and RCP8.5 (Riahi et al., 2007).
We collected local climate data from local weather stations. Forcing data on observed temperature, rainfall, and cloud cover were collected from local weather stations within the respective ecological zones. We collected local climate data from 15, 13, and 28 weather stations for the Sesheke, Kabompo, and Namwala sites respectively (see Fig. S7 in the Supplement). The surveyed Ila forest reserve at the Namwala site stretches in zones I and II; thus, climate data were averaged from all local weather stations in both zones. Contemporaneously the number of wet days was downloaded from the Climatic Research Unit (CRU) website (University of East Anglia Climatic Research Unit et al., 2015).
2.5 Projected climate conditions: RCP4.5 and RCP8.5
In this study, we defined climate as the average weather pattern over a period of 30 years. Climate change was thus defined as the difference between the climates of two periods. We used 1960–1989 as the baseline to determine the relative climate change for the end of the 21st century (2070–2099).
Data from CMIP5 show that temperature (Fig. 2b) and incoming solar radiation (Fig. 2c) are projected to increase by the end of the 21st century (2070–2099) at all sites under both RCPs relative to 1960–1989. Temperature increases by 3 ∘C at all sites by the end of the 21st century under RCP4.5, while, under RCP8.5, temperature is projected to increase by 5 ∘C at the Kabompo and Namwala sites and by 6 ∘C at the Sesheke site. Rainfall is projected to decrease by 33 and 23 mm at Kabompo and Sesheke respectively and to increase by 28 mm at Namwala under RCP8.5 by 2099. Under RCP4.5, rainfall will increase by 32 and 3 mm at Namwala and Sesheke respectively, while at Kabompo, rainfall will decrease by 10 mm by the end of the 21st century (Fig. 2a). The number of wet days will decrease at all sites under both RCPs by the end of the 21st century (Fig. 2d). Carbon dioxide concentration is projected to almost double under RCP8.5 by 2099 (Fig. 2e).
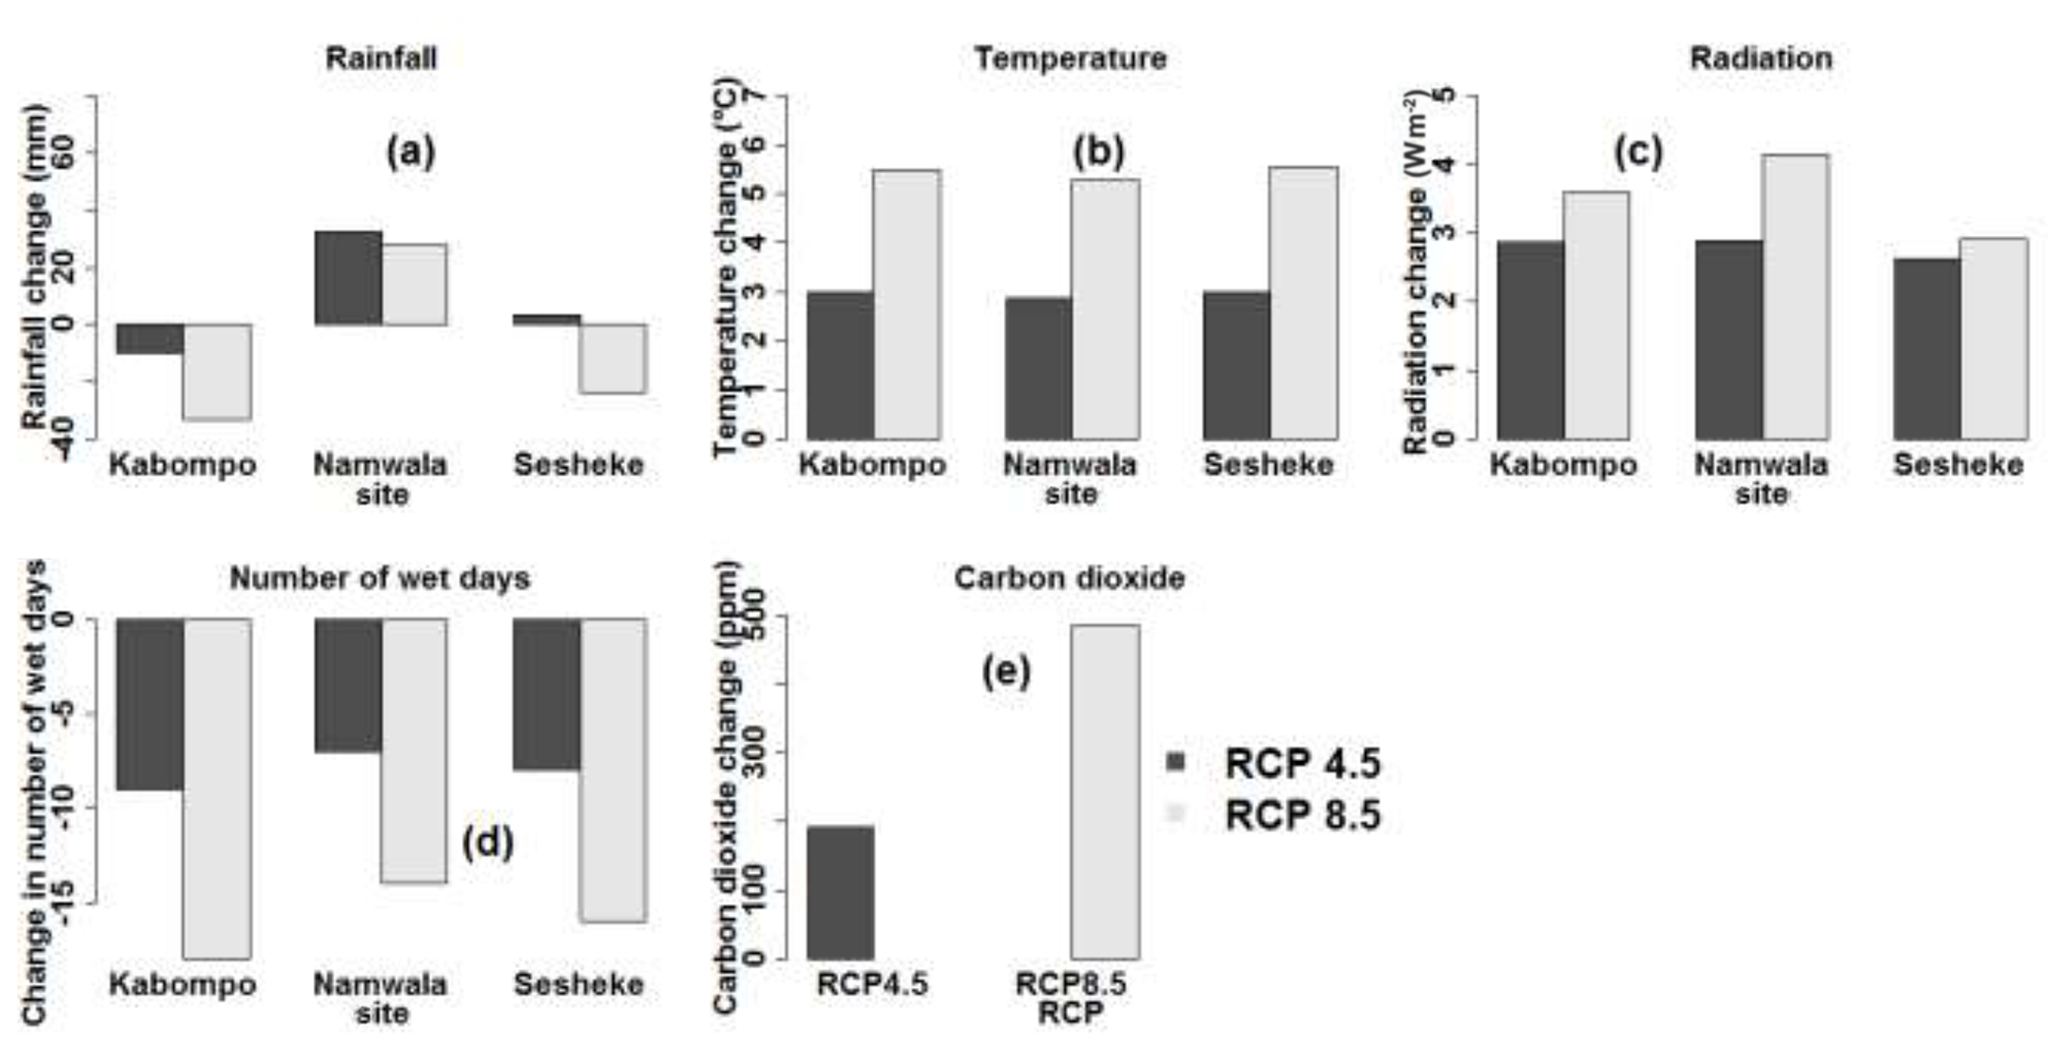
Figure 2Projected changes in rainfall (a), mean temperature (b), incoming solar radiation (c), number of wet days (d), and CO2 concentration (e) under RCP4.5 and RCP8.5 by the end of the 21st century. The end of the 21st century is the period 2070–2099. Values were determined as means of the five GCMs and changes were determined with reference to the 1960–1989 period as the baseline. For sources of data, refer to Sect. 2.4.
2.6 The LPJ-GUESS model description
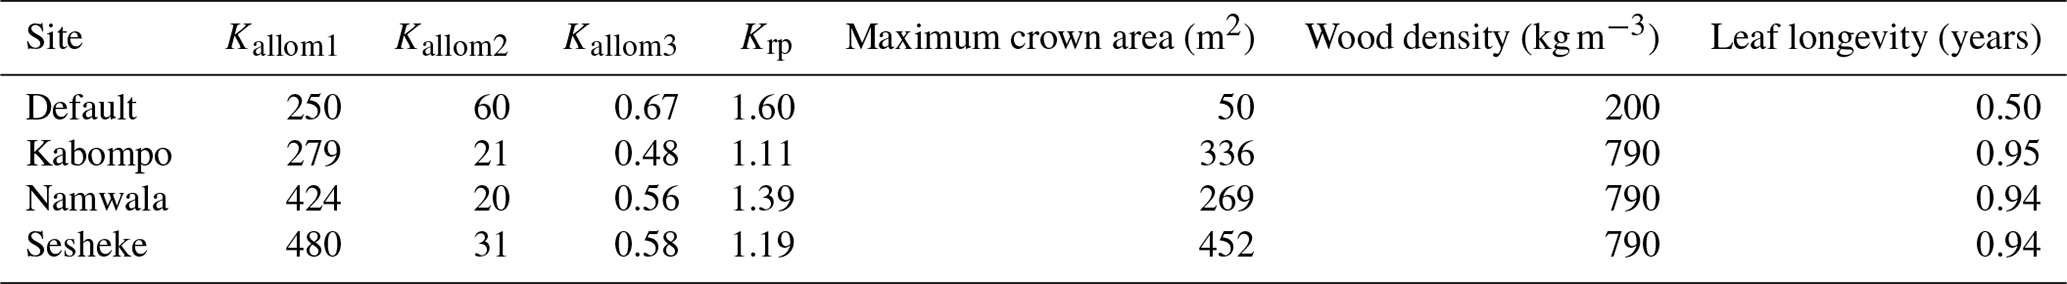
LPJ-GUESS (Ahlström et al., 2012; Smith et al., 2001) is a dynamic vegetation model (DVM) optimized for local, regional, and global applications. However, we applied the model at the local scale in our study. The model uses temperature, precipitation, solar radiation, number of wet days, CO2 concentrations, and soil texture as input variables to simulate the exchange of water and carbon between soils, plants, and the atmosphere. The ecosystem composition and structure is then determined for each simulated scale of which in our study it was for local scale. One grid cell has a number of patches of approximately 0.1 ha in size (Smith et al., 2001). Each patch has a mixture of PFTs (Ahlström et al., 2012; Sitch et al., 2003) distinguished by their bioclimatic niche (distribution in climate space), growth form (tree or herb), leaf phenology (evergreen, summer green, or rain green), photosynthetic pathway (C3 or C4), and life history type (shade-tolerant or shade-intolerant). In a patch, each woody plant belongs to one PFT and has a unique set of parameters that control establishment, phenology, carbon allocation, allometry, survival response to low light conditions, scaling of photosynthesis and respiration rates, and the limits in climate space the PFT can occupy. These parameters are represented in the model through different equations. The equations given below show how some of the parameters that we modified from the default to local values (see Table 2) are represented in the model.
Table 2Local and default tree parameter values used in LPJ-GUESS. Krp, Kallom1, Kallom2, and Kallom3 are constants in allometric equations (see Sect. 2 and Smith et al., 2001). Default parameters were provided together with the model code (Smith et al., 2001).
In the LPJ-GUESS model, leaf longevity has a direct relationship with carbon storage. This relationship is implemented by relating the SLA (m2 kg C−1) to leaf longevity (see Eq. 1) according to the “leaf economics spectrum” (Reich et al., 1997).
where α is leaf longevity (in years).
Photosynthesis, stomatal conductance, plant water uptake, and evapotranspiration are modelled concurrently on a daily time step by a coupled photosynthesis and water module, which was adapted from the BIOME3 model (Haxeltine and Prentice, 1996). Soils have an upper (0.0 to 0.5 m) and a lower (0.5 to 1.5 m) layer, identical in texture. Water enters the upper soil layer through precipitation. Transpiration and evapotranspiration deplete the water content of the soil. Additional depletion of soil water may occur through percolation beyond the lower soil layer and out of reach by plant roots. Uptake by plants is partitioned according to the PFT-specific fraction of roots situated in each layer (Smith et al., 2001).
NPP is determined from gross primary productivity (GPP) after accounting for maintenance and growth respiration. The accrued NPP is allocated on an annual basis to leaves, sapwood, and fine roots, enabling tree growth (Sitch et al., 2003). This allocation is adjusted such that the following four allometric equations, or “constraints”, controlling the structural development of the average individual, remain satisfied: leaf area to sapwood cross-sectional area relationship (McDowell et al., 2002) (see Eq. 2), the functional balance constraint (see Eq. 3), the stem mechanics equation (Huang et al., 1992) (see Eq. 4), and the crowding constraint (see Eq. 5) (Reineke, 1933). In LPJ-GUESS, crown area (m2 per individual) is determined from stem diameter (see Eq. 6) and tree diameter is derived from the sapwood, heartwood, and wood density (see Eq. 7). The reader is referred to Smith et al. (2001) for details.
We used LPJ-GUESS version 3.0 and implemented a “cohort mode” for our study (Braakhekke et al., 2017; Smith et al., 2001). Though this model version accounts for nitrogen dynamics in soil and vegetation, we did not switch nitrogen on during our simulations.
where Klasa, Klr, Krp, Kallom1, Kallom2, and Kallom3 are all constants, LAI is the leaf area index, SA is the sapwood cross-sectional area (m2), Cleaf is leaf carbon (kg C m2), Croot is root carbon (kg C m2), ω is the mean annual value of a drought-stress factor which varies between 0 and 1, and higher values represent greater water availability. In our study we used a value of 0.35, which is the water-stress threshold for leaf abscission (i.e. the point at which the leaves start shading). H stands for total tree height (m), D is tree diameter (m), N stands for population density (individuals m−2), CA is crown area (m2), WD stands for wood density (kg C m−3), Csapwood is sapwood carbon (kg C m2), and Cheartwood is heartwood carbon (kg C m2).
2.7 Model setup
We initiated the model with a 1000-year spin-up at each site to allow the model time to reach equilibrium in all carbon pools. We spun up the model with observed climate data from local weather stations and contemporaneously modelled climate data during the respective model runs. Observed climate data are temperature, rainfall, and cloud cover data observed from local weather stations in the respective study sites, while contemporaneous data on CO2 concentration were downloaded from the RCP database (RCP Database, 2018). Data on the number of wet days per month were downloaded from the Centre for Environmental Data Analysis (University of East Anglia Climatic Research Unit et al., 2015). Contemporaneously modelled climate data are temperature, rainfall, number of wet days per month, and solar radiation averaged from the five GCMs described under Sect. 2.4 and from CO2 concentration data downloaded from the RCP database (RCP Database, 2018).
Using observed local climate data, we forced LPJ-GUESS during the spin-up with a repeated cycle of 30-year climate data for 1959–1988 and a constant CO2 concentration of 316 ppm, corresponding to the observed value for 1959. After the 1000-year spin-up period, the model was forced with a 53-year observed climate and CO2 values, corresponding to the 1959–2011 period at the Namwala and Sesheke sites. We forced the model with a 45-year observed climate and CO2, corresponding to the 1959–2003 period at the Kabompo site. CO2 had reached 375 and 390 ppm by 2003 and 2011 respectively.
Before forcing the model with projected climate data, we first spun up the model with 30 years of modelled climate data from 1960 to 1989 and a constant CO2 of 317 ppm, corresponding to 1960. We then forced the model with 46-year contemporaneously modelled climate data for the period 1960–2005. We used CO2 data for the same period of 1960–2005 and, by 2005, CO2 had reached 379 ppm.
After the spin-up period, and using observed local climate data at the respective sites as forcing, we performed a factorial experiment to determine the effects of various tree parameters (Table 2) and soil textures (Tables 1 and S1) on different model outputs. We first ran the model with default tree parameters that were provided together with the model code. These are tree parameters from the literature, but provided together with the model code (see Table 2). After identifying some limitations (Sect. 3.2), we tested the effects of local tree parameter values listed in Table 2 that coincided with the locations of our measurement plots (Ngoma et al., 2018a). We assessed effects of changing each parameter separately and of changing all parameters combined at each site (Table 2). We further assessed the effects of soil by running the model with default soil parameters (provided with the model code on a 0.5×0.5 global grid) and with local soil parameters derived from samples at the respective sites (Table S1). Results at each site were averaged for 45 years (1959–2003) at Kabompo and for 53 years (1959–2011) at the Namwala and Sesheke sites. Forcing the model with observed climate data and using local tree and soil parameters, we compared the LPJ-GUESS-simulated carbon stocks and NPP with measured carbon stock (Ngoma et al., 2018a, b) and tree-ring indices (Ngoma et al., 2017) respectively.
We performed a factorial experiment for projected effects of temperature, rainfall, CO2 concentration, incoming solar radiation, and number of wet days per month for the end of the 21st century (2070–2099) following RCP4.5 and RCP8.5. To isolate the contemporary effects of each of these climatic variables, the model was forced with the 1960–2005 values of the input climate variable of interest while keeping the 1960 values constant for the other input climatic variables. When assessing the projected effects, we forced the model with projected climate values for the period 2006–2099 of the input climate variable of interest while keeping the 2006 value constant for the other input climatic variables.
3.1 The LPJ-GUESS model validation
We forced the LPJ-GUESS model with observed local climate data and used local tree (Table 2) and soil parameter values (Table S1) to validate the model. We validated the model by comparing standardized tree-ring indices to LPJ-GUESS-simulated annual NPP, i.e. for the period 1970–2003 at the Kabompo site and 1959–2011 at the Namwala and Sesheke sites. The Nash–Sutcliffe model efficiency (NSE) coefficient indicated that the tree-ring indices and LPJ-GUESS-simulated NPP compared poorly at all three sites (Kabompo: , Namwala: , and Sesheke: ).
We also validated the model by comparing measured vegetation carbon with simulated vegetation carbon at the respective study sites. We forced the model with local climate data and ran it with default soil and tree parameters to assess its performance, and the model over-estimated vegetation carbon stock at all sites by between 44 % and 145 %. However, replacing default with local soil parameters (Table S1), maximum crown area, wood density, leaf longevity, and allometry (Table 2), the error reduced to 5 %, 47 %, and 17 % at the Kabompo, Namwala, and Sesheke sites respectively compared to measured vegetation carbon (Fig. 3).
We further assessed the LPJ-GUESS model performance by comparing measured and simulated tree heights and crown area. Using Eq. (4), tree heights estimated using default tree parameter values (Table 2) of Kallom2 and Kallom3 were taller than those estimated using local tree parameters of these same constants for the measured tree diameter at breast height (DBH) at all sites (Fig. 4). Applying the mean absolute percentage error (Sileshi, 2014) to indicate allometric model performance, tree heights were over-estimated by 111 % at Kabompo, 156 % at Namwala, and 56 % at Sesheke when we used default tree parameter values of Kallom2 and Kallom3 in the allometric equation compared to measured tree heights. Using local tree parameter values (Table 2), tree heights were over-estimated by 2 % and 1 % at Kabompo and Namwala and under-estimated by 8 % at Sesheke respectively. Thus, both default and local tree parameters over-estimated tree heights at Kabompo and Namwala compared to measured heights, though the over-estimation was largest with default parameters (Fig. 4).

Figure 3Measured versus LPJ-GUESS-simulated vegetation carbon stock simulated with default soil parameters, default tree parameters, and observed local climate (a); with local soil, local tree parameters, and observed local climate (b); and with local soil, local tree parameters, and modelled contemporaneous climate (c). NSE stands for Nash–Sutcliffe efficiency (Nash and Sutcliffe, 1970).
The crown area, estimated with Eq. (6), was under-estimated by 61 % at Kabompo and Namwala and by 76 % at Sesheke when we used default tree parameters. However, with local tree parameters, the model under-estimated crown area by 15 %, 11 %, and 23 % at Kabompo, Namwala, and Sesheke respectively compared to measured crown area (Fig. 5 and Table 2).

Figure 4Measured and predicted total tree height, plotted against DBH at Kabompo (a), Namwala (b), and Sesheke (c).
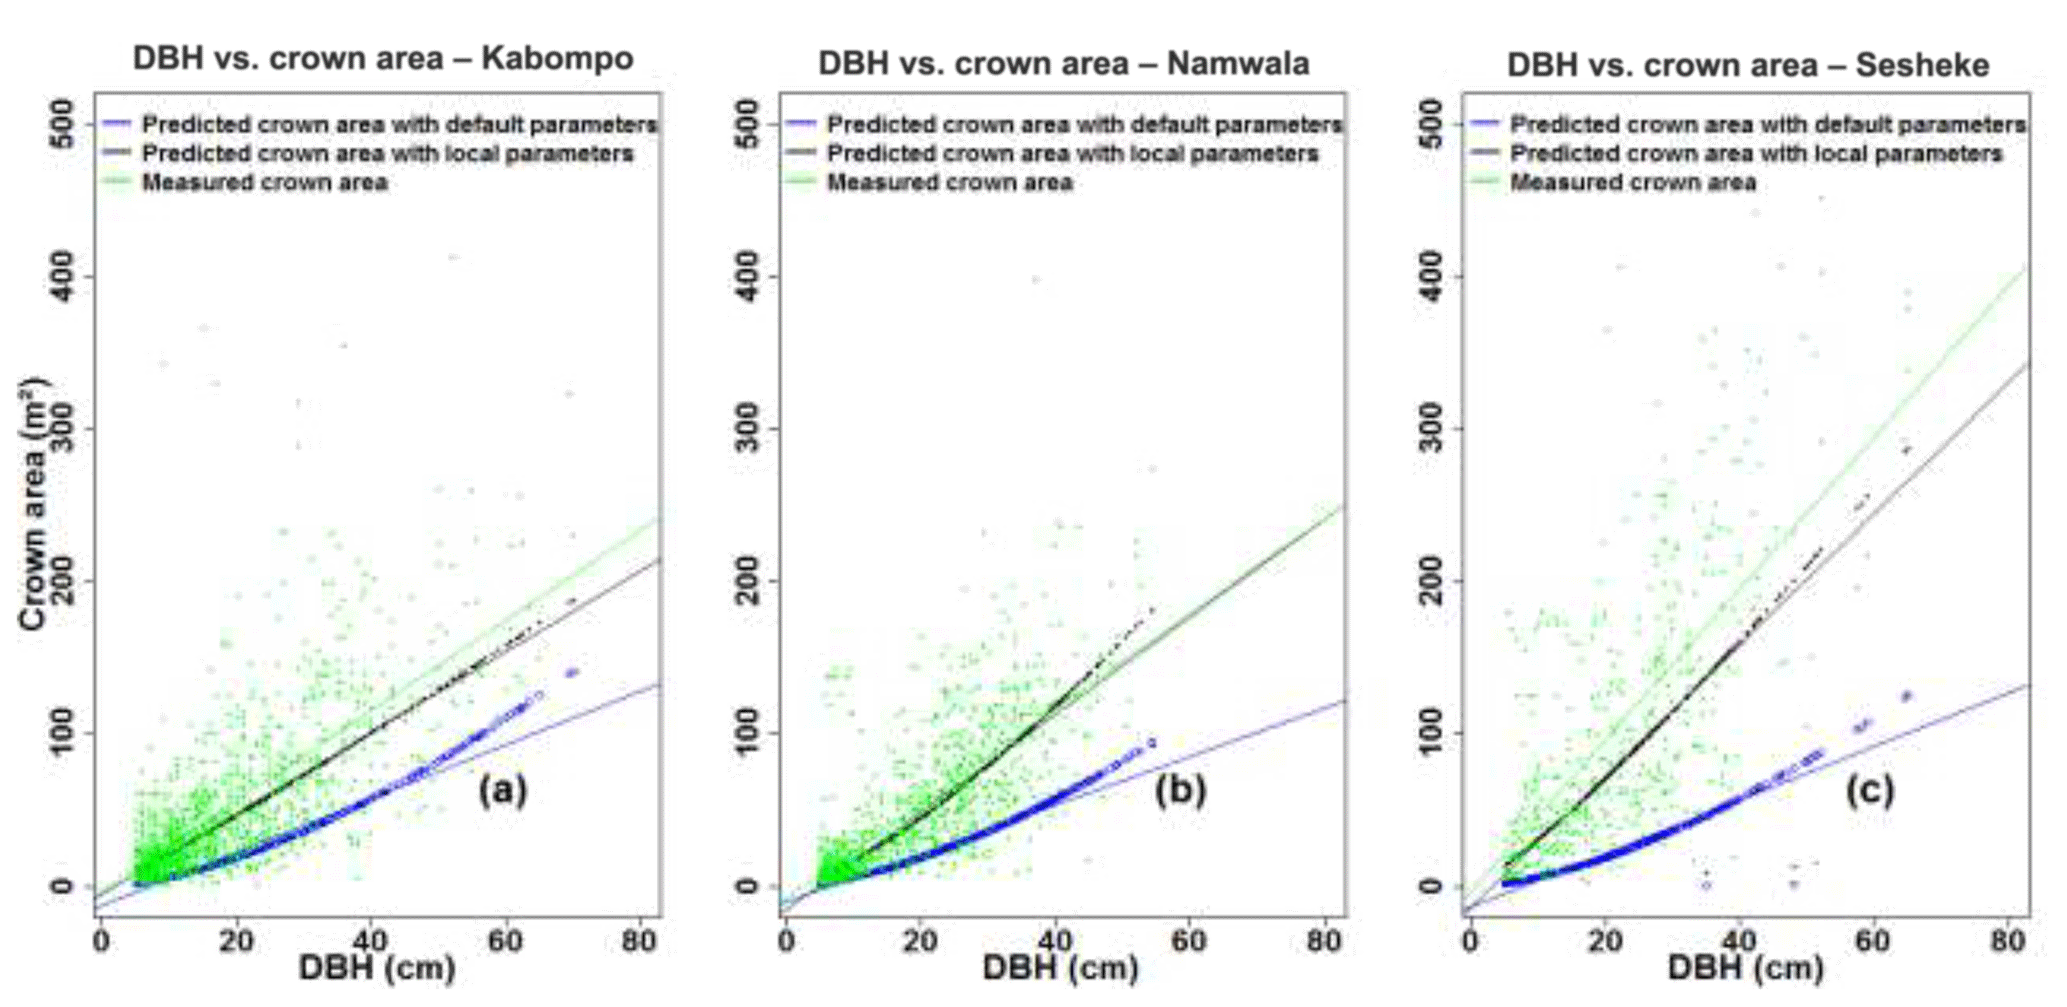
Figure 5Measured and predicted crown area plotted against DBH at Kabompo (a), Namwala (b), and Sesheke (c).
3.2 Carbon stocks, LAI, and NPP
Running the LPJ-GUESS model with local soil and tree parameters and forcing it with local observed climate data for the period 1960–2003, vegetation carbon stocks and leaf area index (LAI) were highest at Kabompo, and Sesheke had the lowest values. The aggregated three carbon pools (vegetation, litter, and soil carbon) were highest at Kabompo and lowest at Namwala. Vegetation carbon was lower when we forced the LPJ-GUESS model with contemporaneously modelled climate data for the period 1960–2003 at all sites compared to the values simulated with observed local climate data (Figs. 6 and S6). Vegetation carbon stocks, LAI, and NPP simulated with both local soil and local tree parameters and forcing of the model with local climate data were lower at all sites compared to values generated by default tree and soil parameters (Figs. 6 and S6).
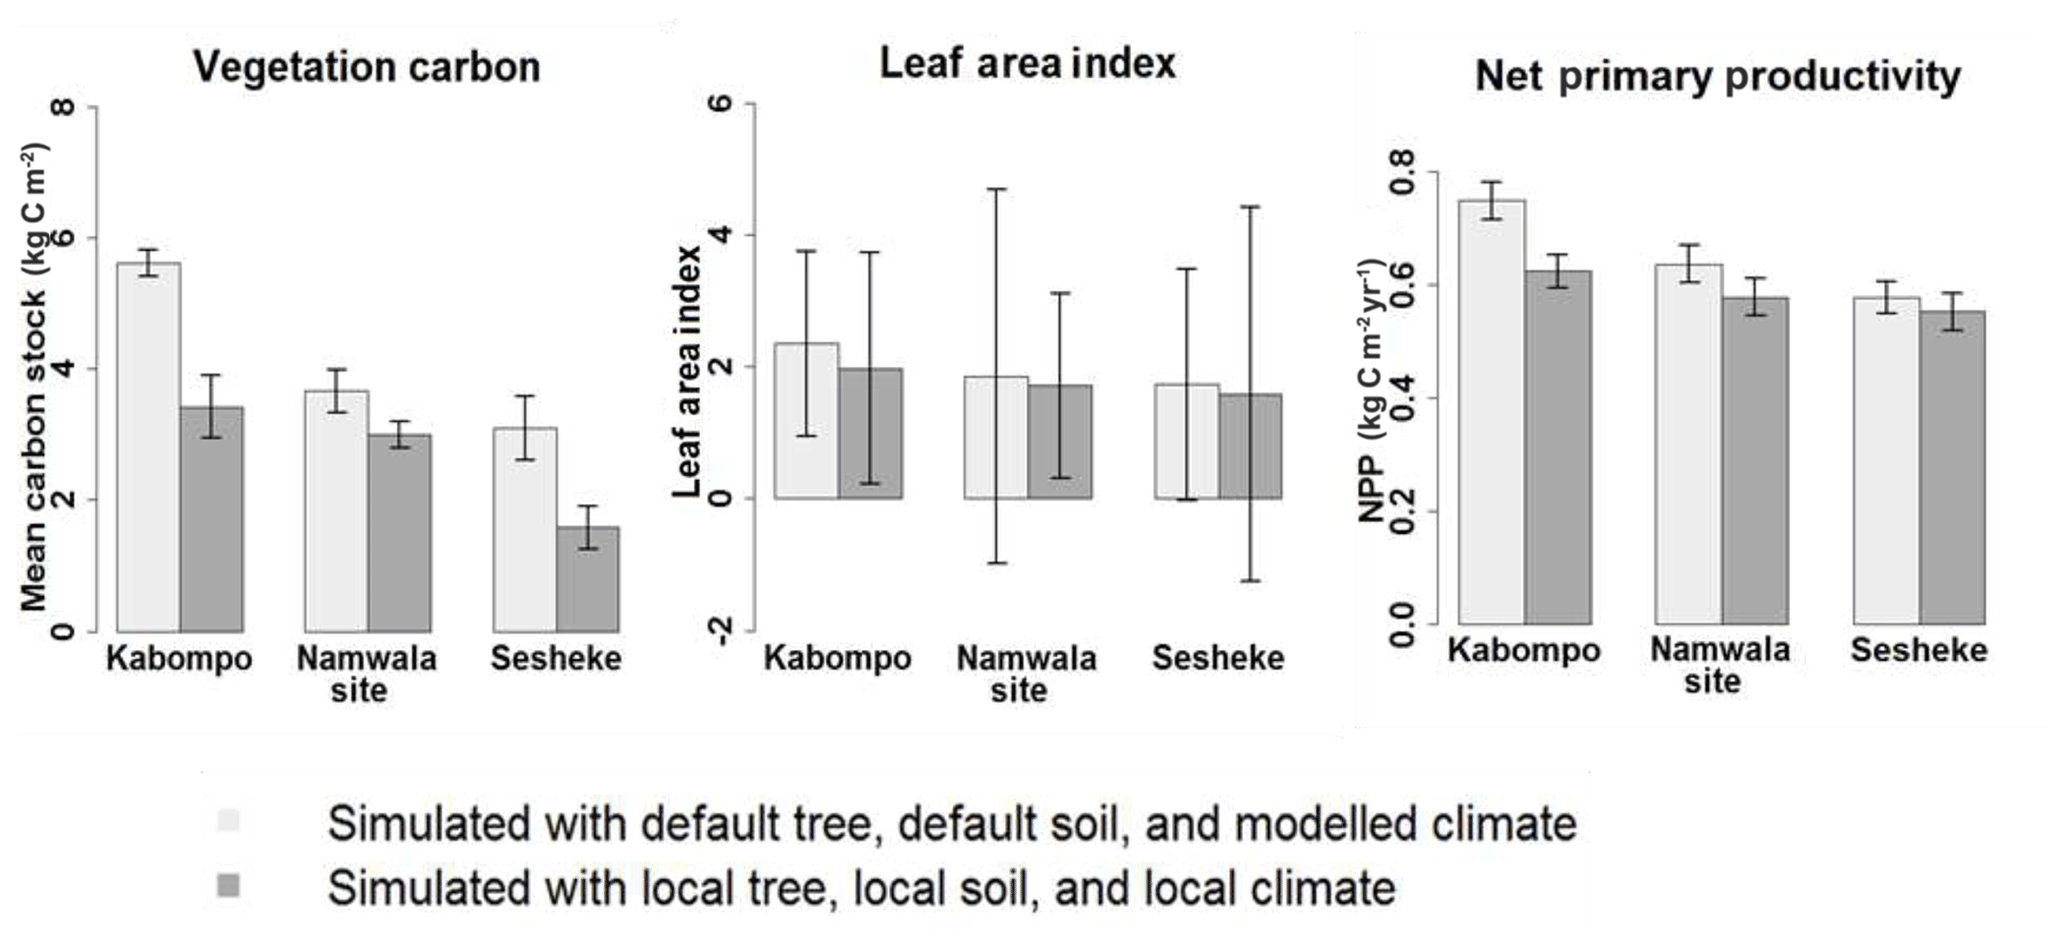
Figure 6Mean annual vegetation carbon stocks, LAI and NPP simulated with local and default soil and tree parameter values, and forcing of the model with local and modelled climate data. Simulations were done for the period 1959–2003. This figure only shows values simulated with a combination of default tree, default soil, and modelled climate data and also a combination of local tree, local soil, and local climate data. The reader is referred to the Supplement (Fig. S6) for the results of the effects of each of these default tree parameters, default soil parameters, local tree, local soil parameters, local climate, and modelled climate data.
3.3 Climate change effects on NPP
By the end of the 21st century, NPP is projected to increase at the Kabompo and Namwala sites, but reduces at the Sesheke site under both scenarios. NPP is projected to increase most at the Kabompo site under RCP8.5 (Fig. 7). Increased CO2 concentration is projected to positively have the most effects on NPP at Kabompo and Namwala under both RCPs, while under RCP8.5 decreased precipitation coupled with increasing temperature negatively affects NPP at Sesheke.
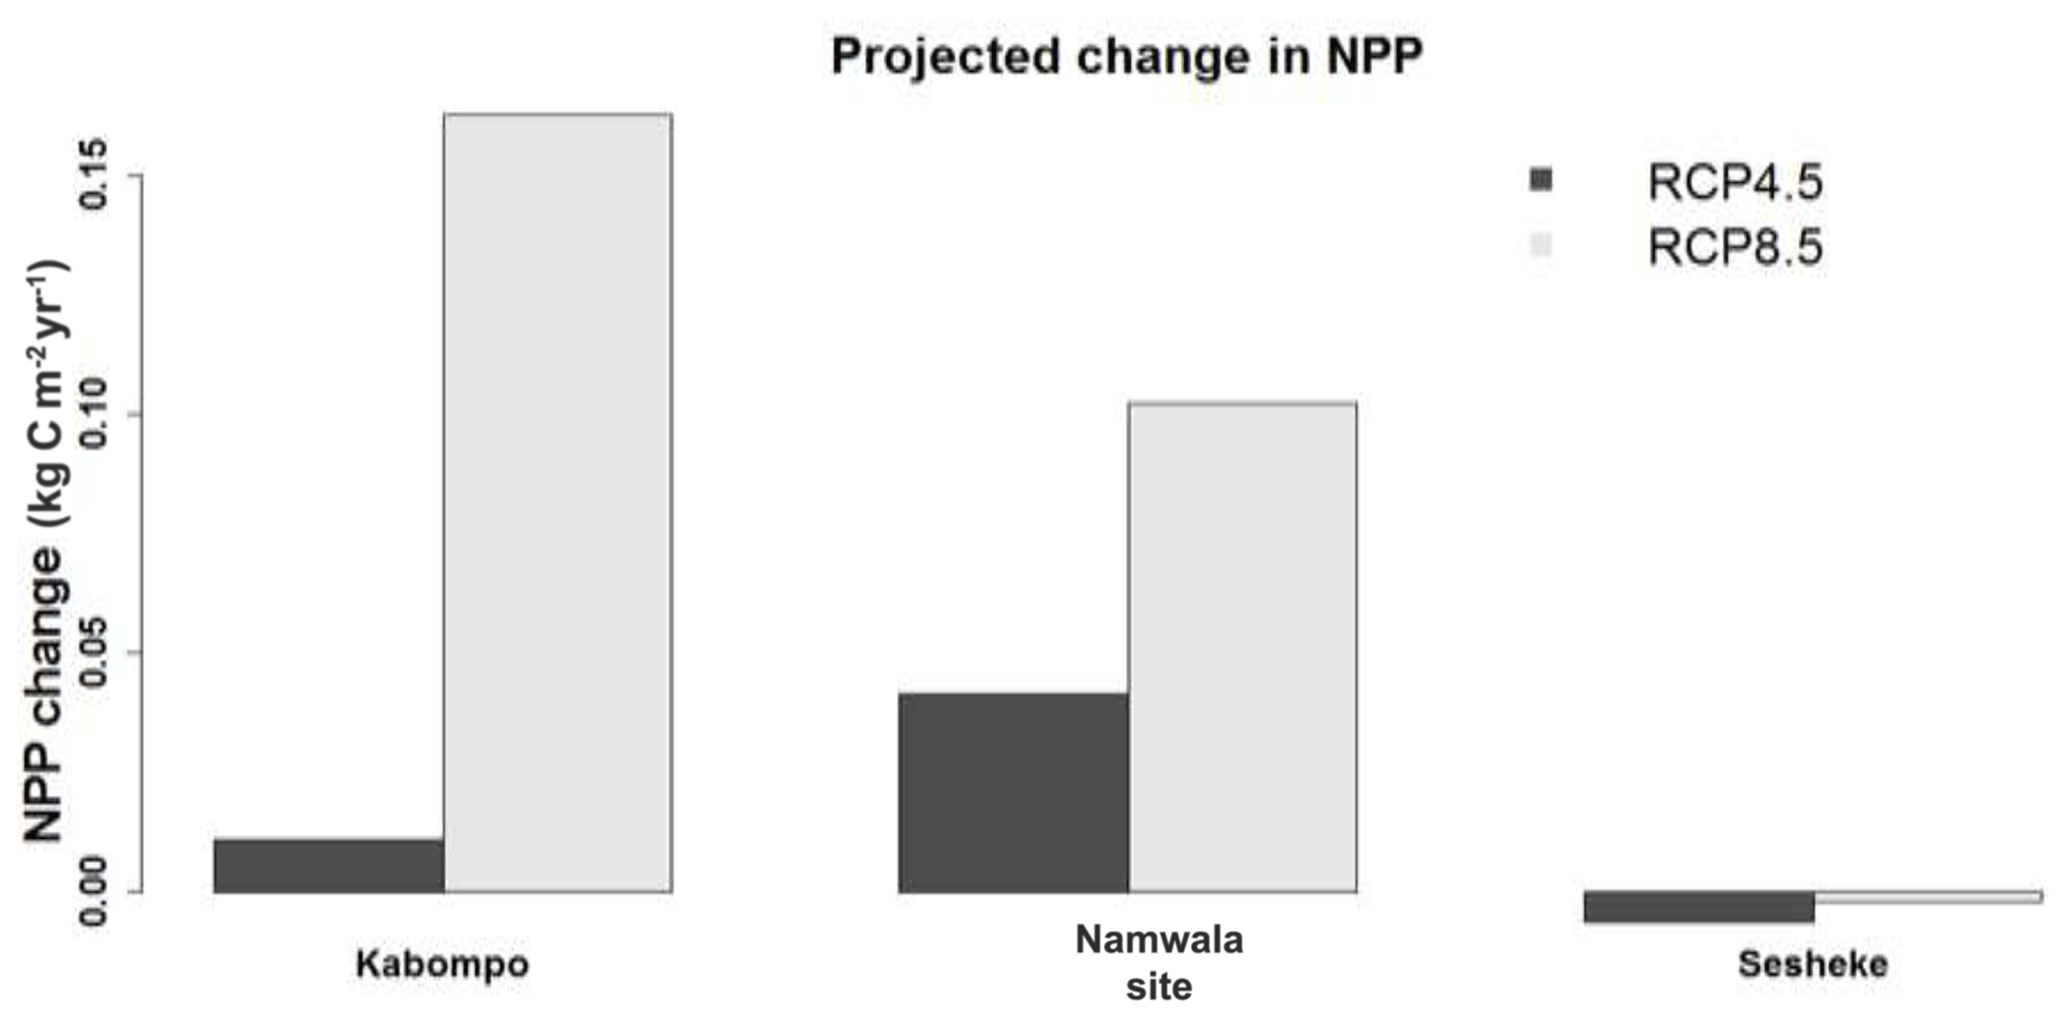
Figure 7Projected changes in NPP at Kabompo, Namwala, and Sesheke resulting from combined changes in temperature, rainfall, CO2 concentration, solar radiation, and number of wet days by the end of the 21st century (2070–2099) with reference to 1960–1989 as the baseline.
4.1 The LPJ-GUESS model performance
We generated new soil texture and tree parameter values for maximum crown area, wood density, leaf longevity, and allometry, and the results simulated with the LPJ-GUESS model improved when we used these local soil and tree parameter values compared to using the default parameters. The over-estimation of vegetation carbon that resulted from using default soil parameter values indicates the differences in clay, silt, and sand proportions between default and local soils of the Zambezi teak forests. Our field measurements (Ngoma et al., 2018a, b) showed that trees were between 2 and 21 m tall. The high default tree heights of between 8 and 47 m led to over-estimation of vegetation carbon by between 33 % and 92 %.
LPJ-GUESS-simulated NPP and tree-ring indices compared poorly at all three sites (Kabompo: NSE = −2.2334, Namwala: NSE = −1.4555, and Sesheke: NSE = −2.0253). This poor comparison is probably due to differences in the number of tree species incorporated into the two methods. We used one species only in the tree-ring analysis, while in modelling studies, which were conducted at ecosystem level, all available tree species in the forests were incorporated to determine the net NPP. The forests' survey that we conducted in 2014 (Ngoma et al., 2018a, b) showed that the Zambezi teak forests have 80 tree species. Thus, the net growth rate of these 80 species incorporated into the modelling studies is probably not the same as the growth rate of one dominant species used in tree-ring analysis. The total number of individual trees incorporated into tree-ring analysis and modelling studies also differed. While the model produced a mean NPP value from an ensemble of all trees in the studied forests, tree-ring studies were conducted on a few selected trees. The trees from which NPP is generated represent a wide variability within the forests. For example, one tree may be restricted in its growth due to competitive pressure, while the overall NPP at the model's resolution includes the more successful trees within its estimates. However, the few trees incorporated into the tree-ring analysis represent little variability within the forests, and results were generated from these few studied trees with either limited growth or successful growth compared to other trees in the forests.
Both modelling and tree-ring analysis showed significant positive Spearman correlations between productivity and rainfall of the previous 2 years at the Sesheke site (Figs. S1i and S2i). These positive correlations between tree-ring indices and rainfall (Fig. S1i) and also between LPJ-GUESS-simulated NPP and rainfall (Fig. S2i) of the previous 2 years at Sesheke indicate a carry-over effect of rainfall on trees' productivity. Though rainfall of the previous years is probably captured by trees through soil moisture in the model, this aspect is not clearly addressed in the LPJ-GUESS model. Babst et al. (2013) reported the lack of representation of carry-over effects of rainfall in dynamic global vegetation models (DGVMs). The clear representation of carry-over effects in the LPJ-GUESS model would improve model results. Also, increasing the number of tree species in tree-ring analysis would probably improve the results of the comparison between LPJ-GUESS-simulated NPP and tree-ring indices. Thus, further tree-ring studies would need to be conducted with a similar number of species to those included in modelling studies to validate the LPJ-GUESS model.
4.2 NPP's distribution
NPP was highest in the high rainfall receiving Kabompo site compared to the low rainfall receiving Sesheke site (Figs. 6 and S6). The upward trend in NPP from the drier site to the wetter site was similar to the trend in LAI and vegetation carbon (Figs. 6 and S6). The trend in NPP was also similar to the trend reported in the literature where the forests growing in high rainfall receiving areas were more productive than the forests growing in arid regions (Cao et al., 2001; Delire et al., 2008; Ngoma et al., 2019; Williams et al., 2008).
4.3 NPP's climate response
We projected an NPP increase at Kabompo and Namwala caused by increasing CO2 concentration and temperature. The positive temperature and CO2 effects were clearly observed from the high positive Spearman correlations between NPP and temperature (see Fig. S5) and NPP and CO2 (see Fig. S4). However, the positive temperature effects could just be up to an optimal temperature level. For tropical trees, carbon uptake reduces with leaf temperature of above 31 ∘C (Doughty and Goulden, 2008). Higher temperatures of above 31 ∘C also reduce activities of photosynthetic enzymes (Farquhar et al., 1980), resulting in reduced NPP.
The projected NPP increase at Kabompo and Namwala is in the same direction as the results reported by other researchers (Alo and Wang, 2008; Mohammed et al., 2018; Pan et al., 2015) for some parts of Africa (Table 3). Some modelling studies on tropical forests (Braakhekke et al., 2017; Ciais et al., 2009; Doherty et al., 2010; Melillo et al., 1993; Midgley et al., 2005; Pan et al., 2015; Thuiller et al., 2006) also reported large positive effects of increased CO2 concentration on forests' productivity. This positive effect is probably due to increased water-use efficiency (WUE, which is a measure of a plant's water use during photosynthesis in relation to the amount of water withdrawn; Grain Research and Development Cooperation, 2009) by the plants. The stomata partially close to maintain a near-constant concentration of CO2 inside the leaf even under continually increasing atmospheric CO2 levels. Such stomatal closure decreases evapotranspiration (Keenan et al., 2013) and thus increases WUE. The positive effects of increased CO2 on NPP could also be due to increased nitrogen-use efficiency (NUE, i.e. the amount of carbon converted into sugars during the photosynthetic process per unit of leaf nitrogen) (Davey et al., 1999). When CO2 concentration increases, the number of rubisco enzymes is reduced. As a consequence, foliar nitrogen is mobilized out of leaves and into other areas of the plant. This decreases the amount of nitrogen in the leaves. However, despite a reduction in leaf nitrogen, photosynthesis is still higher at elevated CO2 concentrations. This results in increased carbon uptake at lower nutrient supplies. The higher photosynthesis activities and lower leaf nitrogen content increase the photosynthetic NUE (Davey et al., 1999). However, some other studies indicate that herbaceous plants and deciduous trees acclimate quickly to increased CO2 concentrations by reducing photosynthetic capacity and stomatal conductance (Ellsworth, 1999; Mooney et al., 1999). As a result, the required water and nitrogen needed to fix a given amount of carbon are reduced (Chapin et al., 2007). However, such acclimation sometimes has no effect on the photosynthetic rate and stomatal conductance (Curtis and Wang, 1998). To what extent our modelling results are realistic is therefore not fully clear.
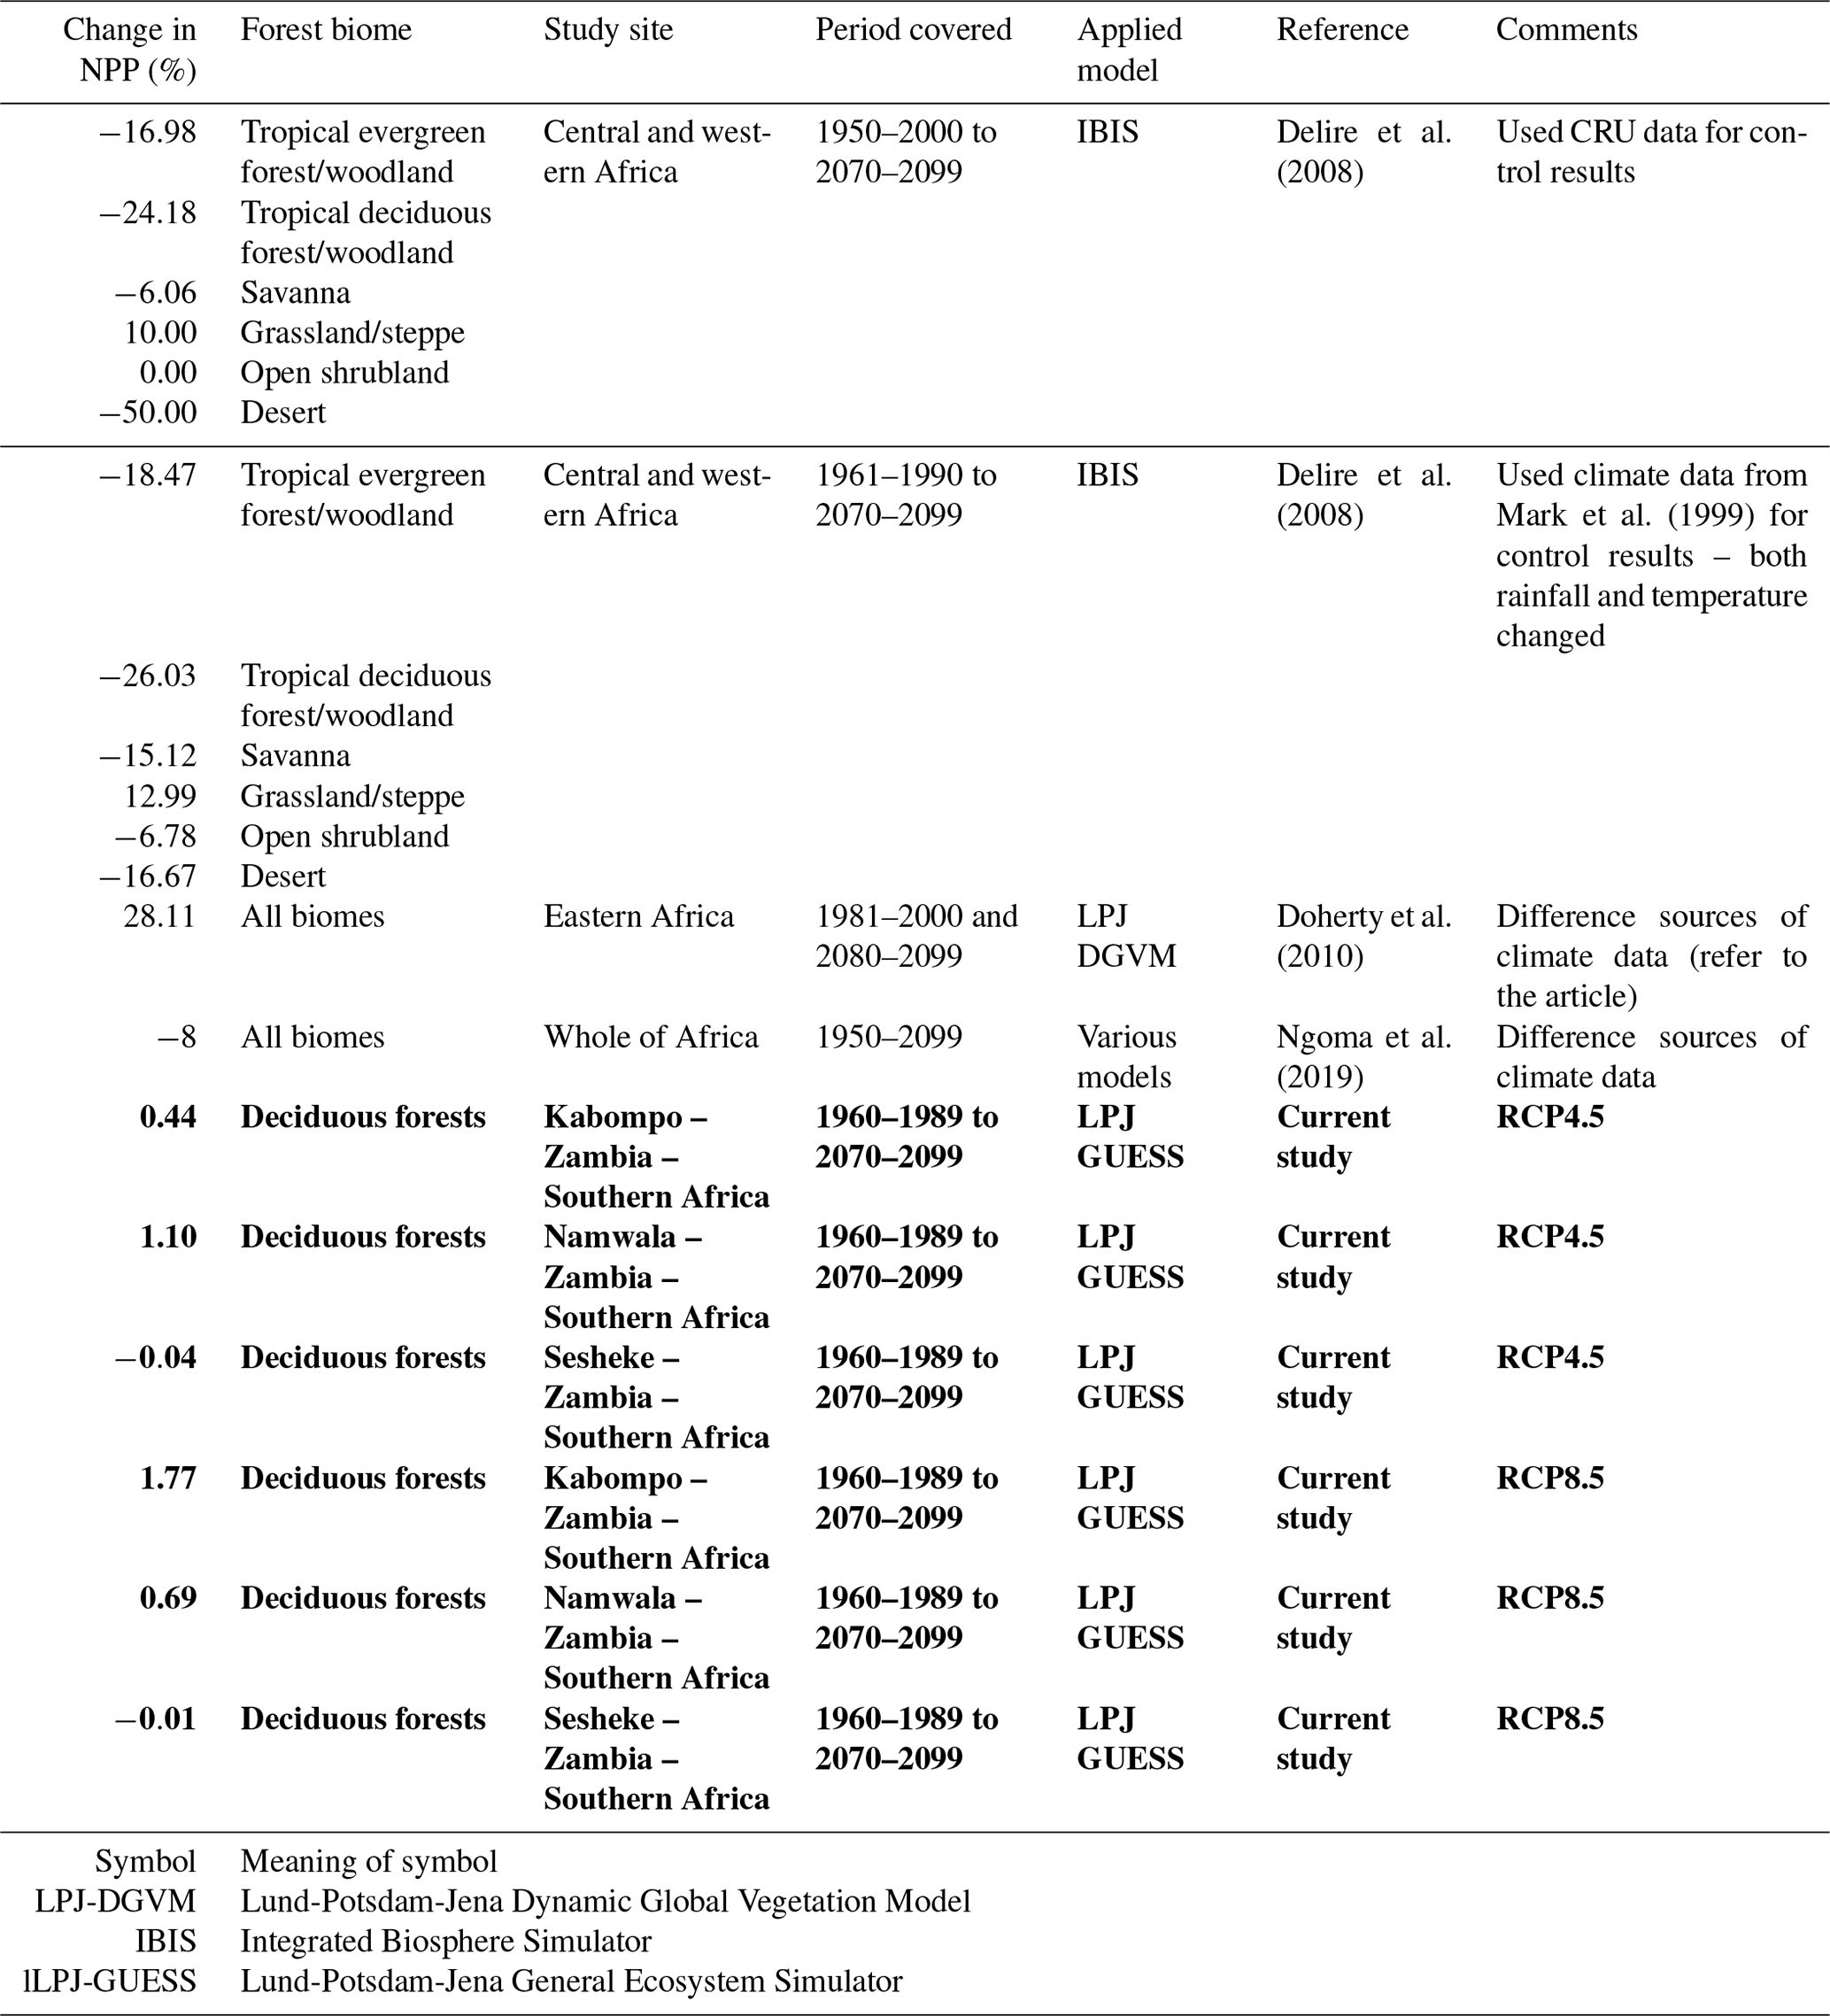
Table 3Projected changes in NPP: current study compared to the literature. A negative sign (−) under “Change in NPP (%)” means a reduction in NPP. Results from the current study are shown in bold.
Currently, the responses of tropical trees and forests to increased CO2 are still poorly understood (Hickler et al., 2008) since CO2 enrichment experiments are lacking in the tropics. Such experiments should be done because they could explain whether the enhanced NPP that results from increased CO2 is due to increased WUE, NUE, or CO2 fertilization. In our study, the Spearman correlations between tree-ring indices and CO2 concentration were not significant at all sites (Fig. S3), contrary to modelling results, indicating the need for further research, more especially the CO2 enrichment experiments to ascertain modelling results.
The projected decreased NPP under RCP8.5 at the Sesheke site results from high negative effects of the projected reduced rainfall coupled with increasing temperatures. NPP of the drier areas is mainly influenced by water by enhancing the WUE of vegetation (Yu and Chen, 2016). Reduced rainfall decreases soil water availability needed by the plants. High temperature enhances evapotranspiration, resulting in reduced soil moisture (Miyashita et al., 2005). When soil water decreases, the stomata close to restrict water loss. The closure of stomata prevents the movement of carbon into the plant, resulting in reduced NPP (McGuire and Joyce, 2005). Decreased soil water also limits nutrient absorption (e.g. nitrogen) by the roots and transportation to the plants. Increased temperature enhances plant respiration, reducing photosynthetic activities (Burton et al., 2008; Wu et al., 2011). The projected reduced number of wet days likely has more effects on NPP at Sesheke under RCP4.5 by the year 2099. The projected NPP decrease at Sesheke is in the same direction as the findings of Delire et al. (2008), who reported an NPP reduction of 12 % for the savanna forests by 2080. Similar results were also reported by Ngoma et al. (2019), who projected an NPP decrease of 8 % by the end of the 21st century for the whole of Africa. Furthermore, Alo and Wang (2008) projected NPP decrease in western and southern Africa.
The differences in NPP's response to climate change at each of the study sites is especially caused by variability in rainfall and nutrient distribution (Fig. 1 and Table 1). Though the photosynthesis process is dependent on CO2 concentration, plant response to increasing CO2 is limited by the availability of soil water and nutrients. Thus, plants growing in poor nutrient conditions respond less to rising CO2 concentration (Lloyd and Farquhar, 1996). This could be the case with the reduced NPP response at Sesheke, where nitrogen content is lower than at Kabompo and Namwala (Table 1) despite the increasing projected CO2 concentration. However, deciduous trees sometimes acclimate to increased CO2 concentration by reducing photosynthetic capacity and stomatal conductance (Ellsworth, 1999; Mooney et al., 1999). As a result, the required nitrogen and water needed to fix a given amount of carbon is reduced (Chapin et al., 2007), resulting in decreased NPP.
Generally, NPP would change at all three studied sites (Kabompo, Namwala, and Sesheke) with the projected changes in climate and carbon dioxide concentration. However, the changes would be fairly small, with the smallest changes recorded at the drier Sesheke site. This smallest change in NPP at the Sesheke site follows the smaller projected changes in rainfall (Fig. 2a).
The different NPP responses to climate change at the three sites could also be attributed to differences in species composition and the variable responses of these distinct tree species to the environment caused by variation in their physiological properties. While 9 % of the total tree species are common in all three sites, 25 % of the total surveyed species are found at Kabompo, 38 % at Namwala, and 16 % at Sesheke only (Ngoma et al., 2018b).
We projected different NPP patterns at the three study sites using climate data from five GCMs, downscaled to 0.5∘ × 0.5∘ resolution. However, NPP projections depend on the accuracy of the climate data. It is therefore worth noting that models are a simplification of the reality and are therefore associated with different uncertainties and assumptions. Uncertainties from GCMs increase with the downscaling of the climate results. Our NPP results were thus affected by the uncertainties and assumptions associated with these GCMs.
We carried out our study in the three study sites of the Zambezi teak forests in Zambia by applying the LPJ-GUESS model. These sites experience some disturbances resulting from illegal activities (e.g. charcoal burning). The artificial disturbances are not captured by the model since the model does not provide for such kinds of disturbances in the forests. Thus, an incorporation of such forest disturbances into the model would improve model results. The fires, which are also other forms of disturbances, are common in the Zambezi teak forests. These fires are usually caused by humans during the dry season, and the LPJ-GUESS model does not provide for these artificial fires. The incorporation of these artificial fires would improve the model results further, though more studies would need to be conducted to determine the frequency and intensity of these fires in the forests before incorporating them into the model. This would reduce the uncertainties of the model results.
Generally, there are some similarities in the results we generated in our study to the literature (Table 3) for similar forest types. The differences in actual values hint at the differences in models applied and the extent of area coverage. For example, while we conducted our study at local level, other researchers conducted similar studies at regional level (Doherty et al., 2010). Studies conducted at regional level constitute average results of different biomes, while our study covered one biome only at all three sites. Other factors such as species composition and soils also differ between our study sites and the study sites of other researchers. We compared our results to few studies due to the limited literature on modelling studies reported for African biomes. Also, studies using the same model as our study (LPJ-GUESS) are limited in Africa. We could not find any studies applying the LPJ-GUESS model at local level in Africa as most studies are conducted at global level (Cao and Woodward, 1998; Schaphoff et al., 2006). Availability of such studies would give much insight into our results. This therefore presents an opportunity to focus modelling research in Africa so as to determine the potential response of the different biomes to climate change. However, our study highlighted the need to use local or region-specific parameter values in models in order to obtain reliable estimates, unlike using default parameter values.
We generated new soil texture and tree parameter values for maximum crown area, wood density, leaf longevity, and allometry. Using these newly generated local parameters, we adapted and evaluated the LPJ-GUESS dynamic vegetation model for the historical climate conditions. The results simulated with the LPJ-GUESS model improved when we used these newly generated local parameters. This indicates that using local parameter values is essential to obtaining reliable simulations at site level. The adapted model setup provided a baseline for assessing the potential effects of climate change on NPP in the Zambezi teak forests in Zambia. NPP was thus projected to increase by 1.77 % and 0.69 % at the wetter Kabompo site and by 0.44 % and 0.10 % at the intermediate Namwala site under RCP8.5 and RCP4.5 respectively, especially caused by the increased CO2 concentration by the end of the 21st century. However, at the drier Sesheke site, NPP would respectively decrease by 0.01 % and 0.04 % by the end of the 21st century under RCP8.5 and RCP4.5. The projected decreased NPP under RCP8.5 at the Sesheke site results from the reduced rainfall coupled with increasing temperature. We thus demonstrated that differences in the amount of rainfall received in a site per year influence the way in which climate change would affect forest resources. The projected increase in CO2 concentration would thus have more effects on NPP in high rainfall receiving areas, while in arid regions, NPP would be affected more by the changes in rainfall and temperature. CO2 concentrations would therefore be more important in forests that are generally not temperature or precipitation limited; however, precipitation will continue to be the limiting factor in the drier site.
Refer to Sect. 2.3 and 2.4 of this paper for sources of various data used in this article.
The supplement related to this article is available online at: https://doi.org/10.5194/bg-16-3853-2019-supplement.
JN, BK, EM, RV, and RL conceived the idea and designed the study; JN prepared the paper, JN and MCB analysed NPP data, and JN and IS analysed climate data; JHS together with all the other authors provided editorial comments and interpreted and discussed the results.
The authors declare that they have no conflict of interest.
We would like to thank the Copperbelt University, the HEART project of the NUFFIC-NICHE programme, the International Foundation for Science (IFS), and the Schlumberger Foundation Faculty for the Future for providing financial support to conduct this research. We sincerely thank the LPJ-GUESS model development team at Lund University in Sweden for providing us with the model code and allowing us to use their model in our research.
This research was supported by the Copperbelt University, the HEART project of the NUFFIC-NICHE programme, the International Foundation for Science (IFS) (grant no. D/5466-1), and the Schlumberger Foundation Faculty for the Future.
This paper was edited by Paul Stoy and reviewed by Donal III O'Leary and two anonymous referees.
Ahlström, A., Schurgers, G., Arneth, A., and Smith, B.: Robustness and uncertainty in terrestrial ecosystem carbon response to CMIP5 climate change projections, Environ. Res. Lett., 7, 044008, https://doi.org/10.1088/1748-9326/7/4/044008, 2012.
Alo, C. A. and Wang, G.: Potential future changes of the terrestrial ecosystem based on climate projections by eight general circulation models, J. Geophys. Res., 113, G01004, https://doi.org/10.1029/2007JG000528, 2008.
Babst, F., Poulter, B., Trouet, V., Tan, K., Neuwirth, B., Wilson, R., Carrer, M., Grabner, M., Tegel, W., Levanic, T., Panayotov, M., Urbinati, C., Bouriaud, O., Ciais, P., and Frank, D.: Site- and species-specific responses of forest growth to climate across the European continent, Global Ecol. Biogeogr., 22, 706–717, 2013.
Braakhekke, M. C., Rebel, K. T., Dekker, S. C., Smith, B., Beusen, A. H. W., and Wassen, M. J.: Nitrogen leaching from natural ecosystems under global change: a modelling study, Earth Syst. Dynam., 8, 1121–1139, https://doi.org/10.5194/esd-8-1121-2017, 2017.
Burton, A. J., Melillo, J. M., and Frey, S. D.: Adjustment of Forest Ecosystem Root Respiration as Temperature Warms, J. Integr. Plant Biol., 50, 1467–1483, 2008.
Bwalya, S. M.: Climate Change in Zambia: Opportunities for Adaptation and Mitigation through Africa Bio-Carbon Initiative, Center for International Forest Research, Southern Africa Regional Office, Lusaka, Zambia, 1–49, 2010.
Cao, M. and Woodward, F. I.: Dynamic responses of terrestrial ecosystem carbon cycling to global climate change, Nature, 393, 249–252, 1998.
Cao, M., Zhang, Q., and Shugart, H. H.: Dynamic responses of African ecosystem carbon cycling to climate change, Clim. Res., 17, 183–193, 2001.
Chapin, F. S., Eviner, V. T., Holland, H. D., and Turekian, K. K.: 8.06 – Biogeochemistry of Terrestrial Net Primary Production, in: Treatise on Geochemistry, edited by: Schlesinger, W. H., Pergamon, Oxford, 2007.
Chen, T., Werf, G. R., Jeu, R. A. M., Wang, G., and Dolman, A. J.: A global analysis of the impact of drought on net primary productivity, Hydrol. Earth Syst. Sci., 17, 3885–3894, https://doi.org/10.5194/hess-17-3885-2013, 2013.
Ciais, P., Piao, S.-L., Cadule, P., Friedlingstein, P., and Chédin, A.: Variability and recent trends in the African terrestrial carbon balance, Biogeosciences, 6, 1935–1948, https://doi.org/10.5194/bg-6-1935-2009, 2009.
Clarke, L., Edmonds, J., Jacoby, H., Pitcher, H., Reilly, J., and Richels, R.: Scenarios of Greenhouse Gas Emissions and Atmospheric Concentrations. Sub-report 2.1A of Synthesis and Assessment Product 2.1 by the U.S. Climate Change Science Program and the Subcommittee on Global Change Research Department of Energy (Ed.), Office of Biological & Environmental Research, Washington, USA, 2007.
Collins, W. J., Bellouin, N., Doutriaux-Boucher, M., Gedney, N., Halloran, P., Hinton, T., Hughes, J., Jones, C. D., Joshi, M., Liddicoat, S., Martin, G., O'Connor, F., Rae, J., Senior, C., Sitch, S., Totterdell, I., Wiltshire, A., and Woodward, S.: Development and evaluation of an Earth-System model – HadGEM2, Geosci. Model Dev., 4, 1051–1075, https://doi.org/10.5194/gmd-4-1051-2011, 2011.
Curtis, P. S. and Wang, X.: A meta-analysis of elevated CO2 effects on woody plant mass, form, and physiology, Oecologia, 113, 299–313, 1998.
Davey, P., Parsons, A., Atkinson, L., Wadge, K., and Long, S.: Does photosynthetic acclimation to elevated CO2 increase photosynthetic nitrogen-use efficiency? A study of three native UK grassland species in open-top chambers, Funct. Ecol., 13, 21–28, 1999.
Delire, C., Ngomanda, A., and Jolly, D.: Possible impacts of 21st century climate on vegetation in Central and West Africa, Global Planet. Change, 64, 3–15, 2008.
Doherty, R. M., Sitch, S., Smith, B., Lewis, S. L., and Thornton, P. K.: Implications of future climate and atmospheric CO2 content for regional biogeochemistry, biogeography and ecosystem services across East Africa, Glob. Change Biol., 16, 617–640, 2010.
Doughty, C. E. and Goulden, M. L.: Are tropical forests near a high temperature threshold?, J. Geophys. Res.-Biogeo., 113, G00B07, https://doi.org/10.1029/2007JG000632, 2008.
Dube, K. and Nhamo, G.: Climate variability, change and potential impacts on tourism: Evidence from the Zambian side of the Victoria Falls, Environ. Sci. Pol., 84, 113–123, 2018.
Dufresne, J.-L., Foujols, M.-A., Denvil, S., Caubel, A., Marti, O., Aumont, O., Balkanski, Y., Bekki, S., Bellenger, H., Benshila, R., Bony, S., Bopp, L., Braconnot, P., Brockmann, P., Cadule, P., Cheruy, F., Codron, F., Cozic, A., Cugnet, D., de Noblet, N., Duvel, J.-P., Ethé, C., Fairhead, L., Fichefet, T., Flavoni, S., Friedlingstein, P., Grandpeix, J.-Y., Guez, L., Guilyardi, E., Hauglustaine, D., Hourdin, F., Idelkadi, A., Ghattas, J., Joussaume, S., Kageyama, M., Krinner, G., Labetoulle, S., Lahellec, A., Lefebvre, M.-P., Lefevre, F., Levy, C., Li, Z. X., Lloyd, J., Lott, F., Madec, G., Mancip, M., Marchand, M., Masson, S., Meurdesoif, Y., Mignot, J., Musat, I., Parouty, S., Polcher, J., Rio, C., Schulz, M., Swingedouw, D., Szopa, S., Talandier, C., Terray, P., Viovy, N., and Vuichard, N.: Climate change projections using the IPSL-CM5 Earth System Model: from CMIP3 to CMIP5, Clim. Dynam., 40, 2123–2165, 2013.
Ellsworth, D. S.: CO2 enrichment in a maturing pine forest: are CO2 exchange and water status in the canopy affected?, Plant Cell Environ., 22, 461–472, 1999.
Farquhar, G. D., von Caemmerer, S., and Berry, J. A.: A biochemical model of photosynthetic CO2 assimilation in leaves of C3 species, Planta, 149, 78–90, 1980.
Giorgetta, M. A., Jungclaus, J., Reick, C. H., Legutke, S., Bader, J., Böttinger, M., Brovkin, V., Crueger, T., Esch, M., Fieg, K., Glushak, K., Gayler, V., Haak, H., Hollweg, H. D., Ilyina, T., Kinne, S., Kornblueh, L., Matei, D., Mauritsen, T., Mikolajewicz, U., Mueller, W., Notz, D., Pithan, F., Raddatz, T., Rast, S., Redler, R., Roeckner, E., Schmidt, H., Schnur, R., Segschneider, J., Six, K. D., Stockhause, M., Timmreck, C., Wegner, J., Widmann, H., Wieners, K. H., Claussen, M., Marotzke, J., and Stevens, B.: Climate and carbon cycle changes from 1850 to 2100 in MPI-ESM simulations for the Coupled Model Intercomparison Project phase 5, J. Adv. Model. Earth Syst., 5, 572–597, 2016.
Government of the Republic of Zambia: The Forest Resources Management Study for Zambia Teak Forests in South-western Zambia: Final Report. Volume 1. (summary section), in: Ministry of Environment and Natural Resources, Japan International Cooperation Agency, 1996.
Government of the Republic of Zambia, United National Development Programme, and Global Environment Facility: Formulation of the National Adaptation Programme of Action on Climate Change, Ministry of Tourism Environment and Natural Resources (Ed.), Lusaka, Zambia, 2007.
Grain Research and Development Cooperation: Water Use Efficiency. Fact sheet. Converting rainfall to grain, Southern and western region, Australia, available at: https://grdc.com.au/__data/assets/pdf_file/0029/225686/water-use-efficiency-north.pdf.pdf (last access: 29 September 2019), 2009.
Haddeland, I., Heinke, J., Voß, F., Eisner, S., Chen, C., Hagemann, S., and Ludwig, F.: Effects of climate model radiation, humidity and wind estimates on hydrological simulations, Hydrol. Earth Syst. Sci., 16, 305–318, https://doi.org/10.5194/hess-16-305-2012, 2012.
Haxeltine, A. and Prentice, I. C.: BIOME3: An equilibrium terrestrial biosphere model based on ecophysiological constraints, resource availability, and competition among plant functional types, Global Biogeochem. Cy., 10, 693–709, 1996.
Hazeleger, W., Wang, X., Severijns, C., Ştefǎnescu, S. S., Bintanja, R., Sterl, A., Wyser, K., Semmler, T., Yang, S., Van den Hurk, B., Van Noije, T., Van der Linden, E., and Van der Wiel, K.: EC-Earth V2.2: description and validation of a new seamless earth system prediction model, Clim. Dynam., 39, 2611–2629, https://doi.org/10.1007/s00382-011-1228-5, 2011.
Hickler, T., Smith, B., Prentice, I. C., Mjöfors, K., Miller, P., Arneth, A., and Sykes, M. T.: CO2 fertilization in temperate FACE experiments not representative of boreal and tropical forests, Glob. Change Biol., 14, 1531–1542, 2008.
Hoerling, M., Hurrell, J., Eischeid, J., and Phillips, A.: Detection and Attribution of Twentieth-Century Northern and Southern African Rainfall Change, J. Climate, 19, 3989–4008, 2006.
Huang, S., Titus, S. J., and Wiens, D. P.: Comparison of nonlinear height–diameter functions for major Alberta tree species, Can. J. Forest Res., 22, 1297–1304, 1992.
Jungclaus, J. H., Fischer, N., Haak, H., Lohmann, K., Marotzke, J., Matei, D., Mikolajewicz, U., Notz, D., and Storch, J. S.: Characteristics of the ocean simulations in the Max Planck Institute Ocean Model (MPIOM) the ocean component of the MPI-Earth system model, J. Adv. Model. Earth Sy., 5, 422–446, 2013.
Kampata, J. M., Parida, B. P., and Moalafhi, D. B.: Trend analysis of rainfall in the headstreams of the Zambezi River Basin in Zambia, Phys. Chem. Earth, 33, 621–625, 2008.
Keenan, T. F., Hollinger, D. Y., Bohrer, G., Dragoni, D., Munger, J. W., Schmid, H. P., and Richardson, A. D.: Increase in forest water-use efficiency as atmospheric carbon dioxide concentrations rise, Nature, 499, 324–327, https://doi.org/10.1038/nature12291, 2013.
Lloyd, J. and Farquhar, G. D.: The carbon dioxide dependence of photosynthesis, plant growth responses to elevated atmospheric carbon dioxide concentrations and their interaction with soil nutrient status. I. General Principles and Forest Ecosystems, Funct. Ecol., 10, 4–32, 1996.
Magadza, C.: Indications of the effects of climate change on the pelagic fishery of Lake Kariba, Zambia–Zimbabwe, Lakes & Reservoirs: Research & Management, 16, 15–22, 2011.
Mark, N., Mike, H., and Phil, J.: Representing Twentieth-Century Space–Time Climate Variability. Part I: Development of a 1961–90 Mean Monthly Terrestrial Climatology, J. Climate, 12, 829–856, 1999.
Matakala, P. W., Misael, K., and Jochen, S.: Zambia National Strategy to Reduce Emissions from Deforestation and Forest Degradation (REDD+), Forestry Department, Ministry of Lands Natural Resources and Environmental Protection, FAO, UNDP, and UNEP, Government of the Republic of Zambia, Zambia, 2015.
McDowell, N., Barnard, H., Bond, B., Hinckley, T., Hubbard, R., Ishii, H., Köstner, B., Magnani, F., Marshall, J., and Meinzer, F.: The relationship between tree height and leaf area: sapwood area ratio, Oecologia, 132, 12–20, 2002.
McGuire, A. D. and Joyce, L. A.: Responses of Net Primary Production to Changes in CO2 and Climate, in: Productivity of America's forests to climate change, US Department of Agriculture (USDA), USA, 2005.
Melillo, J. M., McGuire, A. D., Kicklighter, D. W., Berrien Moore III, C. J., Vorosmarty, A., and Schloss, A. L.: Global climate change and terrestrial net primary production, Nature, 363, 234–240, 1993.
Midgley, G., Greg, H., Wilfried, T., Gill, D., and Wendy, F.: Assessment of potential climate change impacts on Namibia's floristic diversity, ecosystem structure and function Climate Change Research Group. South African National Biodiversity Institute Kirstenbosch Botanical Garden, Rhodes Drive Cape Town, Windhoek, Namibia, 2005.
Miyashita, K., Tanakamaru, S., Maitani, T., and Kimura, K.: Recovery responses of photosynthesis, transpiration, and stomatal conductance in kidney bean following drought stress, Environ. Exp. Bot., 53, 205–214, 2005.
Mohammed, S., Jun, Z., and Shi, F.: Impacts of climate change on net primary productivity in Africa continent from 2001 to 2010, International Journal of Science, Environment and Technology, 7, 365–381, 2018.
Mooney, H. A., Canadell, J., Chapin III, F. S., Ehleringer, J. R., Kijrner, C., McMurtrie, R. E., Parton, W. J., Piteka, L. F., and Schulze, E.-D.: Ecosystem physiology responses to global change, in: The Terrestrial Biosphere and Global Change: Implications for Natural and Managed Ecosystems, edited by: Walker, B., Steffen, W. L., Canadell, J., and Ingram, J., Cambridge University Press, Cambridge, 1999.
Mulenga, B. P., Wineman, A., and Sitko, N. J.: Climate trends and farmers' perceptions of climate change in Zambia, Environ. Manage., 59, 291–306, 2017.
Mulolwa, J. M.: Forestry in Zambia's Western province, in: The Zambezi teak forests: Proceedings of the first international conference on the teak forests of Southern Africa, Livingstone, Zambia, 18–24 March 1984, edited by: Piearce, G. D., Forest Department [etc.], Ndola, 1986.
Musgrave, M. K.: Carbon and the commons in the Zambezi teak (Baikiaea plurijuga, Harms) forests of western Zambia: sustainable forest management for commodity and community, PhD Thesis, The University of St Andrews, 2016.
Nash, J. E. and Sutcliffe, J. V.: River flow forecasting through conceptual models part I – A discussion of principles, J. Hydrol., 10, 282–290, 1970.
New, M., Hewitson, B., Stephenson, D. B., Tsiga, A., Kruger, A., Manhique, A., Gomez, B., Coelho, C. A. S., Masisi, D. N., Kululanga, E., Mbambalala, E., Adesina, F., Saleh, H., Kanyanga, J., Adosi, J., Bulane, L., Fortunata, L., Mdoka, M. L., and Lajoie, R.: Evidence of trends in daily climate extremes over southern and west Africa, J. Geophys. Res., 111, D14102, https://doi.org/10.1029/2005JD006289, 2006.
Ngoma, J., Moors, E., Kruijt, B., Speer, J. H., Vinya, R., Chidumayo, E. N., and Leemans, R.: Below and above-ground carbon distribution along a rainfall gradient. A case of the Zambezi teak forests, Zambia Acta Oecologica, 87, 45–57, 2018a.
Ngoma, J., Moors, E., Kruijt, B., Speer, J. H., Vinya, R., Chidumayo, E. N., and Leemans, R.: Data for developing allometric models and evaluating carbon stocks of the Zambezi Teak Forests in Zambia, Data in Brief, 17, 1361–1373, 2018b.
Ngoma, J., Moors, E., Speer, J. H., Kruijt, B., Vinya, R., and Leemans, R.: Forest response to climate change – A review of net primary productivity in Africa, unpublished data, 2019.
Ngoma, J., Speer, J. H., Vinya, R., Kruijt, B., Moors, E., and Leemans, R.: The dendrochronological potential of Baikiaea plurijuga in Zambia, Dendrochronologia, 41, 65–77, 2017.
Niang, I., Ruppel, O. C., Abdrabo, M. A., Essel, A., Lennard, C., Padgham, J., and Urquhart, P.: Africa. Climate Change 2014: Impacts, Adaptation, and Vulnerability. Part B: Regional Aspects. Contribution of Working Group II to the Fifth Assessment Report of the Intergovernmental Panel on Climate Change, edited by: Barros, V. R., Field, C. B., Dokken, D. J., Mastrandrea, M. D., Mach, K. J., Bilir, T. E., Chatterjee, M., Ebi, K. L., Estrada, Y. O., Genova, R. C., Girma, B., Kissel, E. S., Levy, A. N., MacCracken, S., Mastrandrea, P. R., and White, L. L., Cambridge University Press, Cambridge, UK and New York, NY, USA 1199–1265, 2014.
Pan, S., Dangal, S. R. S., Tao, B., Yang, J., and Tian, H.: Recent patterns of terrestrial net primary production in Africa influenced by multiple environmental changes, Ecosystem Health and Sustainability, 5, 1–15, https://doi.org/10.1890/EHS14-0027.1, 2015.
Piani, C., Weedon, G. P., Best, M., Gomes, S. M., Viterbo, P., Hagemann, S., and Haerter, J. O.: Statistical bias correction of global simulated daily precipitation and temperature for the application of hydrological models, J. Hydrol., 395, 199–215, 2010.
Piearce, G. D.: How to save the Zambezi teak forests, in: FAO (1986). Unasylva – No. 152 – Genetics and the forests of the future. An international journal of the forestry and food industries, FAO – Food and Agriculture Organization of the United Nations, SPECIAL FAO's Forestry Action Plan, 38 pp., 1986a.
Piearce, G. D.: Properties and end-uses of Zambezi teak, in: The Zambezi teak forests: proceedings of the first international conference on the teak forests of Southern Africa, Livingstone, Zambia, 18–24 March 1984, edited by: Piearce, G. D., Forest Department, Ndola, 1986b.
Piearce, G. D.: The Zambezi teak forests: proceedings of the first international conference on the teak forests of Southern Africa, Livingstone, Zambia, 18–24 March 1984, Forest Department, Ndola, 1986c.
PROTA4U: Baikiaea plurijuga Harms, available at: https://www.prota4u.org/database/protav8.asp?g=pe&p=Baikiaea+plurijuga+Harms, last access: 15 December 2017.
RCP Database: RCP Database (Version 2.0.5), available at: https://tntcat.iiasa.ac.at/RcpDb/dsd?Action=htmlpage&page=compare, last access: 11 April 2018.
Reich, P. B., Walters, M. B., and Ellsworth, D. S.: From tropics to tundra: Global convergence in plant-functioning, P. Natl. Acad Sci. USA, 94, 13730–13734, 1997.
Reineke, L. H.: Perfecting a stand-density index for even-aged forests, J. Agric. Res., 46, 627–638, 1933.
Riahi, K., Grübler, A., and Nakicenovic, N.: Scenarios of long-term socio-economic and environmental development under climate stabilization, Technol. Forecast. Soc., 74, 887–935, 2007.
Sarkar, D. and Haldar, A.: Physical and chemical methods in soil analysis, Fundamental concepts of analysical chemistry and intrumental techniques, New Age International (P) Limited, Publishers, New Delhi, 2005.
Sarmiento, J. L. and Gruber, N.: Sinks for Anthropogenic carbon, Phys. Today, 55, 30–66, https://doi.org/10.1063/1.1510279, 2002.
Schaphoff, S., Lucht, W., Gerten, D., Sitch, S., Cramer, W., and Prentice, I. C.: Terrestrial biosphere carbon storage under alternative climate projections, Climatic Change, 74, 97–122, 2006.
Sileshi, G. W.: A critical review of forest biomass estimation models, common mistakes and corrective measures, Forest Ecol. Manage., 329, 237–254, 2014.
Sitch, S., Smith, B., Prentice, I. C., Arneth, A., Bondeau, A., Cramer, W., Kaplan, J. O., Levis, S., Lucht, W., Sykes, M. T., Thonicke, K., and Venevsky, S.: Evaluation of ecosystem dynamics, plant geography and terrestrial carbon cycling in the LPJ dynamic global vegetation model, Glob. Change Biol., 9, 161–185, 2003.
Smith, B., Prentice, I. C., and Sykes, M. T.: Representation of vegetation dynamics in the modelling of terrestrial ecosystems: comparing two contrasting approaches within European climate space, Global Ecol. Biogeogr., 10, 621–637, 2001.
Smith, S. J. and Wigley, T. M. L.: Multi-Gas Forcing Stabilization with the MiniCAM, Energ. J., 27, 373–391, 2006.
Stern, R. and Cooper, P.: Assessing climate risk and climate change using rainfall data – a case study from Zambia, Exp. Agr., 47, 241–266, 2011.
Theilade, I., Sekeli, P. M., Hald, S., and Graudal, L. O. V.: Conservation plan for genetic resources of Zambezi teak (Baikiaea plurijuga) in Zambia, Danida Forest Seed Centre, DFSC Case Study No. 2, University of Copenhagen, Denmark, 2001.
Thuiller, W., Midgley, G. F., Hughes, G. O., Bomhard, B., Drew, G., Rutherford, M. C., and Woodward, F. I.: Endemic species and ecosystem sensitivity to climate change in Namibia, Glob. Change Biol., 12, 759–776, 2006.
University of East Anglia Climatic Research Unit, Harris, I. C., and Jones, P. D.: CRU TS3.23: Climatic Research Unit (CRU) Time-Series (TS) Version 3.23 of High Resolution Gridded Data of Month-by-month Variation in Climate (Jan. 1901–Dec. 2014), Centre for Environmental Data Analysis, 9 November 2015, https://doi.org/10.5285/4c7fdfa6-f176-4c58-acee-683d5e9d2ed5, 2015.
Voldoire, A., Sanchez-Gomez, E., Salas y Mélia, D., Decharme, B., Cassou, C., Sénési, S., Valcke, S., Beau, I., Alias, A., Chevallier, M., Déqué, M., Deshayes, J., Douville, H., Fernandez, E., Madec, G., Maisonnave, E., Moine, M.-P., Planton, S., Saint-Martin, D., Szopa, S., Tyteca, S., Alkama, R., Belamari, S., Braun, A., Coquart, L., and Chauvin, F.: The CNRM-CM5.1 global climate model: description and basic evaluation, Clim. Dynam., 40, 2091–2121, 2013.
Walkley, A. and Black, I. A.: An examination of the Degtjareff method for determining soil organic matter, and a proposed modification of the chromic acid titration method, Soil Sci., 37, 29–38, 1934.
Weedon, G. P., Gomes, S., Viterbo, P., Shuttleworth, W. J., Blyth, E., Österle, H., Adam, J. C., Bellouin, N., Boucher, O., and Best, M.: Creation of the WATCH Forcing Data and Its Use to Assess Global and Regional Reference Crop Evaporation over Land during the Twentieth Century, J. Hydrometeorol., 12, 823–848, 2011.
Williams, C. A., Hanan, N. P., Baker, I., Collatz, G. J., Berry, J., and Denning, A. S.: Interannual variability of photosynthesis across Africa and its attribution, J. Geophys. Res.-Biogeo., 113, G04015, https://doi.org/10.1029/2008JG000718, 2008.
Wise, M., Calvin, K. V., Thomson, A. M., Clarke, L. E., Bond-Lamberty, B., Sands, R. D., Smith, S. J., Janetos, A. C., and Edmonds, J.: Implications of Limiting CO2 Concentrations for Land Use and Energy, Science, 324, 1183–1186, 2009.
Wu, Z., Dijkstra, P., Koch, G. W., Peñuelas, J., and Hungate, B. A.: Responses of terrestrial ecosystems to temperature and precipitation change: a meta-analysis of experimental manipulation, Glob. Change Biol., 17, 927–942, 2011.
Yu, B. and Chen, F.: The global impact factors of net primary production in different land cover types from 2005 to 2011, Springer Plus, 5, 1235, https://doi.org/10.1186/s40064-016-2910-1, 2016.