the Creative Commons Attribution 4.0 License.
the Creative Commons Attribution 4.0 License.
 | 25 Jan 2019
Stable carbon and nitrogen isotopic composition of leaves, litter, and soils of various ecosystems along an elevational and land-use gradient at Mount Kilimanjaro, Tanzania
Friederike Gerschlauer
David Schellenberger Costa
Michael Kleyer
Michael Dannenmann
Ralf Kiese
Variations in the stable isotopic composition of carbon (δ13C) and nitrogen (δ15N) of fresh leaves, litter, and topsoils were used to characterize soil organic matter dynamics of 12 tropical ecosystems in the Mount Kilimanjaro region, Tanzania. We studied a total of 60 sites distributed along five individual elevational transects (860–4550 m a.s.l.), which define a strong climatic and land-use gradient encompassing semi-natural and managed ecosystems. The combined effects of contrasting environmental conditions, vegetation, soil, and management practices had a strong impact on the δ13C and δ15N values observed in the different ecosystems. The relative abundance of C3 and C4 plants greatly determined the δ13C of a given ecosystem. In contrast, δ15N values were largely controlled by land-use intensification and climatic conditions.
The large δ13C enrichment factors (δ13Clitter − δ13Csoil) and low soil C∕N ratios observed in managed and disturbed systems agree well with the notion of altered SOM dynamics. Besides the systematic removal of the plant biomass characteristic of agricultural systems, annual litterfall patterns may also explain the comparatively lower contents of C and N observed in the topsoils of these intensively managed sites. Both δ15N values and calculated δ15N-based enrichment factors (δ15Nlitter − δ15Nsoil) suggest the tightest nitrogen cycling at high-elevation (> 3000 m a.s.l.) ecosystems and more open nitrogen cycling both in grass-dominated and intensively managed cropping systems. However, claims about the nature of the N cycle (i.e. open or closed) should not be made solely on the basis of soil δ15N as other processes that barely discriminate against 15N (i.e. soil nitrate leaching) have been shown to be quite significant in Mount Kilimanjaro's forest ecosystems. The negative correlation of δ15N values with soil nitrogen content and the positive correlation with mean annual temperature suggest reduced mineralization rates and thus limited nitrogen availability, at least in high-elevation ecosystems. By contrast, intensively managed systems are characterized by lower soil nitrogen contents and warmer conditions, leading together with nitrogen fertilizer inputs to lower nitrogen retention and thus significantly higher soil δ15N values. A simple function driven by soil nitrogen content and mean annual temperature explained 68 % of the variability in soil δ15N values across all sites. Based on our results, we suggest that in addition to land-use intensification, increasing temperatures in a changing climate may promote soil carbon and nitrogen losses, thus altering the otherwise stable soil organic matter dynamics of Mount Kilimanjaro's forest ecosystems.
- Article
(4125 KB) - Full-text XML
-
Supplement
(950 KB) - BibTeX
- EndNote


Conversion of natural ecosystems to agriculture is a worldwide phenomenon, which is of particular significance in tropical regions where human population growth rates are currently the highest (FAO and JRC, 2012). Changes in climate and land use significantly alter vegetation composition and biogeochemical cycles, causing a strong impact on carbon (C) and nitrogen (N) turnover and stocks (Smith et al., 2014). Tropical forest biomes are particularly relevant in this context, as they are significant C storages and N turnover hotspots (Bai et al., 2012; Hedin et al., 2009; Lewis et al., 2009; Pan et al., 2011; Vitousek, 1984). Considering the increasing pressure on natural land, it is becoming even more crucial to understand how anthropogenic interventions affect ecosystem C and N cycling and gain better knowledge about the main drivers of nutrient cycling, as well as the associated exchange processes with the atmosphere and hydrosphere in tropical environments.
Research exploiting the natural abundance of stable isotopes has proved quite suitable for investigating potential impacts of land-use and/or climate change on C and N cycling in terrestrial systems (Michener and Lajtha, 2007; Panettieri et al., 2017; Saiz et al., 2015a). Variations in the stable isotopic composition of C (δ13C) and N (δ15N) in plants and soils are the result of fractionation processes occurring during ecosystem exchange of C and N. Thus, δ13C and δ15N can serve as valuable indicators about ecosystem state and provide useful insights on how these systems respond to biotic and abiotic factors (Dawson et al., 2002; Högberg, 1997; Ma et al., 2012; Pardo and Nadelhoffer, 2010; Peterson and Fry, 1987; Robinson, 2001).
Plants discriminate against 13CO2 (carbon dioxide) during photosynthetic CO2 fixation depending on plant metabolism (i.e. C3 and C4 photosynthetic pathways). Most tropical grasses typically employ the C4 photosynthetic pathway (δ13C values > −15 ‰), while trees and shrubs use the C3 photosynthetic pathway (δ13C values < −24 ‰) (Bird et al., 1994; Bird and Pousai, 1997; Cernusak et al., 2013; Farquhar et al., 1980). The distribution of C3 and C4 vegetation shows clear patterns along elevational gradients, with increasing abundance of C3 species towards high elevations (Bird et al., 1994; Körner et al., 1991; Tieszen et al., 1979). Environmental conditions such as water availability also exert a significant influence on isotopic discrimination during atmospheric CO2 fixation. Accordingly, compared to optimal moisture conditions, water stress leads to the enrichment of 13C in C3 plants (Farquhar and Sharkey, 1982), while this isotopic fractionation is less obvious or even absent in C4 plants (Ma et al., 2012; Swap et al., 2004).
The soil organic matter (SOM) pool integrates the isotopic signature of the precursor biomass over different spatio-temporal scales (Saiz et al., 2015a). Variation in soil δ13C values represents a valuable tool to better assess SOM dynamics, mineralization processes, or reconstruct past fire regimes (Saiz et al., 2015a; Wynn and Bird, 2007). The δ13C of SOM in a given ecosystem is greatly controlled by the relative abundance of C3 and C4 plants due to their contrasting C isotopic composition. Therefore, strong variations in soil δ13C can also be used to identify sources of particulate organic matter and vegetation shifts such as woody thickening. However, fractionation effects associated with differential stabilization of SOM compounds, microbial reprocessing of SOM, soil physico-chemical characteristics, and the terrestrial Seuss effect preclude a straightforward interpretation of soil δ13C values (Saiz et al., 2015a).
Plant and soil δ15N relate to environmental and management conditions controlling N turnover, availability, and losses. δ15N values in soils are generally more positive than those of vegetation due to the relatively large isotopic fractionation occurring during soil N transformations (Dawson et al., 2002). The N cycle of a given ecosystem may be characterized as closed if both efficient microbial N retention and the absence of external N inputs (e.g. atmospheric deposition and fertilizer additions) prevent substantial gaseous and/or leaching N losses. In contrast, open ecosystem N cycling is characterized by significant inputs and losses of N. On the one hand, gaseous N losses from soils are strongly depleted in 15N due to the high fractionation factors associated with these processes (Denk et al., 2017). This results in high δ15N values of the residual substrate, which consequently leaves less importance to impacts of external N additions (Robinson, 2001; Zech et al., 2011). On the other hand, N leaching seems to only discriminate slightly against ecosystem 15N. According to Houlton and Bai (2009) δ15N values of drained water agree well with those of soils across various natural ecosystems worldwide. Moreover, it is also important to consider the possibility that soil δ15N may also be influenced by other factors including rooting depth, uptake of different N compounds, and symbiotic N2 fixation (Nardoto et al., 2014). Variations in δ15N values of plants and soils have been successfully applied to characterize N cycling across a large variety of ecosystems worldwide (Amundson et al., 2003; Booth et al., 2005; Craine et al., 2015a, b; Martinelli et al., 1999; Nardoto et al., 2014). This includes research work that has particularly focused on the study of N losses derived from land-use changes or intensification (Eshetu and Högberg, 2000; Piccolo et al., 1996; Zech et al., 2011).
Information on ecosystem C and N cycling is still scarce in many tropical ecosystems, particularly in remote regions of Africa (Abaker et al., 2016; 2018; Saiz et al., 2012; Townsend et al., 2011). Furthermore, feedbacks between C and N cycles, such as limitations of N availability in ecosystem C sequestration and net primary productivity in tropical forest, require urgent investigations (Gruber and Galloway, 2008; Zaehle, 2013). In such a context, the Kilimanjaro region in Tanzania offers the rare possibility to study a broad range of tropical ecosystems across contrasting land-use management intensities and varying climatic conditions. This region hosts a large variety of semi-natural and managed ecosystems as a result of the strong elevational and land-use gradient.
We hypothesized that (i) vegetation composition (C3 ∕ C4) is the main control for ecosystem δ13C values, whereas (ii) δ15N values are rather controlled by land-use management and climatic conditions. The main aim of this study is to evaluate the potential of δ13C and δ15N values in plant and soil material to assess C and N cycling across a broad variety of semi-natural and managed ecosystems under varying climatic conditions.
2.1 Study sites
This study was conducted on the southern slopes of Mount Kilimanjaro (3.07∘ S, 37.35∘ E; 5895 m a.s.l.) in north-east Tanzania. The climate is characterized by a bimodal precipitation pattern with a major rainy season between March and May and the other peak between October and November. Recently, Appelhans et al. (2016) used a network of 52 meteorological stations strategically deployed in the Kilimanjaro region to measure air temperature and precipitation. They then used geo-statistical and machine-learning techniques for the gap filling of the recorded meteorological time series and their regionalization, which provides the means to calculate the meteorological data used for the complete set of sites (60) used in our work. Please refer to Appelhans et al. (2016) for more details. Maximum mean annual precipitation (MAP) of 2552 mm occurs at an elevation of around 2260 m a.s.l., decreasing towards lower and higher elevations, reaching 657 and 1208 mm yr−1 at 871 and 4550 m, respectively (Table 1). Variations in air temperature are dominated by diurnal rather than seasonal patterns (Duane et al., 2008). Mean annual temperature (MAT) decreases with increasing elevation, ranging from 24.8 ∘C at 860 m to 3.5 ∘C at 4550 m (Table 1).
Table 1General characteristics of ecosystems investigated at Mount Kilimanjaro, Tanzania.

Land uses are generically classified as managed (M) and semi-natural ecosystems (S-N). MAP and MAT stand for mean annual precipitation and temperature, respectively. Climatic values are according to Appelhans et al. (2016). Data represent mean values () for different ecosystems. The most representative soil type is shown for each ecosystem. Soil properties are given for topsoil (0–10 cm for pH and soil texture, 0–5 cm for soil organic carbon and total nitrogen).
Five altitudinal transects ranging from 860 to 4550 m a.s.l. were established along the mountain slopes. At each transect, 12 ecosystems occurring over a strong land-use gradient encompassing intensively managed cropping systems and semi-natural stands were investigated. Hence, the total number of plots studied was 60 (5 transects × 12 ecosystems; Table 1 and Fig. 1). The cropping systems comprised multilayer and multi-crop agroforestry home gardens (Hom), monoculture coffee plantations (Cof) with dispersed shading trees, and maize fields (Mai) subject to regular albeit moderate fertilizer and pesticide applications. Plant litter is regularly removed from Cof and Mai sites. Home gardens are manually ploughed, while combustion engine machinery is used for ploughing coffee plantations and maize fields. Coffee plantations are irrigated with drip irrigation systems. Both Hom and Cof sites still host indigenous forest trees that include Albizia schimperi, a species that may potentially fix atmospheric N. This is one of the five most abundant species in two and four of the Hom and Cof sites, respectively, making up less than 25 % of the vegetation cover in all cases. Grasslands (Gra) and savannas (Sav) are extensively managed by means of domestic grazing and occasional grass cutting, thus having significantly lower anthropogenic disturbances than cropping systems. Semi-natural ecosystems include several montane forest stands. These include lower montane (Flm), Ocotea (Foc), Podocarpus (Fpo), Erica (Fer), and alpine shrub vegetation Helichrysum (Hel). Even though lower montane forests are currently under protection they are still subject to sporadic illegal logging. In addition to sampling undisturbed forest ecosystems of Ocotea and Podocarpus, we purposely studied sites that had been affected by logging activities and fire events prior to the establishment of the Kilimanjaro National Park (Soini, 2005): Ocotea (Fod) and Podocarpus (Fpd) (Table 1). Erica forests represent Africa's highest forests in the subalpine zone. Higher above is the alpine zone, the realm of Helichrysum vegetation that is dominated by cushion plants and tussock grasses (Ensslin et al., 2015; Hemp, 2005). Potential ecosystem productivity and decomposition rates show a hump-shaped pattern resembling that of precipitation (Supplement Fig. S1). It is interesting to see the close match between the two variables along the elevation range, although this trend weakens slightly towards higher-elevation sites. Optimum growth and decomposition conditions are shown between 1800 and 2500 m a.s.l. These locations correspond to low-altitude forest ecosystems (Flm and Foc) that do not experience severe seasonal limitations in moisture or temperature as is otherwise the case in lower- and higher-elevation systems that are moisture and temperature limited, respectively (Becker and Kuzyakov, 2018).
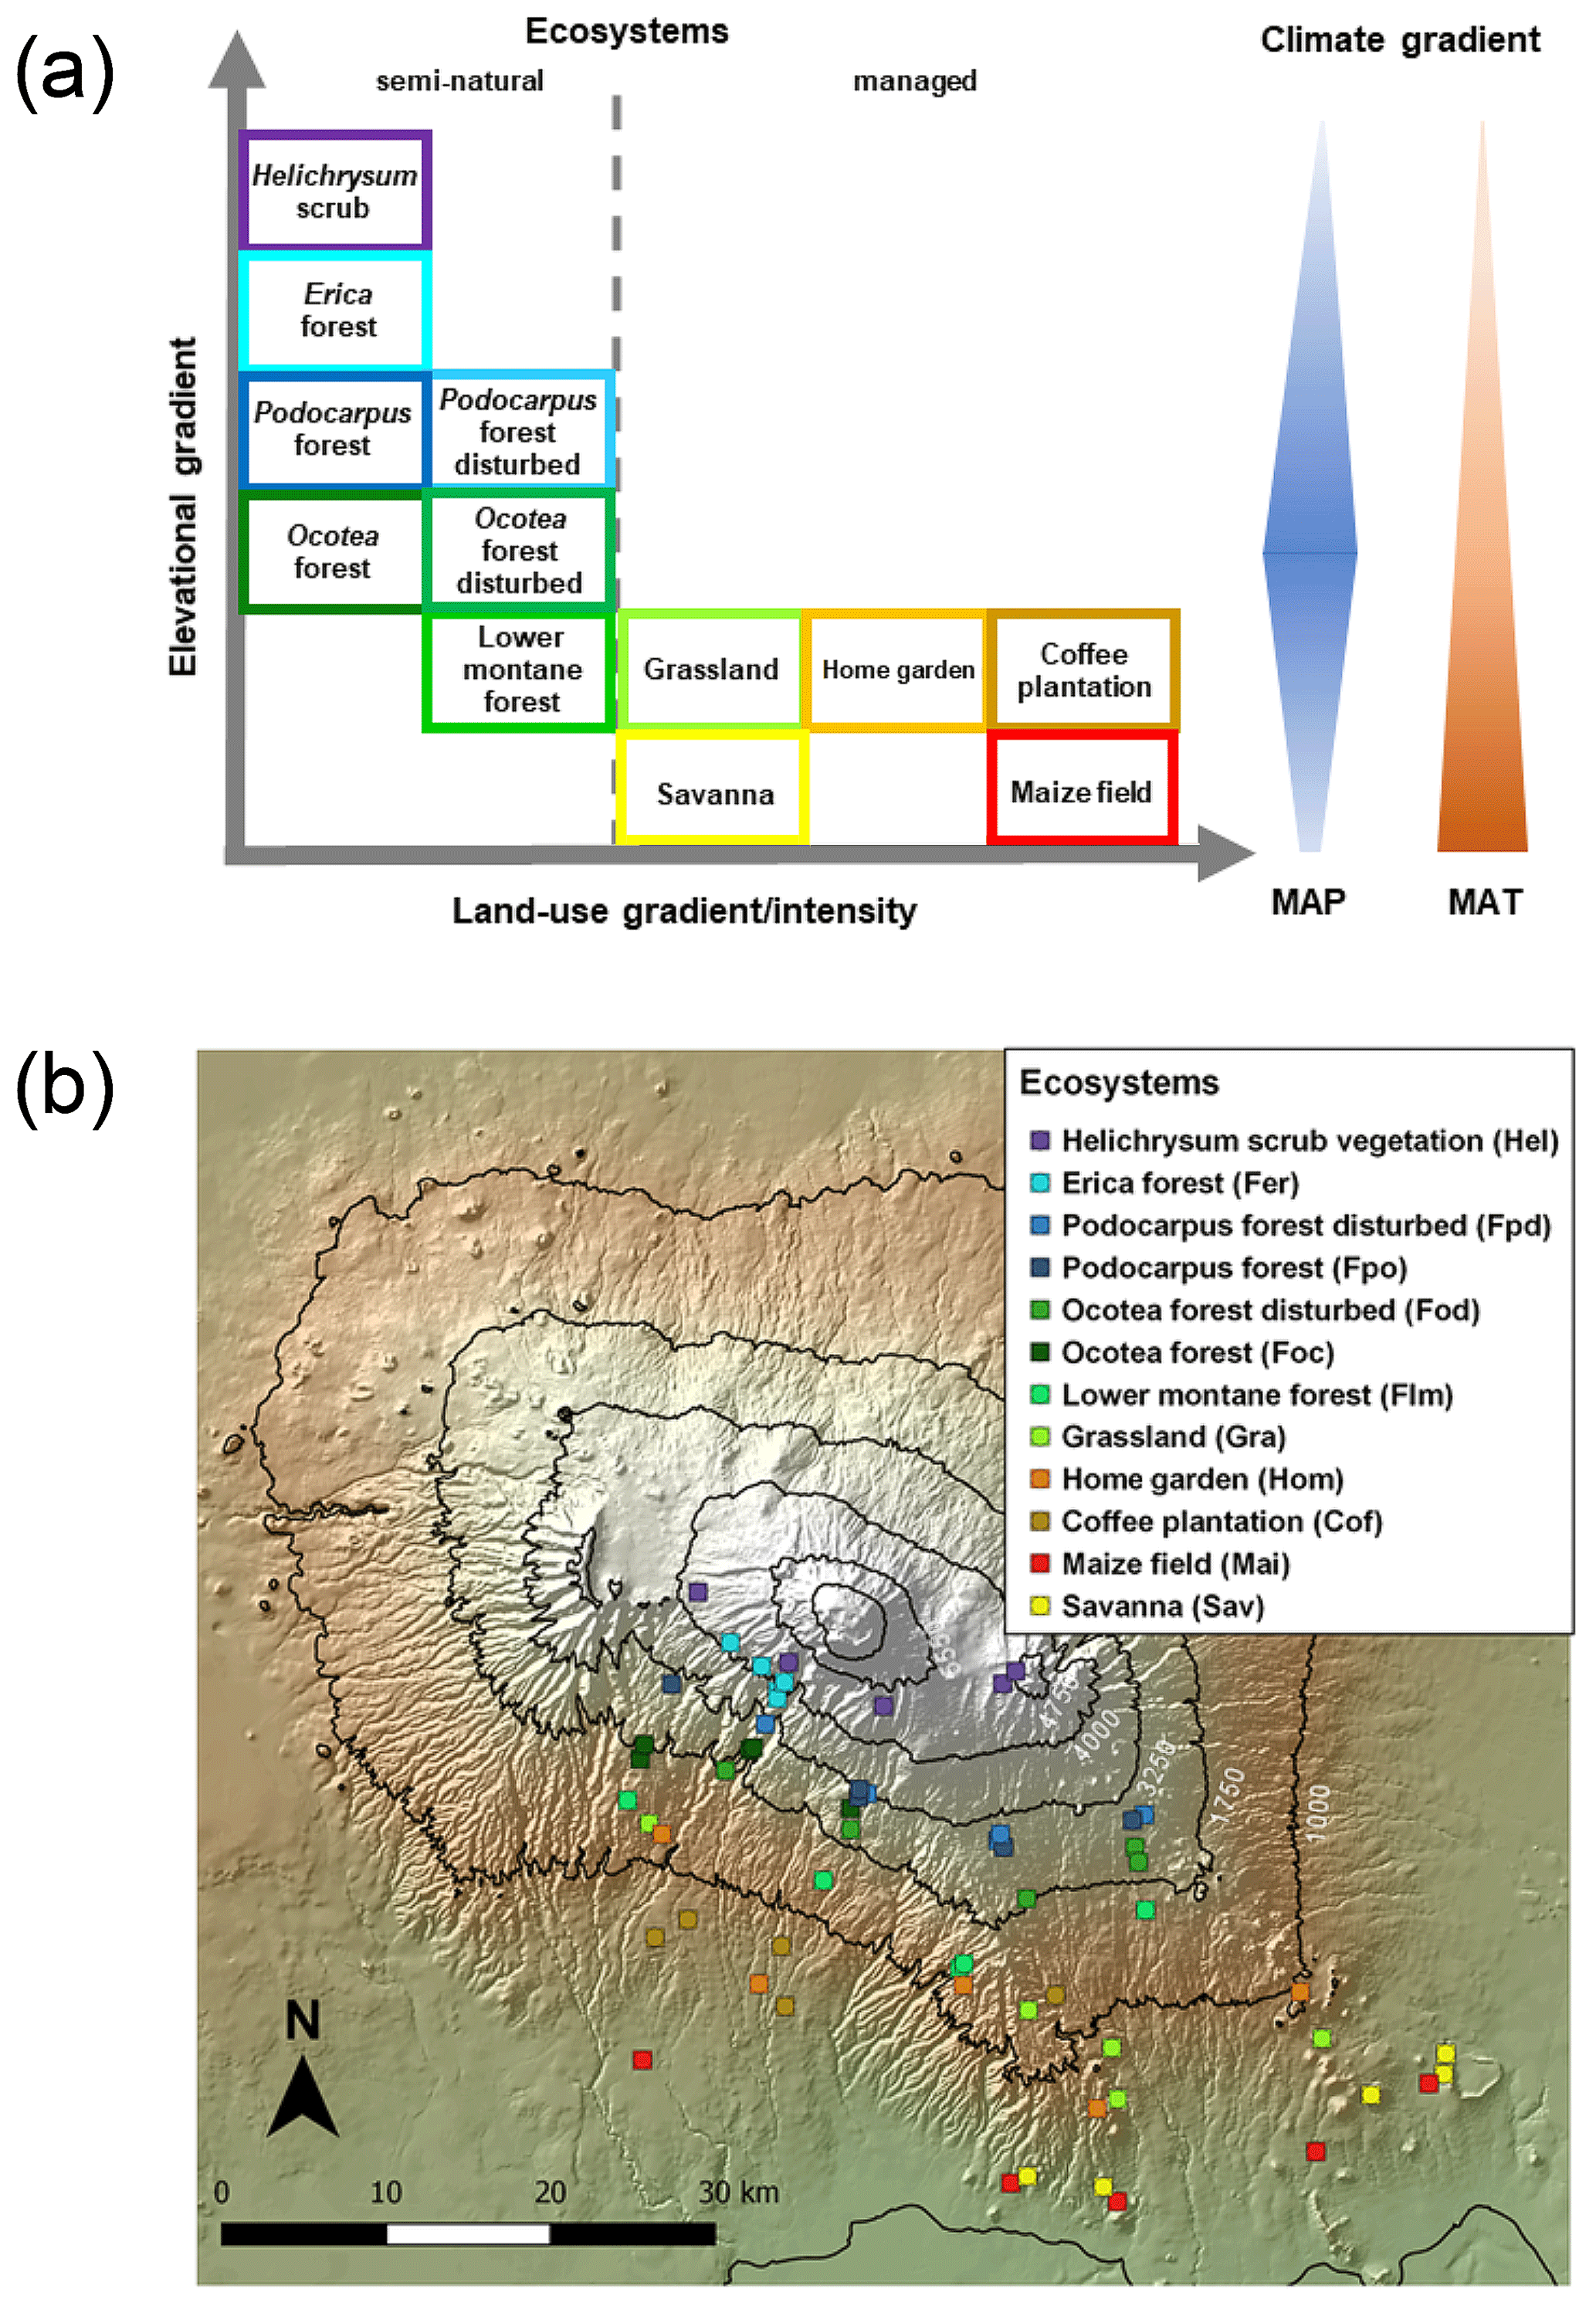
Figure 1Geographical distribution of investigated ecosystems: (a) along the elevational and land-use gradient. MAP denotes mean annual precipitation and MAT mean annual temperature. The colours of the boxes framing the ecosystem names match the colours of symbols in the GeoTIFF panel below; (b) along the southern slope of Mount Kilimanjaro. Symbols represent individual ecosystems (12) replicated five times (60 study sites in total).
Detailed physico-chemical characteristics of the dominant soils are listed in Table 1. Soils in the Mount Kilimanjaro region are mainly derived from volcanic rocks and ashes. The wide array of climatic conditions present along the elevational gradient influence soil genesis, which results in the occurrence of andosols at high elevations and soils of more advanced genesis at lower elevations (e.g. nitosols) (Majule, 2003).
It is extremely difficult to provide reliable estimates of both fertilizer and pesticide rates used in small household farms in sub-Saharan Africa. This is because the actual use of these products is strongly dependent on both its availability in the local and/or regional market, the economic circumstances of each individual farmer, and individual perceptions about their use (Saiz and Albrecht, 2016). The only sites receiving fertilizer are the two monocultures, maize (Mai) fields and coffee (Cof) plantations, and to a lesser extent the home garden (Hom) sites. In the latter sites Gütlein et al. (2018) report that weed control is mainly done by hand, and the use of mineral or organic N fertilizers is low or non-existent. Extensively managed sites (i.e. Sav and Gra) receive varying amounts of organic inputs as a result of grazing activities, but again, their actual rates are unknown. A more detailed explanation on fertilizer and pesticide inputs used in the region is provided in the Supplement (Table S1).
2.2 Sampling and analyses
Fieldwork took place in February and March in 2011 and 2012. Sampling was conducted on 50×50 m plots established at each of the 60 studied sites (12 ecosystems × 5 transects). Surface litter and mineral topsoil (0–5 cm) were sampled at five locations (four corners and the central point) at each plot. Additionally, fresh mature leaves of the five most abundant plant species covering 80 % of total plant biomass per site were collected (Schellenberg Costa et al., 2017). All sampled materials (leaves, litter, and soil) were air-dried until constant weight, and leaf material was subsequently oven-dried at 70 ∘C for 60 h prior to grinding. Soil was sieved to 2 mm with visible root fragments being further removed prior to grinding with a mixer mill (MM200, Retsch, Haan Germany). Soil pH was determined with a pH meter (MultiCal SenTix61, WTW, Weilheim, Germany) in a 0.01 M CaCl2 solution, with a CaCl2-to-soil ratio of 2:1. Particle size distribution was determined gravimetrically using the pipette method (van Reeuwijk, 2002).
All soil, litter, and leaf samples were analysed with a dry combustion elemental analyser (Costech International S.p.A., Milano, Italy) fitted with a zero-blank autosampler coupled to a ThermoFinnigan DeltaPlus XL using continuous-flow isotope ratio mass spectrometry (CF-IRMS) for the determination of the abundance of elemental C and N and their stable isotopic composition (δ13C, δ15N). Precisions (standard deviations) on internal standards for elemental C and N concentrations and stable isotopic compositions were better than 0.08 % and 0.2 ‰, respectively.
Natural 13C or 15N abundances are expressed in δ units according to Eq. (1):
where Rsample denotes the ratio 13C∕12C or 15N∕14N in the sample, and Rstandard denotes the ratios in Pee Dee Belemnite or atmospheric N2 (international standards for C and N, respectively). The average values for the plant samples were weighted considering their relative abundance at each site. Individual values for soil, litter, and leaves were averaged for each plot.
In addition, both δ13C- and δ15N-based enrichment factors (ε) were calculated following Eqs. (2) and (3):
These were used as indicators for SOM decomposition dynamics and ecosystem N status (Garten et al., 2008; Mariotti et al., 1981). Note that we use the stable isotopic values of litter material rather than fresh leaves from various species to calculate enrichment factors, since litter provides a more unbiased representation of the quality, quantity, and spatio-temporal dynamics of organic inputs entering the SOM pool (Saiz et al., 2015a).
2.3 Statistical analysis
The normal distribution of the data was confirmed with the Shapiro–Wilk test. One-way ANOVA was performed to test for significant differences between ecosystems, while Tukey's HSD was used as a post hoc procedure to test for significant differences across sites (P≤0.05). Correlation analyses were performed to identify soil, foliar, and climatic variables influencing soil δ15N values. Subsequently, a principal component analysis (PCA) was conducted to reveal relationships between the main variables affecting soil δ15N values. The PCA was based on a correlation matrix including soil (C and N concentrations, C∕N ratio, δ13C, pH values, sand and clay contents) and climatic parameters (MAT and MAP). A stepwise multiple regression was used to identify the main driving parameters determining soil δ15N across the elevational transect. All statistical analyses were conducted with R (version 3.2.2; R Core Team, 2015).
3.1 General soil characteristics
Soil C and N contents were the highest in forest ecosystems and showed a decreasing trend towards managed sites (i.e. home gardens, grasslands, coffee, and maize fields) (Table 1). Also, natural savannas and Helichrysum ecosystems had lower soil C and N values compared to forest ecosystems. The low temperatures and sandy nature of the Helichrysum sites play a strong role in their characteristically low productivity and moderate decomposition potentials (Table 1; Fig. S1), which unquestionably affects the comparatively low soil C and N contents of these alpine systems.
An opposite trend to that of soil C and N abundance was observed for soil C∕N ratios, whereby managed sites showed significantly lower values compared to those of semi-natural ecosystems. Soil pH values revealed acidic conditions at all sites, with the lowest values observed in forest sites having comparatively higher MAP (Table 1).
3.2 Variation of δ13C values along the elevational and land-use gradient
There were large variations in δ13C values along the elevational and land-use gradient, with distinct differences between managed and semi-natural ecosystems (Fig. 2). Compared to soils and litter, leaves invariably showed the lowest δ13C values in all the studied ecosystems, with the exception of grasslands and savannas that exhibited lower soil δ13C values than plant material.
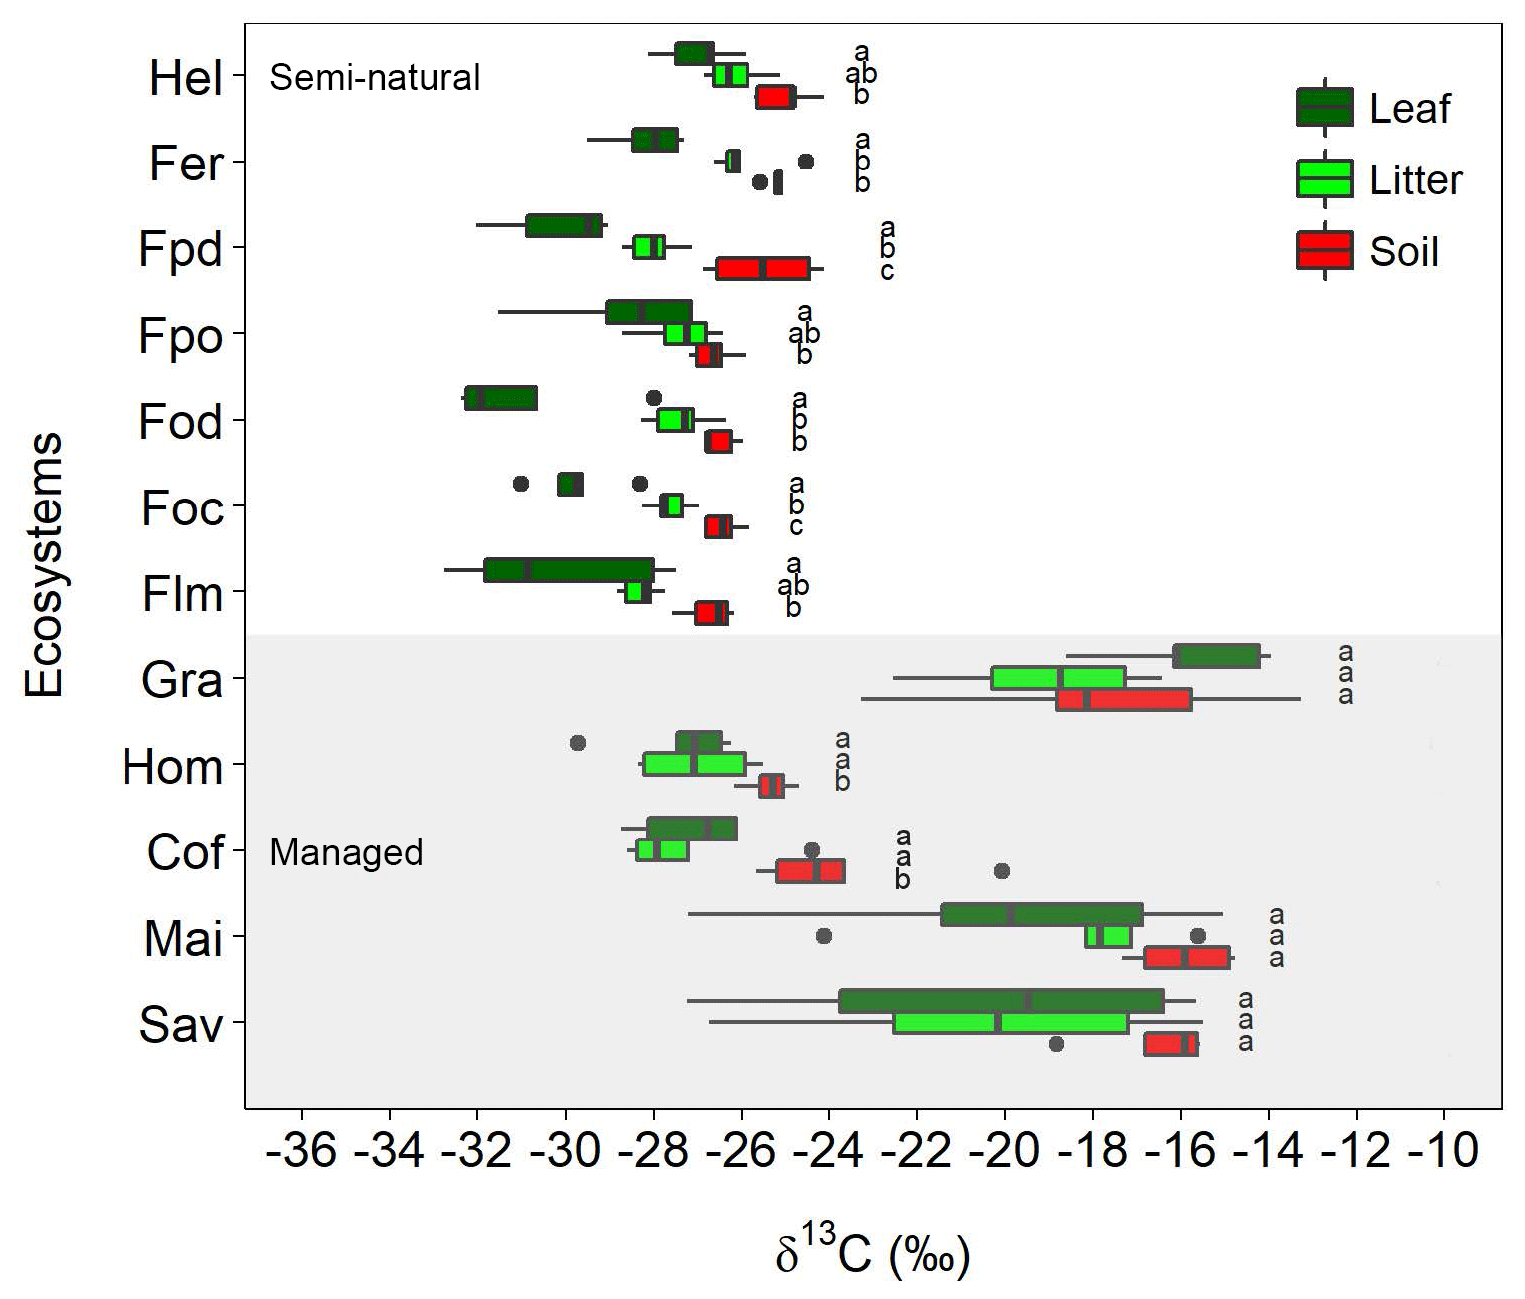
Figure 2Variation in δ13C values for leaves, litter, and soil along the Kilimanjaro elevational and land-use gradient. Ecosystem data represent the average values of five sites (one per each transect), with each site being composed of five samples (n=5). Box plots show median values per ecosystem with whiskers representing the first and third quartiles. Dots represent outliers. The shaded region represents managed ecosystems (both intensively and extensively), while those unshaded indicate semi-natural ecosystems. Lower-case letters show significant differences between sampled materials within each ecosystem (one-way ANOVA followed by Tukey's HSD test as a post hoc procedure, P≤0.05). The ecosystem acronyms used are as per Table 1. Mai, Cof, and Hom are managed cropping sites, Gra and Sav are extensively managed grasslands and savannas, and the rest represent semi-natural ecosystems. Sites are ordered by increasing altitude.
The δ13C values of semi-natural ecosystems ranged between −32.8 and −24.1 ‰ (mean ± SE: soil ‰; litter ‰; leaves ‰), showing a progressive reduction with decreasing elevation (i.e. from 4500 to 1750 m a.s.l.; Fig. S2). The variation in δ13C values was much higher (−29.7 ‰ to −13.3 ‰) in managed ecosystems located at lower elevations (i.e. between 860 and 1750 m a.s.l.; Fig. S2). The highest δ13C values were observed in C4-dominated ecosystems (i.e. savannas, maize fields, and grasslands; soil ‰, litter ‰, leaves ‰), while lower δ13C values were obtained for coffee plantations and home gardens (soil ‰, litter ‰, leaves ‰). Coffee plantations showed a slight influence of C4 vegetation in the soil data as a result of grasses growing between the rows of coffee plants. No significant variations were observed between δ13C values of soils and those of litter and leaves in the ecosystems with a predominance of C4 vegetation (savannas, maize fields, and grasslands). Exploratory data analyses revealed that in most cases soil, litter, leaf, and climatic variables cross-correlated with each other (Table S2 in the Supplement).
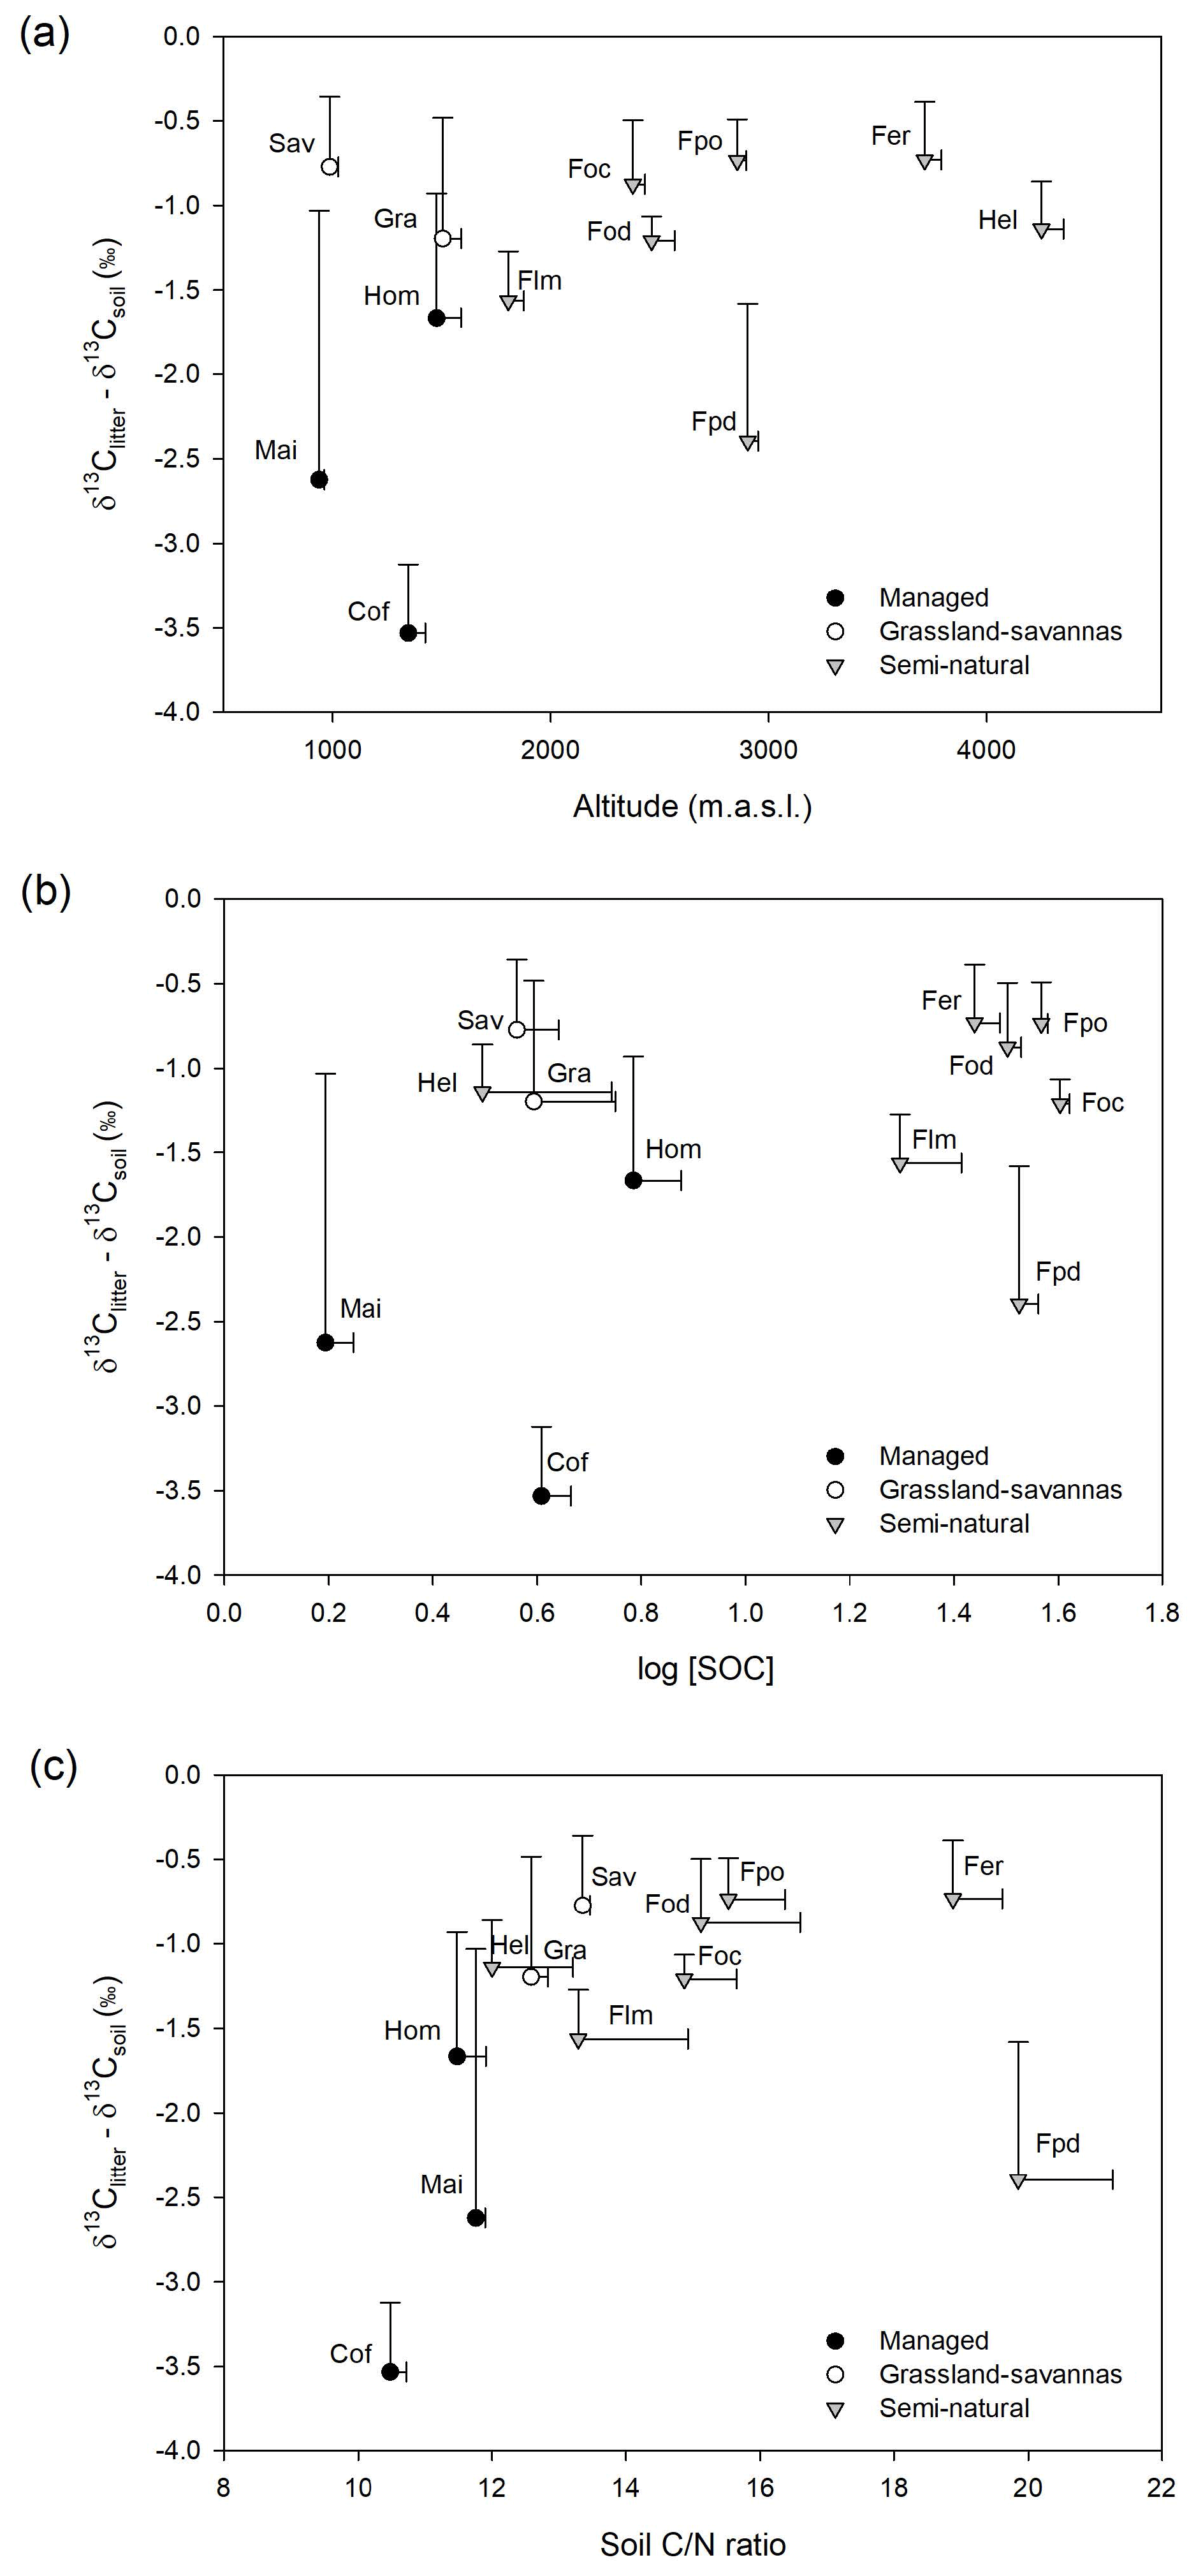
Figure 3(a) Variation in δ13C-based enrichment factors (δ13Citter-soil) with elevation; (b) relationship between δ13C-based enrichment factors (δ13Citter-soil) and SOC concentration (log SOC); and (c) relationship between δ13C-based enrichment factors (δ13Citter-soil) and soil C∕N ratios. Note: a savanna site with large C3 influence was removed from the figure for clarity.
Figure 3 shows relatively small variations in δ13C enrichment factors (> −1.25 ‰) both in undisturbed semi-natural and extensively managed sites along the elevational gradient, while managed and disturbed sites show higher and more variable δ13C enrichment factors.

Figure 4Variation in δ15N values and δ15N-based enrichment factors along the Kilimanjaro elevational and land-use gradient. (a) Variation in δ15N values for leaves, litter, and soil material sampled along the Kilimanjaro elevational and land-use gradient. Box plots show median values per ecosystem with whiskers representing the first and third quartiles. Dots represent outliers. Ecosystem data represent the average values of five sites (one per each transect), with each site being composed of five samples. Lower-case letters show significant differences between sampled materials within each ecosystem (one-way ANOVA followed by Tukey's HSD test as a post hoc procedure, P≤0.05). (b) Variation in δ15N-based enrichment factors (δ15Nlitter-soil) calculated for the different ecosystems along the elevational and land-use gradient. Dotted box plots indicate ecosystems dominated by C4 vegetation. Capital letters indicate significant differences between ecosystems (one-way ANOVA followed by Tukey's HSD test as a post hoc procedure, P≤0.05). The ecosystem acronyms used are the same as those in Table 1. Sites are ordered by increasing altitude.
3.3 Variation of δ15N values along the elevational and land-use gradient
Significantly higher δ15N values were observed for all sampled materials in the intensively managed (cropping) systems compared to semi-natural and grass-dominated ecosystems (Fig. 4a). The δ15N values for managed systems ranged between −2.6 and 7.8 ‰ (mean ± SE: soil 5.6±0.3 ‰, litter 1.7±0.5 ‰, leaves 2.0±0.5 ‰). By contrast, semi-natural ecosystems had considerably lower δ15N values, which ranged from −5.0 ‰ to 3.6 ‰ (soil 1.5±0.2 ‰, litter ‰, leaves ‰). Soil δ15N values were significantly higher than those of leaves and litter across all the ecosystems studied, with the only exception being agroforestry home gardens (Fig. 4a). δ15N values of leaves and litter did not show significant differences within any given ecosystem.
Calculated δ15N-based enrichment factors showed high variability across all ecosystems with values ranging from −7.5 ‰ to −1.6 ‰ (Fig. 4b). A differentiation between managed and natural ecosystems was less clear than for δ15N values. The most negative enrichment factors (< −4.0 ‰) were observed for Helichrysum, Erica, Podocarpus disturbed, and grass-dominated ecosystems (savannas and grasslands). These enrichment factors were significantly less negative for montane forests at lower elevations (Podocarpus, Ocotea, and lower montane) and intensively managed (cropping) systems (i.e. home garden, coffee, and maize; Fig. 4b).
3.4 Impacts of soil and climatic variables on soil δ15N values
Two principal components (PCs) explained 78.3 % of the total soil δ15N variation (Fig. 5). The first component explained 55.8 % of the variability, and included soil chemistry and climatic variables (soil C and N concentrations, soil C∕N ratio, soil pH, soil δ13C, MAP, and MAT). Highly significant correlations (P < 0.001) were obtained between PC 1 and the above factors (r=0.93, 0.93, 0.61, −0.87, −0.76, 0.87, and −0.63, respectively; Table S3). The second component explained an additional 22.5 % of soil δ15N variability and included soil texture (clay and sand contents) and MAT. These variables were highly correlated with PC 2 (, 0.82, and −0.65; Table S3). The principal component bi-plot showed a strong grouping between managed and semi-natural ecosystems (Fig. 5). Managed sites clustered around MAT, soil δ13C, and soil pH, while C4-dominated ecosystems (grassland, savannas, and maize fields) were preferentially influenced by the latter two variables. In contrast, semi-natural montane forest ecosystems rather grouped around soil chemical properties such as C and N contents, C∕N ratio, and MAP, while alpine Helichrysum ecosystems clustered around soil sand content.
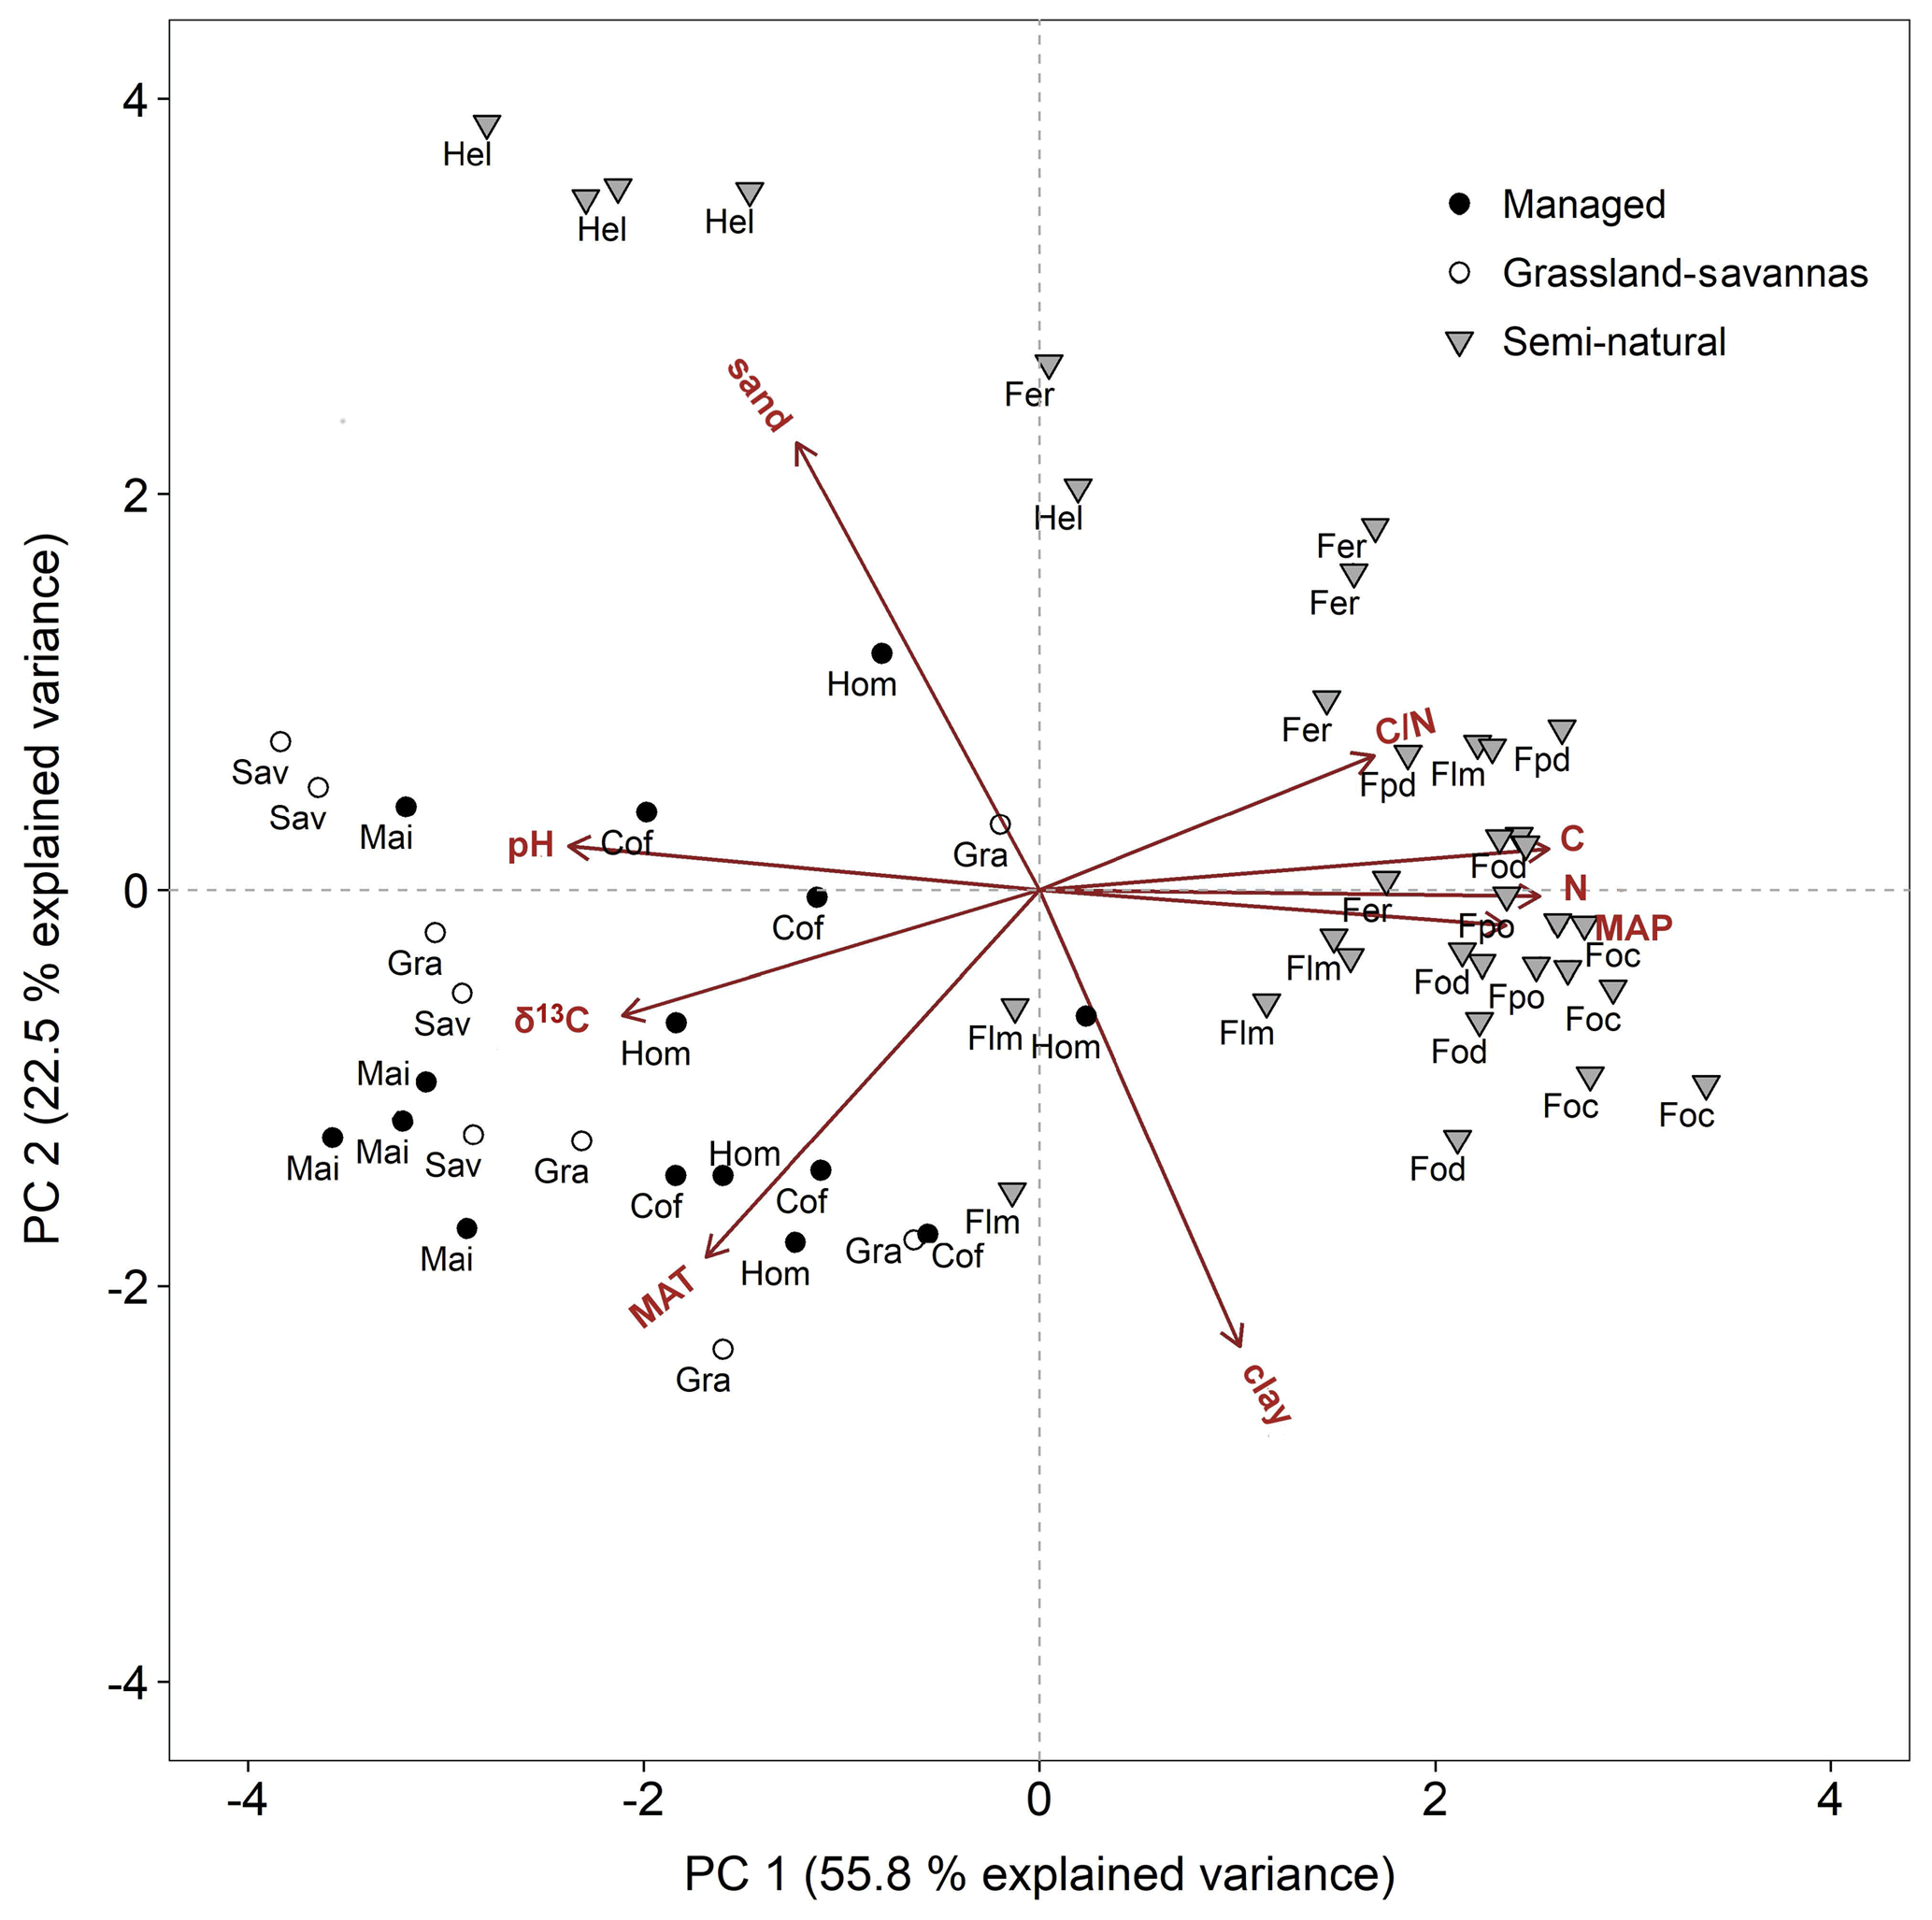
Figure 5Principal component analysis bi-plot for soil and climate variables potentially controlling soil δ15N. Symbols are as per all previous figures. Acronyms are as per Table 1. C∕N: soil C∕N ratio, C: soil carbon content, N: soil nitrogen content, MAP: mean annual precipitation, clay: soil clay content, MAT: mean annual temperature, δ13C: soil δ13C, and pH: soil pH.
In addition to PCA, multiple regression analyses were performed using a stepwise procedure that identified soil N content and MAT as the main driving variables explaining the variation in soil δ15N. A paraboloid model explained 68 % of this variability (P < 0.05; Fig. 6). The combination of relatively high soil N contents (1 % to 3 %) and low MAT (up to 14 ∘C) invariably corresponded to low soil δ15N values (< 2 ‰) characteristic of semi-natural ecosystems. Conversely, the relatively high soil δ15N values (> 2 ‰) observed in managed ecosystems corresponded to low soil N contents (< 1 %) and comparatively high MAT (17 to 25 ∘C).
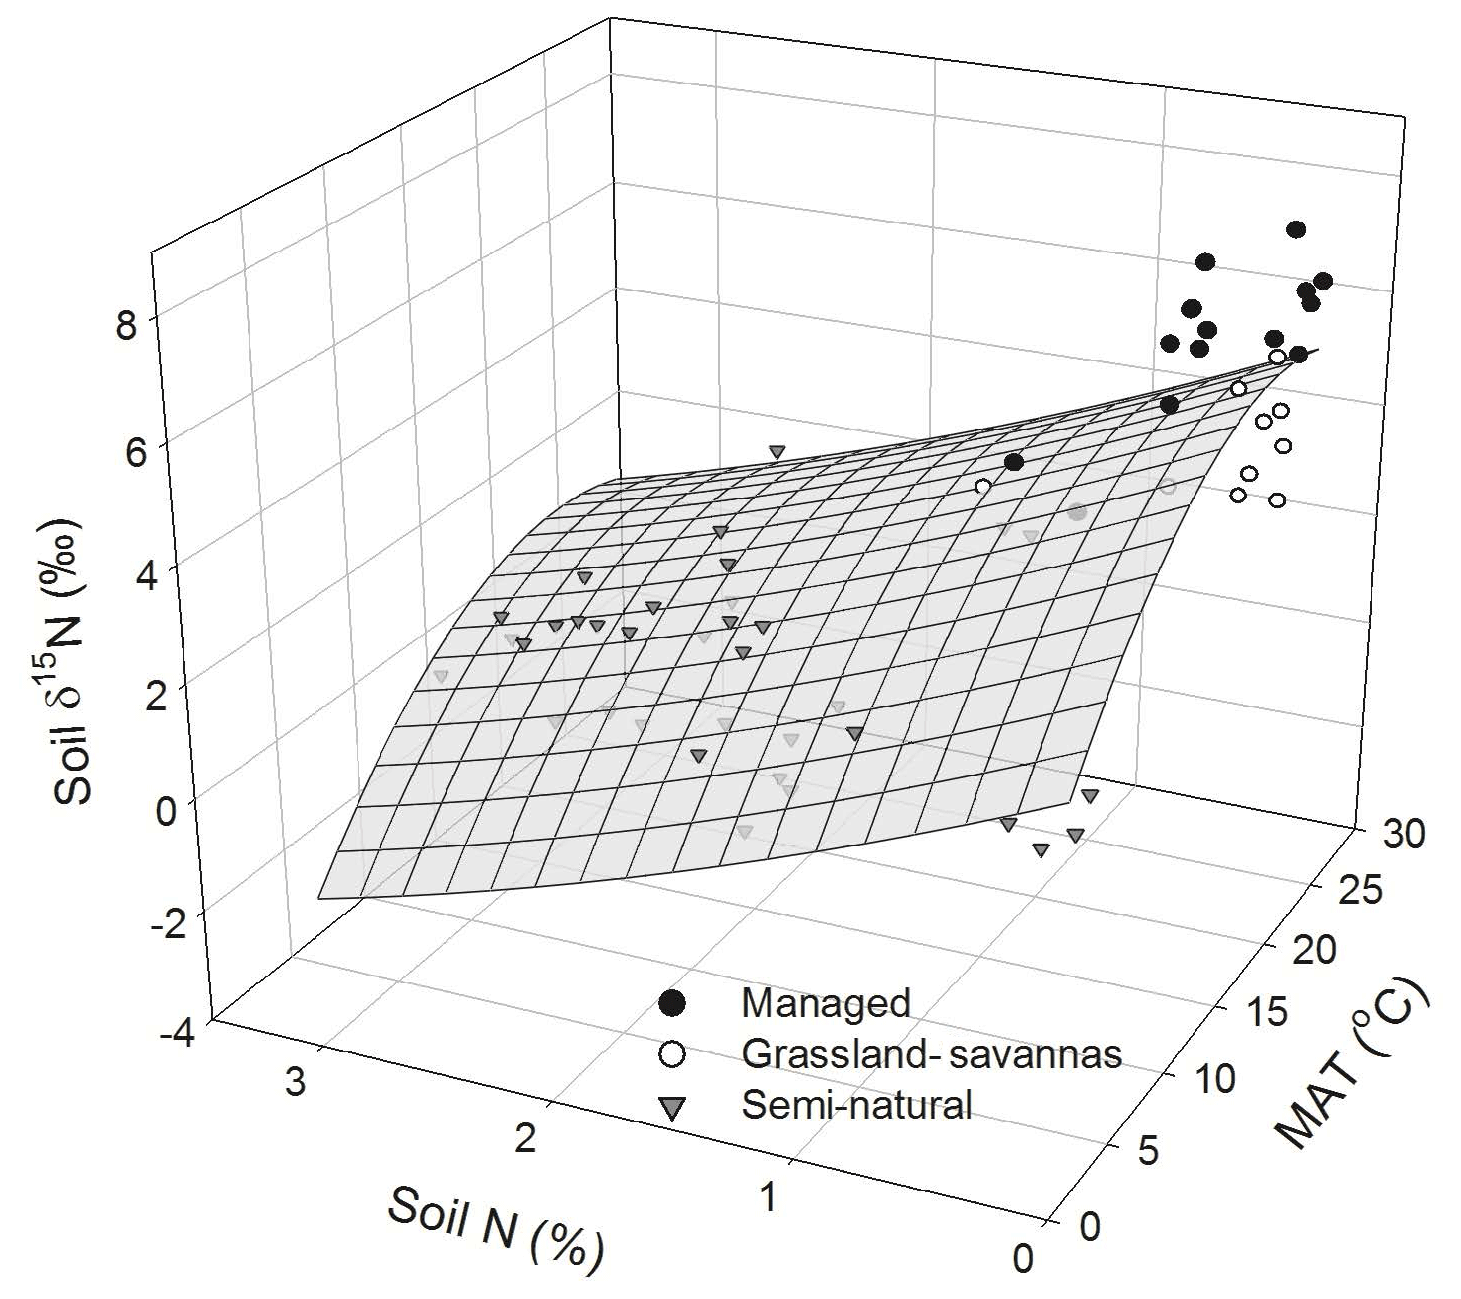
Figure 6Measured and modelled soil δ15N values predicted as a function of soil N abundance and mean annual temperature (MAT). Data points are classified by generic land uses (i.e. intensively managed cropping sites, extensively managed grassland and savannas, and semi-natural ecosystems) observed along the elevational and land-use gradient. The regression takes the following form: soil δ15N (MAT) − 1.86 (soil N) − 0.01 (MAT)2+0.14 (soil N)2; (r2 adj =0.68, P < 0.05, n=60).
The relationship between soil δ15N values and climatic and edaphic variables provided valuable information about potentially different SOM dynamics in the various ecosystems studied, with data showing a clear differentiation between semi-natural and managed ecosystems (Fig. S4). The former is characterized by comparatively higher C∕N ratios and lower δ15N values (averaging 15.5 ‰ and 1.5 ‰, respectively), while the latter showed lower C∕N ratios and higher soil δ15N values (averaging 11.9 ‰ and 3.5 ‰, respectively). Managed ecosystems further grouped into intensively cropped (home gardens, maize fields, and coffee plantations) and extensively managed grass-dominated ecosystems (savannas and grasslands).
4.1 Factors influencing the variation of δ13C values along the elevational and land-use gradient
The δ13C values of leaves in C3-dominated (semi-natural) ecosystems at Mount Kilimanjaro increased with elevation (Figs. 1 and S2), which is in agreement with findings from other mountainous ecosystems in the tropics, Europe, and North America (Bird et al., 1994; Körner et al., 1991; Ortiz et al., 2016; Zhou et al., 2011; Zhu et al., 2009). The wider scatter of δ13C values observed in leaves relative to soils is most certainly due to the inherently large (interspecific and intraspecific) variability of δ13C in plants (Bird et al., 1994). Different tissues within the plant can present widely divergent δ13C values as a result of fractionation processes associated with the C compounds involved in their construction (Dawson et al., 2002). Moreover, other factors including light intensity, humidity, and the reutilization of previously respired low 13C-CO2 within the canopy may further contribute to the variability of δ13C in leaf tissues (Ometto et al., 2006; van der Merwe and Medina, 1989).
While fractionation effects preclude a straightforward interpretation of δ13C of SOM, this variable provides an integrated measure of the isotopic composition of the precursor biomass at the ecosystem level (Bird et al., 2004; Saiz et al., 2015a). Mass balance calculations that assume (i) 5 % (w∕w) average root mass (< 2 mm) in soil samples and (ii) leaves having similar isotopic signals as roots show that the removal of visible sieved roots might cause a very small effect on soil isotopic values. This would amount to values ∼0.15 ‰ higher than the original soil isotopic values, with such discrepancy being even smaller if root samples were considered to have values 0.5 ‰–1 ‰ higher than leaves, as is commonly reported in the literature (calculations not shown). Besides the natural variability of soil δ13C values observed in C3-dominated semi-natural ecosystems, there were distinct patterns in the δ13C values of soil samples collected in extensively managed, low-elevation ecosystems where woody and grass vegetation coexist (i.e. grasslands and savannas), which indicates the strong influence exerted by C4 vegetation on the C isotopic composition of all sampled materials (Fig. 2). The results obtained in semi-natural ecosystems at Mount Kilimanjaro fit well within the interpretative framework for elevational soil δ13C data proposed by Bird et al. (1994). These authors suggest that besides temperature and atmospheric pressure, other primary factors influencing soil δ13C values are the age and degree of decomposition of SOM and variables related to the characteristics of the canopy, including the proportion of respired CO2 that is recycled during photosynthesis, the relative contribution of leaf and woody litter to SOM, and soil moisture.
Besides the factors explained above, soil δ13C values are strongly influenced by the balance between ecosystem C inputs and outputs. It seems reasonable to assume that in the case of natural ecosystems there may be a steady state between SOM inputs and decomposition rates. This should be in contrast with the typically altered nutrient dynamics of disturbed systems, particularly those under agricultural management (Wang et al., 2018). Low fractionation factors in δ13C are commonly reported between plant material and topsoils in natural systems, mainly because of the relatively limited humification of recent organic matter prevalent in topsoils (Acton et al., 2013; Wang et al., 2018). Thus, we hypothesized that if C inputs and outputs were roughly in balance, then the difference in δ13C values between plant material and topsoil would be smaller in undisturbed sites compared to managed or disturbed sites. The results shown in Fig. 3 agree well with this notion.
Soil δ13C values decreased with increasing MAP and decreasing MAT, which also corresponded with higher SOC contents (Fig. S3). This suggests that the relatively cooler and wetter conditions of high-elevation semi-natural forest ecosystems (i.e. Foc, Fpo) promote the accumulation of SOM, which is similar to previous findings of work conducted along elevational gradients (Bird et al., 1994; Kohn, 2010). Compared to high-elevation locations, the climatic conditions of mid-elevation ecosystems are more favourable for the activities of SOM decomposers, as these sites are consistently warmer and drier than the characteristically cool and occasionally waterlogged high-altitude ecosystems (Fig. S1; Becker and Kuzyakov, 2018; Borken and Matzner, 2009; Garten et al., 2009; Kirschbaum, 1995; Leirós et al., 1999). The comparatively high soil δ13C values observed in the disturbed Podocarpus (Fpd) and Erica forest (Fer) plots may have been partly caused by recurrent fire events (Hemp, 2005) leading to reduced SOC contents and higher C∕N ratios (Saiz et al., 2015a). Further variations in soil δ13C values could also be related to the biochemical composition of the precursor biomass. For instance, herbaceous vegetation is pervasive at high elevations and contains relatively low amounts of lignin – an organic compound characteristically depleted in 13C (Benner et al., 1987). This may contribute to explaining the higher δ13C values observed in plant and soil materials in alpine ecosystems dominated by Helichrysum vegetation compared to forest ecosystems at lower elevations (Fig. 2).
Elevation also has a strong influence on the seasonal litterfall dynamics observed in Mount Kilimanjaro and thus may have significant implications in the SOM cycling across the various ecosystems. Becker et al. (2015) suggest that the large accumulation of particulate organic matter observed at the end of the dry season in low- and mid-altitude ecosystems may result in the increased mineralization of easily available substrates (Mganga and Kuzyakov, 2014) and nutrient leaching (Gütlein et al., 2018) during the following wet season. Agricultural practices such as the removal of biomass or ploughing deplete SOM, particularly in intensively managed systems (i.e. maize, home gardens, and coffee plantations), thus leading to lower SOC contents and C∕N ratios and slightly higher soil δ13C values than those observed in semi-natural ecosystems at comparable elevations (e.g. lower montane forests; Fig. S3). Indeed, the relationship between δ13C enrichment factors and soil C∕N ratios shown in Fig. 3 is quite informative regarding SOM dynamics. As previously mentioned, soil C∕N ratios provide a good indication of SOM decomposition processes, typically showing comparatively low values in managed and disturbed systems. These correspond well with sites having large enrichment factors (< −1.25 ‰; i.e. intensively managed and disturbed sites), which agrees with the notion of altered SOM dynamics. Therefore, besides the systematic removal of plant biomass characteristic of agricultural systems, annual litterfall patterns may also explain the comparatively lower contents of C and N observed in the topsoils of intensively managed sites (Table 1; Figs. S3, S4). Moreover, low-elevation ecosystems contain a variable mixture of C3 and C4 vegetation, which have been shown to have differential mineralization dynamics as demonstrated by incubation experiments (Wynn and Bird, 2007) and field-based research (Saiz et al., 2015a).
Our data show strong relationships between temperature and variables directly related to SOM dynamics such as soil δ13C, C, N, and C∕N ratios (Table S2). These results agree well with recent findings by Becker and Kuzyakov (2018), who studied SOM decomposition dynamics at these very sites. An important finding revealed by that study is seasonal variation in temperature being a major factor controlling litter decomposition. Their study shows that small seasonal variations in temperature observed at high-elevation sites exert a strong effect on litter decomposition rates. Therefore, the authors argue that the projected increase in surface temperature may result in potentially large soil C losses at these sites due to the comparatively strong temperature sensitivity to decomposition that is commonly observed at low temperatures and at high-elevation sites (Blagodatskaya et al., 2016).
Savannas and grasslands are subject to recurrent fire events, and thus the soils of these ecosystems may potentially contain significant amounts of fire-derived (pyrogenic) C (Saiz et al., 2015b). This can be partly demonstrated by the higher soil C∕N ratios observed in these ecosystems compared to C4-dominated agricultural systems protected from fire (e.g. maize plantations; Fig. S3d). Moreover, the δ13C values of soils in grasslands and savannas were lower than those of leaves, which may be due to the savanna isotope disequilibrium effect (SIDE) (Bird and Pousai, 1997; Saiz et al., 2015b). The latter concept explains the difference in C isotopic composition between the precursor vegetation and pyrogenic C compounds produced during the combustion of biomass. Saiz et al. (2015b) have demonstrated that savanna fires produce pyrogenic C that is relatively 13C depleted with respect to the precursor biomass. Furthermore, the combustion of C4 vegetation produces finer pyrogenic C particles than woody biomass, resulting in the preferential export of grass-derived pyrogenic particles from the site of burning, which further enhances the depletion of 13C in these soils (Saiz et al., 2018).
4.2 Variation of δ15N values along the elevational and land-use gradient
The δ15N values of leaves, litter, and topsoil presented here (Fig. 4a) agree well with the range of data reported from earlier investigations in the same study region (Amundson et al., 2003; Zech et al., 2011), but with our study involving more ecosystems, replicate sites, and a far larger spatial sampling domain. Overall, the δ15N values for montane tropical forest ecosystems in Mount Kilimanjaro are considerably lower than the mean values reported for a broad variety of tropical lowland forests worldwide (soil values ranging from 3 ‰ to 14 ‰; de Freitas et al., 2015; Martinelli et al., 1999; Nardoto et al., 2014; Piccolo et al., 1996; Sotta et al., 2008). Rather, the δ15N values observed in the montane forests investigated are in the same range of temperate forest ecosystems reported in a comprehensive literature review by Martinelli et al. (1999). These authors argue that, compared to tropical lowland forests, the lower δ15N values of temperate and montane tropical forests result from their lower N availability and thus lower ecosystem N losses. However, this hypothesis may not completely hold for the montane forest ecosystems of our study, since Gütlein et al. (2018) reported elevated soil and DON concentrations at deep soil solution (80 cm) and significant nitrogen leaching rates of 10–15 kg N ha−1 yr−1. The relatively low δ15N-based enrichment factors observed in the lower montane, Ocotea, and undisturbed Podocarpus forest (Fig. 4b) were probably due to the prevalence of biological dinitrogen fixation (BNF) at these ecosystems. The assumption of significant BNF is supported by leaf δ15N values close to 0 ‰ (Fig. 4a) and is in line with previous works (Craine et al., 2015a; Nardoto et al., 2014; Robinson, 2001). Furthermore, sporadic measurements of N compounds in rainfall and throughfall conducted at our forest sites showed substantial input of N via atmospheric deposition, which may be of the order of N leaching losses (unpublished results). This agrees well with findings from Bauters et al. (2018) reporting 18 kg N ha−1 yr−1 N inputs via wet deposition into tropical forests of the Congo Basin, which are predominantly derived from biomass burning and long-range atmospheric transport. High N inputs into these forest ecosystems are likely to be in a similar range as N outputs (prevailed by leaching losses, particularly where MAP is highest; Gütlein et al., 2018), and therefore they would not translate to strong effects on ecosystem δ15N values. The significantly more negative enrichment factors observed in the disturbed Podocarpus and Erica forests (Fig. 4b) may be related to past fire events (Hemp, 2005; Zech et al., 2011). Burning of vegetation may cause losses of 15N-depleted NOχ gas and N leachate, resulting in higher soil δ15N values, thus producing variations in δ15N-based enrichment factors (Zech et al., 2011).
Previous studies have shown that δ15N values generally increase with land-use intensification (Martinelli et al., 1999; Stevenson et al., 2010), which corresponds well with the more positive δ15N values observed in the intensively managed agricultural systems occurring at the mountain's foot slope (Fig. 4a). Indeed, agronomic practices such as fertilization, the removal of plant material after harvest, and ploughing are factors known to impact N turnover processes that strongly affect δ15N values (Bedard-Haughn et al., 2003; Saiz et al., 2016). However, our values are in the lower range of published data for other land-use gradients (Aranibar et al., 2008; Eshetu and Högberg, 2000; Traoré et al., 2015) and may partly be the result of comparably low to moderate organic and inorganic N fertilization rates currently applied in the region (anecdotal evidence gathered by the authors and found in the Supplement). Additionally, the nitrogen isotopic signal of mineral fertilizers commonly used in the region is ∼0 ‰ (Bateman and Kelly, 2007), and thus it may not exert a significant additional bias on the interpretation of soil δ15N values. However, the addition of manure (δ15N ∼8 ‰) in Hom systems, although used in low quantities (Gütlein et al., 2018), may well have contributed to the high δ15N values observed in this ecosystem (Fig. 4). Also, we suggest that the use of pesticides may not pose a strong bias in our isotopic results since their use is limited to intensively managed sites, and the actual isotopic values of pesticides work in the opposite direction to the observed data (Fig. 4; Supplement).
Compared to other low-elevation managed stands such as home gardens and coffee plantations, the higher δ15N-based enrichment factors observed in maize fields and in grass-dominated ecosystems (grasslands and savannas) (Fig. 4b) may be related to both the organic inputs resulting from grazing activities and the influence of C4 vegetation. Both Aranibar et al. (2008) and Wang et al. (2010) have suggested that variations in δ15N values within a given ecosystem could be due to C3 and C4 plants preferentially absorbing chemical forms of N with differing 15N abundances. Moreover, recurrent fires characteristic of tropical grasslands and savannas may have also influenced their comparatively high soil δ15N, causing the relatively high δ15N-based enrichment factors.
4.3 Factors controlling soil δ15N along the elevational and land-use gradient
The strong controlling effects exerted by climatic and edaphic factors on soil δ15N values agree well with numerous previous works (Amundson et al., 2003; Conen et al., 2013; Eshetu and Högberg, 2000; Martinelli et al., 1999; Stevenson et al., 2010). The principal component analysis of factors controlling soil δ15N revealed a strong clustering between managed and semi-natural ecosystems (Fig. 5), which was also reflected in the multiple regression analysis and graphical representation depicting soil δ15N as a function of soil N concentration and MAT (Fig. 6). Semi-natural ecosystems were characterized by relatively low soil δ15N values and occurred across a broad range of soil N contents in locations with low to medium MAT. By contrast, intensively managed ecosystems had higher soil δ15N values and corresponded to locations with low soil N contents and high MAT. The negative correlation of δ15N values with soil nitrogen content and the positive correlation with mean annual temperature suggest reduced mineralization rates and thus limited nitrogen availability, at least in high-elevation ecosystems.
The sharp contrast observed both in soil C∕N ratios and δ15N values between managed and semi-natural ecosystems offers additional useful information about their potentially contrasting SOM dynamics (Fig. S4d). Intensively managed sites consistently showed low soil C∕N ratios and high soil δ15N values, which may initially suggest a more open N cycle and potentially greater N losses as reported by Gerschlauer et al. (2016) for some of these ecosystems. This may be due to the C limitation of heterotrophic microbial N retention under low C∕N ratios (Butterbach-Bahl and Dannenmann, 2012). However, nitrate leaching is quite a relevant process that discriminates only slightly against 15N (Denk et al., 2017), which may confound the interpretation of soil δ15N values. Indeed, Gütlein et al. (2018) have recently shown that nitrate leaching may be quite significant in Mount Kilimanjaro's semi-natural forests. Therefore, at least in these ecosystems, claims about the nature of the N cycle (i.e. open or closed) should not be made solely on the basis of soil δ15N.
Grass-dominated ecosystems (grasslands and savannas) were noticeably different to the intensively managed croplands, as demonstrated by the higher soil C∕N ratios and lower soil δ15N of the former, which suggests a lower degree of decomposition of organic matter and potentially lower N turnover rates (Saiz et al., 2016). Within the intensively managed sites, the stands under maize cultivation show an interesting case of enhanced SOM dynamics. These sites are under an intensive management regime that involves the removal of aboveground vegetation after harvest. This fact combined with the faster decomposition rates reported for C4-derived SOM (Saiz et al., 2015a, 2016; Wynn and Bird, 2007) may invariably lead to their characteristically low SOC and N contents (Table 1; Figs. S3, S4). Furthermore, low soil C∕N ratios have been reported to enhance gaseous losses in semi-arid systems, which leads to increased soil δ15N values (Aranibar et al., 2004) and may explain why maize stands showed the highest soil δ15N values of all the land uses studied.
Semi-natural ecosystems showed rather high soil C∕N ratios and low soil δ15N values compared to managed sites (Fig. S4d). The more humid and cooler conditions prevalent in forest ecosystems may limit decomposition processes, thereby contributing significantly to their higher SOM abundance (Table 1). A small variation range in soil δ15N values was also reported by Zech et al. (2011) for semi-natural ecosystems (Foc and Fpo) when working along the same land-use and elevation gradient. Like us, these authors also observed a strong significant correlation of soil δ15N with MAT, but not with MAP (Table S2). Additionally, site-specific soil characteristics and the structural composition of vegetation have a strong influence on ecosystem nutrient dynamics (Saiz et al., 2012, 2015a). Ecosystem disturbances (e.g. fire, selective logging, etc.) cause changes in vegetation cover that affect SOM cycling and may translate into variations in soil C∕N ratios (Saiz et al., 2016). Both Ocotea and Podocarpus forests contain disturbed (Fod, Fpd) and undisturbed stands (Foc, Fpo), though only the Podocarpus ecosystems allow for a general overview of disturbance impacts on SOM-related properties. While changes in the isotopic composition of C and N were not significant, soil C∕N ratios were heavily influenced by disturbance (Fig. S4). Compared to non-disturbed sites, the lower C and N contents observed in the soil of disturbed ecosystems indicate reduced OM inputs to the soil and/or enhanced decomposition of SOM (Table 1). The higher soil C∕N ratios observed in the Podocarpus disturbed and Erica forests may well be the result of fire, which may preferentially promote N losses while accruing relatively recalcitrant C forms (i.e. pyrogenic C). Woody biomass combustion produces pyrogenic C that accumulates preferentially close to the site of production (Saiz et al., 2018), thus likely contributing to the higher soil C∕N ratios observed at these disturbed ecosystems. The lowest soil C∕N ratios among all semi-natural ecosystems were observed at the alpine Helichrysum sites, which may relate to their characteristically sparse vegetation and extremely low MAT. Under such circumstances, soil development, biomass inputs, decomposition processes, and thus soil N turnover may be strongly limited, as was confirmed by a recent study conducted at one of these sites (Gütlein et al., 2017).
The variations in δ13C and δ15N values combined with the interpretation of other indices, such as δ13C- and δ15N-based enrichment factors and soil C∕N ratios, enabled a qualitative characterization of regional differences in C and N dynamics as affected by vegetation characteristics, environmental conditions, and management activities.
Our data show that SOM contents are higher in cold and wet high-elevation ecosystems than at low-elevation managed sites. Management practices such as tillage, harvest, and vegetation burning promote the loss of OM, with SOM decomposition being further enhanced by the warm and moderately wet conditions of the mountain's foot slope. Based on our results, we suggest that besides management, increasing temperatures in a changing climate may promote C and N losses, thus altering the otherwise stable SOM dynamics of Mount Kilimanjaro's forest ecosystems. Moreover, the current situation of low N inputs in managed systems of sub-Saharan Africa is likely to change, since national efforts that aim to increase fertilizer use are currently at < 10 % of recommended rates (Hickman et al., 2014). Therefore, our data may also be valuable as a generic reference for low-elevation tropical agrosystems managed under low N inputs, while it may also allow for the monitoring of expected changes in agricultural management and associated impacts on the ecosystem N cycle through the study of variation in δ15N values.
In addition to climatic and edaphic factors, δ15N values of plant and soil material can largely depend on both the amount and δ15N signal of atmospheric deposition and BNF, which highlights the importance of conducting additional measurements of site-specific N cycling when comparing ecosystem δ15N values across different biomes and regions. The combination of qualitative isotope natural abundance studies at a large number of sites (this study) with more elaborated quantitative process studies using enriched isotope labelling and N losses on a lower number of selected sites represents an ideal approach to characterize the ecosystem C and N cycling of the larger Mount Kilimanjaro region with its diverse ecosystems, climate, and management.
Research data can be requested and accessed through the following link: https://www.kilimanjaro.biozentrum.uni-wuerzburg.de/Data/Data.aspx (Gerschlauer and Kiese, 2016).
The supplement related to this article is available online at: https://doi.org/10.5194/bg-16-409-2019-supplement.
FG contributed to design, performed the study, and co-wrote the paper; GS contributed to analyses and co-wrote the paper; DSC and MK provided plant samples and contributed to writing; MD contributed to writing; and RK designed the study and contributed to analyses and writing.
The authors declare that they have no conflict of interest.
This study was funded by the German Research Foundation (DFG: KI 1431/1-1 and
KI 1431/1-2) within research unit 1246 (KiLi) and supported by the Tanzanian
Commission for Science and Technology (COSTECH), the Tanzania Wildlife
Research Institute (TAWIRI), and the Mount Kilimanjaro National Park
(KINAPA). In addition, the authors thank Andreas Hemp for the selection and
preparation of the research plots, Bernd Huwe for the correction of soil
texture data, all local helpers in Tanzania, and the assistants in the
laboratory of IMK-IFU in Germany. Technical support by the Center of Stable
Isotopes at KIT/IMK-IFU is gratefully acknowledged. Further thanks go to the
following persons from the KiLi project: Tim Appelhans and Thomas Nauss,
Jie Zhang, Gemma Rutten, and Andreas Hemp for providing georeferenced points
underlying the GeoTIFF in Fig. 1b. We also thank four anonymous reviewers and
Jonathan Wynn for insightful comments on the paper.
The article processing charges for this open-access
publication were covered by a Research
Centre
of the Helmholtz Association.
Edited by:
Yakov Kuzyakov
Reviewed by: four anonymous referees
Abaker, W. E., Berninger, F., Saiz, G., Braojos, V., and Starr, M.: Contribution of Acacia senegal to biomass and soil carbon in plantations of varying age in Sudan, Forest Ecol. Manag., 368, 71–80, https://doi.org/10.1016/j.foreco.2016.03.003, 2016.
Abaker, W. E., Berninger, F., Saiz, G., Pumpanen, J., and Starr, M.: Linkages between soil carbon, soil fertility and nitrogen fixation in Acacia senegal plantations of varying age in Sudan, PeerJ, 6, e5232, https://doi.org/10.7717/peerj.5232, 2018.
Acton, P., Fox, J., Campbell, E., Rowe, H., and Wilkinson, M.: Carbon isotopes for estimating soil decomposition and physical mixing in well-drained forest soils, J. Geophys. Res.-Biogeo., 118, 1532–1545, 2013.
Amundson, R., Austin, A. T., Schuur, E. A. G., Yoo, K., Matzek, V., Kendall, C., Uebersax, A., Brenner, D., and Baisden, W. T.: Global patterns of the isotopic composition of soil and plant nitrogen, Global Biogeochem. Cy., 17, 1031, https://doi.org/10.1029/2002GB001903, 2003.
Appelhans, T., Mwangomo, E., Otte, I., Detsch, F., Nauss, T., and Hemp, A.: Eco-meteorological characteristics of the southern slopes of Kilimanjaro, Tanzania, Int. J. Climatol., 36, 3245–3258, https://doi.org/10.1002/joc.4552, 2016.
Aranibar, J. N., Otter, L., Macko, S. A., Feral, C. J., Epstein, H. E., Dowty, P. R., Eckardt, F., Shugart, H. H., and Swap, R. J.: Nitrogen cycling in the soil–plant system along a precipitation gradient in the Kalahari sands, Glob. Change Biol., 10, 359-373. https://doi.org/10.1111/j.1365-2486.2003.00698.x, 2004.
Aranibar, J. N., Anderson, I. C., Epstein, H. E., Feral, C. J. W., Swap, R. J., Ramontsho, J., and Macko, S. A.: Nitrogen isotope composition of soils, C3 and C4 plants along land use gradients in southern Africa, J. Arid Environ., 72, 326–337, https://doi.org/10.1016/j.jaridenv.2007.06.007, 2008.
Bai, E., Houlton, B. Z., and Wang, Y. P.: Isotopic identification of nitrogen hotspots across natural terrestrial ecosystems, Biogeosciences, 9, 3287–3304, https://doi.org/10.5194/bg-9-3287-2012, 2012.
Bateman, A. S. and Kelly, S. D.: Fertilizer nitrogen isotope signatures, Isot. Environ. Heal. S., 43, 237–247, 2007.
Bauters, M., Drake, T. W., Verbeeck, H., Bodé, S., Hervé-Fernández, P., Zito, P., Podgorski, D. C., Boyemba, F., Makelele, I., Ntaboba, L. C., Spencer, R. G. M., and Boeckx, P.: High fire-derived nitrogen deposition on central African forests, P. Natl. Acad. Sci. USA, 115, 549–554, https://doi.org/10.1073/pnas.1714597115, 2018.
Becker, J., Pabst, H., Mnyonga, J., and Kuzyakov, Y.: Annual litterfall dynamics and nutrient deposition depending on elevation and land use at Mt. Kilimanjaro, Biogeosciences, 12, 5635–5646, https://doi.org/10.5194/bg-12-5635-2015, 2015.
Becker, J. N. and Kuzyakov, Y.: Teatime on Mount Kilimanjaro: Assessing climate and land-use effects on litter decomposition and stabilization using the Tea Bag Index, Land Degrad. Dev., 29, 2321–2329, 2018.
Bedard-Haughn, A., van Groenigen, J. W., and van Kessel, C.: Tracing 15N through landscapes: potential uses and precautions, J. Hydrol., 272, 175–190, https://doi.org/10.1016/S0022-1694(02)00263-9, 2003.
Benner, R., Fogel, M. L., Sprague, E. K., and Hodson, R. E.: Depletion of 13C in lignin and its implications for stable carbon isotope studies, Nature, 329, 708–710, https://doi.org/10.1038/329708a0, 1987.
Bird, M. I., Haberle, S. G., and Chivas, A. R.: Effect of altitude on the carbon-isotope composition of forest and grassland soils from Papua New Guinea, Global Biogeochem. Cy., 8, 13–22, https://doi.org/10.1029/93GB03487, 1994.
Bird, M. I. and Pousai, P.: Variations of δ13C in the surface soil organic carbon pool, Global Biogeochem. Cy., 11, 313–322, https://doi.org/10.1029/97GB01197, 1997.
Bird, M. I., Veenendaal, E. M., and Lloyd, J. J.: Soil carbon inventories and δ13C along a moisture gradient in Botswana, Glob. Change Biol., 10, 342–349, https://doi.org/10.1046/j.1365-2486.2003.00695.x, 2004.
Blagodatskaya, E., Blagodatsky, S., Khomyakov, N., Myachina, O., and Kuzyakov, Y.: Temperature sensitivity and enzymatic mechanisms of soil organic matter decomposition along an altitudinal gradient on Mount Kilimanjaro, Sci. Rep.-UK, 6, 22240, https://doi.org/10.1038/srep22240, 2016.
Booth, M. S., Stark, J. M., and Rastetter, E.: Controls on Nitrogen Cycling in Terrestrial Ecosystems: A Synthetic Analysis of Literature Data, Ecol. Monogr., 75, 139–157, https://doi.org/10.1890/04-0988, 2005.
Borken, W. and Matzner, E.: Reappraisal of drying and wetting effects on C and N mineralization and fluxes in soils, Glob. Change Biol., 15, 808–824, https://doi.org/10.1111/j.1365-2486.2008.01681.x, 2009.
Butterbach-Bahl, K. and Dannenmann, M.: Soil Carbon and Nitrogen Interactions and Biosphere-Atmosphere Exchange of Nitrous Oxide and Methane, in: Recarbonization of the Biosphere, edited by: Lal, R., Lorenz, K., Hüttl, R. F., Schneider, B. U., and von Brau, J., Springer, the Netherlands, 429–443, 2012.
Cernusak, L. A., Ubierna, N., Winter, K., Holtum, J. A. M., Marshall, J. D., and Farquhar, G. D.: Environmental and physiological determinants of carbon isotope discrimination in terrestrial plants, New Phytol., 200, 950–965, https://doi.org/10.1111/nph.12423, 2013.
Conen, F., Yakutin, M. V., Carle, N., and Alewell, C.: δ15N natural abundance may directly disclose perturbed soil when related to C : N ratio, Rapid Commun. Mass Sp., 27, 1101–1104, https://doi.org/10.1002/rcm.6552, 2013.
Craine, J. M., Brookshire, E. N. J., Cramer, M. D., Hasselquist, N. J., Koba, K., Marin-Spiotta, E., and Wang, L.: Ecological interpretations of nitrogen isotope ratios of terrestrial plants and soils, Plant Soil, 396, 1–26, https://doi.org/10.1007/s11104-015-2542-1, 2015a.
Craine, J. M., Elmore, A. J., Wang, L., Augusto, L., Baisden, W. T., Brookshire, E. N. J., Cramer, M. D., Hasselquist, N. J., Hobbie, E. A., Kahmen, A., Koba, K., Kranabetter, J. M., Mack, M. C., Marin-Spiotta, E., Mayor, J. R., McLauchlan, K. K., Michelsen, A., Nardoto, G. B., Oliveira, R. S., Perakis, S. S., Peri, P. L., Quesada, C. A., Richter, A., Schipper, L. A., Stevenson, B. A., Turner, B. L., Viani, R. A. G., Wanek, W., and Zeller, B.: Convergence of soil nitrogen isotopes across global climate gradients, Sci. Rep.-UK, 5, 8280, https://doi.org/10.1038/srep08280, 2015b.
Dawson, T. E., Mambelli, S., Plamboeck, A. H., Templer, P. H., and Tu, K. P.: Stable Isotopes in Plant Ecology, Annu. Rev. Ecol. Syst., 33, 507–559, https://doi.org/10.1146/annurev.ecolsys.33.020602.095451, 2002.
de Freitas, A. D. S., de Sá Barretto Sampaio, E. V., de Souza Ramos, A. P., de Vasconcellos Barbosa, M. R., Lyra, R. P., and Araújo, E. L.: Nitrogen isotopic patterns in tropical forests along a rainfall gradient in Northeast Brazil, Plant Soil, 391, 109–122, https://doi.org/10.1007/s11104-015-2417-5, 2015.
Denk, T. R. A., Mohn, J., Decock, C., Lewicka-Szczebak, D., Harris, E., Butterbach-Bahl, K., Kiese, R., and Wolf, B.: The nitrogen cycle: A review of isotope effects and isotope modeling approaches, Soil Biol. Biochem., 105, 121–137, https://doi.org/10.1016/j.soilbio.2016.11.015, 2017.
Duane, W., Pepin, N., Losleben, M., and Hardy, D.: General Characteristics of Temperature and Humidity Variability on Kilimanjaro, Tanzania, Arct. Antarct. Alp. Res., 40, 323–334, 2008.
Ensslin, A., Rutten, G., Pommer, U., Zimmermann, R., Hemp, A., and Fischer, M.: Effects of elevation and land use on the biomass of trees, shrubs and herbs at Mount Kilimanjaro, Ecosphere, 6, 1–15, https://doi.org/10.1890/ES14-00492.1, 2015.
Eshetu, Z. and Högberg, P.: Effects of land use on 15N natural abundance of soils in Ethiopian highlands, Plant Soil, 222, 109–117, 2000.
FAO and JRC: Global forest land-use change 1990–2005, in: FAO Forestry Paper No. 16, edited by: Lindquist, E. J., D'Annunzio, R., Gerrand, A., MacDicken, K., Achard, F., Beuchle, R., Brink, A., Eva, H. D., Mayaux, P., San-Miguel-Ayanz, J., and Stibig, H.-J., Food and Agriculture Organization of the United Nations and European Comission Joint Research Centre, Rome, FAO, 2012.
Farquhar, G. D. and Sharkey, T. D.: Stomatal Conductance and Photosynthesis, Annu. Rev. Plant Phys., 33, 317–345, https://doi.org/10.1146/annurev.pp.33.060182.001533, 1982.
Farquhar, G. D., von Caemmerer, S., and Berry, J. A.: A biochemical model of photosynthetic CO2 assimilation in leaves of C3 species, Planta, 149, 78–90, https://doi.org/10.1007/BF00386231, 1980.
Garten, J. C., Hanson, P., Todd, J. D., Lu, B., and Brice, D.: Natural 15N and 13C abundance as indicators of forest N status and soil C dynamics, in: Stable Isotopes in Ecology and Environmental Science, second ed., edited by: Michener, R., Lajtha, K., Blackwell Science, Oxford, 61–82, 2008.
Garten, C. T., Classen, A. T., and Norby, R. J.: Soil moisture surpasses elevated CO2 and temperature as a control on soil carbon dynamics in a multi-factor climate change experiment, Plant Soil, 319, 85–94, https://doi.org/10.1007/s11104-008-9851-6, 2009.
Gerschlauer, F. and Kiese, R.: SP3_d15N/d13C natural abundance, TN, and SOC, https://www.kilimanjaro.biozentrum.uni-wuerzburg.de/Data/Data.aspx, last access: 31 August 2016.
Gerschlauer, F., Dannenmann, M., Kühnel, A., Meier, R., Kolar, A., Butterbach-Bahl, K., and Kiese, R.: Gross Nitrogen Turnover of Natural and Managed Tropical Ecosystems at Mt. Kilimanjaro, Tanzania, Ecosystems, 19, 1–18, https://doi.org/10.1007/s10021-016-0001-3, 2016.
Gruber, N. and Galloway, J. N.: An Earth-system perspective of the global nitrogen cycle, Nature, 451, 293–296, https://doi.org/10.1038/nature06592, 2008.
Gütlein, A., Zistl-Schlingmann, M., Becker, J. N., Cornejo, N. S., Detsch, F., Dannenmann, M., Appelhans, T., Hertel, D., Kuzyakov, Y., and Kiese, R.: Nitrogen turnover and greenhouse gas emissions in a tropical alpine ecosystem, Mt. Kilimanjaro, Tanzania, Plant Soil, 411, 243–259, https://doi.org/10.1007/s11104-016-3029-4, 2017.
Gütlein, A., Gerschlauer, F., Kikoti, I., and Kiese, R.: Impacts of climate and land use on N2O and CH4 fluxes from tropical ecosystems in the Mt. Kilimanjaro region, Tanzania, Glob. Change Biol., 24, 1239–1255, https://doi.org/10.1111/gcb.13944, 2018.
Hedin, L. O., Brookshire, E. N. J., Menge, D. N. L., and Barron, A. R.: The Nitrogen Paradox in Tropical Forest Ecosystems, Annu. Rev. Ecol. Evol. S., 40, 613–635, https://doi.org/10.1146/annurev.ecolsys.37.091305.110246, 2009.
Hemp, A.: Climate change-driven forest fires marginalize the impact of ice cap wasting on Kilimanjaro, Glob. Change Biol., 11, 1013–1023, https://doi.org/10.1111/j.1365-2486.2005.00968.x, 2005.
Hickman, J. E., Palm, C. A., Mutuo, P., Melillo, J. M., and Tang, J.: Nitrous oxide (N2O) emissions in response to increasing fertilizer addition in maize (Zea mays L.) agriculture in western Kenya, Nutr. Cycl. Agroecosys., 100, 177–187, https://doi.org/10.1007/s10705-014-9636-7, 2014.
Högberg, P.: 15N natural abundance in soil-plant systems, Tansley Review No. 95, New Phytol., 137, 179–203, https://doi.org/10.1046/j.1469-8137.1997.00808.x, 1997.
Houlton, B. Z. and Bai, E.: Imprint of denitrifying bacteria on the global terrestrial biosphere, P. Natl. Acad. Sci. USA, 106, 21713–21716, https://doi.org/10.1073/pnas.0912111106, 2009.
Kirschbaum, M. U. F.: The temperature dependence of soil organic matter decomposition, and the effect of global warming on soil organic C storage, Soil Biol. Biochem., 27, 753–760, https://doi.org/10.1016/0038-0717(94)00242-S, 1995.
Kohn, M. J.: Carbon isotope compositions of terrestrial C3 plants as indicators of (paleo)ecology and (paleo)climate, P. Natl. Acad. Sci. USA, 107, 19691–19695, https://doi.org/10.1073/pnas.1004933107, 2010.
Körner, C., Farquhar, G. D., and Wong, S. C.: Carbon Isotope Discrimination by Plants Follows Latitudinal and Altitudinal Trends, Oecologia, 88, 30–40, 1991.
Leirós, M. C., Trasar-Cepeda, C., Seoane, S., and Gil-Sotres, F.: Dependence of mineralization of soil organic matter on temperature and moisture, Soil Biol. Biochem., 31, 327–335, https://doi.org/10.1016/S0038-0717(98)00129-1, 1999.
Lewis, S. L., Lloyd, J., Sitch, S., Mitchard, E. T. A., and Laurance, W. F.: Changing Ecology of Tropical Forests: Evidence and Drivers, Annu. Rev. Ecol. Evol. S., 40, 529–549, https://doi.org/10.1146/annurev.ecolsys.39.110707.173345, 2009.
Ma, J.-Y., Sun, W., Liu, X.-N., and Chen, F.-H.: Variation in the Stable Carbon and Nitrogen Isotope Composition of Plants and Soil along a Precipitation Gradient in Northern China, PLOS ONE, 7, e51894, https://doi.org/10.1371/journal.pone.0051894, 2012.
Majule, A. E.: Impacts of Land Use/Land Cover Changes on Soil Degradation and Biodiversity on the Slopes of Mount Kilimanjaro, Tanzania, LUCID Project, International Livestock Research Institute, 2003.
Mariotti, A., Germon, J. C., Hubert, P., Kaiser, P., Letolle, R., Tardieux, A., and Tardieux, P.: Experimental determination of nitrogen kinetic isotope fractionation: some principles; illustration for the denitrification and nitrification processes, Plant Soil, 62, 413–430, 1981.
Martinelli, L. A., Piccolo, M. C., Townsend, A. R., Vitousek, P. M., Cuevas, E., McDowell, W., Robertson, G. P., Santos, O. C., and Treseder, K.: Nitrogen stable isotopic composition of leaves and soil: Tropical versus temperate forests, Biogeochemistry, 46, 45–65, https://doi.org/10.1007/BF01007573, 1999.
Mganga, K. Z. and Kuzyakov, Y.: Glucose decomposition and its incorporation into soil microbial biomass depending on land use in Mt. Kilimanjaro ecosystems, Eur. J. Soil Biol., 62, 74–82, 2014.
Michener, R. H. and Lajtha, K. (Eds.): Stable isotopes in ecology and environmental science, 2nd ed., Ecological methods and concepts series, Blackwell Pub, Malden, MA, 2007.
Nardoto, G. B., Quesada, C. A., Patiño, S., Saiz, G., Baker, T. R., Schwarz, M., Schrodt, F., Feldpausch, T. R., Domingues, T. F., Marimon, B. S., Junior, B.-H. M., Vieira, I. C. G., Silveira, M., Bird, M. I., Phillips, O. L., Lloyd, J., and Martinelli, L. A.: Basin-wide variations in Amazon forest nitrogen-cycling characteristics as inferred from plant and soil 15N :14N measurements, Plant Ecol. Divers., 7, 173–187, https://doi.org/10.1080/17550874.2013.807524, 2014.
Ometto, J. P. H. B., Ehleringer, J. R., Domingues, T. F., Berry, J. A., Ishida, F. Y., Mazzi, E., Higuchi, N., Flanagan, L. B., Nardoto, G. B., and Martinelli, L. A.: The stable carbon and nitrogen isotopic composition of vegetation in tropical forests of the Amazon Basin, Brazil, Biogeochemistry, 79, 251–274, https://doi.org/10.1007/s10533-006-9008-8, 2006.
Ortiz, C., Vázquez, E., Rubio, A., Benito, M., Schindlbacher, A., Jandl, R., Butterbach-Bahl, K., and Díaz-Pinés, E.: Soil organic matter dynamics after afforestation of mountain grasslands in both a Mediterranean and a temperate climate, Biogeochemistry, 131, 267–280, https://doi.org/10.1007/s10533-016-0278-5, 2016.
Pan, Y., Birdsey, R. A., Fang, J., Houghton, R., Kauppi, P. E., Kurz, W. A., Phillips, O. L., Shvidenko, A., Lewis, S. L., Canadell, J. G., Ciais, P., Jackson, R. B., Pacala, S. W., McGuire, A. D., Piao, S., Rautiainen, A., Sitch, S., and Hayes, D.: A Large and Persistent Carbon Sink in the World's Forests, Science, 333, 988–993, https://doi.org/10.1126/science.1201609, 2011.
Panettieri, M., Rumpel, C., Dignac, M. F., and Chabbi, A.: Does grassland introduction into cropping cycles affect carbon dynamics through changes of allocation of soil organic matter within aggregate fractions?, Sci. Total Environ., 576, 251–263, 2017.
Pardo, L. H. and Nadelhoffer, K. J.: Using Nitrogen Isotope Ratios to Assess Terrestrial Ecosystems at Regional and Global Scales, in: Isoscapes, edited by: West, J. B., Bowen, G. J., Dawson, T. E., and Tu, K. P., Springer, the Netherlands, Dordrecht, 221–249, 2010.
Peterson, B. J. and Fry, B.: Stable Isotopes in Ecosystem Studies, Annu. Rev. Ecol. Syst., 18, 293–320, https://doi.org/10.1146/annurev.es.18.110187.001453, 1987.
Piccolo, M. C., Neill, C., Melillo, J. M., Cerri, C. C., and Steudler, P. A.: 15N natural abundance in forest and pasture soils of the Brazilian Amazon Basin, Plant Soil, 182, 249–258, https://doi.org/10.1007/BF00029056, 1996.
R Core Team: R: A language and environment for statistical computing, R Foundation for Statistical Computing, Vienna, Austria, 2015.
Robinson, D.: δ15N as an integrator of the nitrogen cycle, Trends Ecol. Evol., 16, 153–162, https://doi.org/10.1016/S0169-5347(00)02098-X, 2001.
Saiz, G. and Albrecht, A.: Methods for smallholder quantification of soil carbon stocks and stock changes, in: Measurement methods Standard Assessment Of Agricultural Mitigation Potential And Livelihoods (SAMPLES), edited by: Rosenstock, T. S., Rufino, M. C., Butterbach-Bahl, K., Wollenberg, E., and Richards, M., ISBN 978-3-319-29792-7, CGIAR Research Program on Climate Change, Agriculture and Food Security, 135–162, 2016.
Saiz, G., Bird, M., Domingues, T., Schrodt, F., Schwarz, M., Feldpausch, T., Veenendaal, E., Djagbletey, G., Hien, F., Compaore, H., Diallo, A., and Lloyd, J.: Variation in soil carbon stocks and their determinants across a precipitation gradient in West Africa, Glob. Change Biol., 18, 1670–1683, https://doi.org/10.1111/j.1365-2486.2012.02657.x, 2012.
Saiz, G., Bird, M., Wurster, C., Quesada, C. A., Ascough, P., Domingues, T., Schrodt, F., Schwarz, M., Feldpausch, T. R., Veenendaal, E., Djagbletey, G., Jacobsen, G., Hien, F., Compaore, H., Diallo, A., and Lloyd, J.: The influence of C3 and C4 vegetation on soil organic matter dynamics in contrasting semi-natural tropical ecosystems, Biogeosciences, 12, 5041–5059, https://doi.org/10.5194/bg-12-5041-2015, 2015a.
Saiz, G., Wynn, J. G., Wurster, C. M., Goodrick, I., Nelson, P. N., and Bird, M. I.: Pyrogenic carbon from tropical savanna burning: production and stable isotope composition, Biogeosciences, 12, 1849–1863, https://doi.org/10.5194/bg-12-1849-2015, 2015b.
Saiz, G., Wandera, F. M., Pelster, D. E., Ngetich, W., Okalebo, J. R., Rufino, M. C., and Butterbach-Bahl, K.: Long-term assessment of soil and water conservation measures (Fanya-juu terraces) on soil organic matter in South Eastern Kenya, Geoderma, 274, 1–9, https://doi.org/10.1016/j.geoderma.2016.03.022, 2016.
Saiz, G., Goodrick, I., Wurster, C., Nelson, P. N., Wynn, J., and Bird, M.: Preferential Production and Transport of Grass-Derived Pyrogenic Carbon in NE-Australian Savanna Ecosystems, Front. Earth Sci., 5, 115, https://doi.org/10.3389/feart.2017.00115, 2018.
Schellenberger Costa, D., Gerschlauer, F., Pabst, H., Kühnel, A., Huwe, B., Kiese, R., Kuzyakov, Y., Kleyer, M., and Kühn, I.: Community-weighted means and functional dispersion of plant functional traits along environmental gradients on Mount Kilimanjaro, J. Veg. Sci., 28, 684–695, https://doi.org/10.1111/jvs.12542, 2017.
Smith, P., Clark, H., Dong, H., Elsiddig, E.A., Haberl, H., Harper, R., House, J., Jafari, M., Masera, O., Mbow, C., Ravindranath, N. H., Rice, C. W., Roble do Abad, C., Romanovskaya, A., Sperling, F., and Tubiello, F.: Chapter 11 – Agriculture, forestry and other land use (AFOLU), in: Climate Change 2014: Mitigation of Climate Change, IPCC Working Group III Contribution to AR5, Cambridge University Press, 2014.
Soini, E.: Land use change patterns and livelihood dynamics on the slopes of Mt. Kilimanjaro, Tanzania, Agric. Syst., 85, 306–323, https://doi.org/10.1016/j.agsy.2005.06.013, 2005.
Sotta, E. D., Corre, M. D., and Veldkamp, E.: Differing N status and N retention processes of soils under old-growth lowland forest in Eastern Amazonia, Caxiuanã, Brazil, Soil Biol. Biochem., 40, 740–750, https://doi.org/10.1016/j.soilbio.2007.10.009, 2008.
Stevenson, B. A., Parfitt, R. L., Schipper, L. A., Baisden, W. T., and Mudge, P.: Relationship between soil δ15N, C∕N and N losses across land uses in New Zealand, Agr. Ecosyst. Environ., 139, 736–741, https://doi.org/10.1016/j.agee.2010.10.020, 2010.
Swap, R. J., Aranibar, J. N., Dowty, P. R., Gilhooly, W. P., and Macko, S. A.: Natural abundance of 13C and 15N in C3 and C4 vegetation of southern Africa: patterns and implications, Glob. Change Biol., 10, 350–358, https://doi.org/10.1111/j.1365-2486.2003.00702.x, 2004.
Tieszen, L. L., Senyimba, M. M., Imbamba, S. K., and Troughton, J. H.: The distribution of C3 and C4 grasses and carbon isotope discrimination along an altitudinal and moisture gradient in Kenya, Oecologia, 37, 337–350, https://doi.org/10.1007/BF00347910, 1979.
Townsend, A. R., Cleveland, C. C., Houlton, B. Z., Alden, C. B., and White, J. W.: Multi-element regulation of the tropical forest carbon cycle, Front. Ecol. Environ., 9, 9–17, https://doi.org/10.1890/100047, 2011.
Traoré, S., Ouattara, K., Ilstedt, U., Schmidt, M., Thiombiano, A., Malmer, A., and Nyberg, G.: Effect of land degradation on carbon and nitrogen pools in two soil types of a semi-arid landscape in West Africa, Geoderma, 241–242, 330–338, https://doi.org/10.1016/j.geoderma.2014.11.027, 2015.
van der Merwe, N. J. and Medina, E.: Photosynthesis and 13C12C ratios in Amazonian rain forests, Geochim. Cosmochim. Ac., 53, 1091–1094, https://doi.org/10.1016/0016-7037(89)90213-5, 1989.
van Reeuwijk, L. (Ed.): Procedures for Soil Analysis 9, Technical Paper, International Soil Reference and Information Centre, Wageningen, 2002.
Vitousek, P. M.: Litterfall, Nutrient Cycling, and Nutrient Limitation in Tropical Forests, Ecology, 65, 285–298, https://doi.org/10.2307/1939481, 1984.
Wang, C., Houlton, B. Z., Liu, D., Hou, J., Cheng, W., and Bai, E.: Stable isotopic constraints on global soil organic carbon turnover, Biogeosciences, 15, 987–995, https://doi.org/10.5194/bg-15-987-2018, 2018.
Wang, L., D'Odorico, P., Ries, L., and Macko, S. A.: Patterns and implications of plant-soil δ13C and δ15N values in African savanna ecosystems, Quaternary Res., 73, 77–83, https://doi.org/10.1016/j.yqres.2008.11.004, 2010.
Wynn, J. G. and Bird, M. I.: C4-derived soil organic carbon decomposes faster than its C3 counterpart in mixed C3∕C4 soils, Glob. Change Biol., 13, 2206–2217, https://doi.org/10.1111/j.1365-2486.2007.01435.x, 2007.
Zaehle, S.: Terrestrial nitrogen–carbon cycle interactions at the global scale, Philos. T. R. Soc. B, 368, 20130125, https://doi.org/10.1098/rstb.2013.0125, 2013.
Zech, M., Bimüller, C., Hemp, A., Samimi, C., Broesike, C., Hörold, C., and Zech, W.: Human and climate impact on 15N natural abundance of plants and soils in high-mountain ecosystems: a short review and two examples from the Eastern Pamirs and Mt. Kilimanjaro, Isotopes Environ. Health Stud., 47, 286–296, https://doi.org/10.1080/10256016.2011.596277, 2011.
Zhou, Y., Fan, J., Zhang, W., Harris, W., Zhong, H., Hu, Z., and Song, L.: Factors influencing altitudinal patterns of C3 plant foliar carbon isotope composition of grasslands on the Qinghai-Tibet Plateau, China, Alpine Bot., 121, 79, https://doi.org/10.1007/s00035-011-0093-5, 2011.
Zhu, Y., Jiang, Y., Liu, Q., Kang, M., Spehn, E. M., and Körner, C.: Elevational Trends of Biodiversity and Plant Traits Do Not Converge – A Test in the Helan Range, NW China, Plant Ecol., 205, 273–283, 2009.