the Creative Commons Attribution 4.0 License.
the Creative Commons Attribution 4.0 License.
 | 05 Nov 2019
Controls on redox-sensitive trace metals in the Mauritanian oxygen minimum zone
Insa Rapp
Christian Schlosser
Jan-Lukas Menzel Barraqueta
Bernhard Wenzel
Jan Lüdke
Jan Scholten
Beat Gasser
Patrick Reichert
Martha Gledhill
Marcus Dengler
Eric P. Achterberg
The availability of the micronutrient iron (Fe) in surface waters determines primary production, N2 fixation, and microbial community structure in large parts of the world's ocean, and thus it plays an important role in ocean carbon and nitrogen cycles. Eastern boundary upwelling systems and the connected oxygen minimum zones (OMZs) are typically associated with elevated concentrations of redox-sensitive trace metals (e.g., Fe, manganese (Mn), and cobalt (Co)), with shelf sediments typically forming a key source. Over the last 5 decades, an expansion and intensification of OMZs has been observed and this trend is likely to proceed. However, it is unclear how trace-metal (TM) distributions and transport are influenced by decreasing oxygen (O2) concentrations. Here we present dissolved (d; <0.2 µm) and leachable particulate (Lp; >0.2 µm) TM data collected at seven stations along a 50 km transect in the Mauritanian shelf region. We observed enhanced concentrations of Fe, Co, and Mn corresponding with low O2 concentrations (<50 µmol kg−1), which were decoupled from major nutrients and nutrient-like and scavenged TMs (cadmium (Cd), lead (Pb), nickel (Ni), and copper (Cu)). Additionally, data from repeated station occupations indicated a direct link between dissolved and leachable particulate Fe, Co, Mn, and O2. An observed dFe (dissolved iron) decrease from 10 to 5 nmol L−1 coincided with an O2 increase from 30 to 50 µmol kg−1 and with a concomitant decrease in turbidity. The changes in Fe (Co and Mn) were likely driven by variations in their release from sediment pore water, facilitated by lower O2 concentrations and longer residence time of the water mass on the shelf. Variations in organic matter remineralization and lithogenic inputs (atmospheric deposition or sediment resuspension; assessed using Al as indicator for lithogenic inputs) only played a minor role in redox-sensitive TM variability. Vertical dFe fluxes from O2-depleted subsurface-to-surface waters (0.08–13.5 µmol m−2 d−1) driven by turbulent mixing and vertical advection were an order of magnitude larger than atmospheric deposition fluxes (0.63–1.43 µmol m−2 d−1; estimated using dAl inventories in the surface mixed layer) in the continental slope and shelf region. Benthic fluxes are therefore the dominant dFe supply to surface waters on the continental margins of the Mauritanian upwelling region. Overall, our results indicated that the projected future decrease in O2 concentrations in OMZs may result in increases in Fe, Mn, and Co concentrations.
- Article
(4685 KB) - Full-text XML
-
Supplement
(663 KB) - BibTeX
- EndNote


The micronutrient iron (Fe) is essential for phytoplankton growth, but due to biological uptake coupled with a low solubility and low supply rates the availability of Fe is typically low in open ocean surface waters (Bruland and Lohan, 2006). As a result, Fe limits primary production in high-nitrate low-chlorophyll regions (Boyd, 2007) and regulates dinitrogen (N2) fixation in (sub)tropical waters (Moore et al., 2009). Alongside Fe, other trace metals (TMs) such as cobalt (Co), manganese (Mn), zinc (Zn), and copper (Cu) may (co-)limit phytoplankton growth and influence community composition (Browning et al., 2017; Moore et al., 2013; Morel and Price, 2003; Saito et al., 2008).
Oxygen minimum zones (OMZs) are characterized by stable subsurface oxygen (O2) minima, which are maintained by a combination of enhanced O2 consumption in the thermocline and a limited supply of O2-rich water masses (e.g., Brandt et al., 2015; Karstensen et al., 2008; Wyrtki, 1962). Enhanced O2 consumption is a result of elevated surface productivity caused by upwelling of nutrient-rich subsurface waters in eastern boundary regions of the oceans through Ekman divergence and intense remineralization of sinking particles (e.g., Helly and Levin, 2004). Elevated organic matter supply and water column O2 depletion lead to enhanced benthic release of redox-sensitive elements by influencing sediment diagenetic processes (Noffke et al., 2012; Severmann et al., 2010). Elevated concentrations of sediment-derived dissolved Fe, Co, and Mn have been associated with lateral offshore advection in O2-depleted waters in the Arabian Sea and Pacific and Atlantic oceans (Biller and Bruland, 2013; Hatta et al., 2015; Hawco et al., 2016; Milne et al., 2017; Moffett et al., 2015; Noble et al., 2012).
Oxygen concentrations affect the distribution of redox-sensitive TMs by controlling oxidation rates and influencing microbially mediated redox transformations. The reduced forms of redox-sensitive TMs, such as iron (Fe(II)), cobalt (Co(II)), and manganese (Mn(II)), have a higher solubility in aqueous solutions than their oxidized forms (Fe(III), Co(III), Mn(III/IV)) (Liu and Millero, 2002; Stumm and Morgan, 1995). Reduction of these metals occurs to a large extent in anoxic sediment pore waters by microbial-induced dissolution of particulate Fe(III) and Mn(III/IV) oxyhydroxides (Burdige, 1993; Chaillou et al., 2002; Froelich et al., 1979). Sediment pore waters are released to overlying bottom waters by diffusion and bio-irrigation and during submarine groundwater discharge (Beck et al., 2007; Elrod et al., 2004; Green et al., 2002). In contact with O2 and other oxidants (e.g., nitrate; Schlosser et al., 2018; and hydrogen peroxide; Moffett and Zika, 1987), Fe(II) oxidizes to the poorly soluble Fe(III) species, which are rapidly transformed into amorphous Fe oxyhydroxides or scavenged onto particle surfaces (Moffett and Zika, 1987; Scholz et al., 2016; Wu and Luther, 1994). Mn(II) also oxidizes to insoluble Mn(III/IV) oxides, but due to the slow abiotic oxidation kinetics, especially under low-O2 conditions (e.g., von Langen et al., 1997), biotic oxidation by manganese-oxidizing bacteria is the main oxidation mechanism for Mn (Moffett, 1994; Sunda and Huntsman, 1988; Tebo and Emerson, 1986). Co(II) removal is mainly associated with incorporation of Co into Mn oxides by Co co-oxidation (Moffett and Ho, 1996).
Stabilizing mechanisms that prevent removal by scavenging and precipitation of Fe, Co, and Mn are organic ligand complexation (Elrod et al., 2004; Liu and Millero, 2002; Oldham et al., 2017; Parker et al., 2007) and adsorption onto small, slowly sinking or neutrally buoyant particles (Lam et al., 2012). Recent studies suggest a potentially important role for dynamic exchange processes between dissolved and particulate phases of Fe, thereby influencing cycling and transport (Achterberg et al., 2018; Fitzsimmons et al., 2017; Labatut et al., 2014; Milne et al., 2017). This was further indicated by Fe isotope studies suggesting an equilibrium isotopic fractionation between the dissolved and particulate phases in deep waters (Labatut et al., 2014) and the concomitant deepening of the dissolved and particulate Fe plume that originated from a hydrothermal vent (Fitzsimmons et al., 2017).
Spatial and seasonal variations in TMs that are released from sediments, as well as ex situ sediment incubation experiments, suggest a direct influence of bottom water and water column O2 concentrations on the distribution of Fe, Co, and Mn (e.g., Biller and Bruland, 2013; Homoky et al., 2012). Differences in benthic TM supply in field studies, however, suggest other factors such as sediment type, shelf topography, and organic matter supply also influence the benthic release of TMs (Homoky et al., 2016). Ex situ sediment incubation experiments offer a potential means to disentangle the influence of O2 concentrations relative to these controls (Homoky et al., 2012). These experiments, however, need to be interpreted within the context of the confined conditions that eliminate potentially important interactions in open systems, such as seawater exchange and mixing. Furthermore, they offer no means to confidently evaluate controls on TM distributions in the pelagic water column.
In an attempt to resolve the controls on TM release and stabilization in OMZs we measured the concentration of a suite of TMs along a 50 km long transect on the Mauritanian shelf in the Eastern Tropical North Atlantic (ETNA). The Mauritanian shelf is associated with a major OMZ (minimum O2 concentrations below 40 µmol kg−1; Brandt et al., 2015) and is an important Fe source to the North Atlantic Ocean (Milne et al., 2017). Furthermore, atmospheric dust deposition from the Saharan desert can markedly elevate surface water Fe concentrations in the ETNA (Conway and John, 2014; Rijkenberg et al., 2012). Recent observations suggest a decline in O2 content of the oceans, particularly in the northern and southeastern Atlantic, and an expansion of OMZs, modulated by the variability in our climate system (Hahn et al., 2017; Schmidtko et al., 2017; Stramma et al., 2008b). These changes may result in changes in TM supply, and a mechanistic understanding of the factors regulating TM release and stabilization in OMZs is therefore urgently needed. The aim of this study was to evaluate the direct influence of variability in water column O2 concentrations on the distribution of redox-sensitive TMs and to identify responsible control mechanisms. Firstly, we assess the fluxes of dFe in the OMZ to surface waters by vertical advection and diffusive mixing and compared those to the atmospheric deposition flux of dFe. Secondly, we evaluate the importance of redox and non-redox controls on Fe, Co, and Mn by focusing on the influence of O2 and particles on the distribution of dissolved (d) and leachable particulate (Lp) TMs, including redox-sensitive (Fe, Co, and Mn) and nutrient type and scavenged trace metals (aluminum (Al), lead (Pb), nickel (Ni), Cd, and Cu). Thirdly, we determine the influence of variability in the eastern boundary circulation and O2 concentrations in regulating TM concentrations.
2.1 Sampling
Samples were collected on RV Meteor cruise M107 in June 2014 during nine deployments at seven locations (two stations were occupied twice) along a cross-shelf transect at 18∘20′ N on the Mauritanian shelf in the ETNA (Fig. 1). The bottom depths of stations varied between 50 m on the shelf to 1136 m furthest offshore. Seawater sampling was carried out using a trace-metal-clean CTD (TM-CTD, Sea-Bird SBE25) rosette frame equipped with 24 trace-metal-clean samplers (12 L, Ocean Test Equipment (OTE)). The CTD frame was attached to plastic-coated nonconductive steel cable and deployed using a carousel auto-fire module (AFM, Sea-Bird) that closed the bottles at predefined depths. After recovery, the bottles were transferred to a clean-laboratory container and pressurized to 0.2 bar overpressure using filtered N2 gas. Samples were collected unfiltered for total dissolvable (TD) TM measurements and filtered using a 0.2 µm cartridge filter (Acropack 500, Pall) for dissolved (d) TMs and iodide. Trace-metal samples were collected in acid-clean 125 mL low-density polyethylene (LDPE) bottles (Nalgene), and iodide samples in opaque 60 mL high-density polyethylene (HDPE) bottles (Nalgene). Trace-metal samples were acidified to pH 1.9 using ultra-clean HCl (UpA, Romil) and stored (double bagged) for >6 months before preconcentration and analysis. Samples for iodide measurements were stored frozen at −20 ∘C until analysis.
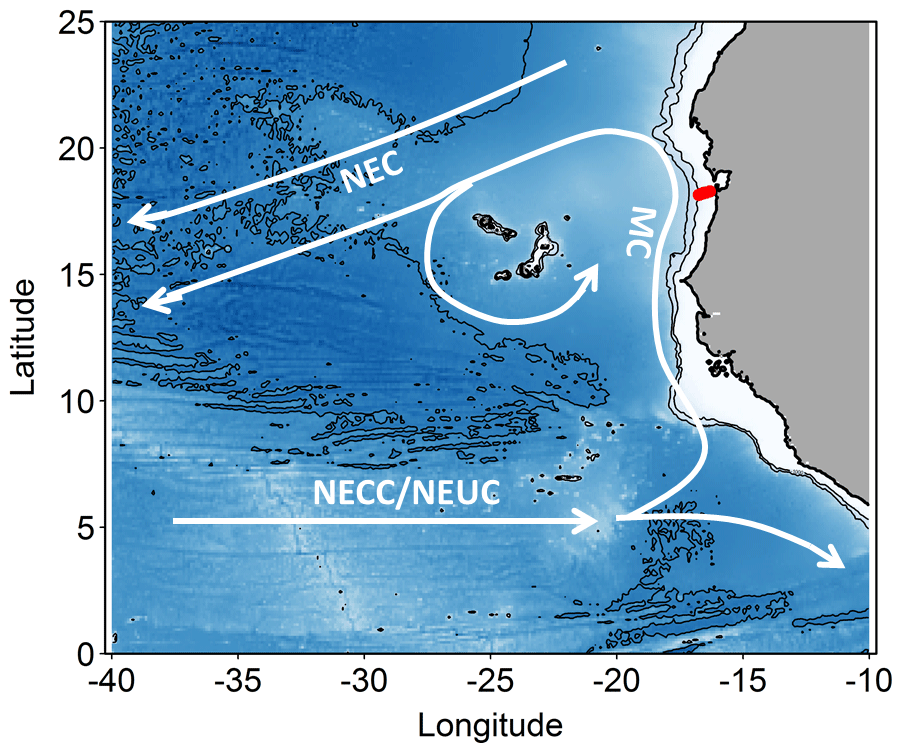
Figure 1Map of the study area. Stations along the transect during cruise M107 (June 2014) are displayed in red and major currents with white lines (adapted from Brandt et al., 2015). MC represents Mauritania Current; NEC represents North Equatorial Current; NECC represents North Equatorial Countercurrent; NEUC represents North Equatorial Undercurrent.
Samples for the determination of radium isotopes (223Ra; d; 224Ra; d) were obtained using in situ filtration pumps (Challenger Oceanic) following the procedures described in Charette et al. (2015) and Henderson et al. (2013). Briefly, each in situ filtration pump was equipped with two particle filters (70 and 1 µm) and two Mn dioxide (MnO2)-impregnated cartridges (CUNO Micro Klean III acrylic) on which dissolved Ra adsorbs. In this work, 224Ra∕223Ra ratios are shown, which were analyzed from the first cartridge. The pumped water volumes varied between 1000 and 1700 L and flow rates were 10–15 L min−1. For the determination of Ra in surface waters (∼5 m water depth), about 200–300 L of seawater was pumped into several 120 L plastic barrels followed by filtration over MnO2-coated acrylic fibers (Mn fibers).
2.2 Trace-metal analysis
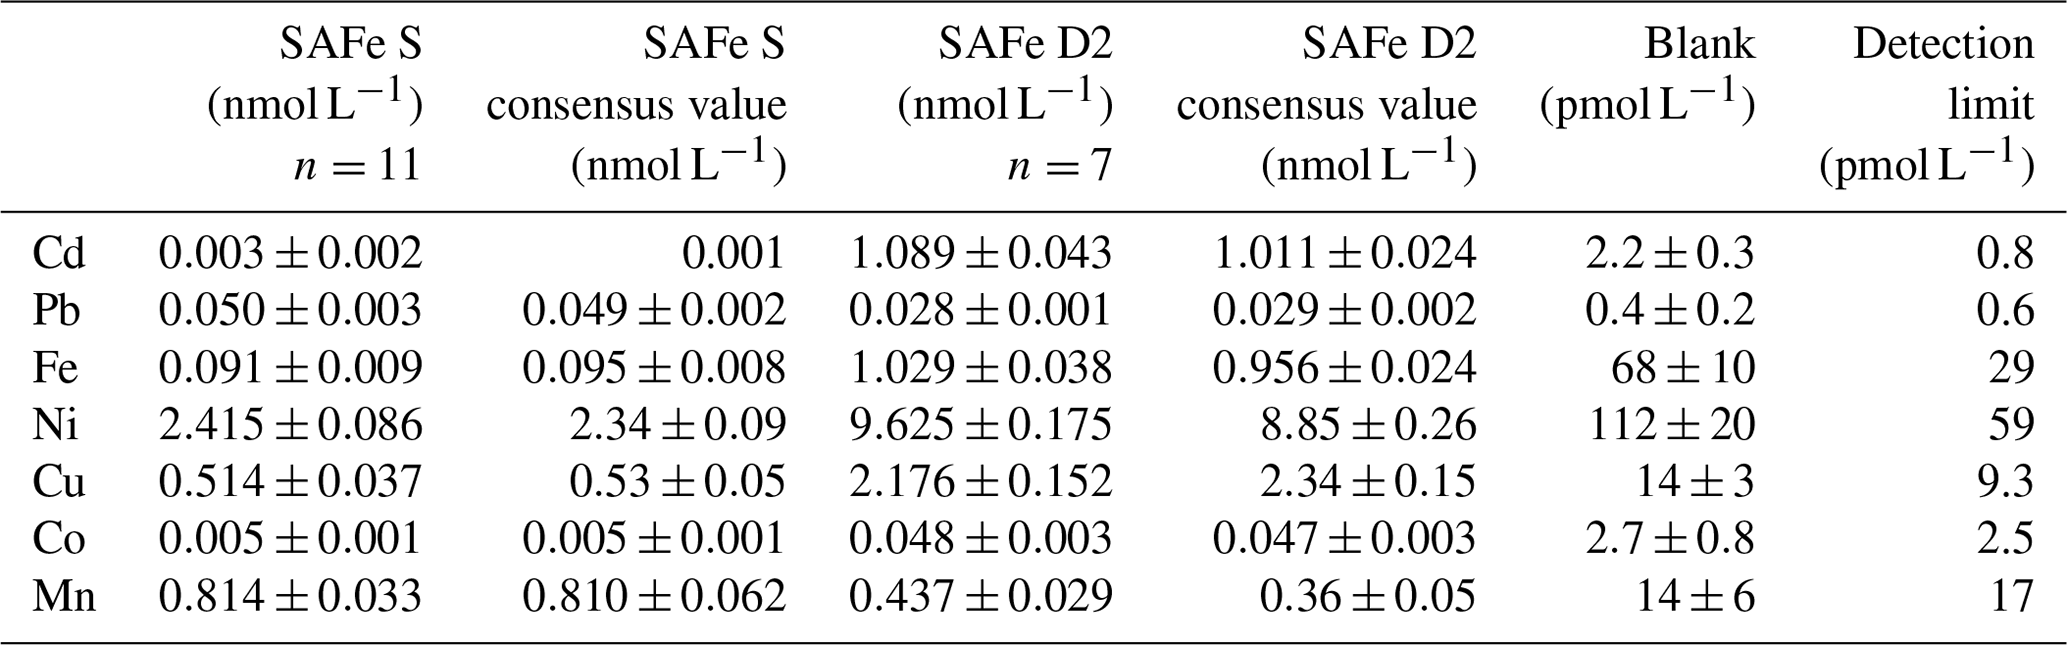
Determination of Co, Mn, Fe, Cd, Pb, Ni, and Cu was carried out as described in Rapp et al. (2017). Briefly, samples were preconcentrated using an automated preconcentration device (SeaFAST, Elemental Scientific Inc.) equipped with a cation chelating resin (WAKO; Kagaya et al., 2009). Samples were UV digested prior to preconcentration to breakdown metal–organic complexes, which would cause an underestimation of the determined TM concentrations. Samples were in-line buffered to pH 6.4±0.2 using 1.5 M ammonium acetate buffer before loading onto the resin. The pH buffer was prepared using an ammonium hydroxide solution (22 %, OPTIMA grade, Fisher) and acetic acid (glacial, OPTIMA grade, Fisher) in deionized water (Milli-Q, Millipore), adjusted to pH 8.5. Retained TMs were eluted from the resin using 1 M distilled HNO3 and collected in 4 mL polypropylene scintillation vials (Wheaton). The acid was distilled from supra-pure HNO3 (SpA grade, Romil) using a sub-boiling perfluoroalkoxy polymer (PFA) distillation system (DST-1000, Savillex). Preconcentration was performed within a clean laboratory (ISO 5) and all sample and reagent handling was performed within the same laboratory in an ISO 3 laminar flow bench with a HEPA (high-efficiency particulate air) filter unit. Preconcentrated samples were analyzed by high-resolution inductively coupled plasma mass spectrometry (HR-ICP-MS, ELEMENT XR, Thermo Fisher Scientific) using isotope dilution for Fe, Cd, Pb, Cu, and Ni and standard additions for Co and Mn. SAFe (sampling and analysis of iron) reference seawaters S and D2 were analyzed with each analytical run and concentrations produced were in good agreement with consensus values (Table 1).
Table 1Analyzed reference seawater, procedural blanks, and detection limits (3 times the standard deviation of the blank). Mean values and standard deviations for Cd, Pb, Fe, Ni, Cu, Mn, and Co as well as available consensus values (±1 standard deviation); n represents number of measurements.
Leachable particulate (Lp) concentrations were calculated as the difference between total dissolvable and dissolved concentrations. The limit of quantification (LOQ) for the Lp concentrations was determined as the sum of the analytical standard deviations of TD and dissolved concentrations. Extended uncertainty calculations were performed using the Nordtest approach (Naykki et al., 2015) accounting for random as well as systematic errors (Rapp et al., 2017). The Lp fraction represents the particulate fraction which is readily dissolvable in the acidified samples during storage at pH 1.9 for 6 months and therefore does not contain any refractory particle components. This more labile fraction of particulate TMs mainly includes TMs in organic and/or biogenic particles, adsorbed to particle surfaces, and TM oxides and/or oxyhydroxides (Hurst et al., 2010).
2.3 Aluminum measurements
Aluminum concentrations were determined in surface water samples for all stations along the transect and at two stations (stations 3 and 8) for the entire water column. Samples were analyzed for Al using the batch lumogallion method (Hydes and Liss, 1976). Acidified samples were buffered manually with a 2 M ammonium acetate buffer (Romil, UpA) to a pH between 5.1 and 5.2. The buffer was prepared using ammonium hydroxide (Romil, UpA) and acetic acid (Romil, UpA) in deionized water (Milli-Q, Millipore). Buffered samples were spiked with a 2 mg L−1 lumogallion (TCI) solution allowing the complexing agent to be in excess. The lumogallion solution was prepared in 2 M ammonium acetate buffer (Romil, UpA). After spiking, samples were heated up for 1.5 h at 80 ∘C in an oven (Heratherm, Thermo Scientific) and left to cool down overnight at room temperature to allow the formation of a fluorescent Al complex. Samples were measured using a fluorescence spectrophotometer (Cary Eclipse, Agilent). The samples were measured with excitation and emission wavelengths of 465 and 555 nm, respectively. The excitation and emission slits were set to 10 nm. The plastic cuvettes used for the measurements were precleaned in a 2 M HCl (trace-metal grade, Fisher) for at least 24 h. In between samples, the cuvette was thoroughly rinsed with deionized water followed by actual sample. The same cuvette was used during an analytical session. All samples were analyzed in duplicate and the concentrations calculated from the peak heights via standard addition. Samples and reagent natural fluorescence was monitored by analyzing their content in the absence of the complexing agent. The standards were prepared in low-trace-metal seawater from a 500 nmol L−1 stock standard solution prepared from a 1000 ppm Al standard solution (Merck Millipore). A typical calibration had the following standard concentrations: 0, 10, 20, 40, and 60 nmol L−1. GEOTRACES reference seawater (GS) was run with a mean average Al value of 27.76±0.17 nmol L−1 (n=4; consensus value 28.2±0.2 nmol L−1).
2.4 Iodide measurements
Frozen samples were defrosted overnight at room temperature prior to analysis for iodide by cathodic stripping square-wave voltammetry after Luther et al. (1988). The voltammetry unit consisted of a voltammeter stand (663 VA, Metrohm), an autosampler (863 Compact Autosampler, Metrohm), and an automatic burette (843 Pump Station, Metrohm) for automated spike addition. The system was controlled by Computrace software (797 VA; Metrohm).
2.5 Oxygen, salinity, nutrient, turbidity, and chlorophyll fluorescence analyses
Oxygen, salinity, nutrients, turbidity, and chlorophyll fluorescence were measured during 62 CTD deployments (including some repeated deployments at the same location) along the 18∘20′ N transect using a Sea-Bird SBE 9 CTD rosette system equipped with double sensor packages for O2, salinity, and temperature and 24 Niskin samplers (10 L; OTE). Turbidity and chlorophyll a were measured with a combined WETlabs turbidity and fluorescence sensor that was attached to the CTD. The output of both sensors was corrected using the calibration provided by the manufacturer. Throughout this article, turbidity data are presented in nephelometric turbidity units (NTU). The noise level of the sensor in our data set was found to be lower than 0.14 NTU. Oxygen sensor data were calibrated by Winkler titration (Hansen, 2007; Winkler, 1888; Sommer et al., 2015) on 348 discrete water samples that were collected from the OTE samplers. Oxygen sensor data were initially processed using calibration coefficients provided by the manufacturer. Subsequently, O2 sensor data were fitted to the O2 concentrations determined by the Winkler titration method using linear functions for temperature, O2, and pressure (i.e., depth). An uncertainty of 1.5 µmol kg−1 was determined for O2 concentrations. Onboard nutrient measurements of nitrite (), nitrate (), phosphate (), and silicic acid (Si(OH)4) of the discrete water samples were conducted using a QuAAtro autoanalyzer (Seal Analytical) according to the study by Grasshoff et al. (1983).
Apparent oxygen utilization (AOU) was calculated as the difference between saturation concentrations of O2 and measured O2 concentrations. The saturation concentration of O2 was calculated after the Weiss methods (Weiss, 1970) using the R package marelac (Soataert et al., 2016), taking into account salinity and temperature.
2.6 Radium analysis
Aboard the ship, the Mn cartridges and Mn fibers were washed with Ra-free tap water to remove any residual sea salt and particles. Ra was removed from the tap water by slowly (<1 L min−1) passing it through a Mn-fiber-filled cartridge. Afterwards, both cartridges and fibers were partially dried with filtered compressed air to remove excess water. The samples were analyzed for 223Ra, 224Ra, and 228Th using a radium delayed coincidence counting (RaDeCC) system (Moore and Arnold, 1996). For the efficiency calibration of the RaDeCC, 227Ac and 232Th standard solutions were used, and the calibration followed the procedure described in Scholten et al. (2010) and Moore and Cai (2013). Counting errors were propagated following Garcia-Solsona et al. (2008). Excess 224Ra (224Raex), i.e., the 224Ra activity corrected for 228Th-supported 224Ra, was calculated by subtracting the 228Th activity from the 224Ra activity. The 228Th activity was measured 3 weeks after the first measurement of 224Ra, when the initial 224Ra had decayed. As we measured only the first Mn cartridge and the Mn cartridges do not adsorb radium quantitatively, we report here only 224Raex∕223Ra ratios.
2.7 Turbulence measurements and vertical flux calculations
In order to advance understanding of the role of benthic Fe supply to the productive surface waters of the upwelling region, vertical diffusive fluxes (Eq. 1: left term, right-hand side) and wind-induced vertical advective fluxes (Eq. 1: right term, right-hand side) were estimated. On the continental margin below the surface mixed layer, solutes are transferred vertically toward the near-surface layers by turbulent mixing processes and by vertical advection forced by Ekman divergence (e.g., Kock et al., 2012; Milne et al., 2017; Rhein et al., 2010; Steinfeldt et al., 2015; Tanhua and Liu, 2015):
Here, Kz is the turbulent eddy diffusivity (m2 s−1), the vertical gradient with depth (z) of the TM concentration [TM] (µmol m−4), Δ[TM] is a TM concentration difference (µmol m−3), and w represents vertical velocity (m s−1). Average advective and diffusive TM fluxes were calculated for a depth interval from the shallow O2-depleted waters to surface waters. The exact depth interval varied for each station (see Table S2) due to differences in the depths where TM samples were collected. The upper depth (8–29 m) was always in layers with enhanced chlorophyll a fluorescence, although for some stations the upper depth was below the surface mixed layer.
Diffusive Fe fluxes were determined by combining TM concentration measurements from the TM-CTD stations with nearby measured microstructure profiles. The microstructure measurements were performed with an MSS90-D profiler (S/N 32, Sea & Sun Technology). The loosely tethered profiler was optimized to sink at a rate of 0.55 m s−1 and equipped with three shear sensors, a fast-response temperature sensor, an acceleration sensor, two tilt sensors, and conductivity, temperature, depth sensors sampling with a lower response time. At TM-CTD stations with bottom depths less than 400 m, 18 to 65 microstructure profiles were available at each station. At deeper stations, 5 to 12 profiles were used. Standard processing procedures were used to determine the rate of kinetic energy dissipation (ε) of turbulence in the water column (see Schafstall et al., 2010, for detailed description). Subsequently, Kz values were determined from (Osborn, 1980), where N is stratification and Γ is the mixing efficiency for which a value of 0.2 was used. The use of this value has recently been shown to yield good agreement between turbulent eddy diffusivities determined from microstructure measurements and from tracer release experiments performed in our study region (Köllner et al., 2016). The 95 % confidence intervals for station-averaged Kρ values were determined from Gaussian error propagation following Schafstall et al. (2010). Finally, diffusive fluxes were estimated by multiplying station-averaged Kρ with the vertical gradient of the respective TM solute, implicitly assuming Kz=Kρ.
The vertical advective flux by Ekman divergence requires determination of vertical velocity in the water column that varies with depth and distance from the coastline. Convincing agreement between vertical velocities derived from Ekman divergence following Gill (1982) determined from scatterometer winds and from helium isotope disequilibrium within the Mauritanian and Peruvian coastal upwelling regions was found by Steinfeldt et al. (2015) (see their Fig. 4). In their study, vertical velocities were parameterized as (Gill, 1982)
where τy represents the alongshore wind stress, ρ the density of sea water, x the distance from maximum Ekman divergence taken here as the position at 50 m bottom depth on the shelf, and Lr the first baroclinic Rossby radius. The parameterization results from considering the baroclinic response of winds parallel to a coastline in a two-layer ocean (Gill, 1982). The baroclinic Rossby radius (ρ1∕2 and H1∕2 are density and thickness of the surface and lower layer, respectively) was found to be 15 km from hydrographical data collected during the cruise. Similar values were determined by Steinfeld et al. (2015) in the same region. Using average alongshore wind stress from satellite data (0.057 Nm−2, determined from daily winds from Remote Sensing Systems ASCAT C-2015, version v02.1 (Ricciardulli and Wentz, 2016) at 18∘22.5′ N, 016∘7.5′ W using τy=ρairCdv2, where v represents alongshore wind, Cd is drag coefficient for which was used (e.g., Fairall et al., 2003), and ρair is density of air) for June 2014, maximum vertical velocities of m s−1 were determined for the shelf region (50 m water depth), which decayed offshore to m s−1 at the position of the 1000 m isobath at 18∘ N. As these vertical velocities describe the magnitude of upwelling at the base of the mixed layer, additional corrections need to be considered for deeper depths. Here, we approximated the vertical decay of w as a linear function which diminishes at the ocean floor.
The calculation of the vertical advective flux supplying solutes from the shallow O2-depleted waters to surface waters requires knowledge of a concentration difference Δ[TM] associated with the upwelling flux. Ideally, the vertical length scale over which the concentration difference is determined can be diagnosed as the TM concentration variance divided by its mean vertical gradient (e.g., Hayes et al., 1991). However, in our study TM concentration time series data are not available. Previous studies have used a vertical length scale of 20 m to calculate the concentration differences between the target depth and the water below (e.g., Hayes et al., 1991; Steinfeldt et al., 2015; Tanhua and Liu, 2015). For our calculations, we chose to use a smaller length scale of 10 m following Hayes et al. (1991), which results in vertical advective TM flux presumably on the lower side of possible values.
2.8 Figures
All figures were produced in R (version 3.4.3). Data gridding in Figs. 2 and 3 was performed using the Tps function within the fields package in R (Nychka et al., 2016).

Figure 2Section plots of oxygen (µmol kg−1), salinity (PSU), NO3 (µmol L−1), and PO4 (µmol L−1) along the transect off the Mauritanian coast in June 2014.
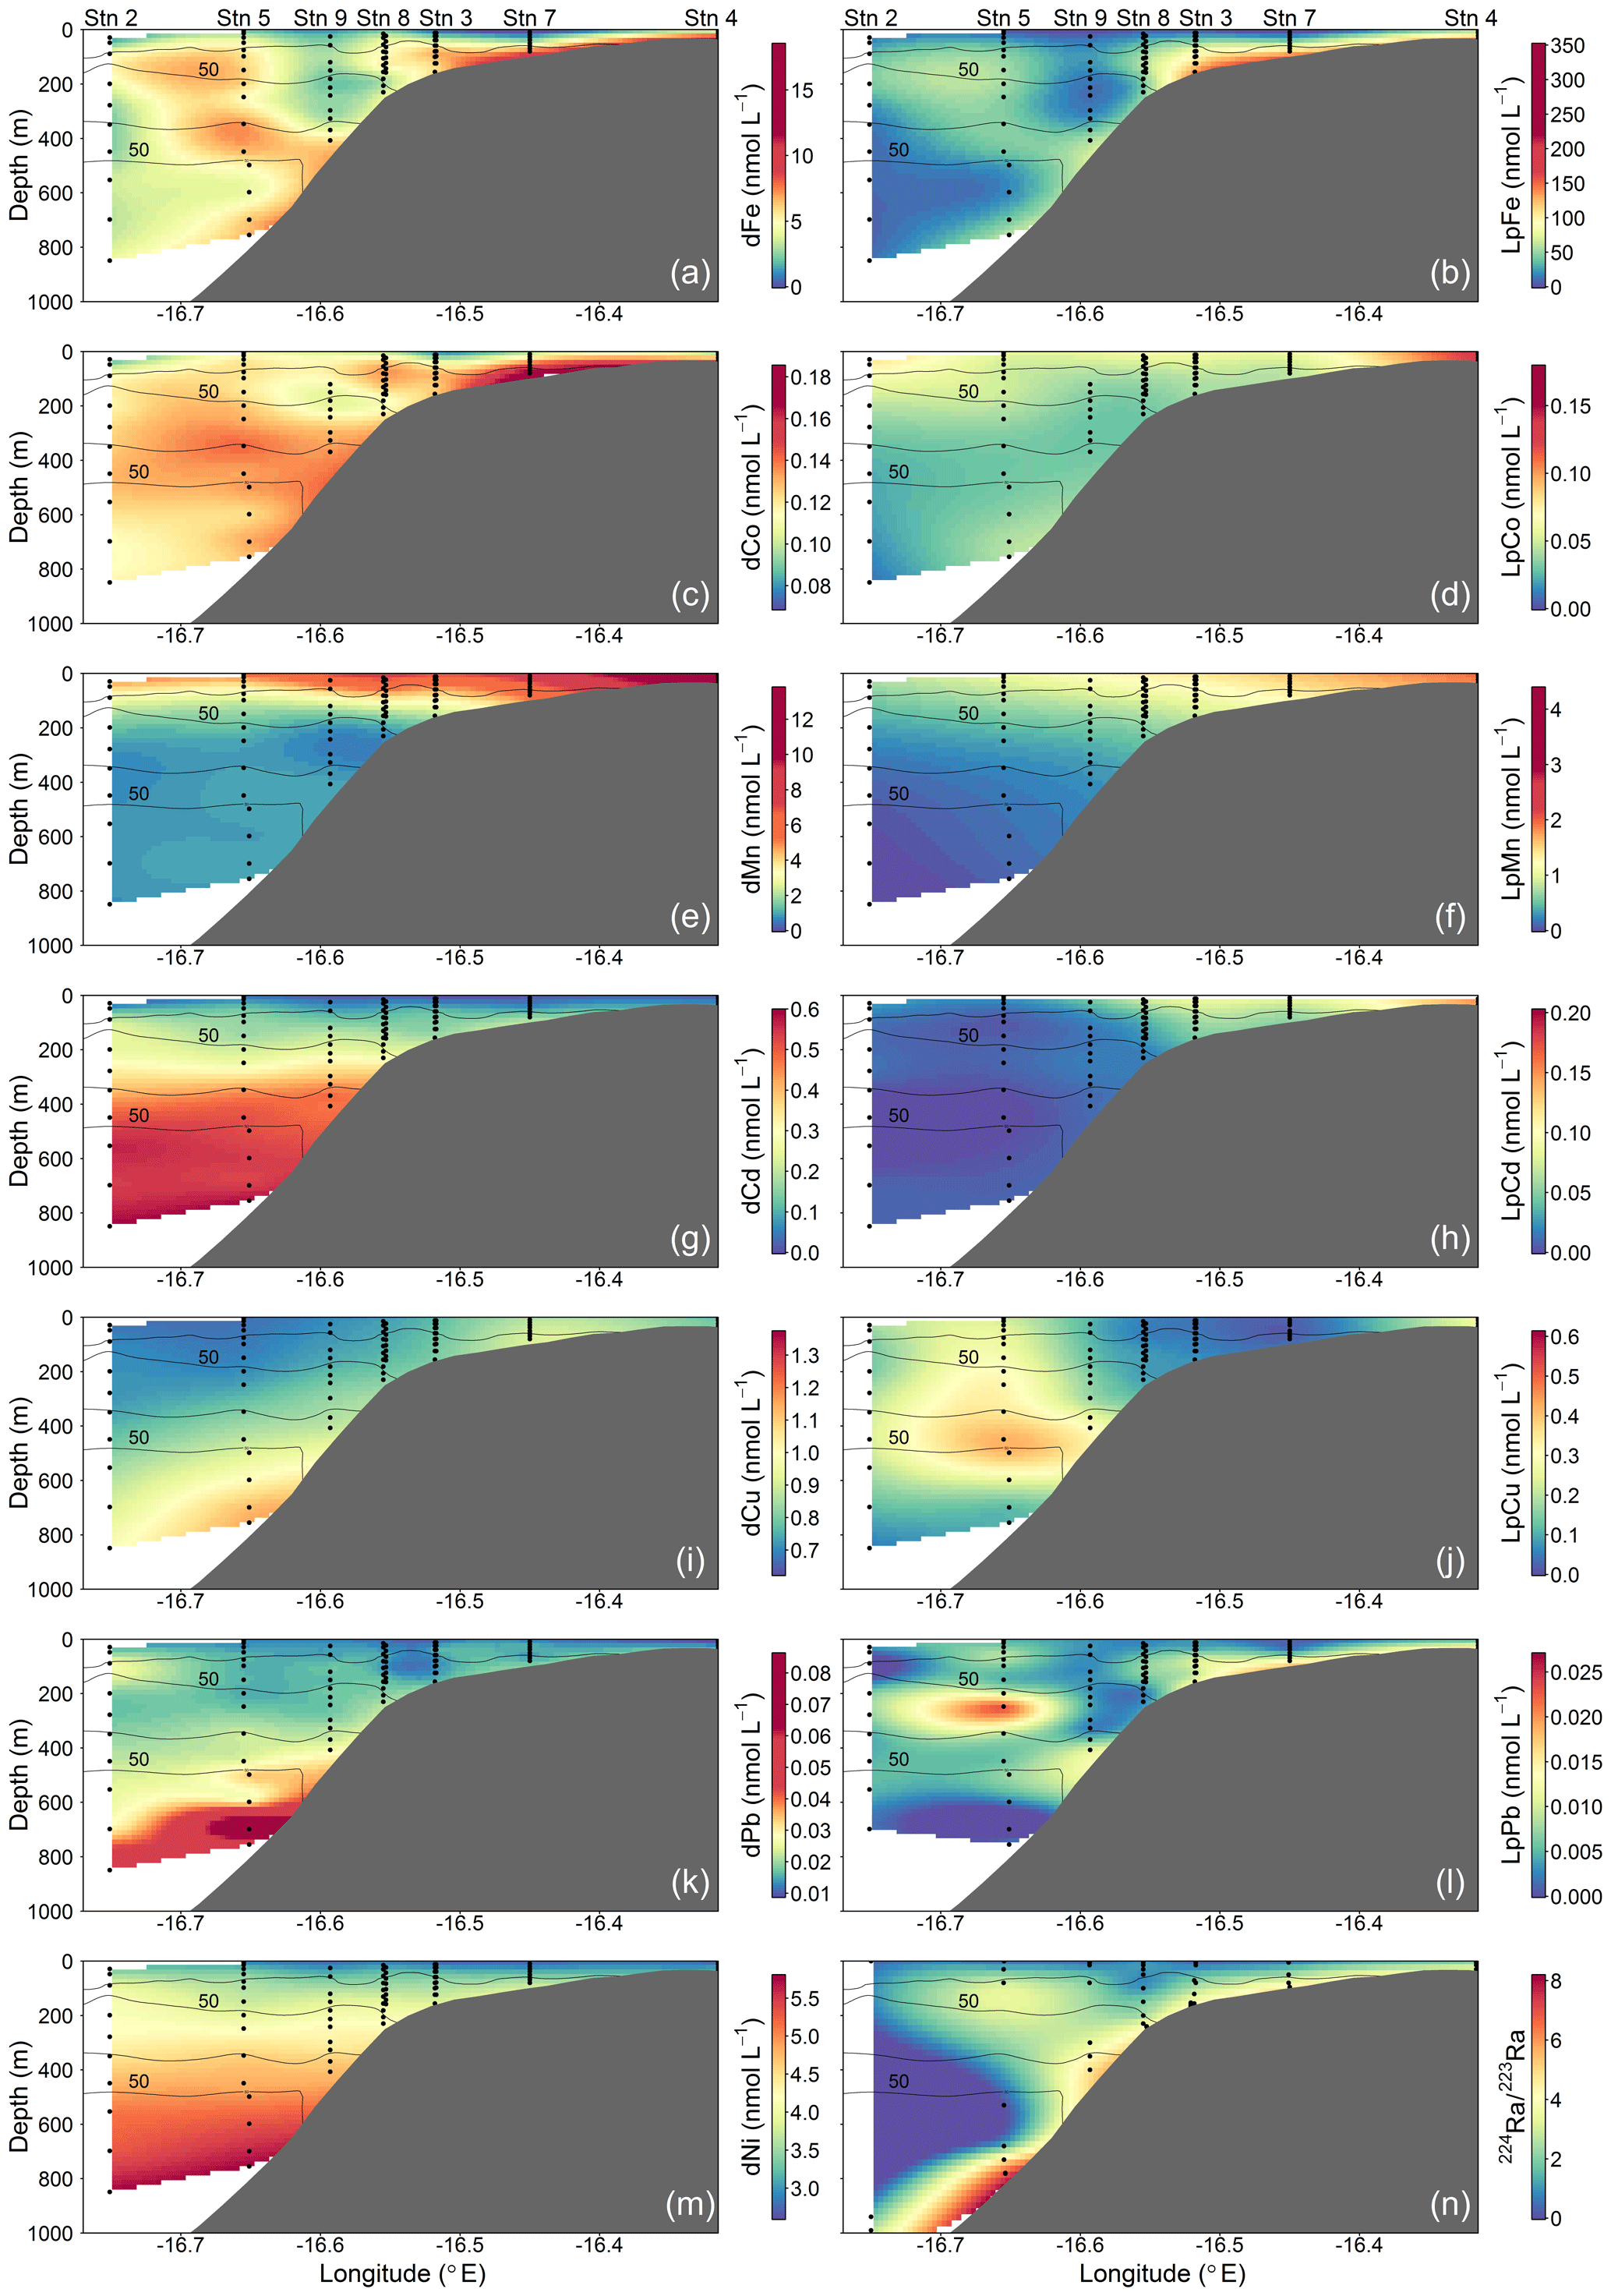
Figure 3Spatial distributions of dissolved (d) and leachable particulate (Lp) trace metals and 224Ra∕223Ra across the Mauritanian shelf at 18∘20′ N in June 2014. Each sample location is indicated by a black dot and oxygen contours at 50 µmol kg−1 enclosing the upper and lower OMZ are displayed with black contour lines.
3.1 Oceanographic settings of the study area
The cruise was conducted in June 2014 along a transect crossing a narrow shelf off the Mauritanian coast at 18∘20′ N. The vertical structure of the OMZ in this region is characterized by a deep OMZ at about 400 m depth and a shallow OMZ at about 100 m depth (Brandt et al., 2015). Coastal upwelling of nutrient-rich deep water occurs as a result of offshore transport of surface waters caused by a northeast trade wind component parallel to the coast. While north of 20∘ N upwelling persists throughout the year, upwelling south of 20∘ N, including the Mauritanian upwelling region, undergoes seasonal changes in upwelling strength (Barton et al., 1998), with strongest upwelling occurring between December and April. The seasonal variability is mainly driven by changes in wind forcing associated with the migration of the Intertropical Convergence Zone (Lathuilère et al., 2008). During the cruise period, cold upwelled waters with temperature less than 20 ∘C were still present on the shelf and upper continental slope (Thomsen et al., 2019, their Fig. 1) indicating active upwelling.
The eastern boundary circulation consists of the Mauritania Current (MC, Fig. 1) flowing poleward at the surface against the equatorward winds and of the poleward undercurrent (PUC) flowing in the same direction at depths between 50 and 300 m (Barton, 1989; Klenz et al., 2018; Mittelstaedt, 1983; Peña-Izquierdo et al., 2015). Both currents supply cold, O2- and nutrient-rich waters of predominantly South Atlantic origin (South Atlantic Central Water, SACW) to the coastal upwelling region (e.g., Mittelstaedt, 1991, 1983; Peña-Izquierdo et al., 2015). In response to the changing winds, the eastern boundary circulation likewise exhibits a pronounced seasonal variability (Klenz et al., 2018; Stramma et al., 2008a). The strongest poleward flow is observed during the relaxation period between May and July when alongshore, upwelling-favorable winds weaken but wind stress curl is at its maximum (Klenz et al., 2018). During the upwelling season in boreal winter, the circulation more closely resembles the classical eastern boundary circulation regime, with a weak PUC flowing beneath an equatorward coastal jet (Klenz et al., 2018; Kounta et al., 2018). At deeper levels (300–500 m depth), flow was found to be equatorward during both seasons. The shallow (<300 m depth) boundary circulations turn offshore at the southern flank of the Cape Verde frontal zone (CVFZ) (e.g., Tomczak, 1981; Zenk et al., 1991) at about 20∘ N, separating SACW from more saline and O2-rich central waters formed in the North Atlantic (NACW). The circulation in June 2014 was typical for a relaxation period characterized by strong poleward flow over the shelf and the upper continental slope between the surface and 250 m depth (Klenz et al., 2018; Thomsen et al., 2019). During the later parts of the cruise, the core of the MC moved offshore and reduced poleward flow was observed near the shelf break. Periods of elevated northward flow on the Mauritanian shelf inhibits the onshore near-bottom supply of low oxygen but nitrate-rich waters onto the shelf with consequences for benthic nitrogen cycling (Yücel et al., 2015).
Meridional sections of water mass properties and O2 concentrations from around 18∘ N showed that waters with an enhanced SACW proportion advected from the south as well as NACW coming from the north have higher O2 concentrations than the ambient waters (Klenz et al., 2018). The mixture of SACW and NACW waters found in the thermocline particularly during boreal winter, previously identified as a regional water mass and termed the Cape Verde SACW (SACWcv) by Peña-Izquierdo et al. (2015), is a signature of an older water mass with lower O2 concentrations than those of SACW or NACW due to a longer residence time and O2 consumption through remineralization. Elevated pelagic oxygen consumption levels at the Mauritanian continental margin were recently determined by Thomsen et al. (2019). During the transition period in May through to July, upper central waters (50–300 m depth) are dominated by SACW accounting for 80 %–90 % of the water masses in the boundary current region (Klenz et al., 2018).
The SACW transported poleward within the boundary circulation is supplied by the zonal North Equatorial Counter Current (NECC) and North Equatorial Undercurrent (NEUC), which flow eastward at about 5∘ N (Brandt et al., 2015) before diverging into a northward and a southward flowing branch in front of the African coast.
As a result of interactions between tidal currents, topography, and critically sloping upper continental slope topography (e.g., Eriksen, 1982), the Mauritanian upwelling region is known for elevated nonlinear internal wave activity resulting in enhanced mixing in the water column of the upper slope and shelf region (Schafstall et al., 2010). Vertical fluxes of nutrients driven by mixing processes are amongst the largest reported in literature, although lower than in the Celtic Sea (Tweddle et al., 2013) and the lower St. Lawrence estuary (Cyr et al., 2015).
The CTD and microstructure deployments were performed along the east–west transect in the period 8 to 27 June (2014) (Fig. 1). Oxygen concentrations reached a deep minimum of 40–50 µmol kg−1 at about 400 m and a shallow minimum of 30–50 µmol kg−1 at about 50–100 m (Fig. 2), which is in agreement with previous studies (Brandt et al., 2015; Thomsen et al., 2019). Mixed layer depths ranged from 10 to 22 m during the cruise. Salinity was highest at the surface (ca. 36.02) and generally decreased with depth to a minimum of 34.71 at around 1000 m. Nitrate () concentrations in the surface mixed layer varied between 0.1 and 11.3 µmol L−1 and phosphate () between 0.15 and 0.91 µmol L−1. and concentrations increased with depth to a maximum of 47.6 and 3.2 µmol L−1, respectively (Fig. 2).
Over a time period of 19 d, two trace-metal stations along the transect at water depths of 170 m (18.23∘ N, 16.52∘ W; first deployment: 12 June; second deployment: 21 June) and 189–238 m (18.22∘ N, 16.55∘ W; first deployment: 24 June; second deployment: 26 June) were reoccupied. Minimum O2 concentrations of 30 µmol kg−1 observed before 15 June increased to 50 µmol kg−1 after 19 or 24 June, depending on the location. This oxygenation event, captured in ocean glider measurements, is discussed in detail by Thomsen et al. (2019). Variability in oxygen concentrations observed further offshore was attributed to physical transport of SACW into the region (Thomsen et al., 2019). In contrast, closer to the coast, enhanced pelagic oxygen consumption rates were determined that significantly contribute to the variability in observed oxygen concentrations (Thomsen et al., 2019). Short-term variability in oxygen concentrations has also been observed further south in nearshore Senegalese waters where an anoxic event was likely attributed to the offshore advection of a decaying diatom bloom (Machu et al., 2019).
The sediments in the study area contain a large amount of carbonate, biogenic silica, and quartz (Hartman et al., 1976). The fraction of sand and mud varies largely depending on bottom depth, with sand comprising between 7 % and 70 % of the dry weight (Dale et al., 2014). The particulate organic carbon (POC) content varies between 0.55 wt % at shallow depth (66 and 90 m) and increases to 3.3 wt % at 1108 m depth (Schroller-Lomnitz et al., 2019). A more detailed description of the sediments underlying our study region and sediment parameters collected on the same cruise, including Fe(II) concentrations and Fe∕Al ratios, are given in Schroller-Lomnitz et al. (2019).
3.2 Spatial distributions of dissolved and leachable particulate trace metals
Dissolved Fe and LpFe concentrations ranged between 0.97–18.5 and 1.6–351 nmol L−1, respectively (Fig. 3a, b). Surface waters (5–29 m) had lowest dFe (0.97–4.7 nmol L−1) and LpFe (1.6–35.9 nmol L−1) concentrations, whereas highest concentrations were present on the shelf close to the seafloor (up to 18.5 nmol L−1 dFe and 351 nmol L−1 LpFe). Enhanced concentrations of both Fe fractions at any given station were observed at depths with low O2 concentrations (30–60 µmol O2 kg−1). A similar distribution pattern was observed for dCo, with concentrations between 0.069 and 0.185 nmol L−1 (Fig. 3c). In contrast, LpCo concentrations varied from below the limit of quantification (LOQ) up to 0.179 nmol L−1 and were generally highest in surface waters and close to the coast (Fig. 3d). Compared to dFe, the concentration range of dCo was much narrower and enhanced concentrations were observed over a broader depth range and further offshore.
Surface dFe and dCo concentrations were low, presumably due to enhanced biological uptake. No clear increasing trend in dFe and dCo with depth was observed, indicating that processes other than, or in addition to, remineralization influenced their distributions. Elevated concentrations were found close to the sediments and within low-O2 waters. This suggested a benthic source of Fe and Co under O2-depleted conditions and offshore transport along O2-depleted water filaments, which is in agreement with previous studies (e.g., Baars and Croot, 2015; Hatta et al., 2015; Noble et al., 2012). Our sharper onshore–offshore gradient of dFe concentrations compared to dCo in O2-depleted waters shows that oxidation and removal mechanisms or scavenging rates were faster for Fe than Co (Noble et al., 2012). Previously reported dFe concentrations in coastal regions of the tropical North Atlantic were lower than we observed, between 0.5 and 6.3 nmol L−1 (Hatta et al., 2015; Milne et al., 2017; Wuttig et al., 2013). However, all these samples were collected at a greater distance from the coast. In the near-coastal Oregon and Washington shelf bottom water dFe concentrations were similar to our study under equivalent O2 concentrations (18.7–42.4 nmol L−1 dFe, 42–61 µmol kg−1 O2; Lohan and Bruland, 2008), whereas in the euxinic waters from the Peruvian shelf region, dFe concentrations were more than an order of magnitude higher, exceeding 200 to 300 nmol L−1 (Schlosser et al., 2018; Scholz et al., 2016). Similar dCo concentrations to our study were observed in the North Atlantic and South Atlantic, with highest concentrations of ∼0.16 nmol L−1 present within O2-depleted waters (Noble et al., 2012, 2017).
Dissolved Mn concentrations ranged between 0.46–13.8 nmol L−1 and LpMn from below the LOQ to 4.4 nmol L−1 (Fig. 3e, f). Highest dMn and LpMn concentrations were observed in surface waters, generally decreasing with depth. Additionally, concentrations were highest on the shelf and decreased offshore. The dMn concentrations were generally elevated within and below the deeper O2-depleted waters with 0.70–1.34 compared to 0.46–0.91 nmol L−1 just above. The increased dMn concentrations within the deeper O2-depleted waters (∼ 350–500 m depth) indicate a benthic source, similar to Fe and Co, which is in accordance with previous studies (Noble et al., 2012). However, in the shallow O2-depleted waters (∼ 50–200 m depth), this effect is not resolvable due to high surface concentrations, which were maintained by photo-reduction of Mn oxides to soluble Mn(II) that prevents loss of Mn from solution (Sunda and Huntsman, 1994). Reported dMn concentrations in the North Atlantic and South Atlantic were lower than in our study, with concentrations <3.5 nmol L−1 in surface waters and around 0.5–1 nmol L−1 dMn within the OMZ (Hatta et al., 2015; Noble et al., 2012; Wuttig et al., 2013). As for dFe, these lower reported values can also be explained by sampling stations positioned at further distance from the coast and removal of dMn via biological oxidation processes with distance from the source (Moffett and Ho, 1996).
Dissolved Cd and Ni concentrations were lowest in surface waters with 0.022–0.032 nmol Cd L−1 and 2.6–2.8 nmol Ni L−1 and showed an increasing trend with depth to maximum values of 0.60 and 5.8 nmol L−1, respectively (Fig. 3g, m). Leachable particulate Cd concentrations were from below the LOQ to 0.20 nmol L−1, and LpNi concentrations from below the LOQ to 1.7 nmol L−1. A large fraction of Ni (72 %–100 %) was present in the dissolved form. The majority of LpNi samples were below the LOQ (>70 % of the data) and LpNi is therefore not included in Fig. 3. LpCd concentrations were highest close to the coast and decreased offshore (Fig. 3h). In surface waters close to the coast the LpCd fraction was dominant with up to 84.3 % of the entire Cd pool (d + Lp). The fraction of LpCd in surface water beyond the shelf break (including stations 2, 1, and 9) contributed still up to 54.3 % of the Cd pool, whereas below 50 m only 0 %–12.8 % of TDCd was in the Lp phase beyond the shelf break. In contrast to Fe, Co, and Mn, no increases in Cd and Ni were observed near the seafloor and within the O2-depleted waters indicating that Cd and Ni concentrations are mainly controlled by remineralization of sinking organic matter, which is typical for these two nutrient-like TMs (Biller and Bruland, 2013). Similar distributions with concentrations between 0 and 1000 m water depth ranging from ∼ 2 to 5.5 and from ∼ 0 to 0.55 nmol L−1 for dNi and dCd, respectively, were observed during the GEOTRACES transect GA03_w in the tropical North Atlantic (Mawji et al., 2015; Schlitzer et al., 2018).
Dissolved Cu concentrations in surface waters ranged between 0.63 and 0.81 nmol L−1 (Fig. 3i). Concentrations increased with depth to around 1.37 nmol L−1 at 700 m depth close to the seafloor, whereas highest observed concentrations further offshore were 0.95 nmol L−1 at the greatest sampled depth of 850 m. These results indicate that in addition to remineralization processes of sinking biogenic particles, the distribution of Cu is influenced by inputs from the seafloor. This is in accordance with previous studies, suggesting that Cu is released from continental shelf sediments under oxic and moderately reducing conditions (Biller and Bruland, 2013; Heggie, 1982), whereas no increase in Cu concentrations near the seafloor was observed at low bottom water O2 concentrations (O2 < 10 µmol L−1; Johnson et al., 1988). A decrease in Cu concentrations in the bottom boundary layer was also reported with a seasonal decrease in O2 in summer from a minimum of 70 µmol L−1 O2 in May to 40 µmol L−1 O2 in August, suggesting a decrease in sedimentary release of Cu (Biller and Bruland, 2013). In strongly reducing sediments and the presence of H2S, Cu forms inorganic sulfides and precipitates, which may explain reduced sedimentary Cu release under low bottom water O2 concentrations (Biller and Bruland, 2013). Therefore, the sediment source of dCu might show a different dependency on bottom water O2 concentrations than dFe, dCo, and dMn explaining the distinct distribution of dCu. Concentrations of LpCu were from below the LOQ to 0.61 nmol L−1 with enhanced levels at station 4 close to the coast and at mid-depths of the three stations furthest offshore (9, 5, and 2) (Fig. 3j).
Observed dPb concentrations were lowest in the surface waters at 9–14 pmol L−1 and increased with depth to 29–86 pmol L−1 below 600 m depth (Fig. 3k). Lead is not considered a nutrient-like TM (e.g., Boyle et al., 2014), but our observations indicate a release of Pb from sinking particles following remineralization. The concentration range and depth distribution is similar to reported distributions further offshore at about 21∘ W (Noble et al., 2015). These authors suggested that increased concentrations of up to 70 pmol L−1 between 600 and 800 m depth were related to the influence of Mediterranean Outflow Waters (MOW). Additionally, increased Pb concentrations in proximity to sediments have been attributed to the benthic release of historic Pb through reversible scavenging from particles and the release of dPb associated with Fe∕Mn oxyhydroxides during reductive dissolution of those oxides in anoxic sediments (Rusiecka et al., 2018). The major source of Pb to the ocean is atmospheric dust deposition from anthropogenic emissions (Bridgestock et al., 2016; Nriagu and Pacyna, 1988; Véron et al., 1994) with a recent indication of reduced anthropogenic Pb inputs to surface waters in the eastern tropical Atlantic under the north African dust plume (Bridgestock et al., 2016). Low surface-water concentrations on the Mauritanian shelf indicate low atmospheric inputs of Pb to this region. LpPb was from below the LOQ to 27 pmol L−1 and the distribution of LpPb was similar to that of LpFe, with subsurface maxima within O2-depleted waters (Fig. 3l), and this may indicate increased scavenging of dPb in these layers, which might be associated with Fe-containing particles.
In general, sediment-derived TM concentrations decrease with distance from the shelf and with time that passed since the water mass has been in contact with the sediments due to water mass mixing and removal processes such as precipitation and scavenging (Bruland and Lohan, 2006). Radium isotopes can be used as a tracer for benthic sources. The major source of Ra to the ocean is input from sediments through the efflux of pore water, sediment resuspension, and submarine groundwater discharge (Moore, 1987; Moore and Arnold, 1996; Rama and Moore, 1996). Due to the distinctive half-lives of the different Ra isotopes (e.g., 224Ra ( d) and 223Ra ( d)) and their conservative behavior in seawater, it is possible to quantify the time that has passed since a parcel of water was in contact with the sediments using the following equation by Moore (2000):
and solved for water mass age (τ)
where A224∕A223 is the activity ratio of 223Ra and 224Ra, with the subscript obs for the observed seawater ratio and the subscript i for the initial groundwater endmember ratio, and λ223 and λ224 are the decay constants in units of per day (d−1) for 223Ra and 224Ra. The ratio 224Ra∕223Ra is not affected by dilution assuming there is no mixing with waters having significantly different 224Ra∕223Ra ratios.
Highest 224Raex∕223Ra activity ratios were observed close to the seafloor (Fig. 3n). The average 224Raex∕223Ra ratio in proximity to the sediment source (<2.60 m above seafloor) was 4.9±1.5 and was similar to the reported ratios for shelf waters off South Carolina (224Raex∕223Ra = 4.4±1.5; Moore, 2000). The 224Raex∕223Ra ratios decreased away from their benthic source due to decay (224Raex∕223Ra = 0–0.5 in surface waters). Ratios close to the seafloor were relatively constant along the transect at bottom depths <600 m, whereas dFe, dCo, and dMn concentrations varied largely in the bottom samples. This suggests that factors, which are not influencing the Ra distribution, impacted the distributions of dFe, dCo, and dMn, with a likely influence of enhanced O2 concentrations reducing sediment release or increasing removal rates of these metals at water depths between 200 and 400 m. At around 800 m bottom depth, 224Raex∕223Ra ratios were slightly elevated and coincided with increased dCo, dFe, dMn, and dCu concentrations despite O2 concentrations >70 µmol kg−1. This suggests that the enhanced TM concentrations at this location were influenced by a strong sediment source which may be related to the presence of a benthic nepheloid layer as indicated by an increase in turbidity in proximity to the seafloor. An elevated 224Raex∕223Ra ratio of 3.5±0.6 was observed at about 16.65∘ N and 80 m water depth (bottom depth 782 m) and coincided with a local maximum of dFe, dMn, and dCo and reduced O2 concentrations. These observations indicate that the waters with the local maximum of dFe, dMn, and dCo have been in relatively recent contact (12–20 d assuming initial pore water 224Raex∕223Ra ratios between 18 and 38; Moore, 2007) with sediments, likely originated from south of our transect as a result of a strong poleward flow (Klenz et al., 2018), and the dynamic current system in this region can cause local and short-term variability in the transport of sediment-derived TMs.
3.3 Classification of different groups of trace metals based on principal component analysis
Principal component analysis (PCA) was performed (using the RDA function within the vegan package in R; Oksanen et al., 2018) to investigate different groups and correlations in the data set. Dissolved TMs (Fe, Mn, Co, Ni, Pb, Cu, and Cd), nutrients (silicic acid, nitrate, and phosphate), dissolved O2, apparent oxygen utilization (AOU), depth, and iodide concentrations (Supplement Fig. S1) were utilized in the PCA. Radium data were not included in the PCA as the number of available data points for 224Raex∕223Ra was much lower than for the other parameters. Surface waters shallower than 50 m were excluded from the PCA to remove the influence of localized atmospheric deposition and photochemical processes, which in particular influence Mn and iodide distributions. The PCA generated three principal components (PC) with eigenvalues larger than 1, with PC1 explaining 53.6 % and PC2 25.5 % of the total variance in the data set (together 79.1 %). Inclusion of PC3 in the analysis explained only 6.8 % more of the variance.
The first PC group is formed by dCd, dCu, dNi, and dPb (Fig. 4), which are associated with depth, AOU, nitrate, and phosphate. This indicates that the distributions of Cd, Cu, Ni, and potentially Pb are controlled by organic matter remineralization processes. This is in agreement with strong Pearson correlations, R>0.9, for the relationships of dCd and dNi with depth, nitrate, and silicic acid (Supplement Table S1). Weaker correlations with major nutrients were observed for dPb (R>0.6) and dCu (R>0.4), potentially due to additional remineralization or removal mechanisms for these elements (e.g., prior atmospheric inputs and water mass transport, Pb; sediments, Cu and Pb; and scavenging). The second group of TMs is composed of dFe, dCo, and dMn that are associated with elevated iodide and turbidity, and low dissolved O2 (Fig. 4). Iodide (I−) is the reduced form of iodine (I), which is typically present as iodate (IO) in oxygenated subsurface water. Both I forms are present as soluble anions in seawater. Due to a relatively high redox potential (pE ∼ 10), iodine is one of the first redox-sensitive elements to undergo reduction under suboxic conditions, and is therefore a useful indicator for active reductive processes (Rue et al., 1997). Despite their role as micronutrients, Fe, Mn, and Co do not correlate with nutrients indicating that processes other than remineralization controlled their distributions.
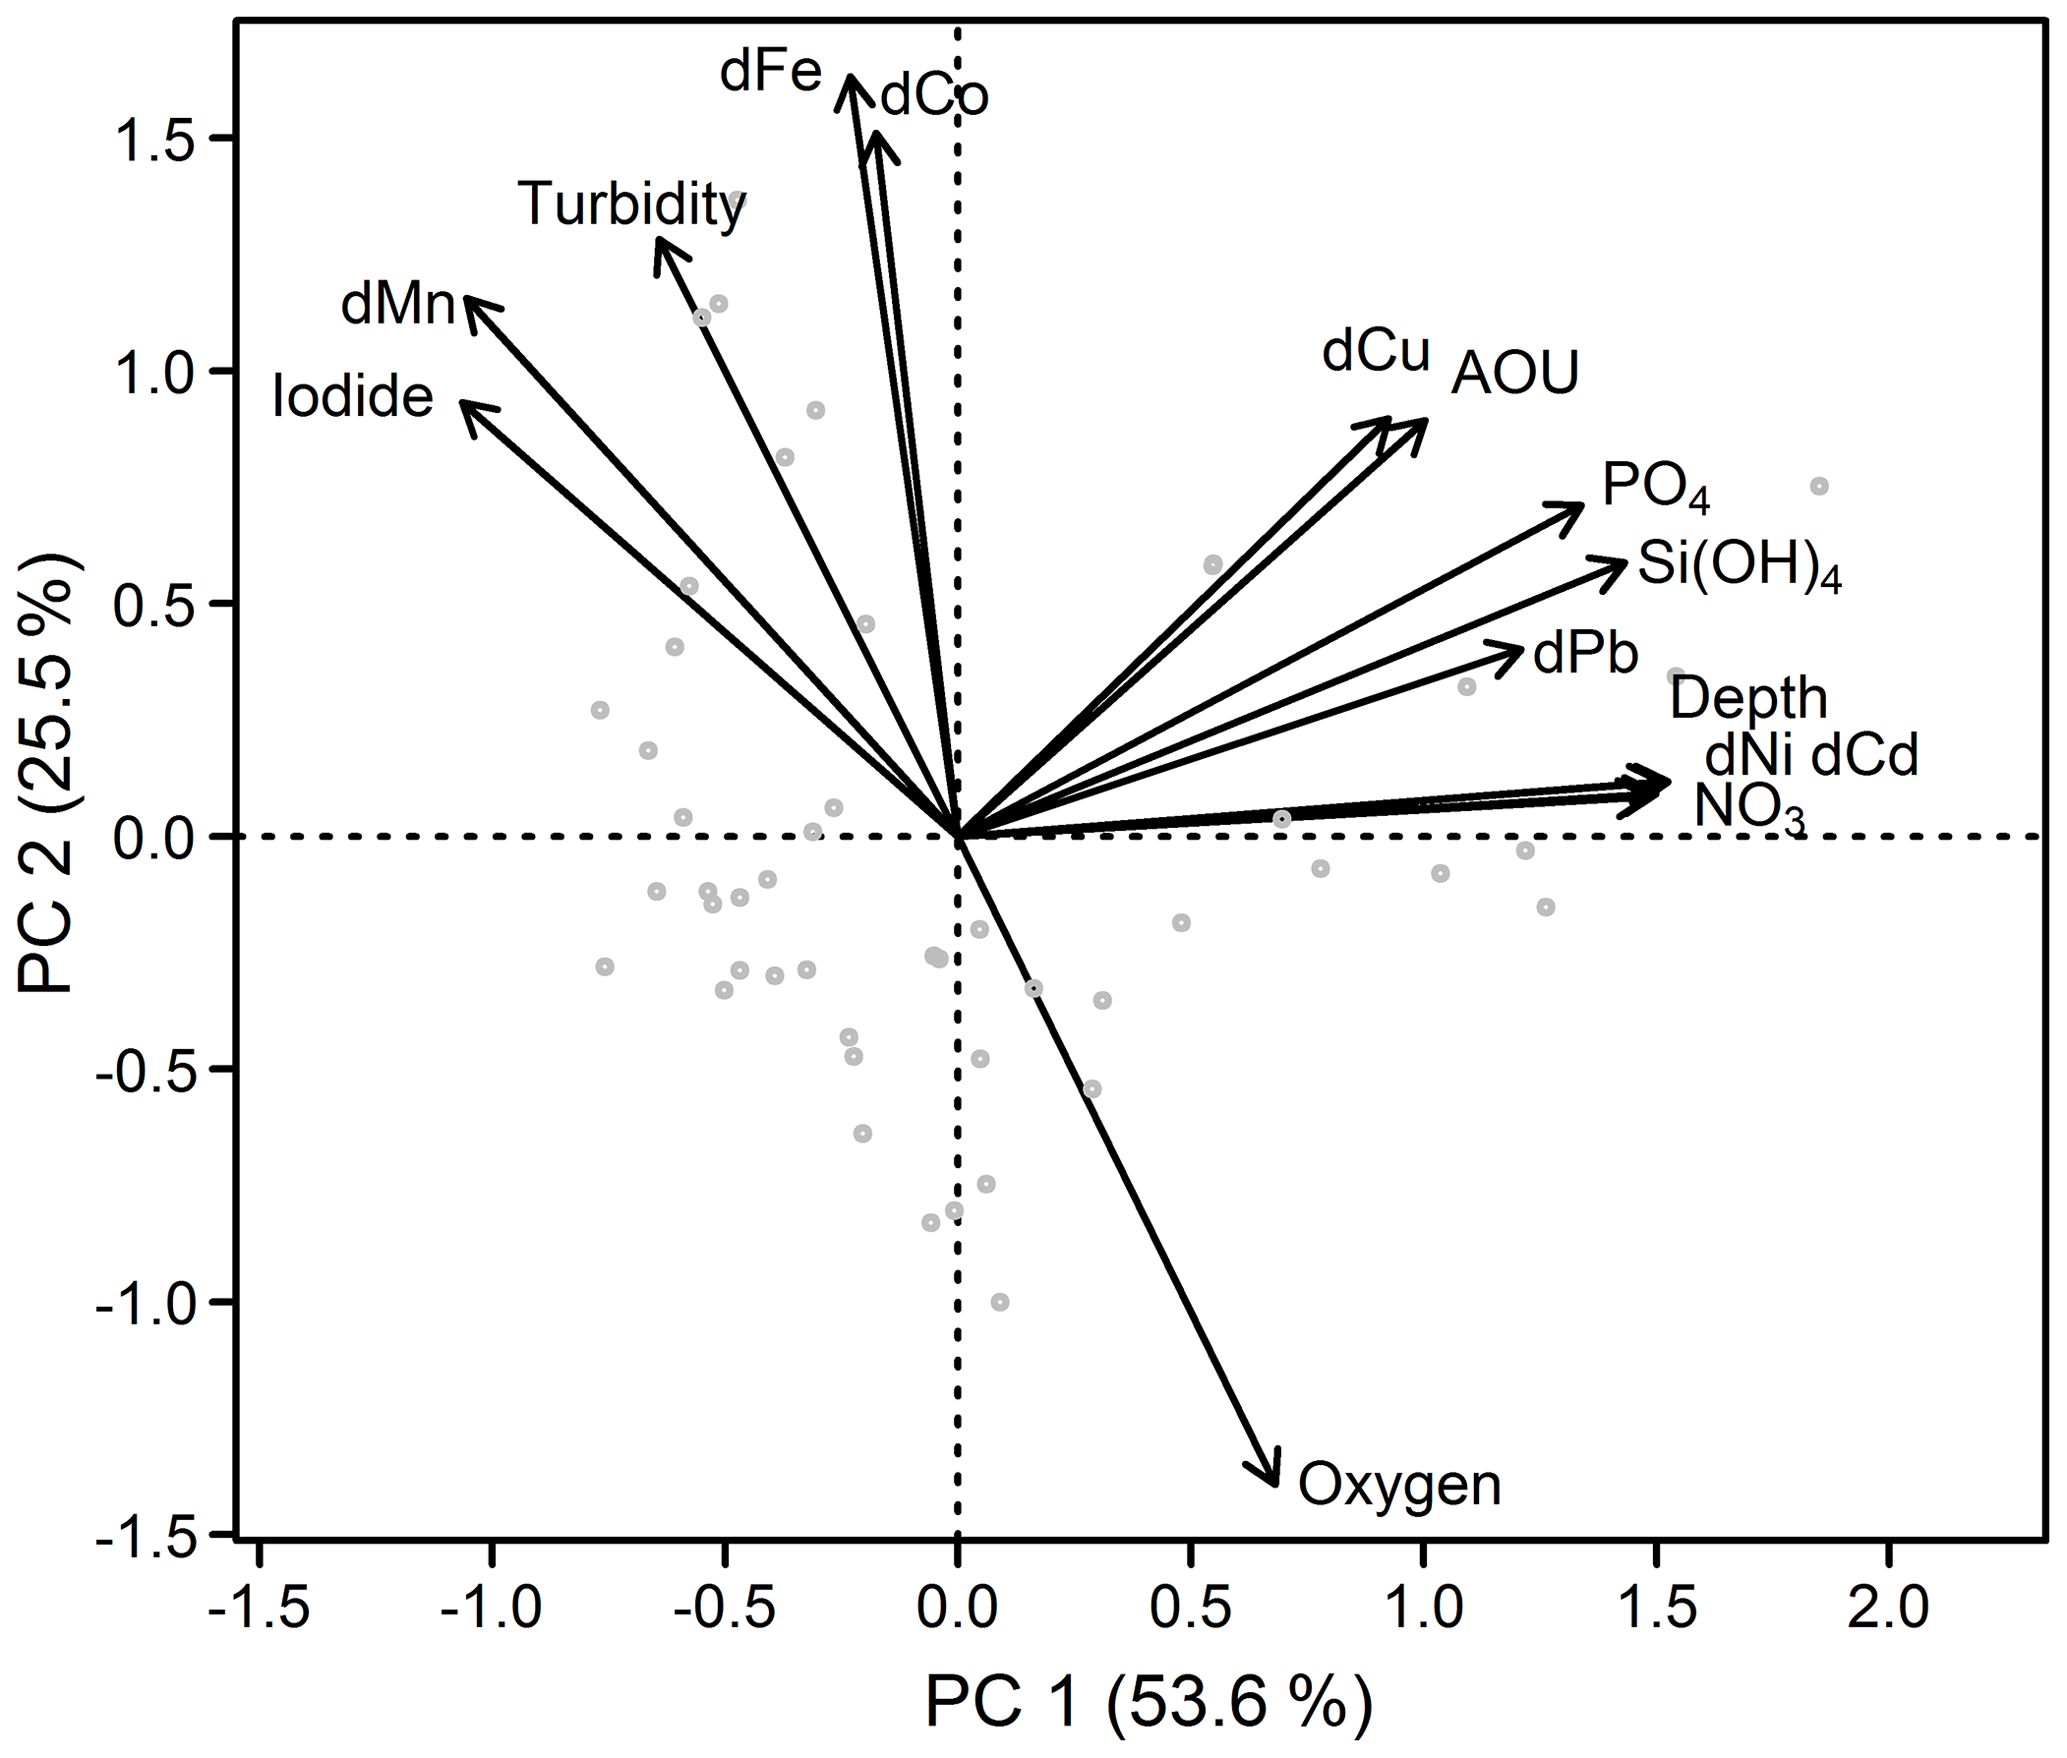
Figure 4Principal component analysis of the Mauritanian shelf data set. Principal component loadings for each variable are indicated by black vectors. Component scores of each sample are indicated as gray circles. Loadings and scores have been scaled symmetrically by square root of the eigenvalue.
The anticorrelation with O2 (also shown in Fig. S2) and correlation with iodide support the notion that Fe, Co, and Mn distributions were strongly influenced by water column O2 concentrations, presumably through (i) enhanced benthic metal fluxes from anoxic sediments and (ii) decreased oxidation rates in the overlying water column under O2-depleted conditions. This is also supported by elevated benthic Fe(II) fluxes observed at the seafloor within the shallow OMZ, with benthic fluxes of 15–27 µmol m−2 d−1 (Schroller-Lomnitz et al., 2019).
Variability in the redox-sensitive metals, Fe, Mn, and Co, was not fully explained by either O2 or iodide concentrations; Pearson correlations with O2 were −0.55, −0.61, and −0.58, respectively (Supplement Table S1). As shown before, other factors such as water mass mixing and age, the amount and type of particles present, and remineralization all likely impact their dissolved concentrations. Consequently, such a complex chain of factors and processes means that one variable alone is unlikely to explain the behavior of Fe, Mn, and Co.
3.4 Influence of the different sources of Fe, Mn, and Co
The main sources of TMs in our study region are sedimentary release and atmospheric dust deposition (e.g., Rijkenberg et al., 2012). Also, release of TMs via organic matter remineralization may have an important influence on the distribution of TMs. In the following, we discuss the relative influence of remineralization, atmospheric dust deposition, and sedimentary release on the supply of Fe, Co, and Mn to surface waters.
3.4.1 Remineralization
To quantify the influence of remineralization for dFe, we employed dFe-to-carbon (dFe∕C) ratios (carbon was calculated using AOU, with an AOU∕carbon ratio of 1.6; Martin et al., 1989). Surface data, where O2 was over-saturated (due to biological O2 production), were excluded. Dissolved Fe∕C ratios for the entire transect varied between 15 and 74 µmol mol−1. These results agree with those for shelf-influenced waters with dFe∕C ratios of 13.3–40.6 µmol mol−1 further south at 12∘ N (Milne et al., 2017). Reported ratios for the North Atlantic, further away from the shelf were lower and ranged between 4 and 12.4 µmol mol−1 (Fitzsimmons et al., 2013; Milne et al., 2017; Rijkenberg et al., 2014). To estimate the amount of dFe being derived by remineralization, we assume a dFe∕C ratio of 4–12 µmol mol−1 from organic matter remineralization, similar to the observed dFe∕C ratios in the open ocean close to our study area without a strong shelf influence. These offshore ratios may still be influenced by an atmospheric source of dFe, which would result in an overestimation of dFe∕C ratios from remineralization and thereby an overestimation of the fraction of remineralized dFe. Apart from additional inputs, the dFe∕C ratios are influenced by the respective Fe∕C stoichiometry in the sinking organic matter and removal of dFe by scavenging. Furthermore, it is not clear if the offshore ratios can be transferred to a location close to the coast, as the balance between remineralization and scavenging processes might be different due to differences in phytoplankton productivity and particle load. Hence, this approach only provides a broad estimate of the relative influence of remineralization on the distribution of dFe in the study area.
We obtain a range between 5±3 % and 54±27 % for dFe being derived from remineralization processes with lowest values observed on the shelf at 34 m depth at station 4 (5±3 %) and highest values estimated beyond the shelf break at Stn. 9 at 213 m depth (54±27 %) and Stn. 2 at 450 m depth (52±26 %). However, no clear increase in the contribution of remineralized dFe to total dFe with depth or distance to the coast was observed. For example at depths between 35 and 200 m, our estimates of dFe from remineralization ranged between 10±5 % and 51±25 % with high values of up to 41±20 % at 50 m depth at station 7 close to the coast, whereas relatively low values of 19±9 % were observed at 89 m at station 2. These results indicate that, locally, remineralization can be an important control on dFe concentrations, but that the contribution varies largely with additional important controls, often dominating over remineralization.
Similar analysis for dCo∕C ratios revealed an increased importance of an additional source close to the shelf. Observed dCo∕C ratios ranged between 0.81 and 2.2 µmol mol−1. The larger ratios were observed close to the coast and decreased further offshore. Overall, the observed ratios were somewhat higher than reported cellular ratios of phytoplankton in the North Atlantic of 0.5–1.4 µmol mol−1 (Twining et al., 2015). However, relatively constant dCo∕C ratios beyond the shelf break (dCo∕C: 0.82–1.09 µmol mol−1, stations 2, 5, and 9) that are similar to cellular ratios of phytoplankton suggest a large influence of remineralization on dCo beyond the shelf break, whereas enhanced ratios close to the coast suggest an additional benthic source. Due to the lack of comparable data of offshore dCo∕C ratios and the multiple processes influencing this ratio (varying phytoplankton nutrient stoichiometry and scavenging), we did not use these values to estimate the remineralized dCo fraction.
The distribution of Mn was not predominantly determined by biological uptake and remineralization processes in our study region. In contrast, dMn∕C ratios were largely influenced by photoreduction in the surface (Sunda and Huntsman, 1994), removal via biotic oxidation, and formation of Mn oxides at depth (Tebo et al., 2004). Therefore, we did not assess remineralization processes for Mn using dMn∕C ratios.
3.4.2 Atmospheric deposition
Aluminum is present as a relatively constant fraction of ∼ 8.15 wt % in the continental crust (Rudnick and Gao, 2006), is supplied to open ocean surface waters mainly by atmospheric deposition (Orians and Bruland, 1986), and is not considered to be taken up by phytoplankton (apart from a small amount being incorporated into siliceous diatom frustules; Gehlen et al., 2002). Therefore, dAl in the surface mixed layer is used as a tracer for atmospheric deposition to the surface ocean (Measures and Brown, 1996; Measures and Vink, 2000). The atmospheric input in the study region is mainly influenced by north African or Saharan mineral dust with only a small contribution of anthropogenic sources, which differ greatly in TM composition and solubilities from mineral dust (Baker et al., 2013; Patey et al., 2015; Shelley et al., 2015). Close to continental shelves, Al can also be supplied by sediment resuspension in addition to atmospheric input (Menzel Barraqueta et al., 2018; Middag et al., 2012; Moran and Moore, 1991). Enhanced aerosol optical depth above our study region (Supplement Figs. S3 and S4) indicates high dust loading at the time of our cruise. Our dAl concentrations in surface water ranged between 30 and 49 nmol L−1 and LpAl between 3.4 and 18.2 nmol L−1. Dissolved Al concentrations decreased with depth (Fig. 8), indicating that Al was released by eolian dust deposition to surface waters and removed through scavenging at depth (Orians and Bruland, 1985).
Dissolved atmospheric deposition fluxes can vary largely depending on the aerosol solubility, which is dependent on aerosol source, atmospheric aerosol processing during transport, and dissolution in surface waters (Jickells, 1999). Here, atmospheric dFe fluxes were calculated using the dAl inventory in the surface mixed layer, a residence time for dAl of 0.65±0.45 years as reported for the Canary Current system (Dammshäuser et al., 2011), and a ratio of 0.31 for dust-derived dissolved Fe∕Al (Buck et al., 2010). This approach is independent of the fractional solubility of Al, as we do not account for total atmospheric deposition fluxes and only use the already dissolved fraction of Al. However, this approach is dependent on the ratio of Fe∕Al from dissolution of aerosols. This ratio, however, is not clearly defined and can vary between different dust sources and deposition pathways, such as wet or dry deposition (e.g., Shelley et al., 2018). In our study region, dry deposition is the dominant deposition pathway, as it is located north of the Intertropical Convergence Zone and precipitation is minimal <0.001 g cm−3 (NASA). Here, we utilized a ratio observed for total aerosol samples in the remote North Atlantic from a Saharan dust source (Buck et al., 2010). Soluble ratios under the Saharan dust plume were, however, lower for all leach media (Fe∕Al: 0.051–0.25; Shelley et al., 2018), indicating that the ratio of 0.31 utilized here might result in an overestimation of the dFe flux estimates. This approach also assumes that dAl is only supplied to the surface ocean via atmospheric deposition. Vertical fluxes of Al from sediment resuspension are unlikely to contribute significantly to concentrations of dAl in surface waters here as dAl concentrations decreased with depth, indicating removal of dAl via scavenging.
Mean atmospheric dFe fluxes of the individual stations were 0.63–1.4 µmol m−2 d−1 (Fig. 5, Supplement Table S2), values similar to reported fluxes close to our study region of 2.12 µmol m−2 d−1 further north between 22.5–25∘ N and 26.5–27.5∘ W (Rijkenberg et al., 2012) and 0.120 µmol m−2 d−1 around 20∘ N close to the African coast (Ussher et al., 2013). The uncertainty in the residence time of dAl, however, creates a large uncertainty in calculated fluxes resulting in a lowest flux of 0.37 µmol m−2 d−1 when using the largest estimated residence time of 1.1 years and a highest flux of 4.65 µmol m−2 d−1 when using the shortest estimated residence time of 0.2 years. In fact, a residence time of 3 months has been shown to give similar results for total Al atmospheric deposition fluxes as modeling studies (Menzel Barraquetta et al., 2019). Short residence times of a few months have also been suggested for Al and Fe in areas with a large dust deposition including our study region (e.g., Croot et al., 2004; Dammshäuser et al., 2011). Therefore, we suggest that the atmospheric dFe flux is more likely to be closer to the upper range of our flux estimates. However, the atmospheric deposition fluxes using a short residence time may be larger than the annual average since the dust load is highest between June and August in our study area (Supplement Fig. S4).
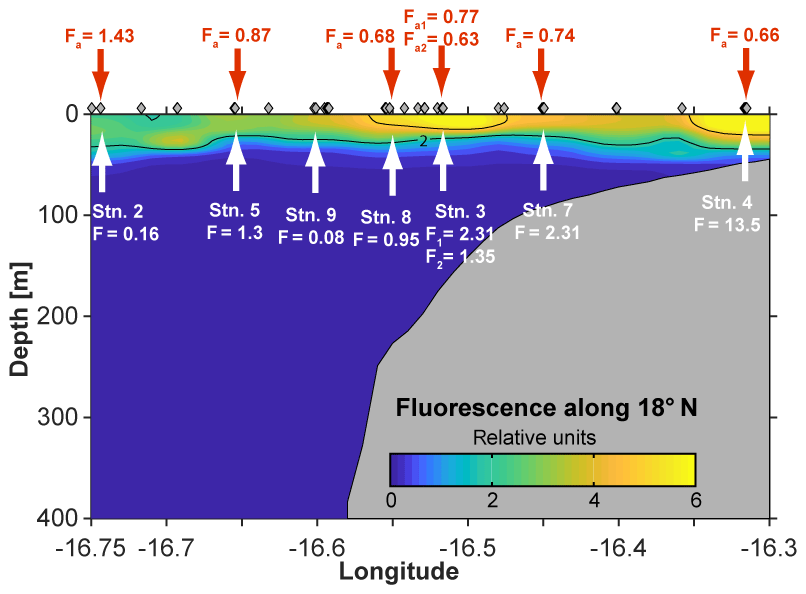
Figure 5Atmospheric dFe fluxes (Fa; red) and vertical dFe fluxes (F; white) in micromoles per square meter per day (µmol m−2 d−1) along the transect at 18∘20′ N in June 2014.
3.4.3 Vertical trace element fluxes to surface waters
The vertical diffusive and advective fluxes of dFe from shallow O2-depleted waters to surface waters with enhanced chlorophyll a fluorescence were determined to assess the potential Fe contribution to phytoplankton growth from suboxic waters (Fig. 5). A detailed summary of the individual dFe flux estimates, and their uncertainties, is given in the Supplement Table S2.
Vertical dFe fluxes increased by 2 orders of magnitude from 70 km offshore to the shallow shelf region. On the shelf (bottom depth: 50 m), an elevated mean dFe flux of 13.5 µmol m−2 d−1 was estimated. The contribution from vertical advection (upwelling) here (11.99 µmol m−2 d−1) was an order of magnitude larger than the diffusive flux (1.56 µmol m−2 d−1). Our estimate agrees with a reported vertical dFe flux of 16 µmol m−2 d−1 on the shelf at 12∘ N (Milne et al., 2017). Average estimates from the upper continental slope and the lower shelf region (stations 3, 7, and 8, bottom depth: 90–300 m) were between 1 and 2.5 µmol m−2 d−1. Here, the vertical diffusive fluxes dominated (0.72–1.75 µmol m−2 d−1) and were about a factor of 3 larger than vertical advective fluxes (0.22–0.68 µmol m−2 d−1). The elevated diffusive fluxes at the upper continental slope and lower shelf region are due to enhanced diapycnal mixing that originates from tide–topography interactions (Schafstall et al., 2010). At 170 m depth of the repeated station (3), vertical dFe flux estimates were 2.3 and 1.4 µmol m−2 d−1, respectively. The differences in the two values are due to differences in the strength of turbulent mixing during the two station occupations. For the offshore stations 2 and 9 (bottom depth >500 m), mean dFe fluxes were 0.08–0.16 µmol m−2 d−1 with similar contributions of diffusive and advective fluxes. However, one offshore station (station 5) exhibited elevated dFe fluxes of 1.3 µmol m−2 d−1 with a large contribution of the diffusive flux term (1.03 µmol m−2 d−1). Here, diapycnal mixing was determined from only five microstructure profiles that exhibited elevated turbulence levels. It is thus very likely that the observations captured a rare elevated mixing event during station occupation and the associated elevated vertical fluxes do not represent a longer-term average.
Although in the study region atmospheric fluxes of dFe were enhanced relative to global averages (Mahowald et al., 2009) with mean fluxes of 0.63–1.43 µmol m−2 d−1, our vertical Fe fluxes from the shallow O2-depleted waters of 0.95–13.5 µmol m−2 d−1 exceeded atmospheric fluxes at all stations apart from station 2 (0.16 µmol m−2 d−1) furthest offshore and potentially station 9 (0.08 µmol m−2 d−1), where no atmospheric fluxes were determined. The weaker influence of atmospheric deposition in this region close to the coast is in accordance with previous studies that demonstrated sediments to be the major contributor to the Fe inventory in the coastal region of the eastern tropical Atlantic, whereas the importance of atmospheric inputs increases further offshore (Milne et al., 2017). It should be noted that there are considerable uncertainties in the flux estimates presented above. Uncertainties in the diffusive flux originate predominately from the elevated variability in turbulence (see Schafstall et al., 2010 for details) and were calculated here using the upper and lower 95 % confidence interval of diffusivity measurements. Uncertainties in the vertical advective flux originate from unaccounted for contributions from, for example, the spatial structure of the wind, particularly in the offshore direction; its temporal variability (e.g., Capet et al., 2004; Desbiolles et al., 2014, 2016; Ndoye et al., 2014); and uncertainties in the satellite wind product near the coast (e.g., Verhoef et al., 2012), and were accounted for by using an estimated error of 50 % for the upwelling velocity. Furthermore, the distribution of vertical velocities with depth is assumed to be linear here.
Dissolved Co fluxes ranged between 2 and 113 nmol m−2 d−1. These values are lower than reported upwelling fluxes of dCo of 250 nmol m−2 d−1 for this region (Noble et al., 2017) but are larger than atmospheric deposition fluxes of 1.7 nmol m−2 d−1 (Shelley et al., 2015). Fluxes of dMn are downwards from surface waters to O2-depleted waters due to higher concentrations in surface waters.
3.5 Removal mechanisms and particle interactions
Particles in the water column can comprise either a source or a sink of dissolved TMs. In the top 50 m of the water column a large part of the LpTMs may be part of living biological cells (e.g., phytoplankton) or organic detritus and can enter the dissolved TM pool by remineralization (Bruland and Lohan, 2006). Additionally, LpTMs may be part of lithogenic phases from Saharan dust and sediment particles, or authigenic phases. Authigenic phases are formed in situ by TM adsorption onto particle surfaces or by the formation of amorphous TM oxides and hydroxides (e.g., FeO(OH) in the mineral structure of goethite) (Sherrell and Boyle, 1992), processes referred to as scavenging. The extent of scavenging processes is largely influenced by the amount and type of particles present (Balistrieri et al., 1981; Honeyman et al., 1988).
Iron was mainly present in the size fraction >0.2 µm with TDFe concentrations being 0.44–44.5 times higher than dFe (<0.2 µm) (Fig. 6a). To investigate the influence of particle load on the distribution between dissolved and particulate phases, the fraction of Lp (Lp∕TD) TMs and Lp concentrations are plotted against turbidity for Fe, Co, and Mn (Fig. 6b, c). A small fraction of LpFe of around 60 % was observed at lowest turbidity. As turbidity increases from 0.1 to 0.2 NTU, the LpFe fraction increased to >90 %. This suggests that the fraction of LpFe is tightly coupled to the particle load. Iron adsorption onto particles has been demonstrated to be reversible with a constant exchange between dissolved and particulate fractions (Abadie et al., 2017; Fitzsimmons et al., 2017; John and Adkins, 2012; Labatut et al., 2014). Furthermore, offshore transport of acid-labile Fe particles formed by scavenging (oxidation and adsorption) of dissolved Fe originating from a benthic source was observed in the North Pacific (Lam and Bishop, 2008) and may contribute to the bioavailable Fe pool. Therefore, an important fraction of Fe may be transported offshore, adsorbed onto particles, and can enter the dissolved pool by cycling between dissolved and particulate phases.
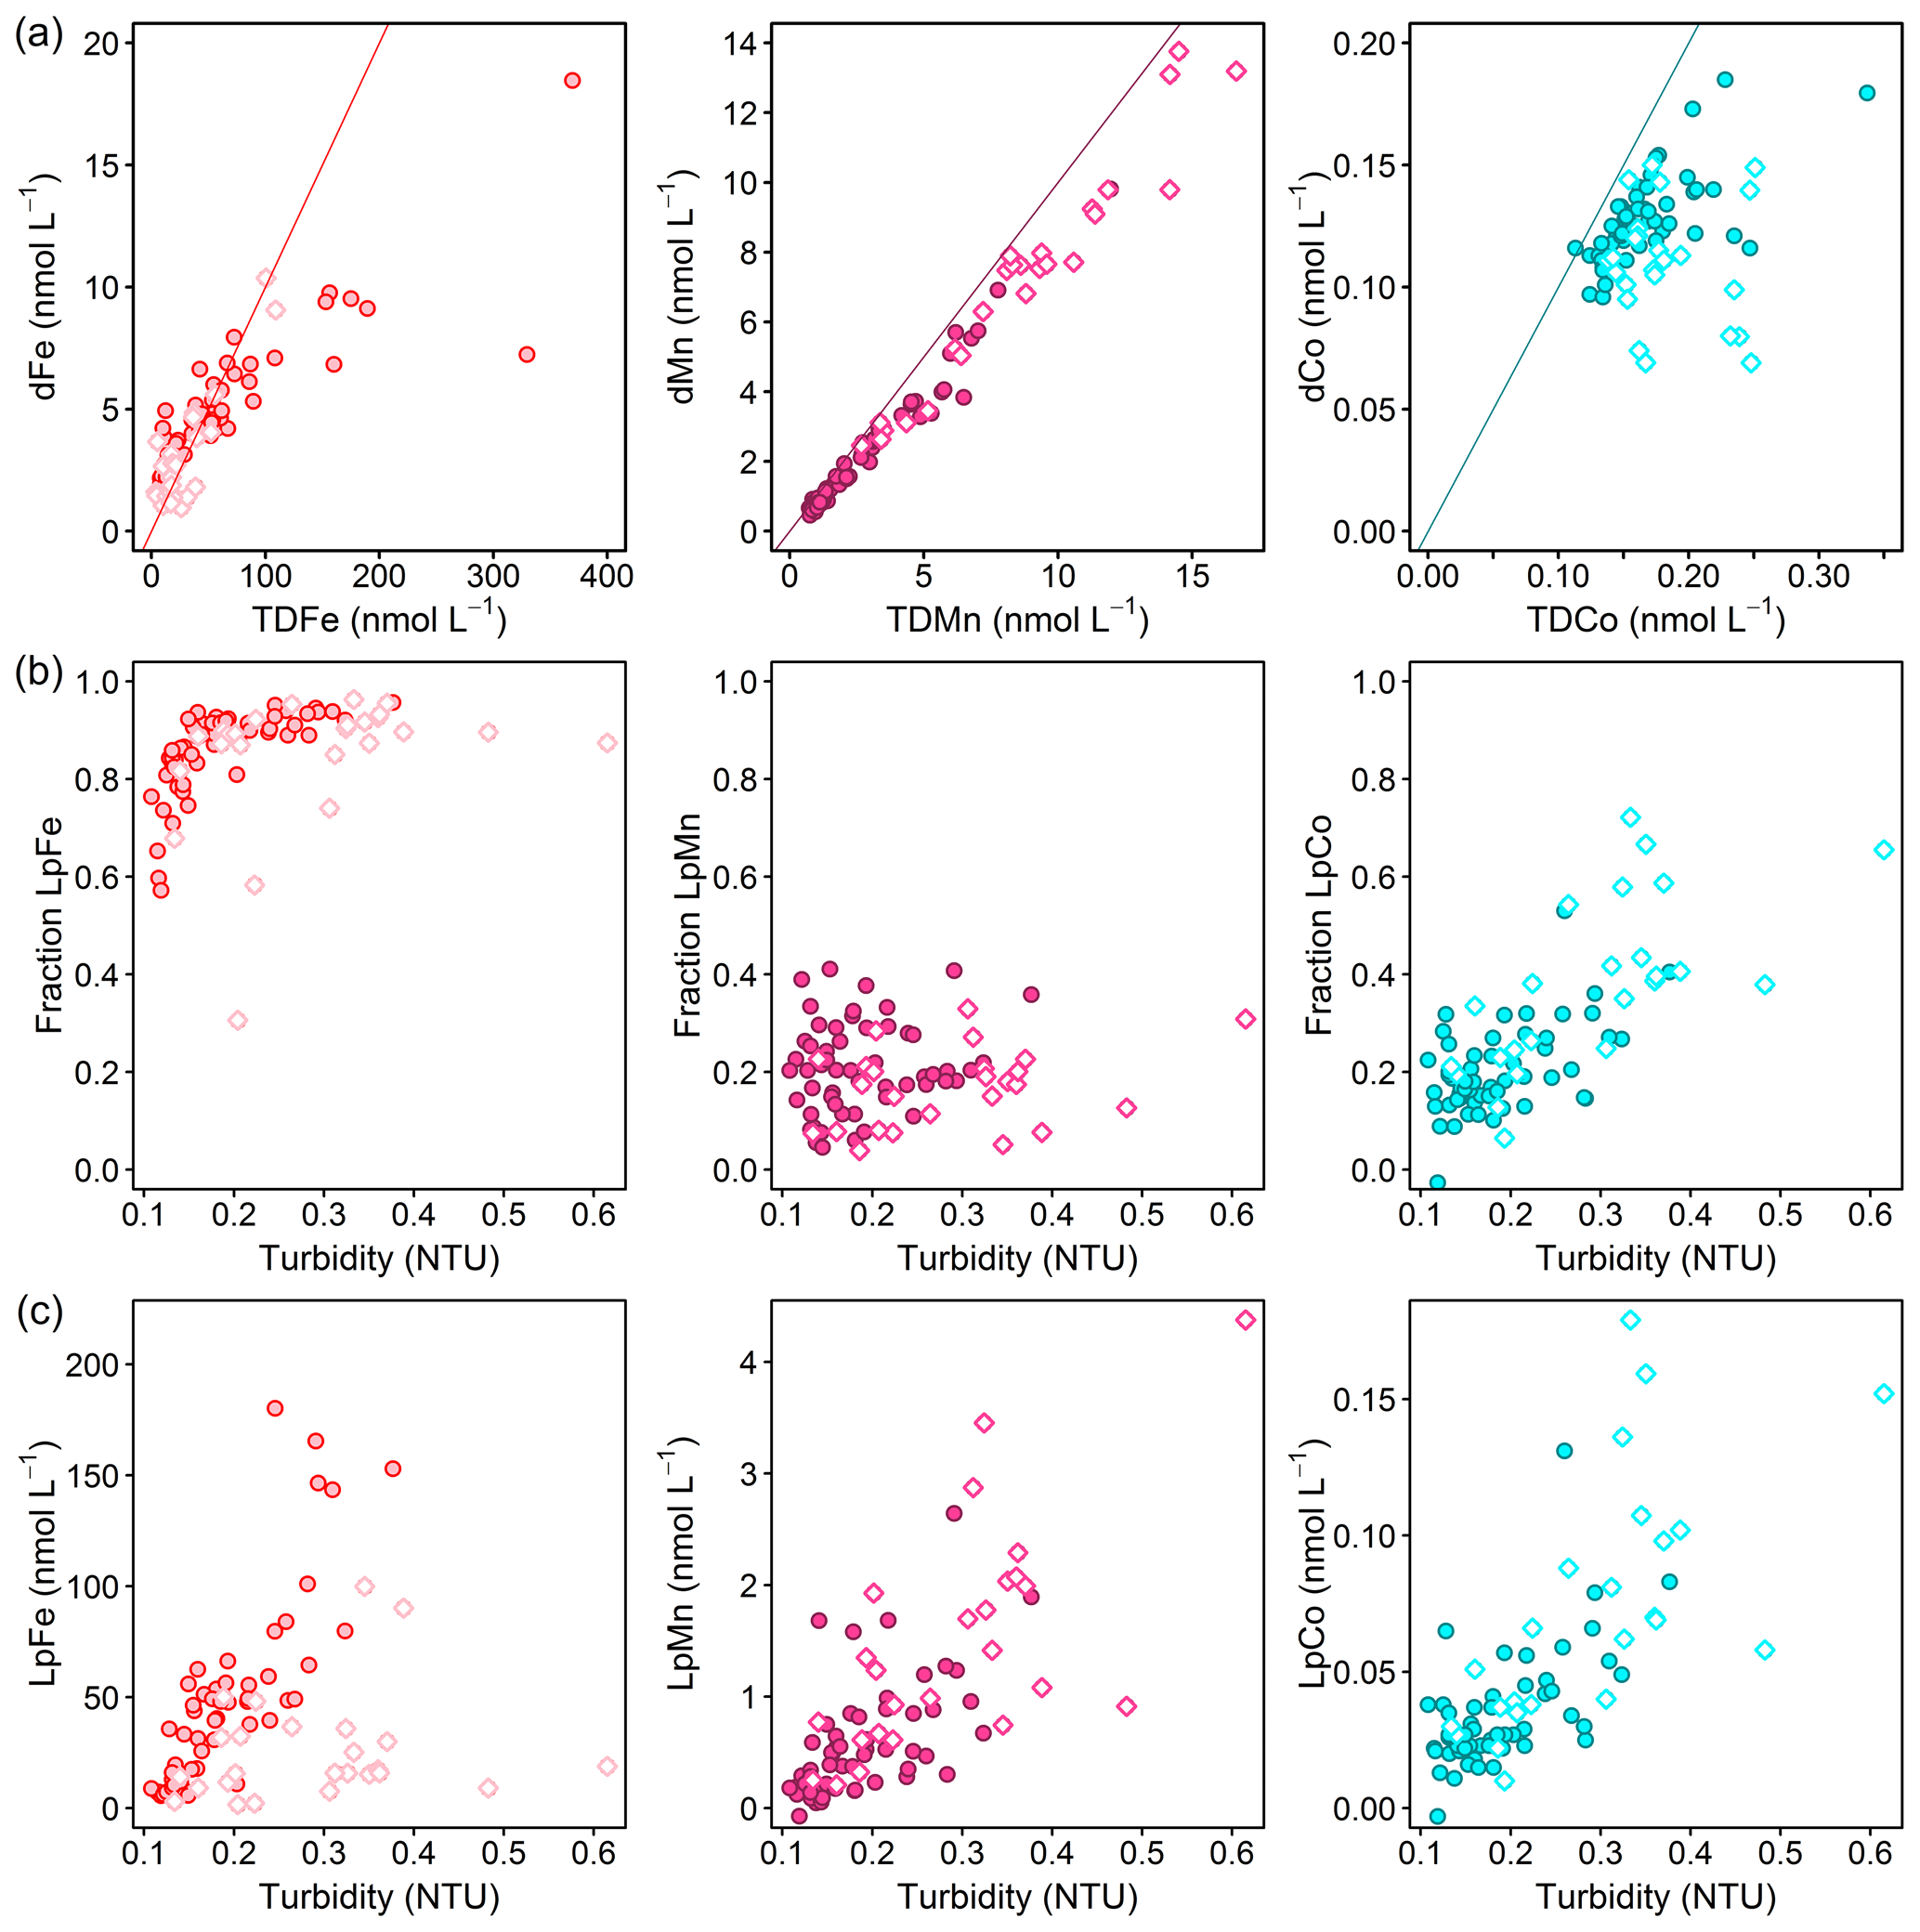
Figure 6(a) Dissolved against total dissolvable trace-metal concentrations for Fe (left; red line: TDFe = 10 ⋅ dFe), Mn (middle; purple line: TDMn = dMn), and Co (right; turquoise line: TDCo = dCo). (b) Fraction of leachable particulate trace metals (Lp∕TD) against turbidity and (c) leachable particulate concentrations against turbidity for Fe (left), Mn (middle), and Co (right). Filled circles display all data points below 50 m depth and open diamonds at depths shallower than 50 m.
The LpCo fraction ranged between 0 % and 75 %, and the fraction and concentration of LpCo showed linear increases with turbidity, indicating an influence of particle load on Co size fractionation, similar to Fe. In contrast to Fe and Co, the fraction of LpMn varied between 3 % and 40 % and did not show a correlation with turbidity, whereas LpMn concentrations showed an increase with turbidity. This indicates that an increased presence of particles coincided with enhanced LpMn levels, but that the particle load did not substantially influence the distribution between dMn and LpMn phases and particles therefore did not contribute to the dMn fraction. This suggests that particles did not play a major role in transport of dMn, which agrees with a study on hydrothermal vent plumes, where the distribution of the dMn plume was decoupled from the distribution of the particulate Mn plume (Fitzsimmons et al., 2017).
The increase in LpFe concentrations with increasing turbidity was weaker in the surface waters compared to water depths below 50 m (Fig. 6c). This suggests a large additional LpFe source at depth with either a higher Fe content of particles or the presence of different sizes of particles causing different responses in turbidity measurements. The large additional LpFe source at depth is likely associated with benthic dFe inputs, with a subsequent transfer to the particulate phase by scavenging. Enhanced turbidity at depth may also indicate sediment resuspension, which would result in the release of TM-containing particles from sediments and enhanced release of dTMs from sediment pore water. The effect of sediment resuspension is discussed in more detail below (Sect. 3.6.2).
In contrast to Fe, the increase in LpCo and LpMn concentrations with turbidity was similar in surface waters and below and suggests less variability in the composition of the particulate Co and Mn phase throughout the water column with a potentially weaker influence of sediment release on the distribution of particulate Mn and Co. A weaker influence of sediment release might be influenced by a weaker release of Co and Mn from sediments in the dissolved form and slower oxidation rates compared to Fe, in particular for Co (Noble et al., 2012), resulting in a slower conversion into the particulate phase. Such an interpretation based on turbidity data alone, however, is very hypothetical and would require further investigation of particulate TM species composition in this area.
3.6 Temporal variability in redox-sensitive trace metals
Large temporal changes in O2, turbidity, and redox-sensitive TMs were observed within a short timescale of a few days at two repeat stations, station 3A/3B and station 8A/8B (Figs. 7 and S5).
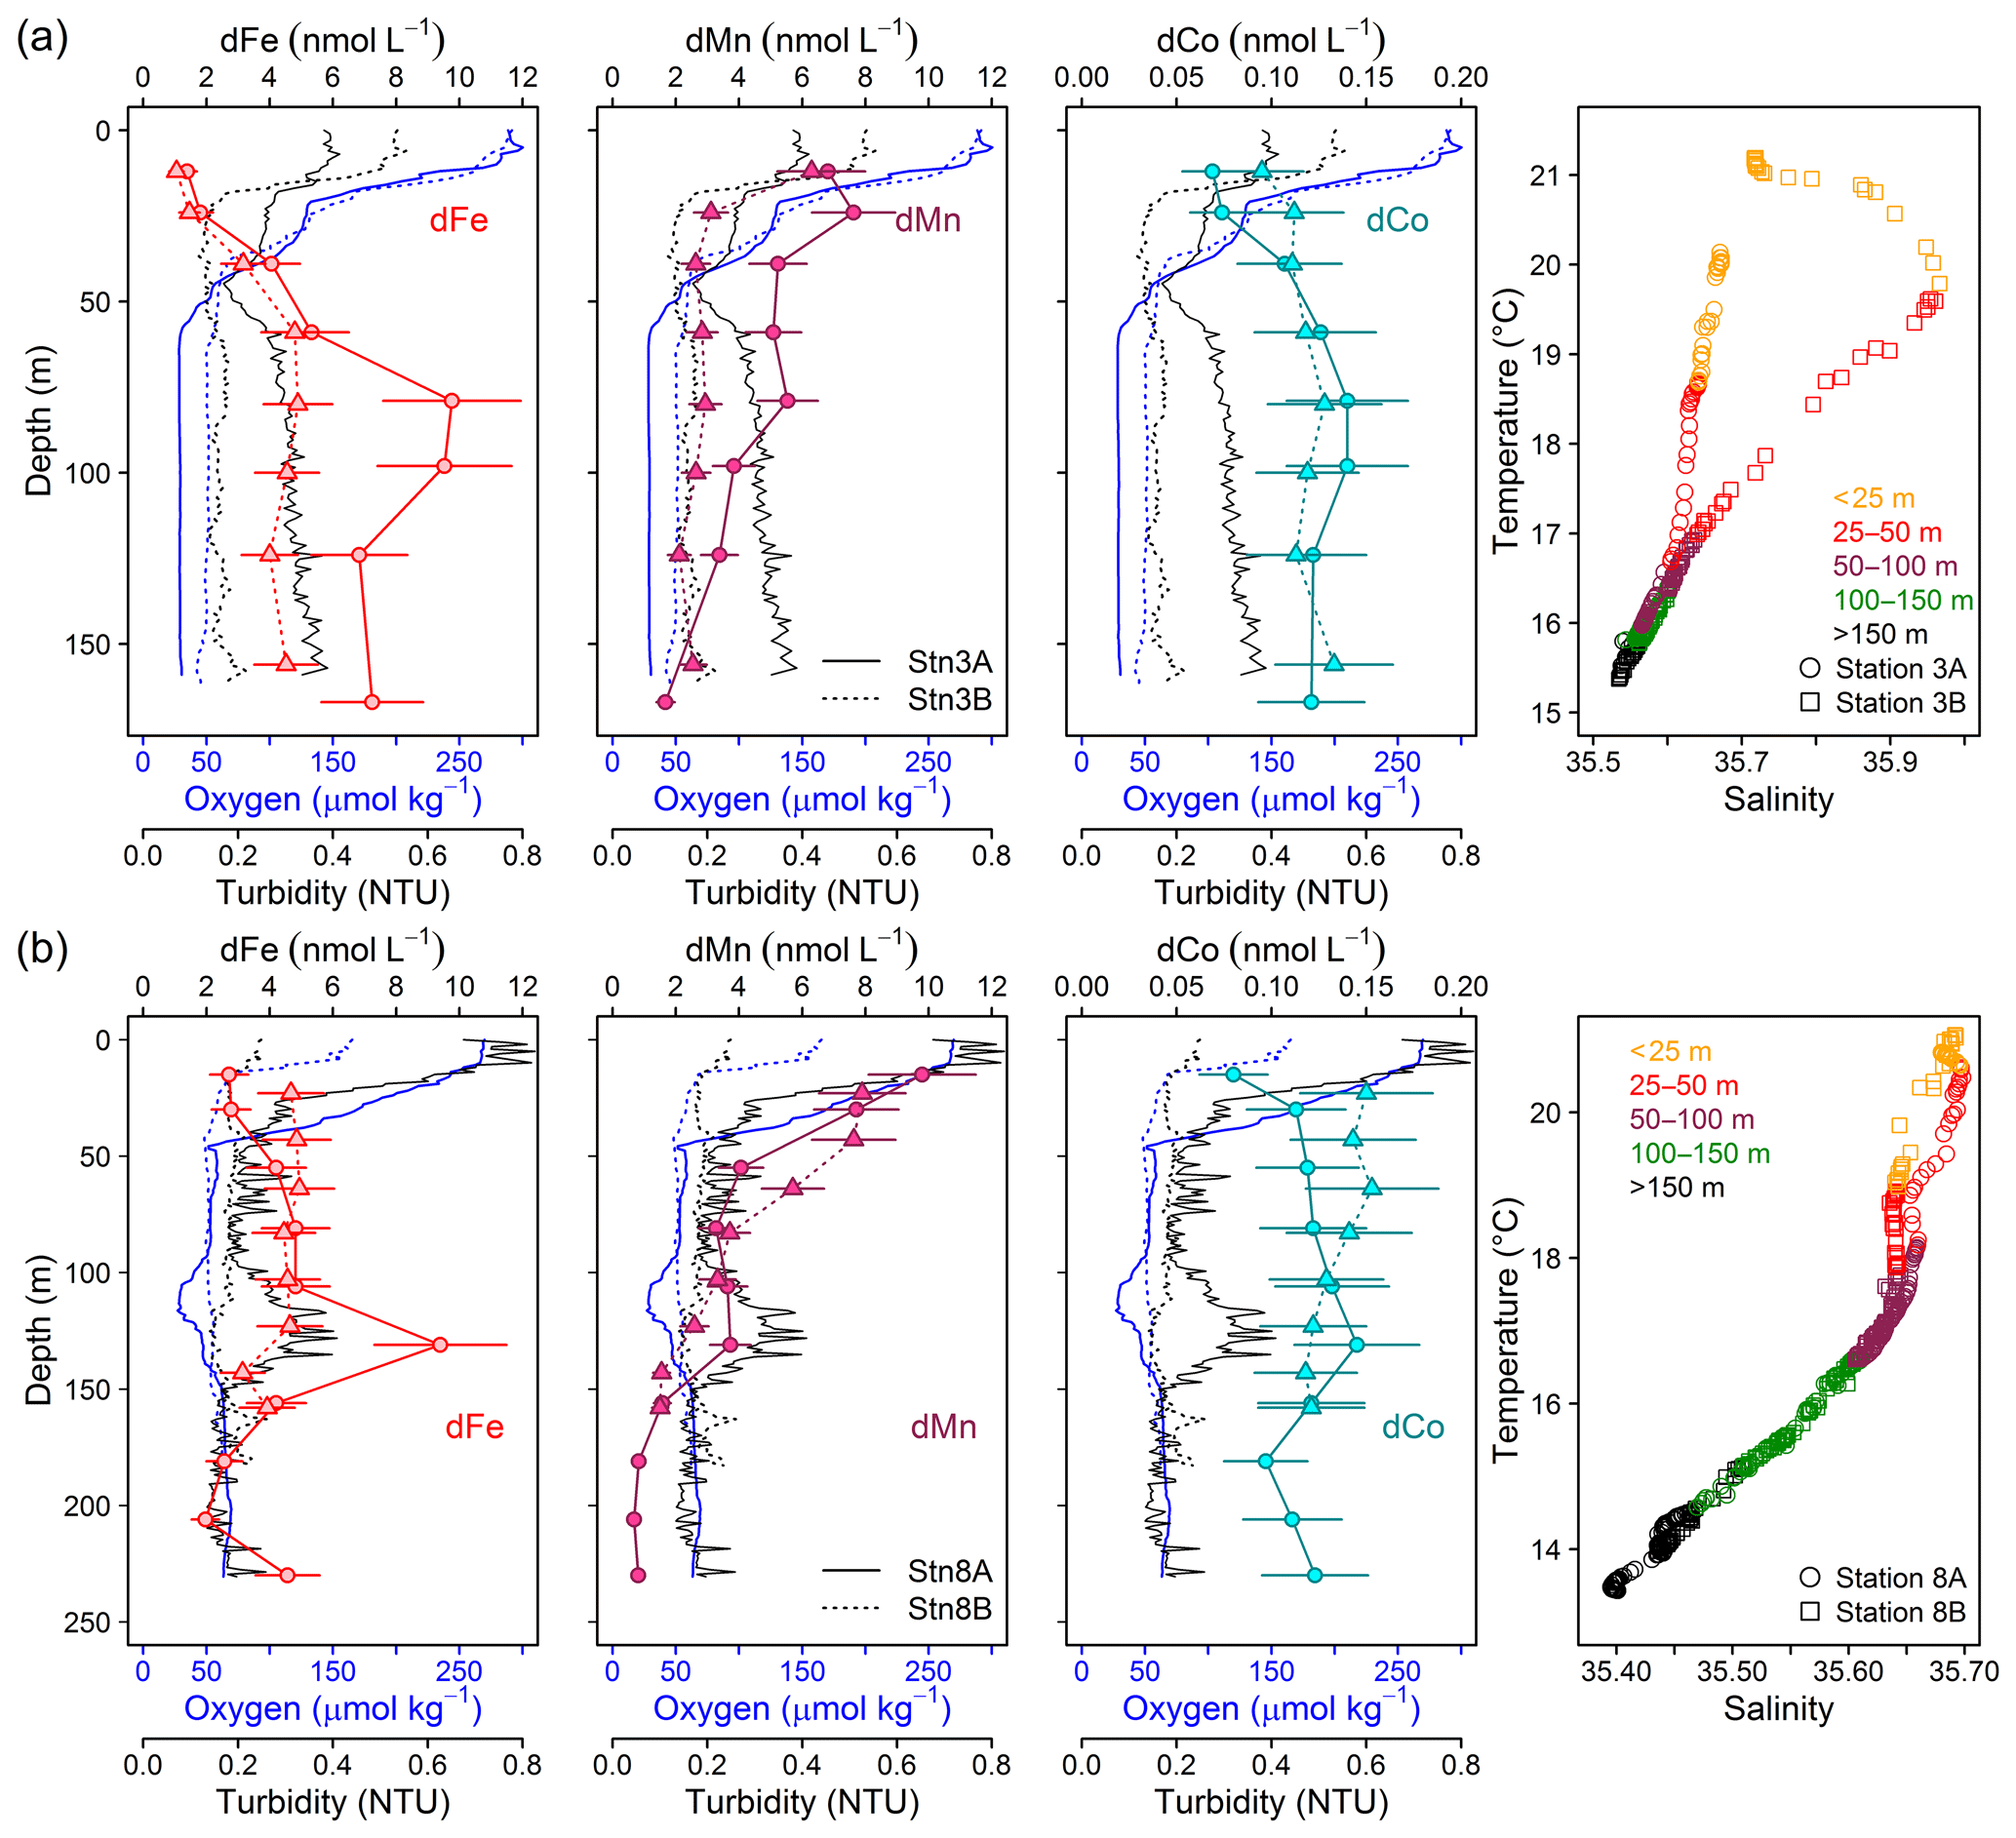
Figure 7Repeat stations: oxygen concentration, turbidity, and dissolved trace metals (Fe, Mn, and Co) and temperature vs. salinity plots. First deployment displayed as solid line and circles and second deployment displayed as dashed line and triangles. (a) Station 3 (18.23∘ N, 16.52∘ W; 170 m water depth, 9 d between deployments). (b) Station 8 (18.22∘ N, 16.55∘ W; 189–238 m water depth, 2 d between deployments).
Stations 3 and 8 were sampled twice with a period of 9 d between both deployments for station 3 (Fig. 7a) and 2 d for station 8 (Fig. 7b). At station 3, O2 concentrations in the upper 50 m were very similar between both deployments, whereas below 50 m O2 increased from 30 µmol kg−1 during the first deployment to 50 µmol kg−1 9 d later. At the same time, turbidity below 50 m had decreased from 0.35 to below 0.2, and dFe concentrations from a maximum of 10 to 5 nmol L−1 9 d later. In addition, dMn and dCo concentrations decreased from 5 to 3 and from 0.14 to 0.12 nmol L−1, respectively. Particularly large changes were also observed for LpTM concentrations with a decrease from 147–322 to 31–51 nmol L−1 for LpFe, from 0.066–0.114 to 0.015–0.031 nmol L−1 for LpCo and from 1.24–2.64 to 0.16–0.54 nmol L−1 for LpMn. In contrast, no changes in temperature and salinity of the water parcel occurred below 50 m (Fig. 7a). Similar changes in O2 and turbidity were observed at station 8. During the first deployment a local minimum in O2 below 30 µmol kg−1 was present between 105 and 120 m water depths which coincided with a maximum in turbidity of 0.4 (Fig. 7b). In contrast O2 concentrations and turbidity during the second deployment were relatively constant (50–60 µmol kg−1 O2 and turbidity 0.2) below 50 m. At the depth of the local O2 minimum and turbidity maximum, concentrations of dFe, dMn, and dCo were elevated during the first deployment with concentrations of 9.4±2.1 nmol dFe L−1, 3.7±0.6 nmol dMn L−1, and 0.145±0.033 nmol dCo L−1 in comparison to 4.6±1.0 nmol dFe L−1, 2.6±0.5 nmol dMn L−1, and 0.122±0.028 nmol dCo L−1 at similar depth during the second deployment.
3.6.1 Remineralization
We compared the results of the redox-sensitive TMs to other nutrient-like TMs and PO4. For both repeat stations only small changes in dCd (Stn. 3A: 0.107–0.231 nmol L−1; Stn. 3B: 0.135–0.150 nmol L−1) and PO4 (Stn. 3A: 1.59–1.85 µmol L−1; Stn. 3B: 1.55–1.71 µmol L−1) concentrations were observed below 50 m (Fig. 8), suggesting that only a small fraction of dFe under lower O2 conditions was supplied by more intense remineralization of biogenic particles in the water column.
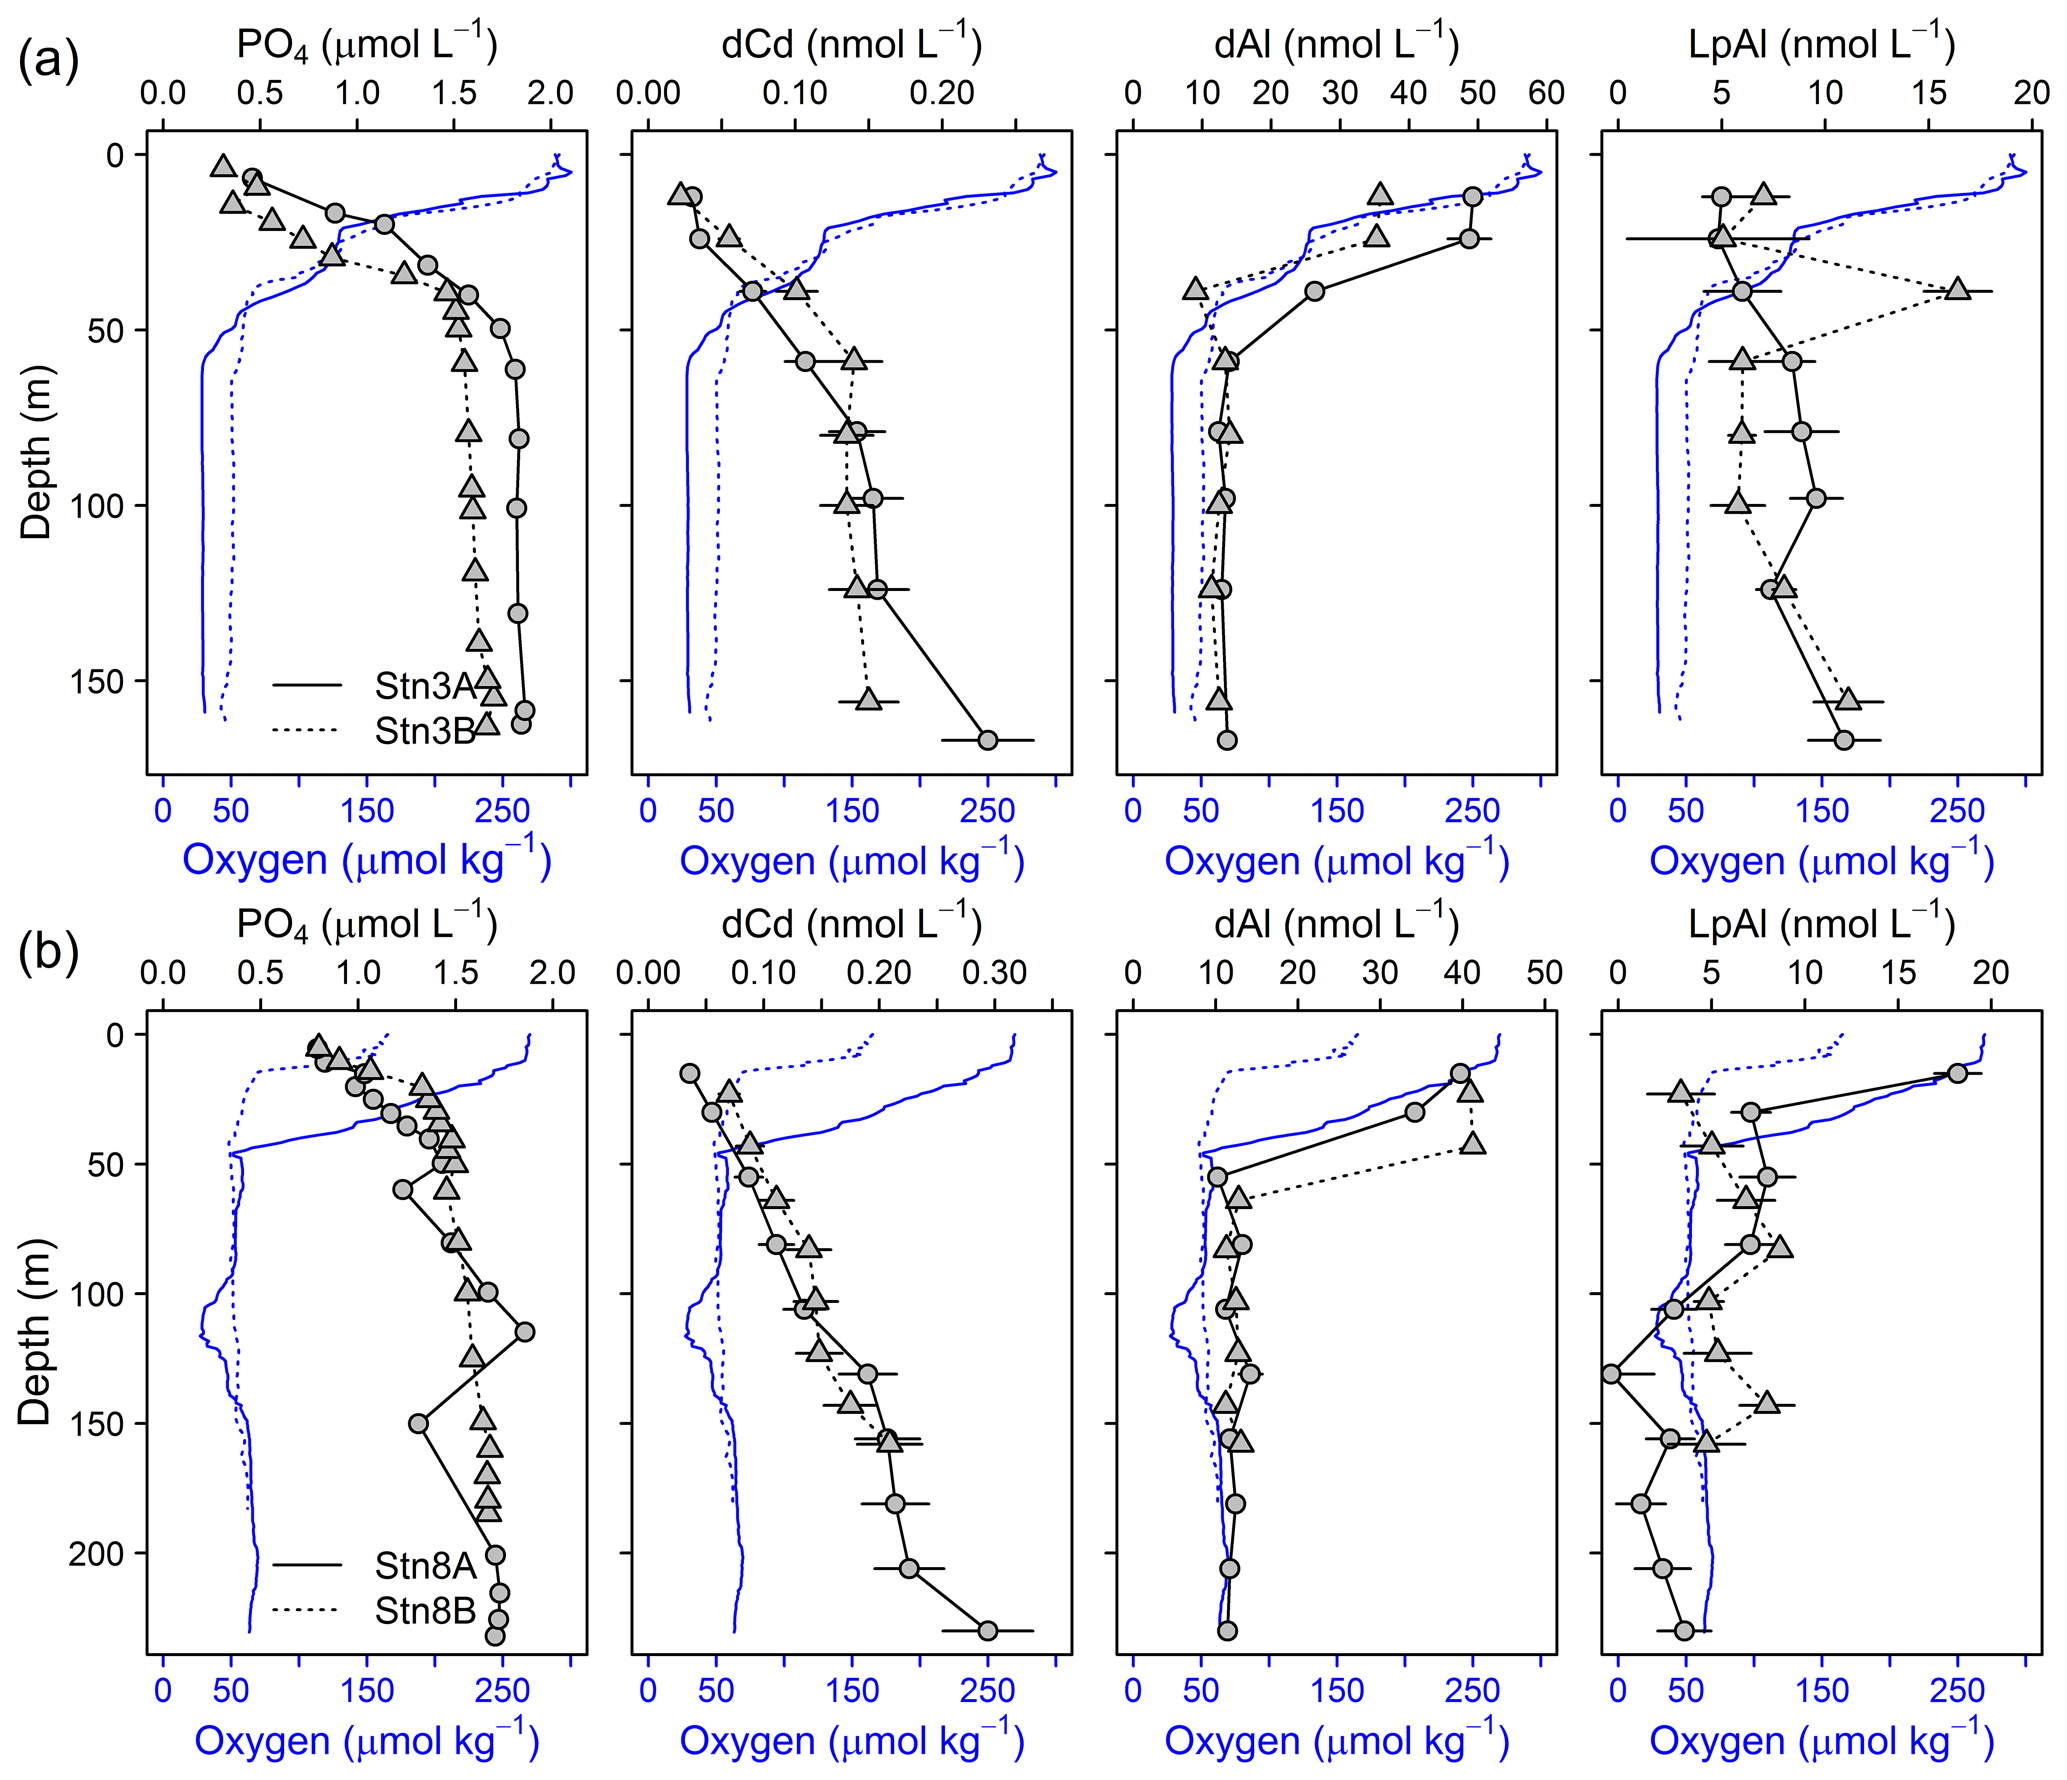
Figure 8Depth profiles of dCd, PO4, dAl, and LpAl of repeat stations. First deployment displayed as solid black line and circles and second deployment displayed as dashed black line and triangles. Oxygen concentrations are indicated as blue solid line for the first deployment and dashed blue line for the second deployment. (a) Station 3 (18.23∘ N, 16.52∘ W; 170 m water depth, 9 d between deployments) and (b) station 8 (18.22∘ N, 16.55∘ W; 189–238 m water depth, 2 d between deployments).
A weak influence of remineralization processes on the variability in dFe concentrations was confirmed by substantially higher dFe∕C ratios at lower O2 concentrations (40–72 µmol mol−1 at Stn. 3A compared to 33–41 µmol mol−1 at Stn. 3B, both below 50 m water depth). Assuming a dFe∕C ratio of around 12 (see Sect. 3.4.1) from remineralization, only about 0.25 nmol L−1 of the difference in dFe concentrations between repeated deployments can be explained by the difference in remineralization, suggesting that most of the difference in dFe between deployments was caused by changes in source inputs, such as enhanced sediment release during lower bottom water O2 concentrations or slower removal by oxidation under lower O2 conditions.
In contrast, dCo∕C ratios were similar between repeat deployments within the OMZ (0.90–1.04 at Stn. 3A and 0.92–1.06 µmol mol−1 at Stn. 3B). Thus, remineralization could be a reason for the changes in observed dCo concentrations during repeated deployments. This is in accordance with the previously observed correlation for dCo with in addition to O2 (Baars and Croot, 2015; Saito et al., 2017). However, we observed a very low Pearson correlation of dCo with PO4 of only 0.15 compared to oxygen (−0.58) (Supplement Table S1) below 50 m water depth, suggesting a stronger influence of oxygen than remineralization on the overall distribution of dCo for our study area.
Similar to Fe, higher dMn∕C ratios were observed at lower O2 concentrations (3.4–5.5 µmol mol−1 at Stn. 3A compared to 2.1–2.9 µmol mol−1 at Stn. 3B). These results indicate that processes other than remineralization are also important for the change in dMn concentrations. An additional factor compared to Fe might involve changes in intensity of photoreduction which may be influenced by differences in surface turbidity observed at station 3 (lower dMn∕C and higher surface turbidity during second deployment). This, however, cannot explain the changes in dMn∕C at station 8, where a higher surface turbidity coincided with a higher dMn∕C ratio at the local minimum in O2.
3.6.2 Atmospheric dust deposition and sediment resuspension
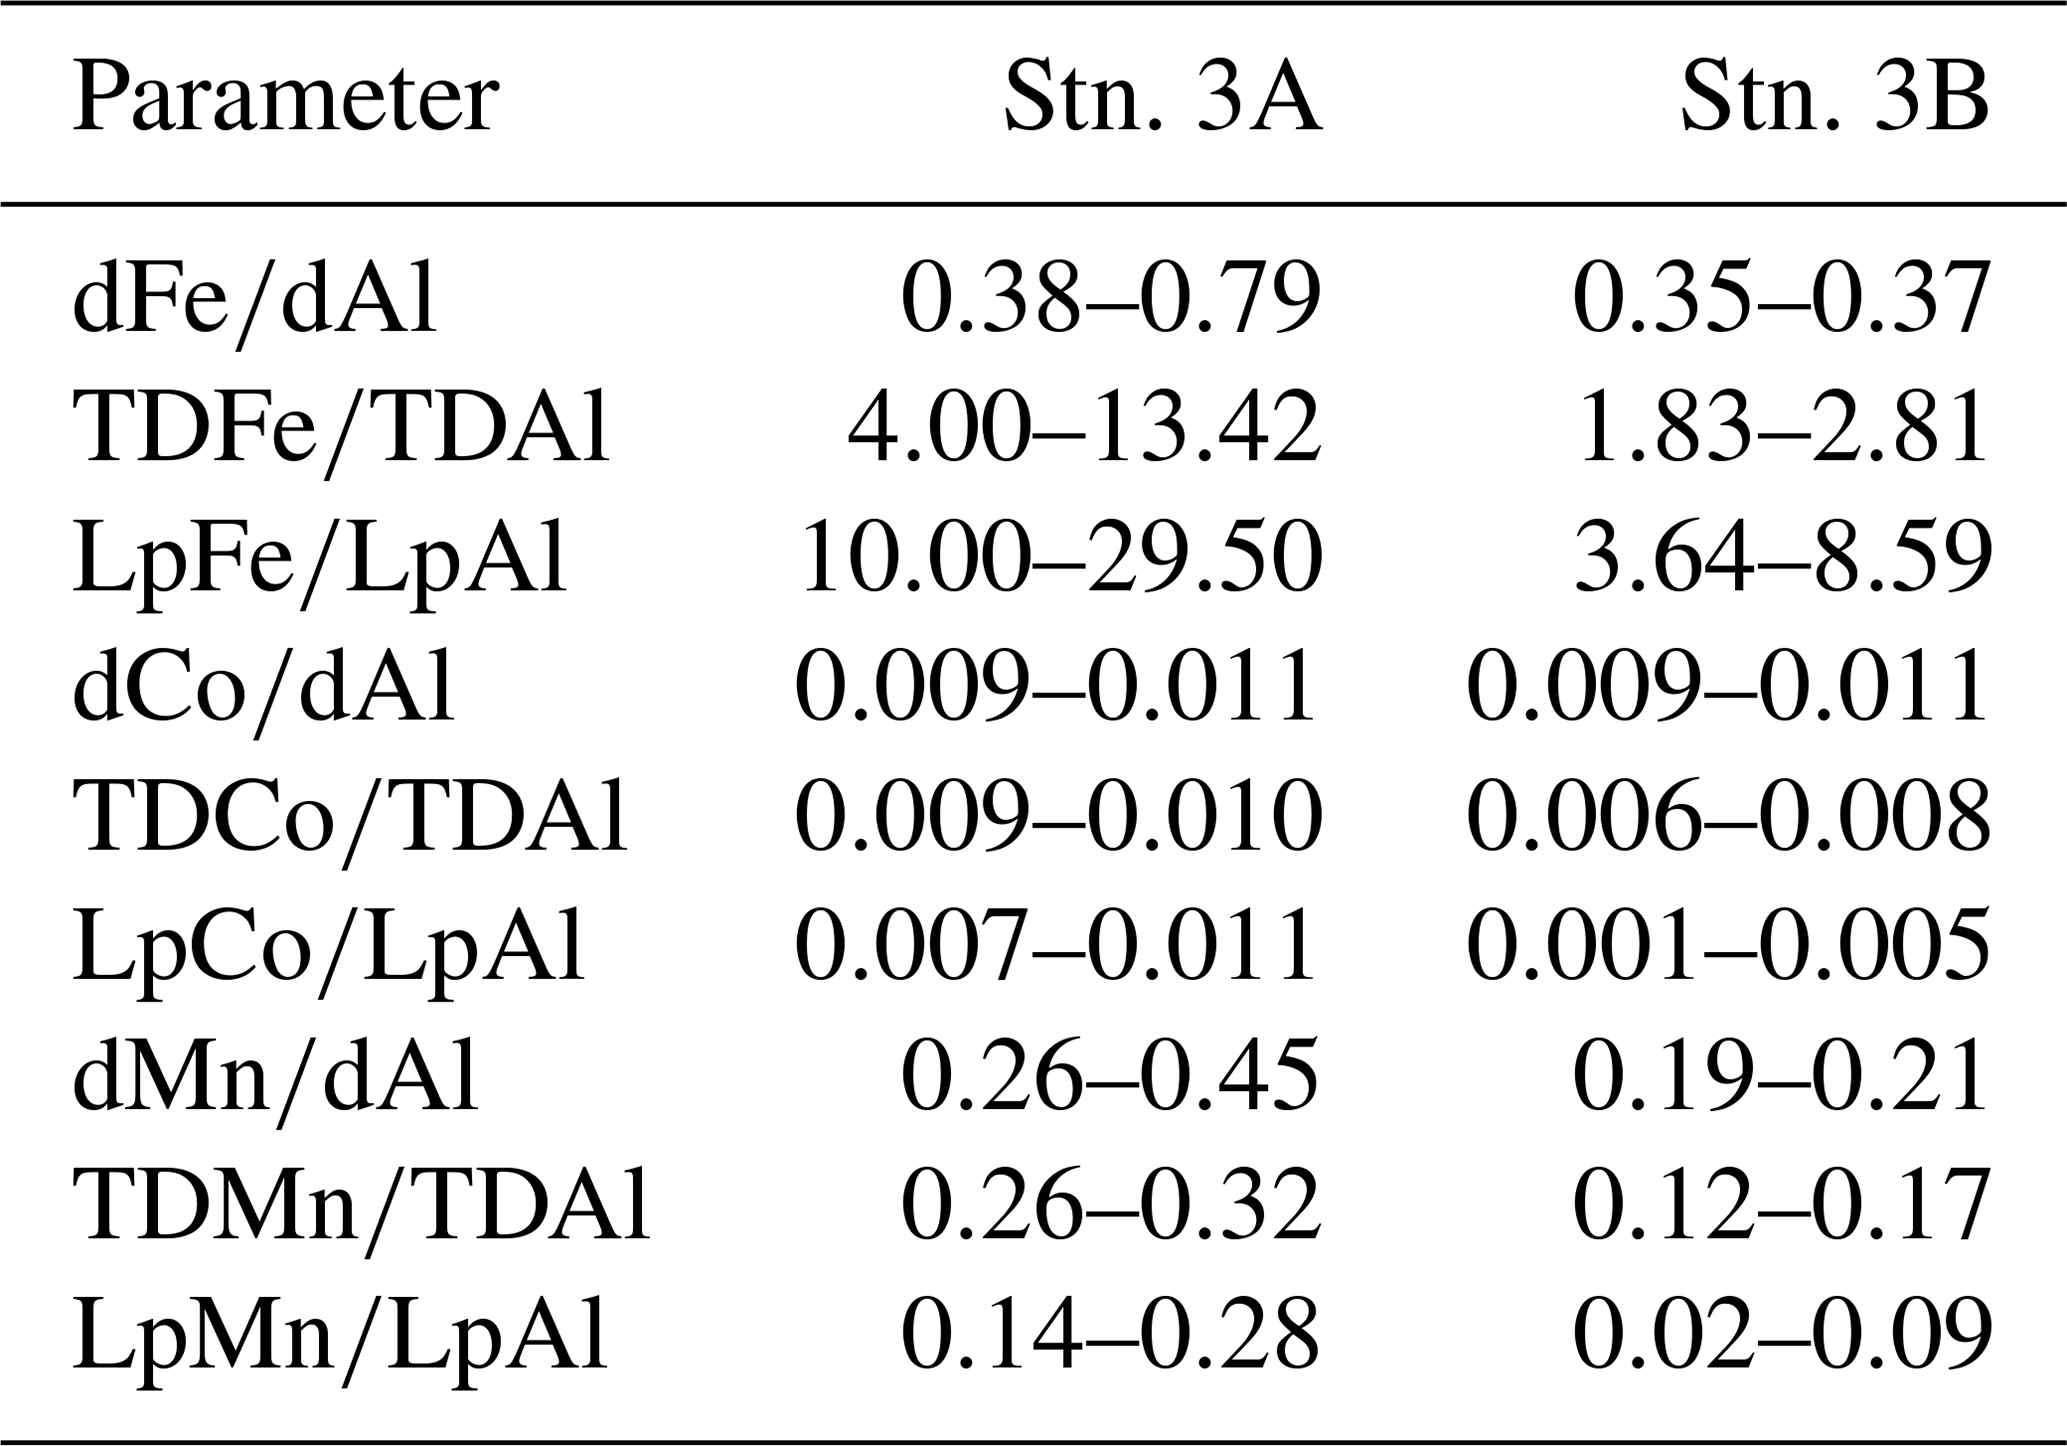
Within the OMZ at stations 3 and 8, dAl concentrations ranged between 10 and 15 nmol L−1, LpAl concentrations between 1.2 and 11.1 nmol L−1, and no substantial changes were observed between deployments (Fig. 8). As lithogenic material has a high-Al content, no substantial changes in Al concentrations signify that lithogenic inputs did not differ greatly between the deployments. Consequently, neither increased atmospheric input nor sediment resuspension is likely to explain the differences in turbidity and redox-sensitive TM concentrations. Hence, changes in turbidity may mainly have been caused by biogenic particles, such as resuspended organic matter (Thomsen et al., 2019). This finding can be confirmed by substantial changes in TM∕Al ratios observed during the deployments (Table 2 and Fig. S6). The Fe∕Al ratios in the solid phase of underlying sediments during the cruise were 0.23–0.30 (Schroller-Lomnitz et al., 2019) with Mn∕Al ratios of 0.0015–0.0020 (Ulrike Schroller-Lomnitz, personal communication, 2018). Slight increases in LpAl towards the sediment indicate some influence of sediment resuspension on the TM distribution. Overall, much higher TM∕Al ratios compared to ratios in the sediments and aerosol samples from this region (Fe∕Al: 0.37±0.02, Co∕Al: 0.00016±0.00002, Mn∕Al: 0.0061±0.0002; Shelley et al., 2015) suggest a large additional source of Fe, Co, and Mn in the OMZ close to the shelf. This again points towards a large influence of benthic release of Fe, Co, and Mn from sediment pore waters and subsequent partial adsorption to particle surfaces.
Table 2TM∕Al ratios of different fractions for the repeated deployments at station 3 within the OMZ below 50 m water depth.
3.6.3 Other possible causes for TM variability
From the comparison above, we can conclude that the variations in Fe concentrations during repeated deployments were not caused by increased remineralization or changes in lithogenic inputs from atmospheric deposition or sediment resuspension. The large changes in the Lp fractions must therefore be of biogenic or authigenic origin. If all LpCo would be present in biogenic particles of suspended phytoplankton cells, at our observed maximum of 0.114 nmol L−1 LpCo at station 3A, we would expect around 4.6 nmol L−1 LpFe in sinking phytoplankton, using an average Fe∕Co ratio in phytoplankton of 40 (Moore et al., 2013) (observed ratios close to our study area were 20–40; Twining et al., 2015). However, LpFe concentrations were 322 nmol L−1 and thereby 70 times larger than our estimate in biogenic particles (4.6 nmol L−1), revealing that the majority of LpFe must be authigenically formed. Altogether our results suggest that changes in particle load as indicated by changes in turbidity do not comprise a major source of dFe but a sink of previously dissolved Fe. Therefore, higher dissolved and Lp concentrations during the first deployment with lower O2 concentrations must be caused by a stronger benthic source of dissolved Fe.
It is not possible to extract from our data whether the stronger benthic source under low-O2 conditions is directly driven by lower O2 concentrations in surface sediments and in the water column resulting in higher benthic Fe fluxes and slower oxidation rates in the water column, or by a longer residence time of the water mass on the shelf. However, increased benthic fluxes are in accordance with previous findings from ex situ sediment incubation experiments, where Fe fluxes increased with decreasing O2 concentrations (Homoky et al., 2012). Therefore, we hypothesize that with a reduction of bottom water O2 concentrations from 50 to 30 µmol kg−1, drastically more Fe is effectively released from the sediments by diminished oxidation rates at the sediment–water interface and that a large fraction gets directly adsorbed onto particles. Therefore, particles do not compose a major source of Fe here but may play an important role in Fe offshore transport.
Due to much lower changes in concentrations of dissolved and LpCo, and the additional effect of photoreduction and strong scavenging for Mn, we were unable to resolve the main mechanisms for changes in Co and Mn concentrations with changes in O2 and turbidity. Nevertheless, due to their similar redox-sensitive behavior and distribution in OMZs, it is likely that they are also affected by reduced O2 conditions. The magnitude of response, however, is much lower.
Sediments are an important source of Fe, Co, and Mn to OMZ waters in the Mauritanian shelf region. Remineralization and atmospheric deposition appear less important than benthic sources for dFe, with vertical fluxes exceeding atmospheric fluxes but gaining importance with distance from shelf. However, deposition of atmospheric dust is a source of Fe to sediments in our study region and consequently indirectly contributes to benthic-released TMs. We showed that changes in O2 concentrations from 30 to 50 µmol kg−1 had a substantial influence on dissolved and LpFe concentrations and to a lesser extent on Co and Mn concentrations by decreasing the sediment source strength. The presence of a large part of sediment-derived Fe in the leachable particulate phase highlights the importance of offshore particle transport on the Fe inventory, including the dissolved form by reversible scavenging. To our knowledge, this is the first field study that demonstrated strong short-term variability in redox-sensitive TMs over a few days to be directly linked to changes in O2. These findings demonstrate that projected long-term changes in oceanic O2 concentrations will impact biogeochemical cycles and have important implications for global TM distributions and their process parameterizations in biogeochemical models. Current models do not account for small changes in O2 on TM distributions and benthic TM fluxes. Determining the processes involved and quantifying the effect of O2 will be crucial for the implementation into current modeling approaches. Not all processes could be resolved in this study, including the influence of the residence time of the water masses on the shelf compared to the direct influence of O2, and it is unclear whether the changes observed on a small scale are readily transferable to a global scale. Therefore, we suggest further investigations on short-term variability in O2 and particle load in the Mauritanian and other dynamic OMZs including water column TM measurements in combination with benthic TM fluxes and more detailed analysis of the amount, types, and composition of present particles.
The CTD sensor and nutrient bottle data are freely available at https://doi.org/10.1594/PANGAEA.860480 (Krahmann et al., 2016) and https://doi.org/10.1594/PANGAEA.885109 (Sommer and Dengler, 2018), respectively. According to the SFB754 data policy (https://www.sfb754.de/de/data), all remaining data (trace metal data set) associated with this article are available at https://doi.pangaea.de/10.1594/PANGAEA.907160 (Rapp, 2019).
The supplement related to this article is available online at: https://doi.org/10.5194/bg-16-4157-2019-supplement.
IR analyzed the trace-metal concentrations and drafted the article. EPA and MG designed the project and CS carried out the trace-metal sampling at sea. JLMB oversaw, and BW carried out, the aluminum sample analysis. MD carried out the microstructure measurements at sea, oversaw the calculation of the vertical flux estimates, and contributed to the writing of the article. JL carried out the processing of microstructure data and calculation of the eddy diffusivity. JS, BG, and PR carried out the radium isotope analysis and their interpretation. IR and MG oversaw, and Fabian Wolf carried out, the iodide analysis. All co-authors commented on the article.
The authors declare that they have no conflict of interest.
The authors would like to thank the captain and the crew from RV Meteor and chief scientist Stefan Sommer from the M107 cruise. This work was funded by the Deutsche Forschungsgemeinschaft as part of Sonderforschungsbereich (SFB) 754: “Climate-Biogeochemistry Interactions in the Tropical Ocean”. Fabian Wolf is thanked for carrying out the analysis of iodide and Peter Streu for help with the general lab work. The International Atomic Energy Agency is grateful to the government of the principality of Monaco for the support provided to its environment laboratories. Analyses and visualizations of aerosol optical depth (see the Supplement) were produced with the Giovanni online data system, developed and maintained by NASA GES DISC.
The article processing charges for this open-access publication were covered by a Research Centre of the Helmholtz Association.
This paper was edited by Marilaure Grégoire and reviewed by two anonymous referees.
Abadie, C., Lacan, F., Radic, A., Pradoux, C., and Poitrasson, F.: Iron isotopes reveal distinct dissolved iron sources and pathways in the intermediate versus deep Southern Ocean, P. Natl. Acad. Sci. USA, 114, 858–863, https://doi.org/10.1073/pnas.1603107114, 2017.
Achterberg, E. P., Steigenberger, S., Marsay, C. M., LeMoigne, F. A. C., Painter, S. C., Baker, A. R., Connelly, D. P., Moore, C. M., Tagliabue, A., and Tanhua, T.: Iron Biogeochemistry in the High Latitude North Atlantic Ocean, Sci. Rep.-UK, 8, https://doi.org/10.1038/s41598-018-19472-1, 2018.
Baars, O. and Croot, P. L.: Dissolved cobalt speciation and reactivity in the eastern tropical North Atlantic, Mar. Chem., 173, 310–319, https://doi.org/10.1016/j.marchem.2014.10.006, 2015.
Baker, A. R., Adams, C., Bell, T. G., Jickells, T. D., and Ganzeveld, L.: Estimation of atmospheric nutrient inputs to the Atlantic Ocean from 50∘ N to 50∘ S based on large-scale field sampling: Iron and other dust-associated elements, Global Biogeochem. Cy., 27, 755–767, https://doi.org/10.1002/gbc.20062, 2013.
Balistrieri, L., Brewer, P. G., and Murray, J. W.: Scavenging residence times of trace metals and surface chemistry of sinking particles in the deep ocean, Deep-Sea Res. Pt. A, 28, 101–121, https://doi.org/10.1016/0198-0149(81)90085-6, 1981.
Barton, E. D.: The Poleward Undercurrent On The Eastern Boundary Of The Subtropical North Atlantic, in: Poleward Flows Along Eastern Ocean Boundaries, edited by: Neshyba, S. J., Mooers, C. N. K., Smith, R. L., and Barber, R. T., Springer-Verlag, New York, https://doi.org/10.1029/CE034, 1989.
Barton, E. D., Aristegui, J., Tett, P., Canton, M., Garcia-Braun, J., Hernandez-Leon, S., Nykjaer, L., Almeida, C., Almunia, J., Ballesteros, S., Basterretxea, G., Escanez, J., Garcia-Weill, L., Hernandez-Guerra, A., Lopez-Laatzen, F., Molina, R., Montero, M. F., Navarro-Perez, E., Rodriguez, J. M., van Lenning, K., Velez, H., and Wild, K.: The transition zone of the Canary Current upwelling region, Prog. Oceanogr., 41, 455–504, https://doi.org/10.1016/S0079-6611(98)00023-8, 1998.
Beck, A. J., Tsukamoto, Y., Tovar-Sanchez, A., Huerta-Diaz, M., Bokuniewicz, H. J., and Sanudo-Wilhelmy, S. A.: Importance of geochemical transformations in determining submarine groundwater discharge-derived trace metal and nutrient fluxes, Appl. Geochem., 22, 477–490, https://doi.org/10.1016/j.apgeochem.2006.10.005, 2007.
Biller, D. V. and Bruland, K. W.: Sources and distributions of Mn, Fe, Co, Ni, Cu, Zn, and Cd relative to macronutrients along the central California coast during the spring and summer upwelling season, Mar. Chem., 155, 50–70, https://doi.org/10.1016/j.marchem.2013.06.003, 2013.
Boyd, P. W.: Biogeochemistry – Iron findings, Nature, 446, 989–991, https://doi.org/10.1038/446989a, 2007.
Boyle, E. A., Lee, J.-M., Echegoyen, Y., Noble, A., Moos, S., Carrasco, G., Zhao, N., Kayser, R., Zhang, J., and Gamo, T.: Anthropogenic lead emissions in the ocean: The evolving global experiment, Oceanography, 27, 69–75, https://doi.org/10.5670/oceanog.2014.10, 2014.
Brandt, P., Bange, H. W., Banyte, D., Dengler, M., Didwischus, S.-H., Fischer, T., Greatbatch, R. J., Hahn, J., Kanzow, T., Karstensen, J., Körtzinger, A., Krahmann, G., Schmidtko, S., Stramma, L., Tanhua, T., and Visbeck, M.: On the role of circulation and mixing in the ventilation of oxygen minimum zones with a focus on the eastern tropical North Atlantic, Biogeosciences, 12, 489–512, https://doi.org/10.5194/bg-12-489-2015, 2015.
Bridgestock, L., van de Flierdt, T. V., Rehkamper, M., Paul, M., Middag, R., Milne, A., Lohan, M. C., Baker, A. R., Chance, R., Khondoker, R., Strekopytov, S., Humphreys-Williams, E., Achterberg, E. P., Rijkenberg, M. J. A., Gerringa, L. J. A., and de Baar, H. J. W.: Return of naturally sourced Pb to Atlantic surface waters, Nat. Commun., 7, 12921, https://doi.org/10.1038/ncomms12921, 2016.
Browning, T. J., Achterberg, E. P., Rapp, I., Engel, A., Bertrand, E. M., Tagliabue, A., and Moore, C. M.: Nutrient co-limitation at the boundary of an oceanic gyre, Nature, 551, 242–246, https://doi.org/10.1038/nature24063, 2017.
Bruland, K. W. and Lohan, M. C.: Controls of Trace Metals in Seawater, in: The Oceans and Marine Geochemistry, edited by: Elderfield, H., Treatise on Geochemistry, Vol. 6, Elsevier, Oxford, 2006.
Buck, C. S., Landing, W. M., Resing, J. A., and Measures, C. I.: The solubility and deposition of aerosol Fe and other trace elements in the North Atlantic Ocean: Observations from the A16N CLIVAR/CO2 repeat hydrography section, Mar. Chem., 120, 57–70, https://doi.org/10.1016/j.marchem.2008.08.003, 2010.
Burdige, D. J.: The biogeochemistry of manganese and iron reduction in marine sediments, Earth-Sci. Rev., 35, 249–284, https://doi.org/10.1016/0012-8252(93)90040-E, 1993.
Capet, X. J., Marchesiello, P., and McWilliams, J. C.: Upwelling response to coastal wind profiles, Geophys. Res. Lett., 31, L13311, https://doi.org/10.1029/2004GL020123, 2004.
Chaillou, G., Anschutz, P., Lavaux, G., Schafer, J., and Blanc, G.: The distribution of Mo, U, and Cd in relation to major redox species in muddy sediments of the Bay of Biscay, Mar. Chem., 80, 41–59, https://doi.org/10.1016/S0304-4203(02)00097-X, 2002.
Charette, M. A., Morris, P. J., Henderson, P. B., and Moore, W. S.: Radium isotope distributions during the US GEOTRACES North Atlantic cruises, Mar. Chem., 177, 184–195, https://doi.org/10.1016/j.marchem.2015.01.001, 2015.
Conway, T. M. and John, S. G.: Quantification of dissolved iron sources to the North Atlantic Ocean, Nature, 511, 212–215, https://doi.org/10.1038/nature13482, 2014.
Croot, P. L., Streu, P., and Baker, A. R.: Short residence time for iron in surface seawater impacted by atmospheric dry deposition from Saharan dust events, Geophys. Res. Lett., 31, L23S08, https://doi.org/10.1029/2004GL020153, 2004.
Cyr, F., Bourgault, D., Galbraith, P. S., and Gosselin, M.: Turbulent nitrate fluxes in the Lower St. Lawrence Estuary, Canada, J. Geophys. Res.-Oceans, 120, 2308–2330, https://doi.org/10.1002/2014jc010272, 2015.
Dale, A. W., Sommer, S., Ryabenko, E., Noffke, A., Bohlen, L., Wallmann, K., Stolpovsky, K., Greinert, J., and Pfannkuche, O.: Benthic nitrogen fluxes and fractionation of nitrate in the Mauritanian oxygen minimum zone (Eastern Tropical North Atlantic), Geochim. Cosmochim. Ac., 134, 234–256, https://doi.org/10.1016/j.gca.2014.02.026, 2014.
Dammshäuser, A., Wagener, T., and Croot, P. L.: Surface water dissolved aluminum and titanium: Tracers for specific time scales of dust deposition to the Atlantic?, Geophys. Res. Lett., 38, L24601, https://doi.org/10.1029/2011gl049847, 2011.
Desbiolles, F., Blanke, B., and Bentamy, A.: Short-term upwelling events at the western African coast related to synoptic atmospheric structures as derived from satellite observations, J. Geophys. Res.-Oceans., 119, 461–483, https://doi.org/10.1002/2013JC009278, 2014.
Desbiolles, F., Blanke, B., Bentamy, A., and Roy, C.: Response of the Southern Benguela upwelling system to fine-scale modifications of the coastal wind, J. Marine Syst., 156, 46–55, https://doi.org/10.1016/j.jmarsys.2015.12.002, 2016.
Elrod, V. A., Berelson, W. M., Coale, K. H., and Johnson, K. S.: The flux of iron from continental shelf sediments: A missing source for global budgets, Geophys. Res. Lett., 31, L12307, https://doi.org/10.1029/2004gl020216, 2004.
Eriksen, C. C.: Observations of internal wave reflection off sloping bottoms, J. Geophys. Res.-Oceans, 87, 525–538, https://doi.org/10.1029/JC087iC01p00525, 1982.
Fairall, C. W., Bradley, E. F., Hare, J. E., Grachev, A. A., and Edson, J. B.: Bulk Parameterization of Air–Sea Fluxes: Updates and Verification for the COARE Algorithm, J. Climate, 16, 571–591, https://doi.org/10.1175/1520-0442(2003)016<0571:BPOASF>2.0.CO;2, 2003.
Fitzsimmons, J. N., Zhang, R. F., and Boyle, E. A.: Dissolved iron in the tropical North Atlantic Ocean, Mar. Chem., 154, 87–99, https://doi.org/10.1016/j.marchem.2013.05.009, 2013.
Fitzsimmons, J. N., John, S. G., Marsay, C. M., Hoffman, C. L., Nicholas, S. L., Toner, B. M., German, C. R., and Sherrell, R. M.: Iron persistence in a distal hydrothermal plume supported by dissolved-particulate exchange, Nat. Geosci., 10, 195–201, https://doi.org/10.1038/Ngeo2900, 2017.
Froelich, P. N., Klinkhammer, G. P., Bender, M. L., Luedtke, N. A., Heath, G. R., Cullen, D., Dauphin, P., Hammond, D., Hartman, B., and Maynard, V.: Early oxidation of organic matter in pelagic sediments of the Eastern Equatorial Atlantic: suboxic diagenesis, Geochim. Cosmochim. Ac., 43, 1075–1090, https://doi.org/10.1016/0016-7037(79)90095-4, 1979.
Garcia-Solsona, E., Garcia-Orellana, J., Masqué, P., and Dulaiova, H.: Uncertainties associated with 223Ra and 224Ra measurements in water via a Delayed Coincidence Counter (RaDeCC), Mar. Chem., 109, 198–219, https://doi.org/10.1016/j.marchem.2007.11.006, 2008.
Gehlen, M., Beck, L., Calas, G., Flank, A. M., Van Bennekom, A. J., and Van Beusekom, J. E. E.: Unraveling the atomic structure of biogenic silica: Evidence of the structural association of Al and Si in diatom frustules, Geochim. Cosmochim. Ac., 66, 1601–1609, https://doi.org/10.1016/S0016-7037(01)00877-8, 2002.
Gill, A.: Atmosphere-Ocean Dynamics, Academic Press, California, 1982.
Grasshoff, K., Ehrhardt, M., and Kremling, K.: Methods of Seawater Analysis, Verlag Chemie, Weinheim, 1983.
Green, M. A., Aller, R. C., Cochran, J. K., Lee, C., and Aller, J. Y.: Bioturbation in shelf/slope sediments off Cape Hatteras, North Carolina: the use of 234Th, Chl-a, and Br− to evaluate rates of particle and solute transport, Deep-Sea Res. Pt. II, 49, 4627–4644, https://doi.org/10.1016/S0967-0645(02)00132-7, 2002.
Hahn, J., Brandt, P., Schmidtko, S., and Krahmann, G.: Decadal oxygen change in the eastern tropical North Atlantic, Ocean Sci., 13, 551–576, https://doi.org/10.5194/os-13-551-2017, 2017.
Hansen, H. P.: Determination of oxygen, Methods of Seawater Analysis, 3rd Edn., 75–89, https://doi.org/10.1002/9783527613984.ch10, 2007.
Hartmann, M., Müller, P. J., Suess, E., and van der Weijden, C. H.: Chemistry of Late Quaternary sediments and their interstitial waters of sediment cores from the North-West African continental margin, in: Supplement to: Hartmann, M., et al. (1976): Chemistry of Late Quaternary sediments and their interstitial waters from the northwest African continental margin. Meteor Forschungsergebnisse, Deutsche Forschungsgemeinschaft, Reihe C Geologie und Geophysik, Gebrüder Bornträger, Berlin, Stuttgart, C24, 1–67, PANGAEA, https://doi.org/10.1594/PANGAEA.548430, 1976.
Hatta, M., Measures, C. I., Wu, J. F., Roshan, S., Fitzsimmons, J. N., Sedwick, P., and Morton, P.: An overview of dissolved Fe and Mn distributions during the 2010–2011 US GEOTRACES north Atlantic cruises: GEOTRACES GA03, Deep-Sea Res. Pt. II, 116, 117–129, https://doi.org/10.1016/j.dsr2.2014.07.005, 2015.
Hayes, S. P., Chang, P., and McPhaden, M. J.: Variability of the sea surface temperature in the eastern equatorial Pacific during 1986–1988, J. Geophys. Res., 96, 10553–10566, https://doi.org/10.1029/91JC00942, 1991.
Hawco, N. J., Ohnemus, D. C., Resing, J. A., Twining, B. S., and Saito, M. A.: A dissolved cobalt plume in the oxygen minimum zone of the eastern tropical South Pacific, Biogeosciences, 13, 5697–5717, https://doi.org/10.5194/bg-13-5697-2016, 2016.
Heggie, D. T.: Copper in Surface Waters of the Bering Sea, Geochim. Cosmochim. Ac., 46, 1301–1306, https://doi.org/10.1016/0016-7037(82)90014-X, 1982.
Helly, J. J. and Levin, L. A.: Global distribution of naturally occurring marine hypoxia on continental margins, Deep-Sea Res. Pt. I, 51, 1159–1168, https://doi.org/10.1016/j.dsr.2004.03.009, 2004.
Henderson, P., Morris, P., Moore, W., and Charette, M.: Methodological advances for measuring low-level radium isotopes in seawater, J. Radioanal Nucl. Ch., 296, 357–362, https://doi.org/10.1007/s10967-012-2047-9, 2013.
Homoky, W. B., Severmann, S., McManus, J., Berelson, W. M., Riedel, T. E., Statham, P. J., and Mills, R. A.: Dissolved oxygen and suspended particles regulate the benthic flux of iron from continental margins, Mar. Chem., 134, 59–70, https://doi.org/10.1016/j.marchem.2012.03.003, 2012.
Homoky, W. B., Weber, T., Berelson, W. M., Conway, T. M., Henderson, G. M., van Hulten, M., Jeandel, C., Severmann, S., and Tagliabue, A.: Quantifying trace element and isotope fluxes at the ocean-sediment boundary: a review, Philos. T. R. Soc. A, 374, 20160246, https://doi.org/10.1098/rsta.2016.0246, 2016.
Honeyman, B. D., Balistrieri, L. S., and Murray, J. W.: Oceanic trace metal scavenging: the importance of particle concentration, Deep Sea Res. Pt. A, 35, 227–246, https://doi.org/10.1016/0198-0149(88)90038-6, 1988.
Hurst, M. P., Aguilar-Islas, A. M., and Bruland, K. W.: Iron in the southeastern Bering Sea: Elevated leachable particulate Fe in shelf bottom waters as an important source for surface waters, Cont. Shelf Res., 30, 467–480, https://doi.org/10.1016/j.csr.2010.01.001, 2010.
Hydes, D. J. and Liss, P. S.: Fluorimetric method for determination of low concentrations of dissolved aluminum in natural waters, Analyst, 101, 922–931, https://doi.org/10.1039/an9760100922, 1976.
Jickells, T. D.: The inputs of dust derived elements to the Sargasso Sea; a synthesis, Mar. Chem., 68, 5–14, https://doi.org/10.1016/S0304-4203(99)00061-4, 1999.
John, S. G. and Adkins, J.: The vertical distribution of iron stable isotopes in the North Atlantic near Bermuda, Global Biogeochem. Cy., 26, GB2034, https://doi.org/10.1029/2011gb004043, 2012.
Johnson, K. S., Stout, P. M., Berelson, W. M., and Sakamotoarnold, C. M.: Cobalt and copper distributions in the waters of Santa-Monica Basin, California, Nature, 332, 527–530, https://doi.org/10.1038/332527a0, 1988.
Kagaya, S., Maeba, E., Inoue, Y., Kamichatani, W., Kajiwara, T., Yanai, H., Saito, M., and Tohda, K.: A solid phase extraction using a chelate resin immobilizing carboxymethylated pentaethylenehexamine for separation and preconcentration of trace elements in water samples, Talanta, 79, 146–152, https://doi.org/10.1016/j.talanta.2009.03.016, 2009.
Karstensen, J., Stramma, L., and Visbeck, M.: Oxygen minimum zones in the eastern tropical Atlantic and Pacific oceans, Prog. Oceanogr., 77, 331–350, https://doi.org/10.1016/j.pocean.2007.05.009, 2008.
Klenz, T., Dengler, M., and Brandt, P.: Seasonal variability of the Mauritanian Undercurrent and Hydrography at 18∘ N, J. Geophys. Res.-Oceans, 123, 8122–8137, https://doi.org/10.1029/2018JC014264, 2018.
Kock, A., Schafstall, J., Dengler, M., Brandt, P., and Bange, H. W.: Sea-to-air and diapycnal nitrous oxide fluxes in the eastern tropical North Atlantic Ocean, Biogeosciences, 9, 957–964, https://doi.org/10.5194/bg-9-957-2012, 2012.
Köllner, M., Visbeck, M., Tanhua, T., and Fischer, T.: Diapycnal diffusivity in the core and oxycline of the tropical North Atlantic oxygen minimum zone, J. Marine Syst., 160, 54–63, https://doi.org/10.1016/j.jmarsys.2016.03.012, 2016.
Kounta, L., Capet, X., Jouanno, J., Kolodziejczyk, N., Sow, B., and Gaye, A. T.: A model perspective on the dynamics of the shadow zone of the eastern tropical North Atlantic – Part 1: the poleward slope currents along West Africa, Ocean Sci., 14, 971–997, https://doi.org/10.5194/os-14-971-2018, 2018.
Krahmann, G., Dengler, M., and Thomsen, S.: Physical oceanography during METEOR cruise M107, PANGAEA, https://doi.org/10.1594/PANGAEA.860480, 2016.
Labatut, M., Lacan, F., Pradoux, C., Chmeleff, J., Radic, A., Murray, J. W., Poitrasson, F., Johansen, A. M., and Thil, F.: Iron sources and dissolved-particulate interactions in the seawater of the Western Equatorial Pacific, iron isotope perspectives, Global Biogeochem. Cy., 28, 1044–1065, https://doi.org/10.1002/2014gb004928, 2014.
Lam, P. J. and Bishop, J. K. B.: The continental margin is a key source of iron to the HNLC North Pacific Ocean, Geophys. Res. Lett., 35, L07608, https://doi.org/10.1029/2008gl033294, 2008.
Lam, P. J., Ohnemus, D. C., and Marcus, M. A.: The speciation of marine particulate iron adjacent to active and passive continental margins, Geochim. Cosmochim. Ac., 80, 108–124, https://doi.org/10.1016/j.gca.2011.11.044, 2012.
Lathuilière, C., Echevin, V., and Lévy, M.: Seasonal and intraseasonal surface chlorophyll-a variability along the northwest African coast, J. Geophys. Res., 113, C05007, https://doi.org/10.1029/2007JC004433, 2008.
Liu, X. W. and Millero, F. J.: The solubility of iron in seawater, Mar. Chem., 77, 43–54, https://doi.org/10.1016/S0304-4203(01)00074-3, 2002.
Lohan, M. C. and Bruland, K. W.: Elevated Fe(II) and dissolved Fe in hypoxic shelf waters off Oregon and Washington: An enhanced source of iron to coastal upwelling regimes, Environ. Sci. Technol., 42, 6462–6468, https://doi.org/10.1021/es800144j, 2008.
Luther, G. W., Swartz, C. B., and Ullman, W. J.: Direct determination of iodide in seawater by Cathodic Stripping Square-Wave Voltammetry, Anal. Chem., 60, 1721–1724, https://doi.org/10.1021/ac00168a017, 1988.
Machu, E., Capet, X., Estrade, P. A., Ndoye, S., Brajard, J., Baurand, F., Auger, P.-A., Lazar, A., and Brehmer, P.: First evidence of anoxia and nitrogen loss in the southern Canary upwelling system, Geophys. Res. Lett., 46, 2619–2627, https://doi.org/10.1029/2018GL079622, 2019.
Mahowald, N. M., Engelstaedter, S., Luo, C., Sealy, A., Artaxo, P., Benitez-Nelson, C., Bonnet, S., Chen, Y., Chuang, P. Y., Cohen, D. D., Dulac, F., Herut, B., Johansen, A. M., Kubilay, N., Losno, R., Maenhaut, W., Paytan, A., Prospero, J. A., Shank, L. M., and Siefert, R. L.: Atmospheric Iron Deposition: Global Distribution, Variability, and Human Perturbations, Annu. Rev. Mar. Sci., 1, 245–278, https://doi.org/10.1146/annurev.marine.010908.163727, 2009.
Martin, J. H., Gordon, R. M., Fitzwater, S., and Broenkow, W. W.: Vertex – Phytoplankton Iron Studies in the Gulf of Alaska, Deep-Sea Res., 36, 649–680, https://doi.org/10.1016/0198-0149(89)90144-1, 1989.
Mawji, E., Schlitzer, R., Dodas, E. M., Abadie, C., Abouchami, W., Anderson, R. F., Baars, O., Bakker, K., Baskaran, M., Bates, N. R., Bluhm, K., Bowie, A., Bown, J., Boye, M., Boyle, E. A., Branellec, P., Bruland, K. W., Brzezinski, M. A., Bucciarelli, E., Buesseler, K., Butler, E., Cai, P. H., Cardinal, D., Casciotti, K., Chaves, J., Cheng, H., Chever, F., Church, T. M., Colman, A. S., Conway, T. M., Croot, P. L., Cutter, G. A., de Baar, H. J. W., de Souza, G. F., Dehairs, F., Deng, F. F., Dieu, H. T., Dulaquais, G., Echegoyen-Sanz, Y., Edwards, R. L., Fahrbach, E., Fitzsimmons, J., Fleisher, M., Frank, M., Friedrich, J., Fripiat, F., Galer, S. J. G., Gamo, T., Solsona, E. G., Gerringa, L. J. A., Godoy, J. M., Gonzalez, S., Grossteffan, E., Hatta, M., Hayes, C. T., Heller, M. I., Henderson, G., Huang, K. F., Jeandel, C., Jenkins, W. J., John, S., Kenna, T. C., Klunder, M., Kretschmer, S., Kumamoto, Y., Laan, P., Labatut, M., Lacan, F., Lam, P. J., Lannuzel, D., le Moigne, F., Lechtenfeld, O. J., Lohan, M. C., Lu, Y. B., Masque, P., McClain, C. R., Measures, C., Middag, R., Moffett, J., Navidad, A., Nishioka, J., Noble, A., Obata, H., Ohnemus, D. C., Owens, S., Planchon, F., Pradoux, C., Puigcorbe, V., Quay, P., Radic, A., Rehkamper, M., Remenyi, T., Rijkenberg, M. J. A., Rintoul, S., Robinson, L. F., Roeske, T., Rosenberg, M., van der Loeff, M. R., Ryabenko, E., Saito, M. A., Roshan, S., Salt, L., Sarthou, G., Schauer, U., Scott, P., Sedwick, P. N., Sha, L. J., Shiller, A. M., Sigman, D. M., Smethie, W., Smith, G. J., Sohrin, Y., Speich, S., Stichel, T., Stutsman, J., Swift, J. H., Tagliabue, A., Thomas, A., Tsunogai, U., Twining, B. S., van Aken, H. M., van Heuven, S., van Ooijen, J., van Weerlee, E., Venchiarutti, C., Voelker, A. H. L., Wake, B., Warner, M. J., Woodward, E. M. S., Wu, J. F., Wyatt, N., Yoshikawa, H., Zheng, X. Y., Xue, Z. C., Zieringer, M., and Zimmer, L. A.: The GEOTRACES Intermediate Data Product 2014, Mar. Chem., 177, 1–8, https://doi.org/10.1016/j.marchem.2015.04.005, 2015.
Measures, C. I. and Brown, E. T.: Estimating dust input to the Atlantic Ocean using surface water aluminium concentrations, in: The impact of desert dust across the Mediterranean, edited by: Guerzoni, S., Chester, R., Environmental Science and Technology Library, Springer, Dordrecht, 1996.
Measures, C. I. and Vink, S.: On the use of dissolved aluminum in surface waters to estimate dust deposition to the ocean, Global Biogeochem. Cy., 14, 317–327, https://doi.org/10.1029/1999gb001188, 2000.
Menzel Barraqueta, J.-L., Schlosser, C., Planquette, H., Gourain, A., Cheize, M., Boutorh, J., Shelley, R., Contreira Pereira, L., Gledhill, M., Hopwood, M. J., Lacan, F., Lherminier, P., Sarthou, G., and Achterberg, E. P.: Aluminium in the North Atlantic Ocean and the Labrador Sea (GEOTRACES GA01 section): roles of continental inputs and biogenic particle removal, Biogeosciences, 15, 5271–5286, https://doi.org/10.5194/bg-15-5271-2018, 2018.
Menzel Barraqueta, J.-L., Klar, J. K., Gledhill, M., Schlosser, C., Shelley, R., Planquette, H. F., Wenzel, B., Sarthou, G., and Achterberg, E. P.: Atmospheric deposition fluxes over the Atlantic Ocean: a GEOTRACES case study, Biogeosciences, 16, 1525–1542, https://doi.org/10.5194/bg-16-1525-2019, 2019.
Middag, R., de Baar, H. J. W., Laan, P., and Huhn, O.: The effects of continental margins and water mass circulation on the distribution of dissolved aluminum and manganese in Drake Passage, J. Geophys. Res.-Oceans, 117, C01019, https://doi.org/10.1029/2011jc007434, 2012.
Milne, A., Schlosser, C., Wake, B. D., Achterberg, E. P., Chance, R., Baker, A. R., Forryan, A., and Lohan, M. C.: Particulate phases are key in controlling dissolved iron concentrations in the (sub)tropical North Atlantic, Geophys. Res. Lett., 44, 2377–2387, https://doi.org/10.1002/2016gl072314, 2017.
Mittelstaedt, E.: The upwelling area off Northwest Africa – A description of phenomena related to coastal upwelling, Prog. Oceanogr., 12, 307–331, https://doi.org/10.1016/0079-6611(83)90012-5, 1983.
Mittelstaedt, E.: The ocean boundary along the northwest African coast: Circulation and oceanographic properties at the sea-surface, Prog. Oceanogr., 26, 307–355, https://doi.org/10.1016/0079-6611(91)90011-A, 1991.
Moffett, J. W.: The Relationship between cerium and manganese oxidation in the marine environment, Limnol. Oceanogr., 39, 1309–1318, https://doi.org/10.4319/lo.1994.39.6.1309, 1994.
Moffett, J. W. and Ho, J.: Oxidation of cobalt and manganese in seawater via a common microbially catalyzed pathway, Geochim. Cosmochim. Ac., 60, 3415–3424, https://doi.org/10.1016/0016-7037(96)00176-7, 1996.
Moffett, J. W. and Zika, R. G.: Reaction kinetics of hydrogen peroxide with copper and iron in seawater, Environ. Sci. Technol., 21, 804–810, https://doi.org/10.1021/es00162a012, 1987.
Moffett, J. W., Vedamati, J., Goepfert, T. J., Pratihary, A., Gauns, M., and Naqvi, S. W. A.: Biogeochemistry of iron in the Arabian Sea, Limnol. Oceanogr., 60, 1671–1688, https://doi.org/10.1002/lno.10132, 2015.
Moore, C. M., Mills, M. M., Achterberg, E. P., Geider, R. J., LaRoche, J., Lucas, M. I., McDonagh, E. L., Pan, X., Poulton, A. J., Rijkenberg, M. J. A., Suggett, D. J., Ussher, S. J., and Woodward, E. M. S.: Large-scale distribution of Atlantic nitrogen fixation controlled by iron availability, Nat. Geosci., 2, 867–871, https://doi.org/10.1038/ngeo667, 2009.
Moore, C. M., Mills, M. M., Arrigo, K. R., Berman-Frank, I., Bopp, L., Boyd, P. W., Galbraith, E. D., Geider, R. J., Guieu, C., Jaccard, S. L., Jickells, T. D., La Roche, J., Lenton, T. M., Mahowald, N. M., Maranon, E., Marinov, I., Moore, J. K., Nakatsuka, T., Oschlies, A., Saito, M. A., Thingstad, T. F., Tsuda, A., and Ulloa, O.: Processes and patterns of oceanic nutrient limitation, Nat. Geosci., 6, 701–710, https://doi.org/10.1038/Ngeo1765, 2013.
Moore, W. S.: 228Ra in the South-Atlantic Bight, J. Geophys. Res.-Oceans, 92, 5177–5190, https://doi.org/10.1029/JC092iC05p05177, 1987.
Moore, W. S.: Ages of continental shelf waters determined from 223Ra and 224Ra, J. Geophys. Res.-Oceans, 105, 22117–22122, https://doi.org/10.1029/1999jc000289, 2000.
Moore, W. S.: Seasonal distribution and flux of radium isotopes on the southeastern U.S. continental shelf, J. Geophys. Res., 112, C10013, https://doi.org/10.1029/2007JC004199, 2007.
Moore, W. S. and Arnold, R.: Measurement of 223Ra and 224Ra in coastal waters using a delayed coincidence counter, J. Geophys. Res., 101, 1321–1329, https://doi.org/10.1029/95jc03139, 1996.
Moore, W. S. and Cai, P.: Calibration of RaDeCC systems for 223Ra measurements, Mar. Chem., 156, 130–137, https://doi.org/10.1016/j.marchem.2013.03.002, 2013.
Moran, S. B. and Moore, R. M.: The potential source of dissolved aluminum from resuspended sediments to the North Atlantic Deep Water, Geochim. Cosmochim. Ac., 55, 2745–2751, https://doi.org/10.1016/0016-7037(91)90441-7, 1991.
Morel, F. M. M. and Price, N. M.: The biogeochemical cycles of trace metals in the oceans, Science, 300, 944–947, https://doi.org/10.1126/science.1083545, 2003.
Naykki, T., Virtanen, A., Kaukonen, L., Magnusson, B., Vaisanen, T., and Leito, I.: Application of the Nordtest method for “real-time” uncertainty estimation of on-line field measurement, Environ. Monit. Assess., 187, 360, https://doi.org/10.1007/s10661-015-4856-0, 2015.
Ndoye, S., Capet, X., Estrade, P., Sow, B., Dagorne, D., Lazar, A., Gaye, A., and Brehmer, P.: SST patterns and dynamics of the southern Senegal-Gambia upwelling center, J. Geophys. Res.-Oceans, 119, 8315–8335, https://doi.org/10.1002/2014JC010242, 2014.
Noble, A. E., Lamborg, C. H., Ohnemus, D. C., Lam, P. J., Goepfert, T. J., Measures, C. I., Frame, C. H., Casciotti, K. L., DiTullio, G. R., Jennings, J., and Saito, M. A.: Basin-scale inputs of cobalt, iron, and manganese from the Benguela-Angola front to the South Atlantic Ocean, Limnol. Oceanogr., 57, 989–1010, https://doi.org/10.4319/lo.2012.57.4.0989, 2012.
Noble, A. E., Echegoyen-Sanz, Y., Boyle, E. A., Ohnemus, D. C., Lam, P. J., Kayser, R., Reuer, M., Wu, J. F., and Smethie, W.: Dynamic variability of dissolved Pb and Pb isotope composition from the US North Atlantic GEOTRACES transect, Deep-Sea Res. Pt. II, 116, 208–225, https://doi.org/10.1016/j.dsr2.2014.11.011, 2015.
Noble, A. E., Ohnemus, D. C., Hawco, N. J., Lam, P. J., and Saito, M. A.: Coastal sources, sinks and strong organic complexation of dissolved cobalt within the US North Atlantic GEOTRACES transect GA03, Biogeosciences, 14, 2715–2739, https://doi.org/10.5194/bg-14-2715-2017, 2017.
Noffke, A., Hensen, C., Sommer, S., Scholz, F., Bohlen, L., Mosch, T., Graco, M., and Wallmann, K.: Benthic iron and phosphorus fluxes across the Peruvian oxygen minimum zone, Limnol. Oceanogr., 57, 851–867, https://doi.org/10.4319/lo.2012.57.3.0851, 2012.
Nriagu, J. O. and Pacyna, J. M.: Quantitative assessment of worldwide contamination of air, water and soils by trace metals, Nature, 333, 134–139, https://doi.org/10.1038/333134a0, 1988.
Nychka, D., Furrer, R., Paige, J., and Sain, S.: fields: Tools for Spatial Data, R package version 8.3-6, available at: https://CRAN.R-project.org/package=fields (last access: 4 March 2018), 2016.
Oksanen, J., Blanchet, F. G., Friendly, M., Kindt, R., Legendre, P., McGlinn, D., Minchin, P., B. O'Hara, R., Simpson, G., Solymos, P., Stevens, H., Szöcs, E., and Wagner, H.: vegan: Community Ecology Package. Ordination methods, diversity analysis and other functions for community and vegetation ecologists, version 2.5-1, available at: https://CRAN.R-project.org/package=vegan, last access: 5 May 2018.
Oldham, V. E., Jones, M. R., Tebo, B. M., and Luther, G. W.: Oxidative and reductive processes contributing to manganese cycling at oxic-anoxic interfaces, Mar. Chem., 195, 122–128, https://doi.org/10.1016/j.marchem.2017.06.002, 2017.
Orians, K. J. and Bruland, K. W.: Dissolved aluminum in the Central North Pacific, Nature, 316, 427–429, https://doi.org/10.1038/316427a0, 1985.
Orians, K. J. and Bruland, K. W.: The biogeochemistry of aluminum in the Pacific Ocean, Earth Planet Sc. Lett., 78, 397–410, https://doi.org/10.1016/0012-821x(86)90006-3, 1986.
Osborn, T. R.: Estimates of the local rate of vertical diffusion from dissipation measurements, J. Phys. Oceanogr., 10, 83–89, https://doi.org/10.1175/1520-0485(1980)010<0083:Eotlro>2.0.Co;2, 1980.
Parker, D. L., Morita, T., Mozafarzadeh, M. L., Verity, R., McCarthy, J. K., and Tebo, B. M.: Inter-relationships of MnO2 precipitation, siderophore-Mn(III) complex formation, siderophore degradation, and iron limitation in Mn(II)-oxidizing bacterial cultures, Geochim. Cosmochim. Ac., 71, 5672–5683, https://doi.org/10.1016/j.gca.2007.03.042, 2007.
Patey, M. D., Achterberg, E. P., Rijkenberg, M. J., and Pearce, R.: Aerosol time-series measurements over the tropical Northeast Atlantic Ocean: Dust sources, elemental composition and mineralogy, Mar. Chem., 174, 103–119, https://doi.org/10.1016/j.marchem.2015.06.004, 2015.
Peña-Izquierdo, J., van Sebille, E., Pelegri, J. L., Sprintall, J., Mason, E., Llanillo, P. J., and Machin, F.: Water mass pathways to the North Atlantic oxygen minimum zone, J. Geophys. Res.-Oceans, 120, 3350–3372, https://doi.org/10.1002/2014jc010557, 2015.
Rama and Moore, W. S.: Using the radium quartet for evaluating groundwater input and water exchange in salt marshes, Geochim. Cosmochim. Ac., 60, 4645–4652, https://doi.org/10.1016/S0016-7037(96)00289-X, 1996.
Rapp, I.: Trace metal data from water samples during METEOR cruise M107, PANGAEA, https://doi.org/10.1594/PANGAEA.907160, 2019.
Rapp, I., Schlosser, C., Rusiecka, D., Gledhill, M., and Achterberg, E. P.: Automated preconcentration of Fe, Zn, Cu, Ni, Cd, Pb, Co, and Mn in seawater with analysis using high-resolution sector field inductively-coupled plasma mass spectrometry, Anal Chim. Acta, 976, 1–13, https://doi.org/10.1016/j.aca.2017.05.008, 2017.
Rhein, M., Dengler, M., Sültenfuß, J., Hummels, R., Hüttl-Kabus, S., and Bourles, B.: Upwelling and associated heat flux in the equatorial Atlantic inferred from helium isotope disequilibrium, J. Geophys. Res., 115, C08021, https://doi.org/10.1029/2009JC005772, 2010.
Ricciardulli, L. and Wentz, F. J.: Remote Sensing Systems ASCAT C-2015 Daily Ocean Vector Winds on 0.25 deg grid, Version 02.1. Santa Rosa, CA, Remote Sensing Systems, available at: http://www.remss.com/missions/ascat (last access: 29 March 2019), 2016.
Rijkenberg, M. J. A., Steigenberger, S., Powell, C. F., van Haren, H., Patey, M. D., Baker, A. R., and Achterberg, E. P.: Fluxes and distribution of dissolved iron in the eastern (sub-) tropical North Atlantic Ocean, Global Biogeochem. Cy., 26, GB3004, https://doi.org/10.1029/2011gb004264, 2012.
Rijkenberg, M. J. A., Middag, R., Laan, P., Gerringa, L. J. A., van Aken, H. M., Schoemann, V., de Jong, J. T. M., and de Baar, H. J. W.: The distribution of dissolved iron in the West Atlantic Ocean, Plos One, 9, e101323, https://doi.org/10.1371/journal.pone.0101323, 2014.
Rudnick, R. L. and Gao, S.: Composition of the continental crust, in: Treatise on geochemistry, edited by: Holland, H. D., Turekian, K. K., Pergamon, Oxford, UK, 2006.
Rue, E. L., Smith, G. J., Cutter, G. A., and Bruland, K. W.: The response of trace element redox couples to suboxic conditions in the water column, Deep-Sea Res. Pt. I, 44, 113–134, https://doi.org/10.1016/S0967-0637(96)00088-X, 1997.
Rusiecka, D., Gledhill, M., Milne, A., Achterberg, E. P., Annett, A. L., Atkinson, S., Birchill, A., Karstensen, J., Lohan, M., Mariez, C., Middag, R., Rolison, J. M., Tanhua, T., Ussher, S., and Connelly, D.: Anthropogenic signatures of lead in the Northeast Atlantic, Geophys. Res. Lett., 45, 2734–2743, https://doi.org/10.1002/2017gl076825, 2018.
Saito, M. A., Goepfert, T. J., and Ritt, J. T.: Some thoughts on the concept of colimitation: Three definitions and the importance of bioavailability, Limnol. Oceanogr., 53, 276–290, https://doi.org/10.4319/lo.2008.53.1.0276, 2008.
Saito, M. A., Noble, A. E., Hawco, N., Twining, B. S., Ohnemus, D. C., John, S. G., Lam, P., Conway, T. M., Johnson, R., Moran, D., and McIlvin, M.: The acceleration of dissolved cobalt's ecological stoichiometry due to biological uptake, remineralization, and scavenging in the Atlantic Ocean, Biogeosciences, 14, 4637–4662, https://doi.org/10.5194/bg-14-4637-2017, 2017.
Schafstall, J., Dengler, M., Brandt, P., and Bange, H.: Tidal-induced mixing and diapycnal nutrient fluxes in the Mauritanian upwelling region, J. Geophys. Res.-Oceans, 115, C10014, https://doi.org/10.1029/2009jc005940, 2010.
Schlitzer, R., Anderson, R. F., Dodas, E. M., Lohan, M., Geibert, W., Tagliabue, A., Bowie, A., Jeandel, C., Maldonado, M. T., Landing, W. M., Cockwell, D., Abadie, C., Abouchami, W., Achterberg, E. P., Agather, A., Aguliar-Islas, A., van Aken, H. M., Andersen, M., Archer, C., Auro, M., de Baar, H. J., Baars, O., Baker, A. R., Bakker, K., Basak, C., Baskaran, M., Bates, N. R., Bauch, D., van Beek, P., Behrens, M. K., Black, E., Bluhm, K., Bopp, L., Bouman, H., Bowman, K., Bown, J., Boyd, P., Boye, M., Boyle, E. A., Branellec, P., Bridgestock, L., Brissebrat, G., Browning, T., Bruland, K. W., Brumsack, H.-J., Brzezinski, M., Buck, C. S., Buck, K. N., Buesseler, K., Bull, A., Butler, E., Cai, P., Mor, P. C., Cardinal, D., Carlson, C., Carrasco, G., Casacuberta, N., Casciotti, K. L., Castrillejo, M., Chamizo, E., Chance, R., Charette, M. A., Chaves, J. E., Cheng, H., Chever, F., Christl, M., Church, T. M., Closset, I., Colman, A., Conway, T. M., Cossa, D., Croot, P., Cullen, J. T., Cutter, G. A., Daniels, C., Dehairs, F., Deng, F., Dieu, H. T., Duggan, B., Dulaquais, G., Dumousseaud, C., Echegoyen-Sanz, Y., Edwards, R. L., Ellwood, M., Fahrbach, E., Fitzsimmons, J. N., Russell Flegal, A., Fleisher, M. Q., van de Flierdt, T., Frank, M., Friedrich, J., Fripiat, F., Fröllje, H., Galer, S. J. G., Gamo, T., Ganeshram, R. S., Garcia-Orellana, J., Garcia-Solsona, E., Gault-Ringold, M., George, E., Gerringa, L. J. A., Gilbert, M., Godoy, J. M., Goldstein, S. L., Gonzalez, S. R., Grissom, K., Hammerschmidt, C., Hartman, A., Hassler, C. S., Hathorne, E. C., Hatta, M., Hawco, N., Hayes, C. T., Heimbürger, L.-E., Helgoe, J., Heller, M., Henderson, G. M., Henderson, P. B., van Heuven, S., Ho, P., Horner, T. J., Hsieh, Y.-T., Huang, K.-F., Humphreys, M. P., Isshiki, K., Jacquot, J. E., Janssen, D. J., Jenkins, W. J., John, S., Jones, E. M., Jones, J. L., Kadko, D. C., Kayser, R., Kenna, T. C., Khondoker, R., Kim, T., Kipp, L., Klar, J. K., Klunder, M., Kretschmer, S., Kumamoto, Y., Laan, P., Labatut, M., Lacan, F., Lam, P. J., Lambelet, M., Lamborg, C. H., Le Moigne, F. A. C., Le Roy, E., Lechtenfeld, O. J., Lee, J.-M., Lherminier, P., Little, S., López-Lora, M., Lu, Y., Masque, P., Mawji, E., McClain, C. R., Measures, C., Mehic, S., Barraqueta, J.-L. M., van der Merwe, P., Middag, R., Mieruch, S., Milne, A., Minami, T., Moffett, J. W., Moncoiffe, G., Moore, W. S., Morris, P. J., Morton, P. L., Nakaguchi, Y., Nakayama, N., Niedermiller, J., Nishioka, J., Nishiuchi, A., Noble, A., Obata, H., Ober, S., Ohnemus, D. C., van Ooijen, J., O'Sullivan, J., Owens, S., Pahnke, K., Paul, M., Pavia, F., Pena, L. D., Peters, B., Planchon, F., Planquette, H., Pradoux, C., Puigcorbé, V., Quay, P., Queroue, F., Radic, A., Rauschenberg, S., Rehkämper, M., Rember, R., Remenyi, T., Resing, J. A., Rickli, J., Rigaud, S., Rijkenberg, M. J. A., Rintoul, S., Robinson, L. F., Roca-Martí, M., Rodellas, V., Roeske, T., Rolison, J. M., Rosenberg, M., Roshan, S., Rutgers van der Loeff, M. M., Ryabenko, E., Saito, M. A., Salt, L. A., Sanial, V., Sarthou, G., Schallenberg, C., Schauer, U., Scher, H., Schlosser, C., Schnetger, B., Scott, P., Sedwick, P. N., Semiletov, I., Shelley, R., Sherrell, R. M., Shiller, A. M., Sigman, D. M., Singh, S. K., Slagter, H. A., Slater, E., Smethie, W. M., Snaith, H., Sohrin, Y., Sohst, B., Sonke, J. E., Speich, S., Steinfeldt, R., Stewart, G., Stichel, T., Stirling, C. H., Stutsman, J., Swarr, G. J., Swift, J. H., Thomas, A., Thorne, K., Till, C. P., Till, R., Townsend, A. T., Townsend, E., Tuerena, R., Twining, B. S., Vance, D., Velazquez, S., Venchiarutti, C., Villa-Alfageme, M., Vivancos, S. M., Voelker, A. H. L., Wake, B., Warner, M. J., Watson, R., van Weerlee, E., Alexandra Weigand, M., Weinstein, Y., Weiss, D., Wisotzki, A., Woodward, E. M. S., Wu, J., Wu, Y., Wuttig, K., Wyatt, N., Xiang, Y., Xie, R. C., Xue, Z., Yoshikawa, H., Zhang, J., Zhang, P., Zhao, Y., Zheng, L., Zheng, X.-Y., Zieringer, M., Zimmer, L. A., Ziveri, P., Zunino, P., and Zurbrick, C.: The GEOTRACES Intermediate Data Product 2017, Chem. Geol., 493, 210–223, https://doi.org/10.1016/j.chemgeo.2018.05.040, 2018.
Schlosser, C., Streu, P., Frank, M., Lavik, G., Croot, P. L., Dengler, M., and Achterberg, E. P.: H2S events in the Peruvian oxygen minimum zone facilitate enhanced dissolved Fe concentrations, Sci. Rep.-UK, 8, 12642, https://doi.org/10.1038/s41598-018-30580-w, 2018.
Schmidtko, S., Stramma, L., and Visbeck, M.: Decline in global oceanic oxygen content during the past five decades, Nature, 542, 335–339, https://doi.org/10.1038/nature21399, 2017.
Scholten, J. C., Pham, M. K., Blinova, O., Charette, M. A., Dulaiova, H., and Eriksson, M.: Preparation of Mn-fiber standards for the efficiency calibration of the delayed coincidence counting system (RaDeCC), Mar. Chem., 121, 206–214, https://doi.org/10.1016/j.marchem.2010.04.009, 2010.
Scholz, F., Loscher, C. R., Fiskal, A., Sommer, S., Hensen, C., Lomnitz, U., Wuttig, K., Gottlicher, J., Kossel, E., Steininger, R., and Canfield, D. E.: Nitrate-dependent iron oxidation limits iron transport in anoxic ocean regions, Earth Planet. Sc. Lett., 454, 272–281, https://doi.org/10.1016/j.epsl.2016.09.025, 2016.
Schroller-Lomnitz, U., Hensen, C., Dale, A. W., Scholz, F., Clemens, D., Sommer, S., Noffke, A., and Wallmann, K.: Dissolved benthic phosphate, iron and carbon fluxes in the Mauritanian upwelling system and implications for ongoing deoxygenation, Deep-Sea Res. Pt. I, 143, 70–84, https://doi.org/10.1016/j.dsr.2018.11.008, 2019.
Severmann, S., McManus, J., Berelson, W. M., and Hammond, D. E.: The continental shelf benthic iron flux and its isotope composition, Geochim. Cosmochim. Ac., 74, 3984–4004, https://doi.org/10.1016/j.gca.2010.04.022, 2010.
Shelley, R. U., Morton, P. L., and Landing, W. M.: Elemental ratios and enrichment factors in aerosols from the US-GEOTRACES North Atlantic transects, Deep-Sea Res. Pt. II, 116, 262–272, https://doi.org/10.1016/j.dsr2.2014.12.005, 2015.
Shelley, R. U., Landing, W. M., Ussher, S. J., Planquette, H., and Sarthou, G.: Regional trends in the fractional solubility of Fe and other metals from North Atlantic aerosols (GEOTRACES cruises GA01 and GA03) following a two-stage leach, Biogeosciences, 15, 2271–2288, https://doi.org/10.5194/bg-15-2271-2018, 2018.
Sherrell, R. M. and Boyle, E. A.: The trace metal composition of suspended particles in the oceanic water column near Bermuda, Earth Planet. Sc. Lett., 111, 155–174, https://doi.org/10.1016/0012-821x(92)90176-V, 1992.
Soataert, K., Petzoldt, T., and Meysman, F.: marelac: Tools for Aquatic Sciences, Version 2.1.6, available at: https://CRAN.R-project.org/package=marelac (last access: 30 June 2017), 2016.
Sommer, S. and Dengler, M.: Hydrochemistry of water samples during METEOR cruise M107, PANGAEA, https://doi.org/10.1594/PANGAEA.885109, 2018.
Sommer, S., Dengler, M., and Treude, T.: Benthic element cycling, fluxes and transport of solutes across the benthic boundary layer in the Mauritanian oxygen minimum zone, (SFB754) – Cruise No. M107 – May 30–July 03, 2014 – Fortaleza (Brazil) – Las Palmas (Spain), METEOR-Berichte, M107, DFG-Senatskommission für Ozeanographie, https://doi.org/10.2312/cr_m107, 2015.
Steinfeldt, R., Sültenfuß, J., Dengler, M., Fischer, T., and Rhein, M.: Coastal upwelling off Peru and Mauritania inferred from helium isotope disequilibrium, Biogeosciences, 12, 7519–7533, https://doi.org/10.5194/bg-12-7519-2015, 2015.
Stramma, L., Brandt, P., Schafstall, J., Schott, F., Fischer, J., and Kortzinger, A.: Oxygen minimum zone in the North Atlantic south and east of the Cape Verde Islands, J. Geophys. Res.-Oceans, 113, C04014, https://doi.org/10.1029/2007jc004369, 2008a.
Stramma, L., Johnson, G. C., Sprintall, J., and Mohrholz, V.: Expanding oxygen-minimum zones in the tropical oceans, Science, 320, 655–658, https://doi.org/10.1126/science.1153847, 2008b.
Stumm, W. and Morgan, J. J.: Aquatic Chemistry: Chemical Equilibria and Rates in Natural Waters, John Wiley & Sons, New York, 1995.
Sunda, W. G. and Huntsman, S. A.: Effect of sunlight on redox cycles of manganese in the Southwestern Sargasso Sea, Deep-Sea Res., 35, 1297–1317, https://doi.org/10.1016/0198-0149(88)90084-2, 1988.
Sunda, W. G. and Huntsman, S. A.: Photoreduction of manganese oxides in seawater, Mar. Chem., 46, 133–152, https://doi.org/10.1016/0304-4203(94)90051-5, 1994.
Tanhua, T. and Liu, M.: Upwelling velocity and ventilation in the Mauritanian upwelling system estimated by CFC-12 and SF6 observations, J. Marine Syst., 151, 57–70, https://doi.org/10.1016/j.jmarsys.2015.07.002, 2015.
Tebo, B. M. and Emerson, S.: Microbial manganese(II) oxidation in the marine environment: a quantitative study, Biogeochemistry, 2, 149–161, https://doi.org/10.1007/Bf02180192, 1986.
Tebo, B. M., Bargar, J. R., Clement, B. G., Dick, G. J., Murray, K. J., Parker, D., Verity, R., and Webb, S. M.: Biogenic manganese oxides: Properties and mechanisms of formation, Annu. Rev. Earth Pl. Sc., 32, 287–328, https://doi.org/10.1146/annurev.earth.32.101802.120213, 2004.
Thomsen, S., Karstensen, J., Kiko, R., Krahmann, G., Dengler, M., and Engel, A.: Remote and local drivers of oxygen and nitrate variability in the shallow oxygen minimum zone off Mauritania in June 2014, Biogeosciences, 16, 979–998, https://doi.org/10.5194/bg-16-979-2019, 2019.
Tomczak, M.: An analysis of mixing in the frontal zone of South and North Atlantic Central Water off North-West Africa, Prog. Oceanogr., 10, 173–192, https://doi.org/10.1016/0079-6611(81)90011-2, 1981.
Tweddle, J. F., Sharples, J., Palmer, M. R., Davidson, K., and McNeill, S.: Enhanced nutrient fluxes at the shelf sea seasonal thermoclinecaused by stratified flow over a bank, Prog. Oceanogr., 117, 37–47, https://doi.org/10.1016/j.pocean.2013.06.018, 2013.
Twining, B. S., Rauschenberg, S., Morton, P. L., and Vogt, S.: Metal contents of phytoplankton and labile particulate material in the North Atlantic Ocean, Prog. Oceanogr., 137, 261–283, https://doi.org/10.1016/j.pocean.2015.07.001, 2015.
Ussher, S. J., Achterberg, E. P., Powell, C., Baker, A. R., Jickells, T. D., Torres, R., and Worsfold, P. J.: Impact of atmospheric deposition on the contrasting iron biogeochemistry of the North and South Atlantic Ocean, Global Biogeochem. Cy., 27, 1096–1107, https://doi.org/10.1002/gbc.20056, 2013.
Verhoef, A., Portabella, M., and Stoffelen, A.: High resolution ASCAT scatterometer winds near the coast, IEEE T Geosci. Remote Sens., 50, 2481–248, https://doi.org/10.1109/TGRS.2011.2175001, 2012.
Véron, A., Patterson, C., and Flegal, A.: Use of stable lead isotopes to characterize the sources of anthropogenic lead in North Atlantic surface waters, Geochim. Cosmochim. Ac., 58, 3199–3206, https://doi.org/10.1016/0016-7037(94)90047-7, 1994.
von Langen, P. J., Johnson, K. S., Coale, K. H., and Elrod, V. A.: Oxidation kinetics of manganese(II) in seawater at nanomolar concentrations, Geochim. Cosmochim. Ac., 61, 4945–4954, https://doi.org/10.1016/S0016-7037(97)00355-4, 1997.
Weiss, R. F.: The solubility of nitrogen, oxygen and argon in water and seawater, Deep Sea Res and Oceanographic Abstracts, 17, 721–735, https://doi.org/10.1016/0011-7471(70)90037-9, 1970.
Winkler, L. W.: Bestimmung des im Wasser gelösten Sauerstoffs, Ber. Dtsch. Chem. Ges., 21, 2843–2855, https://doi.org/10.1002/cber.188802102122, 1888.
Wu, J. F. and Luther, G. W.: Size-fractionated iron concentrations in the water column of the western North Atlantic Ocean, Limnol. Oceanogr., 39, 1119–1129, https://doi.org/10.4319/lo.1994.39.5.1119, 1994.
Wuttig, K., Heller, M. I., and Croot, P. L.: Pathways of Superoxide () Decay in the Eastern Tropical North Atlantic, Environ. Sci. Technol., 47, 10249–10256, https://doi.org/10.1021/es401658t, 2013.
Wyrtki, K.: The oxygen minima in relation to ocean circulation, Deep-Sea Res., 9, 11–23, https://doi.org/10.1016/0011-7471(62)90243-7, 1962.
Yücel, M., Beaton, A. D., Dengler, M., Mowlem, M. C., Sohl, F., and Sommer, S.: Nitrate and Nitrite Variability at the Seafloor of an Oxygen Minimum Zone Revealed by a Novel Microfluidic In-Situ Chemical Sensor, PLoS ONE, 10, e0132785, https://doi.org/10.1371/journal.pone.0132785, 2015.
Zenk, W., Klein, B., and Schroder, M.: Cape-Verde Frontal Zone, Deep-Sea Res., 38, S505–S530, https://doi.org/10.1016/S0198-0149(12)80022-7, 1991.