the Creative Commons Attribution 4.0 License.
the Creative Commons Attribution 4.0 License.
 | 16 Dec 2019
Major role of ammonia-oxidizing bacteria in N2O production in the Pearl River estuary
Li Ma
Hua Lin
Xiabing Xie
Minhan Dai
Yao Zhang
Nitrous oxide (N2O) has significant global warming potential as a greenhouse gas. Estuarine and coastal regimes are the major zones of N2O production in the marine system. However, knowledge on biological sources of N2O in estuarine ecosystems remains controversial but is of great importance for understanding global N2O emission patterns. Here, we measured concentrations and isotopic compositions of N2O as well as distributions of ammonia-oxidizing bacterial and archaeal amoA and denitrifier nirS genes by quantitative polymerase chain reaction along a salinity gradient in the Pearl River estuary, and we performed in situ incubation experiments to estimate N2O yields. Our results indicated that nitrification predominantly occurred, with significant N2O production during ammonia oxidation. In the hypoxic waters of the upper estuary, strong nitrification resulted in the observed maximum N2O and ΔN2Oexcess concentrations, although minor denitrification might be concurrent at the site with the lowest dissolved oxygen. Ammonia-oxidizing β-proteobacteria (AOB) were significantly positively correlated with all N2O-related parameters, although their amoA gene abundances were distinctly lower than ammonia-oxidizing archaea (AOA) throughout the estuary. Furthermore, the N2O production rate and the N2O yield normalized to amoA gene copies or transcripts estimated a higher relative contribution of AOB to the N2O production in the upper estuary. Taken together, the in situ incubation experiments, N2O isotopic composition and concentrations, and gene datasets suggested that the high concentration of N2O (oversaturated) is mainly produced from strong nitrification by the relatively high abundance of AOB in the upper reaches and is the major source of N2O emitted to the atmosphere in the Pearl River estuary.
- Article
(5484 KB) - Full-text XML
-
Supplement
(358 KB) - BibTeX
- EndNote


Nitrous oxide (N2O) is a potent greenhouse gas with global warming potential 298 times that of carbon dioxide (CO2) on a 100 years timescale and contributes to stratospheric ozone depletion as a major precursor of free radicals (Ravishankara et al., 2009). N2O emissions from soils and marine systems are estimated to account for 56 %–70 % (6–7 Tg N2O-N yr−1) (Syakila and Kroeze, 2011; Butterbach-Bahl et al., 2013; Hink et al., 2017) and 30 % (4 Tg N2O-N yr−1) (Nevison et al., 2004; Naqvi et al., 2010; Voss et al., 2013), respectively, of the total global N2O emissions. The main processes responsible for N2O emissions are microbial transformation of ammonia, nitrite, and nitrate through nitrification and denitrification (Butterbach-Bahl et al., 2013). It has been estimated that oceanic N2O production is dominated by nitrification, whereas only 7 % is contributed by denitrification (Freing et al., 2012).
N2O is released as a byproduct during nitrification via incomplete oxidation of hydroxylamine (NH2OH) to nitrite () by ammonia-oxidizing bacteria (AOB) (Stein, 2011). This process may be enhanced under suboxic conditions (Naqvi et al., 2010). While no equivalent of the hydroxylamine oxidoreductase that catalyzes N2O formation through NH2OH oxidation has been found in ammonia-oxidizing archaea (AOA) (Hatzenpichler, 2012), recent studies indicated that AOA possibly produce hybrid N2O via a combination of an ammonia oxidation intermediate (NH2OH, HNO, or NO) and (Stieglmeier et al., 2014; Frame et al., 2017). In addition, AOB have been shown to produce N2O from during nitrifier denitrification (Shaw et al., 2006). This process is also promoted under micro-oxic and anoxic conditions (Yu et al., 2010). Denitrification by heterotrophic denitrifiers is another major pathway of N2O production in marine environments, occurring under anoxic conditions or at the suboxic–anoxic interface (Naqvi et al., 2010; Yamagishi et al., 2007; Ji et al., 2018). is reduced by a copper-containing (NirK) or cytochrome-cd1-containing (NirS) nitrite reductase to nitric oxide (NO) and then by a heme–copper NO reductase (NOR) to N2O (Coyne et al., 1989; Treusch et a1., 2005; Abell et al., 2010; Bartossek et a1., 2010; Lund et a1., 2012; Graf et al., 2014). As an intermediary product during denitrification, production and further reduction of N2O are sensitive to different O2 conditions (Babbin et al., 2015; Ji et al., 2015).
Biological nitrogen transformations are catalyzed by various microbial enzymes, of which ammonium monooxygenase (AMO) and nitrite reductases (NIRs) are key enzymes responsible for nitrification and denitrification, respectively (Canfield et al., 2010). The genes encoding for AMO subunit A (amoA) and NIRs (nirS and nirK) have been widely applied as functional marker genes to identify the distribution of ammonia oxidizers and denitrifiers. Previous studies have shown significant correlations of amoA with spatial variations of N2O emissions or N2O production rates in soils and oceans (Avrahami and Bohanann, 2009; Santoro et al., 2011; Löscher et al., 2012). In addition, significant relationships between nirK or nirS abundances and N2O emissions were observed in grasslands (Čuhel et al., 2010), arable soils (Clark et al., 2012; Jones et al., 2014), and the ocean (Arévalo-Martínez et al., 2015).
Estuaries are highly impacted by coastal nutrient pollution and eutrophication because of anthropogenic activity; they play a significant role in nitrogen cycling at the land–sea interface (Bricker et al., 2008; Damashek et al., 2016; Damashek and Francis, 2018). Estuarine and coastal regimes have long been recognized as major zones of N2O production in the marine system (Seitzinger and Kroeze, 1998; Mortazavi et al., 2000; Usui et al., 2001; Kroeze et al., 2010; Allen et al., 2011). In particular, eutrophic estuaries with extensive oxygen-deficient zones have been considered hotspot regions for N2O production (Abril et al., 2000; De Wilde and De Bie, 2000; Garnier et al., 2006; Lin et al., 2016), with oversaturated N2O and high N2O concentrations and flux (De Wilde and De Bie, 2000; De Bie et al., 2002; Garnier et al., 2006; Rajkumar et al., 2008; Barnes and Upstill-Goddard, 2011; Lin et al., 2016). The dynamics of N2O emissions in these ecosystems are regulated by complex physical and biogeochemical processes; for example, mixing between fresh water and oceanic waters influences the biogeochemistry of estuarine waters as well as microbial activity (Huertas et al., 2018; Laperriere et al., 2019).
Nitrification is often credited as the dominant N2O production pathway in estuaries (De Bie et al., 2002; Barnes and Upstill-Goddard, 2011; Kim et al., 2013; Lin et al., 2016; Huertas et al., 2018; Laperriere et al., 2019). Although AOA frequently outnumber AOB and dominate microbial communities, their contribution to nitrification remains controversial in estuarine and coastal waters (Bernhard et al., 2010; Zhang et al., 2014; Hou et al., 2018). Furthermore, the relative contributions of AOB and AOA to N2O production are inconclusive (Monteiro et al., 2014), and there is a potential niche overlap between nitrifiers and denitrifiers in low-oxygen conditions (Frame and Casciotti, 2010; Zhang et al., 2014; Penn et al., 2016). AOB are reported to thrive in hypoxic environments and denitrification in the oxic ocean is suggested to occur within anoxic particle interiors (Frame and Casciotti, 2010; Ni et al., 2014). It is therefore of great importance to elucidate the biological sources of N2O production in estuarine ecosystems to better understanding global N2O emission patterns.
The Pearl River estuary, surrounded by several big cities, is one of the world's most complex estuarine systems with a total discharge of 285.2×10⁹ m3 yr−1 (Dai et al., 2014). A rich nitrogen supply with the river discharge produces eutrophic waters in the estuary (Dai et al., 2008). Moreover, increased oxygen consumption by organic matter degradation leads to the formation of hypoxic zones in the upper reaches of the estuary (Dai et al., 2006; He et al., 2014), which may support strong nitrification, denitrification, and N2O production (Lin et al., 2016). In this study, N2O-related biogeochemical parameters were measured, and distributions of AOB and AOA amoA and denitrifier nirS genes were quantified by quantitative polymerase chain reaction (qPCR) to investigate the relationship between N2O production and spatial distribution of nitrifiers and denitrifiers along a salinity gradient in the Pearl River estuary (Fig. 1). Moreover, in situ incubation experiments were performed in the hypoxic upper estuary to estimate (1) nitrification and N2O production rates, (2) whether denitrification occurred during nitrification, and (3) N2O yield (mole N2O-N produced per mole of ammonia oxidized). By combining the genetic datasets and incubation estimates, this study thus identified the relative contributions of AOB and AOA in producing N2O in the Pearl River estuary.

Figure 1Map of the Pearl River estuary showing the sampling sites. Biogeochemical analyses were performed on samples from all sites (green and red circles). The green circles indicate sites where genes were additionally analyzed. The black crosses indicate in situ incubation experiment sites (P01 and P05). The black asterisks indicate sites where the isotopic composition of N2O was analyzed.
2.1 Study area and sampling
A total of 22 sites along the salinity gradient of the Pearl River estuary were sampled during a research cruise in July 2015, including 11 sites in the upper reaches (upstream of the Humen outlet) and 11 sites in the lower reaches (Lingdingyang) (Fig. 1). Water samples were taken from the surface (2 m) and bottom (4–15 m) of each site by using a conductivity, temperature, and depth (CTD) rosette sampling system (SBE 25; Sea-Bird Scientific, USA) fitted with 12 L Niskin bottles (General Oceanics). A total of 16 samples (from two depths at eight sites) were subjected to gene analysis (Fig. 1). A total of 1 L of water for gene analysis was serially filtered through 0.8 and then 0.22 µm pore size polycarbonate membrane filters (47 mm diameter, Millipore) within 30 min at a pressure < 0.03 MPa to retain the particle-associated communities (> 0.8 µm) and free-living communities (0.22–0.8 µm). For the upper estuary samples, more membrane filters were used to avoid the filters clogging. RNAlater solution (Ambion, Austin, Texas, USA) was quickly added to the samples to prevent RNA degradation. All of the filters were immediately flash-frozen in liquid nitrogen and then stored at −80 ∘C until further analysis. Water samples for nutrient determination were filtered through 0.45 µm pore size cellulose acetate membranes and then immediately frozen at −20 ∘C until further analysis. Water samples for dissolved N2O were collected into 125 mL headspace glass bottles to which 100 µL of saturated HgCl2 was added; the bottles were immediately closed with rubber stoppers and aluminum crimp caps and stored in the dark at 4 ∘C until analysis in the laboratory. All N2O samples were collected during the July 2015 cruise except for samples from sites P03, P05, A01, A06, and A10 intended for N2O isotopic composition analyses, which were sampled during a cruise in March 2010. Total suspended material (TSM) was collected by filtering 1–4 L of water onto precombusted and preweighed glass fiber filters (GF/Fs) (Whatman) and then stored at −20 ∘C until weighing in the laboratory.
2.2 Biogeochemical parameters, N2O emissions, and isotopic analysis of environmental samples
Temperature and salinity were measured with the SBE 25 CTD system. Dissolved oxygen (DO) concentrations were measured using the Winkler method (Dai et al., 2006). Ammonia was measured using the indophenol blue spectrophotometric method (Pai et al., 2001) on board; nitrate, nitrite, and silicate were analyzed using routine spectrophotometric methods with a Technicon AA3 auto-analyzer (Bran+Luebbe, GmbH) (Han et al., 2012). N2O concentrations were analyzed by gas chromatography (GC, Agilent 6890 with a microelectron capture detector) coupled with a purge-trap system (Tekmar Velocity XPT) at 25 ∘C (Lin et al., 2016). N2O standard gases of 1.02 and 2.94 ppmv N2O∕N2 (National Center of Reference Material, China, Beijing) were used. The relative standard deviation of the slope of the standard working curve was 1.77 % (n=8). The detection limit was calculated to be ∼0.1 nmol L−1 and the precision was better than ±5 %. When water samples were analyzed, every 5–10 samples were spiked with N2O standards to calibrate the GC.
The excess N2O (ΔN2Oexcess) and N2O saturation (S %) were calculated with Eqs. (1) and (2):
where N2Oobserved represents the measured concentrations of N2O in the water, and the equilibrium values of N2O (N2Oequilibrium) were calculated by Eqs. (3) and (4) (Weiss and Price, 1980):
where x is the mole fraction of N2O in the atmosphere and T is the absolute temperature. In this study, we used the global mean atmospheric N2O (327 ppb) from 2015 (http://www.esrl.noaa.gov/gmd, last access: 3 November 2017). The fitted function F and constants A1, A2, A3, A4, B1, B2 and B3 were proposed by Weiss and Price (1980).
The N2O flux (, µmol m−2 d−1) through the air–sea interface was estimated based on Eq. (5):
where (cm h−1) is the N2O gas transfer velocity depending on wind and water temperature, is the solubility of N2O, and ΔpN2O is the average sea–gas N2O partial pressure difference. was estimated using Eq. (6) according to Wanninkhof (1992):
where uav is the average wind speed 10 m above the water surface. In this study, a CO2 Schmidt number (Sc) of 600 at 20 ∘C in fresh water (Wanninkhof, 1992) was used for estuarine systems (Raymond and Cole, 2001). The Sc is defined as the kinematic viscosity of water divided by the diffusion coefficient of the gas and calculated from temperature (Wanninkhof, 1992). For N2O in waters with salinities < 35 and temperatures ranging from 0 to 30 ∘C, Sc was estimated using Eq. (7) according to Wanninkhof (1992):
where t is the in situ temperature of the sampling site.
To determine the isotopic composition of N2O, the gas samples were introduced into a trace gas cryogenic preconcentration device (PreCon, Thermo Finnigan), as described in Cao et al. (2008) and Zhu et al. (2008), and then δ15N-N2O was analyzed using an isotope ratio mass spectrometer (IRMS, Thermo Finnigan MAT-253, Bremen, Germany). The molecular ions of N2O (N2O+; m∕z 44, 45, and 46) were quantified by IRMS to calculate isotope ratios for the entire molecule (15N∕14N and 18O∕16O). The δ15N values of N2O in samples were calculated using the 15N∕14N of the pure N2O reference gas and samples (Frame and Casciotti, 2010; Mohn et al., 2014). The reference gas was previously calibrated against N2O isotopic standard gas (δ15N (vs. the international reference material tropospheric N2, Air-N2) ‰) produced by Shoko Co. Ltd. (Tokyo, Japan), and the δ15N value (vs. Air-N2) of the N2O reference gas is 6.579±0.030 ‰. The precision of the method for δ15N-N2O was estimated as 0.3 ‰.
2.3 Nucleic acid extraction and qPCR
DNA was extracted using the FastDNA™ SPIN Kit for Soil (MP, USA) according to the manufacturers' protocol with minor modifications. RNA was extracted using TRIzol reagent (Ambion, Austin, Texas, USA) and then eluted with 50 µL of RNase-free water. The extracted RNA was treated with DNase I (Invitrogen, Carlsbad, CA) to remove any residual DNA. DNA contamination was checked by amplifying the bacterial 16S rRNA genes before reverse transcription. Total RNA without DNA contamination was reverse transcribed to synthesize single-strand complementary DNA (cDNA) using the First Strand cDNA Synthesis Kit (Invitrogen, Austin, Texas, USA).
The transcript and copy abundances of bacterial and archaeal amoA genes and bacterial nirS genes were examined using qPCR and a CFX96 real-time PCR system (BIO-RAD, Singapore). The β-proteobacterial and archaeal amoA were amplified using primer sets amoA-1F and amoA-2R (Kim et al., 2008) and Arch-amoAF and Arch-amoAR (Francis et al., 2005), respectively; nirS was amplified using primers nirS-1F and nirS-3R (Braker et al., 1998; Huang et al., 2011). Quantitative PCR amplification for the β-proteobacterial and archaeal amoA was carried out as described previously (Mincer et al., 2007; Hu et al., 2011). For the amplification of nirS, the qPCR reaction mixture was prepared in accordance with Zhang et al. (2014) and thermal cycling conditions were as described in Huang et al. (2011). Standards for the qPCR reactions consisted of serial 10-fold dilutions (107 to 100 copies per µL) of plasmid DNA containing amplified fragments of the targeted genes (accession numbers MH458281 for β-proteobacterial amoA, KY387998 for archaeal amoA and KF363351 for nirS). The amplification efficiencies of qPCR were always between 85 % and 95 % with R2 > 0.99. The specificity of the qPCR reactions was confirmed by melting curve analysis, agarose gel electrophoresis, and sequencing analysis. Inhibition tests were performed by 2-fold and 5-fold dilutions of all samples and indicated that our samples were not inhibited.
2.4 Incubation experiments
Incubation experiments were performed in the surface and bottom waters at sites P01 (2 and 5 m water depth) and P05 (2 and 12 m) upstream of the Humen outlet (Fig. 1). Water samples were collected from Niskin bottles through a clean polytetrafluoroethylene (Teflon) silicone hose and carefully filled into 125 mL clean headspace glass bottles without gas bubbles. The bottles were immediately closed with an air-tight butyl rubber stopper and aluminum crimp cap. A total of 43 bottles were set up for surface and bottom at sites P01 and 34 bottles at P05. Samples from four parallel bottles were taken to determine the initial (t0) dissolved N2O concentration, and triplicate samples were taken to measure the initial dissolved inorganic nitrogen (DIN) concentration, which included ammonium, nitrite, and nitrate. The remaining 36 (P01) and 27 (P05) bottles were incubated in the dark at in situ temperatures (±1 ∘C). At site P01, samples from six parallel bottles were taken at 3, 6, 18, and 24 h during the incubation experiment for N2O determination after injecting saturated mercuric chloride (HgCl2, 1:100 v:v) into the bottles; triplicate samples were also taken at the same time for DIN measurements by filtering through 0.7 µm pore size GF/Fs under pressure < 0.03 MPa. Concentrations of N2O, ammonium, nitrite, and nitrate were measured as described in Sect. 2.2. At site P05, samples were taken after 3, 6, and 12 h incubation and the other procedures were the same as described for site P01.
The effect of DIN assimilation is negligible during incubation in the dark (Ward, 2008). Therefore, the potential processes of nitrogen transformation and N2O production can be determined according to mass balance in a closed incubation system. The main processes were analyzed based on the dynamic variations of DIN (ΔDIN), ammonia (), nitrite (), nitrate (), and N2O (ΔN2O) concentrations during incubation. The average rates of nitrification and N2O production were estimated using the slopes of the linear regression between concentrations versus incubation time when DIN was in balance (i.e. no denitrification). All of the concentration-based rates described from the incubations represent net rates. The N2O yield during nitrification was calculated with Eq. (8):
2.5 Statistical analyses
Since a normal distribution of the individual datasets was not always met, we used the nonparametric Wilcoxon rank-sum tests for comparing two variables. The bivariate correlations between environmental factors and functional genes were described by Spearman correlation coefficients (ρ value). False discovery rate-based multiple comparison procedures were applied to evaluate the significance of multiple hypotheses and identify truly significant comparisons (false discovery rate-adjusted P value) (Pike, 2011). The maximum gradient length of detrended correspondence analysis was shorter than 3.0; thus redundancy analysis based on the qPCR data was used to analyze variations in the AOA and AOB distributions under environmental constraints in the software R (version 3.4.4) vegan 2.5–3 package. The qPCR-based relative abundances and environmental factors were normalized via Z transformation (Magalhães et al., 2008). The null hypothesis, that the community was independent of environmental parameters, was tested using constrained ordination with a Monte Carlo permutation test (999 permutations). Significant environmental parameters (P < 0.05) without multicollinearity (variance inflation factor < 20) (Ter Braak, 1986) were obtained. Standard and partial Mantel tests were run in R (version 3.4.4, vegan 2.5–3 package) to determine the correlations between environmental factors and the AOA and AOB distributions. Dissimilarity matrices of communities and environmental factors were based on Bray–Curtis and Euclidean distances between samples, respectively. Based on Spearman correlation, the significance of the Mantel statistics was obtained after 999 permutations. Statistical tests were assumed to be significant at a P value of < 0.05.
3.1 Distribution of nutrients, DO, and N2O along a salinity transect of the Pearl River estuary
The studied transect was divided into a northern region upstream of the Humen outlet and southern area (Lingdingyang) (Fig. 1); these regions have distinct biogeochemical characteristics. Salinity exhibited low values (0.1 to 4.4) upstream of the Humen outlet and sharply increased from 0.7 to 34.2 downstream in Lingdingyang (Fig. 2a). The ammonium/ammonia concentrations decreased from 167.2 µmol L−1 (site P01 surface water) to 20.9 µmol L−1 (site P07 bottom water) upstream of the Humen outlet and consistently decreased downstream in Lingdingyang (5.7 µmol L−1 to below detection limit) (Fig. 2b). Correspondingly, the sum of nitrate and nitrite concentrations increased from 93.6 µmol L−1 (site P01 bottom water) to 172.3 µmol L−1 (site P03 surface water) upstream, but it sharply decreased seaward to Lingdingyang (Fig. 2c). The DO concentrations were distinctly lower upstream of the Humen outlet with nearly one-half of the samples below the hypoxic threshold (63.0 µmol L−1; Rabalais et al., 2010). Generally, the DO concentrations increased seaward from 155.7 to 238.0 µmol L−1 in the surface waters of the Lingdingyang area, whereas they varied from 74.0 to 183.3 µmol L−1 in the bottom waters (Fig. 2d).
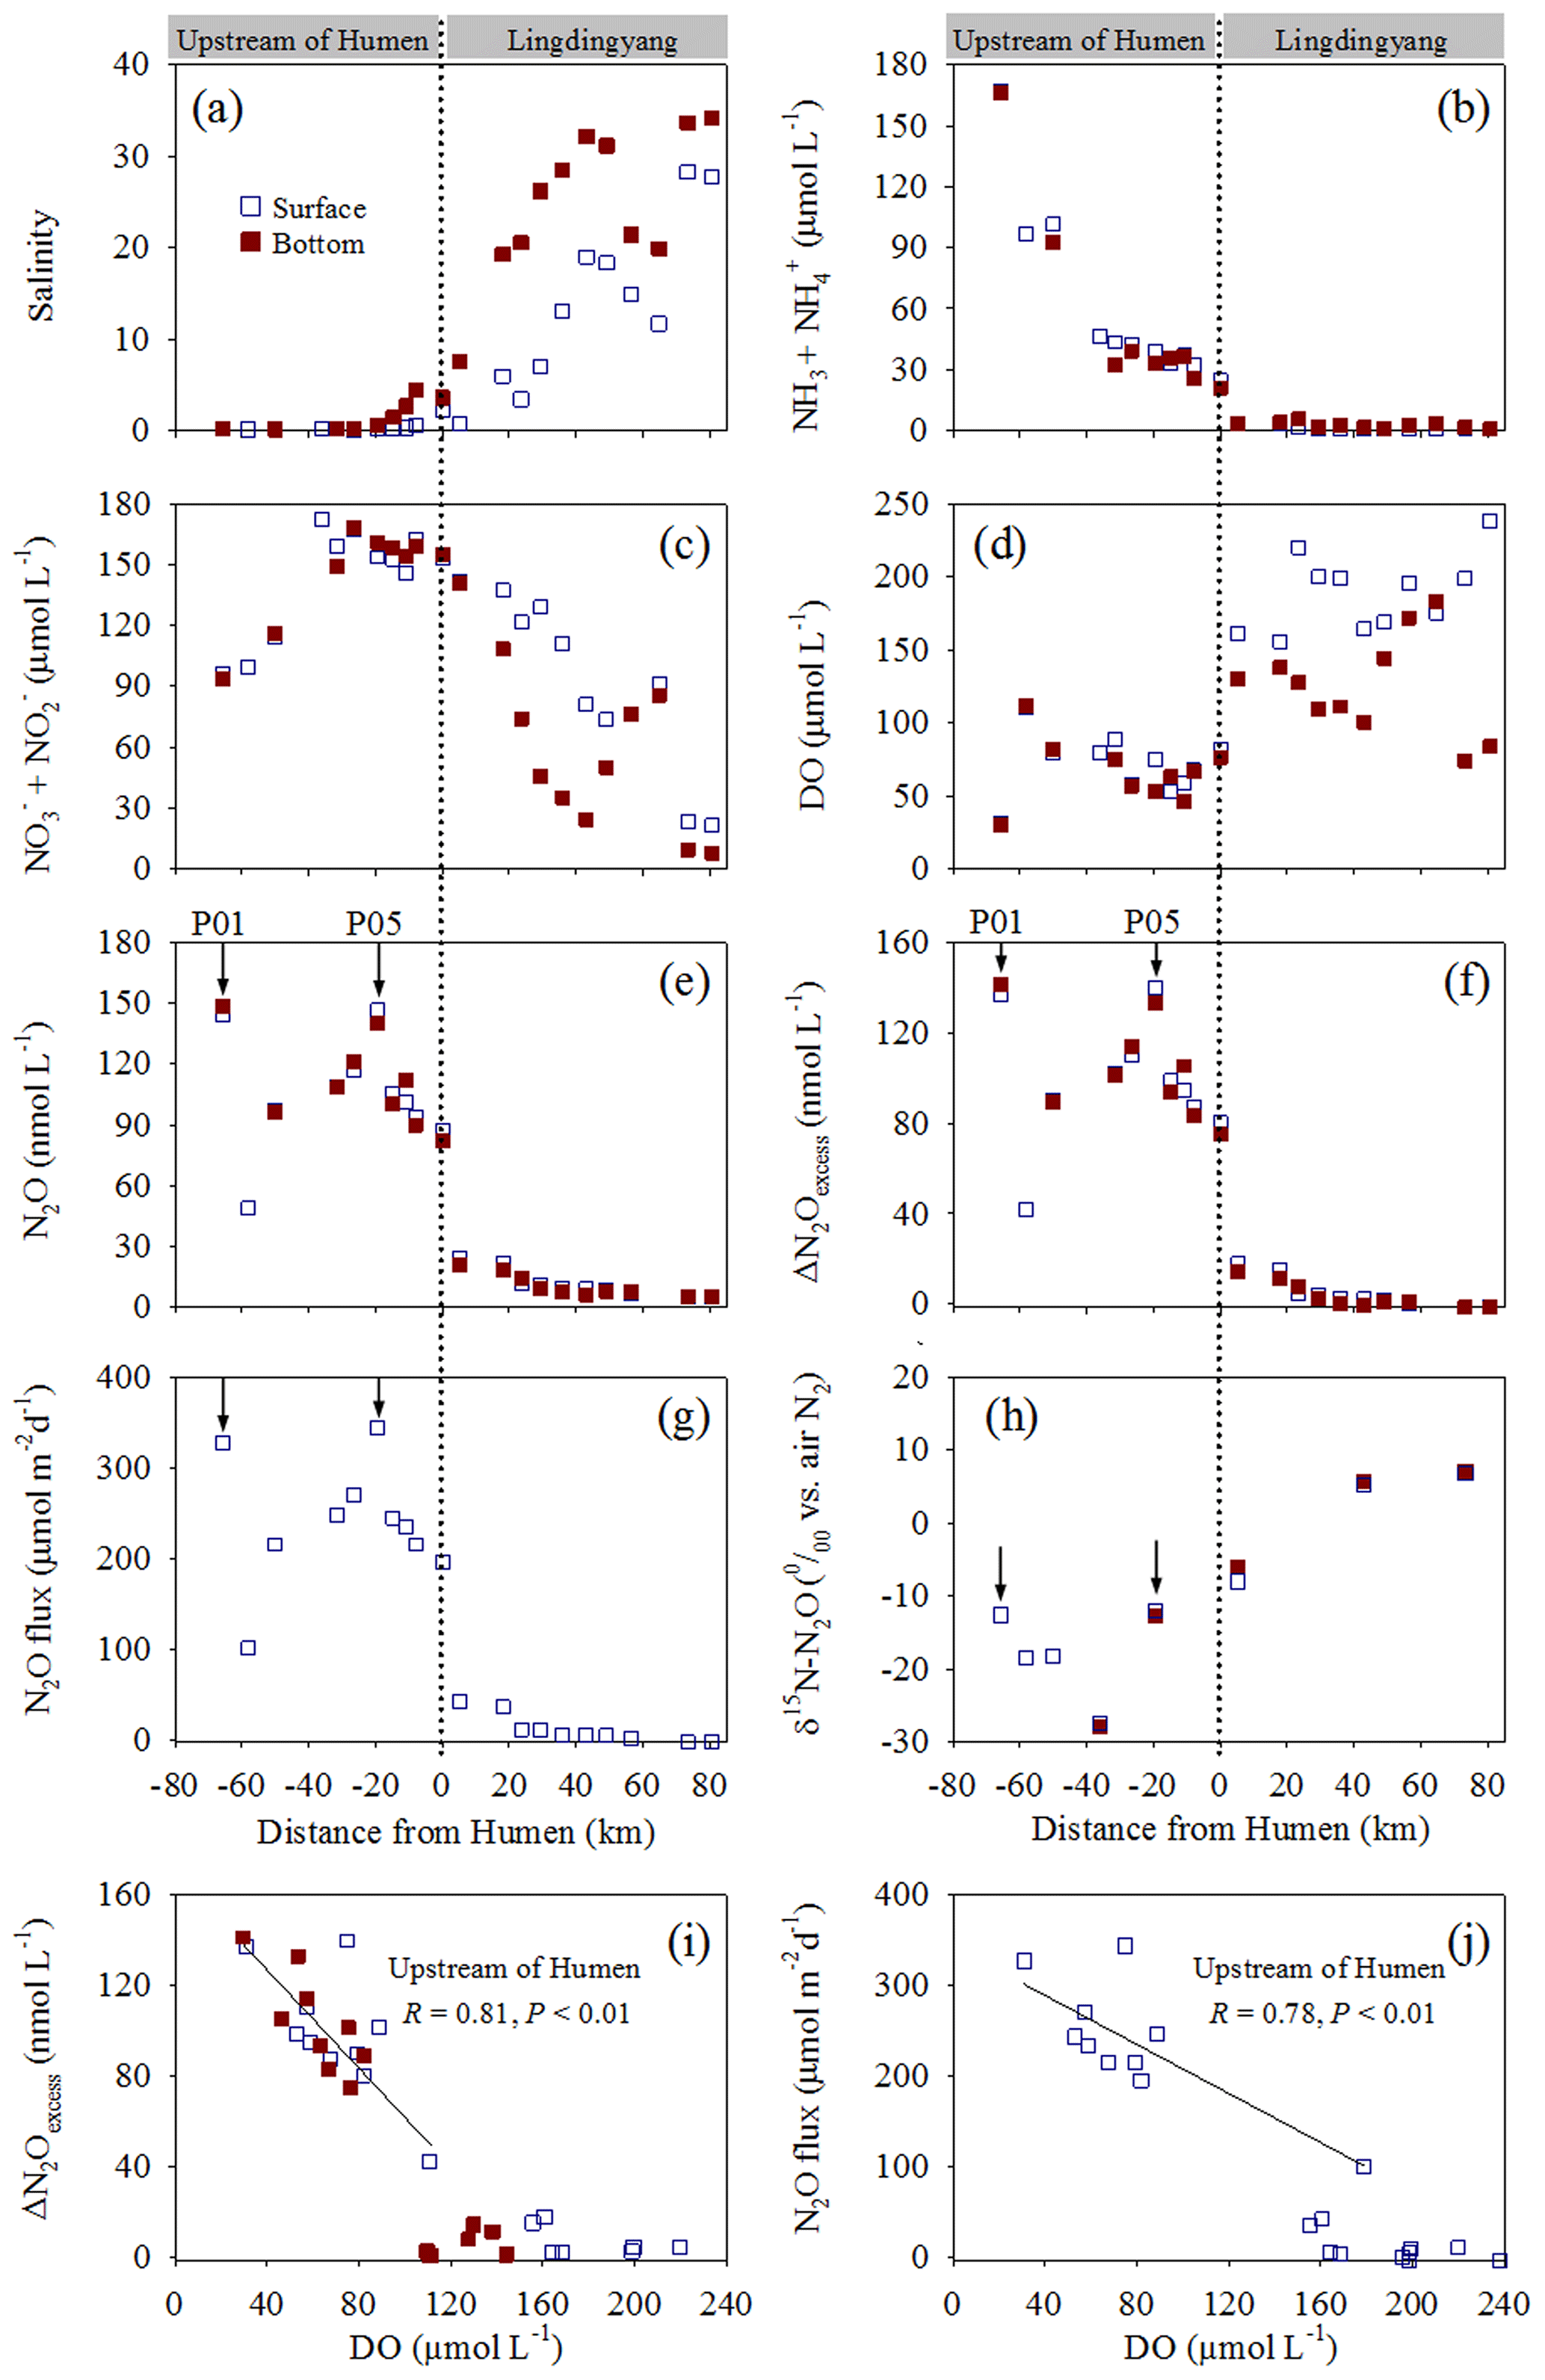
Figure 2Distribution of biogeochemical factors along the Pearl River estuary transect. (a) Salinity, (b) , (c) , (d) DO, (e) N2O, and (f) ΔN2Oexcess concentrations; (g) N2O flux, (h) δ15N-N2O, (i) ΔN2Oexcess vs. DO, and (j) N2O flux vs. DO. The dashed lines show the division of the transect into the northern (upstream of the Humen outlet) and southern (Lingdingyang) areas. The arrows indicate the sites where in situ incubation experiments were performed.
In contrast to the DO concentrations, the N2O concentrations were distinctly higher upstream of the Humen outlet (48.9–148.2 nmol L−1) than in Lingdingyang, where they decreased seaward from 24.6 to 5.4 nmol L−1 (Fig. 2e). Similarly, higher ΔN2Oexcess (42.0–141.3 nmol L−1) with saturations from 701.1 % to 2175.1 % was observed upstream; lower ΔN2Oexcess (−1.4–17.8 nmol L−1) was present in the Lingdingyang area with the saturations ranging from 86 % to 363 % (Fig. 2f). The estimated water–air N2O fluxes were 100.4 to 344.0 µmol m−2 d−1 upstream and decreased in Lingdingyang (42.4 to −2.6 µmol m−2 d−1) (Fig. 2g). Together, the Pearl River estuary acts as a N2O source that releases to the atmosphere, and, notably, a significant negative relationship was observed between ΔN2Oexcess or N2O flux and DO (P < 0.01 for each) in the upstream of the Humen outlet (Fig. 2i and j). The isotopic compositions of N2O (δ15N-N2O) showed an enrichment of 15N2O seaward, varying from −27.9 ‰ to 7.1 ‰ (Fig. 2h). Overall, the upstream of the Humen outlet was characterized by hypoxic waters rich in nitrogen-based nutrients, where ammonium concentrations decreased and the sum of nitrite and nitrate concentrations increased seaward, corresponding to distinctly higher N2O fluxes released to the atmosphere.
3.2 Distributions of amoA and nirS genes along the salinity transect
The total abundance of AOA amoA (sum of free-living and particle-associated communities) varied from 3.10×10³ to 6.87×10⁵ copies L−1 in the surface waters (Fig. 3a) and 6.40×10⁴ to 4.21×10⁷ copies L−1 in the bottom waters; an increase along the salinity transect was observed in the bottom (Fig. 3b). In contrast, the total abundance of AOB amoA generally decreased seaward along the salinity transect for the surface (4.23×10² to 2.13×10⁴ copies L−1) and bottom waters (4.49×10³ to 8.79×10⁴ copies L−1) (Fig. 3c and d). Overall, the abundance of AOA amoA was significantly higher than AOB (P < 0.01). The total abundance of nirS varied from 9.12×10⁴ to 2.00×10⁷ copies L−1 and was higher than both AOA (P < 0.05) and AOB amoA (P < 0.01) in the surface waters and AOB amoA in the bottom water (P < 0.01) (Fig. 3e and f). Notably, these three genes were predominantly distributed in the particle-associated communities compared to the free-living communities in the estuary transect (Fig. 3). The transcripts of the three genes were analyzed in the particle-associated communities of the two incubation sites upstream of the Humen outlet. The transcript abundances of AOA amoA (7.44×10³ to 4.62×10⁵ transcripts L−1) were 1 to 3 orders of magnitude higher than AOB amoA (3.62×10² to 5.00×10² transcripts L−1) at P01 (Fig. 3a–d), whereas the transcript abundances of AOB amoA were relatively higher at P05 (AOB = 8.96×10⁴ to 3.83×10⁵ transcripts L−1; AOA = 1.26×10⁴ to 1.39×10⁵ transcripts L−1). The nirS gene showed a similar transcript level with AOA amoA at P01 (2.20×10⁴ to 6.69×10⁴ transcripts L−1) but a 1-order-of-magnitude-lower transcript level than both AOA and AOB amoA at P05 (8.59×10³ to 1.12×10⁴ transcripts L−1) (Fig. 3e and f).
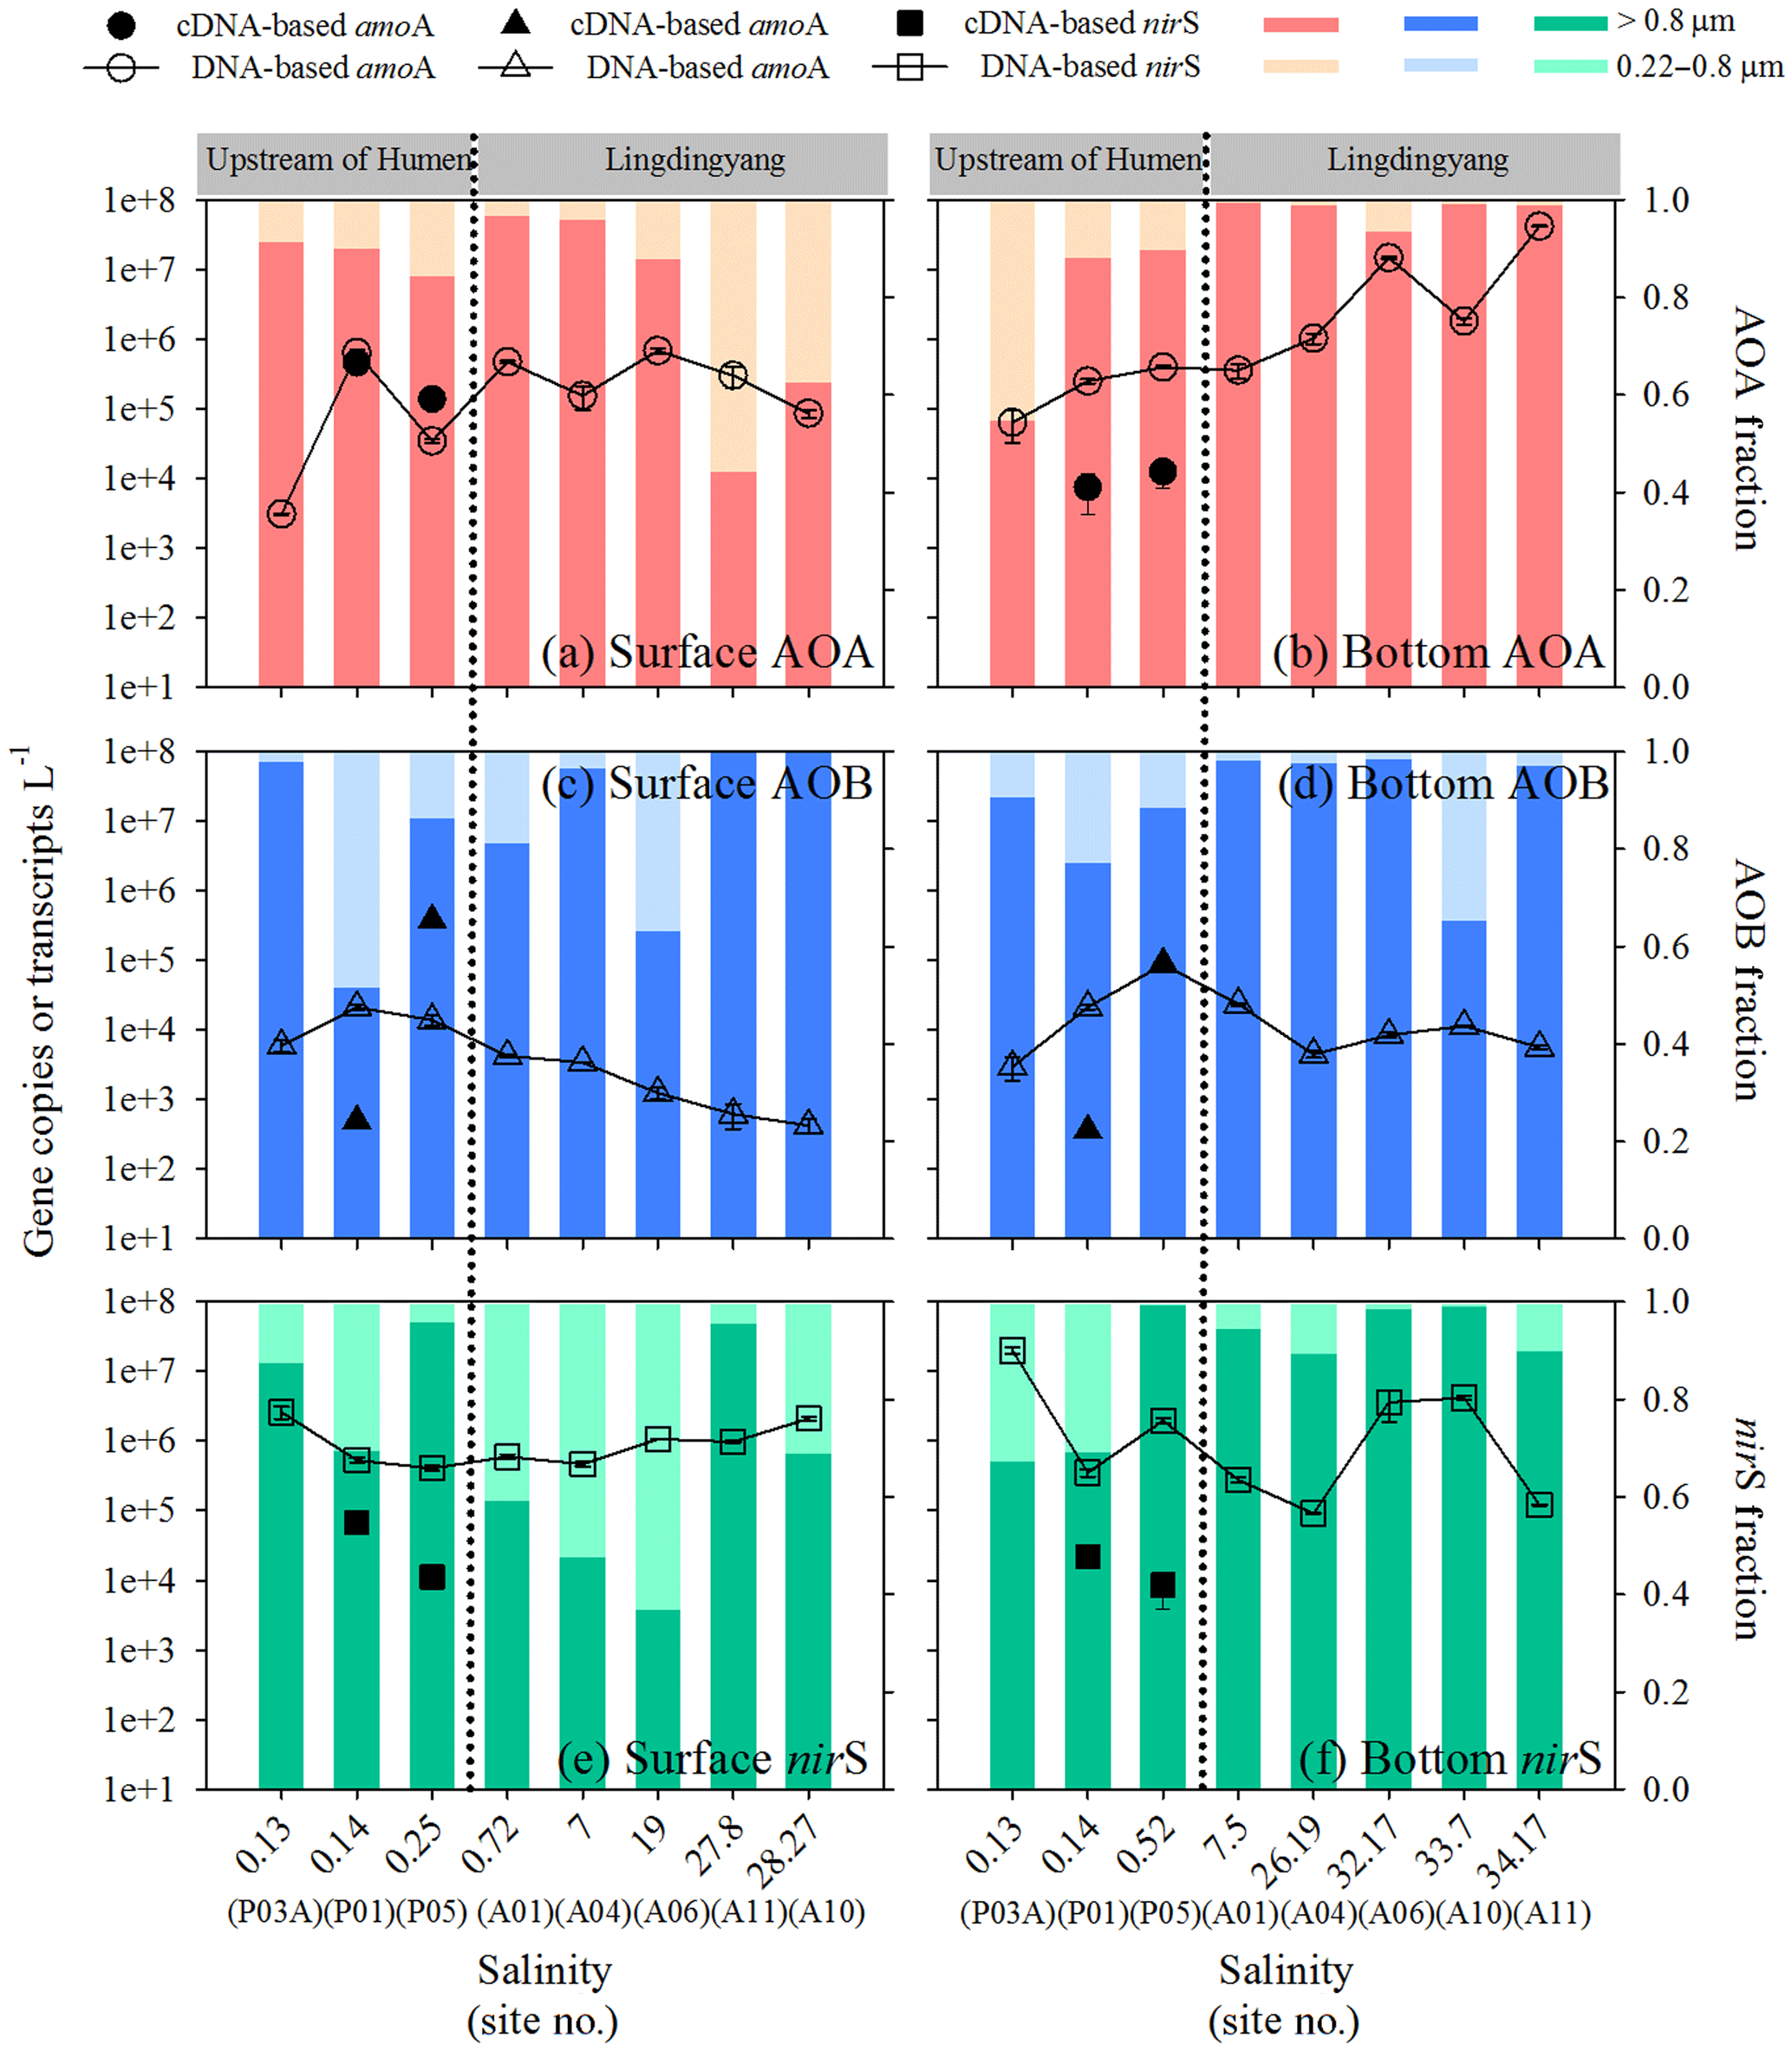
Figure 3Abundance distribution of AOA and AOB amoA and bacterial nirS along the salinity gradient in the Pearl River estuary. Abundances of AOA amoA genes (open circles) and particle-associated transcripts (closed circles) and the relative abundances of particle-associated and free-living AOA amoA genes in (a) surface and (b) bottom waters. Abundances of AOB amoA genes (open triangles) and particle-associated transcripts (closed triangles) and the relative abundances of particle-associated and free-living AOB amoA genes in (c) surface and (d) bottom waters. Abundances of bacterial nirS genes (open squares) and particle-associated transcripts (closed squares) and the relative abundances of particle-associated and free-living nirS genes in (e) surface and (f) bottom waters. The dashed lines indicate the division into the northern (upstream of the Humen outlet) and southern (Lingdingyang) areas.
3.3 Correlations between gene abundances and biogeochemical parameters
We analyzed the correlations between the gene abundances of AOA, AOB, or denitrifiers and biogeochemical parameters. The results indicate that AOA amoA abundance was significantly correlated (P < 0.05–0.01) to the hydrographic parameter temperature (negative) and salinity (positive), as well as silicate concentration (negative) (Table 1). However, AOB amoA abundance was significantly correlated (P<0.05–0.01) to TSM concentration (positive), pH (negative), and DO (negative). Notably, there were positive correlations between AOB amoA abundances and all N2O parameters as well as ammonia concentrations (Table 1; P<0.05–0.01) except for the extremely low abundance of free-living AOB. No significant Spearman correlations were found between bacterial nitrite reductase nirS abundance and the measured biogeochemical parameters.
Table 1Rho (ρ) values for the relationships between nitrifier and denitrifier gene abundances and biogeochemical parameters in the Pearl River estuary.

a Surface data. ∗ False discovery rate-adjusted P<0.05. False discovery rate-adjusted P<0.01. PA, particle-associated communities. FL, free-living communities.
The redundancy analysis was used to further analyze variations in the AOA and AOB distributions under environmental constraints. The results confirmed that the relatively high AOB abundances in the upper estuary were constrained by low-salinity water, high nitrite and TSM concentrations, low-DO conditions, and high N2O concentrations, whereas high-salinity water and opposite environmental conditions constrained the relatively high AOA abundances in the Lingdingyang area (Fig. 4). These constraints explained 89.3 % of the variation in the ammonia oxidizer distribution along the estuary. Apparently, the communities with relatively high AOB abundances in the upper estuary positively influenced the concentration of N2O in the water.

Figure 4The redundancy analysis of the relative abundance of AOA amoA and AOB amoA under biogeochemical constraints. PA, particle-associated; FL, free-living. Each square represents an individual sample. Vectors represent environmental variables. ∗ P<0.05, P<0.01 (Monte Carlo permutation test).
3.4 Nitrogen transformation and N2O production in the incubation experiments
The in situ biogeochemical conditions of the incubation experiments are shown in Fig. 2 and listed in Table S1 in the Supplement. Site P01 exhibited the lowest in situ DO concentrations (30.0 µmol L−1 in the bottom water and 30.9 µmol L−1 in the surface water). The concentration of DIN was generally unchanged in the early-to-middle (0–18 h) phase for the P01 surface water and early (0–6 h) phase for the P01 bottom water but showed a distinct decrease in the end phase (Fig. 5a). The ammonia and nitrite concentrations consistently decreased and increased, respectively, during the incubation experiments; the nitrate concentrations decreased in the end phase after a slight increase (Fig. 5b). These results clearly indicate that nitrification occurred during the entire P01 incubations and suggest that denitrification may be present in the end phase (Fig. 5g). The rates of ammonia oxidation during the entire incubations and nitrite oxidation during the early or early-to-middle phases were estimated by linear regressions of ammonia and nitrate concentrations, respectively (Fig. 5a and b; Table 2). Correspondingly, the estimated average N2O production rate (24 h) was 0.62 nmol L−1 h−1 in P01 surface water and 0.70 nmol L−1 h−1 in P01 bottom water; the estimated N2O production rates from nitrification were 0.60 nmol L−1 h−1 in the surface water (18 h) and 1.61 nmol L−1 h−1 in the bottom water (6 h; Fig. 5c). Thus, the estimated N2O yield in the surface and bottom waters based on nitrification was 0.26 % and 0.30 % (Table 2).
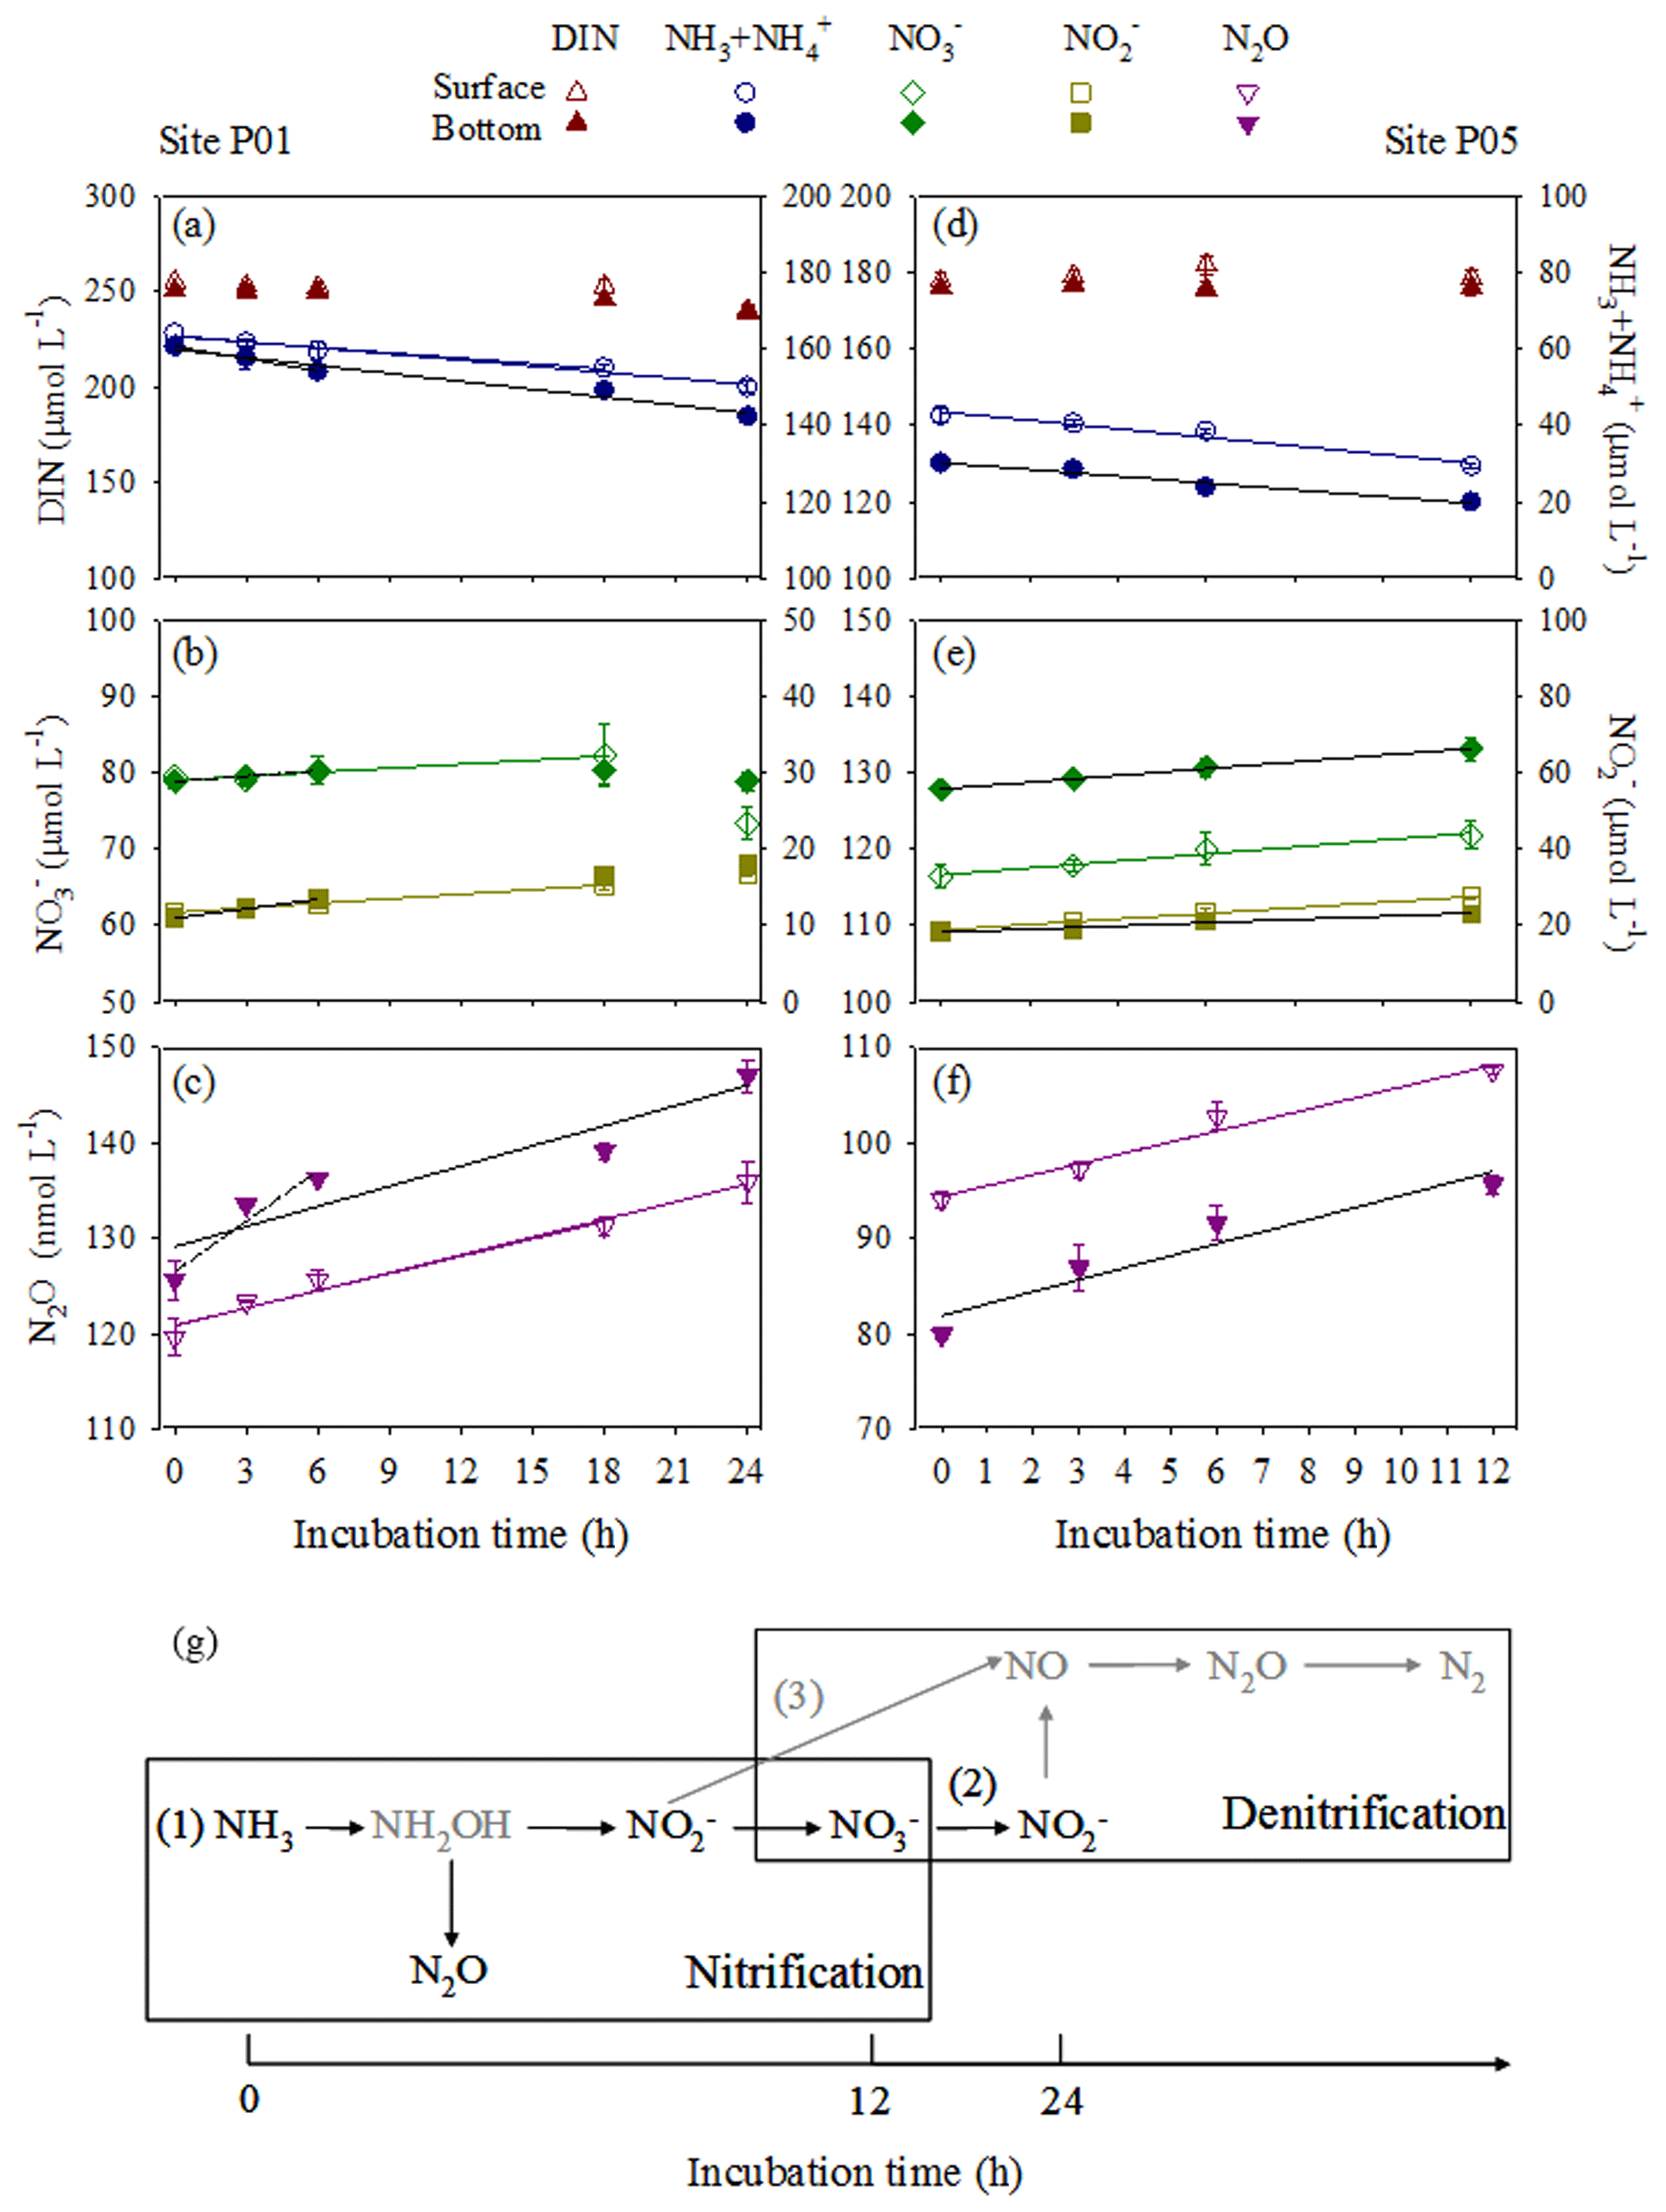
Figure 5Variations in nitrogen compounds and N2O concentrations at sites P01 and P05 during the incubation experiments in surface (open symbols) and bottom (closed symbols) waters. (a, d) Total DIN (brown triangles) and (blue circles), (b, e) (green diamonds) and (dark yellow squares), and (c, f) N2O (purple inverted triangles). Linear regressions depend on whether variations in DIN concentration against time retain mass balance in a closed incubation system. The linear regressions of ammonia were used to estimate ammonia oxidation rates in (a) P01 over 18 and 24 h (surface water, blue lines) and 6 and 24 h (bottom water, black lines), as well as (d) P05 over 12 h (surface, blue line; bottom, black line). The linear regressions of nitrate estimated nitrite oxidation rates in (b) P01 over 18 h (surface water, green line) and 6 h (bottom water, black line), as well as (e) P05 after 12 h (surface, green line; bottom, black line). The nitrite linear regressions after 18 h (surface water, dark yellow line) and 6 h (bottom water, black line) in P01 and 12 h (surface, dark yellow line; bottom, black line) in P05 are also shown but do not indicate oxidation rates. The N2O linear regressions were used to estimate N2O production rates in (c) P01 after 18 and 24 h (surface water, purple lines) and 6 and 24 h (bottom water, black lines; dashed line, no statistical significance test), as well as (f) P05 after 12 h (surface, purple line; bottom, black line). All regression equations, R2 values, and P values are shown in Table 2. (g) A diagram showing transformations of nitrogen compounds and N2O production during incubation experiments. Nitrification (1) occurred during the entire P01 and P05 incubations and denitrification (2 and/or 3) may be present in the end phase of the P01 incubation. The gray arrows indicate the pathways of nitrogen loss not analyzed here, and the gray compounds indicate the unmeasured nitrogen compound.
Table 2Linear regressions of ammonia, nitrite, nitrate, and N2O concentrations against time and N2O yields during incubation experiments.
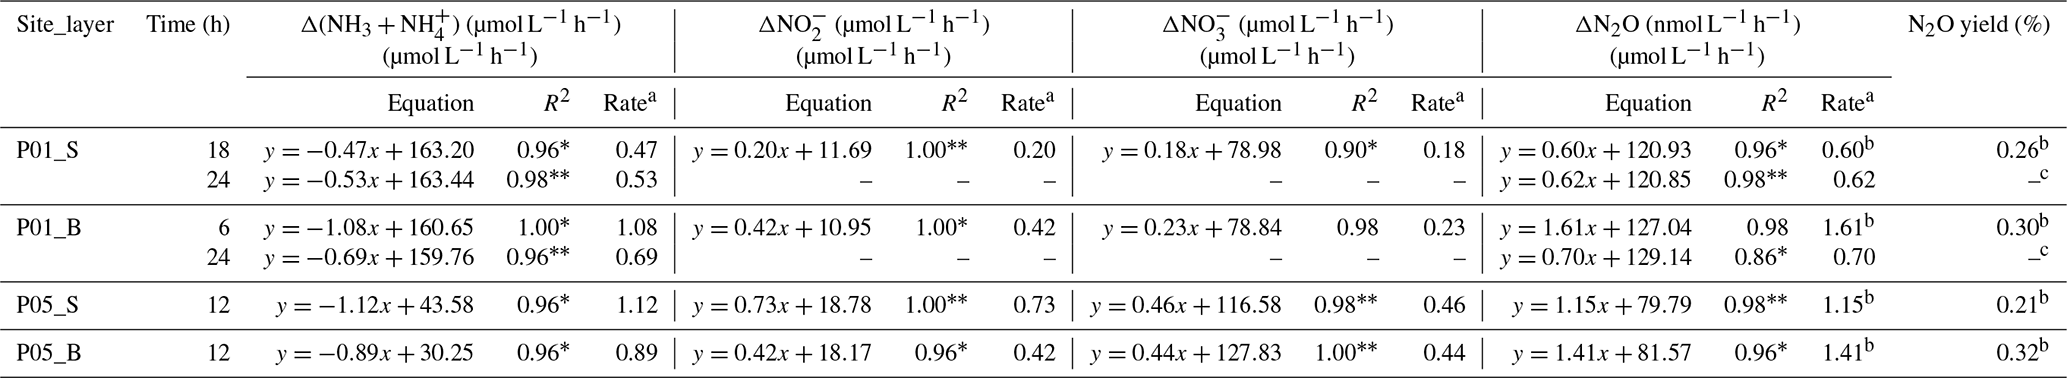
a These rates are net rates since Δ() is the net consumption and Δ, Δ, and ΔN2O are the net production during incubation. b These rates and yields (when only nitrification occurred) were used to calculate the average amoA gene copy-specific N2O production rates and N2O yields in Fig. 7. c No estimation of N2O yield was made due to nitrification, and denitrification may occur concurrently and DIN was not in balance. ∗ P<0.05; P<0.01. “–” indicates no regression analysis or no estimation made due to DIN was not in balance.
In the incubation experiments at site P05, the DIN concentrations remained unchanged (Fig. 5d), and the ammonia concentrations consistently decreased and the nitrite and nitrate concentrations increased (Fig. 5e). The rates of ammonia and nitrite oxidation were also estimated by linear regressions of ammonia and nitrate concentrations, respectively (Fig. 5d and e; Table 2). The ammonia oxidation rates were approximately equal to the sum of the increased nitrite and nitrate concentration rates. Thus, nitrification occurred during the incubation experiments without denitrification. The estimated N2O production rates from nitrification were 1.15 nmol L−1 h−1 in the P05 surface water and 1.41 nmol L−1 h−1 in the P05 bottom water (Fig. 5f); the estimated N2O yields based on nitrification were 0.21 % (surface) and 0.32 % (bottom) (Table 2).
The N2O production rates and yields normalized to total AOA and AOB amoA gene copies (sum of particle-associated and free-living fractions or only particle-associated fractions) or transcripts (only particle-associated fraction) were calculated (Table S3). The highest average amoA gene copy-specific N2O production rates and yields were in the surface water of site P05, where the highest nitrification rate was observed (Table 2). The highest average amoA gene transcript-specific N2O production rates and yields were in the bottom water of site P01, where the highest N2O production rate was observed (Table 2).
4.1 Contribution of nitrification versus denitrification to N2O production in the hypoxic upper estuary
The spatial variations of N2O concentration, its saturation, and water–air N2O flux along the Pearl River estuary are consistent with our previous study (Lin et al., 2016), indicating that higher N2O in the upper estuary ensures the Pearl River estuary acts as a source of atmospheric N2O. The in situ incubation experiments clearly indicated that nitrification predominantly occurred in the hypoxic waters (e.g. both the P01 and P05 sites) of the upper estuary along with significant N2O production and suggested that denitrification could be concurrent at the lowest DO site (P01) where the maximum N2O and ΔN2Oexcess concentrations were observed (Figs. 2 and 5). These results confirm previous speculation that extreme enrichment of ammonia in the water column due to high loads of anthropogenic-sourced nutrients and organic matter in an upper estuary (Dai et al., 2008; He et al., 2014) could result in strong nitrification under low-O2-solubility conditions (Dai et al., 2008); thus, N2O is produced as a byproduct through nitrification and is oversaturated in the Pearl River estuary (Lin et al., 2016). The estuary sediments also act as a source of N2O, which is released into the overlying waters through denitrification (Tan et al., 2019); however, in estuarine waters, nitrification apparently is the main source of N2O production. Previous studies also proposed that nitrification may be the major source of N2O production in the water column in estuarine systems, such as the Guadalquivir (Huertas et al., 2018), Scheldt (De Wilde and De Bie, 2000), and Chesapeake Bay (Laperriere et al., 2019). However, in the estuarine sediments, N2O production was attributed to both nitrification and denitrification, such as in the Tama River (Japan) (Usui et al., 2001) and Yangtze (China) estuaries (Liu et al., 2019; Wang et al., 2019), where denitrification is the major nitrogen removal pathway with N2O production and consumption.
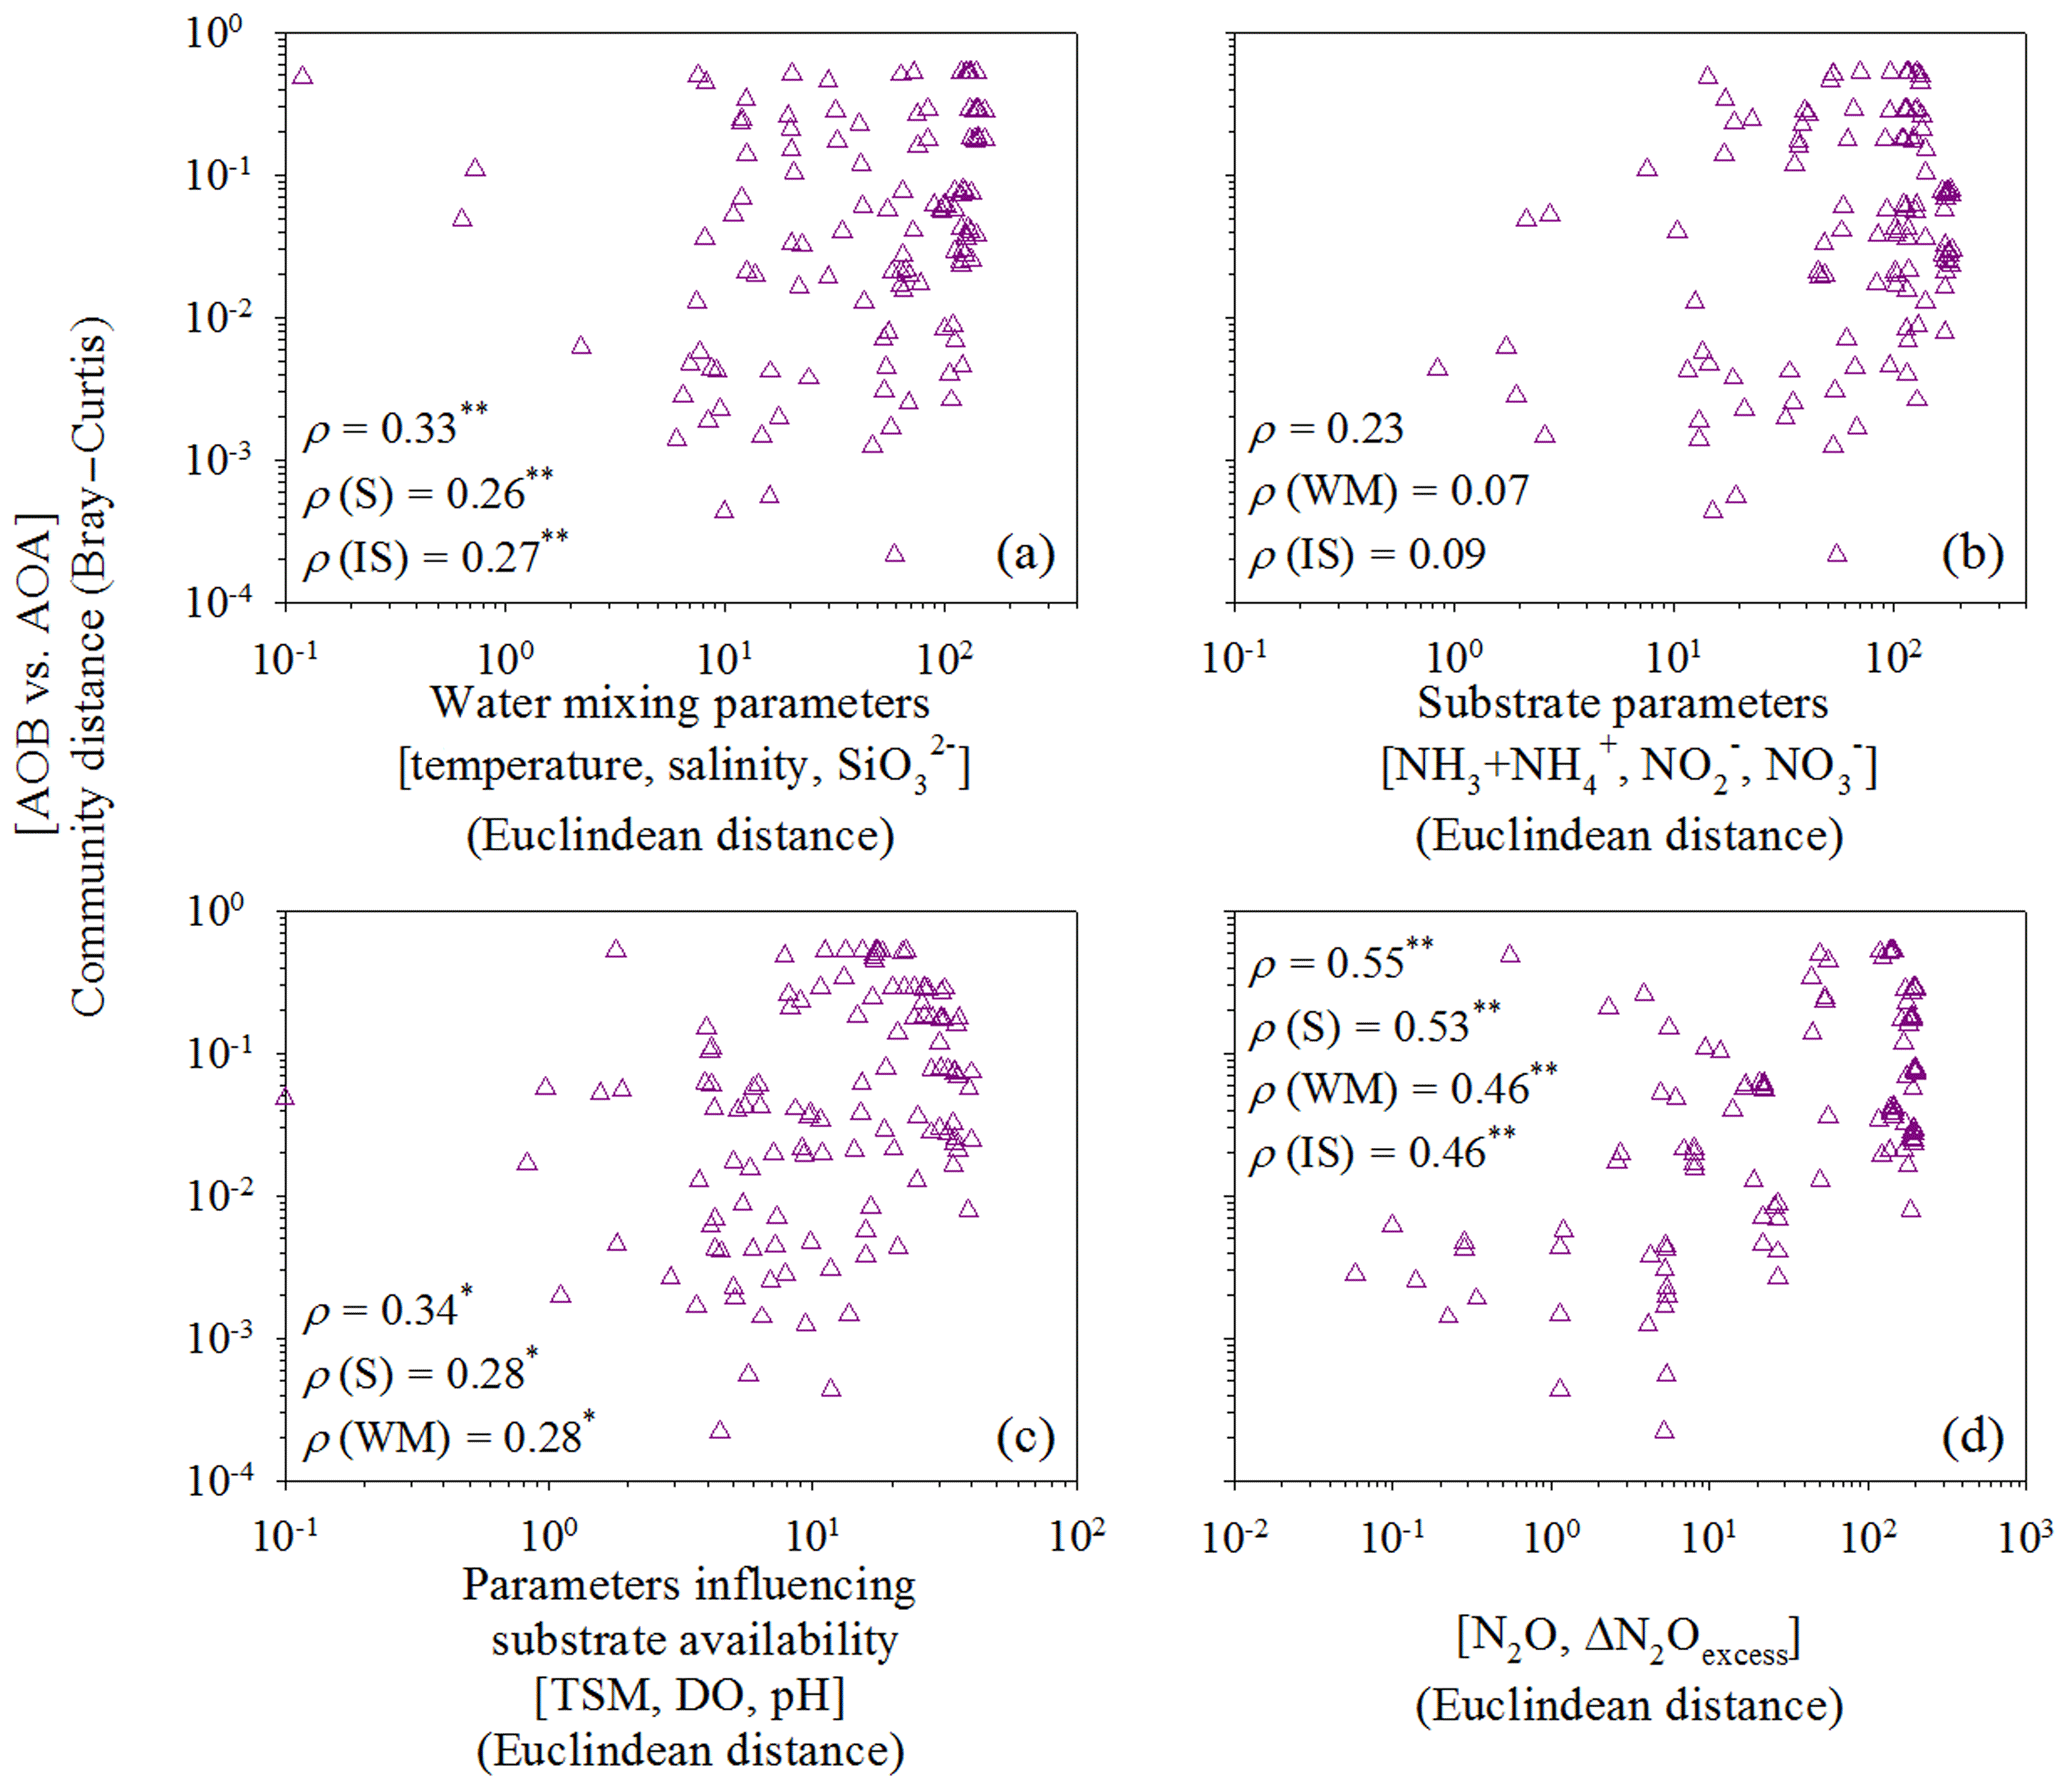
Figure 6Correlations between the relative abundance of AOB versus AOA and (a) water mixing parameters (temperature, salinity, and silicate), (b) substrate parameters (ammonia/ammonium, nitrite, and nitrate), (c) parameters influencing substrate availability (TSM, DO, and pH), or (d) N2O parameters (N2O and ΔN2O). The ammonia oxidizer matrix was calculated according to the relative AOA and AOB abundances. Dissimilarity matrices of the relative abundance of AOB amoA and AOA amoA were based on Bray–Curtis distances and environmental factors were based on Euclidean distances between samples. Standard and partial Mantel tests were run to measure the correlation between two matrices. Spearman correlation coefficient (ρ) values are shown for standard (first value) and partial Mantel (second, third, and fourth) tests. The P values were calculated using the distribution of the Mantel test statistics estimated from 999 permutations. ∗ P<0.05; P<0.01.
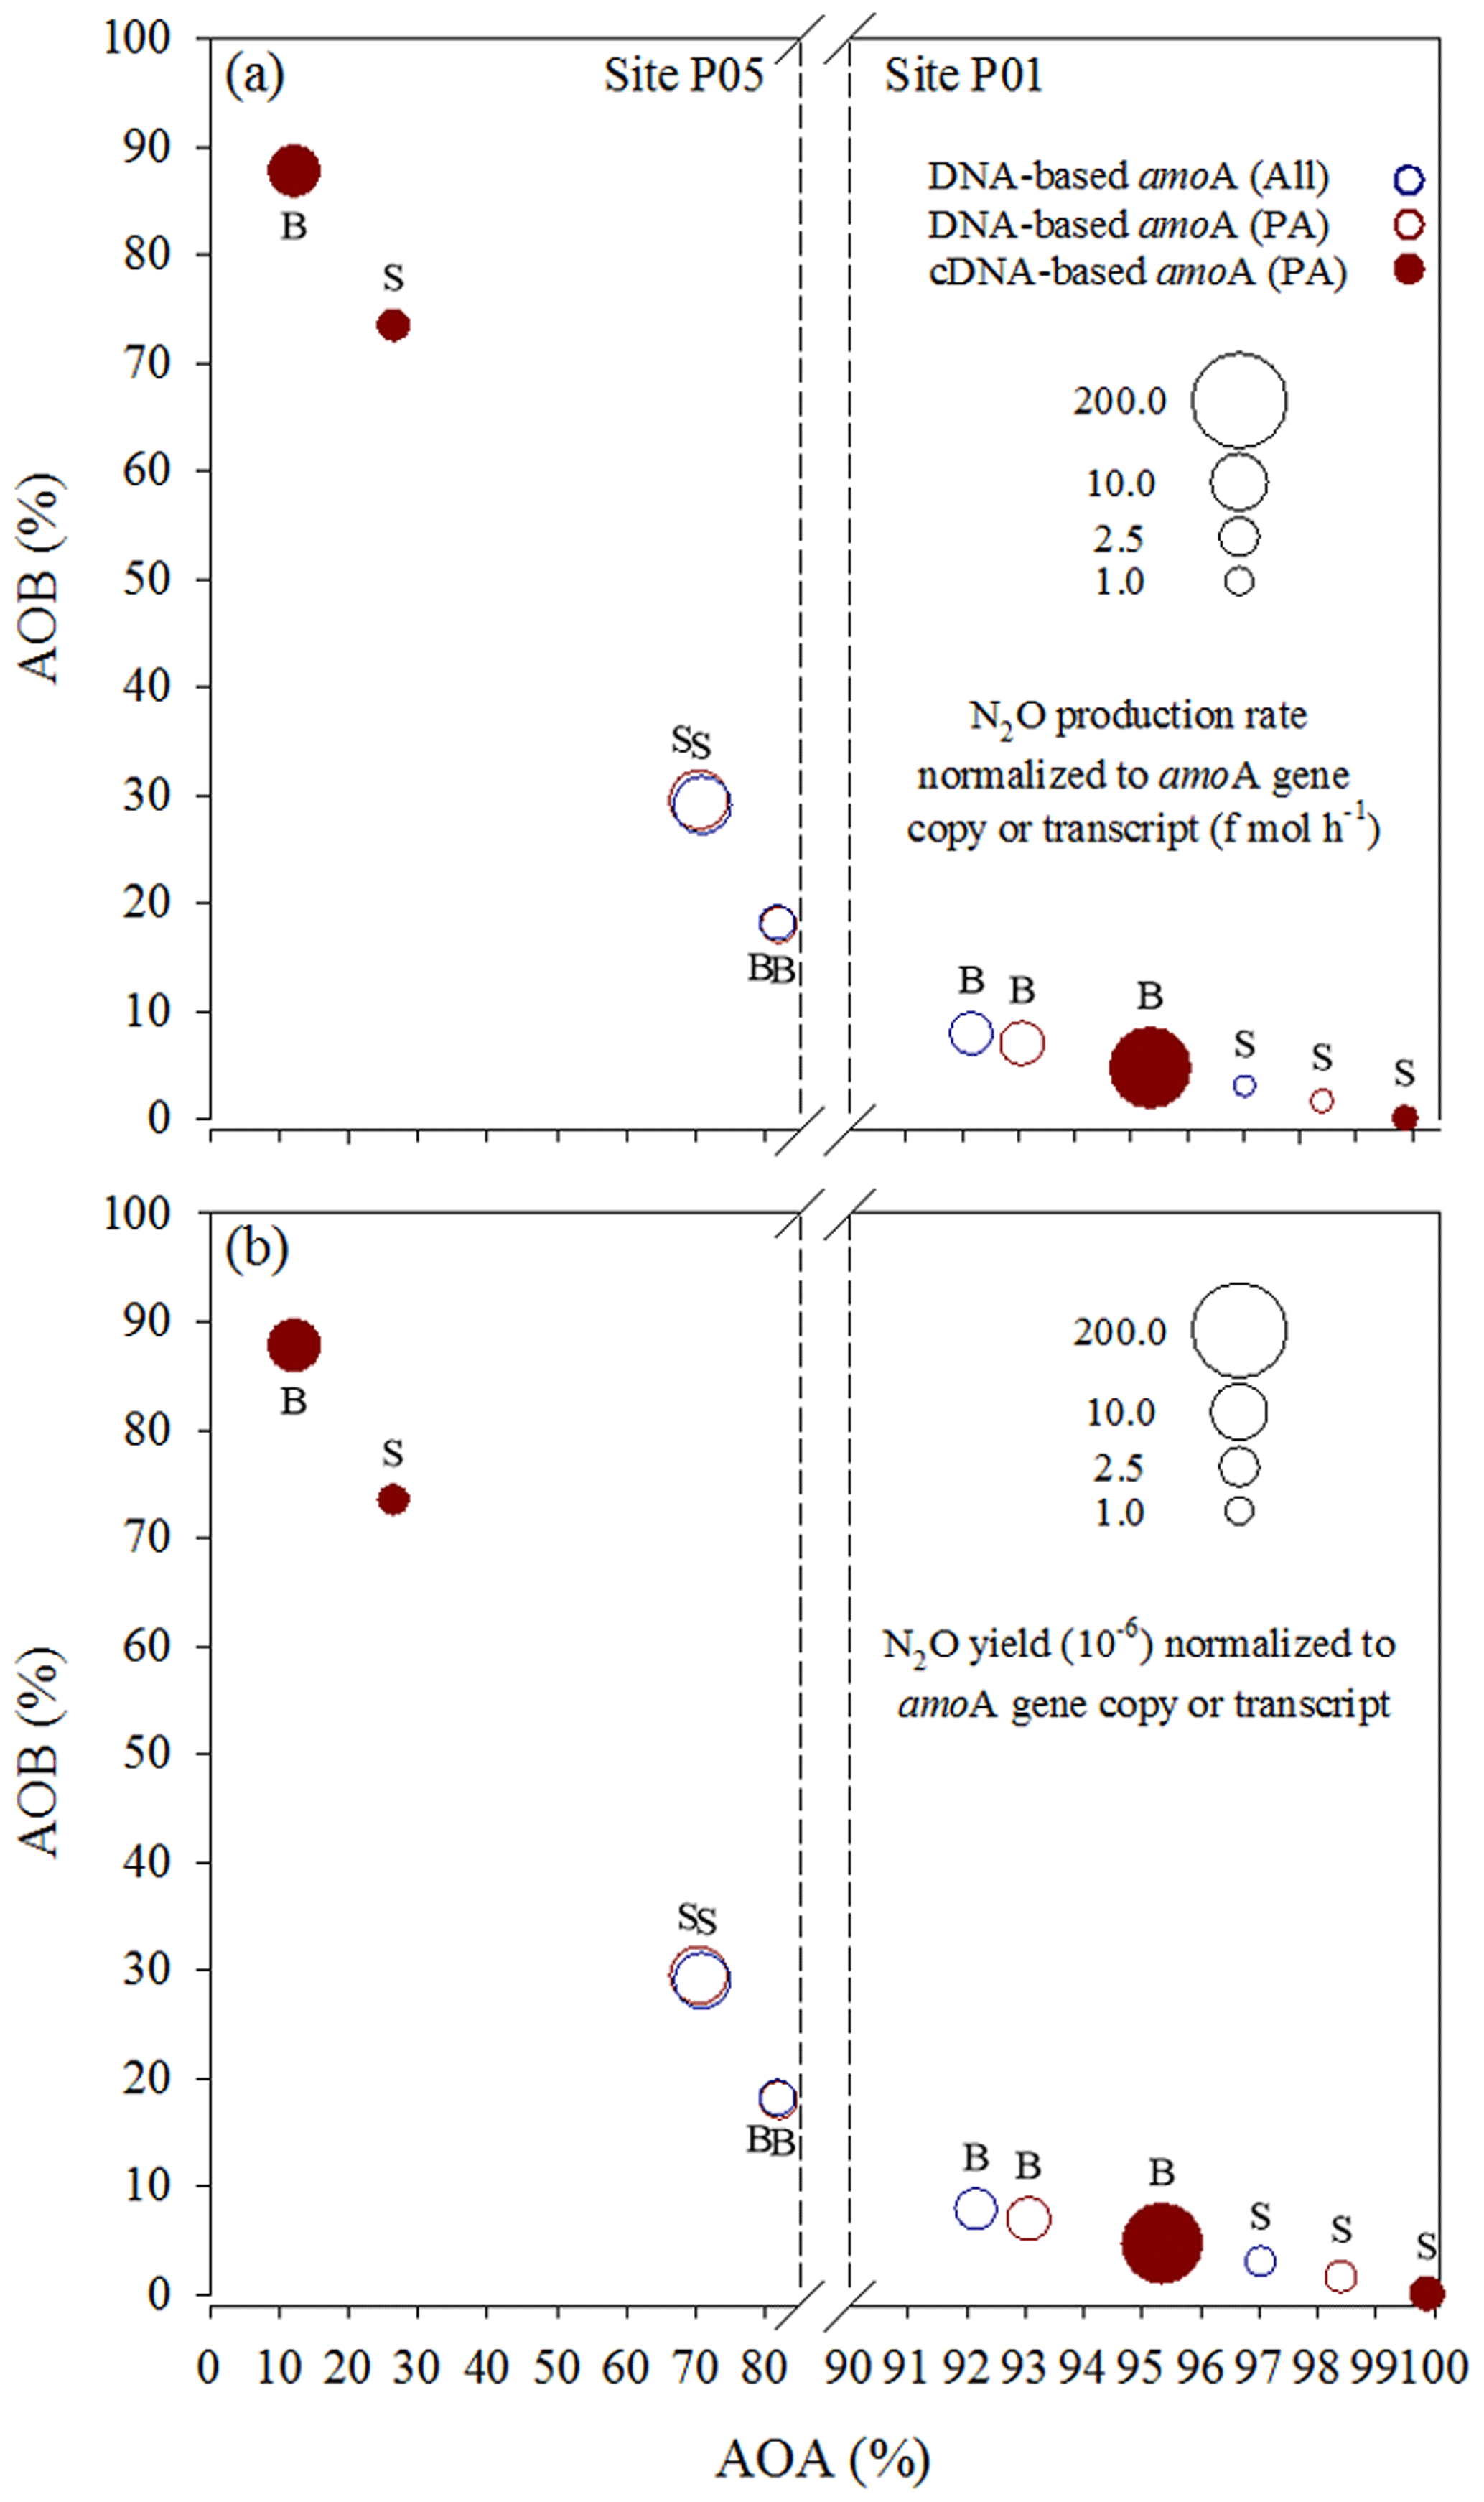
Figure 7N2O (a) production rates and (b) yields normalized to total amoA gene copy or transcript numbers of AOA and AOB in a given sample. They are presented along the x–y axes that represent the relative contributions of AOA and AOB to the total amoA gene or transcript pools. S: surface; B: bottom. All, sum of free-living and particle-associated communities; PA, particle-associated communities.
The isotopic composition of N2O (δ15N-N2O) was consistent with the above interpretation. According to previous studies (Table S2), the δ15N of N2O produced during ammonia oxidation by AOB strains ranged from −68 ‰ to −6.7 ‰ (Yoshida, 1988; Sutka et al., 2006; Mandernack et al., 2009; Frame and Casciotti, 2010; Jung et al., 2014; Toyoda et al., 2017) and from 6.3 ‰ to 10.2 ‰ in a marine AOA strain (Santoro et al., 2011). The δ15N of N2O produced during denitrification ranged from −37.2 ‰ to −7.9 ‰ (Toyoda et al., 2005); during nitrifier denitrification by AOB strains it ranged from ‰ to −21.5 ‰ (Sutka et al., 2003, 2006; Frame and Casciotti, 2010). Therefore, the much lower δ15N-N2O (−27.9 ‰ to −12.6 ‰) upstream of the Humen outlet is consistent with AOB nitrification or denitrification processes, whereas enriched 15N-N2O (5.2 ‰–7.1 ‰) in the lower reaches approaches AOA nitrification and air 15N-N2O (Santoro et al., 2011). Taken together, the isotopic compositions of N2O (Fig. 2h) and N2O concentration distribution (Fig. 2e–g) suggest that the high concentrations of N2O (oversaturation) were produced from strong nitrification by AOB and probably concurrent minor denitrification in the upper estuary; however, in the lower reaches, low concentrations of N2O could be explained by AOA nitrification or water atmospheric exchange of N2O.
4.2 Correlations of AOB versus AOA with N2O-related biogeochemical parameters along the Pearl River estuary
The more abundant AOA amoA genes, relative to AOB, and the more abundant genes in the particle-associated communities than free-living communities are consistent with our previous study in the Pearl River estuary (Hou et al., 2018), which also reported significant positive correlations between the AOB amoA gene abundance and the oxidation rate of ammonia to nitrate. This suggests that AOB might be active in the ammonium and particle-enriched estuary despite their low abundance (Füssel, 2014; Hou et al., 2018). Lower oxygen availability in particle microniches has been reported to be favorable for both nitrification and denitrification potential in oxygenated water (Kester et al., 1997). The Spearman correlations and redundancy analysis in this study indicate that high nutrient and TSM concentrations and low-DO and low-pH conditions were favorable for relatively high abundance of AOB in the upper estuary, which is also consistent with our previous Pearl River estuary study that found high TSM concentrations and low DO and pH influenced substrate availability and thus AOB distribution (Hou et al., 2018). Moreover, AOB amoA abundances positively correlated to all N2O-related parameters as revealed by the Spearman correlations and redundancy analysis, suggesting a significant influence of AOB (mainly the particle-associated fraction) on N2O production/emission in the upper estuary. However, compared to AOB, AOA amoA distribution along the estuary transect appears to be regulated more by water mixing since AOA was significantly correlated to the hydrographic parameters and silicate concentration.
To further eliminate the covarying effects of water mixing, substrate availability, and N2O-related parameters along the salinity transect, and to identify the intrinsic/direct relationship between ammonia oxidizers and N2O production, we performed standard and partial Mantel tests. We defined four types of environmental constraints: water mixing parameters (temperature, salinity, and silicate), substrate parameters (ammonia/ammonium, nitrite, and nitrate), parameters influencing substrate availability (DO, TSM, and pH), and N2O-related parameters (N2O and ΔN2Oexcess). For the water mixing parameters, we analyzed the relationships between potential temperature (θ), salinity, and silicate concentration with a three-dimensional scatter plot (Fig. S1 in the Supplement) that indicates low salinity and high silicate contents were the best indicators for river input in the ocean (Moore, 1986). Thus, we chose temperature, salinity, and silicate as proxies to trace estuarine water masses and mixing. Water mixing parameters (standard and partial Mantel tests, P<0.01) and those influencing substrate availability (standard and partial Mantel tests, P<0.05) significantly controlled variations in the distribution of AOA and AOB along the estuary transect (Fig. 6a and c), supporting the Spearman and redundancy analyses conclusions. Notably, variations in the distribution of AOA and AOB were significantly correlated with N2O production (standard and partial Mantel test, P<0.01) after eliminating the covarying effects of other parameters (Fig. 6d), demonstrating the significant contribution of ammonia oxidizers to N2O production.
4.3 Contribution of AOB versus AOA to N2O production
We attempted to accurately assess the relative contributions of AOA and AOB to N2O production in the Pearl River estuary by plotting the N2O production rates (Fig. 7a) and yields (Fig. 7b) normalized to total (sum of AOA and AOB) amoA gene copies or transcripts at sites P01 and P05 along the x–y axes that represent the relative contributions of AOA and AOB to the total amoA gene or transcript pools. Notably, compared to AOA, higher AOB abundance in the amoA gene-based DNA or cDNA pool resulted in distinctly higher (disproportionately higher relative to enhanced abundance) average amoA gene copy- or transcript-specific N2O production rates (Fig. 7a) and yields (Fig. 7b), suggesting that AOB may have higher cell-specific activities in the upper estuary and thus be more active in producing N2O than AOA. Previous studies based on pure cultures of AOB and AOA strains provided evidence that AOB have higher N2O yields (0.09 % to 26 %) (Yoshida and Alexander, 1970; Goreau et al., 1980) than AOA (0.002 % to 0.09 %) during ammonia oxidation (Löscher et al., 2012; Stieglmeier et al., 2014). The higher N2O yield from AOB has also been observed in soils despite a lower abundance of AOB (Hink et al., 2017, 2018). Based on results indicated by Fig. 7, we conclude that AOB may have higher relative contributions to the high N2O production in the upper estuary where low DO, high concentrations of N2O and ΔN2O, and high N2O flux were observed.
Ammonia oxidizers are sensitive to oxygen during N2O production (Santoro et al., 2011; Löscher et al., 2012; Stieglmeier et al., 2014). Studies based on pure cultures of AOB strains Nitrosomonas marina NM22 and Nitrosococcus oceani NC10 and AOA strain Nitrosopumilus maritimus showed higher N2O yields and production during nitrification by both AOA and AOB when O2 concentrations varied from aerobic to hypoxic conditions (Löscher et al., 2012). However, when O2 concentrations varied from hypoxic to anaerobic conditions (i.e. in a lower O2 concentration range), the AOB strain Nitrosospira multiformis and AOA strains Nitrososphaera viennensis and Nitrosopumilus maritimus showed that AOB had distinctly higher N2O yields at lower oxygen conditions and, in contrast, AOA had lower N2O yields at lower oxygen concentrations (Stieglmeier et al., 2014). In addition, results from the cultured AOB strain Nitrosomonas marina C-113a indicated increasing N2O yields with higher cell concentrations (Frame and Casciotti, 2010). This evidence supports our conclusions that the high concentration of N2O (oversaturated) may be mainly produced from strong nitrification by the high abundance of AOB in the low-DO conditions in the upper estuary.
In addition, it is possible that comammox (complete ammonia oxidizer) species, newly discovered in terrestrial systems (Daims et al., 2015; Santoro, 2016; Kits et al., 2017), are also involved in N2O production (Hu and He, 2017) given the similar ammonia oxidation pathway to AOB. It has been further reported that the comammox Nitrospira inopinata has a lower N2O yield than AOB due to a lack of NO reductases and the formation of N2O from the abiotic conversion of hydroxylamine (Kits et al., 2019). However, comammox has not been widely observed in estuarine waters. Also, nirK-type denitrifiers may contribute to N2O production despite being much less abundant than nirS-type denitrifiers (Huang et al., 2011; Maeda et al., 2017). Furthermore, nirS-type denitrifiers are more likely to be capable of complete denitrification because of a higher co-occurrence of the N2O reductase gene (nosZ) with nirS than nirK (Graf et al., 2014). However, there is currently no direct evidence that denitrification or nitrifier denitrification is responsible for N2O production in the Pearl River estuary water column. A release of N2O into the overlying waters through denitrification was reported for the estuary sediments (Tan et al., 2019). Further study is needed to clarify the potential of both nirK- and nirS-type denitrifiers in N2O production from the interface between sediment and water in the Pearl River estuary.
This study explored the relative contributions of AOB and AOA in producing N2O in the Pearl River estuary by combining isotopic compositions and concentrations of N2O, distributions and transcript levels of AOB and AOA amoA and denitrifier nirS genes, and incubation estimates of nitrification and N2O production rates. Our findings indicate that the high concentrations of N2O and ΔN2Oexcess and the much lower δ15N-N2O are primarily attributed to strong nitrification by AOB. There is also probably concurrent minor denitrification in the upper estuary where AOB abundances are higher before decreasing seaward along the salinity transect. Low concentrations of N2O and ΔN2Oexcess and enriched 15N2O could be explained by AOA nitrification in the lower reaches of the estuary. Collectively, AOB contributed the major part of N2O production in the upper estuary, which is the major source of N2O emitted to the atmosphere in the Pearl River estuary.
All data can be accessed in the form of Excel spreadsheets via the corresponding author.
The supplement related to this article is available online at: https://doi.org/10.5194/bg-16-4765-2019-supplement.
MD and YZ conceived and designed the experiments. LM, HL, and XX performed the experiments. LM, YZ, HL, and XX analyzed the data. LM and YZ wrote the paper. All authors contributed to the interpretation of results and critical revision.
The authors declare that they have no conflict of interest.
We thank Qing Li for measuring ammonia concentrations on board, Jian-Zhong Su and Liguo Guo for measuring dissolved oxygen concentrations on board, and Tao Huang and Lifang Wang for measuring nitrate and nitrite concentrations. We also thank Lei Hou for her assistance in qPCR measurements and data analysis, as well as Mingming Chen and Huade Zhao for their assistance with the software. We thank Kara Bogus, PhD, from Liwen Bianji, Edanz Editing China (http://www.liwenbianji.cn/ac, last access: 27 August 2019), for editing the English text of a draft of the manuscript.
This research has been supported by the National Key Research and Development Programs (grant no. 2016YFA0601400), the NSFC projects (grant no. 41721005, 41676125, and 41706086), and Theme-based Research Scheme (grant no. T21-602/16-R) of the Hong Kong Research Grants Council.
This paper was edited by Silvio Pantoja and reviewed by two anonymous referees.
Abell, G. C. J., Revill, A. T., Smith, C., Bissett, A. P., Volkman, J. K., and Robert, S. S.: Archaeal ammonia oxidizers and nirS-type denitrifiers dominate sediment nitrifying and denitrifying populations in a subtropical macrotidal estuary, ISME J., 4, 286–300, 2010.
Abril, G., Riou, S. A., Etcheber, H., Frankignoulle, M., de Wit, R., and Middelburg, J. J.: Transient tidal time-scale, nitrogen transformations in an estuarine turbidity maximumfluid mud system (the Gironde, south-west France), Estuar. Coast. Shelf S., 50, 703–715, 2000.
Allen, D., Dalal, R. C., Rennenberg, H., and Schmidt, S.: Seasonal variation in nitrous oxide and methane emissions from subtropical estuary and coastal mangrove sediments, Australia, Plant Biol., 13, 126–133, 2011.
Arévalo-Martínez, D. L., Kock, A., Löscher, C. R., Schmitz, R. A., and Bange, H. W.: Massive nitrous oxide emissions from the tropical South Pacific Ocean, Nat. Geosci., 8, 530–533, 2015.
Avrahami, S. and Bohanann, J. M.: N2O emission rates in a California meadow soil are influenced by fertilizer level, soil moisture and the community structure of ammonia-oxidizing bacteria, Glob. Change Biol., 15, 643–655, 2009.
Babbin, A. R., Bianchi, D., Jayakumar, A., and Ward, B. B.: Rapid nitrous oxide cycling in the suboxic ocean, Science, 348, 1127–1129, 2015.
Barnes, J. and Upstill-Goddard, R. C.: N2O seasonal distributions and air–sea exchange in UK estuaries: Implications for the tropospheric N2O source from European coastal waters, J. Geophys. Res., 116, G01006, https://doi.org/10.1029/2009JG001156, 2011.
Bartossek, R., Nicol, G. W., Lanzen, A., Klenk, H. P., and Schleper, C.: Homologues of nitrite reductases in ammonia-oxidizing archaea: diversity and genomic context, Environ. Microbiol., 12, 1075–1088, 2010.
Bernhard, A. E., Landry, Z. C., Blevins, A., de la Torre, J. R., Giblin, A. E., and Stahl, D. A.: Abundance of ammonia-oxidizing archaea and bacteria along an estuarine salinity gradient in relation to potential nitrification rates, Appl. Environ. Microbiol., 76, 1285–1289, 2010.
Braker, G., Fesefeldt, A., and Witzel, K. P.: Development of PCR primer systems for amplification of nitrite reductase genes (nirK and nirS) to detect denitrifying bacteria in environmental samples, Appl. Environ. Microbiol., 64, 3769–3775, 1998.
Bricker, S. B., Longstaff, B., Dennison, W., Jones, A., Boicourt, K.,Wicks, C., and Woerner, J.: Effects of nutrient enrichment in the nation's estuaries: a decade of change, Harmful Algae, 8, 21–32, 2008.
Butterbach-Bahl, K., Baggs, E. M., Dannenmann, M., Kiese, R., and Zechmeister-Boltenstern, S.: Nitrous oxide emissions from soils: how well do we understand the processes and their controls?, Philos. T. Roy. Soc. B, 368, https://doi.org/10.1098/rstb.2013.0122, 2013.
Canfield, D. E., Glazer, A. N., and Falkowski, P. G.: The Evolution and Future of Earth's Nitrogen Cycle, Science, 330, 192–196, 2010.
Cao, Y., Sun, G., Han, Y., Sun, D., and Wang, X.: Determination of nitrogen, carbon and oxygen stable isotope ratios in N2O, CH4, and CO2 at natural abundance levels by mass spectrometer, Acta Pedrol. Sin., 45, 249–258, 2008 (in Chinese).
Clark, I. M., Buchkina, N., Jhureea, D., Goulding, K. W. T., and Hirsch, P. R.: Impacts of nitrogen application rates on the activity and diversity of denitrifying bacteria in the Broadbalk Wheat Experiment, Philos. T. Roy. Soc. B, 367, 1235–1244, https://doi.org/10.1098/rstb.2011.0314, 2012.
Coyne, M. S., Arunakumari, A., Averill, B. A., and Tiedje, J. M.: Immunological identification and distribution of dissimilatory heme cd1 and non-heme copper nitrite reductases in denitrifying bacteria, Appl. Environ. Microbiol., 55, 2924–2931, 1989.
Čuhel, J., Šimek, M., Laughlin, R. J., Bru, D., Chèneby, D., Watson, C. J., and Philippot, L.: Insights into the Effect of Soil pH on N2O and N2 Emissions and Denitrifier Community Size and Activity, Appl. Environ. Microbiol., 76, 1870–1878, 2010.
Dai, M., Guo, X., Zhai, W., Yuan, L., Wang, B., Wang, L., Cai, P., Tang, T., and Cai, W. J.: Oxygen depletion in the upper reach of the Pearl River estuary during a winter drought, Mar. Chem., 102, 159–169, 2006.
Dai, M., Wang, L., Guo, X., Zhai, W., Li, Q., He, B., and Kao, S.-J.: Nitrification and inorganic nitrogen distribution in a large perturbed river/estuarine system: the Pearl River Estuary, China, Biogeosciences, 5, 1227–1244, https://doi.org/10.5194/bg-5-1227-2008, 2008.
Dai, M., Gan, J., Han, A., Kung, H. S., and Yin, Z.: Physical dynamics and biogeochemistry of the Pearl River plume, in: Biogeochemical dynamics at major river-coastal interfaces, Linkages with Global Change, edited by: Bianchi, T. S., Allison, M. A., and Cai, W. J., Cambridge University Press, 321–351, 2014.
Daims, H., Lebedeva, E. V., Pjevac, P., Han, P., Herbold, C., Albertsen, M., Jehmlich, N., Palatinszky, M., Vierheilig, J., and Bulaev, A.: Complete nitrification by Nitrospira bacteria, Nature, 528, 504–509, 2015.
Damashek, J. and Francis, C. A.: Microbial Nitrogen Cycling in Estuaries: From Genes to Ecosystem Processes, Estuar. Coast., 41, 626–660, 2018.
Damashek, J., Casciotti, K. L., and Francis, C. A.: Variable Nitrification Rates Across Environmental Gradients in Turbid, Nutrient-Rich Estuary Waters of San Francisco Bay, Estuar. Coast., 39, 1050–1071, 2016.
De Wilde, H. P. J. and De Bie, M. J. M.: Nitrous oxide in the Schelde Estuary: production by nitrification and emission to the atmosphere, Mar. Chem., 69, 203–216, 2000.
De Bie, M. J. M., Middelburg, J .J., Starink, M., and Laanbroek, H. J.: Factors controlling nitrous oxide at the microbial community and estuarine scale, Mar. Ecol.-Prog. Ser., 240, 1–9, 2002.
Frame, C. H. and Casciotti, K. L.: Biogeochemical controls and isotopic signatures of nitrous oxide production by a marine ammonia-oxidizing bacterium, Biogeosciences, 7, 2695–2709, https://doi.org/10.5194/bg-7-2695-2010, 2010.
Frame, C. H., Lau, E., Joseph Nolan IV, E., Goepfert, T. J., and Lehmann, M. F.: Acidification Enhances Hybrid N2O Production Associated with Aquatic Ammonia-Oxidizing Microorganisms, Front. Microbiol., 7, 1–23, 2017.
Francis, C. A., Roberts, K. J., Beman, J. M., Santoro, A. E., and Oakley, B. B.: Ubiquity and diversity of ammonia-oxidizing archaea in water columns and sediments of the ocean, P. Natl. Acad. Sci. USA, 102, 14683–14688, 2005.
Freing, A., Wallace, D. W. R., and Bange, H. W.: Global oceanic production of nitrous oxide, Philos. T. Roy. Soc. B, 367, 1245–1255, https://doi.org/10.1098/rstb.2011.0360, 2012.
Füssel, J.: Impacts and importance of ammonia and nitrite oxidation in the marine nitrogen cycle, PhD thesis, Max Planck Institute for Microbial Ecology, Bremen, Germany, 166 pp., 2014.
Garnier, J., Cébron, A., Tallec, G., Billen, G., Sebilo, M., and Martinez, A.: Nitrogen behaviour and nitrous oxide emission in the tidal Seine River estuary (France) as influenced by human activities in the upstream watershed, Biogeochemistry, 77, 305–326, 2006.
Goreau, T. J., Kaplan, W. A., Wofsy, S. C., McElroy, M. B., Valois, F. W., and Watson, S. W.: Production of and N2O by Nitrifying Bacteria at Reduced Concentrations of Oxygen, Appl. Environ. Microbiol., 40, 526–532, 1980.
Graf, D. R. H., Jones, C. M., and Hallin,. S.: Intergenomic comparisons highlight modularity of the denitrification pathway and underpin the importance of community structure for N2O emissions, PloS One, 9, e114118, https://doi.org/10.1371/journal.pone.0114118.s008, 2014.
Han, A., Dai, M., Kao, S.-J., Gan, J., Li, Q., Wang, L., Zhai, W., and Wang, L.: Nutrient dynamics and biological consumption in a large continental shelf system under the influence of both a river plume and coastal upwelling, Limnol. Oceanogr., 57, 486–502, 2012.
Hatzenpichler, R.: Diversity, Physiology, and Niche Differentiation of Ammonia Oxidizing Archaea, Appl. Environ. Microbol., 78, 7501–7510, 2012.
He, B., Dai, M., Zhai, W., Guo, X., and Wang, L.: Hypoxia in the upper reaches of the Pearl River Estuary and its maintenance mechanisms: A synthesis based on multiple year observations during 2000–2008, Mar. Chem., 167, 13–24, 2014.
Hink, L., Nicol, G. W., and Prosser, J. I.: Archaea produce lower yields of N2O than bacteria during aerobic ammonia oxidation in soil, Environ. Microbiol., 19, 4829–4837, 2017.
Hink, L., Gubry-Rangin, C., Nicol, G. W., and Prosser, J. I.: The consequences of niche and physiological differentiation of archaeal and bacterial ammonia oxidisers for nitrous oxide emissions, ISME J., 12, 1084–1093, 2018.
Hou, L., Xie, X., Wan, X., Kao, S.-J., Jiao, N., and Zhang, Y.: Niche differentiation of ammonia and nitrite oxidizers along a salinity gradient from the Pearl River estuary to the South China Sea, Biogeosciences, 15, 5169–5187, https://doi.org/10.5194/bg-15-5169-2018, 2018.
Huang, S., Chen, C., Yang, X., Wu, Q., and Zhang, R.: Distribution of typical denitrifying functional genes and diversity of the nirS-encoding bacterial community related to environmental characteristics of river sediments, Biogeosciences, 8, 3041–3051, https://doi.org/10.5194/bg-8-3041-2011, 2011.
Hu, A., Jiao, N., and Zhang, C. L.: Community structure and function of planktonic Crenarchaeota: changes with depth in the South China Sea, Microb. Ecol., 62, 549–563, 2011.
Hu, H. W. and He, J. Z.: Comammox–a newly discovered nitrification process in the terrestrial nitrogen cycle, J. Soils Sediments, 17, 2709–2717, 2017.
Huertas, I. E., Flecha, S., Navarro, G., Perez, F. F., and de la Paz, M.: Spatio-temporal variability and controls on methane and nitrous oxide in the Guadalquivir Estuary, Southwestern Europe, Aquat. Sci., 80, 29, 2018.
Ji, Q., Babbin, A. R., Jayakumar, A., Oleynik, S., and Ward, B. B.: Nitrous oxide production by nitrication and denitrication in the Eastern Tropical South Pacific oxygen minimum zone, Geophys. Res. Lett., 42, 10755–10764, 764, 2015.
Ji, Q., Buitenhuis, E., Suntharalingam, P., Sarmiento, J. L., and Ward, B. B.: Global Nitrous Oxide Production Determined by Oxygen Sensitivity of Nitrification and Denitrification, Global Biogeochem. Cy., 32, 1790–1802, 2018.
Jones, C. M., Spor, A., Brennan, F. P., Breuil, M. C., Bru, D., Lemanceau, P., Griffiths, B., Hallin, S., and Philippot, L.: Recently identified microbial guild mediates soil N2O sink capacity, Nat. Clim. Change, 4, 801–805, 2014.
Jung, M. Y., Well, R., Min, D., Giesemann, A., Park, S. J., Kim, J. G., and Rhee, S. K.: Isotopic signatures of N2O produced by ammonia-oxidizing archaea from soils, ISME J., 8, 1115–1125, 2014.
Kester, R. A., de Boer, W., and Laanbroek, H. J.: Production of NO and N2O by pure cultures of nitrifying and denitrifying bacteria during changes in aeration, Appl. Environ. Microbiol., 63, 3872–3877, 1997.
Kim, O. S., Junier, P., Imhoff, J. F., and Witzel, K. P.: Comparative analysis of ammonia monooxygenase (amoA) genes in the water column and sediment–water interface of two lakes and the Baltic Sea, FEMS Microbiol. Ecol., 66, 367–378, 2008.
Kim, I.-N., Lee, K., Bange, H. W., and Macdonald, A. M.: Interannual variation in summer N2O concentration in the hypoxic region of the northern Gulf of Mexico, 1985–2007, Biogeosciences, 10, 6783–6792, https://doi.org/10.5194/bg-10-6783-2013, 2013.
Kits, K. D., Sedlacek, C. J., Lebedeva, E. V., Han, P., Bulaev, A., Pjevac, P., Daebeler, A., Romano, S., Albertsen, M., Stein, L. Y., Daims, H., and Wagner, M.: Kinetic analysis of a complete nitrifier reveals an oligotrophic lifestyle, Nature, 549, 269–272, 2017.
Kits, K. D., Jung, M. Y., Vierheilig, J., Pjevac, P., Sedlacek, C. J., Liu, S., Herbold, C., Stein, L. Y., Richter, A., Wisse, H., Brüggemann, N., Wagner, M., and Daims, H.: Low yield and abiotic origin of N2O formed by the complete nitrifier Nitrospira inopinata, Nat. Commun., 10, 1836, https://doi.org/10.1038/s41467-019-09790-x, 2019.
Kroeze, C., Dumont, E., and Seitzinger, S.: Future trends in emissions of N2O from rivers and estuaries, J. Integr. Environ. Sci., 7, 71–78, 2010.
Laperriere, S. M., Nidzieko, N. J., Fox, R. J., Fisher, A. W., and Santoro, A. E.: Observations of variable ammonia oxidation and nitrous oxide flux in a eutrophic estuary, Estuar. Coast., 42, 33–44, 2019.
Lin, H., Dai, M., Kao, S. J., Wang, L., Roberts, E., Yang, J., Huang, T., and He, B.: Spatiotemporal variability of nitrous oxide in a large eutrophic estuarine system: The Pearl River Estuary, China, Mar. Chem., 182, 14–24, 2016.
Liu, C., Hou, L., Liu, M., Zheng, Y., Yin, G., Han, P., Dong, H., Gao, J., Gao, D., Chang, Y., and Zhang, Z.: Coupling of denitrification and anaerobic ammonium oxidation with nitrification in sediments of the Yangtze Estuary: Importance and controlling factors, Estuar. Coast. Shelf. S., 220, 64–72, 2019.
Löscher, C. R., Kock, A., Könneke, M., LaRoche, J., Bange, H. W., and Schmitz, R. A.: Production of oceanic nitrous oxide by ammonia-oxidizing archaea, Biogeosciences, 9, 2419–2429, https://doi.org/10.5194/bg-9-2419-2012, 2012.
Lund, M. B., Smith, J. M., and Francis, C. A.: Diversity, abundance and expression of nitrite reductase (nirK)-like genes in marine thaumarchaea, ISME J., 6, 1966–1977, 2012.
Maeda, K., Toyoda, S., Philippot, L., Hattori, S., Nakajima, K., Ito, Y., and Yoshida, N.: Relative Contribution of nirK- and nirS- Bacterial Denitrifiers as Well as Fungal Denitrifiers to Nitrous Oxide Production from Dairy Manure Compost, Environ. Sci. Technol., 51, 14083–14091, 2017.
Magalhães, C., Bano, N., Wiebe, W. J., Bordalo, A. A., and Hollibaugh, J. T.: Dynamics of nitrous oxide reductase genes (nosZ) in intertidal rocky biofilms and sediments of the Douro River Estuary (Portugal), and their relation to N-biogeochemistry, Microb. Ecol., 55, 259–269, 2008.
Mandernack, K. W., Mills, C. T., Johnson, C. A., Rahn, T., and Kinney, C.: The δ15N and δ18O values of N2O produced during the co-oxidation of ammonia by methanotrophic bacteria, Chem. Geol., 267, 96–107, 2009.
Mincer, T. J., Church, M. J., Taylor, L. T., Preston, C., Karl, D. M., and DeLong, E. F.: Quantitative distribution of presumptive archaeal and bacterial nitrifiers in Monterey Bay and the North Pacific Subtropical Gyre, Environ. Microbiol., 9, 1162–1175, 2007.
Mohn, J., Wolf, B., Toyoda, S., Lin, C. T., Liang, M. C., Brüggemann, N., Wissel, H., Steiker, A. E., Dyckmans, J., Szwec, L., Ostrom, N. E., Casciotti, K. L., Forbes, M., Giesemann, A., Well, R., Doucett, R. R., Yarnes, C. T., Ridley, A. R., Kaiser, J., and Yoshida, N.: Interlaboratory assessment of nitrous oxide isotopomer analysis by isotope ratio mass spectrometry and laser spectroscopy: current status and perspectives, Rapid Commun. Mass Spectrom. 28, 1995–2007, 2014.
Monteiro, M., Séneca, J., and Magalhães, C.: The History of Aerobic Ammonia Oxidizers: from the First Discoveries to Today, J. Microbiol., 52, 537–547, 2014.
Moore, W. S., Sarmiento, J. L., and Key, R. M.: Tracing the Amazon component of surface Atlantic water using 228Ra, salinity and silica, J. Geophys. Res., 91, 2574–2580, 1986.
Mortazavi, B., Iverson, R. L., Huang, W., Graham Lewis, F., and Caffrey, J. M.: Nitrogen budget of Apalachicola Bay, a bar-built estuary in the northeastern Gulf of Mexico, Mar. Ecol.-Prog. Ser., 195, 1–14, 2000.
Naqvi, S. W. A., Bange, H. W., Farías, L., Monteiro, P. M. S., Scranton, M. I., and Zhang, J.: Marine hypoxia/anoxia as a source of CH4 and N2O, Biogeosciences, 7, 2159–2190, https://doi.org/10.5194/bg-7-2159-2010, 2010.
Nevison, C. D., Lueker, T. J., and Weiss, R. F.: Quantifying the nitrous oxide source from coastal upwelling, Global Biogeochem. Cy., 18, GB1018, https://doi.org/10.1029/2003GB002110, 2004.
Ni, B. J., Peng, L., Law, Y., Guo, J., and Yuan, Z.: Modeling of Nitrous Oxide Production by Autotrophic Ammonia-Oxidizing Bacteria with Multiple Production Pathways, Environ. Sci. Technol., 48, 3916–3924, 2014.
Pai, S. C., Tsau, Y. J., and Yang, T. I.: pH and buffering capacity problems involved in the determination of ammonia in saline water using the indophenol blue spectrophotometric method, Anal. Chim. Acta, 434, 209–216, 2001.
Penn, J., Weber, T., and Deutsch, C.: Microbial functional diversity alters the structure and sensitivity of oxygen deficient zones, J. Geophys. Res. Lett., 43, 9773–9780, 2016.
Pike, N.: Using false discovery rates for multiple comparisons in ecology and evolution, Methods Ecol. Evol., 2, 278–282, 2011.
Rabalais, N. N., Díaz, R. J., Levin, L. A., Turner, R. E., Gilbert, D., and Zhang, J.: Dynamics and distribution of natural and human-caused hypoxia, Biogeosciences, 7, 585–619, https://doi.org/10.5194/bg-7-585-2010, 2010.
Rajkumar, A. N., Barnes, J., Ramesh, R., Purvaja, R., and Upstill-Goddard, R. C.: Methane and nitrous oxide fluxes in the polluted Adyar River and estuary, SE India, Mar. Pollut. Bull., 56, 2043–2051, 2008.
Ravishankara, A. R., Daniel, J. S., and Portmann, R. W.: Nitrous Oxide (N2O): The Dominant Ozone-Depleting Substance Emitted in the 21st Century, Science, 326, 123–125, 2009.
Raymond, P. A. and Cole, J. J.: Gas exchange in rivers and estuary: choosing a gas transfer velocity, Estuar. Coast., 24, 312–317, 2001.
Santoro, A. E., Buchwald, C., McIlvin, M. R., and Casciotti K. L.: Isotopic Signature of N2O Produced by Marine Ammonia-Oxidizing Archaea, Science, 333, 1282–1285, 2011.
Santoro, A. E: The do-it-all nitrifier, Science, 351, 342–343, 2016.
Seitzinger, S. P. and Kroeze, C.: Global distribution of nitrous oxide production and N inputs in freshwater and coastal marine ecosystems, Global Biogeochem. Cy., 12, 93–113, 1998.
Shaw, L. J., Nicol, G. W., Smith, Z., Fear, J., Prosser, J. I., and Baggs, E. M.: Nitrosospira spp. can produce nitrous oxide via a nitrifier denitrification pathway, Environ. Microbiol., 8, 214–222, 2006.
Stein, L. Y.: Surveying N2O-Producing Pathways in Bacteria, Methods Enzymol., 486, 131–152, 2011.
Stieglmeier, M., Mooshammer, M., Kitzler, B., Wanek, W., Zechmeister-Boltenstern, S., Richter, A., and Schleper, C.: Aerobic nitrous oxide production through N-nitrosating hybrid formation in ammonia-oxidizing archaea, ISME J., 8, 1135–1146, 2014.
Sutka, R. L., Ostrom, N. E., Ostrom, P. H., Gandhi, H., and Breznak, J. A.: Nitrogen isotopomer site preference of N2O produced by Nitrosomonas europaea and Methylococcus capsulatus Bath, Rapid Commun. Mass Spectrom., 17, 738–745, 2003.
Sutka, R. L., Ostrom, N. E., Ostrom, P. H., Breznak, J. A., Gandhi, H., Pitt, A. J., and Li, F.: Distinguishing Nitrous Oxide Production from Nitrification and Denitrification on the Basis of Isotopomer Abundances, Appl. Environ. Microbiol., 72, 638–644, 2006.
Syakila, A. and Kroeze, C.: The global nitrogen budget revisited, J. Greenhouse Gas Meas. Manag., 1, 17–26, 2011.
Tan, E., Zou, W., Jiang, X., Wan, X., Hsu, T. C., Zheng, Z., Chen, L., Xu, M., Dai, M., and Kao, S.: Organic matter decomposition sustains sedimentary nitrogen loss in the Pearl River Estuary, China, Sci. Total. Environ., 648, 508–517, 2019
Ter Braak, C. J. F. Canonical correspondence analysis: a new eigenvector technique for multivariate direct gradient analysis, Ecology, 67, 1167–1179, 1986.
Toyoda, S., Mutobe, H., Yamagishi, H., Yoshida, N., and Tanji, Y.: Fractionation of N2O isotopomers during production by denitrifier, Soil. Biol. Biochem., 37, 1535–1545, 2005.
Toyoda, S., Yoshida, N., and Koba, K.: Isotopocule analysis of biologically produced nitrous oxide in various environments, Mass Spectrom. Rev., 36, 135–160, 2017.
Treusch, A. H., Leininger, S., Kletzin, A., Schuster, S. C., Klenk, H., and Schleper, C.: Novel genes for nitrite reductase and Amo-related proteins indicate a role of uncultivated mesophilic crenarchaeota in nitrogen cycling, Environ. Microbiol., 7, 1985–1995, 2005.
Usui, T., Koike, I., and Ogura, N.: N2O production, nitrification and denitrification in an estuarine sediment, Estuar. Coast. Shelf S., 52, 769–781, 2001.
Voss, M., Bange, H. W., Dippner, J. W., Middelburg, J. J., Montoya, J. P., and Ward, B.: The marine nitrogen cycle: recent discoveries, uncertainties and the potential relevance of climate change, Philos. T. Roy. Soc. B, 368, 20130121, https://doi.org/10.1098/rstb.2013.0121, 2013.
Wang, J., Kan, J., Qian, G., Chen, J., Xia, Z., Zhang, X., Liu, H., and Sun, J.: Denitrification and anammox: Understanding nitrogen loss from Yangtze Estuary to the east China sea (ECS), Environ. Pollut., 252, 1659–1670, https://doi.org/10.1016/j.envpol.2019.06.025, 2019.
Wanninkhof, R. I. K.: Relationship between wind speed and gas exchange over the ocean, J. Geophys. Res.-Ocean., 97, 7373–7382, 1992.
Ward, B. B.: Nitrification in marine systems, in: Nitrogen in the Marine Environment (2nd Edn.), edited by: Capone, D. G., Bronk, D. A., Mulholl, M. R., and Carpenter, E. J., Burlington, Academic Press, 199–261, 2008.
Weiss, R. F. and Price, B. A.: Nitrous oxide solubility in water and seawater, Mar. Chem., 8, 347–359, 1980.
Yamagishi, H., Westley, M. B., Popp, B. N., Toyoda, S., Yoshida, N., Watanabe, S., Koba, K., and Yamanak, Y.: Role of nitrification and denitrification on the nitrous oxide cycle in the eastern tropical North Pacific and Gulf of California, J Geophy. Res., 112, G02015, https://doi.org/10.1029/2006JG000227, 2007.
Yoshida, N.: 15N-depleted N2O as a product of nitrification, Nature, 335, 528–529, 1988.
Yoshida, T. and Alexander, M.: Nitrous Oxide Formation by Nitrosomonas europaea and Heterotrophic Microorganisms, Soil Sci. Soc. Am. Pro., 34, 880–882, 1970.
Yu, R., Kampschreur, M. J., Mark van Loosdrecht, C. M., and Chandran, K.: Mechanisms and Specific Directionality of Autotrophic Nitrous Oxide and Nitric Oxide Generation during Transient Anoxia, Environ. Sci. Technol., 44, 1313–1319, 2010.
Zhang, Y., Xie, X., Jiao, N., Hsiao, S. S.-Y., and Kao, S.-J.: Diversity and distribution of amoA-type nitrifying and nirS-type denitrifying microbial communities in the Yangtze River estuary, Biogeosciences, 11, 2131–2145, https://doi.org/10.5194/bg-11-2131-2014, 2014.
Zhu, R., Liu, Y., Li, X., Sun, J., Xu, H. and Sun, L.: Stable isotope natural abundance of nitrous oxide emitted from Antarctic tundra soils: effects of sea animal excrement depositions, Rapid Commun. Mass Sp., 22, 3570–3578, 2008.