the Creative Commons Attribution 4.0 License.
the Creative Commons Attribution 4.0 License.
 | 04 Feb 2019
Gas transfer velocities of CO2 in subtropical monsoonal climate streams and small rivers
Rong Mao
Yongmei Ma
Vedula V. S. S. Sarma
CO2 outgassing from rivers is a critical component for evaluating riverine carbon cycle, but it is poorly quantified largely due to limited measurements and modeling of gas transfer velocity in subtropical streams and rivers. We measured CO2 flux rates and calculated k and partial pressure (pCO2) in 60 river networks of the Three Gorges Reservoir (TGR) region, a typical area in the upper Yangtze River with monsoonal climate and mountainous terrain. The determined k600 (gas transfer velocity normalized to a Schmidt number of 600 (k600) at a temperature of 20 ∘C) value (48.4±53.2 cm h−1) showed large variability due to spatial variations in physical processes related to surface water turbulence. Our flux-derived k values using chambers were comparable with k values using the model derived from flow velocities based on a subset of data. Unlike in open waters, e.g., lakes, k600 is more pertinent to flow velocity and water depth in the studied river systems. Our results show that TGR river networks emitted approx. 0.69 to 0.71 Tg CO2 (1 Tg =1012 g) during the monsoon period using varying approaches such as chambers, derived k600 values and models. This study suggests that incorporating scale-appropriate k measurements into extensive pCO2 investigations is required to refine basin-wide carbon budgets in subtropical streams and small rivers. We concluded that the simple parameterization of k600 as a function of morphological characteristics is site specific for regions and watersheds and hence highly variable in rivers of the upper Yangtze. k600 models should be developed for stream studies to evaluate the contribution of these regions to atmospheric CO2.
- Article
(1981 KB) - Full-text XML
-
Supplement
(662 KB) - BibTeX
- EndNote


Rivers serve as a significant contributor of CO2 to the atmosphere (Raymond et al., 2013; Cole et al., 2007; Li et al., 2012; Tranvik et al., 2009). As a consequence, accurate quantification of riverine CO2 emissions is a key component to estimate net continental carbon (C) flux (Raymond et al., 2013). More detailed observational data and accurate measurement techniques are critical to refining riverine C budgets (Li and Bush, 2015; Raymond and Cole, 2001). Generally, two methods are used to estimate CO2 areal fluxes from the river system: direct measurements using floating chambers (FCs) and the indirect calculation of a thin boundary layer (TBL) model, which is dependent on the gas concentration gradient at the air–water interface and gas transfer velocity, k (Guerin et al., 2007; Xiao et al., 2014). Direct measurements are normally laborious, while the latter method is simple and thus preferred (Butman and Raymond, 2011; Lauerwald et al., 2015; Li et al., 2012, 2013; Ran et al., 2015).
The areal flux of CO2 (F, mmol m−2 d−1) via the water–air interface by TBL is described as follows:
where k (m d−1) is the gas transfer velocity of CO2 (also referred to as piston velocity) at the in situ temperature (Li et al., 2016); pCO2 (µatm) is the pCO2 gradient at the air–water interface (Borges et al., 2004). Kh (mmol m−3 µatm−1) is the aqueous-phase solubility coefficient of CO2 corrected using in situ temperature (T in ∘C) (Li et al., 2016).
pCO2 can be measured well in various aquatic systems; however, the accuracy of the estimation of flux is dependent on the k value. Broad ranges of k for CO2 (Raymond and Cole, 2001; Raymond et al., 2012; Borges et al., 2004) were reported due to variations in techniques, tracers used and governing processes. k is controlled by turbulence at the surface aqueous boundary layer; hence, k600 (the standardized gas transfer velocity at a temperature of 20 ∘C is valid for freshwater) is parameterized as a function of wind speed in open water systems of reservoirs, lakes and oceans (Borges et al., 2004; Guerin et al., 2007; Wanninkhof et al., 2009). While in streams and small rivers, turbulence at the water–air interface is generated by shear stresses at the streambed, and thus k is modeled using channel slope, water depth and water velocity in particular (Raymond et al., 2012; Alin et al., 2011). Variable formulations of k have been established by numerous theoretical, laboratory and field studies; nonetheless, a better constraint on k levels is still required as its levels are very significant and specific due to large heterogeneity in the hydrodynamics and physical characteristics of river networks. This highlights the importance of k measurements in a wide range of environments for accurate upscaling of CO2 evasion and for parameterizing the physical controls on k600. However, only a few studies provide information on k for riverine CO2 flux in Asia (Alin et al., 2011; Ran et al., 2015), and those studies do not address the variability of k in China's small rivers and streams.
Limited studies have demonstrated higher levels of k in large Chinese rivers (Liu et al., 2017; Ran et al., 2015, 2017; Alin et al., 2011), which contributed to much higher CO2 areal flux, particularly in China's monsoonal rivers that are impacted by hydrological seasonality. The monsoonal flow pattern and thus flow velocity is expected to be different than other rivers in the world; as a consequence, k levels should be different than others and potentially higher in subtropical monsoonal rivers.
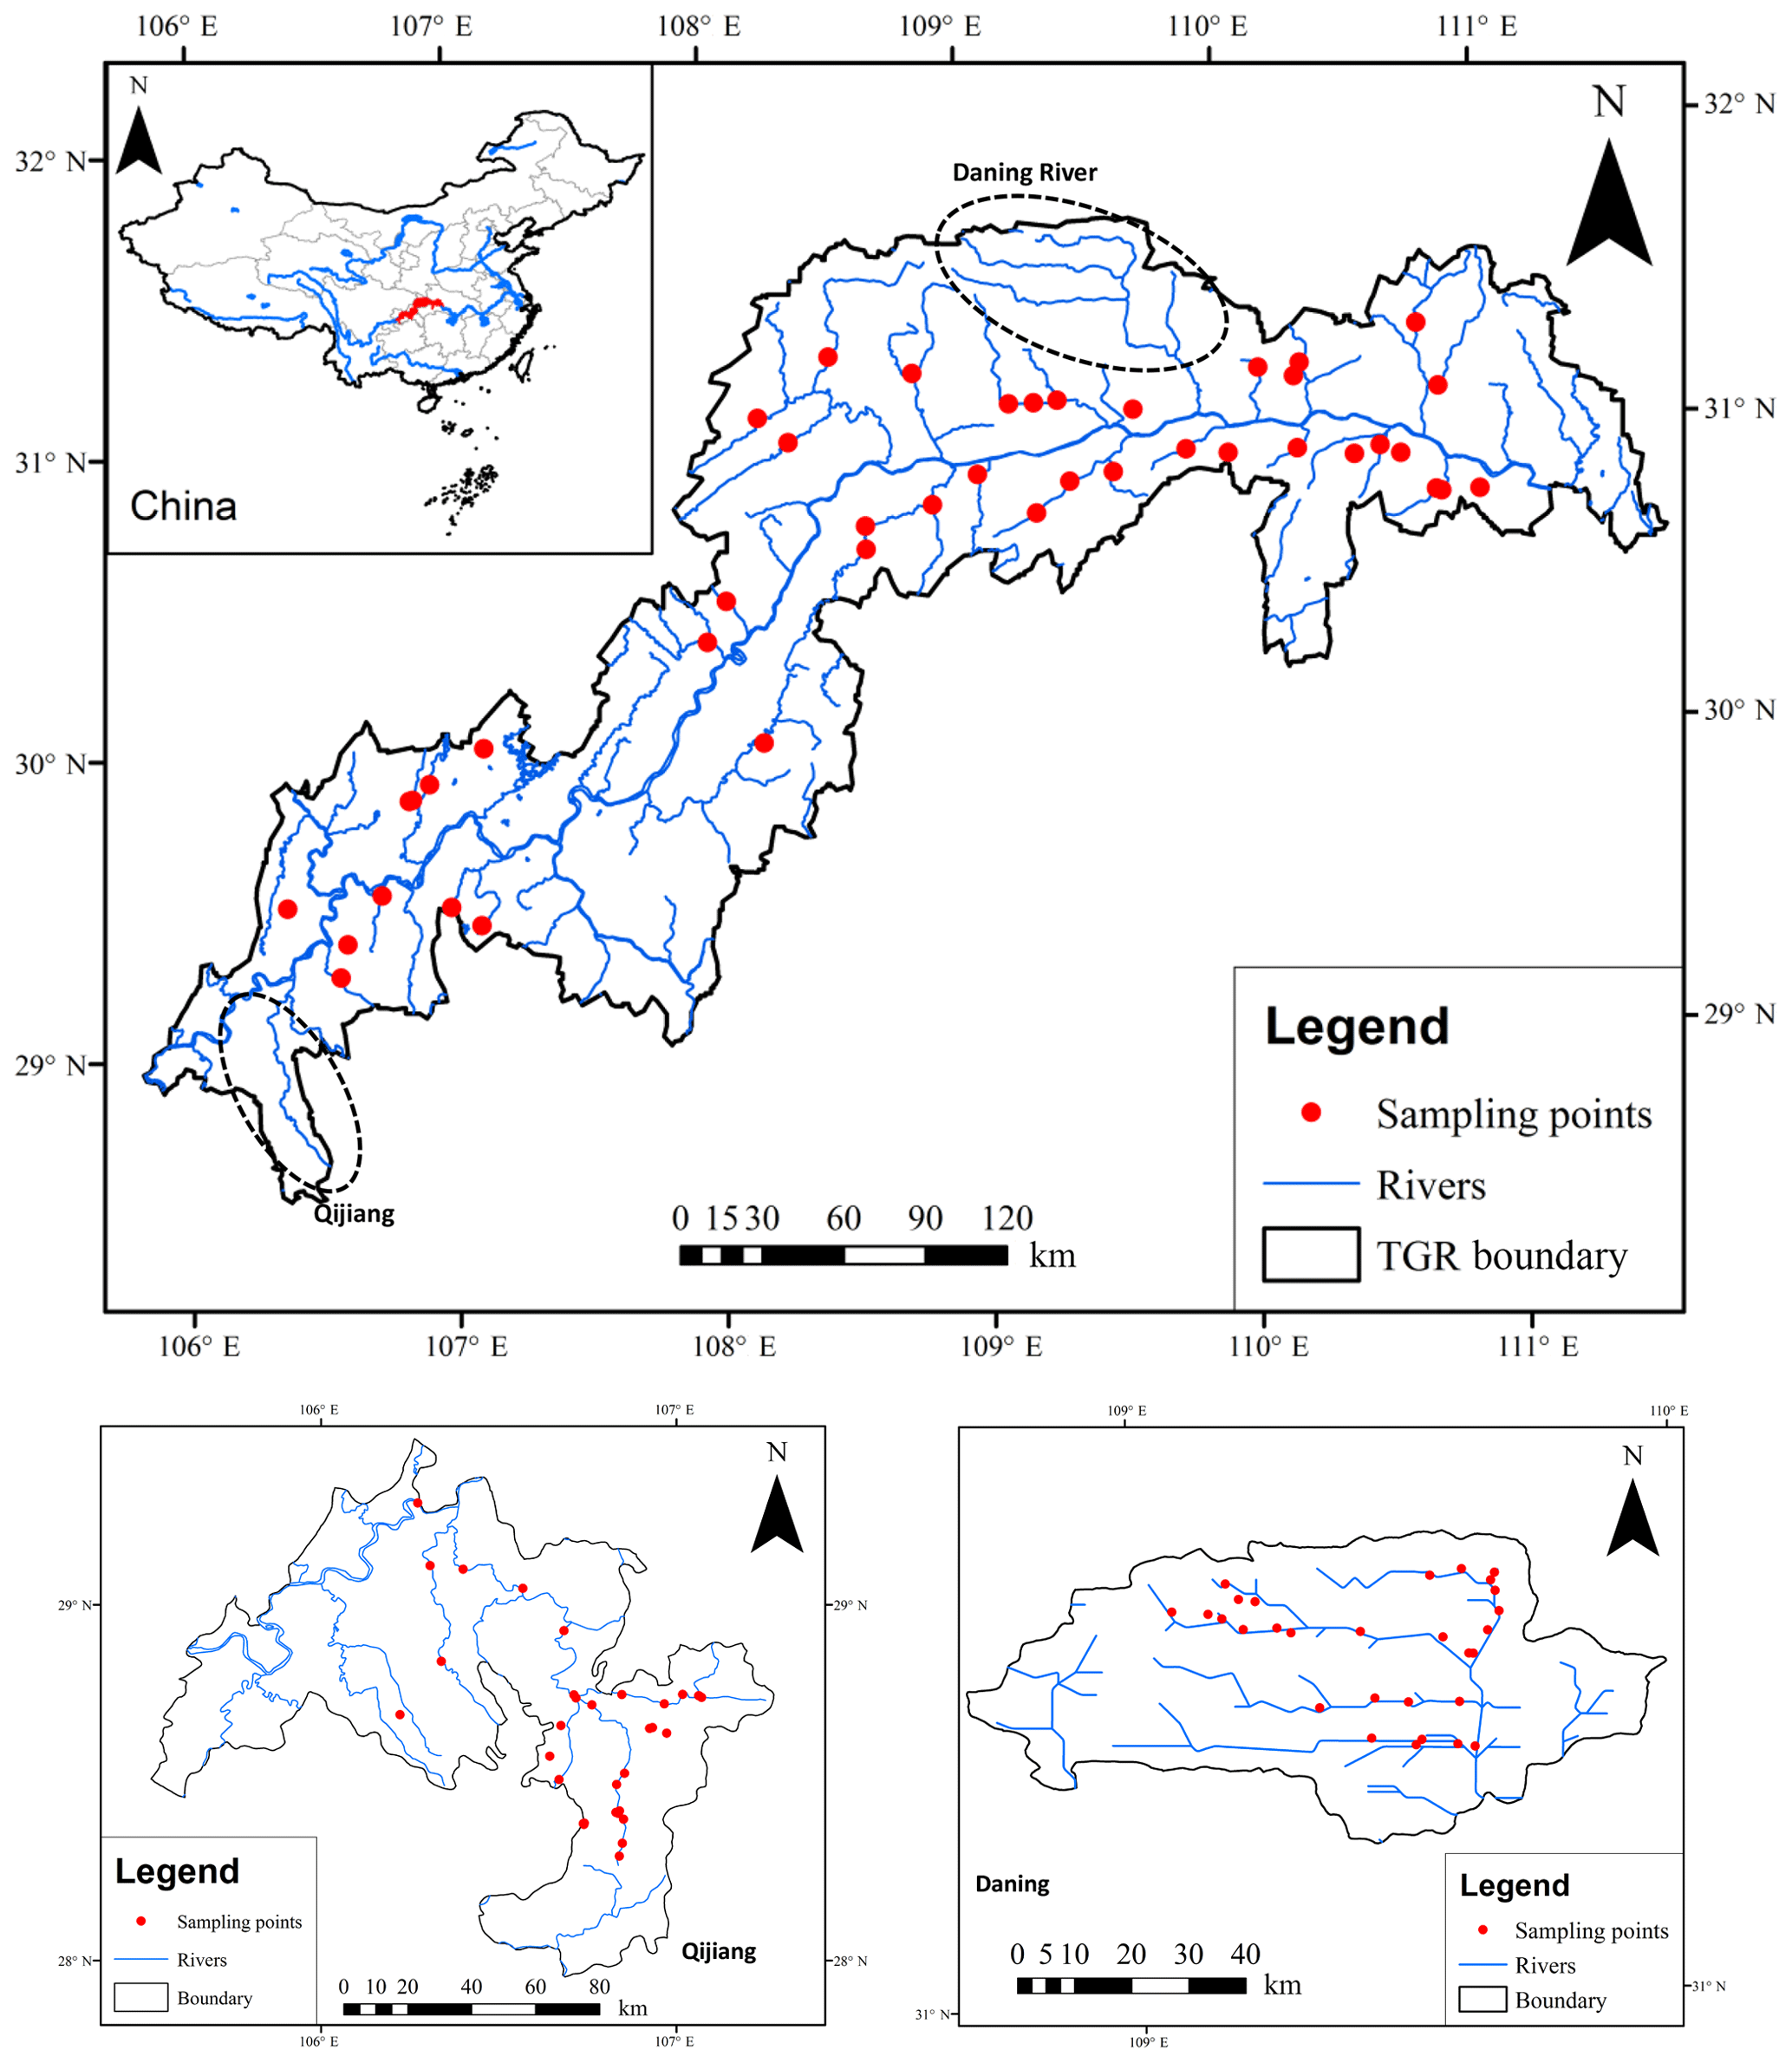
Figure 1Map of sampling locations for major rivers and streams in the Three Gorges Reservoir region, China.
Considerable efforts, such as the use of purposeful (Crusius and Wanninkhof, 2003; Jean-Baptiste and Poisson, 2000) and natural tracers (Wanninkhof, 1992) and FCs (Alin et al., 2011; Borges et al., 2004; Prytherch et al., 2017; Guerin et al., 2007), have been carried out to estimate accurate k values. The direct determination of k by FCs is more popular due to the simplicity of the technique for short-term CO2 flux measurements (Prytherch et al., 2017; Raymond and Cole, 2001; Xiao et al., 2014). Prior reports, however, have demonstrated that k values and the parameterization of k as a function of wind and/or flow velocity (probably water depth) vary widely across rivers and streams (Raymond and Cole, 2001; Raymond et al., 2012). To contribute to this debate, extensive investigation was first accomplished for the determination of k in rivers and streams of the upper Yangtze using the FC method. Models of k were further developed using hydraulic properties (i.e., flow velocity, water depth) by flux measurements with chambers and a TBL model. Our recent study preliminarily investigated pCO2 and air–water CO2 areal flux as well as their controls from fluvial networks in the Three Gorges Reservoir (TGR) area (Li et al., 2018). The past study was based on two fieldwork studies, and diffusive models from other rivers and/or regions were used. Here, we derive k levels and develop the gas transfer model in this area (mountainous streams and small rivers) for more accurate quantification of CO2 areal flux; it also serves for the fluvial networks in the Yangtze River or others with similar hydrology and geomorphology. Moreover, we conducted detailed field campaigns in two contrasting rivers, the Daning and Qijiang, for models (Fig. 1) and the rest were TGR streams and small rivers. The study thus clearly shows distinct differences from a previous study (Li et al., 2018) through the contribution of specific new objectives and data supplements with wider significance. Our new contributions to the literature thus include (1) the determination and controls of k levels for small rivers and streams in subtropical areas of China and (2) new models developed in subtropical mountainous river networks. The outcome of this study is expected to help in the accurate estimation of CO2 evasion from subtropical rivers and streams and thus refine the riverine C budget over a regional and/or basin scale.
2.1 Study areas
All field measurements were carried out in the rivers and streams of the Three Gorges Reservoir (TGR) region (28∘44′–31∘40′ N, 106∘10′–111∘10′ E) located in the upper Yangtze River, China (Fig. 1). This region is subject to a humid subtropical monsoon climate with an average annual temperature ranging between 15 and 19 ∘C. Average annual precipitation is approx. 1250 mm with large intra-annual and interannual variability. About 75 % of the total annual rainfall is concentrated between April and September (Li et al., 2018).
The river sub-catchments include large-scale river networks covering the majority of the tributaries of the Yangtze in the TGR region, i.e., data for 48 tributaries were collected. These tributaries have drainage areas that vary widely from 100 to 4400 km2 with width ranging from 1 m to less than 100 m. The annual discharges from these tributaries have a broad spectrum of 1.8–112 m3 s−1. Detailed samplings were conducted in the two largest rivers of Daning (35 sampling sites) and Qijiang (32 sites) in the TGR region. These two river basins drain catchment areas of 4200 and 4400 km2. The studied river systems had widths < 100 m, and we thus defined them as small rivers and streams. The Daning and Qijiang river systems are underlain by widely carbonate rock and located in a typical karst area. The location of the sampling sites is shown in Fig. 1. Detailed information on the sampling sites and primary data is presented in the Supplement (Table S5). The sampling sites are outside the Reservoirs and are not affected by dam operation.
2.2 Water sampling and analyses
Three fieldwork campaigns from the main river networks in the TGR region were undertaken during May through August in 2016 (i.e., 18–22 May for Daning, 21 June–2 July for all tributaries of TGR and 15–18 August for Qijiang). A total of 115 discrete grab samples were collected (each sample consisted of three replicates). Running waters were taken using pre-acid-washed 5 L high-density polyethylene (HDPE) plastic containers from depths of 10 cm below the surface. The samples were filtered through prebaked Whatman GF/F (0.7 µm pore size) filters on the sampling day and immediately stored in acid-washed HDPE bottles. The bottles were transported in an icebox to the laboratory and stored at 4 ∘C for analysis. Concentrations of dissolved organic carbon (DOC) were determined within 7 days of water collection (Mao et al., 2017).
Water temperature (T), pH, DO saturation (DO %) and electrical conductivity (EC) were measured in situ by calibrated multiparameter sondes (HQ40d HACH, USA, and YSI 6600, YSI incorporated, USA). pH, the key parameter for pCO2 calculation, was measured to a precision of ±0.01, and the pH sonde was calibrated by certified reference materials (CRMs) before measurements with an accuracy of better than ±0.2 %. Atmospheric CO2 concentrations were determined in situ using an EGM-4 (environmental gas monitor; PP SYSTEMS Corporation, USA). Total alkalinity was measured using a fixed endpoint titration method with 0.0200 mol L−1 hydrochloric acid (HCl) on the sampling day. DOC concentration was measured using a total organic carbon analyzer (TOC-5000, Shimadzu, Japan) with a precision better than 3 % (Mao et al., 2017). All the solvents and reagents used in the experiments were of analytical reagent grade.
Concomitant stream width, depth and flow velocity were determined along the cross section, and flow velocity was determined using a portable flow meter LS300-A (China); the meter shows an error of < 1.5 %. Wind speed at 1 m over the water surface (U1) and air temperature (Ta) were measured with a Testo 410-1 handheld anemometer (Germany). Wind speed at 10 m of height (U10, unit in m s−1) was calculated using the following formula (Crusius and Wanninkhof, 2003):
where Cd10 is the drag coefficient at 10 m of height (0.0013 m s−1), K is the von Karman constant (0.41) and z is the height (m) of wind speed measurement. as we measured the wind speed at a height of 1 m (U1).
Aqueous pCO2 was computed from the measurements of pH, total alkalinity and water temperature using a CO2 system (k1 and k2 are from Millero, 1979) (Lewis et al., 1998). This program can yield high-quality data (Li et al., 2012, 2013; Borges et al., 2004).
2.3 Water-to-air CO2 fluxes using the FC method
FCs (30 cm in diameter, 30 cm in height) were deployed to measure air–water CO2 fluxes and transfer velocities. They were made of cylindrical polyvinyl chloride (PVC) pipe with a volume of 21.20 L and a surface area of 0.071 m2. These nontransparent, thermally insulated vertical tubes covered by aluminum foil were connected via CO2-impermeable rubber–polymer tubing (with outer and inner diameters of 0.5 and 0.35 cm, respectively) to a portable nondispersive infrared CO2 analyzer EGM-4 (PPSystems). Air was circulated through the EGM-4 instrument via an air filter using an integral pump at a flow rate of 350 mL min−1. The chamber method was widely used and more details of the advantages and limits of chambers were reviewed elsewhere (Alin et al., 2011; Borges et al., 2004; Xiao et al., 2014).
Chamber measurements were conducted by deploying two replicate chambers or one chamber two times at each site. In sampling sites with low and favorable flow conditions (Supplement Fig. S1), freely drifting chambers (DCs) were deployed, while sites in rivers and streams with higher flow velocity were sampled with anchored chambers (ACs) (Ran et al., 2017). DCs were used at sampling sites with a current velocity of < 0.1 m s−1; this resulted in a limited number of sites (a total of six sites) using DCs. ACs would create an overestimation of CO2 emissions by a factor of several-fold (i.e., > 2) in our study region (Lorke et al., 2015). Data were logged automatically and continuously at 1 min intervals over a given span of time (normally 5–10 min) after enclosure. The CO2 area flux (mg m−2 h−1) was calculated using the following formula:
where dpCO2∕dt is the rate of concentration change in FCs (µL L−1 min−1); M is the molar mass of CO2 (g mol−1); P is the atmosphere pressure of the sampling site (Pa); T is the chamber absolute temperature of the sampling time (K); V0 is the molar volume (22.4 L mol−1); P0 is atmosphere pressure (101 325 Pa); T0 is absolute temperature (273.15 K) under the standard condition; and H is the chamber height above the water surface (m) (Alin et al., 2011). We accepted the flux data that had a good linear regression of flux against time (R2≥0.95, p < 0.01) following the manufacturer specifications. In our sampling points, all measured fluxes were retained since the floating chambers yielded linearly increasing CO2 against time.
Water samples from a total of 115 sites were collected. Floating chambers with replicates were deployed in 101 sites (32 sampling sites in Daning, 37 sites in TGR river networks and 32 sites in Qijiang). The sampling period covered the spring and summer season, and our sampling points are reasonable considering a water area of 433 km2. For example, 16 sites were collected for the Yangtze system to examine hydrological and geomorphological controls on pCO2 (Liu et al., 2017), with 17 sites for dynamic biogeochemical controls on riverine pCO2 in the Yangtze basin (Liu et al., 2016). Similar to other studies, sampling and flux measurements in the day would tend to underestimate the CO2 evasion rate (Bodmer et al., 2016).
2.4 Calculations of the gas transfer velocity
The k was calculated by reorganizing Eq. (1). To make comparisons, k is normalized to a Schmidt (Sc) number of 600 (k600) at a temperature of 20 ∘C.
kT is the measured value at the in situ temperature (T, unit in ∘C), and SCT is the Schmidt number of temperature T. A dependency of −0.5 was employed here as measurements were made in turbulent rivers and streams in this study (Alin et al., 2011; Borges et al., 2004; Wanninkhof, 1992).
2.5 Estimation of river water area
The water surface is an important parameter for CO2 efflux estimation, as it depends on its climate, channel geometry and topography. River water area therefore largely fluctuates with a much higher areal extent of water surface, particularly in the monsoonal season. However, most studies do not consider this change, and a fraction of the drainage area is used in river water area calculation (Zhang et al., 2017). In our study, 90 m resolution SRTM DEM (Shuttle Radar Topography Mission digital elevation model) data and Landsat images in the dry season were used to delineate the river network and thus the water area (Zhang et al., 2018), while stream orders were not extracted. The water area of river systems is generally much higher in the monsoonal season in comparison to the dry season; for instance, the Yellow River showed a 1.4-fold higher water area in the wet season than in the dry season (Ran et al., 2015). The available dry-season image was likely to underestimate CO2 estimation.
2.6 Data processing
Prior to statistical analysis, we excluded k600 data for samples with an air–water pCO2 gradient < 110 µatm, since the error in the k600 calculations are drastically enhanced when pCO2 approaches zero (Borges et al., 2004; Alin et al., 2011), and datasets with pCO2 > 110 µatm provide an error of < 10 % on k600 computation. Thus, we discarded the samples (36.7 % of sampling points with flux measurements) with pCO2 < 110 µatm for k600 model development, while all samples were included for flux estimations from the diffusive TBL model and floating chambers.
Spatial differences (Daning, Qijiang and all tributaries of TGR region) were tested using the nonparametric Mann–Whitney U test. Multivariate statistics, such as correlation and stepwise multiple linear regression, were performed for the models of k600 using potential physical parameters of wind speed, water depth and current velocity as independent variables (Alin et al., 2011). Data analyses were conducted from both separated data and combined data for the river systems. k models were obtained by water depth using data from the TGR rivers and by flow velocity in the Qijiang, while models were not developed for Daning and the combined data. All statistical relationships were significant at p < 0.05. The statistical processes were conducted using SigmaPlot 11.0 and SPSS 16.0 for Windows (Li et al., 2009, 2016).
Table 1Statistics of all the data from the three river systems (for separated statistics please refer to Figs. S2 and S3).
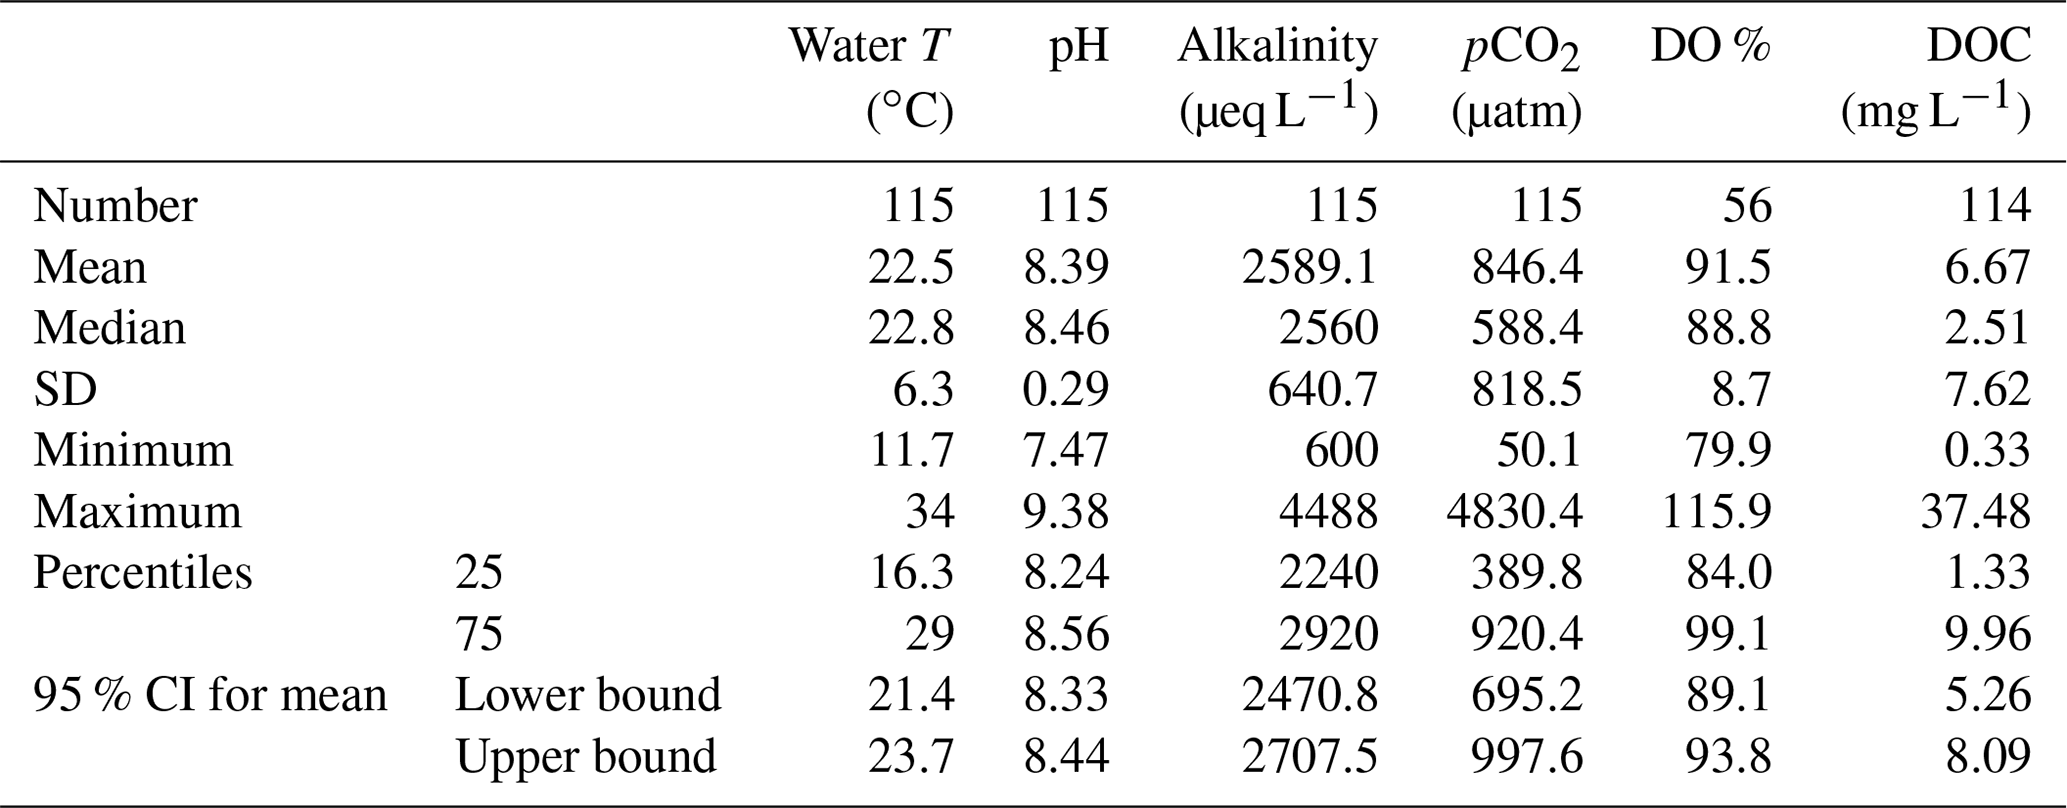
CI: confidence interval.
3.1 CO2 partial pressure and key water quality variables
Significant spatial variations in water temperature, pH, pCO2 and DOC were observed among the Daning, TGR and Qijiang rivers, whereas alkalinity did not display such variability (Fig. S2). pH varied from 7.47 to 8.76 with the exception of two quite high values of 9.38 and 8.87 (total mean: 8.39±0.29). Significantly lower pH was observed in TGR rivers (8.21±0.33) (Table 1; p < 0.001; Fig. S2). pCO2 varied between 50 and 4830 µatm with a mean of 846±819 µatm (Table 1). There were 28.7 % of samples that had pCO2 levels lower than 410 µatm, while the studied rivers were overall supersaturated with reference to atmospheric CO2 and act as a source of atmospheric CO2. The pCO2 levels were 2.1 to 2.6-fold higher in TGR rivers than Daning (483±294 µatm) and Qijiang River (614±316 µatm) (Fig. S2).
There was a significantly higher concentration of DOC in the TGR rivers (12.83±7.16 mg L−1) than Daning and Qijiang River (3.76±5.79 vs. 1.07±0.33 mg L−1 in Qijiang and Daning) (p < 0.001; Fig. S3). Moreover, Qijiang showed a significantly higher concentration of DOC than Daning (3.76±5.79 vs. 1.07±0.33 mg L−1 in Qijiang and Daning) (p < 0.001 by Mann–Whitney rank sum test; Fig. S3).
3.2 CO2 flux using floating chambers
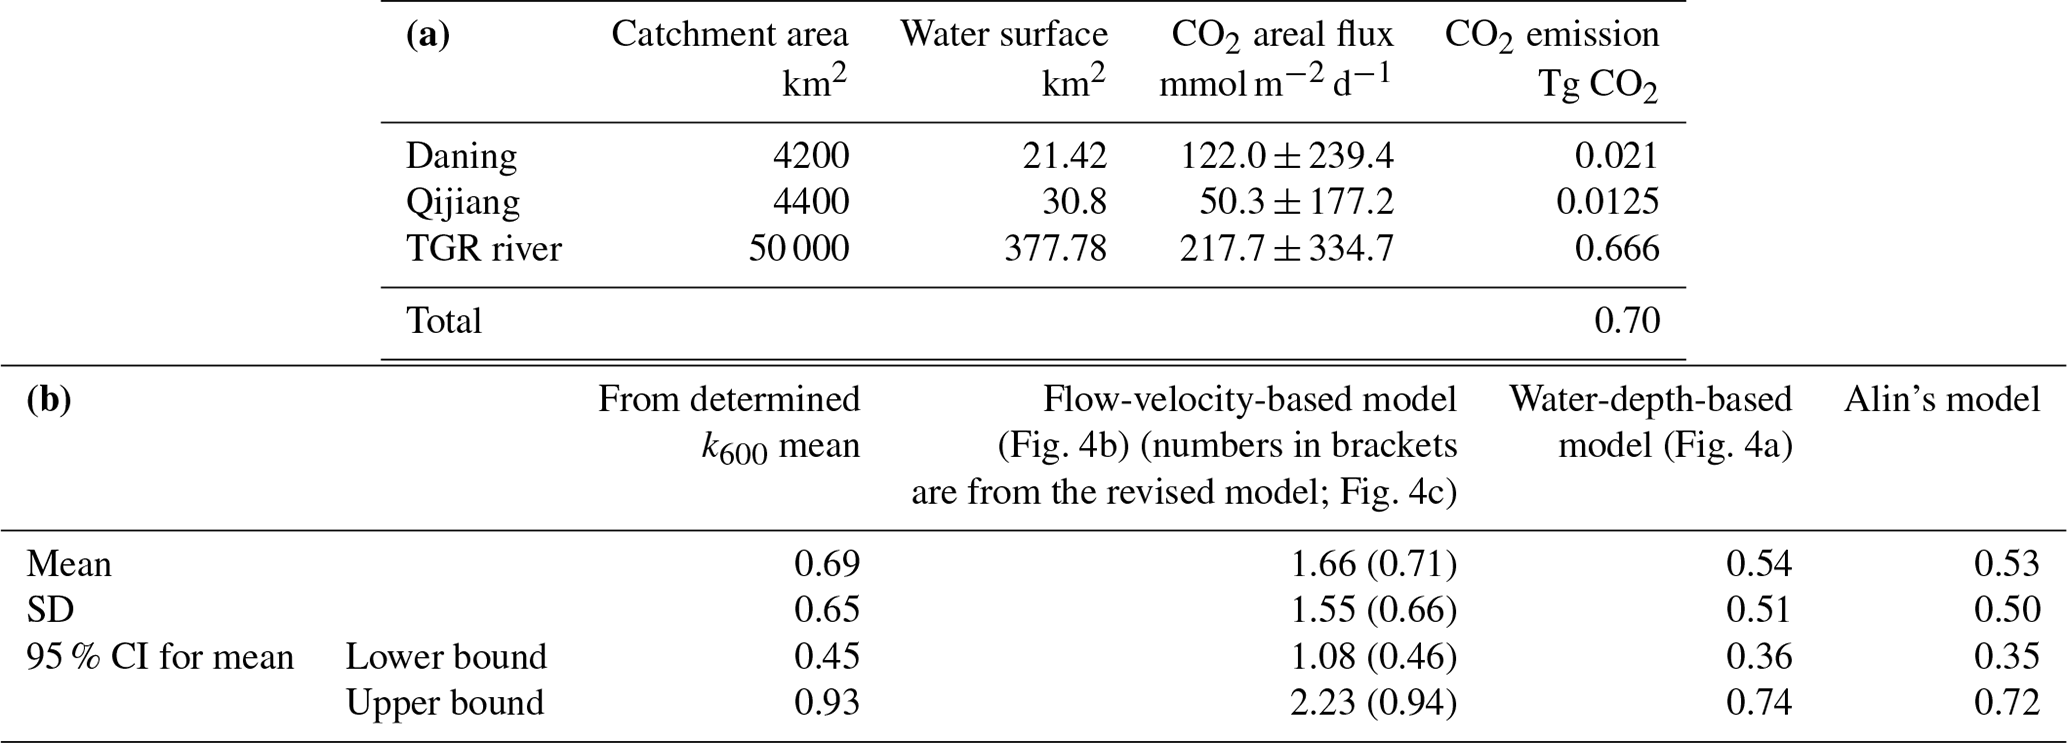
The calculated CO2 areal fluxes were higher in TGR rivers (217.7±334.7 mmol m−2 d−1, n=35), followed by Daning (122.0±239.4 mmol m−2 d−1, n=28) and Qijiang rivers (50.3±177.2 mmol m−2 d−1, n=32) (Fig. 2). The higher CO2 evasion from the TGR rivers is consistent with high riverine pCO2 levels. The mean CO2 emission rate was 133.1±269.1 mmol m−2 d−1 (n=95) in all three rivers sampled. The mean CO2 flux differed significantly between TGR rivers and Qijiang (Fig. 2).
Table 2Comparison of different models for CO2 areal flux estimation using combined data (unit is mmol m−2 d−1 for CO2 areal flux and cm h−1 for k600).
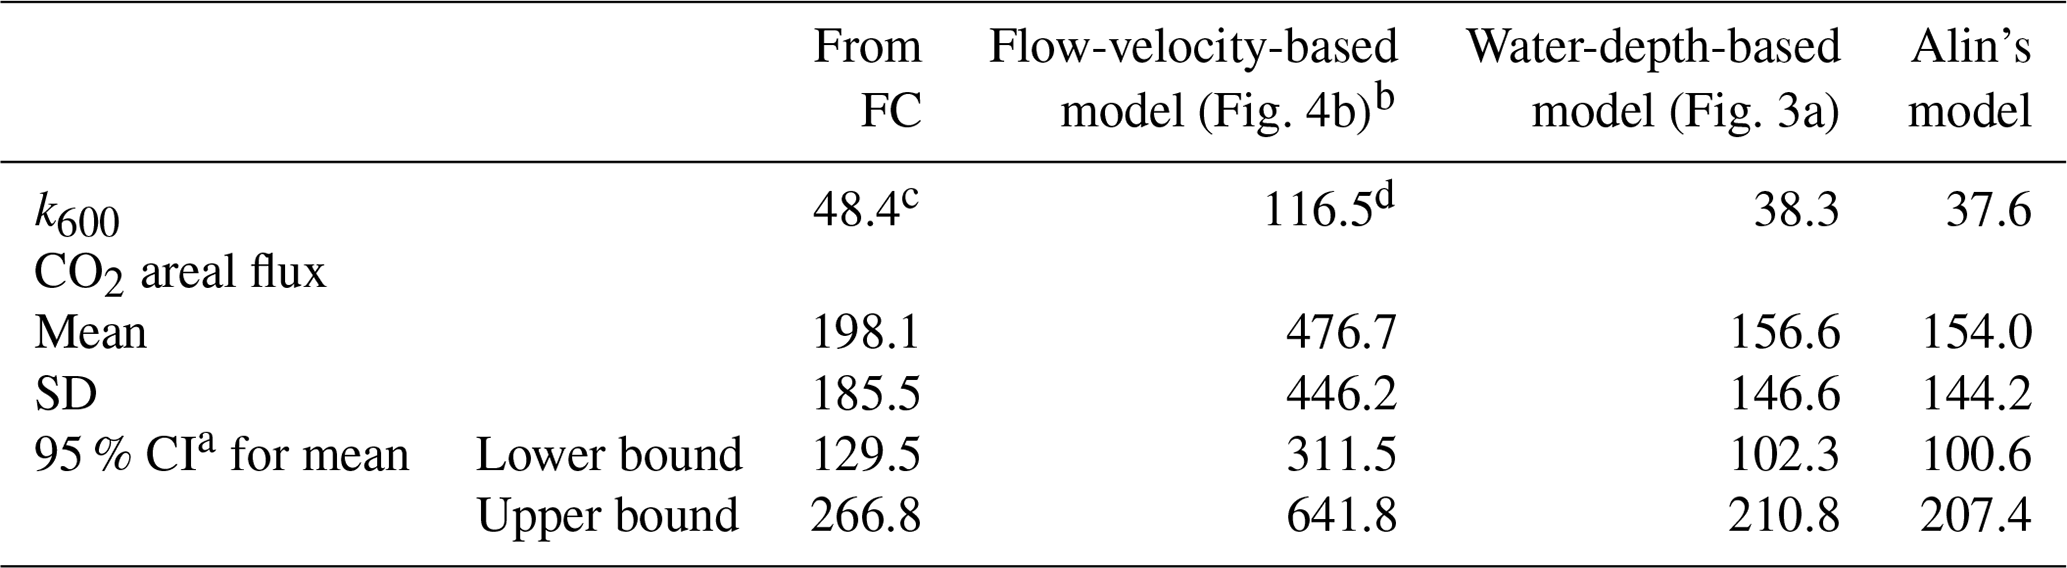
aCI: confidence interval. b The flow-velocity-based model is from a subset of the data (please refer to Fig. 4) c Mean value determined using floating chambers (FCs). d This figure is revised to be 49.6 cm h−1 if the model (k600=62.879 FV +6.8357, R2=0.52, p=0.019) is used (the model is obtained by taking out two extreme values; please refer to Fig. 4c), and the corresponding CO2 areal flux is 203±190 mmol m−2 d−1.
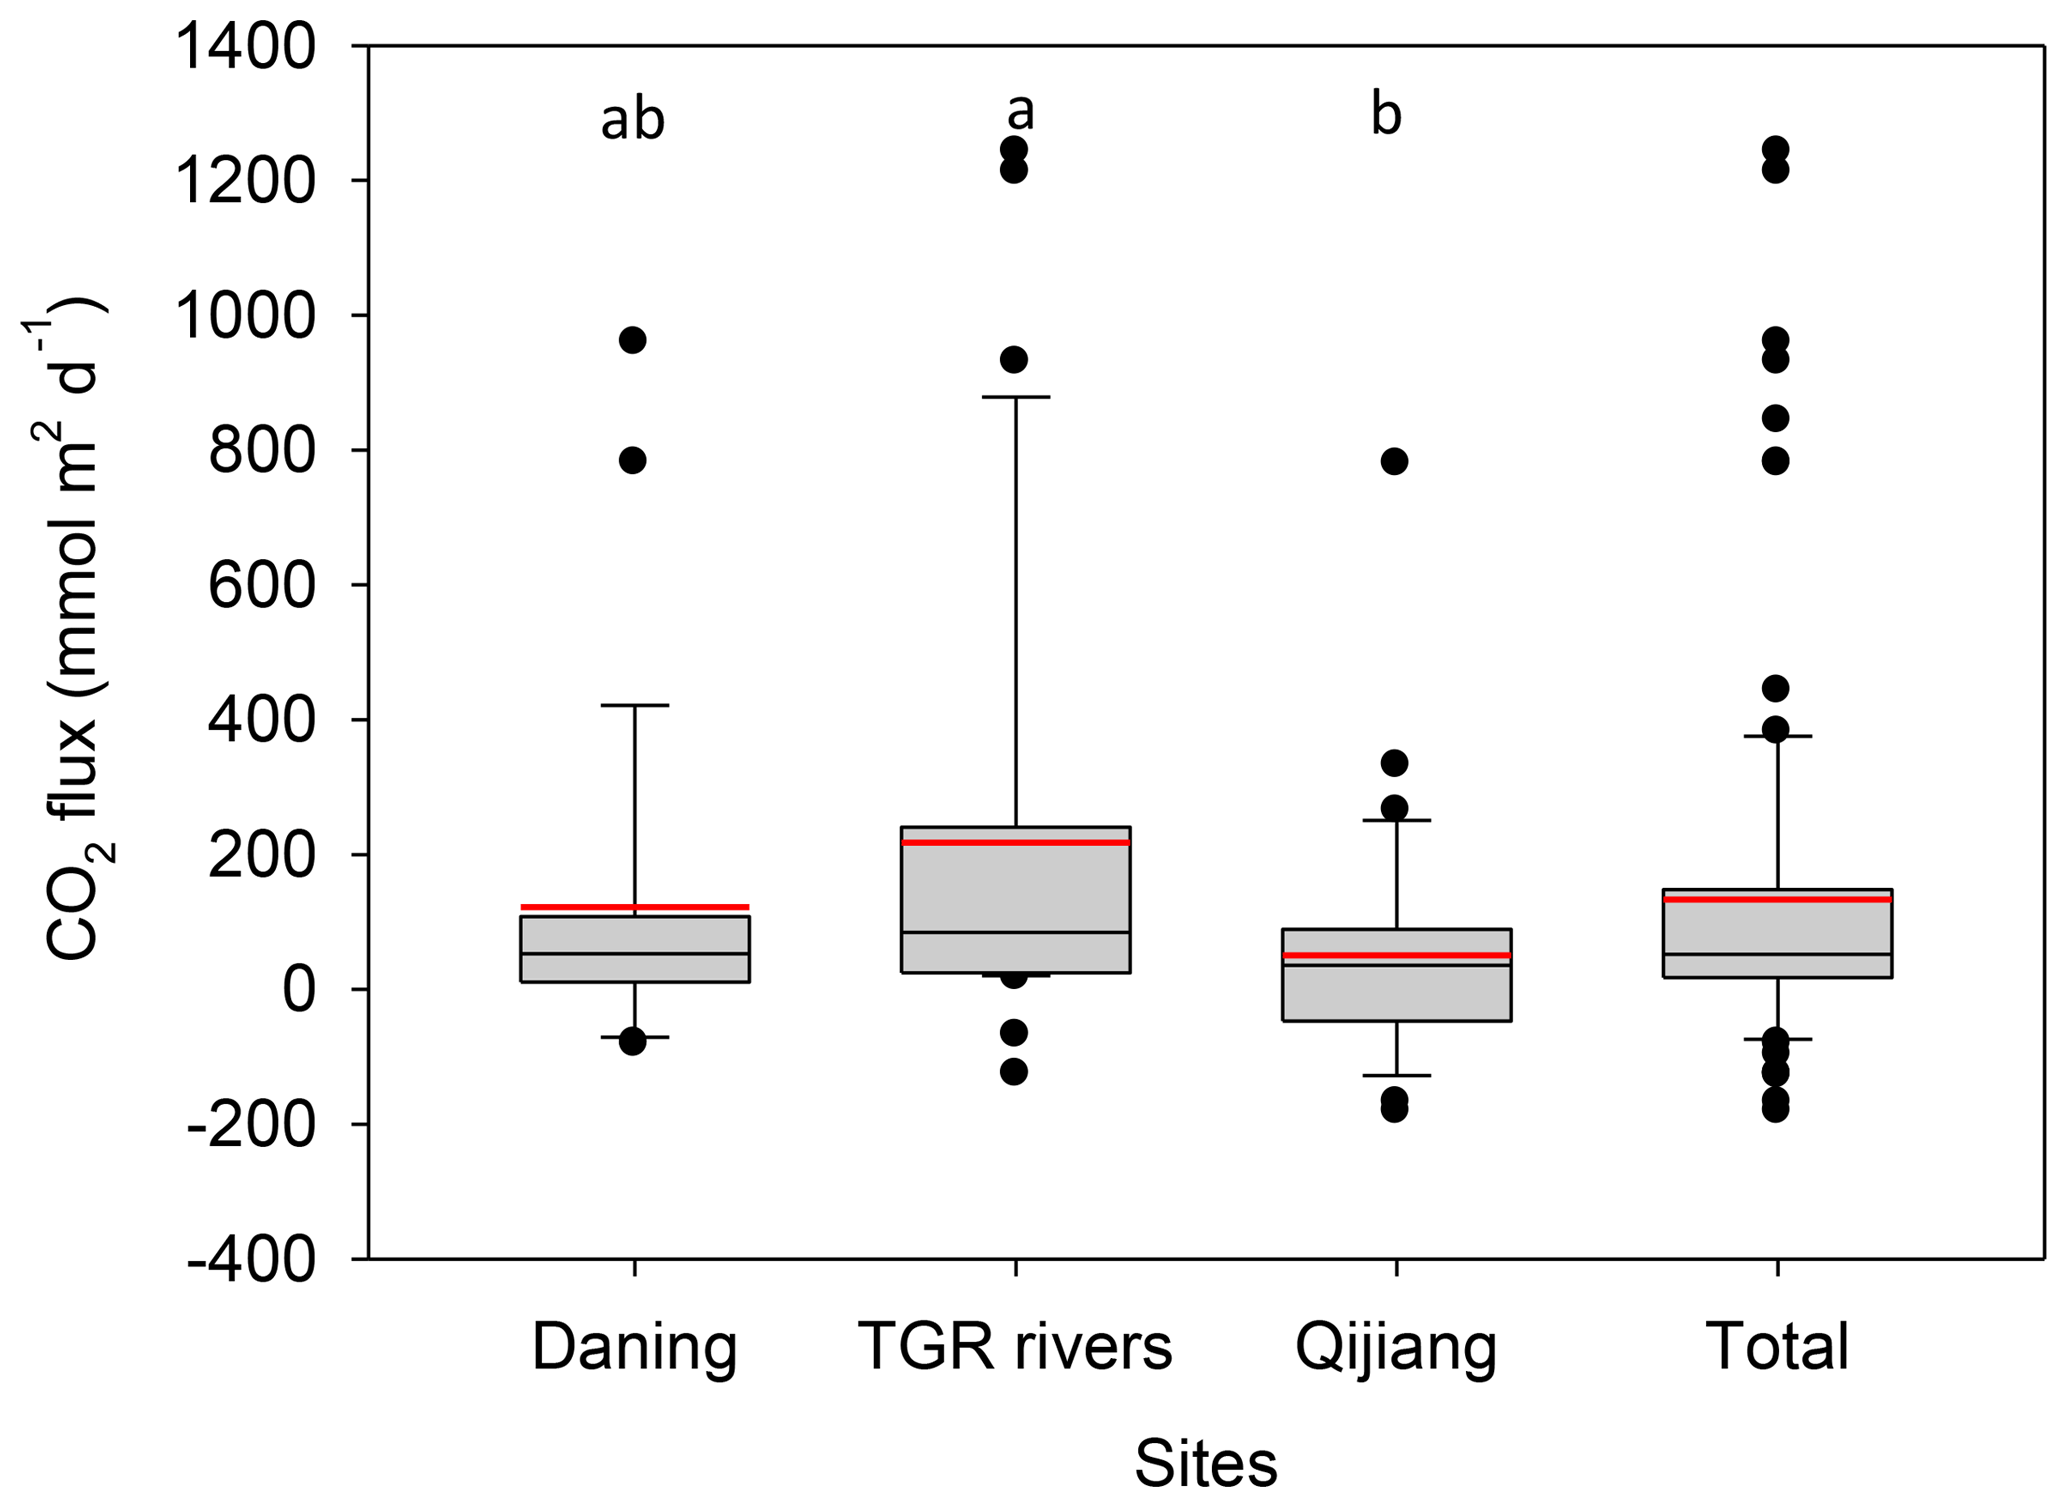
Figure 2Box plots of CO2 emission rates from floating chambers in the three investigated river systems (different letters represent statistical differences at p < 0.05 by Mann–Whitney rank sum test). The black and red lines, lower and upper edges, and bars and dots in or outside the boxes demonstrate median and mean values, 25th and 75th, 5th and 95th, and < 5th and > 95th percentiles of all data, respectively. For an interpretation of the references to color in this figure legend, the reader is referred to the web version of this article. “Total” means combined data from the three river systems.
3.3 k levels
A total of 64 data points were used (10 for Daning River, 33 for TGR rivers and 21 for Qijiang River) to develop the k model after removal of samples with pCO2 less than 110 µatm (Table 2). No significant variability in k600 values was observed among the three rivers sampled (Fig. 3). The mean k600 was relatively higher in Qijiang (60.2±78.9 cm h−1), followed by Daning (50.2±20.1 cm h−1) and TGR rivers (40.4±37.6 cm h−1), while the median k600 was higher in Daning (50.5 cm h−1), followed by TGR rivers (30.0 cm h−1) and Qijiang (25.8 cm h−1) (Fig. 3; Supplement Table S1). Combined k600 data were averaged to 48.4±53.2 cm h−1 (95 % CI: 35.1–61.7), and this is 1.5-fold higher than the median value (32.2 cm h−1) (Fig. 3).
Contrary to our expectations, no significant relationship was observed between k600, water depth and current velocity using all data in the three river systems (TGR streams and small rivers, Daning and Qjiang) (Fig. S4). There were no statistically significant relationships between k600 and wind speed using separated data or combined data. Flow velocity showed a slightly linear relation with k600, and an extreme high value of k600 was observed during periods of higher flow velocity (Fig. S4a) using combined data. A similar trend was also observed between water depth and k600 values (Fig. S4b). k600 as a function of water depth was obtained in the TGR rivers, but it explained only 30 % of the variance in k600. However, the model using data from Qijiang could explain 68 % of the variance in k600 (Fig. 4b), and it was in line with general theory.
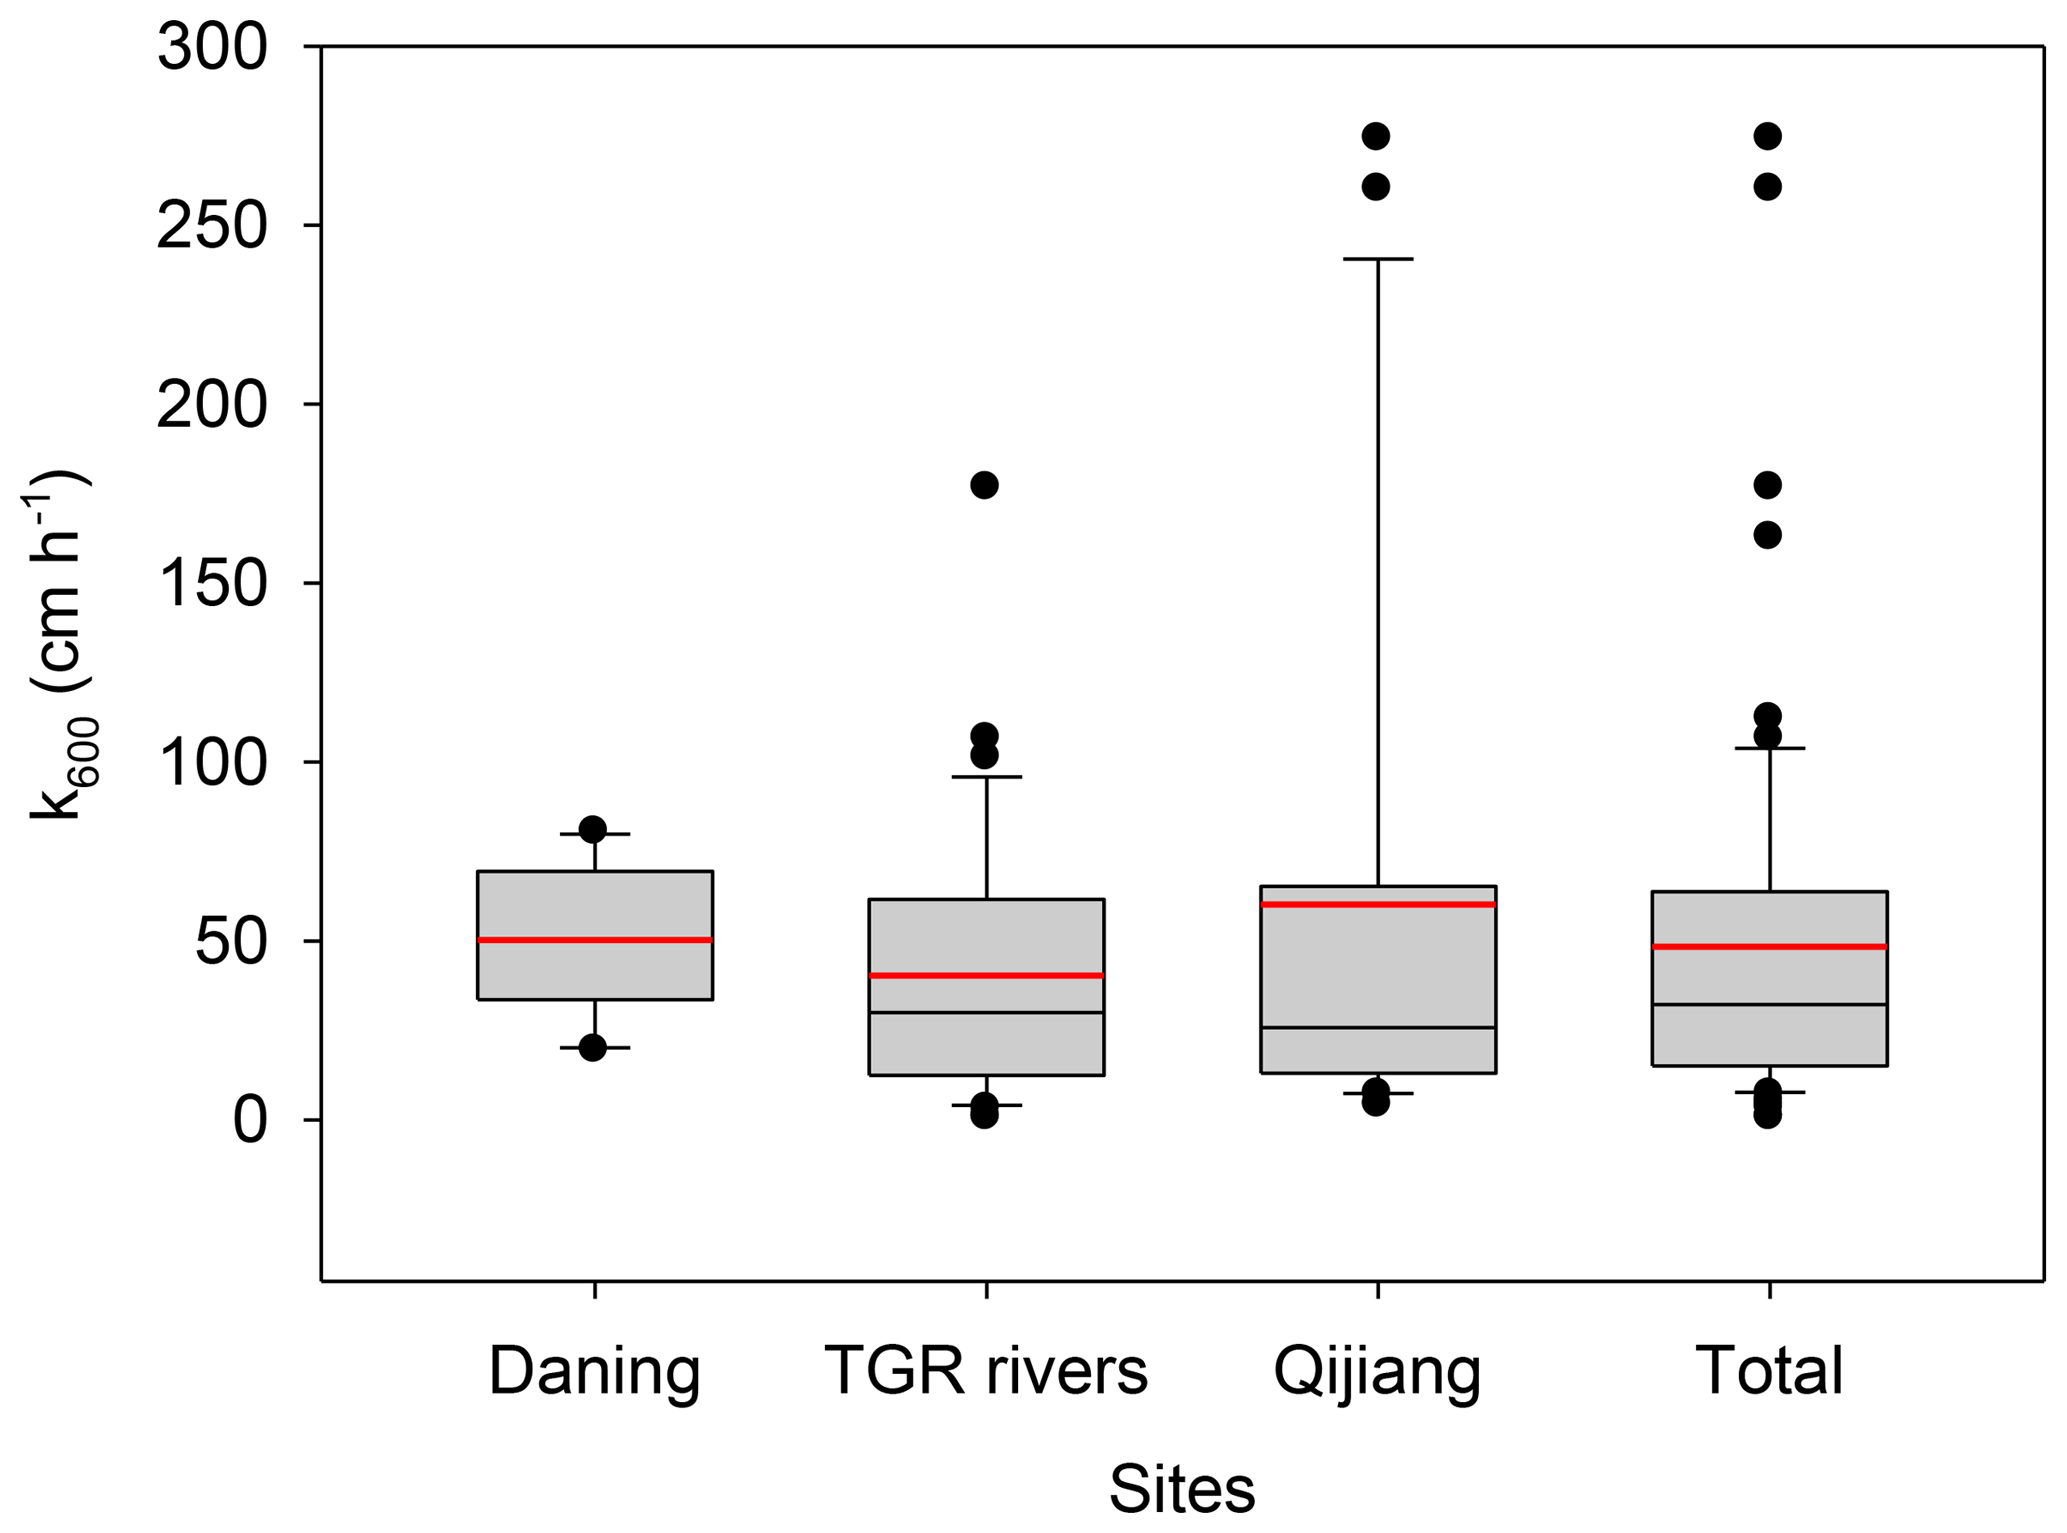
Figure 3Box plots of k600 levels in the three investigated river systems (there is not a statistically significant difference in k among sites by Mann–Whitney rank sum test). The black and red lines, lower and upper edges, and bars and dots in or outside the boxes demonstrate median and mean values, 25th and 75th, 5th and 95th, and < 5th and > 95th percentiles of all data, respectively. For an interpretation of the references to color in this figure legend, the reader is referred to the web version of this article. “Total” means combined data from the three river systems.
4.1 Uncertainty assessment of pCO2 and flux-derived k600 values
The uncertainty of flux-derived k values mainly stems from ΔpCO2 and flux measurements (Bodmer et al., 2016; Golub et al., 2017; Lorke et al., 2015). Thus, we provided uncertainty assessments for dominant sources of uncertainty from measurements of aquatic pCO2 and CO2 areal flux since the uncertainty of atmospheric CO2 measurement could be neglected.
In our study, aquatic pCO2 was computed based on pH, alkalinity and water temperature rather than directly measured. Recent studies highlighted pCO2 uncertainty caused by systematic errors over empiric random errors (Golub et al., 2017). Systematic errors are mainly attributed to instrument limitations, i.e., sondes of pH and water temperature. The relative accuracy of the temperature meters was ±0.1 ∘C according to the manufacturer specifications, and thus the uncertainty of water T propagated on uncertainty in pCO2 was minor (Golub et al., 2017). Systematic errors therefore stem from pH, which has been proved to be a key parameter for biased pCO2 estimation calculated from the aquatic carbon system (Li et al., 2013; Abril et al., 2015). We used a high-accuracy pH electrode and the pH meters were carefully calibrated using CRMs; in situ measurements showed an uncertainty of ±0.01. We then run an uncertainty of ±0.01 pH to quantify the pCO2 uncertainty, and an uncertainty of ±3 % was observed. Systematic errors thus seemed to show little effect on pCO2 errors in our study.
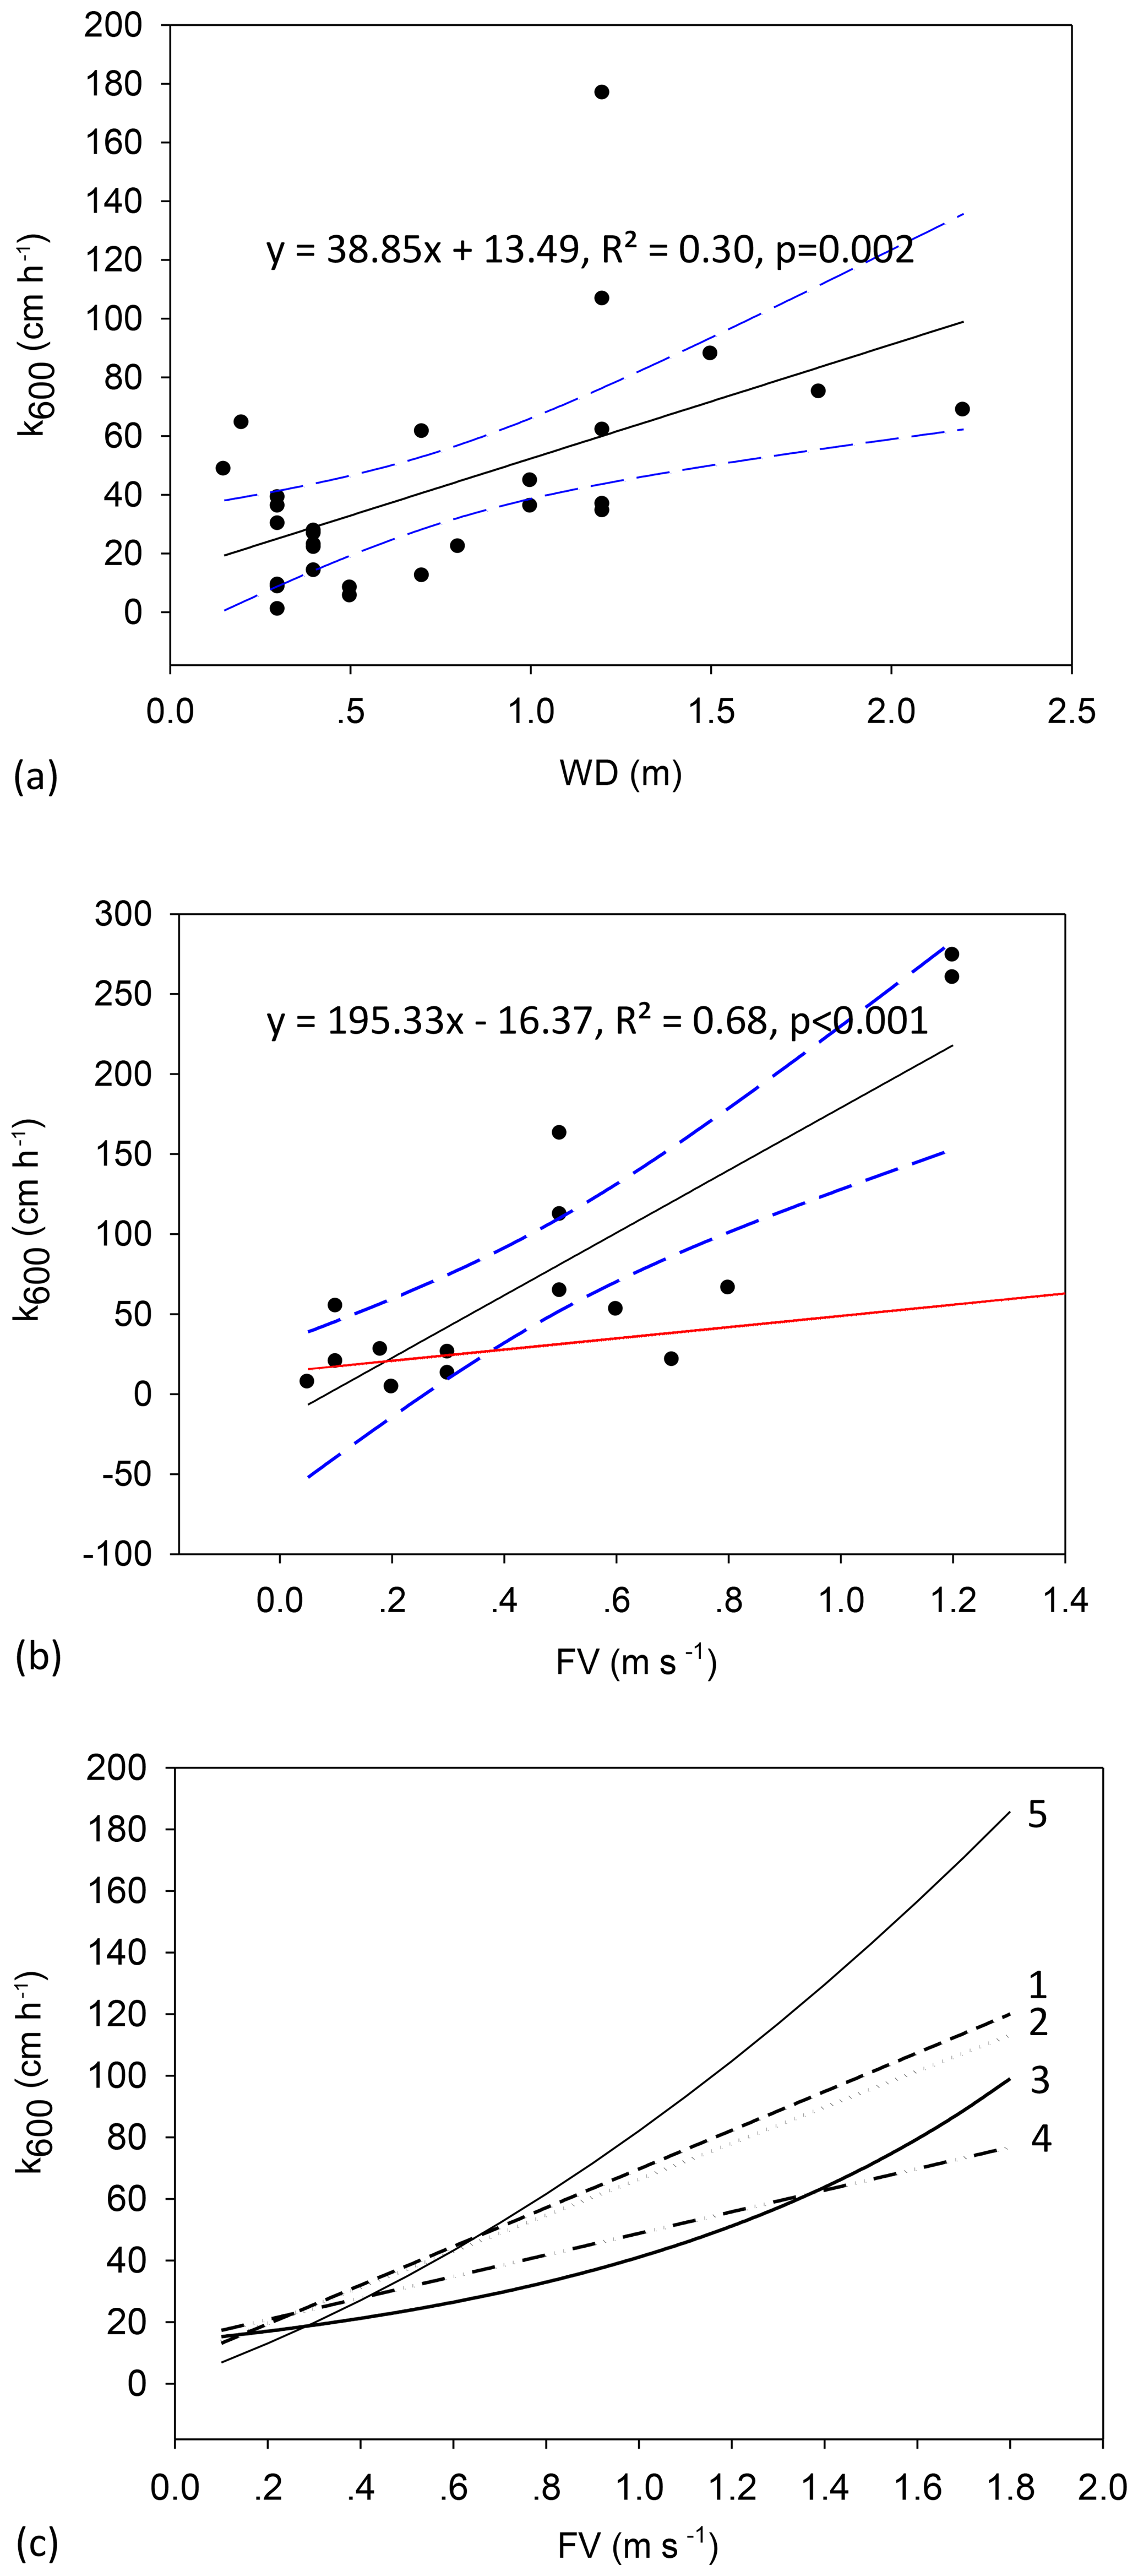
Figure 4The k600 as a function of water depth (WD) using data from TGR rivers (a), flow velocity (FV) using data from Qijiang (b) and comparison of the developed model with other models (c) (others without significant relationships between k and physical factors are not shown). The solid lines show regression, the dashed lines represent the 95 % confidence band, and the red dash-dotted line represents the model developed by Alin et al. (2011). Extreme values of 260 and 274 cm h−1 are removed in panel (b); the revised model would be k600=62.879 FV +6.8357, R2=0.52, p=0.019 (in panel c, 1 – the revised model, 2 – model from Ran et al., 2017, 3 – model from Ran et al., 2015, 4 – model from Alin et al., 2011, 5 – model from Liu et al., 2017; 1 – k600=62.879 FV +6.8357; 2 – k600=58.47 FV +7.99; 3 – k600=13.677 exp (1.1 FV); 4 – k600=35 FV +13.82; 5 – FV +0.3). The unit of k in models 1–4 is cm h−1, and the unit m d−1 for model 5 is transferred to cm h−1.
Random errors are from the repeatability of carbonate measurements. Two replicates for each sample showed an uncertainty within ±5 %, indicating that uncertainty in pCO2 calculation from alkalinity measurements could be minor.
The measured pH ranges also exhibited great effects on pCO2 uncertainty (Hunt et al., 2011; Abril et al., 2015). At low pH, pCO2 can be overestimated when calculated from pH and alkalinity (Abril et al., 2015). Samples for CO2 fluxes estimated from pH and alkalinity showed pH average of 8.39±0.29 (median 8.46 with quartiles of 8.24–8.56) (n=115). Thus, the overestimation of calculated CO2 areal flux from pH and alkalinity is likely to be minor. Further, the contribution of organic matter to non-carbonate alkalinity is likely to be neglected because of low DOC (mean 6.67 mg L−1; median 2.51 mg L−1) (Hunt et al., 2011; Li et al., 2013).
Efforts have been devoted to measurement techniques (comparison of FC, eddy covariance (EC) and boundary layer model; BLM) for improving CO2 quantification from rivers because of a notable contribution of inland waters to the global C budget, which could have a large effect on the magnitude of the terrestrial C sink. Prior studies have reported inconsistent trends of CO2 area flux with these methods. For instance, CO2 areal flux from FC was much lower than EC (Podgrajsek et al., 2014), while areal flux from FC was higher than both EC and BLM elsewhere (Erkkila et al., 2018); however, Schilder et al. (2013) demonstrated that areal flux from BLM was 33 %–320 % of in situ FC measurements. Despite unresolved errors in various techniques and additional perturbations from FC, the FC method is currently a simple and preferred technique for CO2 flux because choosing the right k value remains a major challenge and others require high workloads (Martinsen et al., 2018).
A recent study further reported fundamental differences in CO2 emission rates between ACs and free DFs (Lorke et al., 2015); i.e., ACs biased the gas areal flux higher by a factor of 2.0–5.5. However, some studies observed that ACs showed reasonable agreement with other flux measurement techniques (Galfalk et al., 2013), and this method is straightforward, inexpensive and relatively simple; hence, it is widely used (Ran et al., 2017). Water–air interface CO2 flux measurements were primarily made using ACs in our studied streams and small rivers because of relatively high current velocity; otherwise, floating chambers will travel far during the measurement period. In addition, inflatable rings were used for sealing the chamber headspace and the submergence of ACs was minimal; therefore, our measurements were potentially overestimated, but reasonable. We could not test for the overestimation of ACs in this study; studies with modified FCs, i.e., DCs and the integration of ACs and DCs, and multi-method comparison studies including FCs, ECs and BLM should be conducted for a reliable chamber method.
Our model was from a subset of the data (i.e., Qijiang); CO2 flux from our model was in good agreement with the fluxes from FC, which determined k and other models when the developed model was applied for the whole dataset (please refer to Tables 2 and 3). The comparison of the fluxes from variable methods suggested that the model can be used for riverine CO2 flux at catchment scale or regional scale, though it cannot be used at individual sites. Recent studies, however, did not test the applicability of models when k600 models from other regions were employed. Our k600 values were close to the average of Ran et al. (2015) (measured with drifting chambers) and Liu et al. (2017) (measured with static chambers in canoe shape); this indicated that our potential overestimation was limited. However, since we had very limited drifting chamber measurements because of high current velocity, the relationships with chamber-derived k600 values and flow velocity–depth only with the drifting chamber data could not be tested. We acknowledge that k600 could be overestimated using AFs.
Table 3CO2 emission during the monsoonal period (May through October) from all rivers sampled in the study. (a) Upscaling using CO2 areal flux (mean ±SD) by FC during the monsoonal period. (b) Upscaling using determined k600 average and models (whole datasets are used here).
A total water area of approx. 430 km2 for all tributaries (water area is from Landsat ETM+ in 2015); CO2 emission upscaling (Tg CO2 during May through October) was conducted during the monsoonal period because of the sampling in this period.
The extremely high values (two values of 260 and 274 cm h−1) are outside of the global ranges and also considerably higher than k600 values in Asian rivers. Furthermore, the revised model was comparable to published models (Fig. 4), i.e., models of Ran et al. (2015) (measured with drifting chambers) and Liu et al. (2017) (measured with static chambers in canoe shape), which suggested that the exclusion of the two extreme values was reasonable, and this was further supported by the CO2 flux using different approaches (Tables 2 and 3).
Sampling seasonality considerably regulated riverine pCO2 and gas transfer velocity and thus water–air interface CO2 evasion rate (Ran et al., 2015; Li et al., 2012). We sampled waters in the wet season (monsoonal period) because it showed a wider range of flow velocity and thus it covered the k600 levels in the whole hydrological season. The wet season generally had a higher current velocity and thus a higher gas transfer velocity (Ran et al., 2015), while aquatic pCO2 was variable with seasonality. We recently reported that riverine pCO2 in the wet season was 81 % of the level in the dry season (Li et al., 2018), and a prior study on the Yellow River reported that the k level in the wet season was 1.8-fold higher than in the dry season (Ran et al., 2015). Another study on the Wuding River demonstrated that the k level in the wet season was 83 %–130 % of that in the dry season (Ran et al., 2017). Thus, we acknowledge a certain amount of errors on the annual flux estimation from sampling campaigns during the wet season in the TGR area, but this uncertainty is not significant because the diluted pCO2 could alleviate the overestimated emission with an increased k level in the wet season (for a more detailed discussion, please refer to SOM).
4.2 Determined k values relative to world rivers
We derived k values for the first time in subtropical streams and small rivers. Our determined k600 levels with a 95 % CI of 35.1 to 61.7 (mean: 48.4) cm h−1 compared well with a compilation of data for streams and small rivers (e.g., 3–70 cm h−1) (Raymond et al., 2012). Our determined k600 values are greater than the global river average (8–33 cm h−1) (Raymond et al., 2013; Butman and Raymond, 2011) and much higher than the mean for tropical and temperate large rivers (5–31 cm h−1) (Alin et al., 2011). These studies evidence the fact that k600 values are highly variable in streams and small rivers (Alin et al., 2011; Ran et al., 2015). Though the mean k600 in the TGR, Daning and Qijiang is higher than the global mean, it is consistent with k600 values in the main stream and river networks of the turbulent Yellow River (42±17 cm h−1) (Ran et al., 2015) and Yangtze (38±40 cm h−1) (Liu et al., 2017) (Table S2).
The calculated pCO2 levels were within the published range, but towards the lower end of published concentrations compiled elsewhere (Cole and Caraco, 2001; Li et al., 2013). The total mean pCO2 (846±819 µatm) in the TGR, Daning and Qijiang rivers was one-third lower than the global river average (3220 µatm) (Cole and Caraco, 2001). The pCO2 lower than most of the world's river systems, particularly the under-saturated values, demonstrated that heterotrophic respiration of terrestrially derived DOC was not significant. Compared with high alkalinity, the limited delivery of DOC, particularly in the Daning and Qijiang river systems (Figs. S2 and S3), also indicated that in-stream respiration was limited. These two river systems are characterized by karst terrain and underlain by carbonate rock, for which photosynthetic uptake of dissolved CO2 and carbonate mineral dissolution considerably regulated aquatic pCO2 (Zhang et al., 2017).
Higher pH levels were observed in the Daning and Qijiang river systems (p < 0.05 by Mann–Whitney rank sum test), where more carbonate rock exists that is characterized by karst terrain. Our pH range was comparable to the recent study on karst rivers in China (Zhang et al., 2017). Quite high values (8.39±0.29, ranging between 7.47 and 9.38; 95 % confidence interval: 8.33–8.44) could increase the importance of the chemical enhancement; nonetheless, few studies have taken chemical enhancement into account (Wanninkhof and Knox, 1996; Alshboul and Lorke, 2015). Chemical enhancement can increase the CO2 areal flux by a factor of several-fold in lentic systems with low gas transfer velocity, with the enhancement factor decreasing quickly as k600 increased (Alshboul and Lorke, 2015). Our studied rivers are located in mountainous area with high k600, which could cause minor chemical enhancement. This chemical enhancement of CO2 flux was also reported to be limited in high-pH and turbulent rivers (Zhang et al., 2017).
4.3 Hydraulic controls of k600
It has been well established that k600 is governed by a multitude of physical factors, particularly current velocity, wind speed, stream slope and water depth, among which wind speed is the dominant factor of k in open waters such as large rivers and estuaries (Alin et al., 2011; Borges et al., 2004; Crusius and Wanninkhof, 2003; Raymond and Cole, 2001). In contrast, k600 in small rivers and streams is closely linked to flow velocity, water depth and channel slope (Alin et al., 2011; Raymond et al., 2012). Several studies reported that the combined contribution of flow velocity and wind speed to k is significant in large rivers (Beaulieu et al., 2012; Ran et al., 2015). Thus, k600 values are higher in the Yellow River (ca. 0–120 cm h−1) compared to the low-gradient Mekong River (0–60 cm h−1) (Alin et al., 2011; Ran et al., 2015) due to higher flow velocity in the Yellow River (1.8 m s−1) than the Mekong River (0.9±0.4 m s−1), resulting in greater surface turbulence and a higher k600 level in the Yellow (42±17 cm h−1) than Mekong River (15±9 cm h−1). This could substantiate the higher k600 levels and spatial changes in k600 values of our three river systems. For instance, similar to other turbulent rivers in China (Ran et al., 2015, 2017), high k600 values in the TGR, Daning and Qjiang rivers were due to mountainous terrain catchment, high current velocity (10–150 cm s−1) (Fig. 4b), bottom roughness and shallow water depth (10–150 cm) (Fig. 4a). It has been suggested that shallow water enhances bottom shear, and the resultant turbulence increases k values (Alin et al., 2011; Raymond et al., 2012). These physical controls are highly variable across environmental types (Fig. 4a and b); hence, k values are expected to vary widely (Fig. 3). The k600 values in the TGR rivers showed a wider range (1–177 cm h−1; Fig. 3; Table S1), spanning more than 2 orders of magnitude across the region, and this is consistent with the considerable variability in physical processes related to water turbulence across environmental settings. A similarly broad range of k600 levels was also observed in China's Yellow basin (ca. 0–123 cm h−1) (Ran et al., 2015, 2017).
Insignificant relationships between riverine k600 and wind speed were consistent with earlier studies (Alin et al., 2011; Raymond et al., 2012). The lack of strong correlation between k600 and physical factors using the combined data was probably due to the combined effect of both flow velocity and water depth, as well as large diversity of channel morphology, both across and within river networks in the entire catchment (60 000 km2). This is further collaborated by weak correlations between k600 and flow velocity in the TGR rivers (Fig. 4), where one or two samples were taken for a large-scale examination. We provided new insights into k600 parameterized using current velocity. Nonetheless, k600 from our flow-velocity-based model (Fig. 4b) was potentially largely overestimated with consideration of other measurements (Alin et al., 2011; Ran et al., 2015, 2017). When several extreme values were removed, k600 (cm h−1) was parameterized as follows: k600=62.879 FV +6.8357, R2=0.52, p=0.019, flow velocity with a unit of m s−1. This revised model was in good agreement with the model in the river networks of the Yellow River (Ran et al., 2017), but much lower than the model developed in the Yangtze system (Liu et al., 2017) (Fig. 4c). This was reasonable because k600 values in the Yangtze system were from large rivers with higher turbulence than the Yellow and our studied rivers. Furthermore, the determined k600 using FCs was, on average, consistent with the revised model (Table 2). These differences in the relationship between spatial changes in k600 values and physical characteristics further corroborated the heterogeneity of channel geomorphology and hydraulic conditions across the investigated rivers.
Subtropical streams and small rivers are biologically more active and recognized to exert higher CO2 areal flux to the atmosphere; however, their contribution to riverine carbon cycling is still poorly quantified because of data paucity and the absence of k in particular. Larger uncertainty of riverine CO2 emission in China was anticipated by the use of k600 from other continents or climate zones. For instance, k600 for CO2 emission from tributaries in the Yellow River and karst rivers originated from the model in the Mekong (Zhang et al., 2017), Pearl (Yao et al., 2007), Longchuan (Li et al., 2012) and Metropolitan rivers (Wang et al., 2017), which are mostly from temperate regions. Our k600 values will therefore largely improve the estimation of CO2 evasion from subtropical streams and small rivers and improve the refinement of the riverine carbon budget. More studies, however, are clearly needed to build the model based on flow velocity and slope–water depth given the difficulty in k quantification on a large scale.
4.4 Implications for large-scale estimation
We compared CO2 areal flux from FCs, the models developed here (Fig. 4) and other studies (Alin et al., 2011) (Tables 2 and 3). CO2 evasion was estimated for rivers in China with k values ranging between 8 and 15 cm h−1 (Li et al., 2012; Yao et al., 2007; Wang et al., 2011) (Table S2). These estimates of CO2 evasion rate were considerably lower than using present k600 values (48.4±53.2 cm h−1). For instance, CO2 emission rates in the Longchuan River (e.g., k=8 cm h−1) and Pearl River tributaries (e.g., k=8–15 cm h−1) were 3 to 6 times higher using present k values compared to earlier estimates. We found that the determined k600 average was marginally beyond the levels from the water-depth-based model and the model developed by Alin et al. (2011), while it was equivalent to the flow-velocity-based revised model, resulting in similar patterns of CO2 emission rates (Table 2). Hence, the selection of k values would significantly hamper the accuracy of the flux estimation. Therefore, k must be estimated along with pCO2 measurements to make accurate flux estimations.
We used our measured CO2 emission rate from FCs for upscaling flux estimates during the monsoonal period given the sampling in this period and it was found to be 0.70 Tg CO2 (1 Tg =1012 g) for all rivers sampled in our study (Table 3a). The estimated emission in the monsoonal period was close to that of the revised model (0.71±0.66 (95 % confidence interval: 0.46–0.94) Tg CO2) and using the determined k average, i.e., 0.69±0.65 (95 % confidence interval: 0.45–0.93) Tg CO2, but slightly higher than the estimation using the water-depth-based model (0.54±0.51 Tg CO2) and Alin's model (0.53±0.50 Tg CO2) (Table 3b). This comparable CO2 flux further substantiated the exclusion of extreme k600 values for developing the model (Fig. 4). The CO2 evasion comparison for variable approaches also implied that the original flow-velocity-based model (two extreme k600 values were included; Fig. 4b) largely overestimated the CO2 fluxes, i.e., 1.66±1.55 (1.08–2.23) Tg CO2 was 2.3–3-fold higher than other estimations (Table 3b) and our earlier evasion using TBL on the TGR river networks (Li et al., 2018). Moreover, our estimated CO2 emission during the monsoonal period also suggests that CO2 annual emissions from rivers and streams in this area were previously underestimated, i.e., 0.03 Tg CO2 yr−1 (Li et al., 2017) and 0.37–0.44 Tg CO2 yr−1 (Yang et al., 2013), as the former used a TBL model with a lower k level; the latter employed floating chambers, but they both sampled very limited tributaries (i.e., two to three rivers). Therefore, measurements of k must be made mandatory along with pCO2 measurement in river and stream studies.
We provided the first determination of gas transfer velocity (k) in subtropical streams and small rivers in the upper Yangtze. High variability in k values (mean 48.4±53.2 cm h−1) was observed, reflecting the variability of the morphological characteristics of water turbulence both within and across river networks. We highlighted the fact that k estimates from empirical models should be pursued with caution and the significance of incorporating k measurements along with extensive pCO2 investigation is highly essential for upscaling to watershed- and/or regional-scale carbon (C) budget.
Riverine pCO2 and CO2 areal flux showed pronounced spatial variability with much higher levels in the TGR rivers. The CO2 areal flux was averaged at 133.1±269.1 mmol m−2 d−1 using FCs, and the resulting emission during the monsoonal period was around 0.7 Tg CO2, similar to the scaling-up emission with the determined k and the revised flow-velocity-based model, while also marginally above the water-depth-based model. More work is clearly needed to refine k modeling in the river systems of the upper Yangtze River for evaluating regional C budgets.
Basic data including pH, EC, DO, alkalinity, DOC and nutrients are available in the Supplement.
The supplement related to this article is available online at: https://doi.org/10.5194/bg-16-681-2019-supplement.
SL designed the research. SL, RM and YM collected observational data. SL analyzed the data and interpreted the results. SL wrote the paper with comments provided by VVSSS.
The authors declare that they have no conflict of interest.
This article is part of the special issue “Human impacts on carbon fluxes in Asian river systems”. It is not associated with a conference.
This study was funded by “the Hundred-Talent Program” of the Chinese
Academy of Sciences (R53A362Z10; granted to Siyue Li) and the National
Natural Science Foundation of China (grant no. 31670473). We are grateful to
Maofei Ni, Tianyang Li and Jing Zhang for their assistance in
the fieldwork. Users can access the original data from the Supplement.
Special thanks are given to the editor, David Butman, and anonymous reviewers for
improving the paper.
Edited by: David Butman
Reviewed by: three anonymous referees
Abril, G., Bouillon, S., Darchambeau, F., Teodoru, C. R., Marwick, T. R., Tamooh, F., Ochieng Omengo, F., Geeraert, N., Deirmendjian, L., Polsenaere, P., and Borges, A. V.: Technical Note: Large overestimation of pCO2 calculated from pH and alkalinity in acidic, organic-rich freshwaters, Biogeosciences, 12, 67–78, https://doi.org/10.5194/bg-12-67-2015, 2015.
Alin, S. R., Rasera, M., Salimon, C. I., Richey, J. E., Holtgrieve, G. W., Krusche, A. V., and Snidvongs, A.: Physical controls on carbon dioxide transfer velocity and flux in low-gradient river systems and implications for regional carbon budgets, J. Geophys. Res.-Biogeo., 116, G01009, https://doi.org/10.1029/2010jg001398, 2011.
Alshboul, Z. and Lorke, A.: Carbon Dioxide Emissions from Reservoirs in the Lower Jordan Watershed, PLoS One, 10, e0143381, https://doi.org/10.1371/journal.pone.0143381, 2015.
Beaulieu, J. J., Shuster, W. D., and Rebholz, J. A.: Controls on gas transfer velocities in a large river, J. Geophys. Res.-Biogeo., 117, G02007, https://doi.org/10.1029/2011jg001794, 2012.
Bodmer, P., Heinz, M., Pusch, M., Singer, G., and Premke, K.: Carbon dynamics and their link to dissolved organic matter quality across contrasting stream ecosystems, Sci. Total Environ., 553, 574–586, https://doi.org/10.1016/j.scitotenv.2016.02.095, 2016.
Borges, A. V., Delille, B., Schiettecatte, L. S., Gazeau, F., Abril, G., and Frankignoulle, M.: Gas transfer velocities of CO2 in three European estuaries (Randers Fjord, Scheldt, and Thames), Limnol. Oceanogr., 49, 1630–1641, 2004.
Butman, D. and Raymond, P. A.: Significant efflux of carbon dioxide from streams and rivers in the United States, Nat. Geosci., 4, 839–842, https://doi.org/10.1038/ngeo1294, 2011.
Cole, J. J. and Caraco, N. F.: Carbon in catchments: connecting terrestrial carbon losses with aquatic metabolism, Mar. Freshwater Res., 52, 101–110, https://doi.org/10.1071/mf00084, 2001.
Cole, J. J., Prairie, Y. T., Caraco, N. F., McDowell, W. H., Tranvik, L. J., Striegl, R. G., Duarte, C. M., Kortelainen, P., Downing, J. A., Middelburg, J. J., and Melack, J.: Plumbing the Global Carbon Cycle: Integrating Inland Waters into the Terrestrial Carbon Budget, Ecosystems, 10, 172–185, https://doi.org/10.1007/s10021-006-9013-8, 2007.
Crusius, J. and Wanninkhof, R.: Gas transfer velocities measured at low wind speed over a lake, Limnol. Oceanogr., 48, 1010–1017, 2003.
Erkkilä, K.-M., Ojala, A., Bastviken, D., Biermann, T., Heiskanen, J. J., Lindroth, A., Peltola, O., Rantakari, M., Vesala, T., and Mammarella, I.: Methane and carbon dioxide fluxes over a lake: comparison between eddy covariance, floating chambers and boundary layer method, Biogeosciences, 15, 429–445, https://doi.org/10.5194/bg-15-429-2018, 2018.
Galfalk, M., Bastviken, D., Fredriksson, S. T., and Arneborg, L.: Determination of the piston velocity for water-air interfaces using flux chambers, acoustic Doppler velocimetry, and IR imaging of the water surface, J. Geophys. Res.-Biogeo., 118, 770–782, https://doi.org/10.1002/jgrg.20064, 2013.
Golub, M., Desai, A. R., McKinley, G. A., Remucal, C. K., and Stanley, E. H.: Large Uncertainty in Estimating pCO2 From Carbonate Equilibria in Lakes, J. Geophys. Res.-Biogeo., 122, 2909–2924, https://doi.org/10.1002/2017jg003794, 2017.
Guerin, F., Abril, G., Serca, D., Delon, C., Richard, S., Delmas, R., Tremblay, A., and Varfalvy, L.: Gas transfer velocities of CO2 and CH4 in a tropical reservoir and its river downstream, J. Mar. Syst., 66, 161–172, https://doi.org/10.1016/j.jmarsys.2006.03.019, 2007.
Hunt, C. W., Salisbury, J. E., and Vandemark, D.: Contribution of non-carbonate anions to total alkalinity and overestimation of pCO2 in New England and New Brunswick rivers, Biogeosciences, 8, 3069–3076, https://doi.org/10.5194/bg-8-3069-2011, 2011.
Jean-Baptiste, P. and Poisson, A.: Gas transfer experiment on a lake (Kerguelen Islands) using He-3 and SF6, J. Geophys. Res.-Oceans, 105, 1177–1186, https://doi.org/10.1029/1999jc900088, 2000.
Lauerwald, R., Laruelle, G. G., Hartmann, J., Ciais, P., and Regnier, P. A. G.: Spatial patterns in CO2 evasion from the global river network, Global Biogeochem. Cy., 29, 534–554, https://doi.org/10.1002/2014gb004941, 2015.
Lewis, E., Wallace, D., and Allison, L. J.: Program developed for CO2 system calculations, Brookhaven National Lab., Dept. of Applied Science, Upton, NY (United States); Oak Ridge National Lab., Carbon Dioxide Information Analysis Center, TN (United States)ORNL/CDIAC-105, https://doi.org/10.2172/639712, 40 pp., 1998.
Li, S. and Bush, R. T.: Revision of methane and carbon dioxide emissions from inland waters in India, Glob. Change Biol., 21, 6–8, 2015.
Li, S., Gu, S., Tan, X., and Zhang, Q.: Water quality in the upper Han River basin, China: The impacts of land use/land cover in riparian buffer zone, J. Hazard. Mater., 165, 317–324, https://doi.org/10.1016/j.jhazmat.2008.09.123, 2009.
Li, S., Bush, R. T., Ward, N. J., Sullivan, L. A., and Dong, F.: Air-water CO2 outgassing in the Lower Lakes (Alexandrina and Albert, Australia) following a millennium drought, Sci. Total Environ., 542, 453–468, https://doi.org/10.1016/j.scitotenv.2015.10.070, 2016.
Li, S., Wang, F., Luo, W., Wang, Y., and Deng, B.: Carbon dioxide emissions from the Three Gorges Reservoir, China, Acta Geochimica, 36, 645–657, https://doi.org/10.1007/s11631-017-0154-6, 2017.
Li, S., Ni, M., Mao, R., and Bush, R. T.: Riverine CO2 supersaturation and outgassing in a subtropical monsoonal mountainous area (Three Gorges Reservoir Region) of China, J. Hydrol., 558, 460–469, https://doi.org/10.1016/j.jhydrol.2018.01.057, 2018.
Li, S. Y., Lu, X. X., He, M., Zhou, Y., Li, L., and Ziegler, A. D.: Daily CO2 partial pressure and CO2 outgassing in the upper Yangtze River basin: A case study of the Longchuan River, China, J. Hydrol., 466, 141–150, https://doi.org/10.1016/j.jhydrol.2012.08.011, 2012.
Li, S. Y., Lu, X. X., and Bush, R. T.: CO2 partial pressure and CO2 emission in the Lower Mekong River, J. Hydrol., 504, 40–56, https://doi.org/10.1016/j.jhydrol.2013.09.024, 2013.
Liu, S., Lu, X. X., Xia, X., Zhang, S., Ran, L., Yang, X., and Liu, T.: Dynamic biogeochemical controls on river pCO2 and recent changes under aggravating river impoundment: An example of the subtropical Yangtze River, Global Biogeochem. Cy., 30, 880–897, https://doi.org/10.1002/2016gb005388, 2016.
Liu, S., Lu, X. X., Xia, X., Yang, X., and Ran, L.: Hydrological and geomorphological control on CO2 outgassing from low-gradient large rivers: An example of the Yangtze River system, J. Hydrol., 550, 26–41, https://doi.org/10.1016/j.jhydrol.2017.04.044, 2017.
Lorke, A., Bodmer, P., Noss, C., Alshboul, Z., Koschorreck, M., Somlai-Haase, C., Bastviken, D., Flury, S., McGinnis, D. F., Maeck, A., Müller, D., and Premke, K.: Technical note: drifting versus anchored flux chambers for measuring greenhouse gas emissions from running waters, Biogeosciences, 12, 7013–7024, https://doi.org/10.5194/bg-12-7013-2015, 2015.
Mao, R., Chen, H., and Li, S.: Phosphorus availability as a primary control of dissolved organic carbon biodegradation in the tributaries of the Yangtze River in the Three Gorges Reservoir Region, Sci. Total Environ., 574, 1472–1476, https://doi.org/10.1016/j.scitotenv.2016.08.132, 2017.
Martinsen, K. T., Kragh, T., and Sand-Jensen, K.: Technical note: A simple and cost-efficient automated floating chamber for continuous measurements of carbon dioxide gas flux on lakes, Biogeosciences, 15, 5565–5573, https://doi.org/10.5194/bg-15-5565-2018, 2018.
Millero, F.: The thermodynamics of the carbonate system in seawater, Geochem. Cosmochem., 43, 1651–1661, 1979.
Podgrajsek, E., Sahlée, E., Bastviken, D., Holst, J., Lindroth, A., Tranvik, L., and Rutgersson, A.: Comparison of floating chamber and eddy covariance measurements of lake greenhouse gas fluxes, Biogeosciences, 11, 4225–4233, https://doi.org/10.5194/bg-11-4225-2014, 2014.
Prytherch, J., Brooks, I. M., Crill, P. M., Thornton, B. F., Salisbury, D. J., Tjernstrom, M., Anderson, L. G., Geibel, M. C., and Humborg, C.: Direct determination of the air-sea CO2 gas transfer velocity in Arctic sea ice regions, Geophys. Res. Lett., 44, 3770–3778, https://doi.org/10.1002/2017gl073593, 2017.
Ran, L., Li, L., Tian, M., Yang, X., Yu, R., Zhao, J., Wang, L., and Lu, X. X.: Riverine CO2 emissions in the Wuding River catchment on the Loess Plateau: Environmental controls and dam impoundment impact, J. Geophys. Res.-Biogeo., 122, 1439–1455, https://doi.org/10.1002/2016jg003713, 2017.
Ran, L. S., Lu, X. X., Yang, H., Li, L. Y., Yu, R. H., Sun, H. G., and Han, J. T.: CO2 outgassing from the Yellow River network and its implications for riverine carbon cycle, J. Geophys. Res.-Biogeo., 120, 1334–1347, https://doi.org/10.1002/2015jg002982, 2015.
Raymond, P. A. and Cole, J. J.: Gas exchange in rivers and estuaries: Choosing a gas transfer velocity, Estuaries, 24, 312–317, https://doi.org/10.2307/1352954, 2001.
Raymond, P. A., Zappa, C. J., Butman, D., Bott, T. L., Potter, J., Mulholland, P., Laursen, A. E., Mcdowell, W. H., and Newbold, D.: Scaling the gas transfer velocity and hydraulic geometry in streams and small rivers, Limnology & Oceanography Fluids & Environments, 2, 41–53, 2012.
Raymond, P. A., Hartmann, J., Lauerwald, R., Sobek, S., McDonald, C., Hoover, M., Butman, D., Striegl, R., Mayorga, E., Humborg, C., Kortelainen, P., Duerr, H., Meybeck, M., Ciais, P., and Guth, P.: Global carbon dioxide emissions from inland waters, Nature, 503, 355–359, https://doi.org/10.1038/nature12760, 2013.
Schilder, J., Bastviken, D., van Hardenbroek, M., Kankaala, P., Rinta, P., Stötter, T., and Heiri, O.: Spatial heterogeneity and lake morphology affect diffusive greenhouse gas emission estimates of lakes, Geophys. Res. Lett., 40, 5752–5756, https://doi.org/10.1002/2013gl057669, 2013.
Tranvik, L. J., Downing, J. A., Cotner, J. B., Loiselle, S. A., Striegl, R. G., Ballatore, T. J., Dillon, P., Finlay, K., Fortino, K., and Knoll, L. B.: Lakes and reservoirs as regulators of carbon cycling and climate, Limnol. Oceanogr., 54, 2298–2314, 2009.
Wang, F., Wang, B., Liu, C. Q., Wang, Y., Guan, J., Liu, X., and Yu, Y.: Carbon dioxide emission from surface water in cascade reservoirs–river system on the Maotiao River, southwest of China, Atmos. Environ., 45, 3827–3834, 2011.
Wang, X. F., He, Y. X., Yuan, X. Z., Chen, H., Peng, C. H., Zhu, Q., Yue, J. S., Ren, H. Q., Deng, W., and Liu, H.: pCO2 and CO2 fluxes of the metropolitan river network in relation to the urbanization of Chongqing, China, J. Geophys. Res.-Biogeo., 122, 470–486, https://doi.org/10.1002/2016jg003494, 2017.
Wanninkhof, R.: Relationship between wind-speed and gas-exchange over the ocean, J. Geophys. Res.-Oceans, 97, 7373–7382, https://doi.org/10.1029/92jc00188, 1992.
Wanninkhof, R. and Knox, M.: Chemical enhancement of CO2 exchange in natural waters, Limnol. Oceanogr., 41, 689–697, https://doi.org/10.4319/lo.1996.41.4.0689, 1996.
Wanninkhof, R., Asher, W. E., Ho, D. T., Sweeney, C., and McGillis, W. R.: Advances in Quantifying Air-Sea Gas Exchange and Environmental Forcing, Annu. Rev. Mar. Sci., 1, 213–244, https://doi.org/10.1146/annurev.marine.010908.163742, 2009.
Xiao, S., Yang, H., Liu, D., Zhang, C., Lei, D., Wang, Y., Peng, F., Li, Y., Wang, C., Li, X., Wu, G., and Liu, L.: Gas transfer velocities of methane and carbon dioxide in a subtropical shallow pond, Tellus B, 66, 23795, https://doi.org/10.3402/tellusb.v66.23795, 2014.
Yang, L., Lu, F., Wang, X., Duan, X., Tong, L., Ouyang, Z., and Li, H.: Spatial and seasonal variability of CO2 flux at the air-water interface of the Three Gorges Reservoir, J. Environ. Sci., 25, 2229–2238, https://doi.org/10.1016/S1001-0742(12)60291-5, 2013.
Yao, G. R., Gao, Q. Z., Wang, Z. G., Huang, X. K., He, T., Zhang, Y. L., Jiao, S. L., and Ding, J.: Dynamics Of CO2 partial pressure and CO2 outgassing in the lower reaches of the Xijiang River, a subtropical monsoon river in China, Sci. Total Environ., 376, 255–266, https://doi.org/10.1016/j.scitotenv.2007.01.080, 2007.
Zhang, J., Li, S., Dong, R., and Jiang, C.: Physical evolution of the Three Gorges Reservoir using advanced SVM on Landsat images and SRTM DEM data, Environ. Sci. Pollut. R., 25, 14911–14918, https://doi.org/10.1007/s11356-018-1696-9, 2018.
Zhang, T., Li, J., Pu, J., Martin, J. B., Khadka, M. B., Wu, F., Li, L., Jiang, F., Huang, S., and Yuan, D.: River sequesters atmospheric carbon and limits the CO2 degassing in karst area, southwest China, Sci. Total Environ., 609, 92–101, https://doi.org/10.1016/j.scitotenv.2017.07.143, 2017.