the Creative Commons Attribution 4.0 License.
the Creative Commons Attribution 4.0 License.
 | 04 Feb 2019
Multi-trace-element sea surface temperature coral reconstruction for the southern Mozambique Channel reveals teleconnections with the tropical Atlantic
Juan P. D'Olivo
Christoph J. Gey
Malcolm T. McCulloch
J. Henrich Bruggemann
Janice M. Lough
Mireille M. M. Guillaume
Here we report seasonally resolved sea surface temperatures for the southern Mozambique Channel in the SW Indian Ocean based on multi-trace-element temperature proxy records preserved in two Porites sp. coral cores. Particularly, we assess the suitability of both separate and combined Sr∕Ca and Li∕Mg proxies for improved multielement SST reconstructions. Overall, geochemical records from Europa Island Porites sp. highlight the potential of Sr∕Ca and Li∕Mg ratios as high-resolution climate proxies but also show significant differences in their response at this Indian Ocean subtropical reef site. Our reconstruction from 1970 to 2013 using the Sr∕Ca SST proxy reveals a warming trend of 0.58±0.1 ∘C in close agreement with instrumental data (0.47±0.07 ∘C) over the last 42 years (1970–2013). In contrast, the Li∕Mg showed unrealistically large warming trends, most probably caused by uncertainties around different uptake mechanisms of the trace elements Li and Mg and uncertainties in their temperature calibration. In our study, Sr∕Ca is superior to Li∕Mg to quantify absolute SST and relative changes in SST. However, spatial correlations between the combined detrended Sr∕Ca and Li∕Mg proxies compared to instrumental SST at Europa revealed robust correlations with local climate variability in the Mozambique Channel and teleconnections to regions in the Indian Ocean and southeastern Pacific where surface wind variability appeared to dominate the underlying pattern of SST variability. The strongest correlation was found between our Europa SST reconstruction and instrumental SST records from the northern tropical Atlantic. Only a weak correlation was found with ENSO, with recent warm anomalies in the geochemical proxies coinciding with strong El Niño or La Niña. We identified the Pacific–North American (PNA) atmospheric pattern, which develops in the Pacific in response to ENSO, and the tropical North Atlantic SST as the most likely causes of the observed teleconnections with the Mozambique Channel SST at Europa.
- Article
(9084 KB) - Full-text XML
-
Supplement
(5111 KB) - BibTeX
- EndNote


Ocean–atmosphere dynamics in the tropics are key drivers of large-scale climate phenomena, such as the El Niño–Southern Oscillation (ENSO) (Angell, 1990; Trenberth et al., 1998; Xie et al., 2010; Timmermann et al., 2018). Tropical climate variability therefore has a strong impact on regional and global climate teleconnections. These ocean–atmosphere dynamics are temporally variable and sensitive to small perturbations in sea surface temperature (SST) associated with natural and anthropogenic climate change. The oceans respond to the combined effects of natural variability and greenhouse-driven anthropogenic warming acting at seasonal, interannual, and multi-decadal scales. The complexity of the climate system at temporal and spatial scales therefore calls for a comprehensive assessment of SST pattern change in historical times (Xie et al., 2010). To investigate changing tropical climate and model potential future scenarios, the modern climatology faces the challenge of improving data coverage, especially extending the limited time length of instrumental measurements. The earliest records of SST, measured by commercial ship traffic mainly along trading routes, started in the mid-19th century (Freeman et al., 2017). Only with the arrival of satellite technology in the 1980s have the oceans been covered in more detail. The limited number of observations and drop in data quality prior to the 1980s cause considerable uncertainties in our understanding of important climate interactions (Thompson et al., 2008; Pfeiffer et al., 2017). These limitations make the use of paleoclimate reconstructions, particularly from remote locations, a vital tool to learn about past climate conditions.
Coral reconstructions extending back decades to several centuries provide invaluable data to assess past tropical climate variability (Hennekam et al., 2018; Pfeiffer et al., 2017). One of the most robust and widely used geochemical proxies to reconstruct SST in tropical areas is the Sr∕Ca ratio from massive corals like Porites (Corrège, 2006; Pfeiffer et al., 2009; DeLong et al., 2012). The Sr∕Ca ratios in CaCO3 precipitated during skeletal formation are negatively correlated with temperatures; i.e., as temperatures increase, less Sr is incorporated into the aragonite lattice relative to Ca (Alibert and McCulloch, 1997; Corrège, 2006; DeLong et al., 2007). While the Sr∕Ca proxy is a remarkably useful tool for paleoclimate reconstructions, there are a number of limitations that need to be considered in the application of this proxy for quantitative reconstructions. Among these, there is a significant difference in the Sr∕Ca temperature dependency of biogenic and experimentally precipitated inorganic aragonite (Smith et al., 1979). Abiogenic aragonite has a significantly stronger Sr∕Ca dependence on temperature with a slope of −0.039 to −0.044 mmol mol−1 ∘C−1 than the coral skeletal Sr∕Ca with slopes ranging between −0.040 and −0.084 mmol mol−1 ∘C−1 (Smith et al., 1979; Cohen et al., 2002; Gaetani and Cohen, 2006; Gaetani et al., 2011). This disparity has been considered the influence of strong “vital effects” during the coral biomineralization process (de Villiers et al., 1995) or bio-smoothing effects (Gagan et al., 2012). Nevertheless, several recent studies have confirmed the suitability of the Sr∕Ca paleorecorder when carefully sampled along the optimal growth axis and ideally replicated (Pfeiffer et al., 2009, 2017; DeLong et al., 2012; Zinke et al., 2016). Recently, the use of additional SST-sensitive proxies (multielement paleothermometry) has been tested and the Li∕Mg ratios emerged as a promising tool to reconstruct SST (Hathorne et al., 2013; Montagna et al., 2014; Fowell et al., 2016; D'Olivo et al., 2018). The innovation of the Li∕Mg temperature proxy lies in the normalization of Li to Mg, which is thought to eliminate the influence of Raleigh fractionation processes influencing most trace element incorporations into the coral skeleton (Cohen et al., 2002; Gaetani and Cohen, 2006; Gaetani et al., 2011). Li∕Mg was shown (e.g., Montagna et al., 2014) to be applicable to a large range of coral species inhabiting a large temperature range. However, to date no long-term (e.g., multi-decadal) SST reconstruction has been developed based on Li∕Mg ratios to test its suitability, particularly in tropical corals, in comparison to the established Sr∕Ca time series.
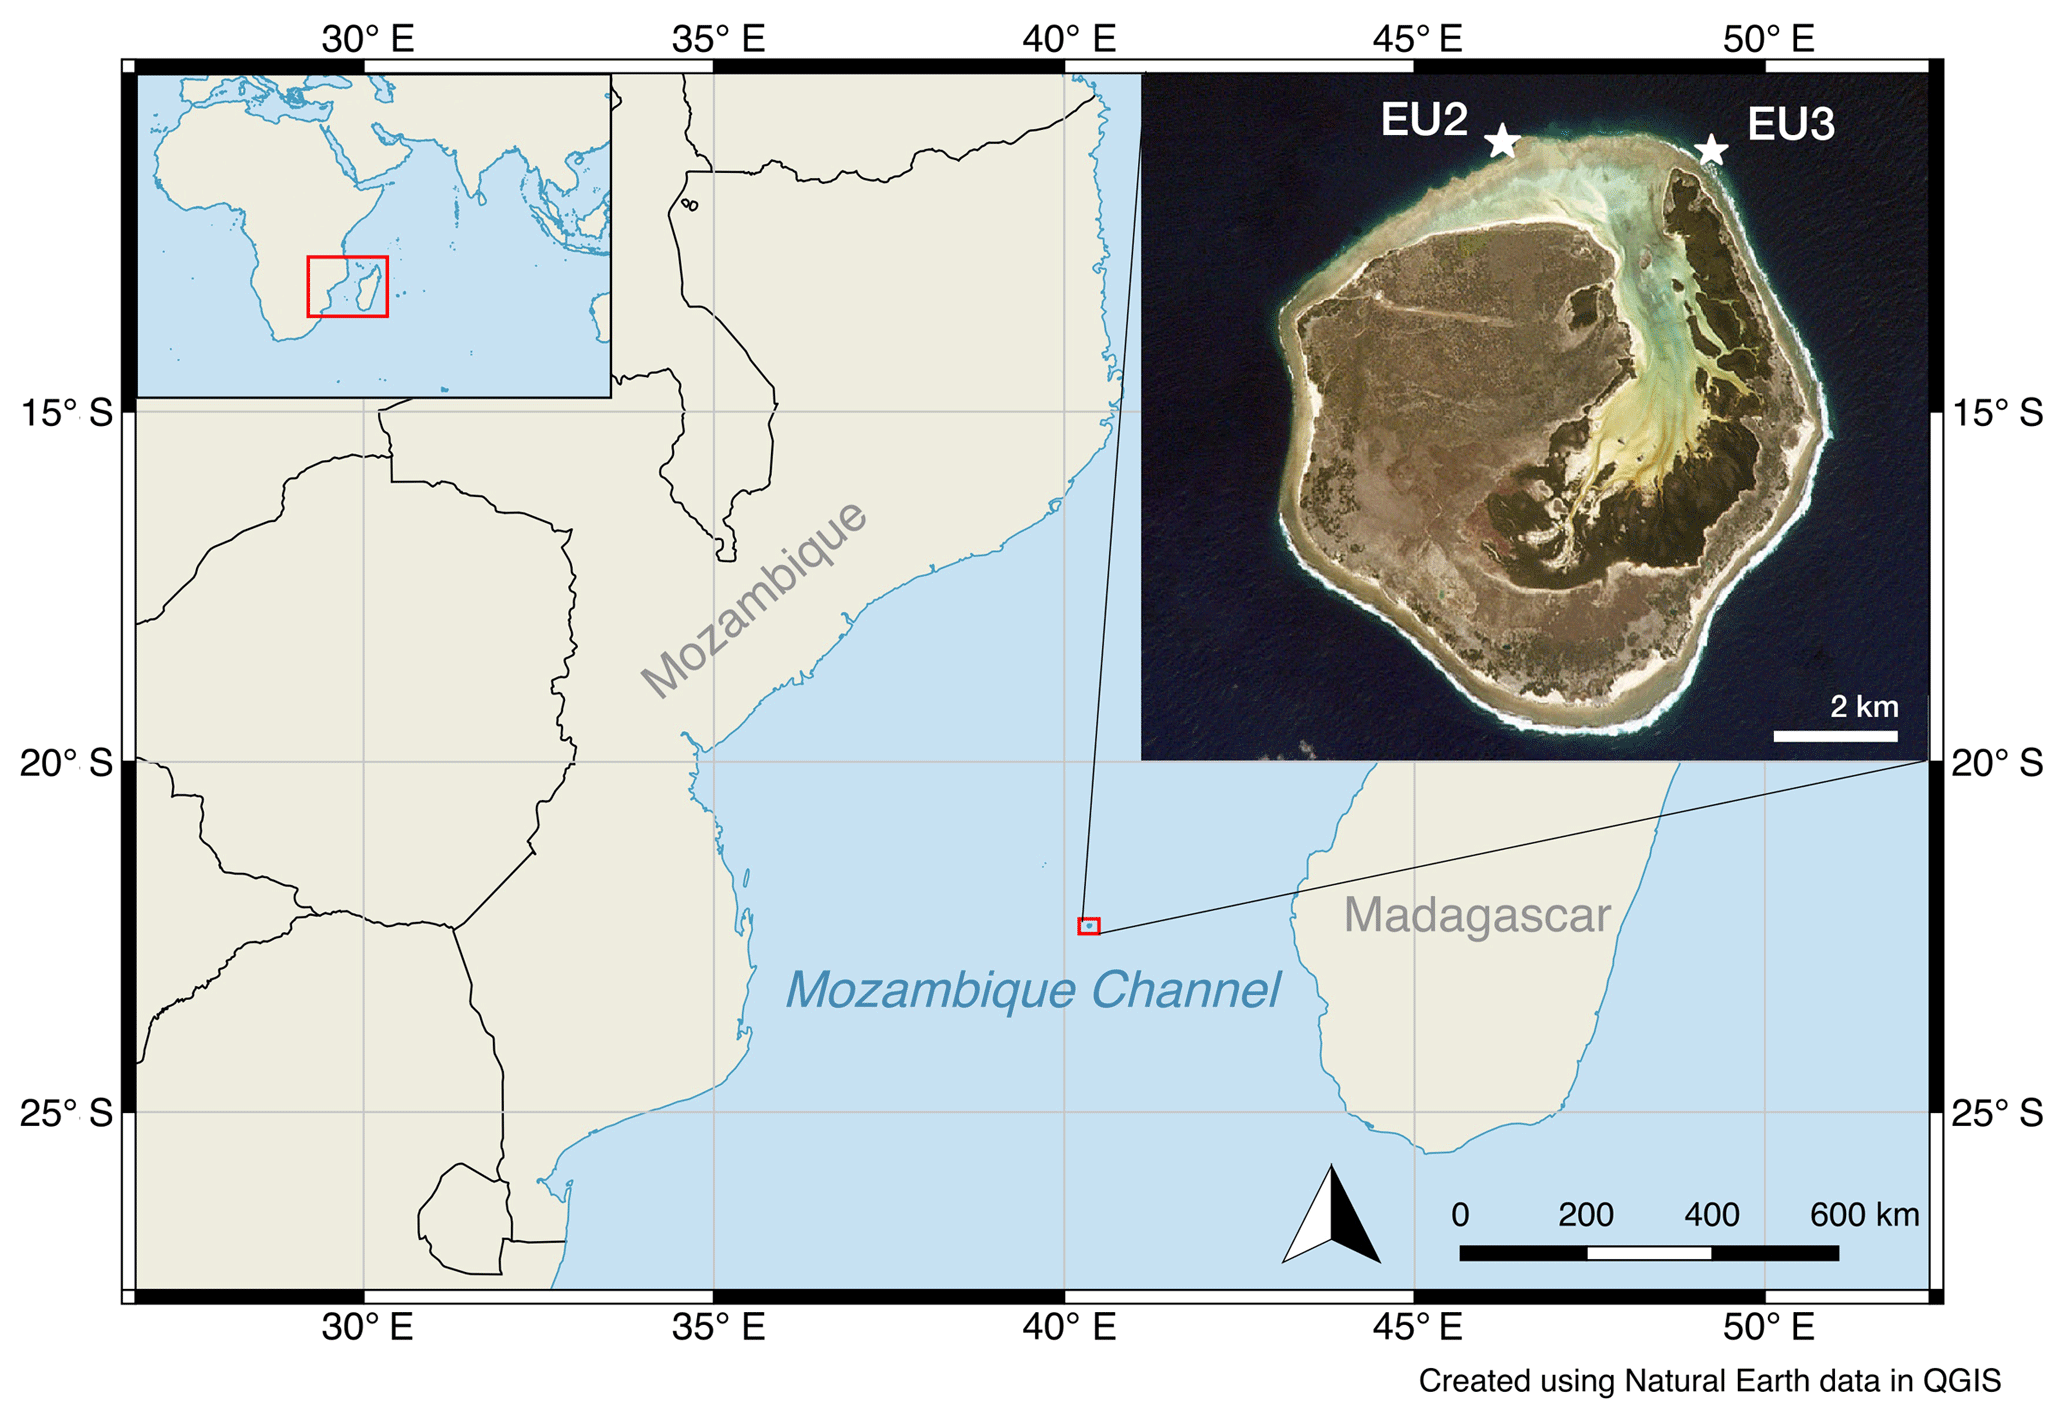
Figure 1Coral collection sites for cores EU2 and EU3 along the northern–northeastern reef slope of Europa and its positioning within the southern Mozambique Channel (southwest Indian Ocean).
The aim of this study was to reconstruct sea surface temperatures based on coral Sr∕Ca, Li∕Mg, and their combination to validate and extend the SST information for the southern Mozambique Channel in the southwestern Indian Ocean. We examined instrumental climate and coral proxy data from Europa Island. The high latitude of this atoll and the lack of human impact make this location ideal to investigate past climate variability based on cores from massive Porites corals (Fig. 1). The Mozambique Channel in the southwestern Indian Ocean is a particular sparsely sampled region, despite its importance as a major pathway of warm surface flow of the global ocean conveyer (De Ruijter et al., 2002; Schouten et al., 2002; Woodruff et al., 2011; Beal et al., 2011). Furthermore, Europa Island is located just upstream of the region that feeds the Agulhas Current, one of the most powerful western boundary currents on the planet. As such, this region is a possible source of both local and global climate interactions and drivers of especially longer-term changes in patterns of SST variability, which are investigated here.
2.1 Study area
Europa Island (hereafter Europa), a 28 km2 atoll that is part of the five Éparses islands of the French Terres Australes et Antarctiques Françaises, lies in the central Mozambique Channel between southern Mozambique and southern Madagascar (22∘21′ S, 40∘21′ E; Fig. 1). Europa, with Hall Tablemount and Bassas da India Atoll, is part of an archipelago that was hypothesized to have been formed by the Quathlamba hot spot, which presently lies beneath Lesotho (Hartnady, 1985). Europa is a carbonate platform attaining a maximum elevation of 6 m with a fossil coral terrace that was dated to the last interglacial period with an age of approximately 94 kyr (Battistini et al., 1976); it therefore formed concomitantly to other carbonate platforms in the Mozambique Channel (Battistini et al., 1976; Guillaume et al., 2013). The 22 km coastline is surrounded by a fringing coral reef with a forereef slope that dips steeply into deeper water. A geomorphological relict of the former atoll drained by the following marine regression forms a narrow shallow lagoon that occupies more than half of the island and opens to the sea through the northern reef flat. A mangrove formation ranging from shrub to forest stands grows in the salt waters of the back and windward edge of the lagoon (Lambs et al., 2016). Europa is characterized by a high-energy environment under the influence of south to southeasterly trade winds (strongest in austral winter) and occasionally impacted by tropical cyclones in austral summer (Barruol et al., 2016). A train of anticyclonic ocean eddies traveling through the Mozambique Channel transports tropical water southward, eventually feeding the Agulhas Current (Beal et al., 2011).
Europa is a no-take area; the pristine state of its fringing coral reefs was attested by scarce macroalgae, high fish biomass, and high coral coverage that locally exceeded 80 % due to superimposed platy Acropora stands (Guillaume and Bruggemann, 2011). While almost undisturbed from local anthropogenic disturbance, remote islands are impacted by global change. For instance, in 1998 (El Niño) a severe coral bleaching event was inferred at Europa from high coral mortality accompanied by a recruit cohort of small-sized Acropora colonies observed 4 years later (Quod and Garnier, 2004). In 2011 (La Niña), a moderate bleaching event affecting mostly Pocillopora corals, massive and branching Porites, was witnessed (Guillaume and Bruggemann, 2011).
2.2 Instrumental temperature data
To review and evaluate the coral geochemical proxies, various sources of instrumental data were assessed. High-resolution SST data () covering 1981 to 2013 were obtained from the Advanced Very High Resolution Reconstructed Optimum Interpolation Sea Surface Temperature version 2 (AVHRR-OISSTv2; Banzon et al., 2014, 2016; Reynolds et al., 2007). The AVHRR-OISSTv2 dataset is composed of daily satellite data and in situ data, adjusted for biases (Banzon et al., 2014). The SST data were extended back to 1970 using the Extended Reconstructed Sea Surface Temperature (ERSSTv4; Liu et al., 2015) dataset, which is based on the International Comprehensive Ocean–Atmosphere Data Set (ICOADS; Woodruff et al., 2011). The ESRSSTv4 record is composed of satellite data from the AVHRR data extended with temperature records from ships and buoys processed at monthly resolution and interpolated to a spatial resolution of 2.0∘. In addition, in situ SST data were available from April 2009 to October 2010 measured by a tide–temperature–conductivity XR-420 6.30 RBR Ltd gauge deployed by the CNRS-INSU close to the Porites coral coring site studied here (Testut et al., 2016). Finally, in situ air temperature records were provided by the Météo-France station at Europa between 1970 and 2013 (no. 98403003; 22.32∘ S, 40.33∘ E; elevation 6 m).
Table 1Coral core GPS locations from Europa, water depth, core name, core length, mean extension rate between 1968 and 2012 (± standard deviation in brackets), and collection dates.

2.3 Coral core sampling, analysis, and age model
Coral cores were extracted with a pneumatic drill in sections of ∼30 cm from two living massive Porites colonies on the northeastern reef slope of Europa in early May 2013 during the ORCIE scientific expedition. The cores were obtained at a depth of 12 to 13 m at the base of the colony with the core top at 8.5–9.5 m of depth. Morphological identification based on skeletal features observed under an optical microscope assigned core EU2 to P. solida and core EU3 to P. mayeri. The longest core EU3 measured 136 cm (Table 1) and was sampled from 2013 back to 1970. The shorter core EU2 was sampled from 2013 back to 2003. Cores were sliced to 7 mm thick slabs and cleaned following established protocols (Nagtegaal et al., 2012). The slabs were then X-rayed to reveal the annual density banding and analyzed by densitometry along single transects at the Australian Institute of Marine Science (Figs. S1 and S2 in the Supplement). Annual rates of linear extension were calculated from (1) X-ray-based density measurements with CoralXDS software (Helmle et al., 2011) and (2) the bimonthly Sr∕Ca records by measuring the distance between Sr∕Ca maxima in both records.
The basis for the optimal extraction of geochemical signals from massive Porites is the precise selection of the sampling path, according to the architecture of the coral skeleton. The X-rays show the corallite fan structures with the chosen sampling path along the central growth axis of the corallum highlighted (Figs. S1 and S2). Carbonate powder samples of approximately 50 mg at 2 mm continuous intervals were obtained along this sampling path with a 0.9 mm diameter dental drill. Processing of the samples for geochemical analysis is based on methods described by Zinke et al. (2015) and D'Olivo et al. (2018). First, the powder samples were homogenized in a small agate mortar and ∼10 mg portions were weighed into thoroughly cleaned 5 mL tubes. Subsequently, the samples were dissolved in 0.5 mL of 0.5 N HNO3 and diluted to a calcium concentration of 100 ppm by taking an aliquot of 38 mL from the primary dissolution and adding 3 mL of 2 % HNO3 to use for the analysis of Li and Mg. A second aliquot for the analysis of Sr, Ca, and Mg was prepared at 10 ppm by using a 300 mL aliquot of the first dilution and adding 2.7 mL of 2 % HNO3 spiked with trace concentrations of scandium, praseodymium, and yttrium used as internal standards. The analyses for trace element (TE) concentrations were made on a Thermo Scientific XSERIES 2 quadrupole ICP-MS (inductively coupled plasma mass spectrometer) at the University of Western Australia (UWA). The Sr∕Ca, Mg∕Ca, and Li∕Mg data reported here are normalized to the JCp-1 Porites sp. standard prepared by the Geological Survey of Japan (Okai et al., 2002) with Sr∕Ca = 8.85 mmol mol−1 (2σ RSD %), Mg∕Ca = 4.20 mmol mol−1 (2σ RSD %), and Li∕Mg =1.47 mmol mol−1 (2σ RSD %) (N=17). The Li∕Ca data were estimated by dividing the Li∕Mg by the Mg∕Ca data. Long-term reproducibility was determined using the UWA in-house Davies Reef coral standard solution with Mg∕Ca %, Sr∕Ca %, and Li∕Mg % (2σ RSD; N=139) (D'Olivo et al., 2018).
The first step after generating the trace element records was to assign an age model. The 2 mm sampling resolution provided six to nine samples per year for any given year and provided robust bimonthly resolved geochemical records. Based on the instrumental SST data from AVHRR-OISSTv2 and the in situ measurements, the coldest bimonthly period (on average July–August) and the warmest bimonthly period (on average February–March) for any given year was established for our location. The age model was assigned by simultaneously checking the correlation of Sr∕Ca and Li∕Mg with the AVHRR-OISSTv2, ensuring the maximum correlation possible was obtained for one proxy without compromising the other proxy. The highest Sr∕Ca and Li∕Mg annual values in the raw data were tied to the annual minimum and the lowest Sr∕Ca and Li∕Mg to the annual maximum in the SST records using the open-source time series analysis toolkit “Analyseries”. Bimonthly (six samples per year) records were generated by linear interpolation in Analyseries to facilitate comparisons between the different datasets.
Calibrations between trace elements and the SST products, and the relationships between different trace elements, were obtained using robust regressions, which accounts for heteroscedasticity errors and the presence of outliers in the data. This method uses iteratively reweighted least squares with a bisquare weighting function. In addition to absolute SST values, SST anomalies (deviations from bimonthly SST seasonality in any given year) were calculated relative to the reference period of 2003 to 2012, which includes the overlap between the two cores. Longer time series anomalies were calculated relative to the 1981 to 2010 period. Bimonthly temperature residuals were calculated for absolute SST and SST anomaly reconstructions to highlight periods during which Sr∕Ca SST and Li∕Mg SST differ from instrumental SST. To evaluate how different trace element ratios tracked the instrumental temperatures, uncertainties in bimonthly absolute SST and SST anomalies for individual and composite cores were calculated based on the root mean square error (RMSE) defined as
where Tcalc,n is the nth term from the coral-derived temperature, Tmeas,n is the nth measurement in the instrumental record, and N is the total number of observations.
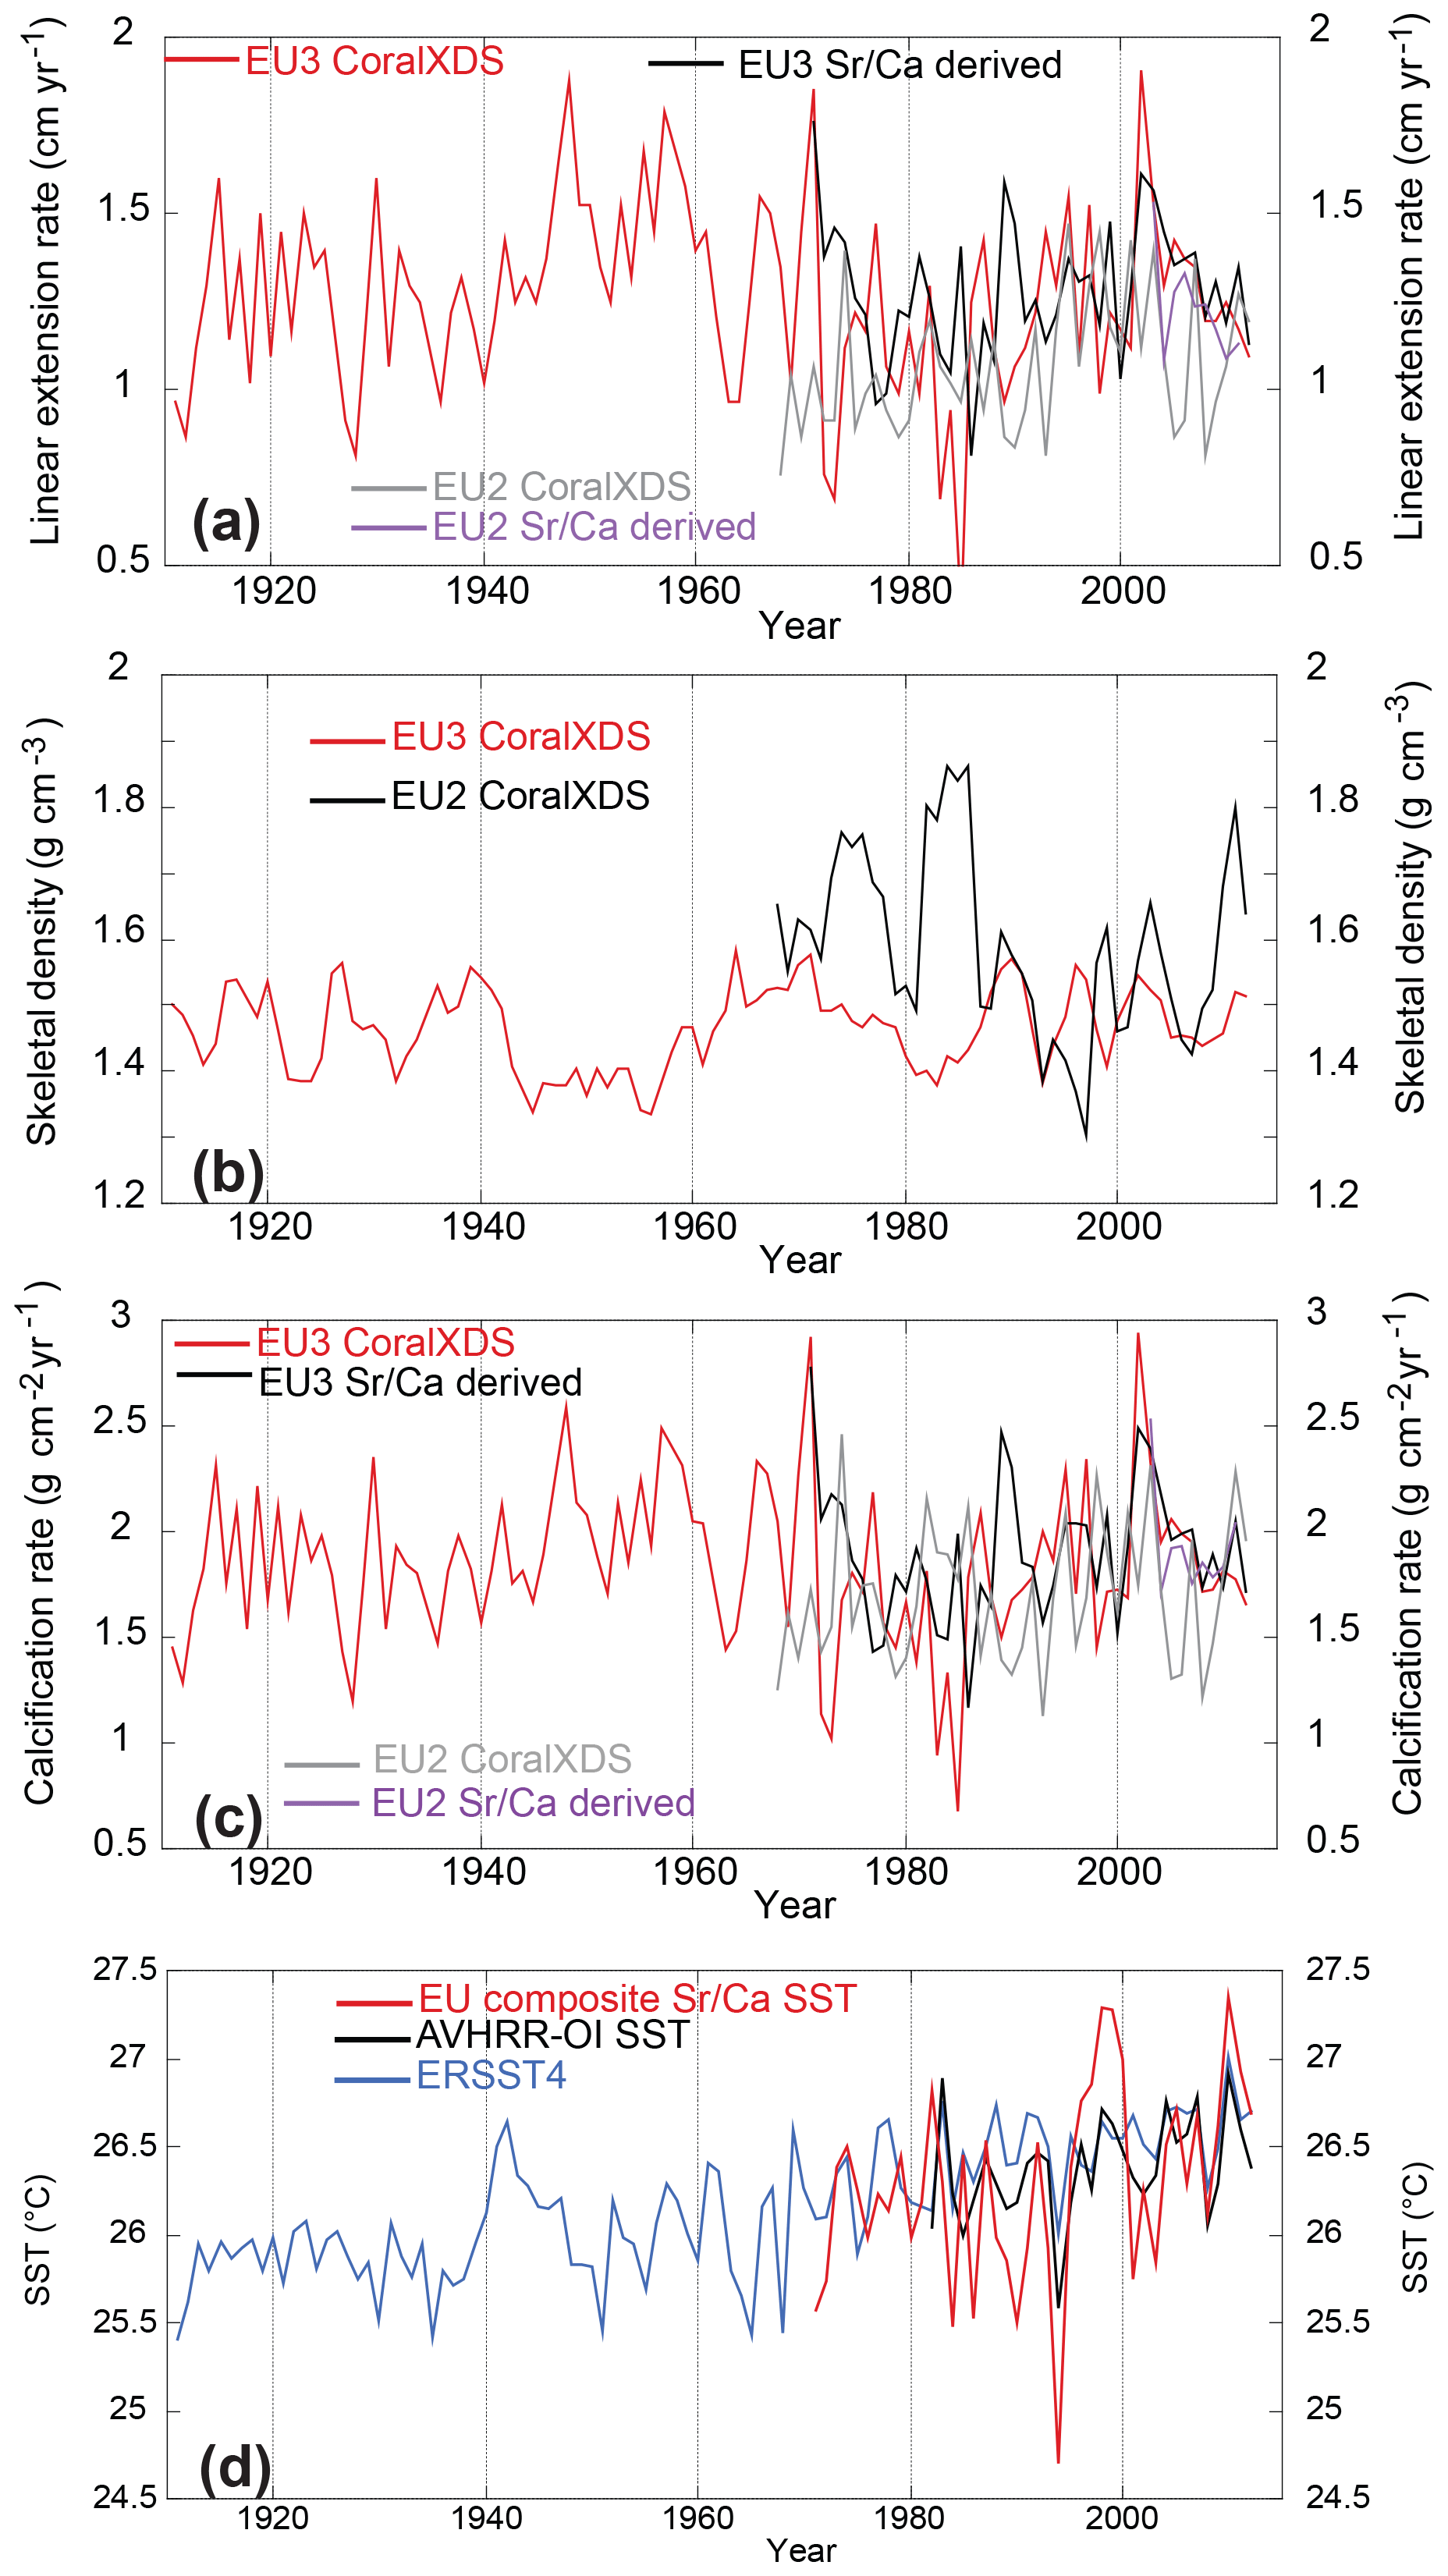
Figure 2Mean annual coral growth parameters of cores EU3 and EU2 compared to coral composite Sr∕Ca SST reconstruction, AVHRR-OISSTv2 (Banzon et al., 2016), and ERSSTv4 (Liu et al., 2015). Mean annual (a) EU2 and EU3 linear extension rate (CoralXDS and Sr∕Ca derived), (b) EU2 and EU3 skeletal density (CoralXDS), (c) EU2 and EU3 calcification rate (CoralXDS and Sr∕Ca derived), and (d) SST time series (ERSSTv4, AVHRR-OI SSTv2, EU Sr∕Ca SST composite).
3.1 Coral growth parameters and SST
Linear extension rates based on the distance between annual density bands and the distance between Sr∕Ca maxima in both cores displayed interannual and multi-decadal variability (Fig. 2a; for anomalies see Fig. S3). Linear extension rates in both cores were above 7 mm yr−1 in any given year. Linear extension for EU3 was within 0.2 cm between the two methods except during 1972 to 1973 and 1983 to 1985. The exceptionally low extension rates during these intervals obtained in core EU3 by the density method (CoralXDS) were most probably related to uncertainties in assessing the chronology due to poorly defined density contrasts (Fig. S2; Table S2). Therefore, for those years, the clear seasonal pattern in Sr∕Ca provided a better chronology control than X-ray densitometry. Extension rates measured with the density method in EU2 and EU3 between 1968 and 2012 showed similar values, with a mean of 1.07±0.19 cm yr−1 for EU2 and 1.2±0.27 cm yr−1 for EU3 (Table 1). However, the sclerochronology based on the density measured with X-rays had large uncertainties due to poorly defined annual density cycles in EU2 in the older part of the record (Fig. S1). EU2 and EU3 mean extension rates measured between Sr∕Ca maxima between 2003 and 2012 were also similar with 1.23±0.14 cm yr−1 for EU2 and 1.28±0.13 cm yr−1 for EU3 (Fig. 2a). Interannual extension rates in EU2 and EU3 showed no significant correlation.
Skeletal density in core EU3 displayed lower variability (±0.1 g cm−3) than core EU2 (±0.2 g cm−3) with no correlation between cores and no significant trend (Fig. 2b). Interestingly, core EU2 displayed higher density than EU3 in El Niño years 1977–78, 1982–83, 2002–03, and 2010 (Table S2). EU3 and EU2 density variations were in antiphase with extension rates for most of the record. Variability and trends in calcification in both cores were mainly explained by changes in extension rates (Fig. 2c; Table S2).
We find no correlation between SST reconstructions or instrumental SST with either extension or calcification rates nor skeletal density in both cores (Fig. 2d). The period of fastest extension and highest calcification in EU3 corresponded to 1947 to 1961 (Table S2). No significant changes in extension or calcification rates were associated with known El Niño events (e.g., 1941–42 and 1998) or local cold–warm events recorded by instrumental and proxy records (e.g., 1994, 2002).
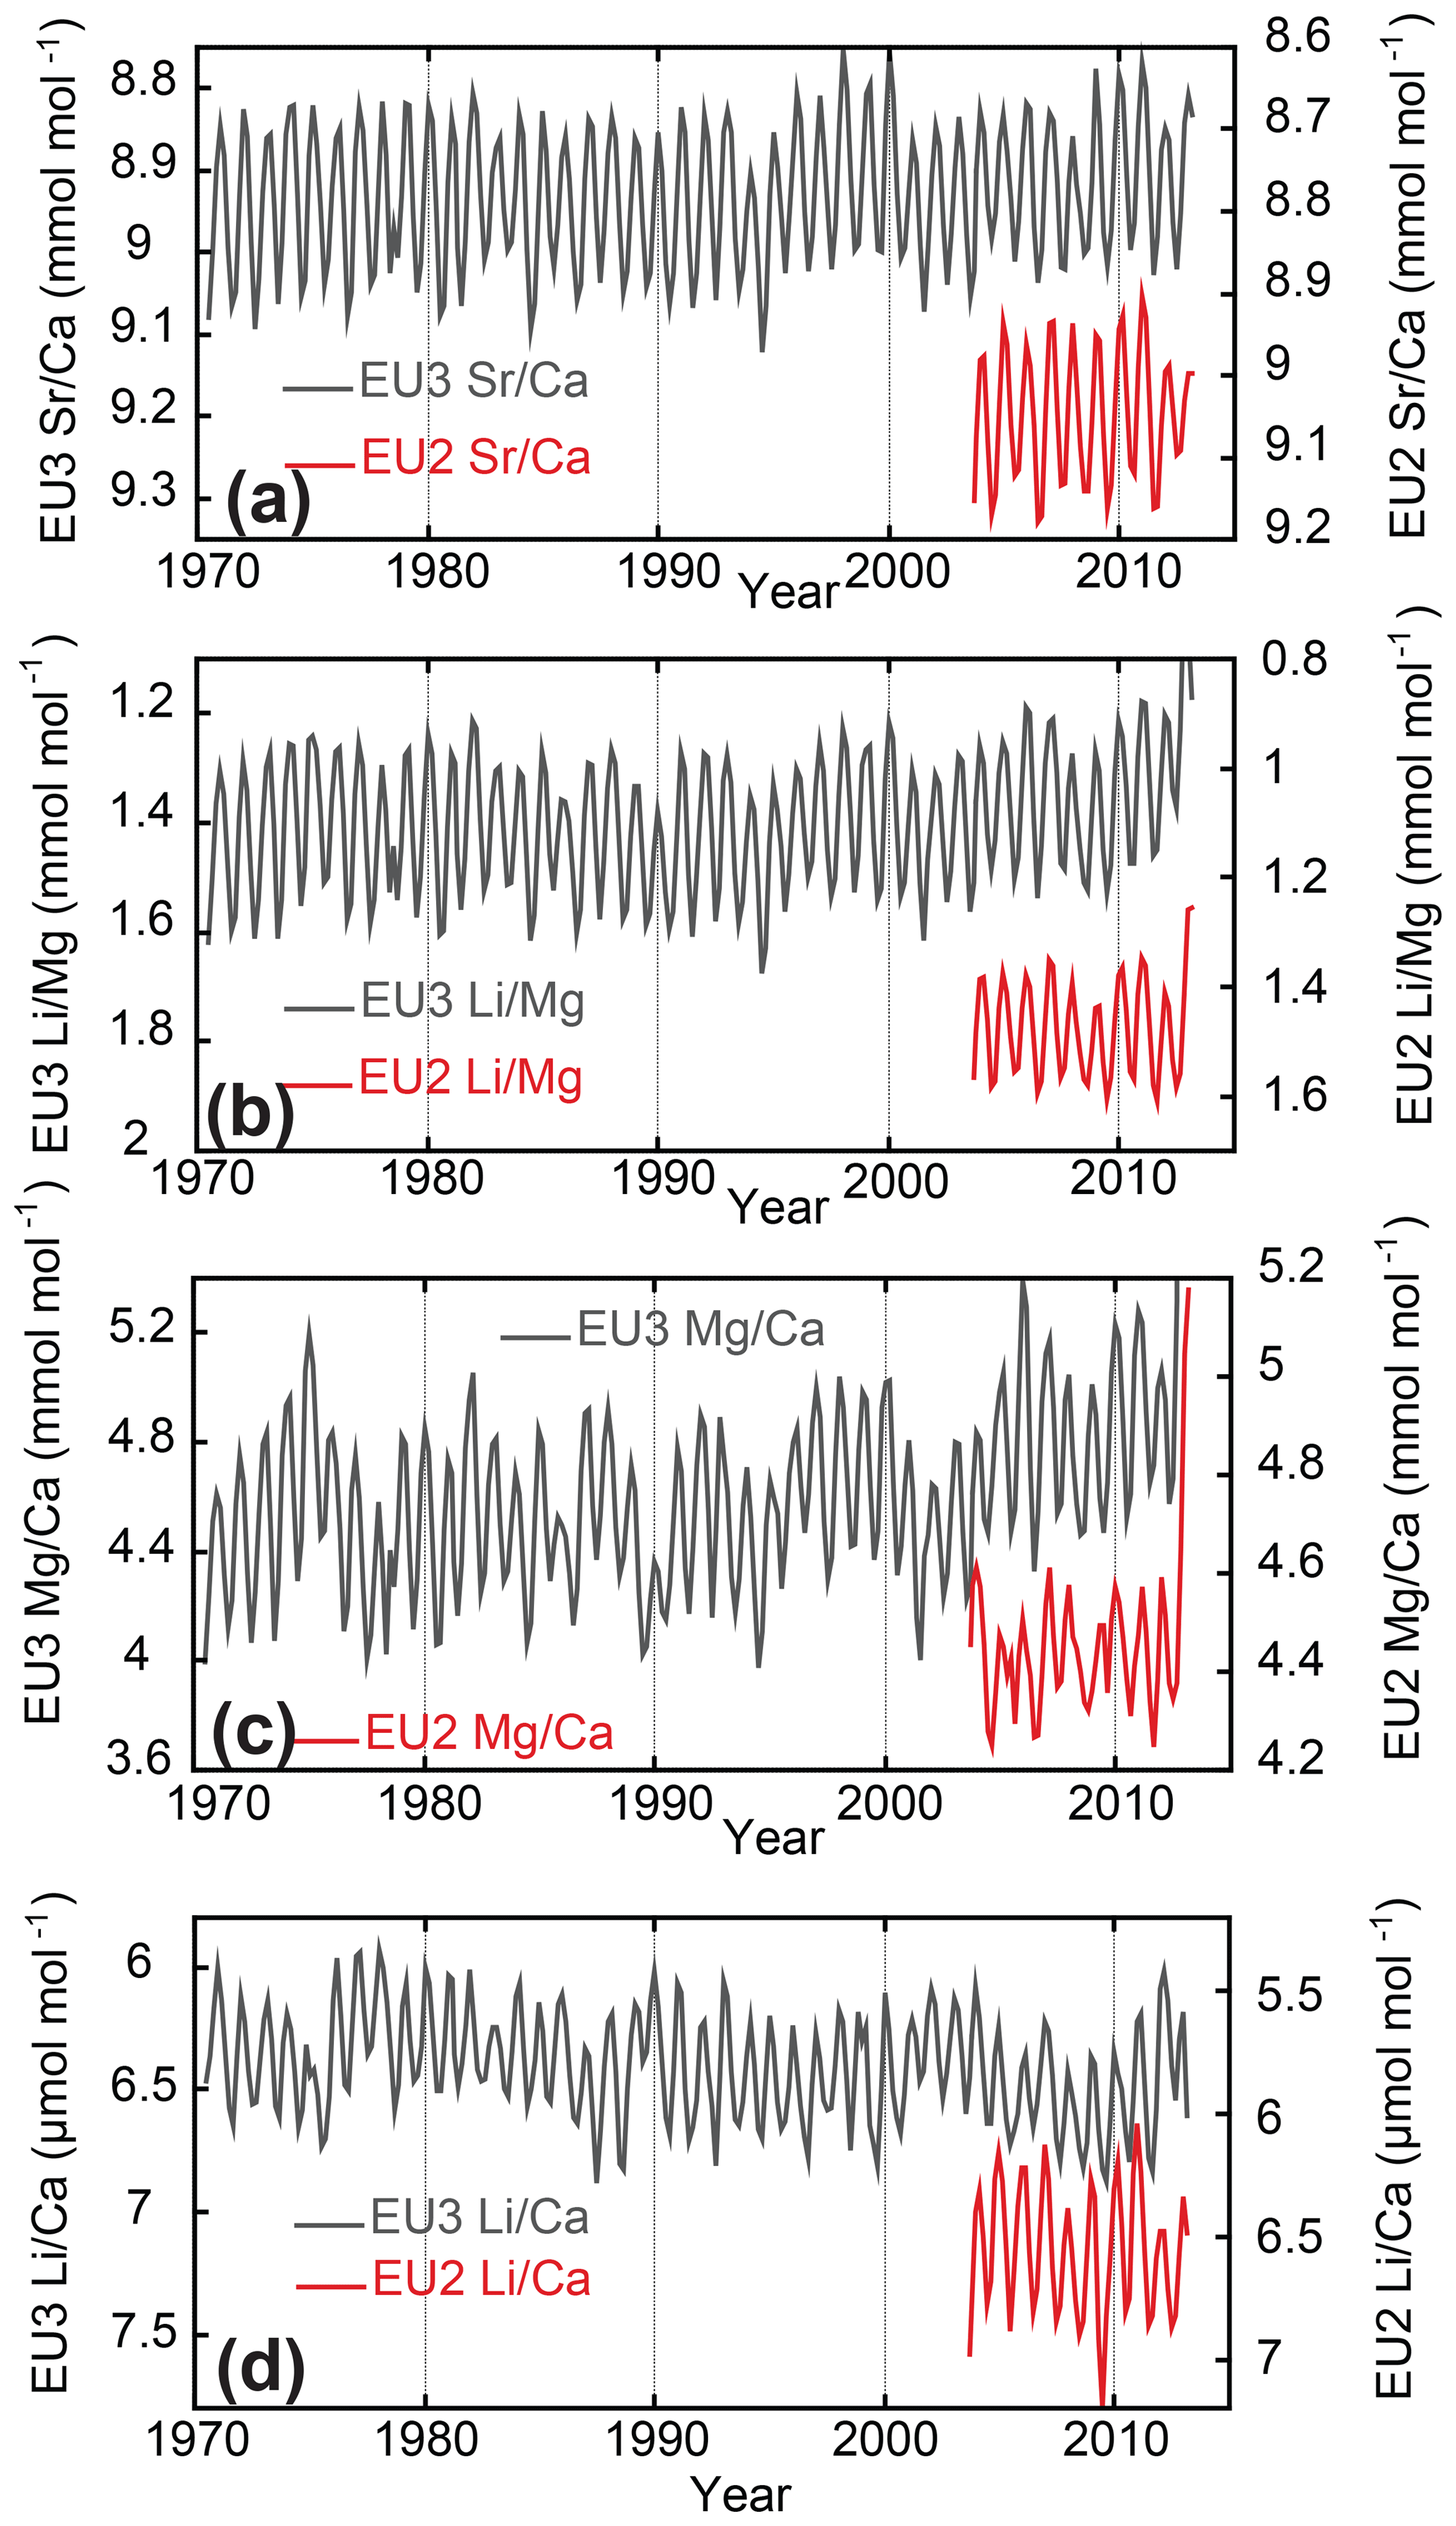
Figure 3Bimonthly interpolated time series of trace element ratios in cores EU2 and EU3. (a) Sr∕Ca, (b) Li∕Mg, (c) Mg∕Ca, and (d) Li∕Ca.
3.2 Bimonthly Sr∕Ca, Li∕Mg, Mg∕Ca, and Li∕Ca ratios
The bimonthly time series of all trace element ratios measured in cores EU2 and EU3 are illustrated in Fig. 3. Comparisons between the different trace element ratios for the full length of individual records (EU2: 2003 and 2012; EU3: 1970–2012) are shown in Fig. 4, as well as Fig. S4 and Table S1 in the Supplement.
For the period of overlap the bimonthly time series of the Sr∕Ca ratios for core EU3 ranged between 8.78 and 9.03 mmol mol−1 (8.77 and 9.09 mmol mol−1 between 1970 and 2012) and in EU2 between 8.90 and 9.18 mmol mol−1 (Figs. 3a, 4a). The mean Sr∕Ca ratios for the EU2 core were ∼0.1 mmol mol−1 higher compared to EU3, while seasonal amplitudes and trends since 2003 were similar between cores (Fig. 3a). Sr∕Ca ratios for EU2 and EU3 were highly correlated (r2=0.85, p<0.001, N=54). Both cores showed a long-term decrease (warming trend) in Sr∕Ca between 2003 and 2012. The time series of EU3 Sr∕Ca between 1970 and 2012 showed a nonlinear decrease starting in the middle to late 1990s with the lowest ratios between 1998 and 2000 and between 2009 and 2011.
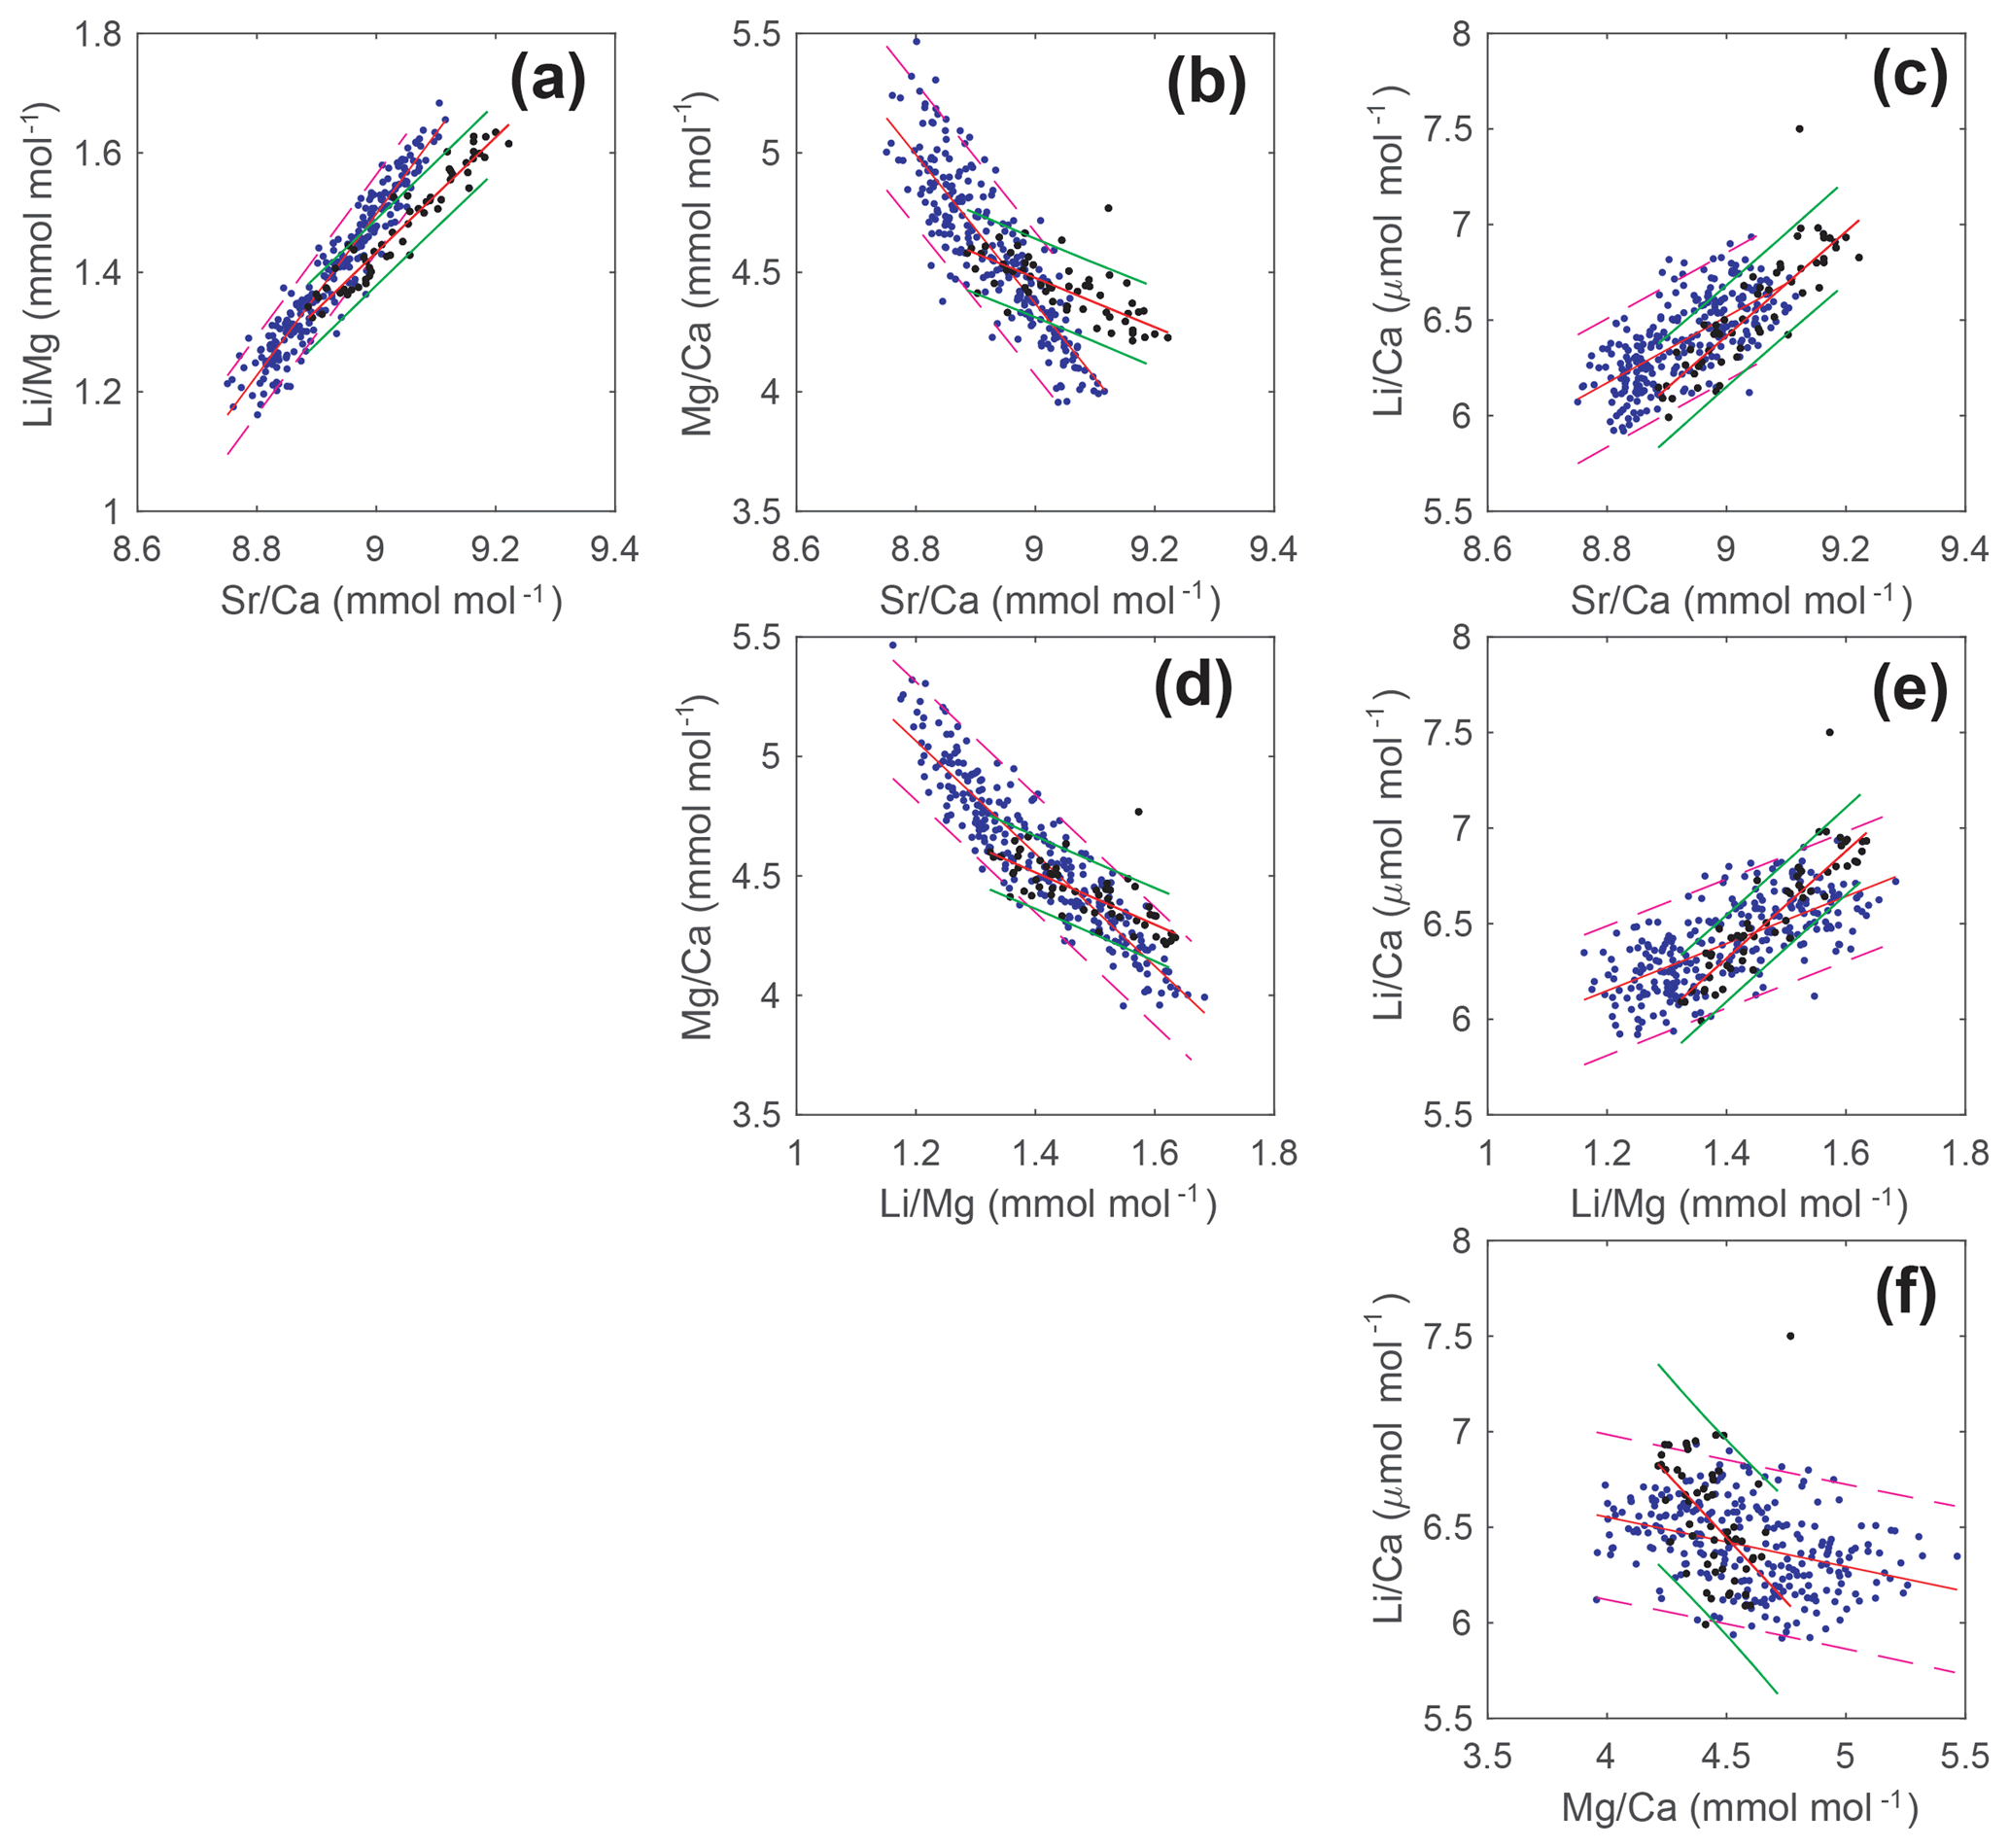
Figure 4Scatterplot of bimonthly trace element ratios in cores EU2 (black dots) and EU3 (blue dots) over the full length of the records. (a–c) Sr∕Ca ratios vs. Li∕Mg, Mg∕Ca, and Li∕Ca, (d–e) Li∕Mg vs. Mg∕Ca and Li∕Ca, and (f) Li∕Ca vs. Mg∕Ca. The 95 % prediction intervals of the regressions are indicated by red dashed (EU3) and green solid lines (EU2) with linear fits for each core indicated by a red line. Regression equations are provided in Table S1.
The seasonal range in Li∕Mg ratios in core EU3 varied between 1.18 and 1.52 mmol mol−1 (1.18 and 1.65 mmol mol−1 between 1970 and 2012), while in core EU2 it ranges between 1.35 and 1.6 mmol mol−1. EU2 Li∕Mg showed an offset to higher absolute Li∕Mg ratios between 2003 and 2012 relative to EU3 (Figs. 3b, 4a). Li∕Mg ratios for EU2 and EU3 were highly correlated (r2=0.69, p<0.001, N=54), although lower than Sr∕Ca ratios. The time series of EU3 Li∕Mg between 1970 and 2012 showed a nonlinear decrease starting in the middle to late 1990s. For the period of overlap between 2003 and 2012, both core Li∕Mg ratios showed no trend.
Mg∕Ca ratios in core EU3 showed larger seasonal variations than core EU2 (Fig. 3c). EU2 Mg∕Ca ratios ranged between 4.24 and 4.61 mmol mol−1 between 2003 and 2012, while EU3 ranged between 4.40 and 5.36 mmol mol−1 (4.03 and 5.36 mmol mol−1 between 1970 and 2012; Figs. 3c, 4b). EU2 showed lower mean Mg∕Ca ratios (∼0.4 mmol mol−1) than EU3 between 2003 and 2012 (Fig. 3b). Mg∕Ca ratios in EU2 and EU3 were significantly correlated, yet lower than Sr∕Ca or Li∕Mg (r2=0.34, p<0.001, N=54). Overall, EU3 Mg∕Ca showed an increase since 1970 with a marked switch post-2005. EU2 Mg∕Ca had no trend.
Li∕Ca ratios in core EU2 ranged between 6.03 and 7.20 µmol mol−1, while in EU3 they ranged between 6.04 and 6.87 µmol mol−1 (5.97 to 6.87 µmol mol−1 between 1970 and 2012; Figs. 3d, 4c). Li∕Ca ratios in EU2 and EU3 were significantly correlated (r2=0.33, p<0.001, N=54), but lower than Sr∕Ca or Li∕Mg. Li∕Ca was positively correlated with Sr∕Ca and Li∕Mg and negatively with Mg∕Ca in both cores for most of the record (Fig. 4c, e, f; Table S1). EU2 Li∕Ca largely mirrored variations in Sr∕Ca and Li∕Mg, while in EU3 Li∕Ca showed lower correlations (Table S1). EU3 interannual variability in Li∕Ca deviated from the patterns observed in the Sr∕Ca, Li∕Mg, and Mg∕Ca data in 1970–71, 1976–1978, 1989–90, and between 2001 and 2004 (Fig. 3d). In those years lower EU3 Li∕Ca ratios were associated with lower Mg∕Ca and higher Sr∕Ca and Li∕Mg ratios, opposite to the expected relationships (Fig. 3d).
Table 2Robust linear regression equations (weighted least squares) for core EU2 and EU3 Sr∕Ca and Li∕Mg ratios with AVHRR-OISSTv2 and ERSSTv4.
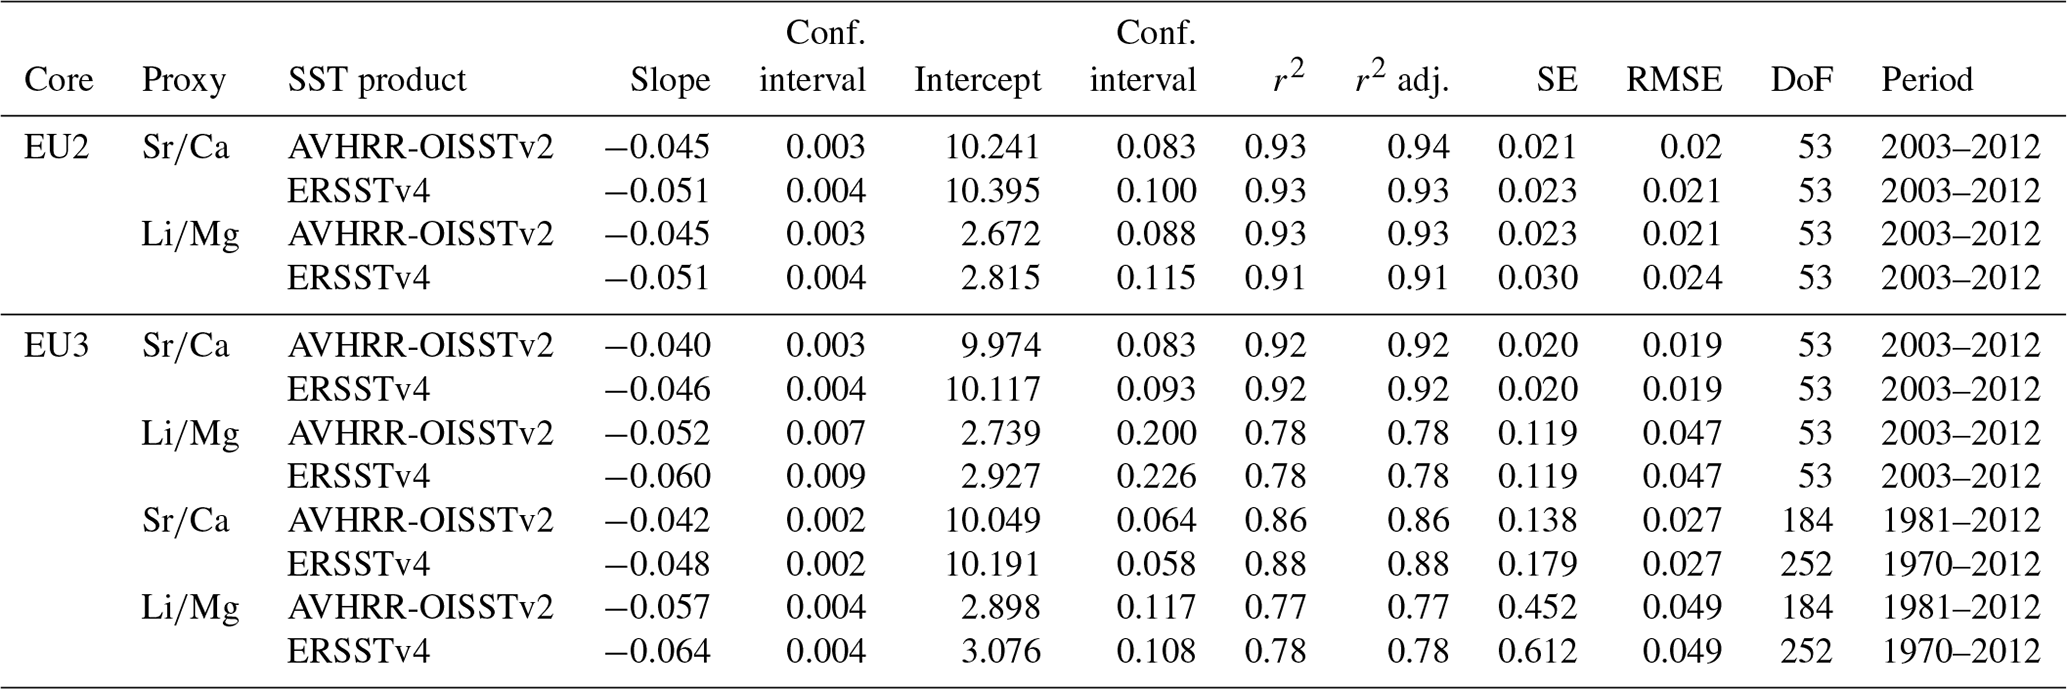
Conf. interval indicates the 95 % confidence interval of the regression slopes and intercepts; r2 adj.: r2 adjusted; SE: standard error; RMSE: root mean square error; DoF: degrees of freedom (N−2).
3.3 Calibration of TE∕Ca and SST reconstruction
Absolute temperature reconstructions were obtained from the regression of the bimonthly Sr∕Ca and Li∕Mg ratios with the AVHRR-OISSTv2 and ERSSTv4 data (Fig. 5; Table 2; for ERSSTv4 see Fig. S5 and for Mg∕Ca and Li∕Ca vs. SST see Fig. S6). Both of the coral datasets showed highly significant (p<0.001) correlation coefficients with the temperature products over the period of overlap (2003 to 2012) with , , , and (Table 2). Correlation coefficients of EU3 Sr∕Ca and Li∕Mg for the longer periods 1981 to 2012 and 1970 to 2012 with AVHRR-OISSTv2 and ERSSTv4, respectively, were also high (Table 2; Fig. S5). The regression slope of TE ratios with the two SST products varied between −0.040 and −0.051 mmol mol−1 ∘C−1 for Sr∕Ca and between −0.045 and −0.064 mmol mol−1 ∘C−1 for Li∕Mg (Table 2). Overall, the regression slopes were marginally lower for regressions with AVHRR-OISSTv2 compared to ERSSTv4. Weighted least squares regressions with 1.5 years of in situ SST data between 2009 and 2010 revealed similar regression slopes for Sr∕Ca and Li∕Mg but with a narrower range (−0.042 to −0.047 mmol mol−1 ∘C−1 for Sr∕Ca and −0.045 to −0.052 mmol mol−1 ∘C−1 for Li∕Mg) and lower correlation coefficients (, , , and ). All correlations were statistically significant with p<0.050.
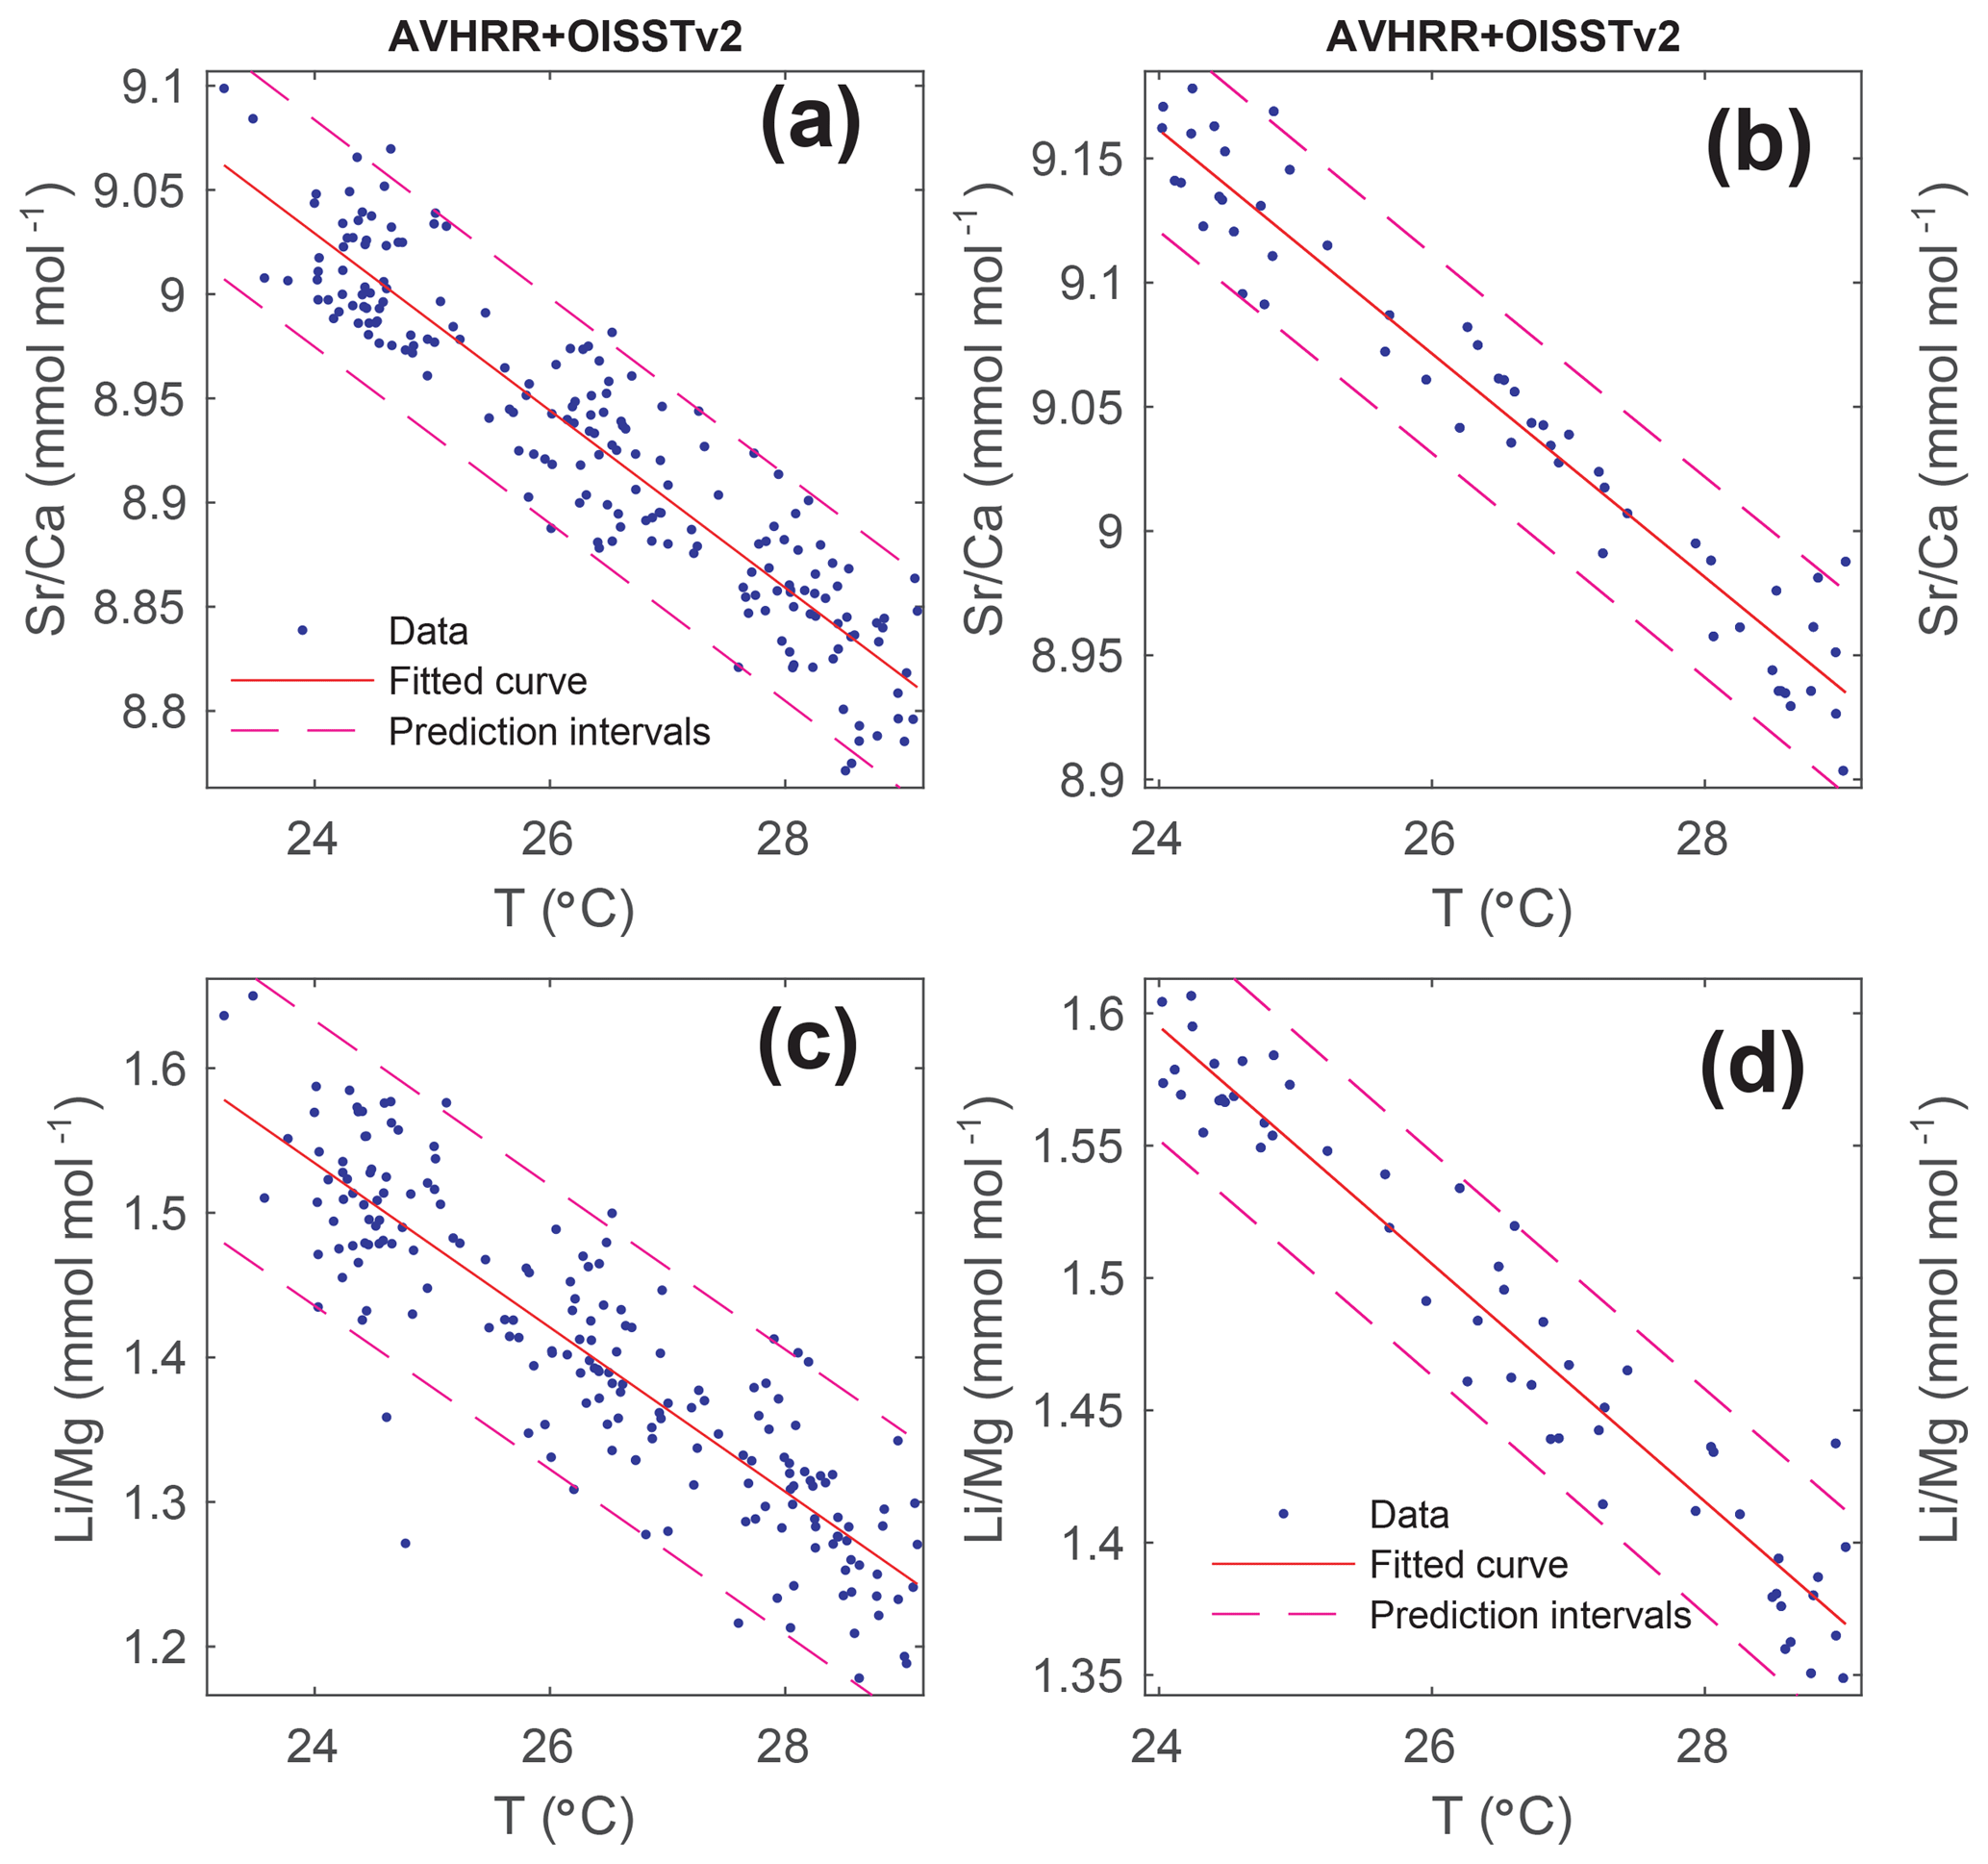
Figure 5Linear regressions of trace element ratios with AVHRR-OISSTv2 (Banzon et al., 2016) for core EU3 1981–2012 (a, c) and EU2 2003–2012 (b, d). The trace element records were calibrated using the respective weighted least squares regression equations of the bimonthly correlations obtained for each of the core records from the two sites. The 95 % confidence intervals of the regressions are indicated. Regression equations are provided in Table 2.
The maximal seasonal range over the period 1970 to 2012 of the reconstructed bimonthly Sr∕Ca SST and Li∕Mg SST varied between 22 and 30 ∘C in both cores with a mean seasonal amplitude of 4.33±0.67 ∘C (Fig. 5; for ERSSTv4 see Fig. S7) in close agreement with in situ SST (4.82±0.05 ∘C for 2009 to 2010) and regional AVHRR-OISSTv2 (4.67±0.7 ∘C for 1981 to 2013) and ERSSTv4 (4.52±0.44 ∘C for 1970 to 2012).
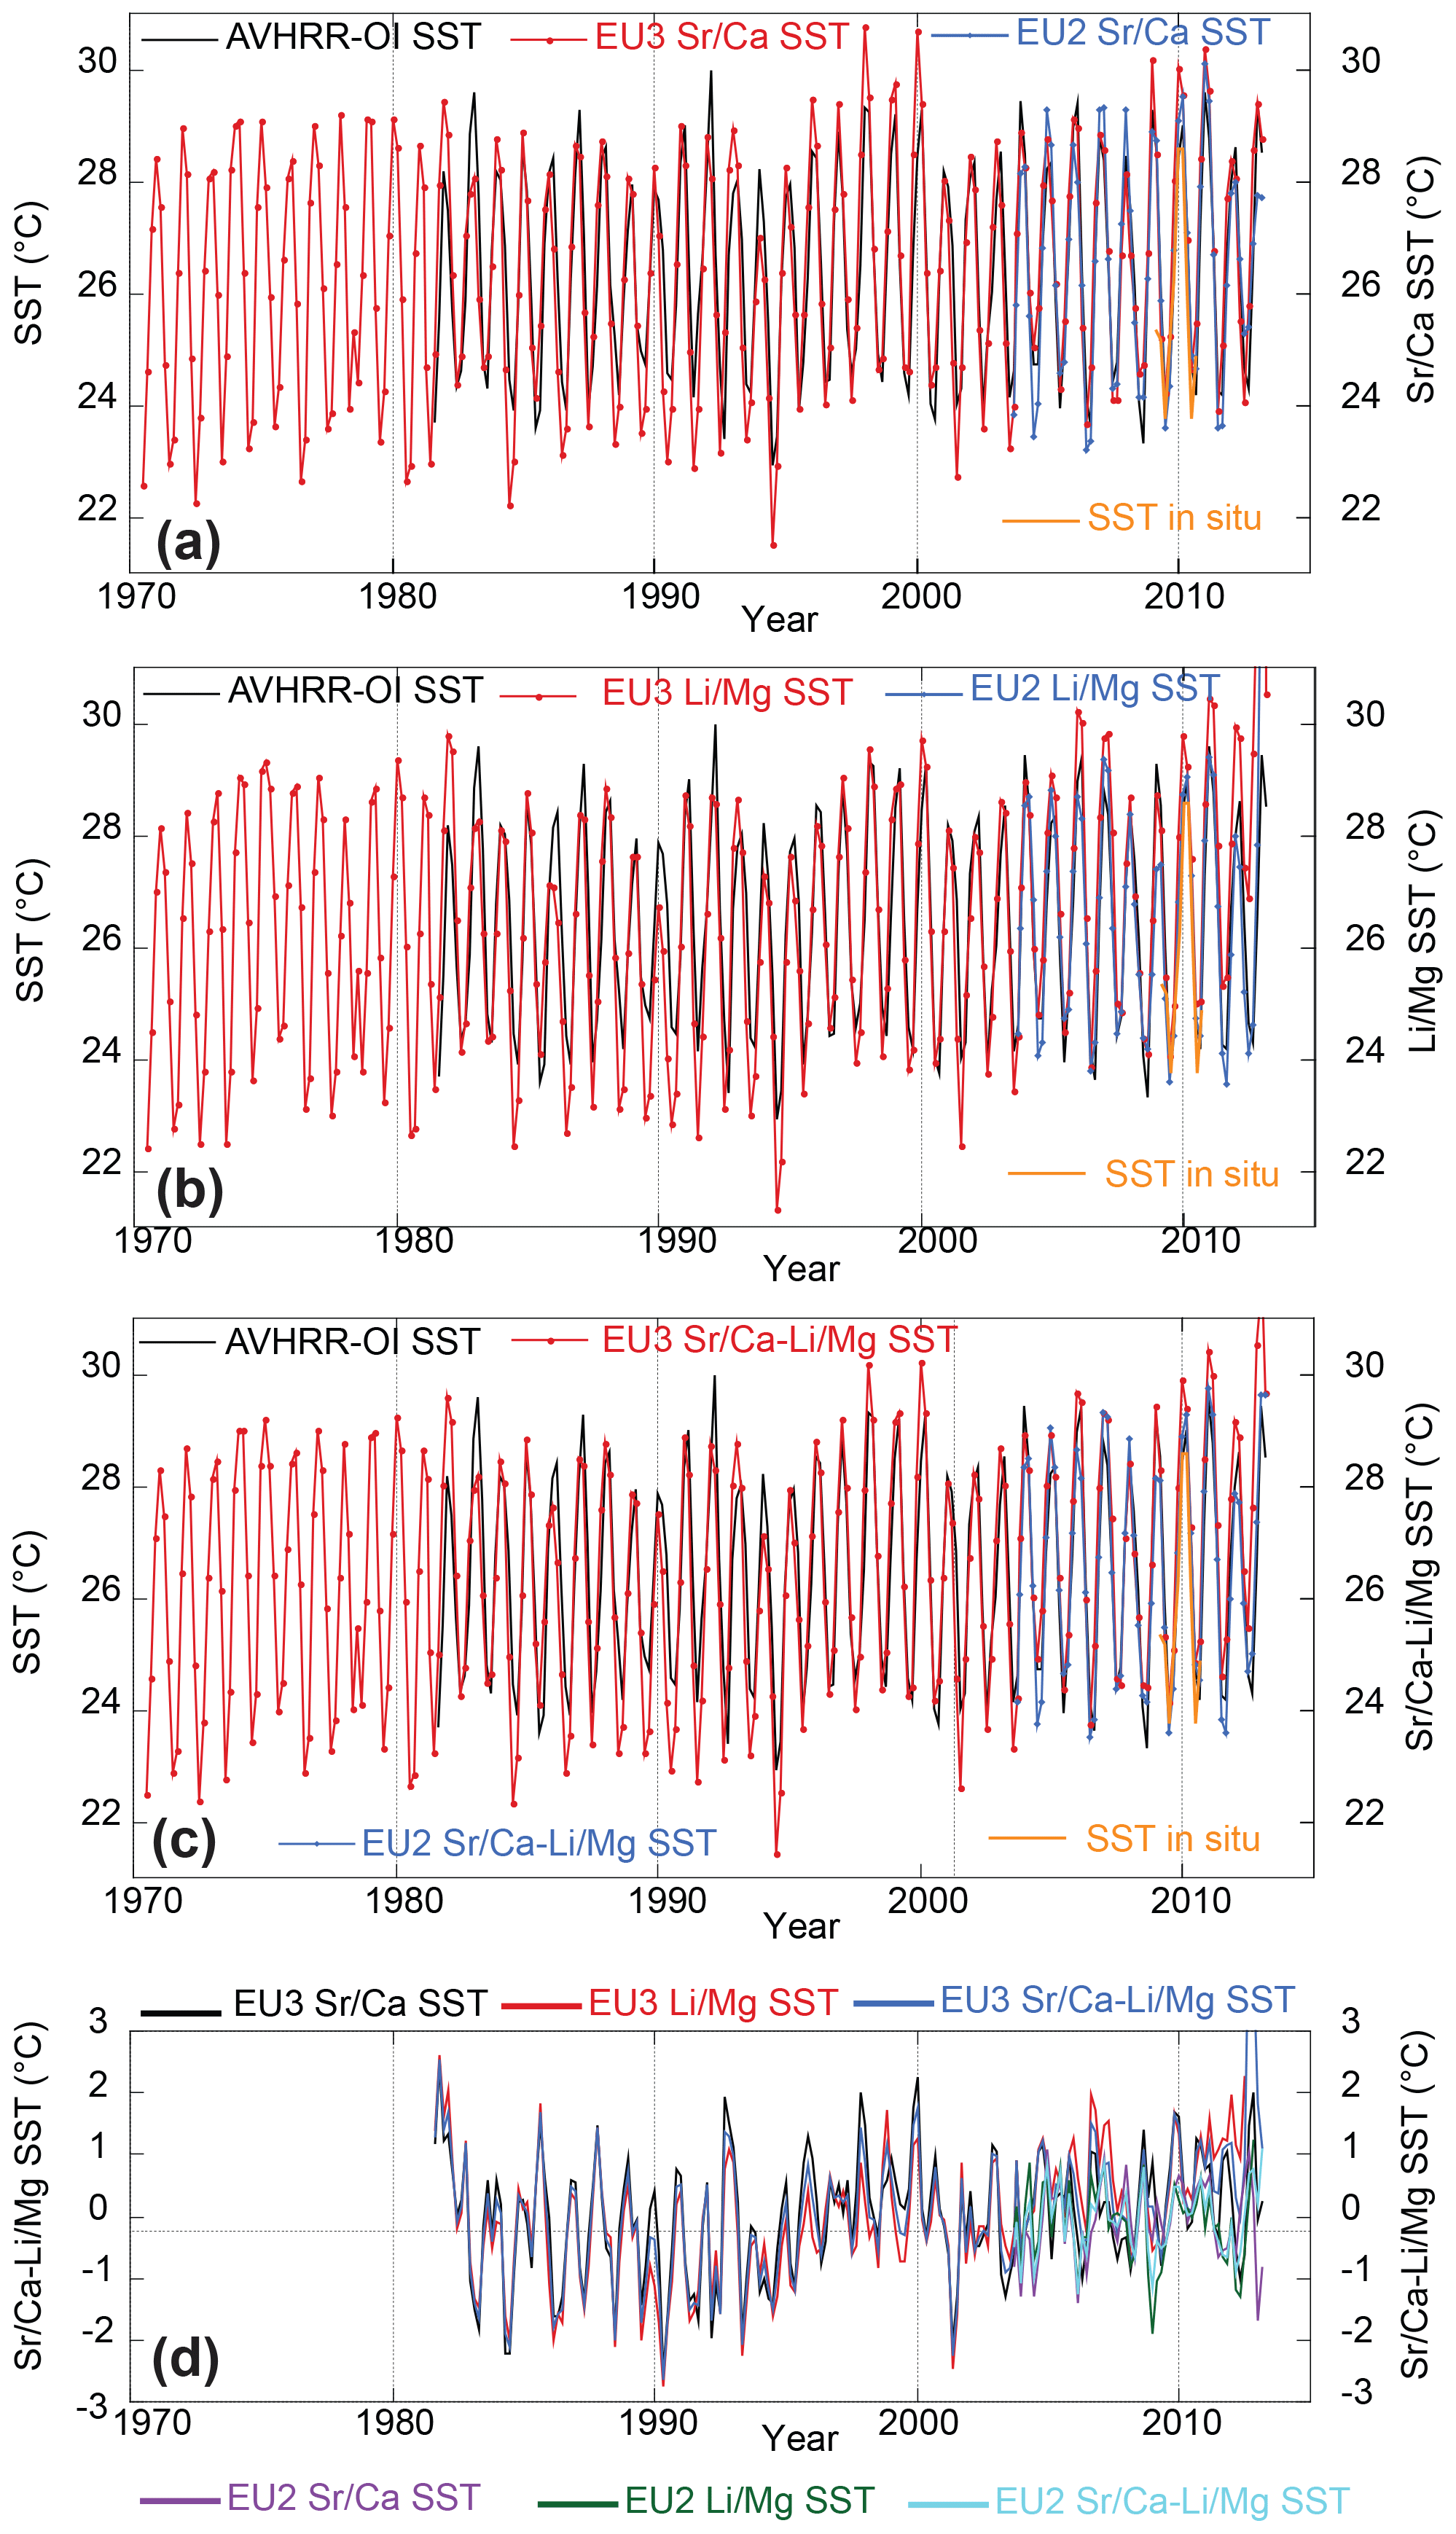
Figure 6Absolute SST reconstructions for cores EU3 (red) and EU2 (blue) with SST residuals based on the calibration period 1981 to 2012 for (a) Sr∕Ca SST, (b) Li∕Mg SST, and (c) their combination in comparison to AVHRR-OISSTv2 (Banzon et al., 2016; black) and in situ SST (orange; 2009–2010). (d) Residuals for Sr∕Ca SST, Li∕Mg SST, and their combination for cores EU2 and EU3 with respect to the AVHRR-OISSTv2 data (Banzon et al., 2016).
Table 3Root mean square error (RMSE) for trace element ratios against AVHRR-OISSTv2 for individual trace element ratios and Sr∕Ca–Li∕Mg combination. Period used for the calculation of RMSE indicated in the last column.
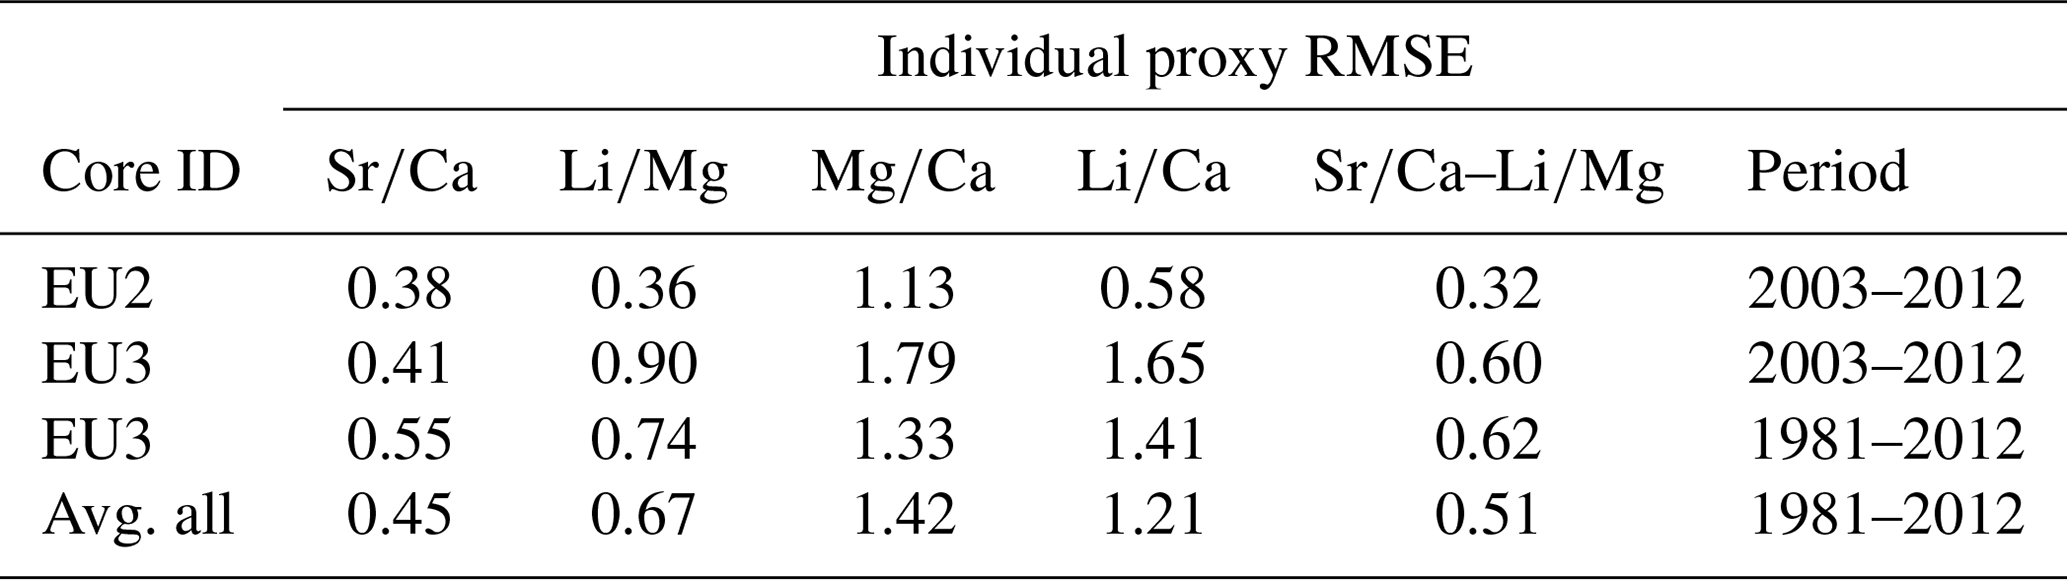
Residuals (calculated as the difference between coral-derived SST and AVHRR-OISSTv2 for individual record length) are presented in Fig. 6 and RMSEs in Table 3 (for ERSSTv4 see Fig. S7). The coral Sr∕Ca and Li∕Mg SST reconstructions had the lowest residuals between 1993 and 2012 with AVHRR-OISSTv2, with slightly larger residuals prior to 1993 (core EU3). AVHRR-OISSTv2 displayed a truncated seasonality between 1989 and 1995 (warmer winters) with on average higher mean SST than coral-derived SST (Fig. 6; Sr∕Ca, Li∕Mg, and their combination). Summer SST (Sr∕Ca, Li∕Mg, and their combination) was in general in better agreement throughout the individual records. Sr∕Ca performed best as an SST proxy, followed by the combined Sr∕Ca and Li∕Mg SST (Fig. 6; Table 3).
Sr∕Ca, Li∕Mg, and SST bimonthly anomalies were calculated relative to the 2003 to 2012 (core overlap) and 1981 to 2010 (coral composite) reference periods. Coral-derived SST anomalies were calculated using the literature average proxy–SST relationships of −0.061 mmol mol−1 ∘C−1 for Sr∕Ca (Corrège, 2006) and −0.060 mmol mol−1 ∘C−1 for Li∕Mg (for Porites growing within 25 and 30 ∘C; Hathorne et al., 2013; D'Olivo et al., 2018). Composite coral-derived SST anomalies were then calculated as the arithmetic mean obtained from the two cores. Residuals were calculated as the difference between coral-derived SST anomalies and AVHRR-OISSTv2 anomalies (for ERSSTv4 see Fig. S8).
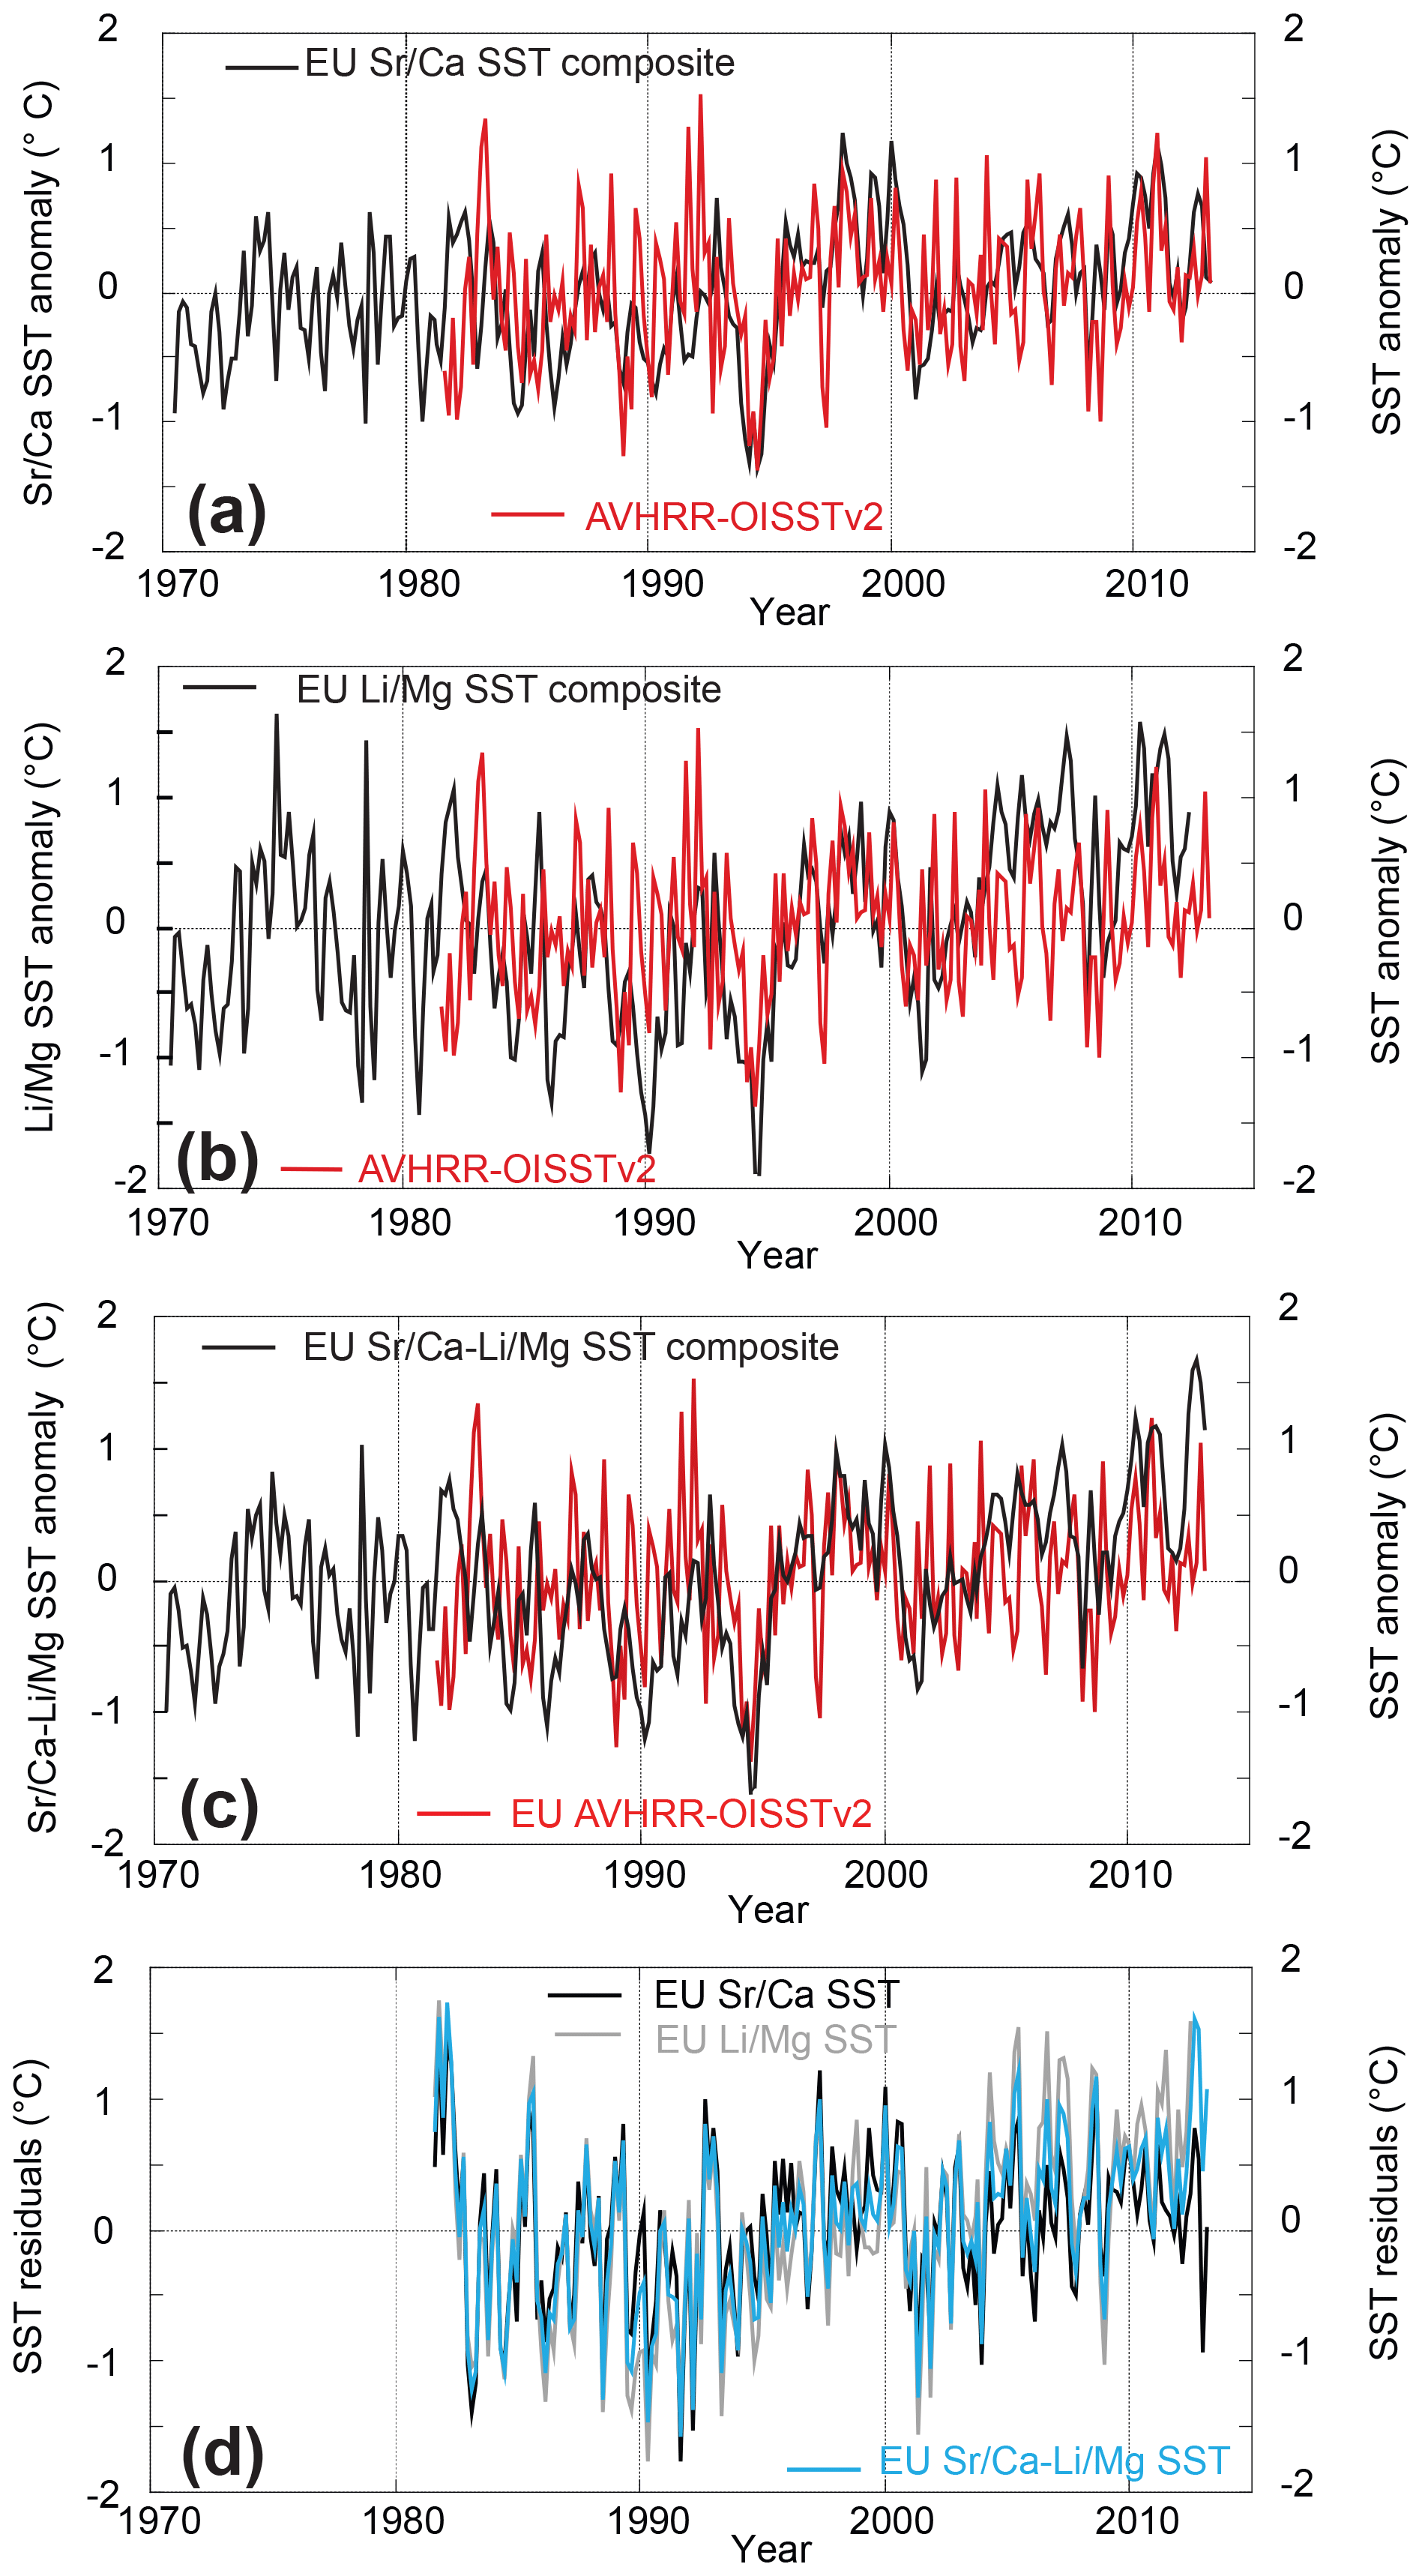
Figure 7SST anomaly reconstructions with SST residuals for (a) EU composite Sr∕Ca, (b) EU composite Li∕Mg, and (c) their combination for cores EU2 and EU3. (d) Residuals for SST anomalies of Sr∕Ca SST, Li∕Mg SST, and their combination for cores EU2 and EU3 with respect to the AVHRR-OISSTv2 data (Banzon et al., 2016). Anomalies were calculated relative to the 1981 to 2010 average bimonthly seasonal cycle.

Figure 8Comparison of coral composite Sr∕Ca SST, Li∕Mg SST, and Sr∕Ca–Li∕Mg SST anomaly reconstructions with air temperature from Europa Météo-France weather station data. (a) Sr∕Ca SST composite, (b) Li∕Mg SST composite, (c) Sr∕Ca–Li∕Mg SST composite, (d) Europa gridded AVHRR-OISSTv2 (Banzon et al., 2016), and (e) Europa gridded ERSSTv4. Anomalies were calculated relative to the 1981 to 2010 average bimonthly seasonal cycle for proxy reconstructions, instrumental SST, and air temperatures.
Figure 7 illustrates the anomalies (1981–2010) for the composite proxy SST from the two cores (individual cores shown in Fig. S9) compared to the SST anomalies from AVHRR-OISSTv2 (for ERSSTv4 see Fig. S8). EU2 and EU3 Sr∕Ca and Li∕Mg anomalies agreed well between records (, p<0.001, N=57; , p<0.001, N=57; Fig. S9). The amplitudes of the EU Sr∕Ca SST composite anomalies closely tracked AVHRR-OISSTv2 anomalies with slightly higher residuals prior to 1993 (Fig. 7a). EU Li∕Mg SST composite anomalies displayed similar variability as AVHRR-OISSTv2, yet the agreement was slightly lower than for Sr∕Ca SST anomalies with a shift to lower mean Li∕Mg SST (, p<0.001, N=189; , p<0.001, N=189; Fig. 7b). The detrended bimonthly records agreed well between composite Sr∕Ca SST and Li∕Mg SST anomalies (r=0.73, p<0.001, N=252) and with AVHRR-OISSTv2 anomalies (, p<0.001, N=189; , p<0.001, N=189). As with absolute SST, Sr∕Ca SST and Li∕Mg SST composite anomalies showed larger residuals pre-1993 and in general colder anomalies than in AVHRR-OISSTv2 (Fig. 7c; for ERSSTv4 see Fig. S8). The lowest residuals were found for Sr∕Ca SST and Sr∕Ca–Li∕Mg combined SST anomalies (Fig. 7d). RMSEs between 2003 and 2012 are lowest for Sr∕Ca SST (0.49±0.35 ∘C), followed by Sr∕Ca–Li∕Mg (0.76±0.39 ∘C) and Li∕Mg SST (1.03±0.50 ∘C), while RMSEs between 1970 and 2012 are slightly higher (Table 3).
The anomalies for the EU Sr∕Ca SST, Li∕Mg SST, and Sr∕Ca–Li∕Mg SST composite time series closely tracked the anomalies in the in situ air temperature data (Fig. 8a–c). Sr∕Ca SST and Sr∕Ca–Li∕Mg SST performed slightly better than Li∕Mg SST (, p<0.001, N=189; , p<0.001, N=189; , p<0.001, N=189). Air temperatures showed marginally colder temperature anomalies between 1970 and 1978 compared to the Sr∕Ca, Li∕Mg, or Sr∕Ca–Li∕Mg composite SST anomalies. AVHRR-OISSTv2 was also in close agreement with air temperature anomalies (Fig. 8d). ERSSTv4 anomalies mirrored air temperatures with overall slightly colder mean SST anomalies than in air temperatures, especially between 1970 and 1990 (Fig. 8e).

Figure 9Regional comparison of Mozambique Channel ERSSTv4 anomalies for Mayotte (green), Europa (orange), and Ifaty, Madagascar (blue) (a), with linear warming trends in brackets. EU Sr∕Ca SST composite anomaly compared with (b) Mayotte δ18O SST anomaly (blue), (c) Mayotte Sr∕Ca SST anomaly (blue), (d) Ifaty δ18O SST anomaly (blue), and (e) Ifaty Sr∕Ca SST anomaly (blue). Anomalies were calculated for the 1973 to 1993 reference period. Linear warming trends indicated in (b)–(e) for proxy–SST for individual record length with EU composite Sr∕Ca SST anomaly only indicated once in panel (b). Proxy data taken from Zinke et al. (2004, 2008).
3.4 Regional and large-scale climate relationships
To assess regional correlations, we compared the EU Sr∕Ca SST composite with published coral proxy records from the Mozambique Channel and their corresponding instrumental data based on ERSSTv4 (Figs. 9, S9). The proxy records included Porites coral oxygen isotope and Sr∕Ca from Mayotte (Comoros Archipelago; 13∘ S, 45∘ E; Zinke et al., 2008) in a lagoonal setting and from Ifaty Reef in a lagoon passage (southwest Madagascar; 23∘ S, 43∘ E; Zinke et al., 2004). Bimonthly anomalies for ERSSTv4, Sr∕Ca SST, and δ18O SST were calculated relative to the reference period 1973 to 1993. The ERSSTv4 records from the three sites, spanning 10∘ of latitude in the Mozambique Channel between 13 and 23∘ S, documented a statistically significant (>95 %) warming trend since 1970 (Fig. 9). ERSSTv4 for spatial grids near Europa and Ifaty Reef shared 98 % of variability, while Mayotte shared 38 % of variability with the former two sites. The coral-proxy-based SST anomalies also showed statistically significant (>95 %) warming trends, although generally higher than in ERSSTv4, with the exception of Ifaty that showed no trend in Sr∕Ca SST anomalies (Fig. 9).
The interannual variability in the EU Sr∕Ca SST composite anomalies and in the Mayotte and Ifaty proxy–SST anomalies fluctuated by ∘C with the exception of a few warm and cold spikes in Mayotte and Ifaty time series that were not recorded at Europa (Figs. 9b–e, S10). The EU Sr∕Ca SST composite anomalies agreed best with interannual variability in Ifaty Sr∕Ca SST (r=0.42, p<0.001, N=21) and δ18O SST (r=0.19, p<0.050, N=21), although with a cold bias in Ifaty Sr∕Ca between 1985 and 1995 (Figs. 9d, e, S10). The EU Sr∕Ca SST composite anomalies and Mayotte proxy SST anomalies showed no significant correlations, although the trend estimates were within uncertainty bounds for Mayotte δ18O SST (Figs. 9b and c, S10). Mayotte Sr∕Ca SST time series showed anomalous cold spikes between 1970 and 1978, which were not recorded in regional ERSSTv4 (Fig. S10b and c).
Spatial correlations between the EU composite SST anomalies and the AVHRR-OISSTv2 mean annual averages (July to June) between 1981 and 2012 (Fig. 10) for each grid point were calculated to investigate large-scale teleconnections. Similar spatial correlations were calculated with the AVHRR-OISSTv2 data near Europa at 22∘ S, 40∘ E ( resolution) with the rest of the grid points (Fig. 10). The correlations of the detrended data were computed using the KNMI climate explorer (https://climexp.knmi.nl/, last access: 20 December 2018; Trouet and van Oldenborgh, 2013) with a cutoff p value < 0.05. Similar correlation patterns were observed for the EU2–EU3 Sr∕Ca–Li∕Mg SST composite and the local AVHRR-OISSTv2 with global grids in AVHRR-OISSTv2 (Fig. 10a and b). Coherent positive correlation patterns emerge in the Mozambique Channel, the northern and southeastern Indian Ocean, the southeastern tropical Pacific, and northern tropical Atlantic. The Sr∕Ca and Li∕Mg ratios showed the expected negative relationship of both proxies with regional AVHRR-OISSTv2 mirroring the SST patterns (Fig. 10c and d). Of particular interest was the strong relationship with the northern tropical Atlantic (0–20∘ N, 80–30∘ W).
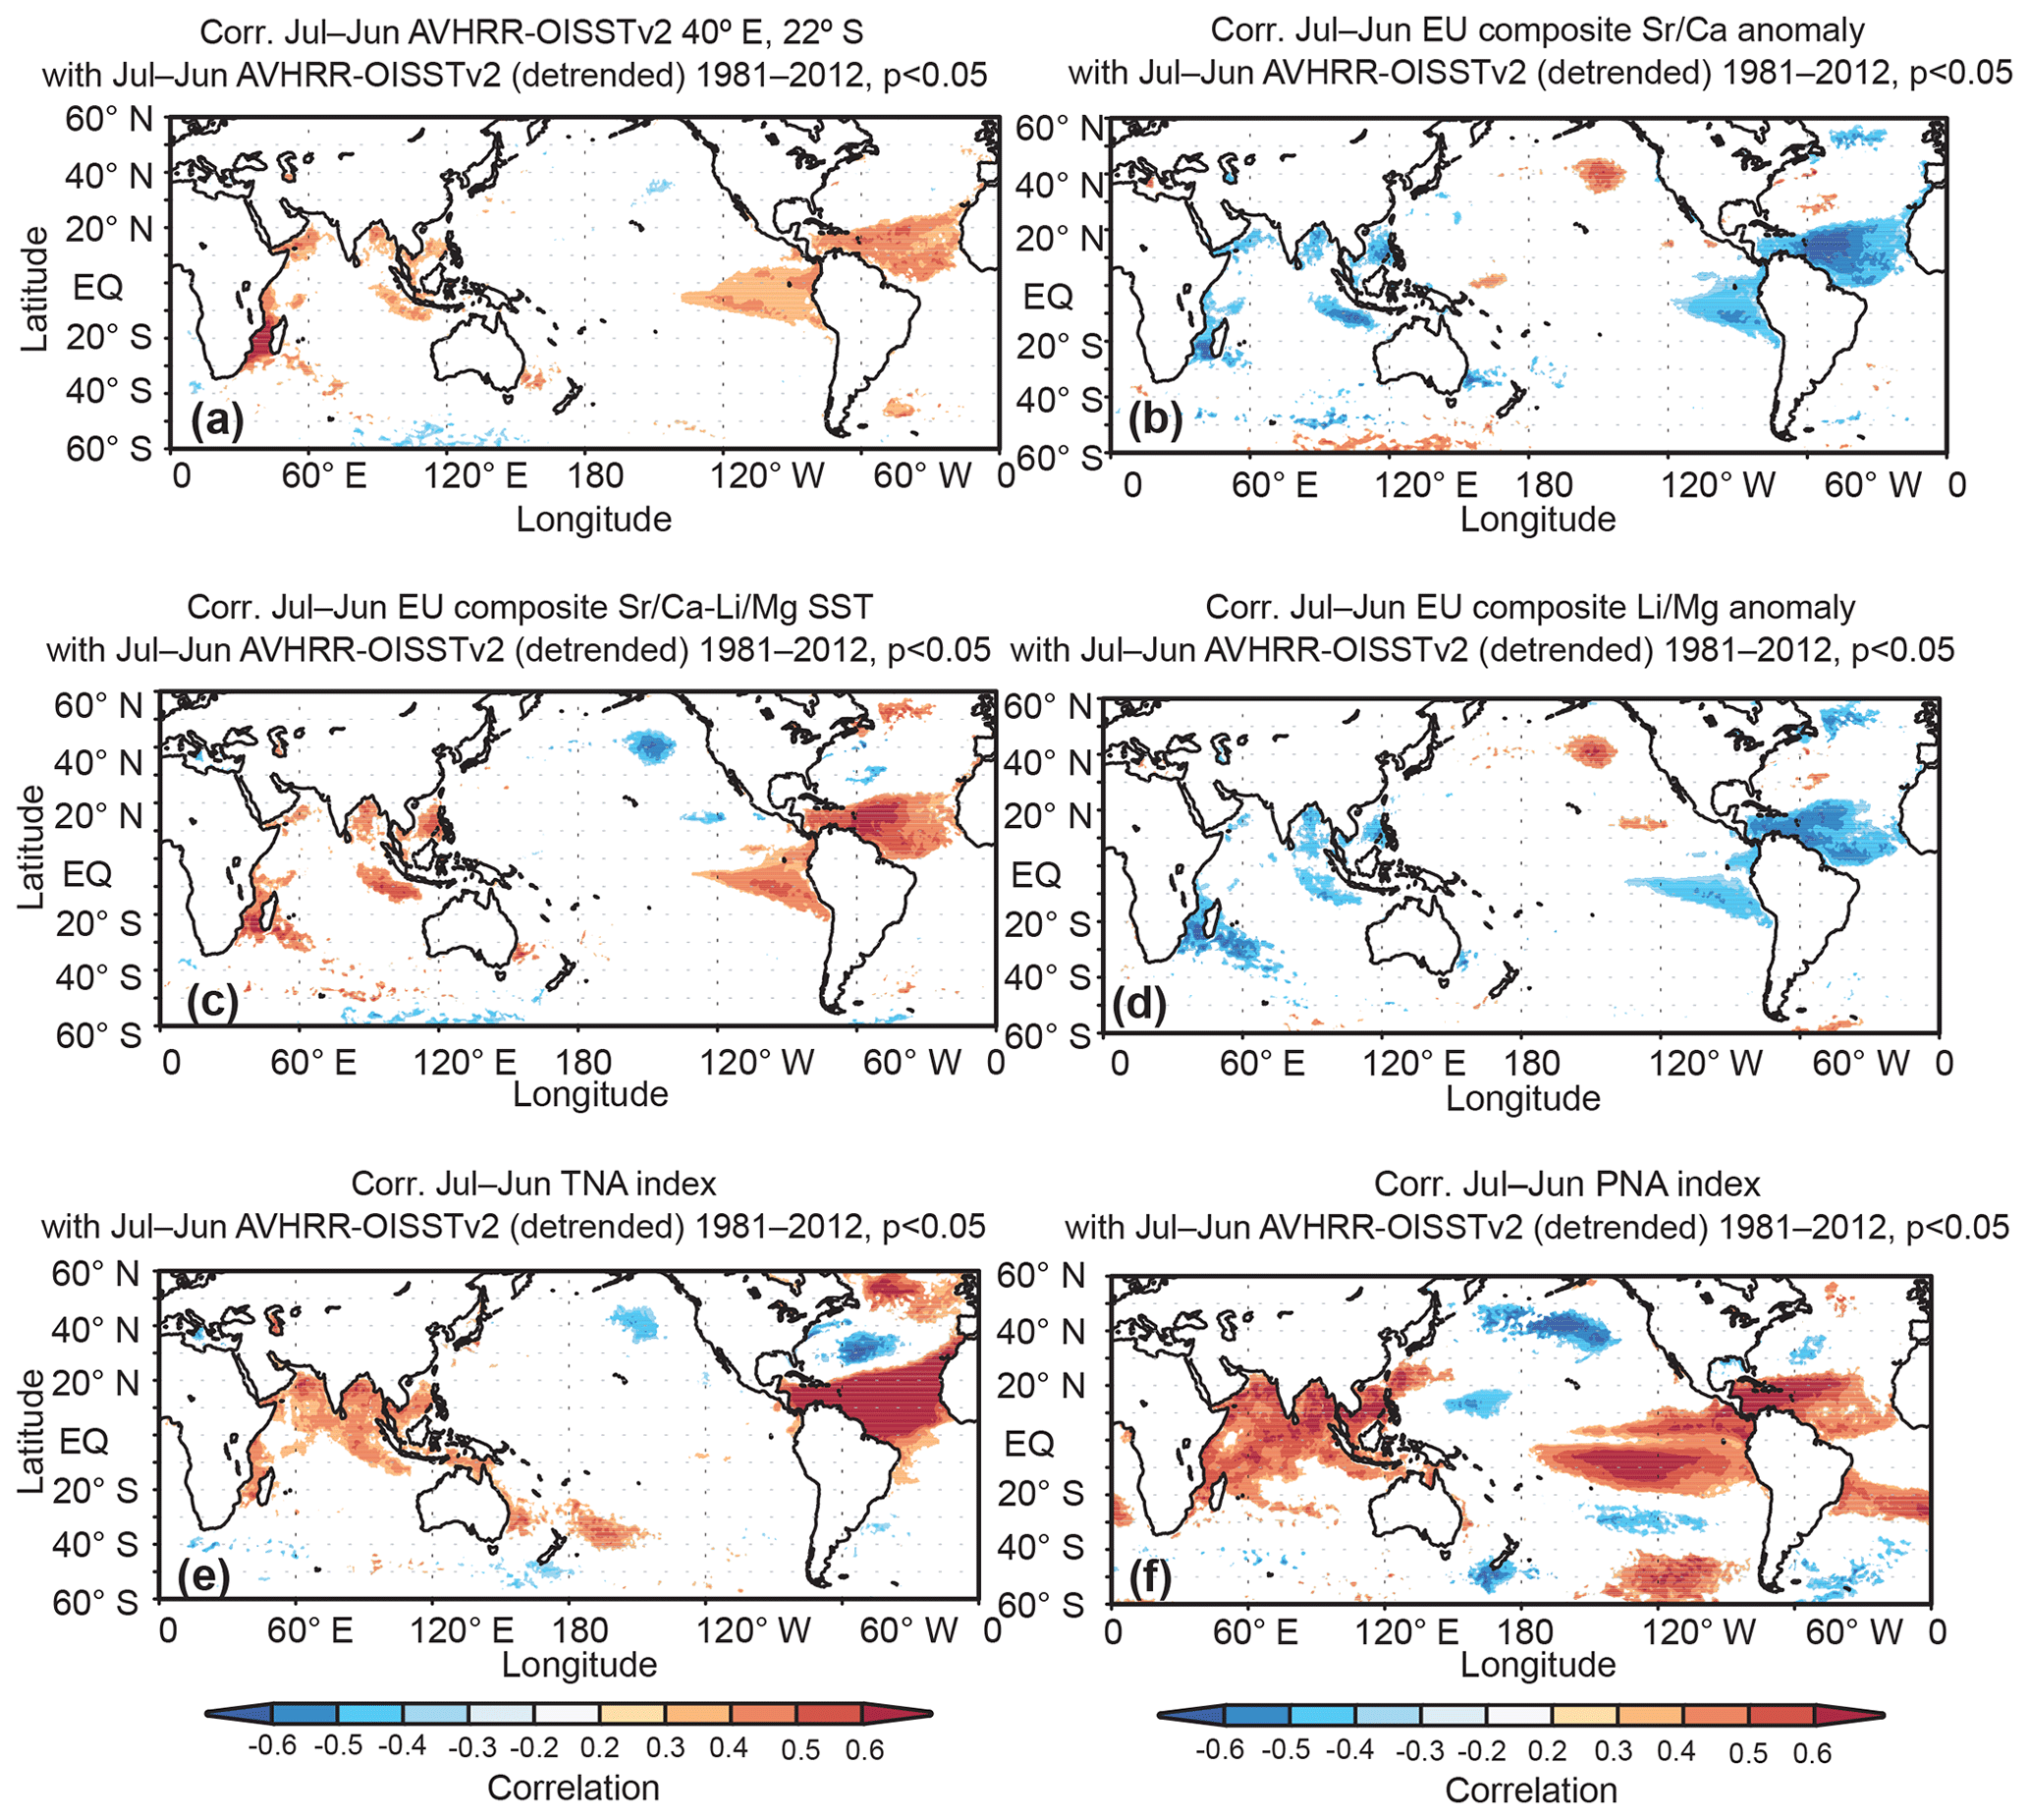
Figure 10Spatial correlations of proxy-based coral composite SST reconstructions with local and global AVHRR-OISSTv2 for mean annual data (Banzon et al., 2016). (a) Local AVHRR-OISSTv2 with global AVHRR-OISSTv2, (b) local AVHRR-OISSTv2 with EU composite Sr∕Ca–Li∕Mg SST, (c) local AVHRR-OISSTv2 with EU composite Sr∕Ca ratios, and (d) local AVHRR-OISSTv2 with EU composite Li∕Mg ratios. Panels (e) and (d) show spatial correlations of the TNA and PNA indices with global AVHRR-OISSTv2. Only correlations with p<0.05 were colored.
Table 4Linear correlation of detrended, mean annual instrumental and coral composite proxy-based SST for Europa (EU) with northern tropical Atlantic SST, the AMO index based on ERSSTv4, the tropical North Atlantic (TNA; Enfield et al., 1999) and north tropical Atlantic index (Penland and Matrosova, 1998), and the seasonal Niño3.4 index between 1970 and 2012 (Kaplan et al., 1998).
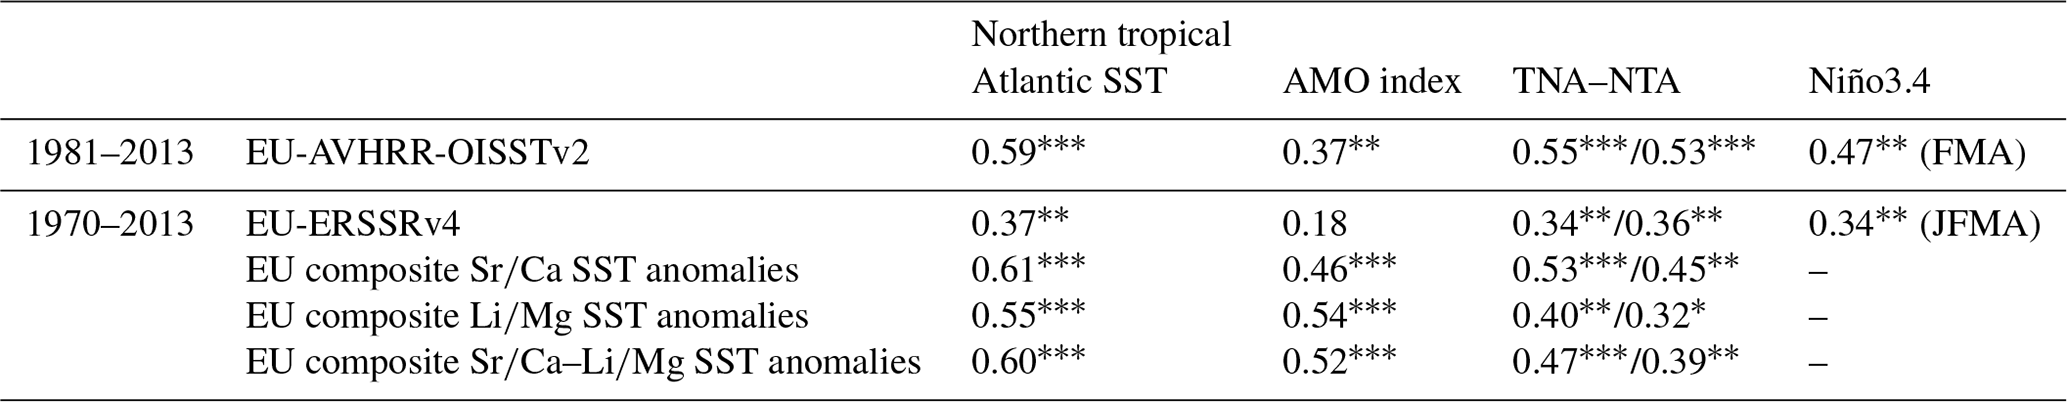
*90 %, %, % significance; DoF = 40 (N−2).
The regressions of detrended coral composite Sr∕Ca and Sr∕Ca–Li∕Mg combined SST reconstructions with northern tropical Atlantic AVHRR-OISSTv2 revealed the strongest positive relationships for annual means between July and June (Table 4). Correlations between detrended coral composite Li∕Mg SST reconstructions with northern tropical Atlantic AVHRR-OISSTv2 were slightly lower. Northern tropical Atlantic AVHRR-OISSTv2 (1981–1970) and ERSSTv4 (1970–2017) showed positive correlations with the Atlantic Multi-decadal Oscillation (AMO) index (r=0.70 to 0.72, p<0.001; Table 4). Our detrended coral composite Sr∕Ca and Sr∕Ca–Li∕Mg combined SST reconstructions also showed statistically significant positive correlations with the AMO index based on ERSSTv4 (Table 4). However, AVHRR-OISSTv2 and ERSSTv4 for Europa indicated low or nonsignificant correlations with the AMO, respectively, despite the strong correlations with the northern tropical Atlantic (Table 3). Furthermore, the tropical North Atlantic (TNA; Enfield et al., 1999) and north tropical Atlantic indices (NTA; Penland and Matrosova, 1998) indicated statistically significant positive correlations with the coral-based SST and instrumental SST data at Europa (Fig. 10e; Table 4).
The regressions of detrended seasonal averages in AVHRR-OISSTv2 for Europa with the Niño3.4 index of ENSO variability showed weak yet statistically significant correlations in the season from February to April (r=0.47; p<0.010; Table 4). The correlations between ERSSTv4 and Niño3.4 were weaker (r=0.34, p<0.050; Table 4). The detrended coral composite Sr∕Ca, Li∕Mg, and their combined SST reconstructions showed no significant correlations with the Niño3.4 index. However, the Pacific–North American (PNA) pattern (Wallace and Gutzler, 1981), which is an atmospheric response to ENSO, showed statistically significant correlations with AVHRR-OISSTv2 (r=0.67, p<0.001) for Europa and the coral-derived SST anomalies between 1981 and 2012 (r=0.42, p=0.014; Table 4). The spatial correlation pattern of the PNA index with global AVHRR-OISSTv2 revealed a similar pattern as observed for the coral-based SST (Fig. 10).
4.1 Reliability of Sr∕Ca and Li∕Mg as SST proxies
Both of the Europa coral core Sr∕Ca and Li∕Mg bimonthly time series (EU3 and EU2) showed highly significant correlations with the local and regional instrumental SST products (AVHRR-OISSTv2 and ERSSTv4). For the period of overlap between 2003 and 2012 both proxies performed equally well in core EU2, while core EU3 Li∕Mg slightly underperformed Sr∕Ca. The regression slopes with SST were within the range of published calibrations for Porites corals (e.g., Hathorne et al., 2013; Montagna et al., 2014; D'Olivo et al., 2018). The bimonthly Sr∕Ca, Li∕Mg, and combined Sr∕Ca–Li∕Mg absolute SST reconstructions showed small deviations (mean RMSEs between 0.45 and 0.67 ∘C; Table 3) from the instrumental temperatures with lower winter and slightly higher summer SST. For all proxies the agreement with instrumental data was highest for the period of overlap between cores (2003 and 2012). In general, AVHRR-OISSTv2 seasonal SST amplitudes and SST anomalies showed higher correlations with the coral-based SST reconstructions than with ERSSTv4. The lower temperatures in the proxy–SST compared with the satellite data of AVHRR-OISSTv2, which measures SST at the skin of the sea surface (top few millimeters), could be related to the living depth of the corals (8.5 to 9.5 m). This was particularly apparent in several cold spikes with 2 SD (−0.72 ∘C) below the 1981 to 2012 mean SST in our coral-based SST anomaly reconstructions, which were also observed in the instrumental data (1971, 1972, 1976, 1978, 1980, 1984, 1986, 1994, 2001, 2008). The most extreme cold excursions during austral summer occurred in 1986, 1994, 2001, and 2008, which were also prominent in the AVHRR-OISSTv2. The year 1994 stands out as the coldest anomaly between 1970 and 2012 in coral-based SST (−1.34 ∘C), AVHRR-OISSTv2 (−1.37 ∘C), and ERSSTv4 (−1.16 ∘C). However, the January–February 1989 and March–June 1997 cold spikes exceeding 1 ∘C observed in AVHRR-OISSTv2 were not as extreme in our coral-based SST anomalies (−0.58 ∘C in 1989; −0.1 ∘C in 1997). A possible explanation for these cold spikes is the upwelling of colder deeper water onto the northeast coast reef promoted by the steep slopes and topography of the forereef (gentle sloping plain to a depth of 25 m). Upwelling-related cold spikes have been recorded in temperature loggers across the Mozambique Channel at 18 m of depth, potentially related to periods of active Mozambique Channel eddies interacting with the steep topography (Schouten et al., 2002; Van den Berg et al., 2007; Swart et al., 2010). Differences between the proxy records and the instrumental records at interannual scales could also reflect limitation in the instrumental records. The ERSSTv4 data used extending back to 1970 are based on very sparse observations in the ICOADS database for the southern Mozambique Channel. The resolution of the satellite data starting in 1981 should provide the best estimates for SST near Europa; however, observations near the coast can be susceptible to biases (e.g., mixing of land temperature with SST; Smit et al., 2013; Brevin et al., 2017). The comparison between AVHRR-OISSTv2 and local air temperature anomalies revealed an excellent agreement for the years covered by the weather station and serves as a quality check for the AVHRR-OISSTv2 data for our site. Nevertheless, the absolute temperature reconstruction from the coral Sr∕Ca and Li∕Mg ratios showed a good agreement with the different instrumental temperature datasets, especially for core EU2. Thus, both Sr∕Ca and Li∕Mg provide highly reliable SST proxies and in combination have the potential to improve SST reconstructions.
The statistically significant warming trend of 0.58±0.1 ∘C (p<0.001) between 1970 and 2012 in the coral Sr∕Ca SST composite was in close agreement with instrumental SST data (0.47±0.07 ∘C in ERSSTv4; 0.40±0.18 ∘C in AVHRR-OISSTv2 since 1981). The Li∕Mg SST composite trend of 1.06±0.15 ∘C (p<0.001) is, however, too large and inconsistent with both the Sr∕Ca and instrumental records. The differences in warming trends in Li∕Mg SST and Sr∕Ca SST probably highlight the differences in incorporation between these elements (Montagna et al., 2014; Marchitto et al., 2018), which could be exacerbated during periods of thermal stress. The Li∕Mg SST anomalies were especially low during some years, which resulted in a larger RMSE 0.67±0.65 ∘C (Table 3) compared to Sr∕Ca SST and AVHRR-OISSTv2, ERSSTv4, and local air temperatures. A potential limitation for the use of Li∕Mg as an SST proxy is the small number of studies to date reporting Li∕Mg SST relationships (regression slopes) in tropical Porites and Siderastrea corals (Hathorne et al., 2013; Montagna et al., 2014; Fowell et al., 2016; D'Olivo and McCulloch, 2017; D'Olivo et al., 2018; Marchitto et al., 2018). For example, applying the mean slope of −0.049 mmol mol−1 ∘C−1 for marine calcifiers reported in Montagna et al. (2014) to our Li∕Mg data would lead to significant overestimations of SST anomalies and hence even larger cold biases. Applying the −0.097 mmol mol−1 ∘C−1 for Caribbean Siderastrea siderea forereef corals would underestimate SST anomalies (Fowell et al., 2016). The mean Sr∕Ca SST relationship of -0.060 mmol mol−1 ∘C−1 is, on the other hand, far better constrained by a much larger number of studies (e.g., Corrège, 2006; DeLong et al., 2012; Pfeiffer et al., 2017). In particular, EU3 Li∕Mg was most likely affected by uncertainties in the incorporation of Mg and Li into the skeleton, while EU2 Li∕Mg showed no irregularities. Interestingly, on a seasonal scale, Li∕Ca and Mg∕Ca in EU3 showed the expected negative correlation; however, on interannual to decadal scales these ratios were positively correlated. This perhaps reflects an “extreme” example of growth effects on Li and Mg unrelated to temperature (e.g., the effect of cation entrapment and heterogeneous distribution in the centers of calcification; Montagna et al., 2014; Marchitto et al., 2018). In most cases calculating Li∕Mg cancels out this effect by leaving SST as the main controlling parameter; however, in core EU3 this appears not to be as effective, leading to slightly lower correlation of Li∕Mg with SST compared to Sr∕Ca with SST. Careful inspection of the sampling path along the major growth axes revealed that a potential cause for discrepancies in Li∕Ca and Mg∕Ca affecting Li∕Mg might be suboptimal sampling along parallel growth axes as also apparent in Fowell et al. (2016). The overlap period of 2003 to 2012 was sampled continuously in both cores without a switch in growth axis, showing an excellent agreement between cores including Li∕Ca (r=0.57, p<0.001, N=54) and Mg∕Ca (r=0.58, p<0.001, N=54). Prior to 2003, core EU3 was sampled along three different growth axes (1970–1982, 1983–1996, and 1996–2012) orientated at angles along the core length. Although all axes showed optimal growth orientations, the Li∕Ca ratios in EU3 deviated from the trends shown in Mg∕Ca, Sr∕Ca, and Li∕Mg. The importance of optimal sampling along continuous main growth axes for optimal trace element ratios and stable isotope determinations has been shown in several recent studies (e.g., DeLong et al., 2012; Zinke et al., 2016), which also appears to be the case for the Li∕Mg proxy. This sensitivity of the Li and Mg proxies in core EU3, identified as P. mayeri, could also reflect a species effect due to slight differences in their calcification strategies. For example, D'Olivo et al. (2018) showed a deviation for Porites solida from other massive Porites species in the relationships between Sr∕Ca and Li∕Mg with temperature. However, this requires further investigations as this is the first long-term (multi-decadal) reconstruction based on massive Porites. Despite these uncertainties Li∕Mg was overall the second-best-performing proxy in this study with the detrended Li∕Mg data showing an excellent agreement with the instrumental SST and Sr∕Ca data. Furthermore, the interannual and decadal SST variations as well as spatial correlation patterns in Li∕Mg appeared not to have been affected and can be interpreted with high confidence as indicated by our field correlations. Overall, the results from this study indicated that Sr∕Ca is still superior to Li∕Mg and was the most reliable SST proxy when applied to a longer time series. However, the excellent agreement between Sr∕Ca and Li∕Mg and their combination in core EU2 demonstrated that both SST proxies and their combination can provide, with greater confidence, more reliable SST reconstructions with lower RMSEs (D'Olivo et al., 2018).
In addition, we tested the multiproxy paleothermometer based on Sr∕Ca and Li∕Mg data proposed by D'Olivo et al. (2018) in both corals. Using the proposed equations on cores EU2 and EU3, their respective RMSE values were 1.1 and 0.2 ∘C higher than the values obtained from a direct calibration against the SST products. While the multiproxy method produced excellent results for core EU3, the higher RMSE for EU2 could be explained by the limitations of the multiproxy method as solutions appear to deteriorate for Porites solida and corals with small effective tissue thickness ( months). In this case EU2 had an effective tissue thickness of 3.9 months and was identified as P. solida, while EU3 had an effective tissue thickness of 9.5 months and was identified as P. mayeri. This confirms the effectiveness of the multiproxy method proposed by D'Olivo et al. (2018) when applied within its limits.
4.2 Regional and large-scale climate teleconnections
The spatial correlations between Europa coral composite data and global SST data indicated a strong response to local variability in the Mozambique Channel at the latitude between 15 and 30∘ S. The pattern of spatial correlation also suggested teleconnections with the northern–eastern Indian Ocean, the southeastern Pacific, and the tropical Atlantic. ENSO influence in the instrumental data was weak and absent in our proxy records. Only the warmest years (summer maxima) of the Europa composite time series corresponded with strong El Niño (1998, 2010) and La Niña (1999, 2000, 2011) events, as attested, for example, by the high coral mortality reported from 1998 (Quod and Garnier, 2004) and the moderate coral bleaching observed in 2011 (Guillaume and Bruggemann, 2011). Local air temperatures and AVHRR-OISSTv2 anomalies indicated other warm years (>0.5 ∘C) corresponding to El Niño years (1983, 1988, 1991–92), La Niña years (1989, 1996), and ENSO neutral years (1981, 2007, 2012–13). The majority of these lower-magnitude warm events were also recorded in the coral proxy time series. Overall, these results suggest a weak or variable impact of ENSO around Europa.
Perhaps the most interesting and to some extent unexpected relationship of our study region was found with the northern tropical Atlantic (5 to 20∘ N, 30 to 80∘ W), a region that corresponds with the main development region for hurricanes in the tropical Atlantic (Knutson et al., 2010). This region also has strong relationships with the AMO, which is the leading mode of multi-decadal variability in the northern Atlantic and thought to be driven by Atlantic Meridional Ocean Circulation (AMOC) variability (e.g., Schlesinger and Ramankutty, 1994; Kerr, 2000; Knight et al., 2005). Our coral-based SST reconstructions and satellite data revealed a strong relationship with both the tropical North Atlantic (TNA; Enfield et al., 1999) and north tropical Atlantic indices (NTA; Penland and Matrosova, 1998) as well as the AMO since at least 1970 (Table 4). However, the ERSSTv4 for Europa showed nonsignificant correlations with the AMO, while the relationship with the northern tropical Atlantic SST was robust. The exact mechanism for this teleconnection between the Mozambique Channel and the tropical Atlantic remains elusive. We speculate that atmospheric processes in response to AMO, tropical Atlantic, or Indo-Pacific variability might be controlling this relationship since all correlated regions lie within or near the trade wind convergence zone (the Intertropical Convergence Zone) where atmospheric circulation associated with deep convection controls underlying SST (Schott et al., 2009; Xie et al., 2010; Marshall et al., 2014; Green et al., 2017; Koseki and Bhatt, 2018). Wind-driven upwelling controls the regions with positive correlations (negative with the geochemical proxies) in the northern and eastern Indian Ocean, the northern South China Sea, and the southeastern Pacific (Schott et al., 2009; Xie et al., 2010; Varela et al., 2015; Sydeman et al., 2014). The strongest resemblance to an atmospheric pattern driving the observed SST pattern, including teleconnections with the Mozambique Channel, was found with the Pacific–North American (PNA) pattern (Trenberth et al., 1998). The PNA is one of the strongest modes of low-frequency atmospheric variability in the Northern Hemisphere with an equivalent Pacific–South American pattern in the Southern Hemisphere (Mo and Peagle, 2001; Irving and Simmonds, 2016). The PNA–PSA pattern is strongly influenced by ENSO and the Pacific Decadal Oscillation (PDO; Mantua et al., 1997), tending towards being in its positive phase during El Niño and negative phase during La Niña (Rodionov and Assel, 2001). The importance of atmospheric processes for Indo-Pacific climate teleconnections emanating from the Pacific PNA and PSA patterns has been documented in several studies (Rodionov and Assel, 2001; Dai et al., 2017). The Mozambique Channel and adjacent southern Africa are both impacted by PNA–PSA variability (Blamey et al., 2018). Therefore, our spatial correlation between the TNA, NTA, PNA, and global SST point towards tropical–extratropical atmospheric forcing of the observed SST teleconnection patterns in our study.
A comparison of multiple trace element ratios in two Porites cores from Europa (southern Mozambique Channel) indicated that Sr∕Ca was the most robust paleothermometer analyzed. In addition to Sr∕Ca, Li∕Mg and their combination showed great potential for improved higher-confidence multielement SST reconstructions. The SST over the last 42 years (1970–2012) was dominated by interannual variability with a warming trend of 0.58±0.1 ∘C in Sr∕Ca SST in close agreement with instrumental data (0.47±0.07 ∘C). Li∕Mg and the combination of Li∕Mg and Sr∕Ca showed unrealistically large warming trends, most probably caused by uncertainties around Li∕Ca and Mg∕Ca incorporation with marginally different uptake mechanisms for these trace elements. However, detrended data from Sr∕Ca, Li∕Mg, and the combination of Li∕Mg and Sr∕Ca agreed well with each other and with regional instrumental SST and local air temperature. Spatial correlations between detrended Sr∕Ca, Li∕Mg, and combined proxies with instrumental SST at Europa revealed robust correlations with local climate variability in the Mozambique Channel and teleconnections to regions in the tropical Atlantic Ocean, Indian Ocean, and southeastern Pacific where surface wind variability appeared to dominate the underlying SST. Of particular interest is the strong correlation found between the proxy and instrumental SST records with the northern tropical Atlantic SST. Only a weak correlation was found with ENSO, with recent warm anomalies in the geochemical proxies coinciding with strong El Niño or La Niña. We identified the PNA atmospheric pattern, which develops in the Pacific in response to ENSO, and the tropical North Atlantic SST as the most likely causes of the observed teleconnections with the Mozambique Channel SST. In conclusion, the Europa Porites sp. geochemical records highlight the great potential of Sr∕Ca and Li∕Mg ratios as accurate, reliable, high-resolution climate archives for the tropical oceans.
Trace element data will be made publicly available on the NOAA WDC paleoclimate data server at https://www.ncdc.noaa.gov/data-access/paleoclimatology-data/datasets (last access: 20 December 2018, NOAA, 2018).
The supplement related to this article is available online at: https://doi.org/10.5194/bg-16-695-2019-supplement.
JZ, MMMG, JHB, JCG, and JPD designed the study and led the writing of the paper. MMMG provided the samples, JZ, JPD, and MMMG organized and performed the trace element analysis, while JML did the coral densitometry measurements. All coauthors contributed to analysis and writing of the paper.
The authors declare that they have no conflict of interest.
The scientific expedition ORCIE 2013 conducted by Mireille M. M. Guillaume
benefited from financial support from CNRS-INEE for the inter-organism
program îles Éparses and from the Association Française des
Plongeurs Scientifiques (COLIMPHA). Authorizations for diving around Europa
and a CITES export permit (no. FR1398400001-E) were provided by the Terres
australes et antarctiques françaises (TAAF) administration. The
Forces Armées de la Zone Sud de l'Océan Indien (FAZSOI) and the gendarme were very
helpful. The assistance of photographer Steven Weinberg, skipper Jean-Bernard Galves, and the crew of the vessel
Inventive is gratefully acknowledged. We further thank the
professional divers Jean-Patrick Rousse and Erwan Meyer for their efficient
help in coring the coral colonies and the Division Technique from CNRS-INSU,
especially Michel Calzas, Christine Drezen, and Christophe Guillerm, for
sharing the temperature records of the RBR gauges that were deployed and
retrieved by Jean-Patrick Rousse. Météo-France is acknowledged for
the use of meteorological data from Europa. We thank Vanessa E. Skiba from FU
Berlin for composing the map in Fig. 1. Mireille M. M. Guillaume also
received funds from the MNHN/UMR BOrEA for geochemical analysis and support
from the ANR-STORISK project (no. ANR-15-CE03-0003) for conducting research at Europa. We
thank Kai Rankenburg from the University of Western Australia Advanced
Geochemical Facility for Indian Ocean Research for support in trace element
measurements. Research conducted at UWA was supported by the Australian
Research Council through the Centre of Excellence for Coral Reef Studies
(CE140100020) and a Laureate Fellowship awarded to Malcolm McCulloch
(FL120100049).
We acknowledge support from the Open
Access Publication
Initiative of Freie Universität Berlin.
Edited by: Aldo
Shemesh
Reviewed by: two anonymous referees
Alibert, C. and McCulloch, M. T.: Strontium/calcium ratios in modern Porites corals from the Great Barrier Reef as a proxy for sea surface temperature: calibration of the thermometer and monitoring of ENSO, Paleoceanography, 12, 345–363, 1997.
Angell, J. K.: Variation in global tropospheric temperature after adjustment for the EI Niño influence, 1958–1989, Geophys. Res. Lett., 17, 1097–1110, 1990.
Banzon, V., Smith, T. M., Chin, T. M., Liu, C., and Hankins, W.: A long-term record of blended satellite and in situ sea-surface temperature for climate monitoring, modeling and environmental studies, Earth Syst. Sci. Data, 8, 165–176, https://doi.org/10.5194/essd-8-165-2016, 2016.
Banzon, V. F., Reynolds, R. W., Stokes, D., and Xue, Y.: A spatial resolution daily sea surface temperature climatology based on a blended satellite and in situ analysis, J. Climate, 27, 8221–8228, 2014.
Barruol, G., Davy, C., Fontaine, F. R., Schlindwein, V., and Sigloch, K.: Monitoring austral and cyclonic swells in the “Iles Eparses (Mozambique channel) from microseismic noise, Acta Oecol., 72, 120–128, 2016.
Battistini, R., Lalou C., and Elbez G.: Datation par la méthode 230Th 234U du Pléistocène moyen marin de Madagascar et des îles voisines, C. R. Somm. Soc. Géol. France, 5, p. 121, 1976.
Beal, L. M., De Ruijter, W. P. M., Biastoch, A., Zhan, R., and SCOR/WCRP/IAPSO Working Group 136: On the role of the Agulhas system in ocean circulation and climate, Nature, 472, 429–436, 2011.
Blamey, R. C., Kolusu, S. R., Mahlalela, P., Todd, M. C., and Reason, C. J. C.: The role of regional circulation features in regulating El Niño climate impacts over southern Africa: A comparison of the 2015/2016 drought with previous events, Int. J. Climatol., 38, 4276–4295, https://doi.org/10.1002/joc.5668, 2018.
Brevin, R. J. W., de Mora, L., Billson, O., Jackson, T., Russell, P., Brewin, T. G., Shutler, J. D., Miller, P. I., Taylor, B. H., Smyth, T. J., and Fishwick, J. R.: Evaluating operational AVHRR sea surface temperature data at the coastline using surfers, Estuar. Coast. Shelf S., 196, 276–289, 2017.
Cohen, A. L., Owens, K. E., Layne, G. D., and Shimizu N.: The effect of algal symbionts on the accuracy of Sr∕Ca paleotemperatures from coral, Science, 296, 331–333, https://doi.org/10.1126/science.1069330, 2002.
Corrège, T.: Sea surface temperature and salinity reconstructions from coral geochemical tracers, Palaeogeogr. Palaeoclimatol., 232, 408–428, 2006.
Dai, Y., Feldstein, S. B., Tan, B., and Lee, S.: Formation Mechanisms of the Pacific-North American Teleconnection with and without Its Canonical Tropical Convection Pattern, J. Climate, 30, 3139–3155, 2017.
DeLong, K. L., Quinn, T. M., and Taylor, F. W.: Reconstructing twentieth-century sea surface temperature variability in the southwest Pacific: A replication study using multiple coral Sr∕Ca records from New Caledonia, Paleoceanography, 22, PA4212, https://doi.org/10.1029/2007PA001444, 2007.
DeLong, K. L., Quinn, T. M., Taylor, F. W., Shen, C.-C., and Lin, K.: Improving coral-base paleoclimate reconstructions by replicating 350 years of coral Sr∕Ca variations, Palaeogeogr. Palaeoclimatol., 373, 6–24, 2012.
De Ruijter, W. P. M., Ridderinkhof, H., Lutjeharms, J. R. E., Schouten, M. W., and Veth, C.: Observations of the flow in the Mozambique Channel, Geophys. Res. Lett., 29, 140–142, 2002.
De Villiers, S., Nelson, B. K., and Chivas A. R.: Biological controls on coral Sr∕Ca and delta18O reconstructions of sea surface temperatures, Science, 269, 1247–1249, 1995.
D'Olivo, J. P. and McCulloch, M. T.: Response of coral calcification and calcifying fluid composition to thermally induced bleaching stress, Sci. Rep., 7, 2207, https://doi.org/10.1038/s41598-017-02306-x, 2017.
D'Olivo, J. P., Sinclair, D. J., Rankenburg, K., and McCulloch, M. T.: A universal multi-trace element calibration for reconstructing sea surface temperatures from long-lived Porites corals: Removing “vital-effects”, Geochim. Cosmochim. Ac., 239, 109–135, 2018.
Enfield, D. B., Mestas, A. M., Mayer, D. A., and Cid-Serrano, L.: How ubiquitous is the dipole relationship in tropical Atlantic sea surface temperatures?, J. Geophys. Res., 104, 7841–7848, 1999.
Freeman, E., Woodruff, S. D., Worley, S. J., Lubker, S. J., Kent, E. C., Angel, W. E., Berry, D. I., Brohan, P., Eastman, R., Gates, L., Gloeden, W., Ji, Z., Lawrimore, J., Rayner, N. A., Rosenhagen, G., and Smith, S. R.: ICOADS Release 3.0: a major update to the historical marine climate record, Int. J. Climatol., 37, 2211–2232, 2017.
Fowell, S. E., Sandford, K., Stewart, J. A., Castillo, K. D., Ries, J. B., and Foster, G. L.: Intrareef variations in Li∕Mg and Sr∕Ca sea surface temperature proxies in the Caribbean reef-building coral Siderastrea siderea, Paleoceanography, 31, 1315–1329, 2016.
Gaetani, G. A. and Cohen, A. L.: Element partitioning during precipitation of aragonite from seawater: A framework for understanding paleoproxies, Geochim. Cosmochim. Ac., 70, 4617–4634, https://doi.org/10.1016/j.gca.2006.07.008, 2006.
Gaetani, G. A., Cohen, A. L., Wang, Z., and Crusius, J.: Rayleigh-based, multi-element coral thermometry: A biomineralization approach to developing climate proxies, Geochim. Cosmochim. Ac., 75, 1920–1932, https://doi.org/10.1016/j.gca.2011.01.010, 2011.
Gagan, M. K., Dunbar, G. B., and Suzuki, A.: The effect of skeletal mass accumulation in Porites on coral Sr∕Ca and δ18O paleothermometry, Paleoceanography, 27, PA1203, https://doi.org/10.1029/2011PA002215, 2012.
Green, B., Marshall, J., and Donohoe, A.: Twentieth century correlations between extratropical SST variability and ITCZ shifts, Geophys. Res. Lett., 44, 9039–9047, 2017.
Guillaume, M. M. M. and Bruggemann, J. H.: Coral bleaching in 2011 in NTA's of the southern Mozambique Channel (Europa and Bassas da India), 7th Western Indian Ocean Marine Science Association scientific symposium, Mombasa, Kenya, 24–29 October 2011.
Guillaume, M. M. M., Reyss, J.-L., Pirazzoli, P. A., and Bruggemann, J. H.: Tectonic stability since the last interglacial offsets the Glorieuses Islands from the nearby Comoros archipelago, Coral Reefs, 32, 719–726, https://doi.org/10.1007/s00338-012-1006-9, 2013.
Hartnady, C. J. H.: Uplift, faulting, seismicity, thermal spring and possible incipient volcanic activity in the Lesotho-Natal region, SE Africa: The Quathlamba Hotspot hypothesis, Tectonics, 4, 371–377, 1985.
Hathorne, E. C., Felis, T., Suzuki, A., Kawahata, H., and Cabioch G.: Lithium content of the aragonitic skeletons of massive Porites corals: a new tool to reconstruct tropical sea surface temperatures, Paleoceanography, 28, 143–152, 2013.
Helmle, K. P., Dodge, R. E., Swart, P. K., Gledhill, D. K., and Eakin, C. M.: Growth rates of Florida corals from 1937 to 1996 and their response to climate change, Nat. Commun., 2, 215, https://doi.org/10.1038/ncomms1222, 2011.
Hennekam, R., Zinke, J., ten Have, M., Brummer, G. J. A., and Reichart, G.-J.: Cocos (Keeling) corals reveal 200 years of multi-decadal modulation of southeast Indian Ocean hydrology by Indonesian Throughflow, Palaeogeogr. Palaeoclimatol., 33, 48–60, 2018.
Irving, D. and Simmonds, I.: A new method for identifying the Pacific–South American pattern and its influence on regional climate variability, J. Climate, 29, 6109–6125, 2016.
Kaplan, A., Cane, M. A., Kushnir, Y., Clement, A. C., Blumenthal, M. B., and Rajagopalan, B.: Analyses of global sea surface temperature 1856–1991, J. Geophys. Res., 103, 18567–18589, 1998.
Kerr, R. A. A.: North Atlantic Climate Pacemaker for the Centuries, Science, 288, 1984–1986, 2000.
Knight, J. R., Allan, R. J., Folland, C. K., Vellinga, M., and Mann, M. E.: A signature of persistent natural thermohaline circulation cycles in observed climate, Geophys. Res. Lett., 32, L20708, https://doi.org/10.1029/2005gl024233, 2005.
Knutson, T. R., McBride, J. L., Chan, J., Emanuel, K., Holland, G., Landsea, C., Held, I., Kossin, J. P., Srivastava, A. K., and Sugi, M.: Tropical cyclones and climate change, Nat. Geosci., 3, 157–163, 2010.
Koseki, S. and Bhatt, B. C.: Unique relationship between tropical rainfall and SST to the north of the Mozambique Channel in boreal winter, Int. J. Climatol., 38, e378–e387, https://doi.org/10.1002/joc.5378, 2018.
Lambs, L., Mangion, P., Mougin, E., and Fromard, F.: Water cycle and salinity dynamics in the mangrove forests of Europa and Juan de Nova Islands, southwest Indian Ocean, Rapid Commun. Mass Spectrom., 30, 311–320, 2016.
Liu, W., Huang, B., Thorne, B.W., Banzon, V. F., Zhang, H.-M., Freeman, E., Lawrimore, J., Peterson, T. C., Smith, T. M., and Woodruff, S. D.: Extended Reconstructed Sea Surface Temperature Version 4 (ERSST.v4) – Part II: Parametric and Structural Uncertainty Estimations, J. Climate, 28, 931–951, 2015.
Mantua, N. J., Hare, S. R., Zhang, Y., Wallace, J. M., and Francis, R. C.: A Pacific interdecadal climate oscillation with impacts on salmon production, B. Am. Meteorol. Soc. USA, 78, 1069–1079, 1997.
Marchitto, T. M., Bryan, S. P., Doss, W., McCulloch, M. T., and Montagna, P.: A simple biomineralization model to explain Li, Mg, and Sr incorporation into aragonitic foraminifera and corals, Earth Planet. Sc. Lett., 481, 20–29, 2018.
Marshall, J., Donohoe, A., Ferreira, D., and McGee, D.: The ocean's role in setting the mean position of the Inter-Tropical Convergence Zone, Clim. Dynam., 42, 1967–1979, 2014.
Mo, K. C. and Paegle, J. N.: The Pacific South–American modes and their downstream effects, Int. J. Climatol., 21, 1211–1229, 2001.
Montagna, P., McCulloch, M. T., Douville, E., Lopez Correa, M., Trotter, J., Rodolfo-Metalpa, R., Dissard, D., Ferrier-Pages, C., Frank, N., Freiwald, A., Goldstein, S., Mazzoli, C., Reynaud, S., Rüggeberg, A., Russo, S., and Taviani, M.: Li∕Mg systematics in scleractinian corals: Calibration of the Thermometer, Geochim. Cosmochim. Ac., 132, 288–310, 2014.
Nagtegaal, R., Grove, C. A., Kasper, S., Zinke, J., Boer, W., and Brummer, G. J. A.: Spectral luminescence and geochemistry of coral aragonite: effects of whole-core chemical treatments, Chem. Geol., 318–319, 6–15, 2012.
National Oceanic and Atmospheric Administration (NOAA): Paleoclimatology Datasets, available at: https://www.ncdc.noaa.gov/data-access/paleoclimatology-data/datasets, last access: 20 December 2018.
Okai, T., Suzuki, A., Kawahata, H., Terashima, S., and Imai, N.: Preparation of a new Geological Survey of Japan geochemical reference material: Coral JCp-1, Geostandard Newslett., 26, 95–99, 2002.
Penland, C. and Matrosova, L.: Prediction of tropical Atlantic sea surface temperatures using Linear Inverse Modeling, J. Climate, 11, 483–496, 1998.
Pfeiffer, M., Dullo, W. C., Zinke, J., and Garbe-Schoenberg, D.: Three monthly coral Sr∕Ca records from the Chagos Archipelago covering the period of 1950 to 1995: Reproducibility and implications for quantitative reconstructions of sea surface temperature variations, Int. J. Earth Sci., 98, 53–66, 2009.
Pfeiffer, M., Zinke, J., Dullo, W.-C., Timm, O., Cahyarini, S. Y., Latif, M., and Weber, M. E.: Indian Ocean corals reveal crucial role of World War II bias for twentieth century warming estimates, Sci. Rep.-UK, 7, 14434, https://doi.org/10.1038/s41598-017-14352-6, 2017.
Quod, J.-P. and Garnier R.: A preliminary assessment of the coral reefs of Europa (Mozambique channel), Reef Encounter, 32, 23–25, 2004.
Reynolds, R. W., Smith, T. M., Liu, C., Chelton, D. B., Casey, K. S., and Schlax, M. G.: Daily high-resolution-blended analyses for sea surface temperature, J. Climate, 20, 5473–5496, 2007.
Rodionov, S. and Assel, R.: A New Look at the Pacific/North American Index, Geophys. Res. Lett., 28, 1519–1522, 2001.
Schlesinger, M. E. and Ramankutty, N.: An oscillation in the global climate system of period 65–70 years, Nature, 367, 723–726, 1994.
Schott, F. A., Xie, S. P., and McCreary Jr., J. P.: Indian Ocean circulation and climate variability, Rev. Geophys., 47, RG1002, https://doi.org/10.1029/2007RG000245, 2009.
Schouten, M. W., De Ruijter, W. P. M., Van Leeuwen, P. J., and Dijkstra, H. A.: An oceanic teleconnection between the equatorial and southern Indian Ocean, Geophys. Res. Lett., 29, 9–62, 2002.
Smit, A. J., Roberts, M., Anderson, R. J., Dufois, F., Dudley, S. F. J., Bornman, T. G., Olbers, J., and Bolton, J. J.: A Coastal Seawater Temperature Dataset for Biogeographical Studies: Large Biases between In Situ and Remotely-Sensed Data Sets around the Coast of South Africa, Plos One, 8, e81944, https://doi.org/10.1371/journal.pone.0081944, 2013.
Smith, S. V., Buddemeier, R. W., Redalje, R. C., and Houck, J. E.: Strontium-calcium thermometry in coral skeletons, Science, 204, 404–406, 1979.
Swart, N. C., Lutjeharms, J. R. E., Ridderinkhof, H., and de Ruijter, W. P. M.: Observed characteristics of Mozambique Channel eddies, J. Geophys. Res., 115, C09006, https://doi.org/10.1029/2009JC005875, 2010.
Sydeman, W. J., García-Reyes, M., Schoeman, D. S., Rykaczewski, R. R., Thompson, S., Black, B. A., and Bograd S. J.: Climate change and wind intensification in coastal upwelling ecosystems, Science, 345, 77–80, https://doi.org/10.1126/science.1251635, 2014.
Testut L., Duvat V., Ballu V., Fernandes R. M. S., Pouget F., Salmon C., and Dyment J.: Shoreline changes in a rising sea level context: The example of Grande Glorieuse, Scattered Islands, Western Indian Ocean, Acta Oecol., 72, 110–119, 2016.
Timmermann, A., An, S. I., Kug, J. S. Jin, F. F., Cai, W., Capotondi, A., Cobb, K., Lengaigne, M., McPhaden, M. J., Stuecker, M. F., Stein, K., Wittenberg, A. T., Yun, K. S., Bayr, T., Chen, H.-C., Chikamoto, Y., Dewitte, B., Dommenget, D., Grothe, P., Guilyardi, E., Ham, Y.-G., Hayash, M., Ineson, S., Kang, D., Kim, S., Kim, W., Lee, J.-Y. Li, T., Luo, J. J., McGregor, S., Planton, Y., Power, S., Rashid, H., Ren, H. L., Santoso, A., Takahashi, K., Todd, A., Wang, G., Wang, G., Xie, R. Yang, W.-H., Yeh, S.-W., Yoon, J., Zelle, E., and Zhang, X.: El Niño-Southern Oscillation complexity, Nature, 559, 535–545, 2018.
Thompson, D. W. J., Kennedy, J. J., Wallace, J. M., and Jones, P. D.: A large discontinuity in the mid-twentieth century in observed global-mean surface temperature, Nature, 453, 646–649, 2008.
Trenberth, K. E., Branstator, G. W., Karoly, D., Kumar, A., Lau, N., and Ropelewski, C: Progress during TOGA in understanding and modelling global teleconnections associated with tropical sea surface temperatures, J. Geophys. Res., 103, 14291–14324, 1998.
Trouet, V. and van Oldenborgh, G. J.: KNMI Climate Explorer: a web-based research tool for high-resolution paleoclimatology, Tree-Ring Res., 69, 3–14, 2013.
Van den Berg, M. A., Morris, T., and Roberts, M. J.: Long-term temperature monitoring in the Mozambique Channel, 5th Western Indian Ocean Marine Science Association scientific symposium, Durban, South Africa, 22–26 October 2007.
Varela, R., Álvarez, I., Santos, F., de Castro, M., and Gómez-Gesteira, M.: Has upwelling strengthened along worldwide coasts over 1982–2010?, Sci.-Rep. UK, 5, 10016, https://doi.org/10.1038/srep10016, 2015.
Wallace, J. M. and Gutzler, D. S.: Teleconnections in the geopotential height field during the norther hemisphere winter, Mon. Weather Rev., 109, 784–812, 1981.
Woodruff, S. D., Worley, S. J., Lubker, S. J., Ji, Z., J. Freeman, E., Berry, D. I., Brohan, P., Kent, E. C., Reynolds, R. W., Smith, S. R., and Wilkinson, C.: ICOADS Release 2.5: Extensions and enhancements to the surface marine meteorological archive, Int. J. Climatol., 31, 951–967, 2011.
Xie, S. P., Deser, C., Vecchi, G., Ma, J., Teng, H., and Wittenberg, A. T.: Global warming pattern formation: Sea surface temperature and rainfall, J. Climate, 23, 966–986, 2010.
Zinke, J., Dullo, W.-C., Heiss, G. A., and Eisenhauer, A.: ENSO and subtropical dipole variability is recorded in a coral record off southwest Madagascar for the period 1659 to 1995, Earth Planet. Sc. Lett., 228, 177–197, 2004.
Zinke, J., Timm, O., Pfeiffer, M., Dullo, W.-C., Kroon, D., and Thomassin, B. A.: Mayotte coral reveals hydrological changes in the western Indian between 1865 to 1994, Geophys. Res. Lett., 35, L23707, https://doi.org/10.1029/2008GL035634, 2008.
Zinke, J., Hoell, A., Lough, J., Feng, M., Kuret, A., Clarke, H., Ricca, V., and McCulloch, M. T.: Coral record of southeast Indian Ocean marine heatwaves with intensified Western Pacific temperature gradient, Nat. Comm., 6, 8562, https://doi.org/10.1038/ncomms9562, 2015.
Zinke, J., Reuning, L., Pfeiffer, M., Wassenburg, J. A., Hardman, E., Jhangeer-Khan, R., Davies, G. R., Ng, C. K. C., and Kroon, D.: A sea surface temperature reconstruction for the southern Indian Ocean trade wind belt from corals in Rodrigues Island (19∘ S, 63∘ E), Biogeosciences, 13, 5827–5847, https://doi.org/10.5194/bg-13-5827-2016, 2016.