the Creative Commons Attribution 4.0 License.
the Creative Commons Attribution 4.0 License.
 | 06 Feb 2019
Carbon balance of a restored and cutover raised bog: implications for restoration and comparison to global trends
Michael M. Swenson
Shane Regan
Dirk T. H. Bremmers
Jenna Lawless
Matthew Saunders
Laurence W. Gill
The net ecosystem exchange (NEE) and methane (CH4) flux were measured by chamber measurements for five distinct ecotypes (areas with unique eco-hydrological characteristics) at Abbeyleix Bog in the Irish midlands over a 2-year period. The ecotypes ranged from those with high-quality peat-forming vegetation to communities indicative of degraded, drained conditions. Three of these ecotypes were located in an area where peat was extracted by hand and then abandoned and left to revegetate naturally at least 50 years prior to the start of the study. Two of the ecotypes were located on an adjacent raised bog, which although never mined for peat, was impacted by shallow drainage and then restored (by drain blocking) 6 years prior to the start of the study. Other major aspects of the carbon (C) balance, including dissolved organic carbon (DOC), dissolved inorganic carbon (DIC), and open-water CO2 evasion, were quantified for a catchment area at the study site over the same 2-year period. The ecotype average annual ecotype C balance ranged from a net C sink of g C m−2 yr−1, comparable to studies of intact peatlands, to a substantial C source of g C m−2 yr−1, with NEE being the most variable component of the C balance among the five ecotypes. Ecotype annual CH4 flux ranged from 2.7±1.4 g C-CH4 m−2 yr−1 to 14.2±4.8 g C-CH4 m−2 yr−1. Average annual aquatic C losses were 14.4 g C m−2 yr−1 with DOC, DIC, and CO2 evasion of 10.4 g C m−2 yr−1, 1.3 g C m−2 yr−1, and 2.7 g C m−2 yr−1, respectively. A statistically significant negative correlation was found between the mean annual water table (MAWT) and the plot-scale NEE but not the global warming potential (GWP). However, a significant negative correlation was observed between the plot-scale percentage of Sphagnum moss cover and the GWP, highlighting the importance of regenerating this keystone genus as a climate change mitigation strategy in peatland restoration. The data from this study were then compared to the rapidly growing number of peatland C balance studies across boreal and temperate regions. The trend in NEE and CH4 flux with respect to MAWT was compared for the five ecotypes in this study and literature data from degraded/restored/recovering peatlands, intact peatlands, and bare peat sites.
- Article
(5526 KB) - Full-text XML
-
Supplement
(1278 KB) - BibTeX
- EndNote


Peatlands are important to the global carbon cycle as they act as important stores of carbon (C) and sources or sinks of carbon dioxide (CO2) and methane (CH4) (Gorham, 1991). Despite covering only ∼3 % of the Earth's terrestrial surface, it is estimated that between 500 and 700 billion tonnes of C are stored as organic soil within the global peatland expanse (Leifeld and Menichetti, 2018; Page and Baird, 2016; Yu et al., 2009). However, at present, human activity is either draining or mining ∼10 % of global peatlands, transforming them from long-term C sinks into sources (Joosten, 2010; Leifeld and Menichetti, 2018). In Europe, a high percentage (∼46 %) of the remaining peatlands are degraded to the point at which peat is no longer actively being formed (Tanneberger et al., 2017), and in Ireland whilst ∼20 % of the land area is peatland, over 95 % of raised bogs have been degraded through anthropogenic activities such as drainage for agriculture, forestry, and peat extraction (Connolly and Holden, 2017; Connolly and Holden, 2009).
The C cycle and greenhouse gas (GHG) dynamics of degraded peatlands are often substantially different compared to intact peatlands (Baird et al., 2009; Blodau, 2002), making them significant with respect to national and global GHG budgets and emission reporting (Billet et al., 2010; Wilson et al., 2013). Moreover, degraded peatlands can continue to emit C for decades to centuries following drainage, and current estimates are that degraded peatlands store globally ∼80.8 Gt of soil C and emit ∼1.91 (0.31–3.38) Gt CO2 eq. yr−1 (Leifeld and Menichetti, 2018). Soil C sequestration through peatland restoration is increasingly recognized as an important strategy to tackle climate change (Dise, 2009; Leifeld and Menichetti, 2018), and in recent years there has been a substantial increase in money being invested in peatland projects across the world (Andersen et al., 2017). With the increase in global active peatland management, there is a need for more studies examining how drainage and restoration alters the eco-hydrology of degraded peatland systems and their C balances (Baird et al., 2009; Young et al., 2017).
The land–atmosphere CO2 flux, or net ecosystem exchange (NEE), in peatlands is related to water table level, as inundation creates anaerobic conditions that suppress the decomposition of soil organic matter (Lain et al., 1996). A high water table can result in a net CO2 sink (negative NEE), whereas a low water table can result in a net CO2 source (positive NEE). Thus, water table has been correlated to spatial (Jungkunst and Fielder, 2007; Silvola et al., 1996; Strack et al., 2014) and temporal (Helfter et al., 2015; Lund et al., 2012; McVeigh et al., 2014; Peichl et al., 2014; Strachan et al., 2016) variation in the NEE of both intact and degraded peatlands. However, anaerobic conditions due to a high water table can also increase the land atmosphere CH4 flux (Frenzel and Karofeld, 2000). Both NEE and CH4 flux are also affected by plant ecology, as the extent of aerenchymatous vegetation cover such as Eriophorum spp. is correlated with increased CH4 flux (Cooper et al., 2014; Frenzel and Karofeld, 2000; Gray et al., 2013; McNamara et al., 2008; Waddington and Day, 2007), although this effect can possibly be reversed if aerenchymatous vegetation aerates the saturated soil (Fritz et al., 2011). Sphagnum spp., however, often exhibit lower CH4 fluxes (Frenzel and Rudolph, 1998) due to a symbiotic relationship with methanotrophic bacteria (Raghoebarsing et al., 2005). Also, Sphagnum spp. coverage may correspond to an increase in the CO2 sink function of “natural” sites (Strack et al., 2016) as much of the peat in northern peatlands is derived from this genus (Bacon et al., 2017; Vitt et al., 2000). Furthermore, the extent of vegetation cover is an important factor affecting the NEE (Strack et al., 2016; Tuittila et al., 1999; Waddington and Day, 2007). This is relevant to degraded and restored peatlands because mined peatlands can have large areas of bare peat (Wilson et al., 2015).
Climatic variables such as the frequency of cloudiness, temperature, and length of growing season have also been found to be important controlling factors of NEE (Charman et al., 2013; Helfter et al., 2015; McVeigh et al., 2014; Zhaojun et al., 2011). However, climate variables cannot be controlled at a specific site and therefore may not be as relevant when considering climate change mitigation actions.
Although N2O emissions can be an important aspect of the GHG emissions from organic soils (Pärn et al., 2018), this study focuses only on aspects of the C balance. In low-nutrient, nonagricultural sites like in this study, N2O emissions are typically low (Haddaway et al., 2014) but can be higher for deeply drained (Vanselow-Algan et al., 2015) or high-nutrient sites (Danevčič et al., 2010). The radiative impact of different GHGs can be normalized by converting them into a CO2 equivalent in terms of the 100-year global warming potential (GWP) in metric tons of CO2 equivalent per hectare per year: over a 100-year horizon, CO2 = 1, CH4 = 34, and N2O = 298, after IPCC 2013 recommendations (Myhre and Shindell, 2013).
Intact peatlands are a net CO2 sink (typical annual average NEE range of −31.9 to −66 g C-CO2 m−2 yr−1, from literature data compiled by Helfter et al., 2015) and a CH4 source. By contrast, drained peatlands are a CO2 source (the average annual NEE of +81 to +151 g C-CO2 m−2 yr−1 reported in Renou-Wilson et al. (2018a) is typical) with very low CH4 emissions (Baird et al., 2009). However, it should be noted that this can be offset by high CH4 emissions from active drains of ∼60 g CH4 m−2 yr−1 (Evans et al., 2016). Degraded/drained peatlands typically have a larger GWP compared to intact sites or rewetted sites because a large positive NEE outweighs the reduced CH4 emissions (Renou-Wilson et al., 2018a). The NEE and CH4 fluxes from restored peatlands can be similar to intact peatlands, but exhibit greater variability (Strack et al., 2016; Wilson et al., 2016a).
Several studies have suggested the hypothesis that time since restoration is an important factor in the GWP of peatlands (Augustin and Joosten, 2007; Bain et al., 2011; Waddington and Day, 2007). In particular, the restored sites may go through an initial period of high CH4 production and high GWP because restored peatlands are often rapidly colonized by aerenchymatous vegetation, such as Eriophorum spp. (Cooper et al., 2014; Waddington and Day, 2007). This is followed by a period of decreasing GWP as mosses and other peatland species become established (Augustin and Joosten, 2007; Bain et al., 2011). To test this hypothesis, more data are needed for peatlands “restored more than 10 years previously” (Bacon et al., 2017). Also, it is valuable to have studies which directly compare adjacent sites with contrasting site histories.
Aquatic losses of C include dissolved organic carbon (DOC) and dissolved inorganic carbon (DIC) in runoff as well as CO2 evasion from open water. These have not been measured as frequently as NEE and CH4 flux (Dinsmore et al., 2010), but can represent a key component of the net ecosystem C budget (NECB) (Barry et al., 2016; Kindler et al., 2011). Ignoring the aquatic C losses would result in an overestimate of the C sink function of peatlands (Billet et al., 2010). Few studies have concurrently measured a complete NECB for a peatland including the DIC flux (Nilsson et al., 2008) and CO2 evasion from open water (Dinsmore et al., 2010), even though CO2 evasion has been found to be important to the overall C balance (Dinsmore et al., 2010). Further, these studies have focused on intact rather than degraded or restored peatlands.
The growing body of scientific research on the GHG and C balance of peatlands and the importance to global climate change means that it is increasingly important to consider new data in the context of global studies (e.g., Jungkunst and Fieldler, 2007).
The goal of this work is to quantify all of the major aspects of the C balance (NEE, CH4 flux, and aquatic losses as DOC, DIC, and CO2 evasion) over a 2-year period for five distinct peatland ecotypes, which are located in two adjacent areas with contrasting site histories: a peat extraction bog, which was abandoned in ca. 1960, and an ombrotrophic raised bog, which was previously impacted by drainage but not peat extraction, and then recently restored (in 2009). This study also presents the measurements in the context of global studies on boreal and temperate peatlands with the aim of identifying trends in NEE and CH4 flux based on land condition (drained, restored, intact), mean annual water table, and vegetation cover (presence or lack of vegetation).
2.1 Site description
Abbeyleix Bog (lat 52.89714, long −7.35022, elevation approx. 90 m) is a peatland and natural area in Co. Laois, Ireland. This site is located in a temperate, oceanic climate with a 30-year (1981–2010) mean annual rainfall of 923 mm and a mean annual temperature of 9.5 ∘C (Walsh, 2012).
Abbeyleix Bog contains areas that were historically mined for peat (referred to here as cutover bog) as well as raised ombrotrophic bog, which was never mined for peat (Fig. 1). The areas of cutover bog were domestically mined for peat by hand cutting between the 1870s and 1960s and then abandoned (i.e., no restoration or management works have occurred in this area post-extraction) (Ryle, 2013). Peat extraction never occurred on the remaining areas of raised bog; however, these areas were impacted by a surface drainage network installed in the 1980s in preparation for industrial extraction although the plans for industrial extraction of the peat were later abandoned due to resistance from the local community. Throughout the raised bog, surface drains were installed at 15 m spacing to a depth of 1 m and connected with older and deeper drains along a historic railway track and the margins of the bog. The surface drains were later blocked as part of a restoration effort in 2009, 6 years before the start of this study. Acidic, low-nutrient, Histosol peat soils remain throughout the raised and cutover bogs, with 5.0–8.5 m in depth on the raised bog and 1–3 m in depth on the cutover bog.
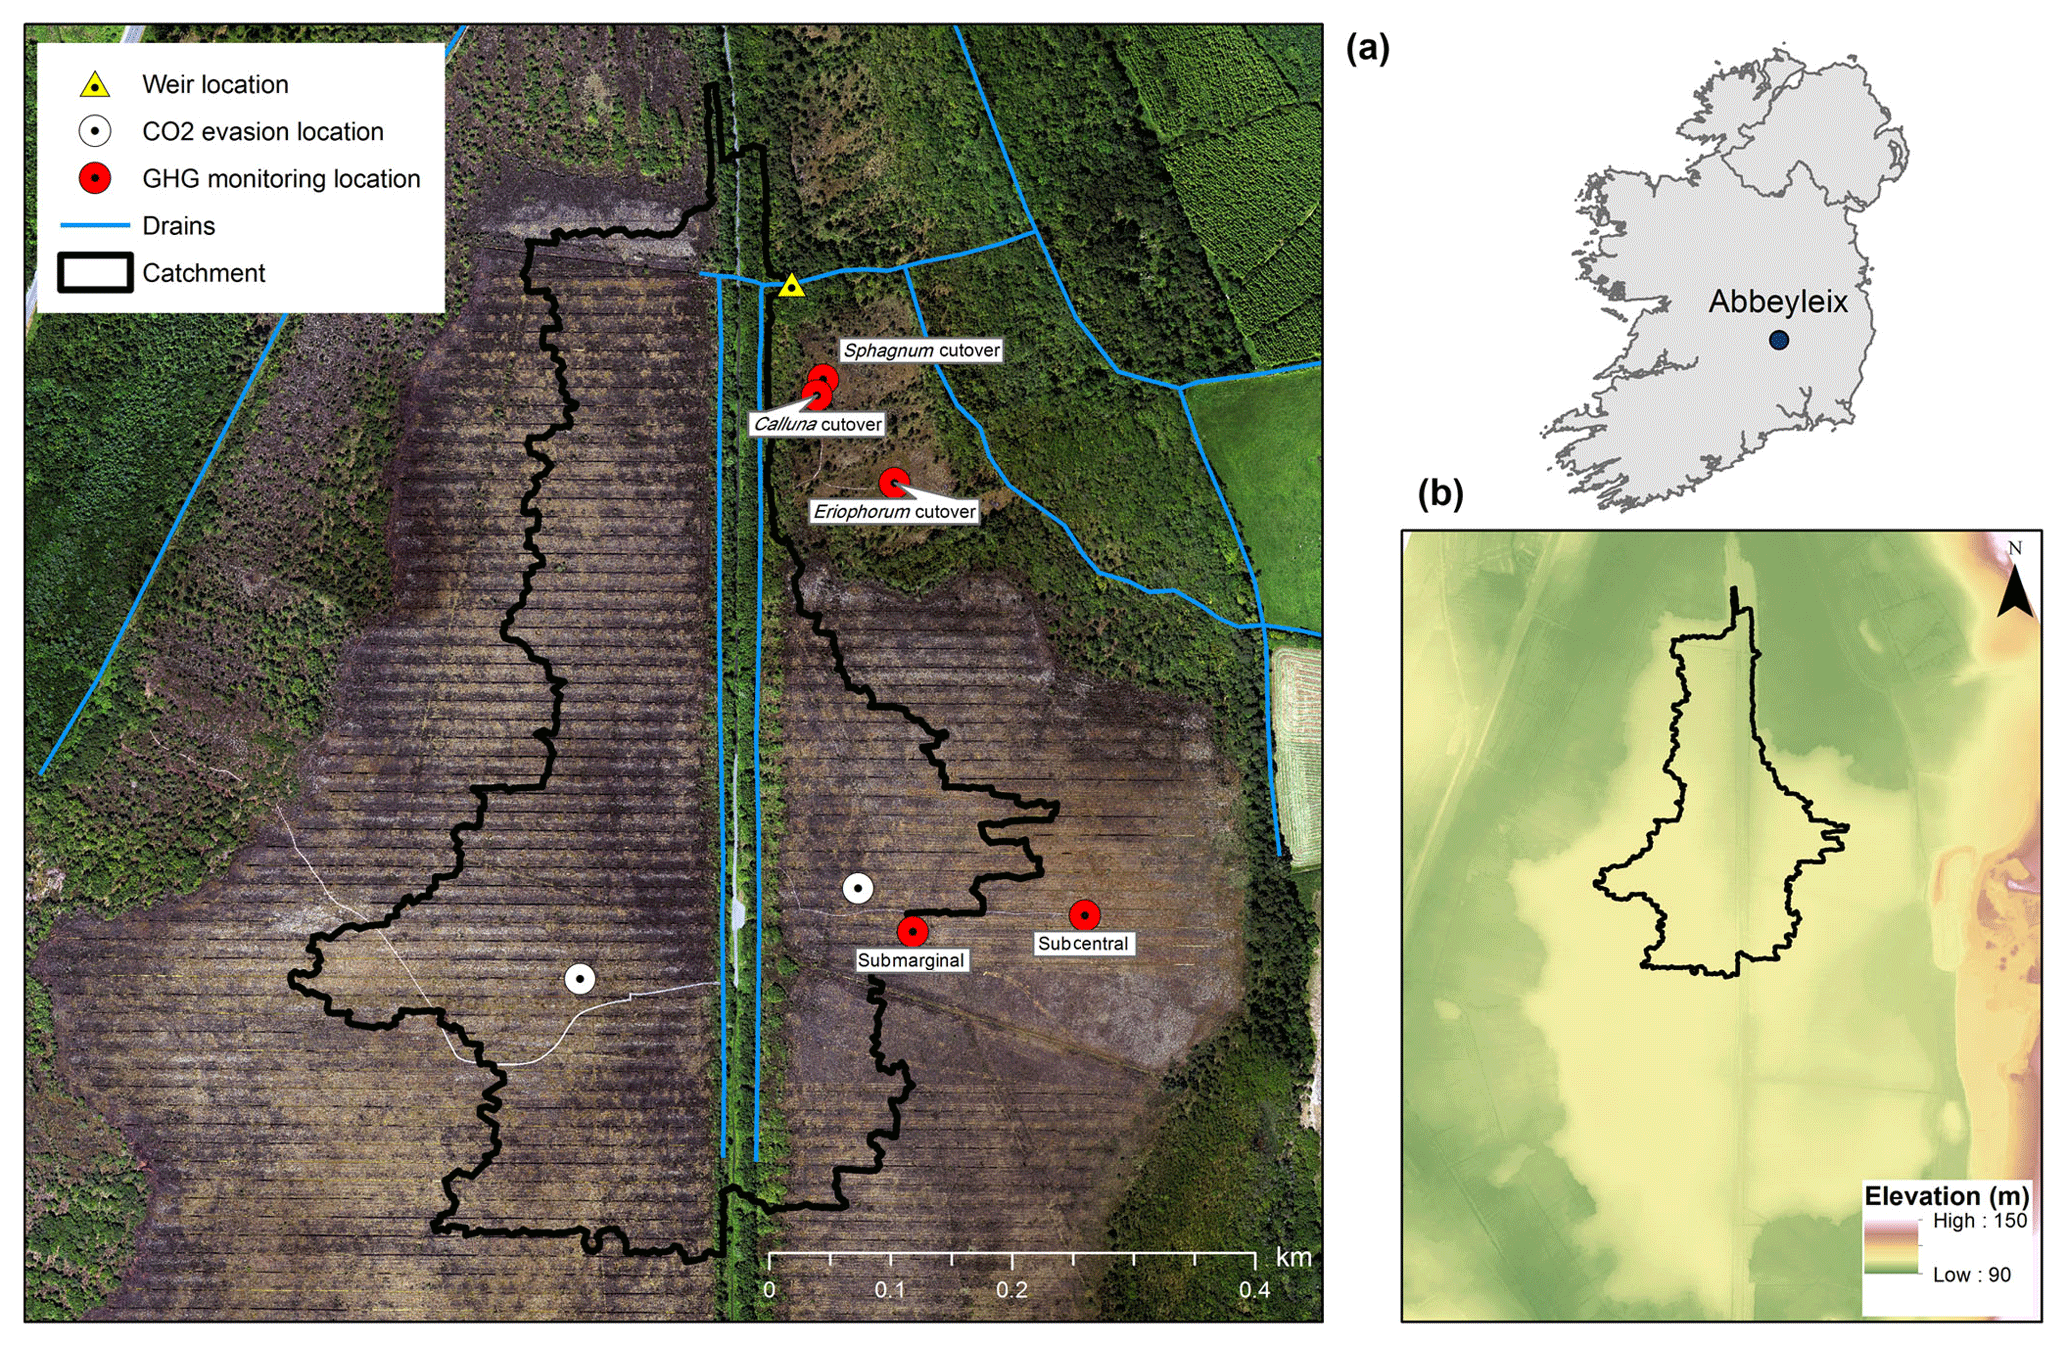
Figure 1Location of the study site in Ireland; elevation map of Abbeyleix Bog (bottom right) showing the uncut raised bog surrounded by lower cutover bog and the higher esker complex to the east; an aerial photograph of the study site showing the weir catchment area, major drains, and sampling locations. In the aerial photograph the blocked surface drainage network on the raised bog can be seen as a set of horizontal lines and the historic railroad track can be seen as a vertical line through the middle of the photograph. White circles represent the open-water CO2 evasion locations on blocked drains, referred to as west high bog (WHB) and east high bog (EHB).
2.2 Sampling locations
Five sampling locations were chosen to quantify GHG emissions, two on the uncut raised bog and three on the cutover bog. These locations were chosen to represent five ecotypes, for which the ecotype refers to a distinct set of hydro-physical and ecological conditions. These five areas were chosen to represent common ecotypes on raised and cutover bogs in Ireland with the help of ecologists from the Irish National Parks and Wildlife Service (NPWS).
Table 1Summary of the plant ecology for each ecotype in this study. Data are reported as the mean (range) of the five or six collars within each ecotype.
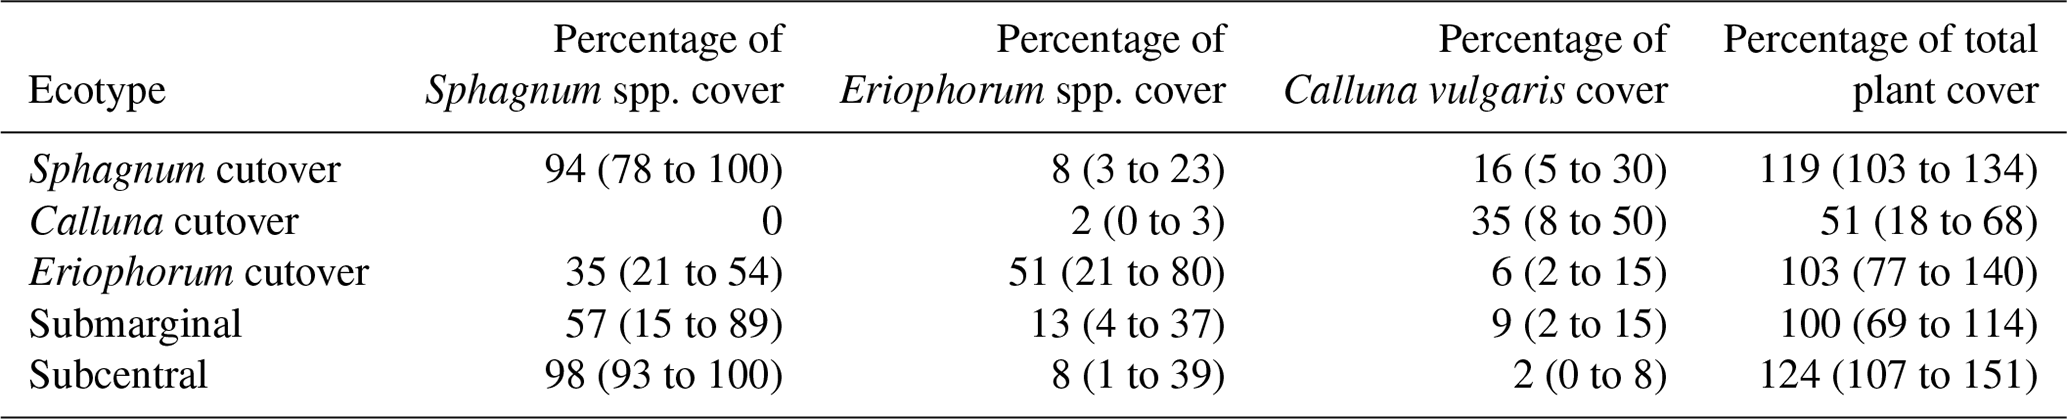
On the raised bog, one study location was chosen in a subcentral ecotype, which is defined as having a continuous Sphagnum spp. cover and continuously high water table but lacking the micro-topography of hummocks and hollows. The subcentral ecotype is the highest-quality bog conditions found at this site. Another study location was chosen in a submarginal ecotype, which is defined as having a discontinuous Sphagnum spp. moss cover and a mixed presence of both relatively wet and dry bog vegetation (Table 1). Further description of raised bog ecotypes can be found in Schouten et al. (2002).
On the cutover bog, three sampling locations were chosen based on distinctions in the plant ecology. The Sphagnum cutover ecotype contains a continuous Sphagnum spp. cover (primarily as hummocks of Sphagnum capillifolium with some Sphagnum subnitens and Sphagnum magellanicum) and a mixture of plant species similar to the subcentral ecotype. The Calluna cutover ecotype contains a low diversity of plant species characteristic of a well-drained peat soil, dominated by heather (Calluna vulgaris), bare peat, and lichens (mostly Cladonia portentosa) similar to a face bank ecotype on a raised bog. The Eriophorum cutover ecotype is dominated by Eriophorum angustifolium and contains a moderate percentage (21–54 % in this study) cover of Sphagnum spp. (Table 1). All sampling locations were chosen in open areas, excluding any trees, shrubs, or other vegetation that could not fit under the gas sampling chambers (see Sect. 2.4). Six collars were installed for each ecotype except for the Calluna cutover ecotype in which five collars were installed. Collar locations were chosen to represent ecological variability within each ecotype. Plant ecology was characterized for all collars in June 2016 and again in June 2017 with the help of ecologists from the NPWS. The plant ecology was determined in terms of the percentage of cover of every species present, averaged over the 2 years.
2.3 Meteorological field data
On site, hourly measurements of air temperature and humidity (CS215 probe, Campbell Scientific, Loughborough, UK), rainfall (ARG100 tipping bucket rain gage, Campbell Scientific), barometric pressure (PTB110 barometer, Vaisala, Osakeyhtiö, Finland), and soil temperature at 5 and 10 cm (PT100 temperature probes, Campbell Scientific) were recorded by a CR1000 data logger (Campbell Scientific). Soil temperature was also recorded at ecotypes by two LogBox-AA data loggers (Novus, Miami, USA). The hourly phreatic water table was recorded in 5 cm diameter stilling wells located at each of the five ecotypes by an Orpheus Mini level logger (vented transducer, 0.1 % error, OTT Hydromet, Kempten, Germany). The ground elevation at the center of each collar was surveyed and compared to the stilling well using an RTK GPS with ±2 mm accuracy (TDL 450L, Trimble, Sunnyvale, CA), and the hourly water table at each collar was offset by this difference in elevation. All collars were located within 8 m of the ecotype water table logger.
The hourly light intensity was measured in the field in units of watts per square meter using an LP02 pyranometer (Hukseflux Thermal Sensors, Delft, Netherlands). This sensor was calibrated to the photosynthetically active radiation (PPFD) sensor (TPR-2, PP Systems), which recorded in units of µmol m−2 s−1, used during the field measurements, located inside the chamber. A linear calibration between these two sensors was found for both sunny and overcast days (n=27, r2=0.82), which was used to convert hourly light intensity to hourly PPFD.
2.4 CO2 and CH4 flux measurements
The closed static chamber method was used to measure CO2 and CH4 gas fluxes from all plots, comparable to methods used in a large number of other studies, particularly on peatlands in Ireland (e.g., Wilson et al., 2016b). Stainless steel collars were permanently installed 20 cm into the ground at least 2 weeks before the start of sampling. This collar had a water trough along the top edge to ensure a suitable seal with the chamber. The chambers were constructed in-house of clear polycarbonate for CO2 measurements and opaque Polystone™ for CH4 and were equipped with a fan. Chambers were of the size of cm or 54 L in total with a measurement area of 0.36 m2. A system of wooden platforms was constructed 6–7 weeks before the start of sampling so that each collar could be accessed without putting pressure on the ground surface adjacent to it. In the subcentral ecotype, platforms were placed on steel piles to the base of the peat to prevent sinking into the bog. For CO2 flux measurements, chambers were gently set on the collar and any pressure differential between the chamber headspace and the ambient atmosphere was vented using a 5 cm2 hole set in the side of the chamber. The chamber was then sealed and the CO2 concentration was recorded in the field every 15 s for a period of 105 s using an EGM-4 infrared gas analyzer (PP Systems, Amesbury, USA). CO2 flux was calculated from the slope of the linear increase in CO2 concentration over time. In order to maintain a constant temperature over the chamber closure time, particularly under high irradiance, a cooling system was installed in the chamber, which pumped water from an ice bath through a small radiator located behind the fan to keep the variance of the chamber temperature to within 1 ∘C during the measurement. The CO2 flux measurement was repeated under a range of light levels by artificially shading the chamber, generally under full ambient light, one to two other partial shading light levels, and a completely shaded measurement. Ecosystem respiration is assumed to be the CO2 flux when the light transmitted into the chamber was zero. For this study, a positive sign convention indicates a net loss of C from the peatland. CO2 flux measurements were conducted over 63 field days between January 2016 and August 2017. Over 29 collar locations, a total of 3358 chamber measurements for CO2 flux were kept for modeling after quality checking to ensure that the change in CO2 concentration over the chamber closure was monotonic and that the PPFD did not change by more than 50 µmol m−2 s−1 over the chamber closure.
For CH4 flux measurements, gas samples of 20 mL each were extracted from the chamber every 10 min beginning 5 min after the chamber had been placed on the collar and sealed. These samples were later analyzed in the lab on an Agilent gas chromatograph instrument with a flame ionization detector and a 30 m long Elite-Q PLOT gas chromatography column. Samples were collected over 17 field days between May 2017 and January 2018.
Additionally, the soil temperature at 5 and 10 cm in depth, with the water table adjacent to the collar, air temperature, and light level inside the chamber (for CO2 flux measurements) were recorded for each chamber closure at the time of sampling.
2.5 NEE modeling
The NEE was modeled on an hourly basis to account for the expected diurnal variations, which are driven by diurnal variations in light intensity and soil temperature. Field measurements of CO2 flux were used to build collar specific empirical models of gross primary production (GPP) and ecosystem respiration (ER). Hourly measurements of field variables were input into these empirical models to calculate hourly GPP and ER, which were then summed to calculate NEE.
Several different empirical models of GPP and ER were tested based on the fit to the field data (see Sect. 1 in the Supplement), which were judged based on the sum of the squares of the residuals and r2 values. Models were also checked to ensure that there was no bias or trend in the residuals with respect to independent variables. Of the models tested, the GPP model in Eq. (1) and ER model in Eq. (2) (from Wilson et al., 2016b) were found to best explain the variance in the field data for all of the 29 collars.
where a, b, c, d, and e are collar-specific empirical fitted model parameters and JDAY is the Julian day of the year. PPFD is the light level in µmol m−2 s−1, T5 cm is the soil temperature at 5 cm, and WT is the water level in centimeters below ground surface at the collar. The r2 value of the modeled versus measured data using Eq. (1) ranged between 0.77 and 0.94 for each of the 29 collars (Table S3).
where a, b, and c are collar-specific empirical fitting parameters, and other variables are as above. For this ER model, the r2 values ranged from 0.63 to 0.92 for each of the 29 collars (Table S4). (Other metrics on model fitting for Eqs. (1) and (2) including the standard error of the model fitting parameters and n values are shown in Tables S3 and S4). Fitting parameters and more information on the GPP and ER models tested can be found in Supplemental Sect. 1.
Hourly water level, T5cm, PAR, and Julian day data were input into Eqs. (1) and (2) (with the collar-specific fitting parameters) to calculate hourly GPP and ER at each collar over a 2-year period.
2.6 CH4 modeling
The annual CH4 fluxes for 2017 were calculated from the average measured flux at each collar (as in Strack et al., 2014) over the year. However, in this case, the data collection was biased toward the warmer part of the year, with no measurements collected during January–April because of equipment issues. To account for this bias in sampling period, the collar average CH4 flux was scaled by a factor of 0.80. This factor was in turn derived from an empirical model fit to the field data, which modeled the temporal variation in CH4 flux as a function of soil temperature and day of the year (Eq. S3). The modeling process is described more fully in Sect. S1. Throughout all of 2016, equipment issues prevented the collection of CH4 flux measurements. Due to this data limitation, the GWP and C balance for 2016 was calculated using the 2017 values of CH4 flux. The reported GWP and to a lesser extent C balance for 2016 should thus be interpreted with some caution. The assumption that CH4 fluxes were similar in 2016 and 2017 is partially justified by the fact that the empirical model of CH4 flux gave very similar results for 2016 and 2017 (<3 % difference).
2.7 Aquatic C losses
A thin-plate V-notch weir was installed to measure hourly discharge from a 249 000 m2 catchment area on-site (as shown in Fig. 1). The weir catchment area was delineated in ArcGIS using a digital terrain map based on lidar survey data from 2013. The majority of this catchment area was composed of marginal and submarginal uncut raised bog (>90 %) as well as lightly forested drains along a bog road (<10 %). Aquatic C losses as DOC and DIC were quantified at this location only and assumed to be the same for all ecotypes (even those adjacent to but outside of this catchment area) due to the difficulty in resolving the relative contributions of each ecotype to the total DOC flux. The DOC concentration was sampled weekly in 2016 and every 12 h (with a few gaps) from January through November 2017. DOC samples were filtered in the field using a 0.45 µm cellulose syringe filter after rinsing the syringe and filter with 20 mL of sample. Samples were then acidified to pH 2 using 10 % HCl to preserve them and stored under refrigeration at 4 ∘C and analyzed within 2 months. The DOC concentration was measured by UV absorbance as in other studies (e.g., Jager et al., 2009; Koehler et al., 2009) at a wavelength of 254 nm. A site-specific calibration curve was determined between 254 nm UV absorbance and DOC concentration measured using a Vario total organic carbon (TOC) select analyzer (Elementar, Langenselbold, Germany). This was undertaken on samples collected from January 2016 to April 2016, July 2016, and July 2017 (r2=0.997, n=76). The error of this method was ±1.1 mg C L−1 based on the standard deviation of the residuals. The hourly discharge at the weir was multiplied by the most recent DOC concentration measurement to calculate a C flux as DOC from the catchment. This value was then divided by the catchment area to calculate the aquatic C loss as DOC per square meter.
The DIC concentration at the weir was calculated from the aqueous partial pressure of CO2 as well as the pH and temperature using equations from Gelbrecht et al. (1998) as in Nilsson et al. (2008) in which dissolved CO2 was included as part of DIC. Partial pressure of CO2 was measured on-site in triplicate by filling and then sealing a 250 mL bottle with 200 mL of water sample. Circulated air was bubbled through the sample and the change in CO2 concentration in the headspace was measured over time using an EGM-4 infrared gas analyzer (PP Systems, Amesbury, USA) until the concentration was constant (10–12 min). The initial partial pressure of dissolved CO2 in the sample was then back-calculated from the total change in CO2 concentration in the headspace. A total of seven DIC measurements were taken at the weir between November 2016 and October 2017. The average DIC concentration was multiplied by the hourly discharge and divided by the catchment area to calculate the aquatic C loss as DIC per square meter.
CO2 evasion occurred from the open-water areas of blocked drains on the raised bog and from the functioning drain network upstream of the weir. CO2 evasion was measured in triplicate with a CPY-4 (PP Systems, Amesbury, USA) chamber fitted to a small floating raft and EGM-4 gas analyzer. A total of 15 measurements of CO2 evasion were conducted between two locations of blocked drains on the raised bog (Fig. 1), and eight measurements were conducted just upstream of the weir from November 2016 to July 2017.
For the calculation of the global warming potential, 90 % of the DOC loss is assumed to be converted to CO2 and 10 % to longer-term storage (after Evans et al., 2016), while 100 % of the DOC flux is included in the calculation of the C balance for the system. All of the DIC loss is assumed to be converted to atmospheric CO2 as DIC is almost entirely composed of dissolved supersaturated CO2.
2.8 Statistical analysis
The standard error and statistical significance of model fit parameters in Tables S5 and S6 was determined using Minitab©2018 statistical software with the nonlinear regression function. The differences among ecotypes for C balance, CH4 flux, and GWP was determined using one-way ANOVA with the annual results from the 29 collars grouped by ecotype, which was coupled with the Bonferroni honestly significant difference for multiple pair-wise comparisons. The statistical significance of ecotype annual C sinks or sources was determined using a Student's t test of the five or six collars in the ecotype. The significance of linear trends was determined using a Microsoft Excel© data analysis package.
2.9 Comparisons with global studies of boreal and temperate peatlands
The annual NEE, CH4 flux, and water table data from the ecotypes in this study were compared to global studies of boreal and temperate peatlands. The data from global studies were divided into three generic categories as follows: intact peatlands – those peatlands that have not been mined, undergone intensive agriculture or forestry, and are not heavily impacted by drainage or other disturbance; bare peat sites – previous peat extraction sites where there is an absence of vegetation cover; degraded/restored/recovering peatlands – peatlands that have (at some point in time) been substantially altered by previous/current land use, drainage, or peat extraction, where recovering is defined here as the “spontaneous revegetation of mined peatlands” (Poulin et al., 2005), which have had no definite action taken to rehabilitate them. This compilation of data focuses on low-nutrient (if specified, pH<6) seminatural sites, i.e., excludes sites that are actively used for intensive agriculture, forestry, or other uses.
3.1 Environmental monitoring
The annual rainfall measured at Abbeyleix Bog was 746 mm in 2016 and 840 mm in 2017, compared to the 2001–2017 (the period of record) annual average of 862±134 mm at the Ballyroan (Oatlands) daily rainfall station, located approximately 5 km NE of the site. The mean annual temperature at Abbeyleix Bog was 9.6 and 9.7 ∘C in 2016 and 2017, similar to the 30-year average (1981–2010) of 9.5 ∘C based on a gridded interpolation of Irish climate (Walsh, 2012). Mean daily PPFD, air temperature, and monthly rainfall are shown in Fig. 2 over the study period. The mean annual water table (MAWT) was within 2 cm between the 2 years for all ecotypes. The winter (October–March) water table was higher than the summer (April–September) water table, as expected (Fig. 3). The average soil pore water pH was 4.7 (range: 4.4–5.1) for all ecotypes.
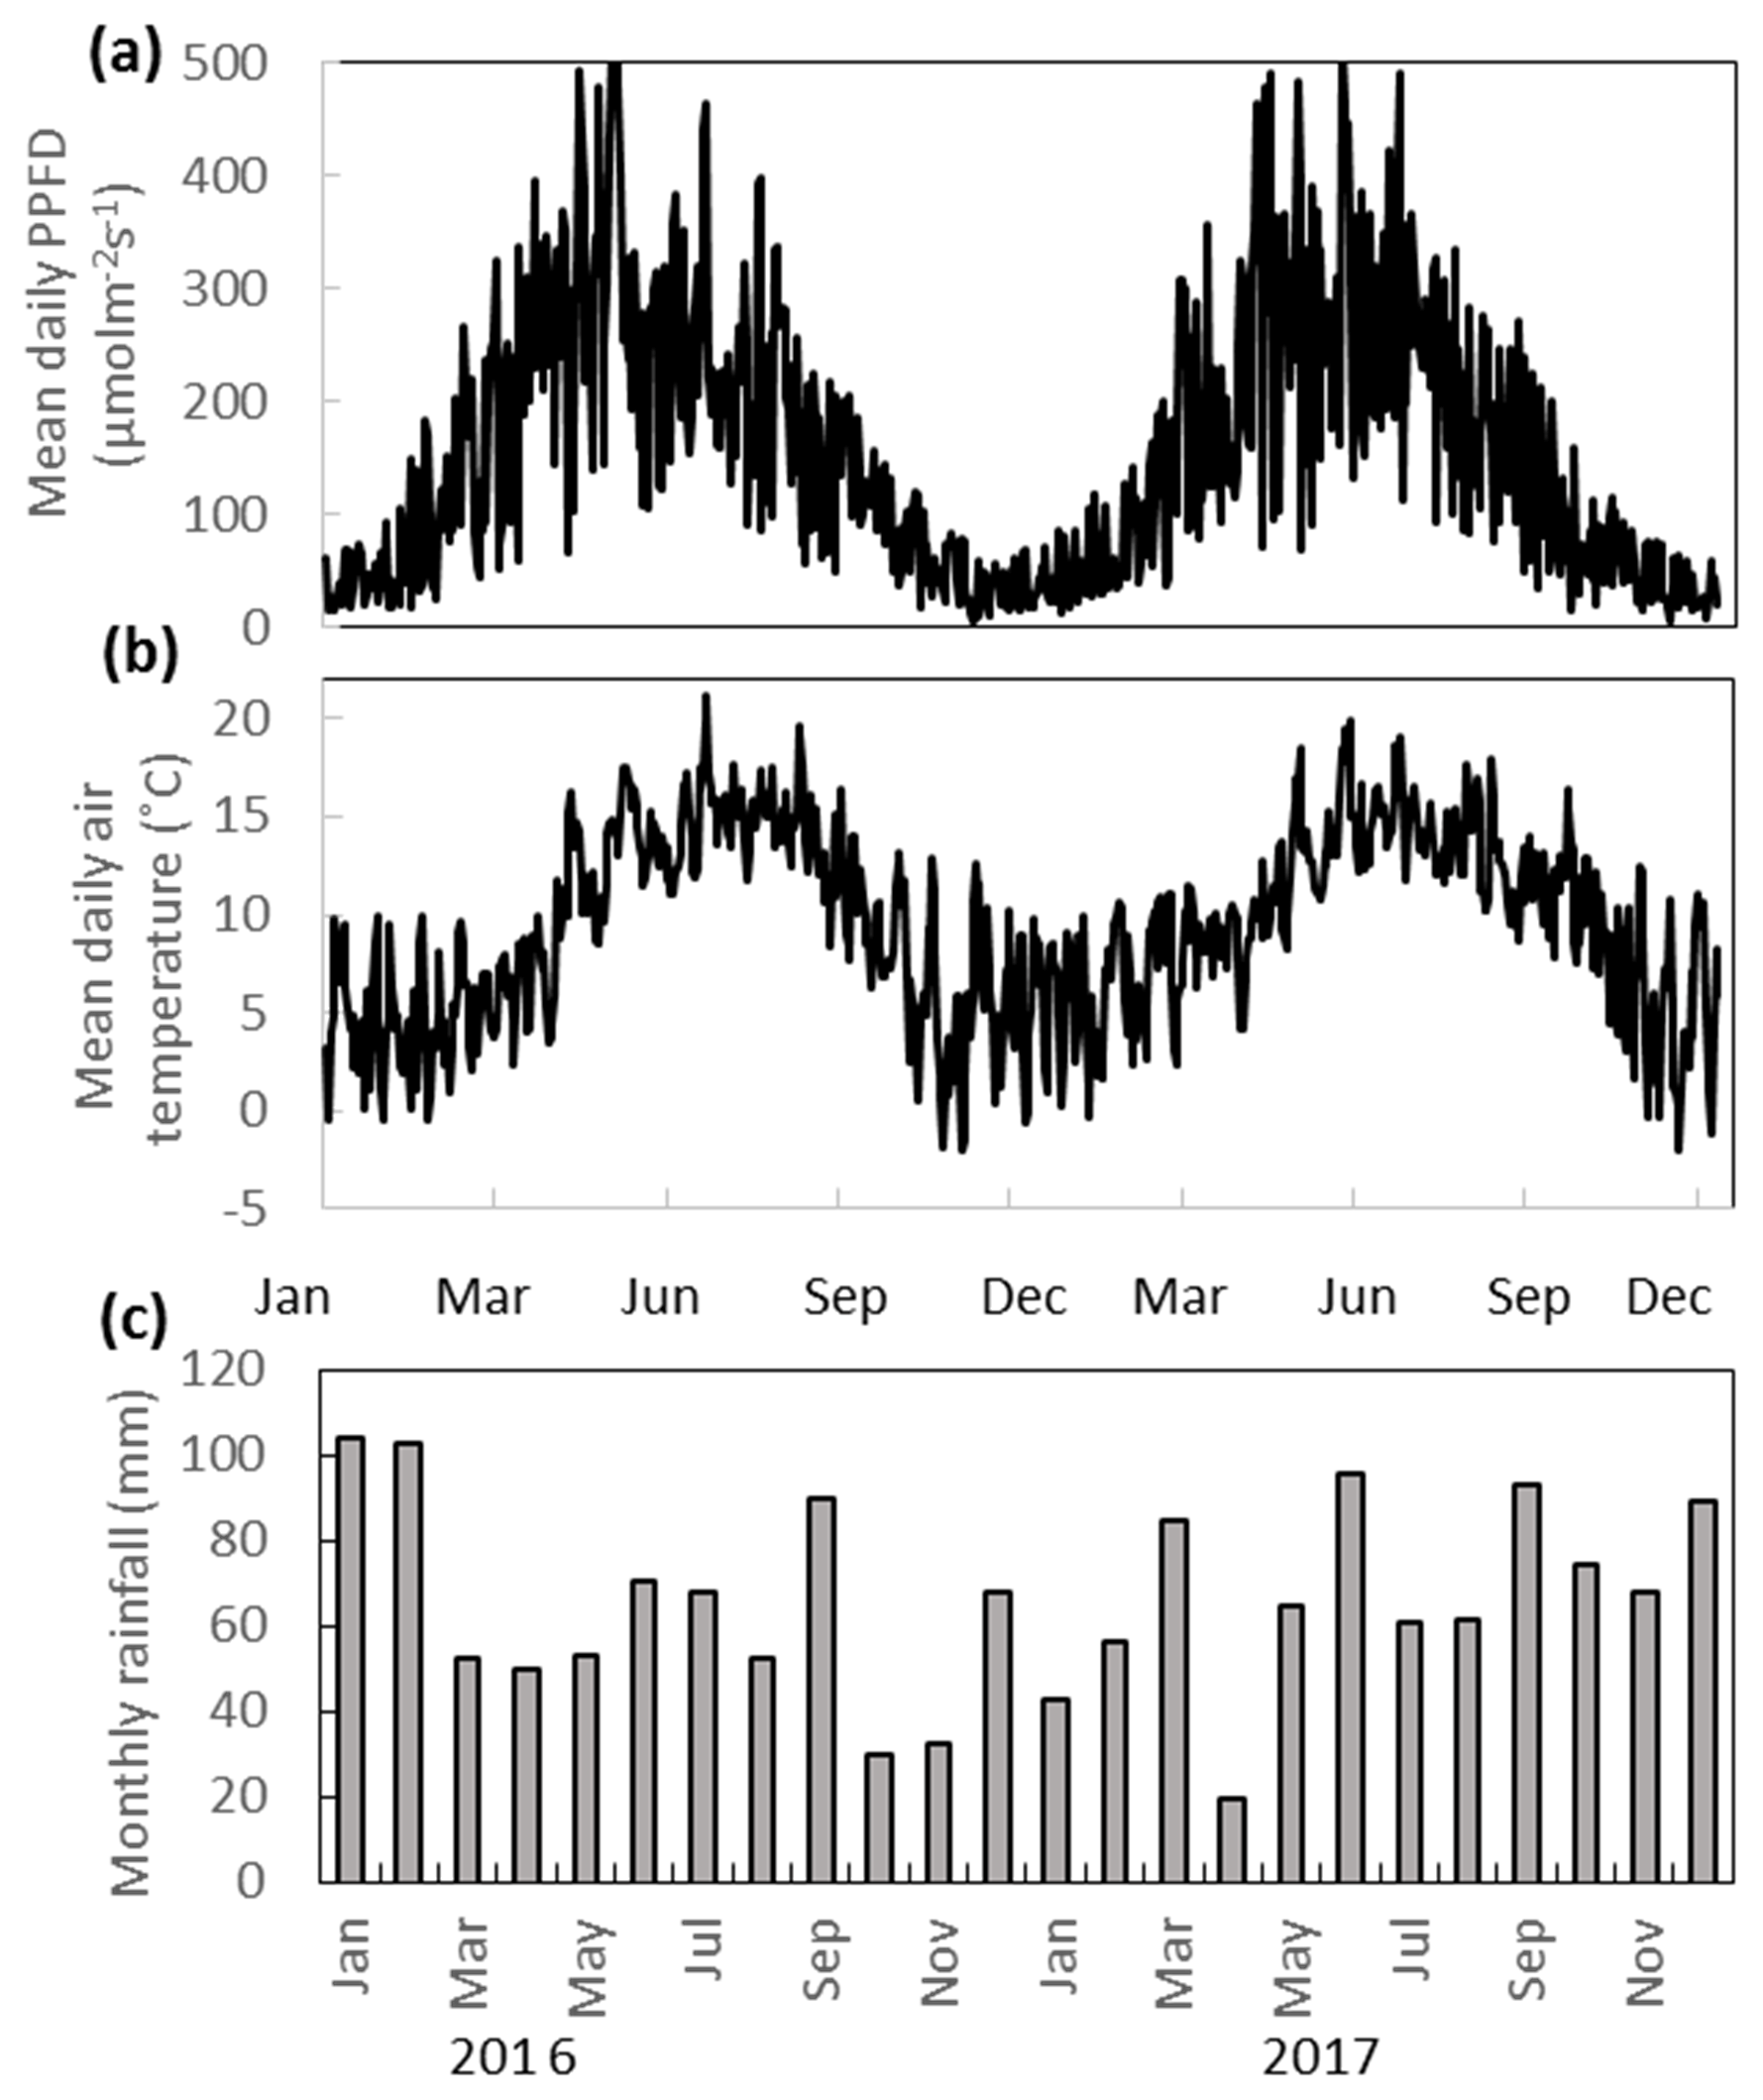
Figure 2(a) Mean daily PPFD, (b) mean daily temperature, and (c) monthly rainfall at Abbeyleix Bog in 2016 and 2017.
3.2 CO2 and CH4 gas fluxes
The modeled annual GPP, ER, and NEE for each collar is shown in (Table S8). The ecotype CO2 fluxes were calculated as the average of all collars in each ecotype. The seasonal trend in modeled monthly GPP and ER was similar among all ecotypes, increasing in magnitude during the summer and decreasing during the winter (Fig. 4a, b). The Sphagnum cutover ecotype had the largest monthly GPP from January to June both years. The monthly ER was highest at the Calluna cutover ecotype, especially during the summer months. The ecotypes show different seasonal trends in cumulative NEE (Fig. 4c). The Sphagnum cutover and the subcentral ecotypes were net CO2 sinks (negative slope) from March (27 March for subcentral and 4 March for Sphagnum cutover) to 24 October 2016 and 24 April to 7 October 2017 and CO2 sources the rest of the year, showing an overall pattern similar to in other studies of intact peatlands (e.g., Gažovič et al., 2013). The submarginal ecotype is an overall moderate CO2 source both years with a minor net CO2 uptake occurring during the summer of 2017. The Eriophorum cutover ecotype is approximately CO2 neutral for much of the year with short periods of CO2 uptake during the summer months. Some caution should be applied to interpreting the 2017 NEE data because the field measurements of NEE were conducted for 8 months of 2017 (January–August), although the field measurements in 2017 did encompass the warmest months of the year when the largest variation in NEE occurred.
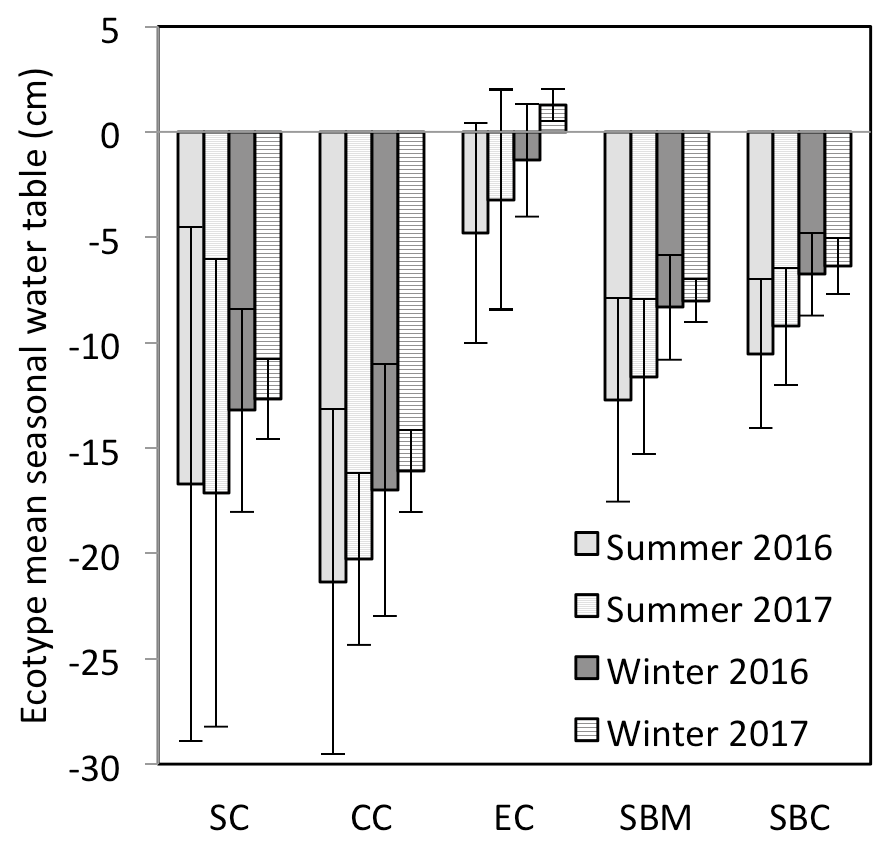
Figure 3Mean seasonal water table for each of the ecotypes for summer (April–September) and winter (October–March), for which the mean annual water table is measured with respect to the springtime peat surface or Sphagnum surface (if present). The ecotypes are abbreviated as SC for Sphagnum cutover, CC for Calluna cutover, EC for Eriophorum cutover, SBM for submarginal, and SBC for subcentral.
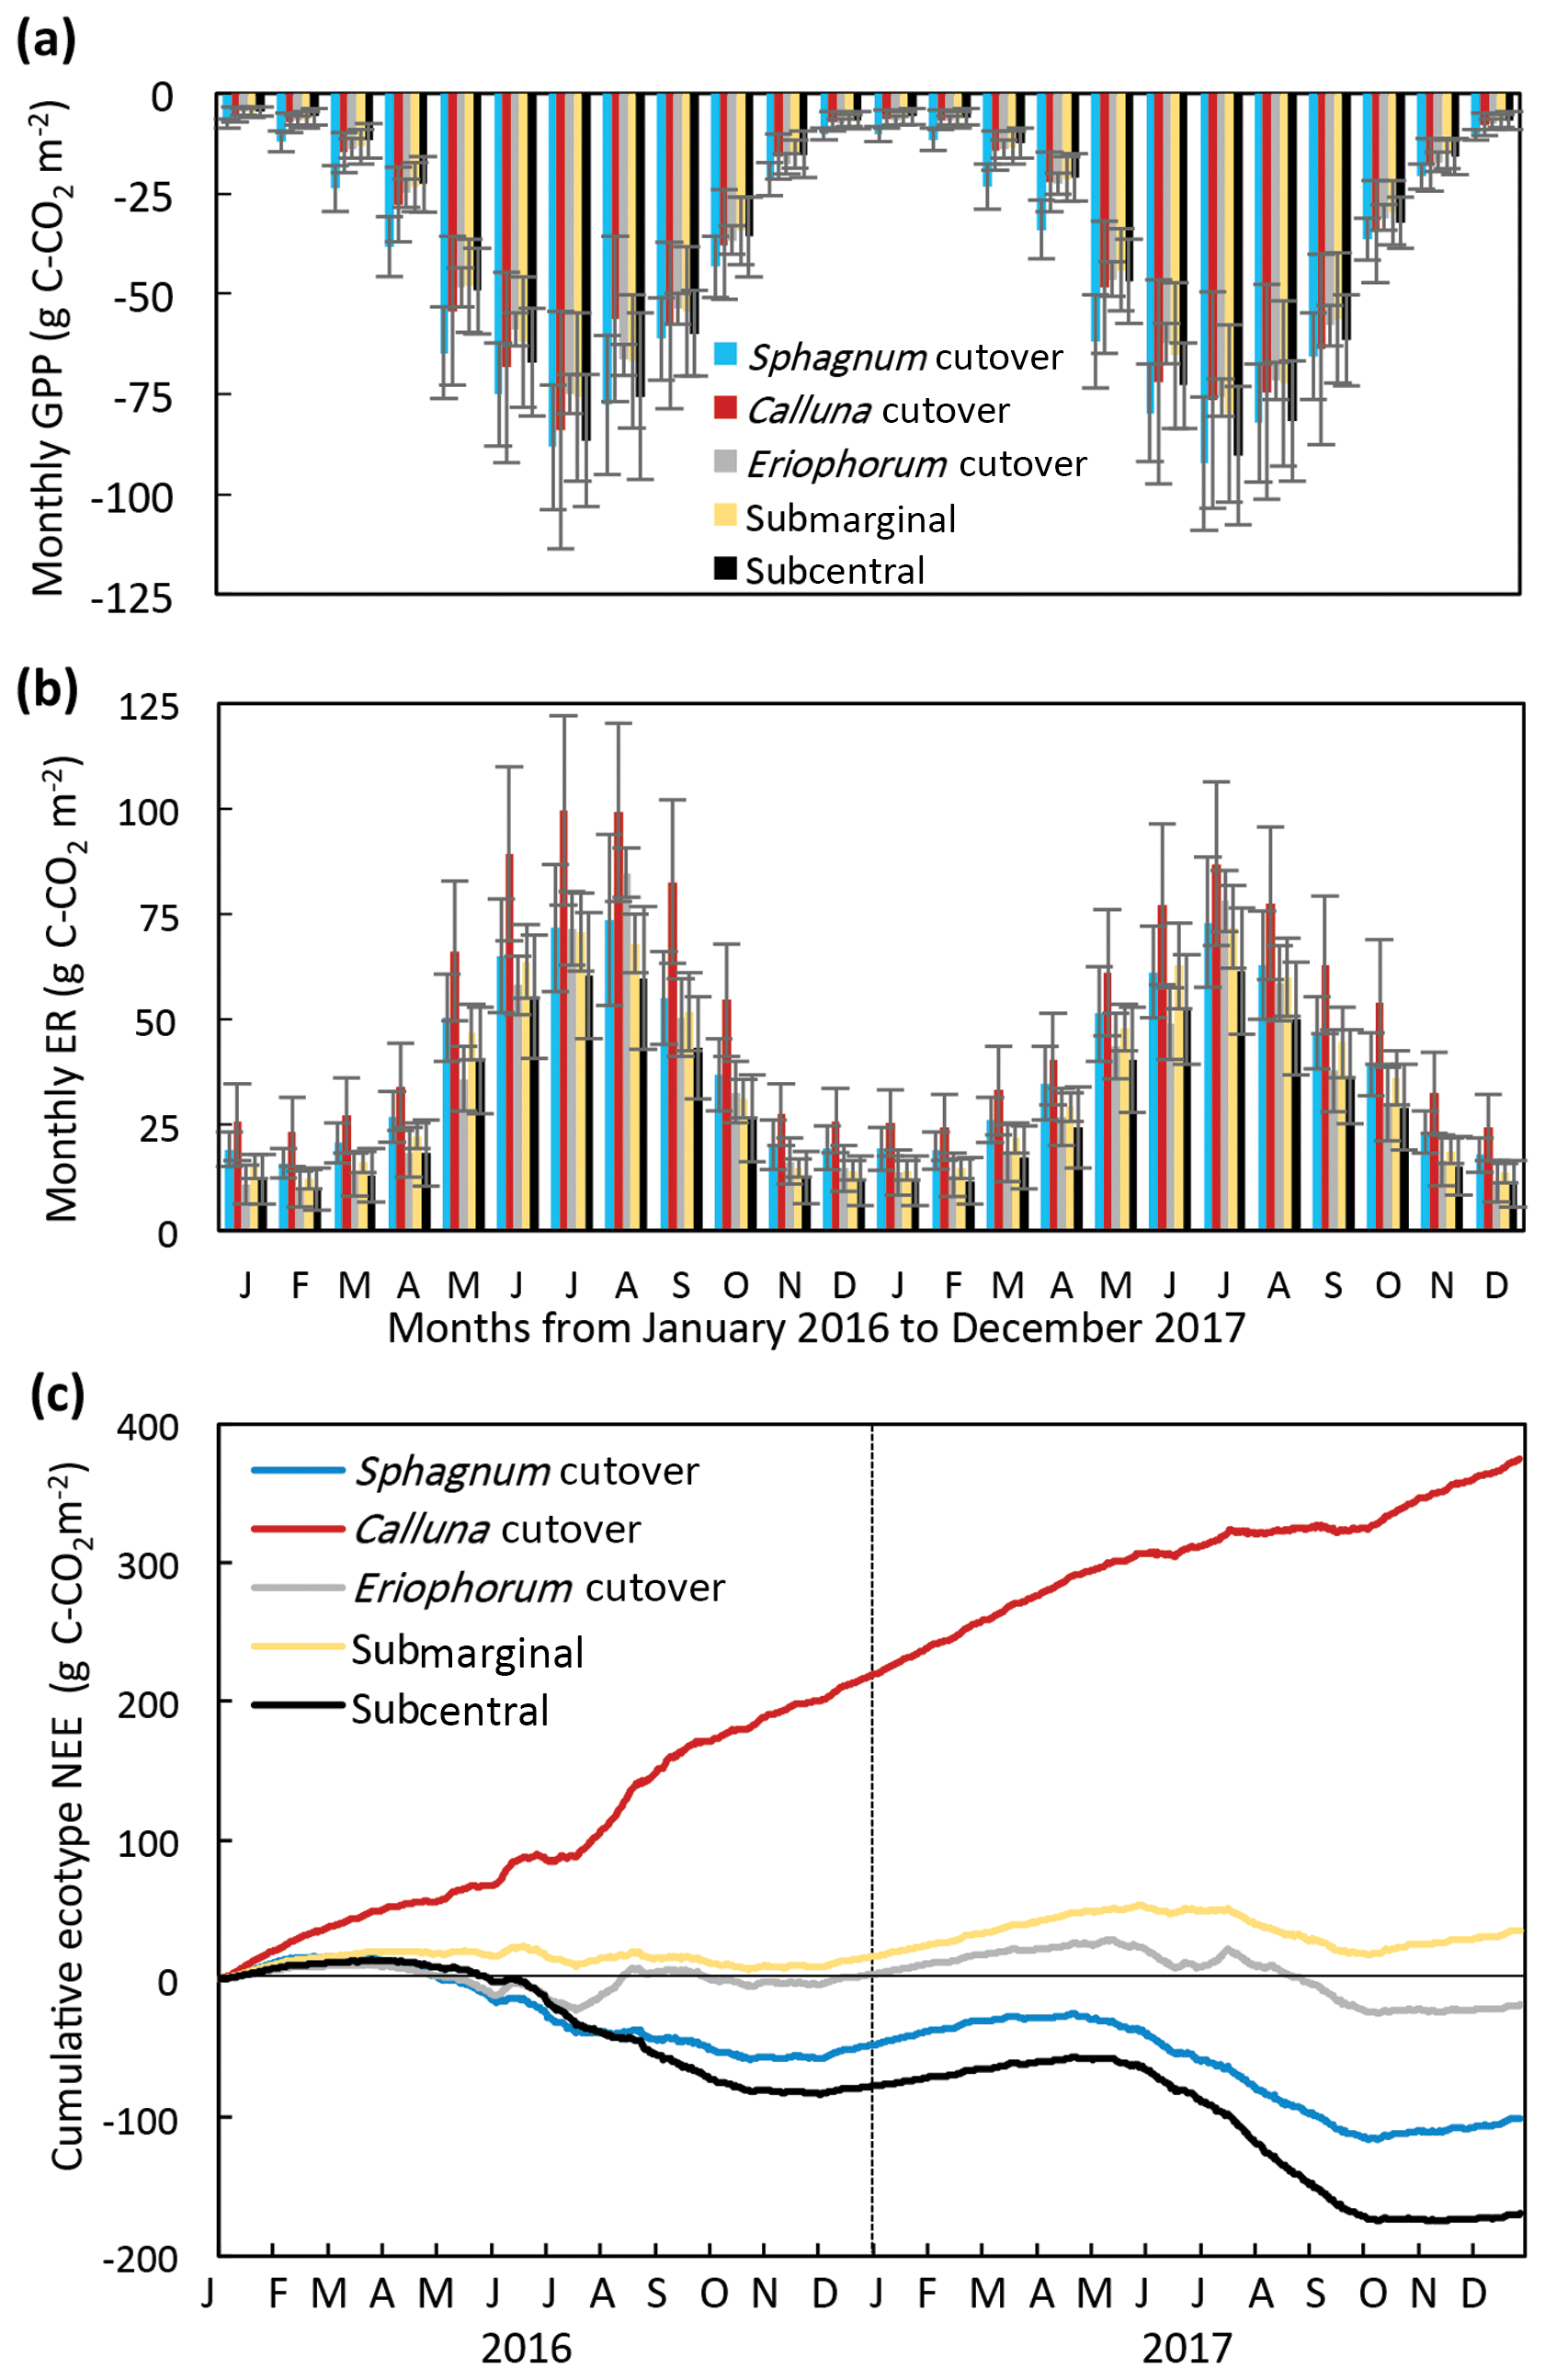
Figure 4Monthly (a) GPP and (b) ER and (c) cumulative NEE for each ecotype for 2016 and 2017, for which the ecotype values are the average of all collars in the ecotype.
The temporal variation in measured CH4 flux followed a seasonal trend, becoming larger and more variable during the summer months, which was captured reasonably well by the model (Figs. 5, S2). Annual CH4 fluxes by ecotype are shown in Fig. 6 and for each collar in Table S8. The annual CH4 emissions are highest for the Eriophorum cutover (14.2±4.8 g C-CH4 m−2 yr−1) and subcentral ecotypes (12.6±7.9 g C-CH4 m−2 yr−1), which have the highest MAWT. The annual CH4 flux at the subcentral ecotype is highly variable with a range of 1.2 to 19.3 g C-CH4 m−2 yr−1 among collars. The annual CH4 flux is lowest for the Calluna cutover ecotype (2.7±1.4 g C-CH4 m−2 yr−1).
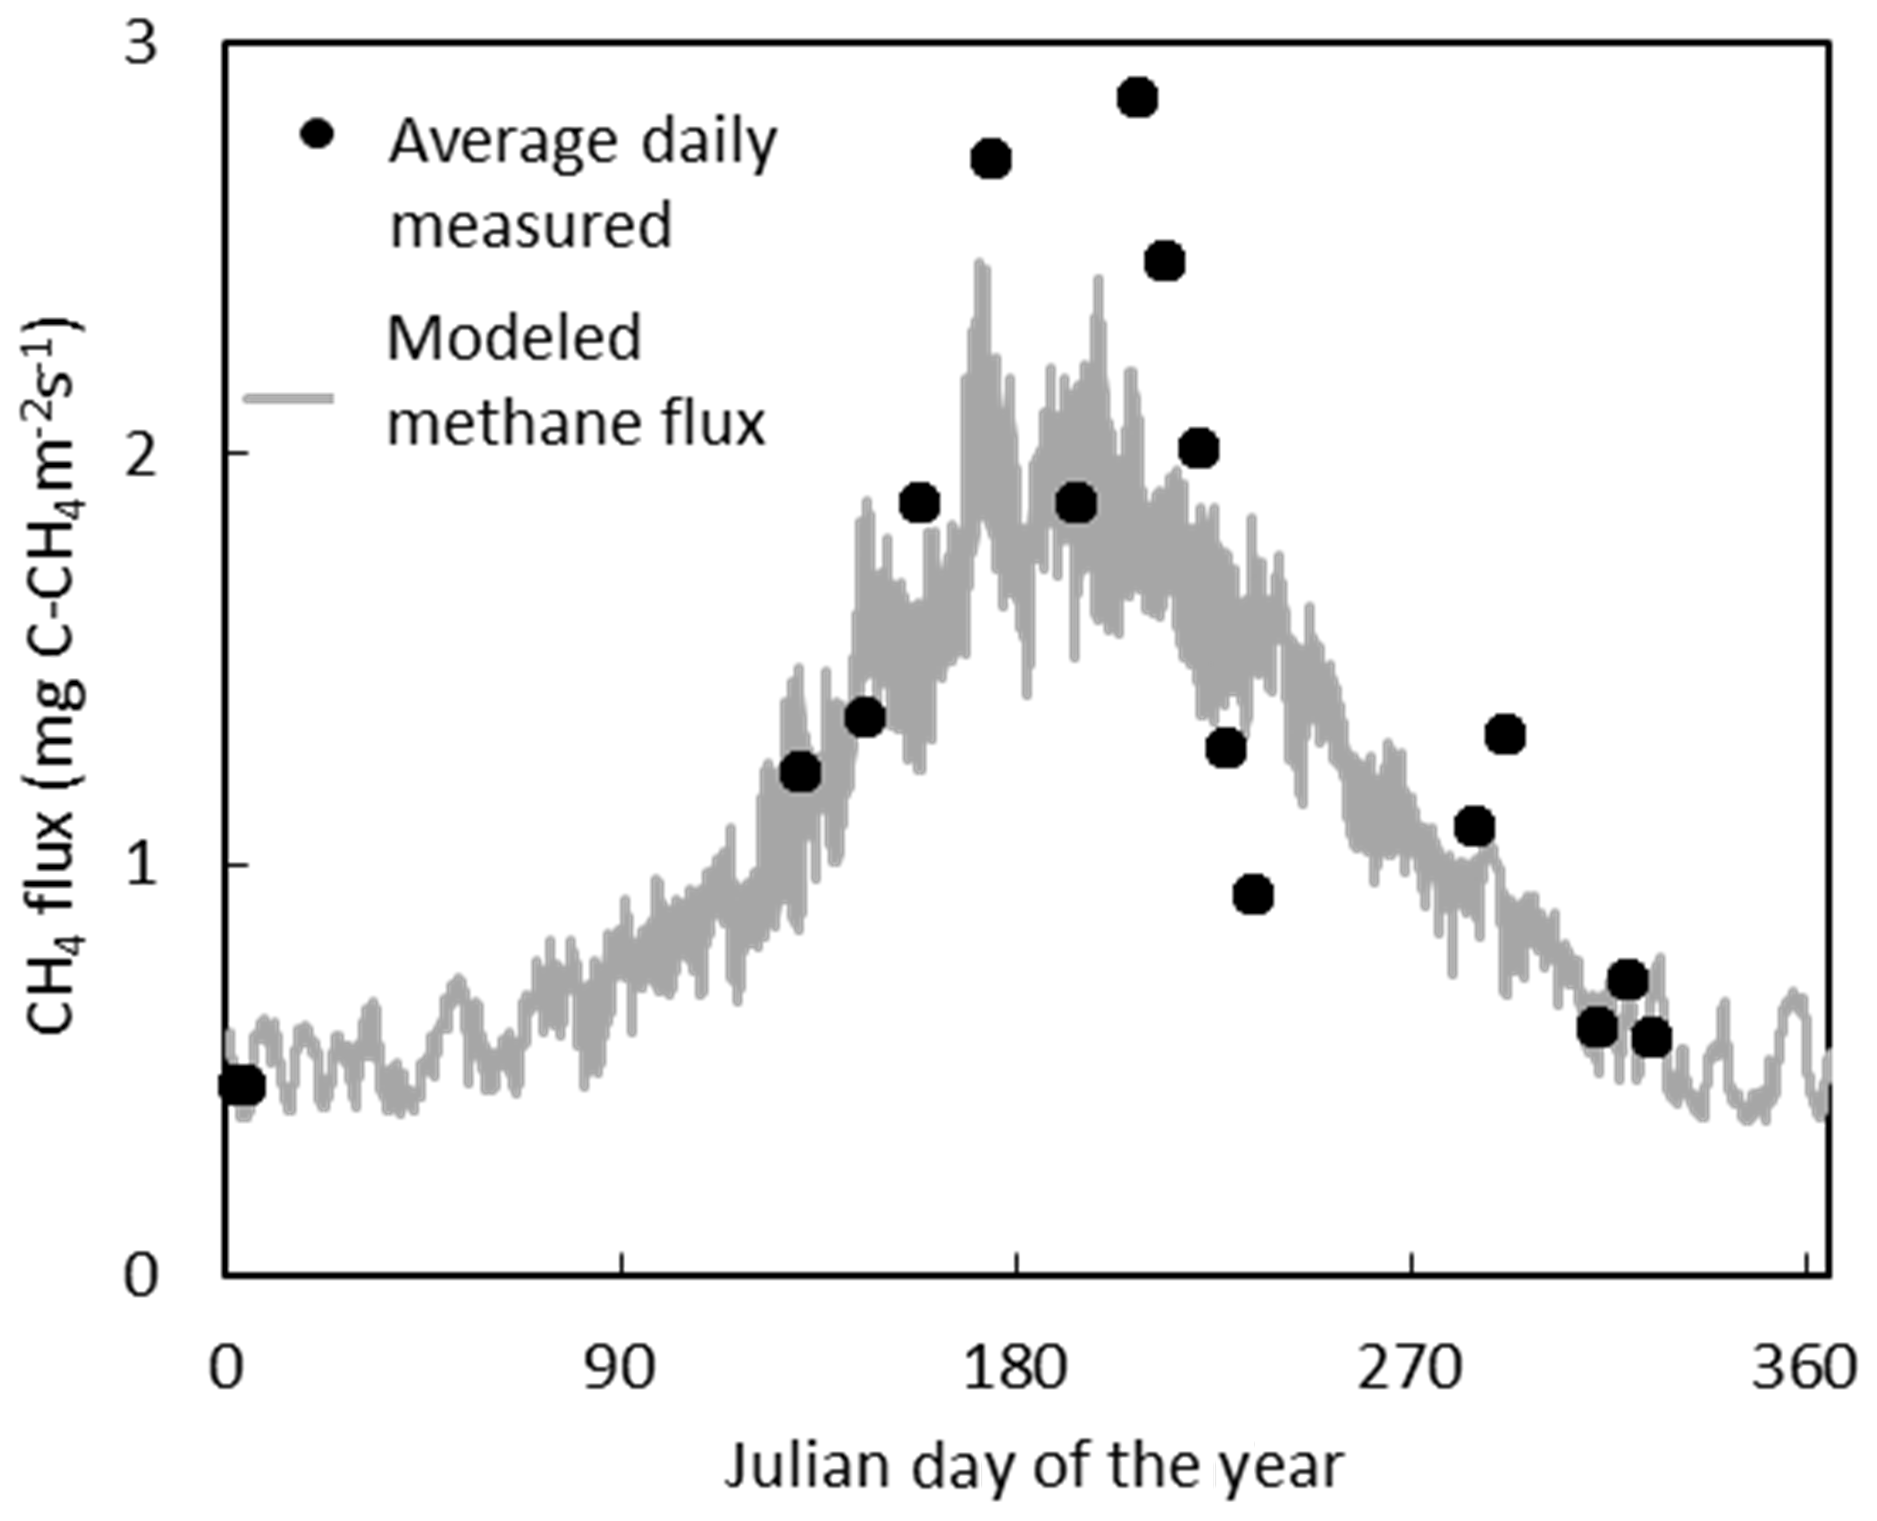
Figure 5The average daily CH4 flux measured in the field compared to the modeled temporal fluctuations in CH4 flux for 2017.
3.3 Aquatic C losses
The DOC concentrations showed a seasonal trend for both years – higher between approximately June and November (46.0±3.0 mg L−1) and lower between December and May (34.5±2.3 mg L−1) (Fig. 7). No trend in DOC concentration was observed with respect to discharge. The discharge at the weir site was much higher in the winter months, with a resulting higher total DOC flux over those months. Annual losses of DOC were 8.0±1.6 and 12.8±2.5 g C m−2 yr−1 for 2016 and 2017, respectively. Seven DIC measurements were conducted at the weir site between November 2016 and October 2017. The average DIC concentration at the weir was 4.6±1.1 mg L−1, excluding one low outlier (2.2 mg L−1) on 2 June 2017 (Fig. 7). Based on this limited number of data there is no significant trend in DIC concentration with respect to season, temperature, or discharge, so it was assumed constant throughout the 2-year study period. Annual C losses as DIC were 1.1±0.2 and 1.5±0.3 g C m−2 yr−1. These values of annual aquatic C loss for DOC and DIC were applied to each of the ecotypes equally when calculating the C balance and GWP. Open-water CO2 evasion was measured for two blocked drains on the raised bog and just upstream of the weir. The average CO2 evasion rate from the two blocked drains on the western and eastern portions of the raised bog (WHB and EHB, respectively) (n=15) was mg C-CO2 m−2 s−1 and was somewhat higher at the weir (n=8) as mg C-CO2 m−2 s−1 (Fig. 8).
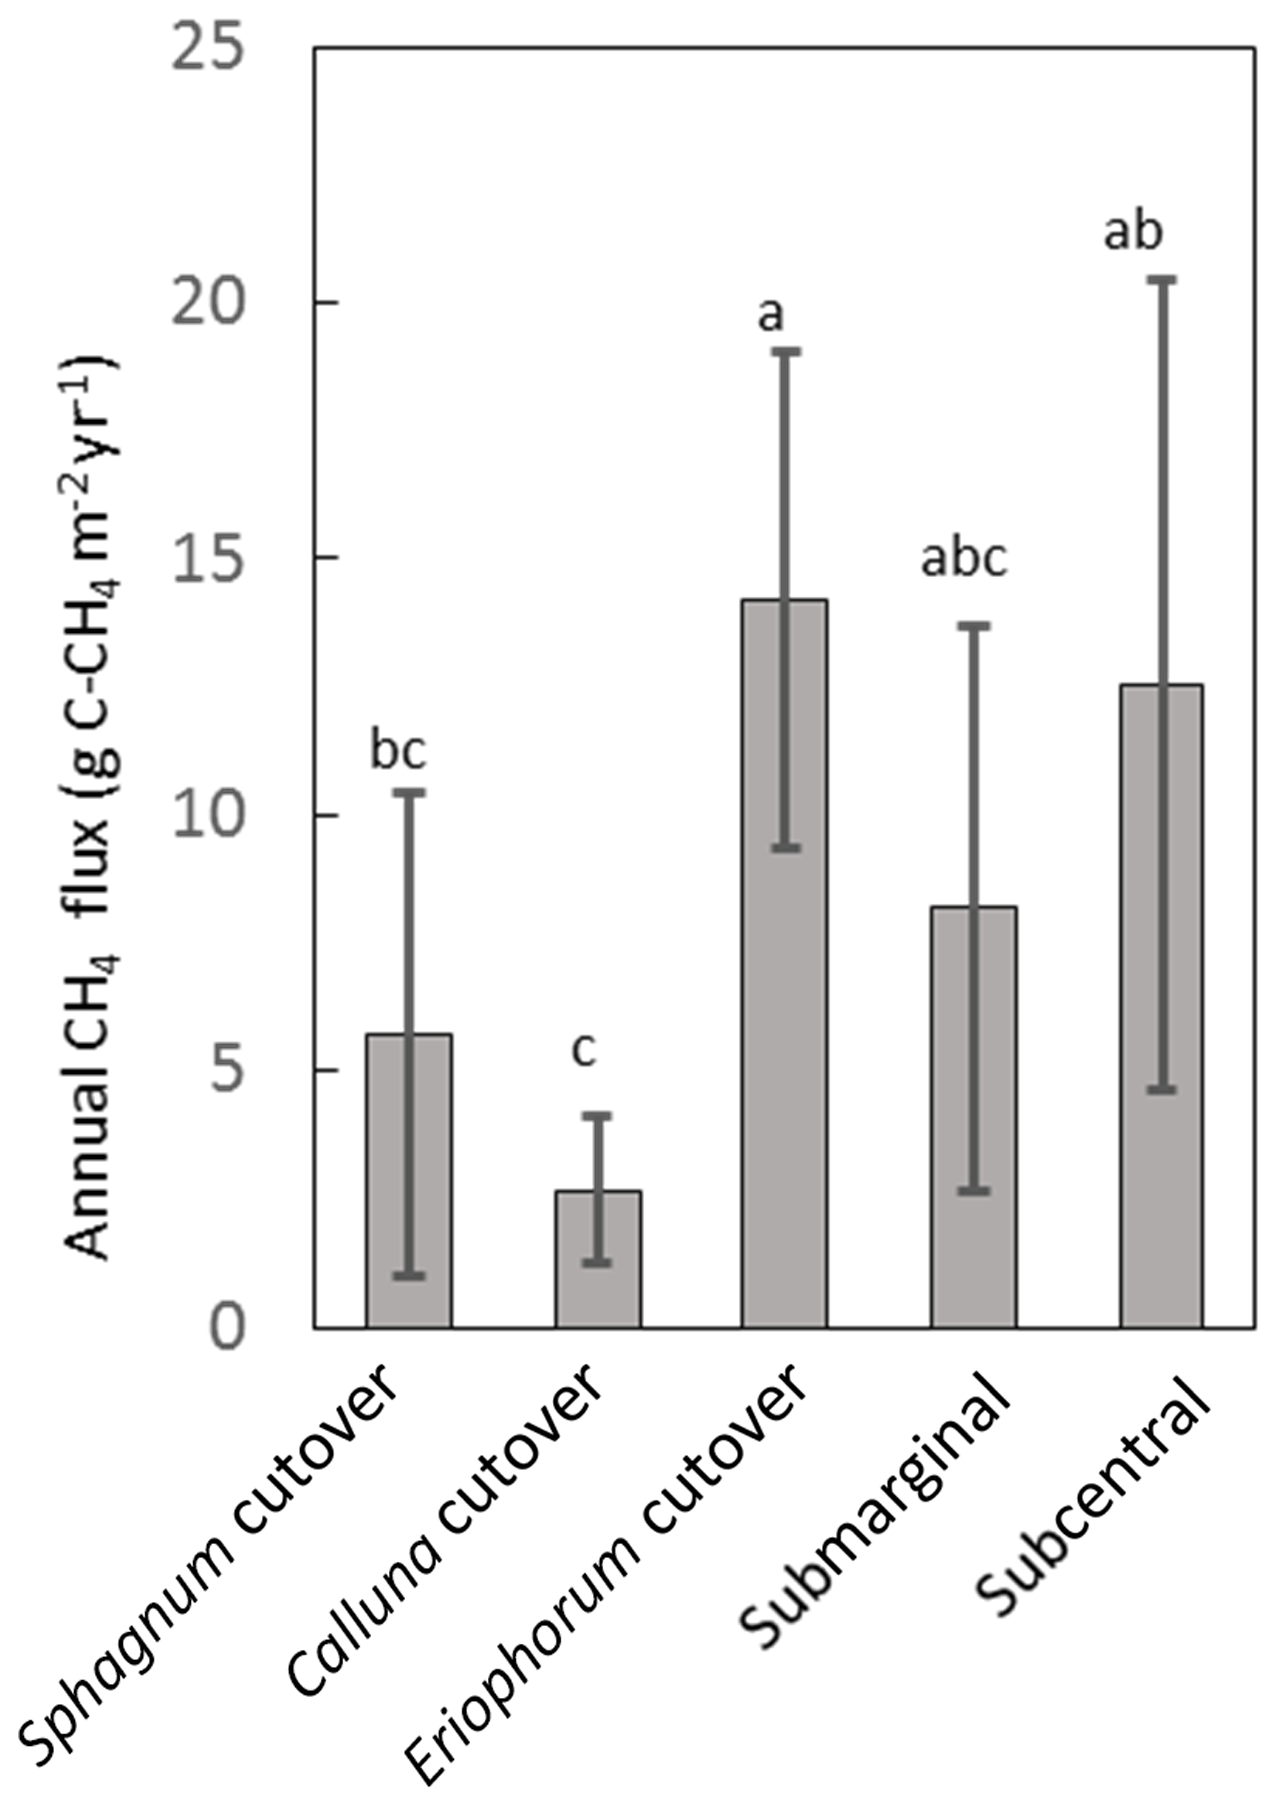
Figure 6Annual CH4 flux for each ecotype averaged over all collars in the ecotype. Shared letters represent no statistically significant difference among ecotypes based on one-way ANOVA with Bonferroni honestly significant difference for pairwise comparisons.
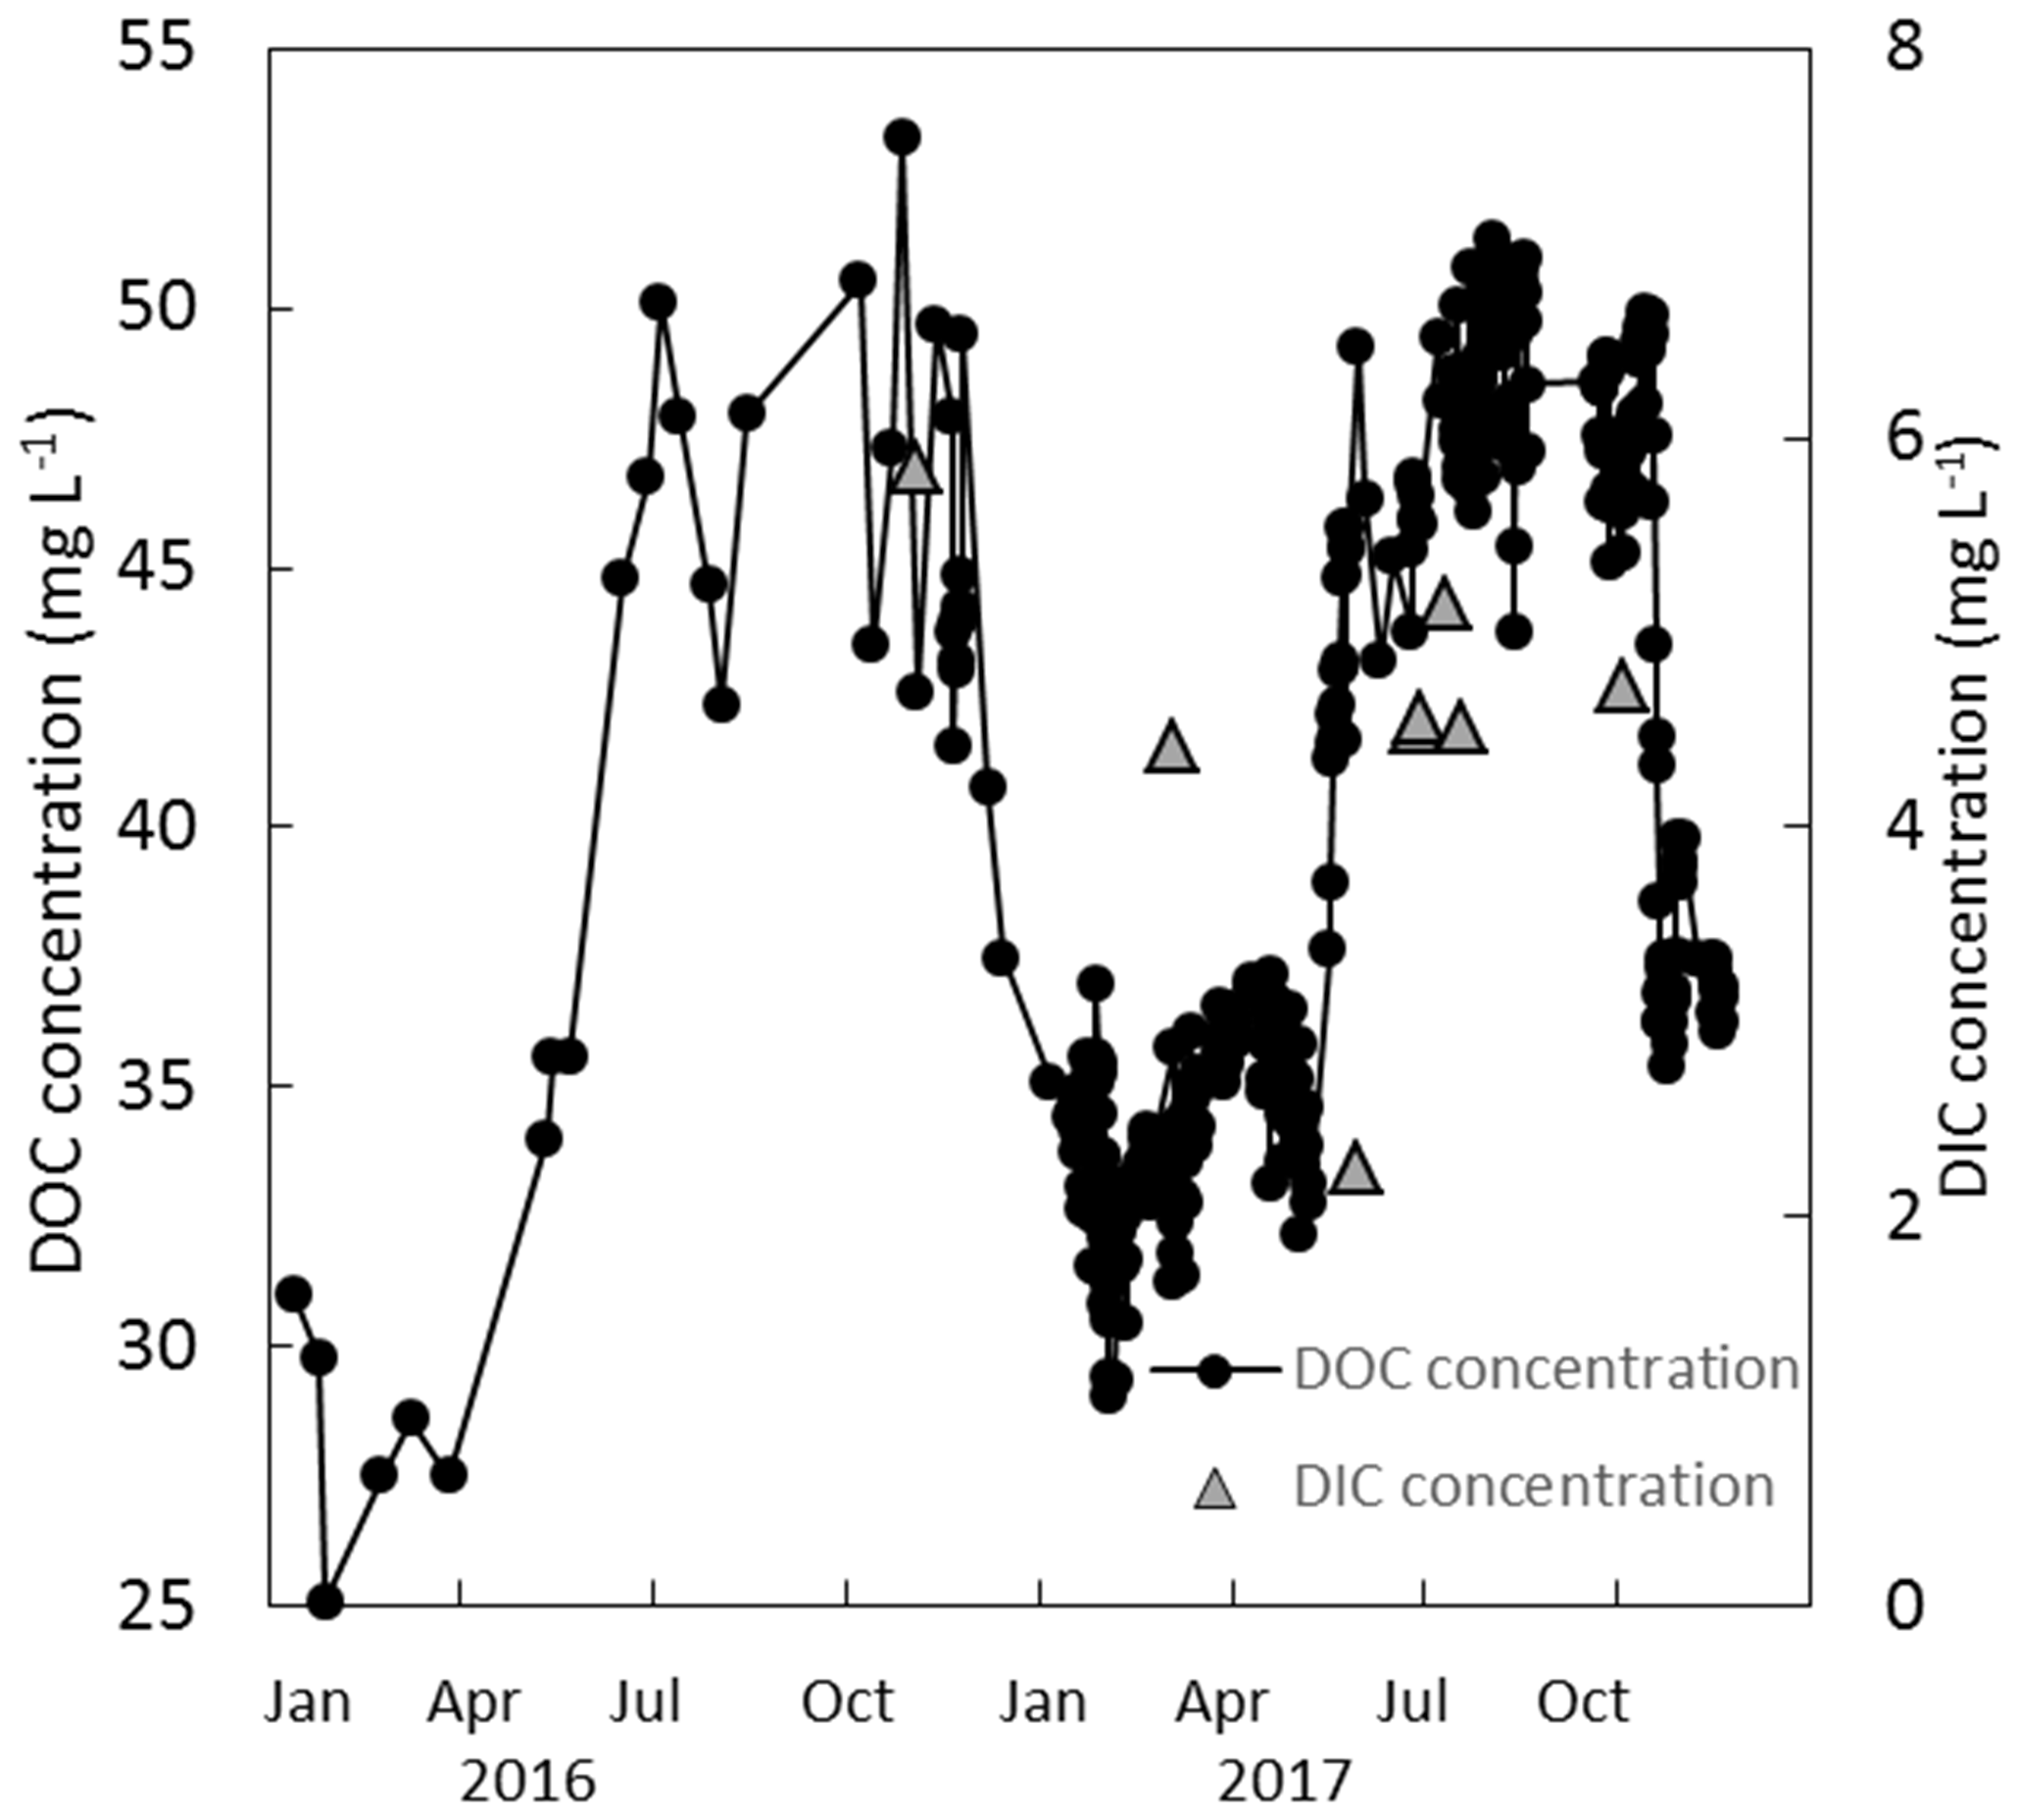
Figure 7Measured DOC and DIC concentrations (mg L−1) over a 2-year period (2016 and 2017) at the weir.
Based on this limited data set, there was no significant trend in evasion rate with respect to season, temperature, or (at the weir site) discharge. CO2 evasion rate was thus assumed constant and extrapolated to give an annual C loss as CO2 evasion of 162±91 g C-CO2 m−2 yr−1 and 290±100 g C-CO2 m−2 yr−1 for open-water blocked ditches and the active drain network of the weir, respectively. The open-water areas in the drain network contributing to the weir were ∼0.9 % of the total catchment area to give a C loss of 2.7±0.9 g C-CO2 m−2 yr−1 for the weir catchment area as a whole. As above, this was applied equally to all ecotypes. Open-water areas of blocked drains only occurred near one of the ecotypes (submarginal), where they were estimated to be 2.8 % of the total surface area. This gives an additional C loss in the submarginal ecotype of 4.5±2.6 g C-CO2 m−2 yr−1.
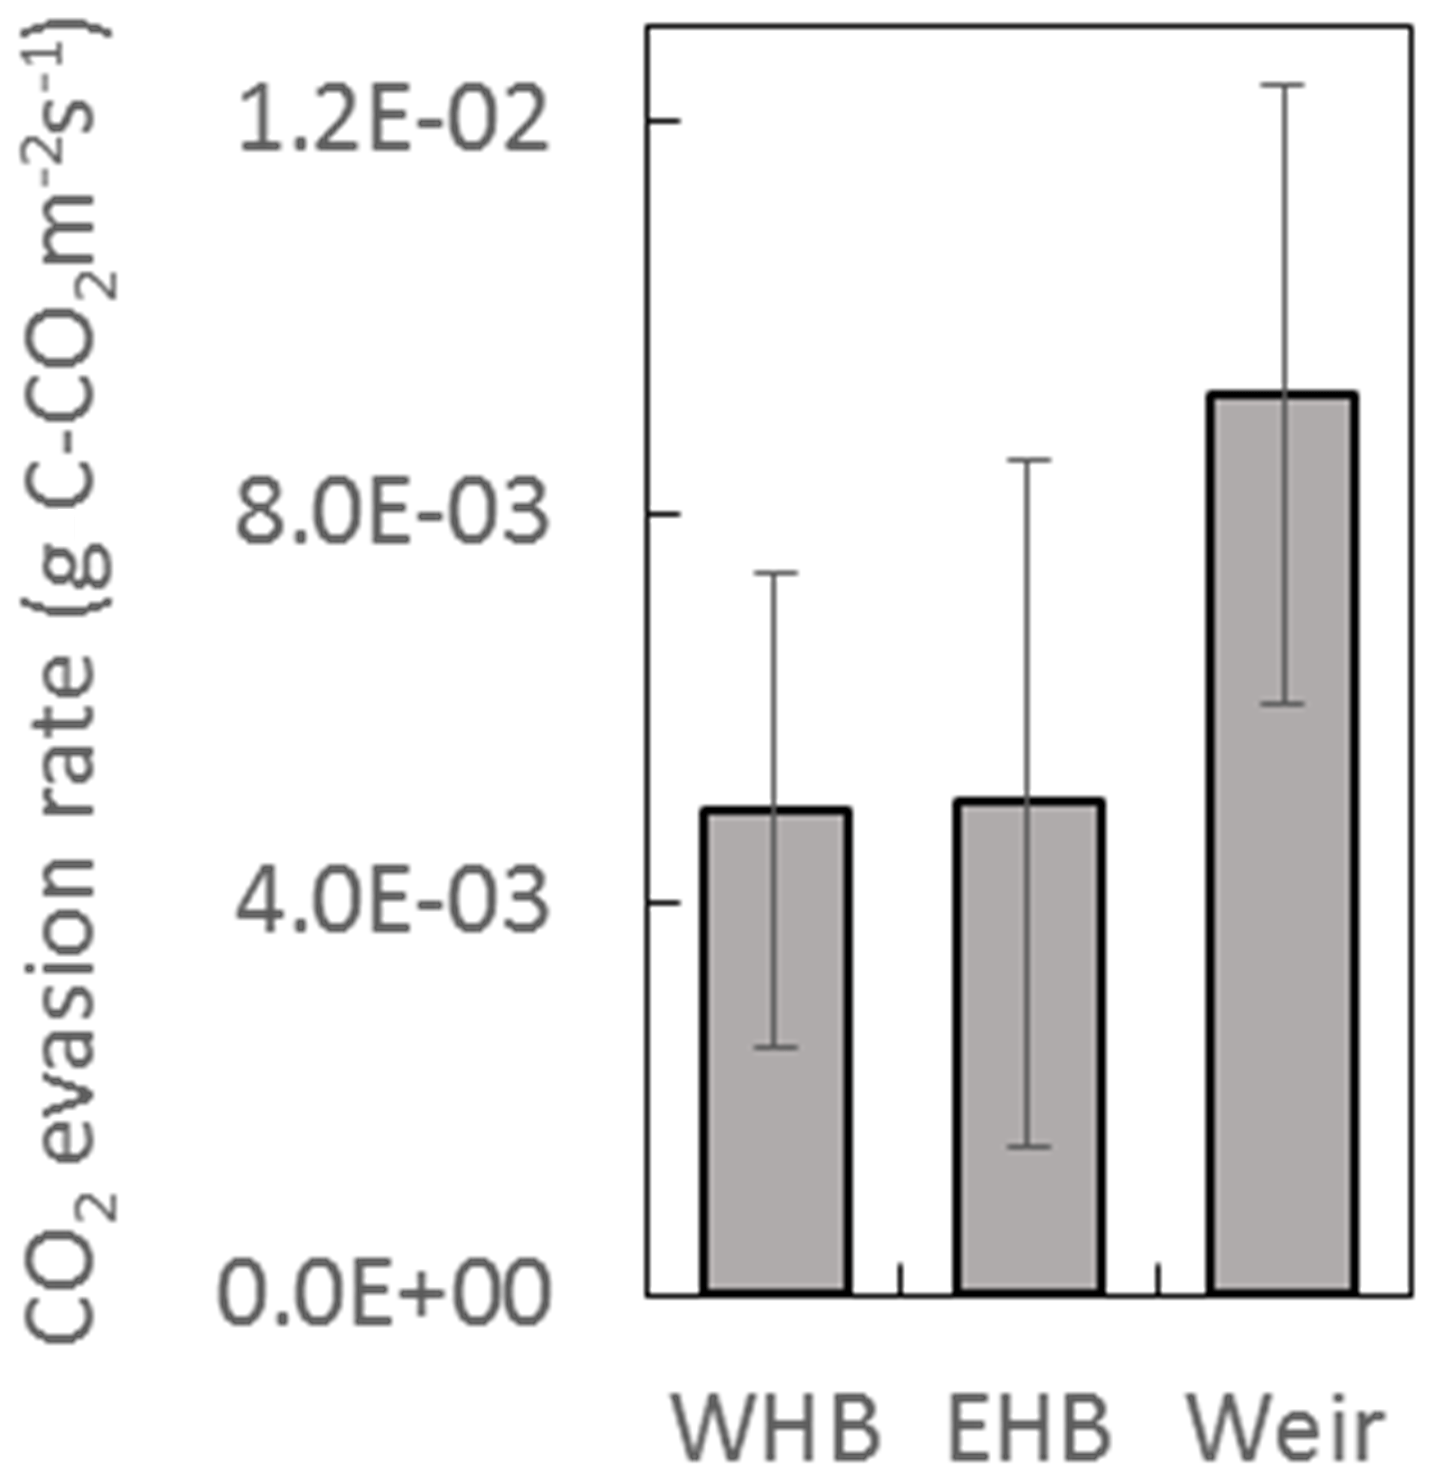
Figure 8CO2 evasion rate measured at two blocked drains on the high bog (WHB and EHB) and just upstream of the weir. Locations of WHB and EHB are shown as white dots in Fig. 1 as is the Weir location. Data were collected between March and July 2017 at the WHB location (n=7), November 2016 and July 2017 at the EHB location (n=8), and December 2016 and July 2017 at the weir location (n=8).
3.4 Carbon balance and GWP by ecotype
The NEE, CH4 fluxes, and aquatic losses of C were compiled to calculate the C balance and GWP for each ecotype (Fig. 9), with collar-specific data shown in Table S8. Two of the ecotypes were on average C sinks both years: the Sphagnum cutover ( g C m−2 yr−1 for 2016 and g C m−2 yr−1 for 2017) and the subcentral ecotypes ( g C m−2 yr−1 for 2016 and g C m−2 yr−1 for 2017), but only the subcentral ecotype was a statistically significant carbon sink based on a Student's t test (p=0.018 in 2016 and p=0.021 in 2017, n=6). The Calluna cutover ecotype was a substantial C source of 234±52 g C-CO2 m−2 yr−1 and 175±61 g C-CO2 m−2 yr−1 for 2016 and 2017, respectively. This ecotype was significantly higher than all the other ecotypes in 2016 (p<0.001) and 2017 (p=0.017) (Fig. 9a). The submarginal, Eriophorum cutover, and Sphagnum cutover ecotypes showed no statistically significant difference from C neutral both years. However, the submarginal ecotype had one collar, which was a low outlier (Table S8); this collar is much more similar ecologically and hydrologically to the subcentral ecotype (Table S7). If this low outlier is removed, then the submarginal ecotype is a significant C source both years (p=0.003 for 2016 and p=0.003 for 2017, n=5), based on a Student's t test. Removing this outlier, the submarginal ecotype is a significant higher C source than the subcentral (p=0.007) and Sphagnum cutover (p=0.046) ecotypes in 2016 and higher than the Sphagnum cutover ecotype, showing marginal significance (p=0.057), in 2017. There is substantial variation among collars within each ecotype for NEE and CH4 flux, which is the largest source of error in ecotype C balance and GWP.
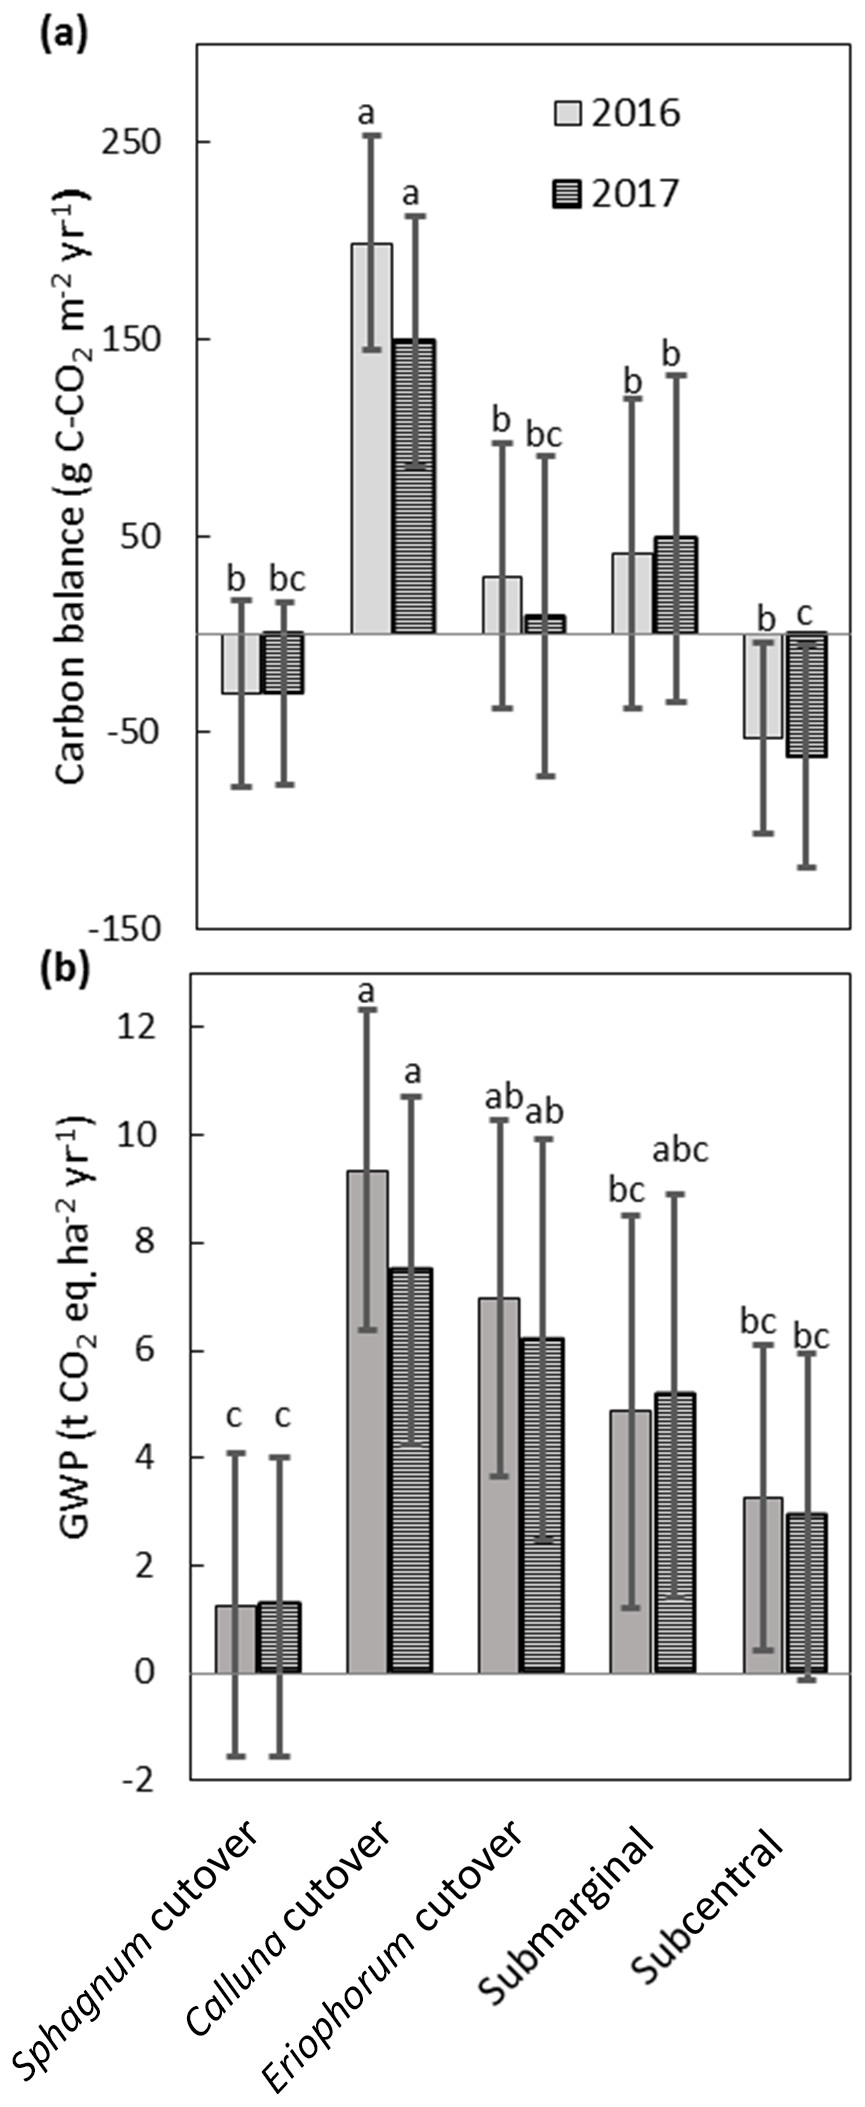
Figure 9(a) Annual C balance for each ecotype including NEE, CH4 flux, aquatic losses as DOC and DIC, and open-water CO2 evasion averaged over all collars in each ecotype. (b) Annual global warming potential for each ecotype. Shared letters represent no statistically significant difference to 95 % confidence among ecotypes based on one-way ANOVA with Bonferroni honestly significant difference for pairwise comparisons. Letters apply for each year separately.
All ecotypes had an average positive GWP both years, with the lowest average GWP of 1.2±2.6 t CO2 eq. m−2 yr−1 at the Sphagnum cutover ecotype and the highest average GWP occurring at the Calluna cutover ecotype of 8.6±3.3 t CO2 eq. m−2 yr−1 (Fig. 9b). The Sphagnum-dominated ecotypes, Sphagnum cutover and subcentral, were on average the lowest GWP sources, with the Sphagnum cutover ecotype lower than the Calluna cutover ecotype to a high degree of significance (p<0.001) and significantly lower (p=0.001 for 2016 and p=0.010 for 2017) than the Eriophorum cutover ecotype both years. The subcentral ecotype was significantly lower (p<0.001 for 2016 and p=0.020 for 2017) than the Calluna cutover ecotype. CH4 emissions account for 13 % and 16 % of the GWP at the Calluna cutover ecotype in 2016 and 2017, respectively. CH4 emissions account for the majority of the total GWP in all other ecotypes (72–210 %). Thus, the differences between ecotype GWP should be interpreted with some caution for 2016, with CH4 flux assumed to be the same as in 2017.
3.5 Drivers of NEE and GWP
Environmental drivers of the annual NEE, CH4 flux, and GWP were analyzed by comparing the data from each of the 29 collars. There is a significant (slope = , p=0.015, n=29) but weak (r2=0.16) negative linear correlation between the 2-year average annual NEE and the MAWT (Fig. 10a). This particular data set is skewed by the Sphagnum cutover ecotype, for which there is a relatively low water table and a moderate CO2 sink due to the presence of Sphagnum spp. hummocks. If the Sphagnum cutover ecotype is excluded, the linear regression between average annual NEE and MAWT is more highly significant (slope = , p=0.003, n=29) with a stronger correlation (r2=0.35). The annual CH4 flux has a significant (slope = 0.57±0.11, p<0.001, n=29) positive linear correlation (r2=0.51) with the average MAWT (Fig. 10b). The trends in CH4 flux and NEE with respect to MAWT offset each other such that there is no trend (slope = 0.04±0.09, p=0.61, n=29, r2<0.01) in GWP with respect to mean annual water table (Fig. 10c).
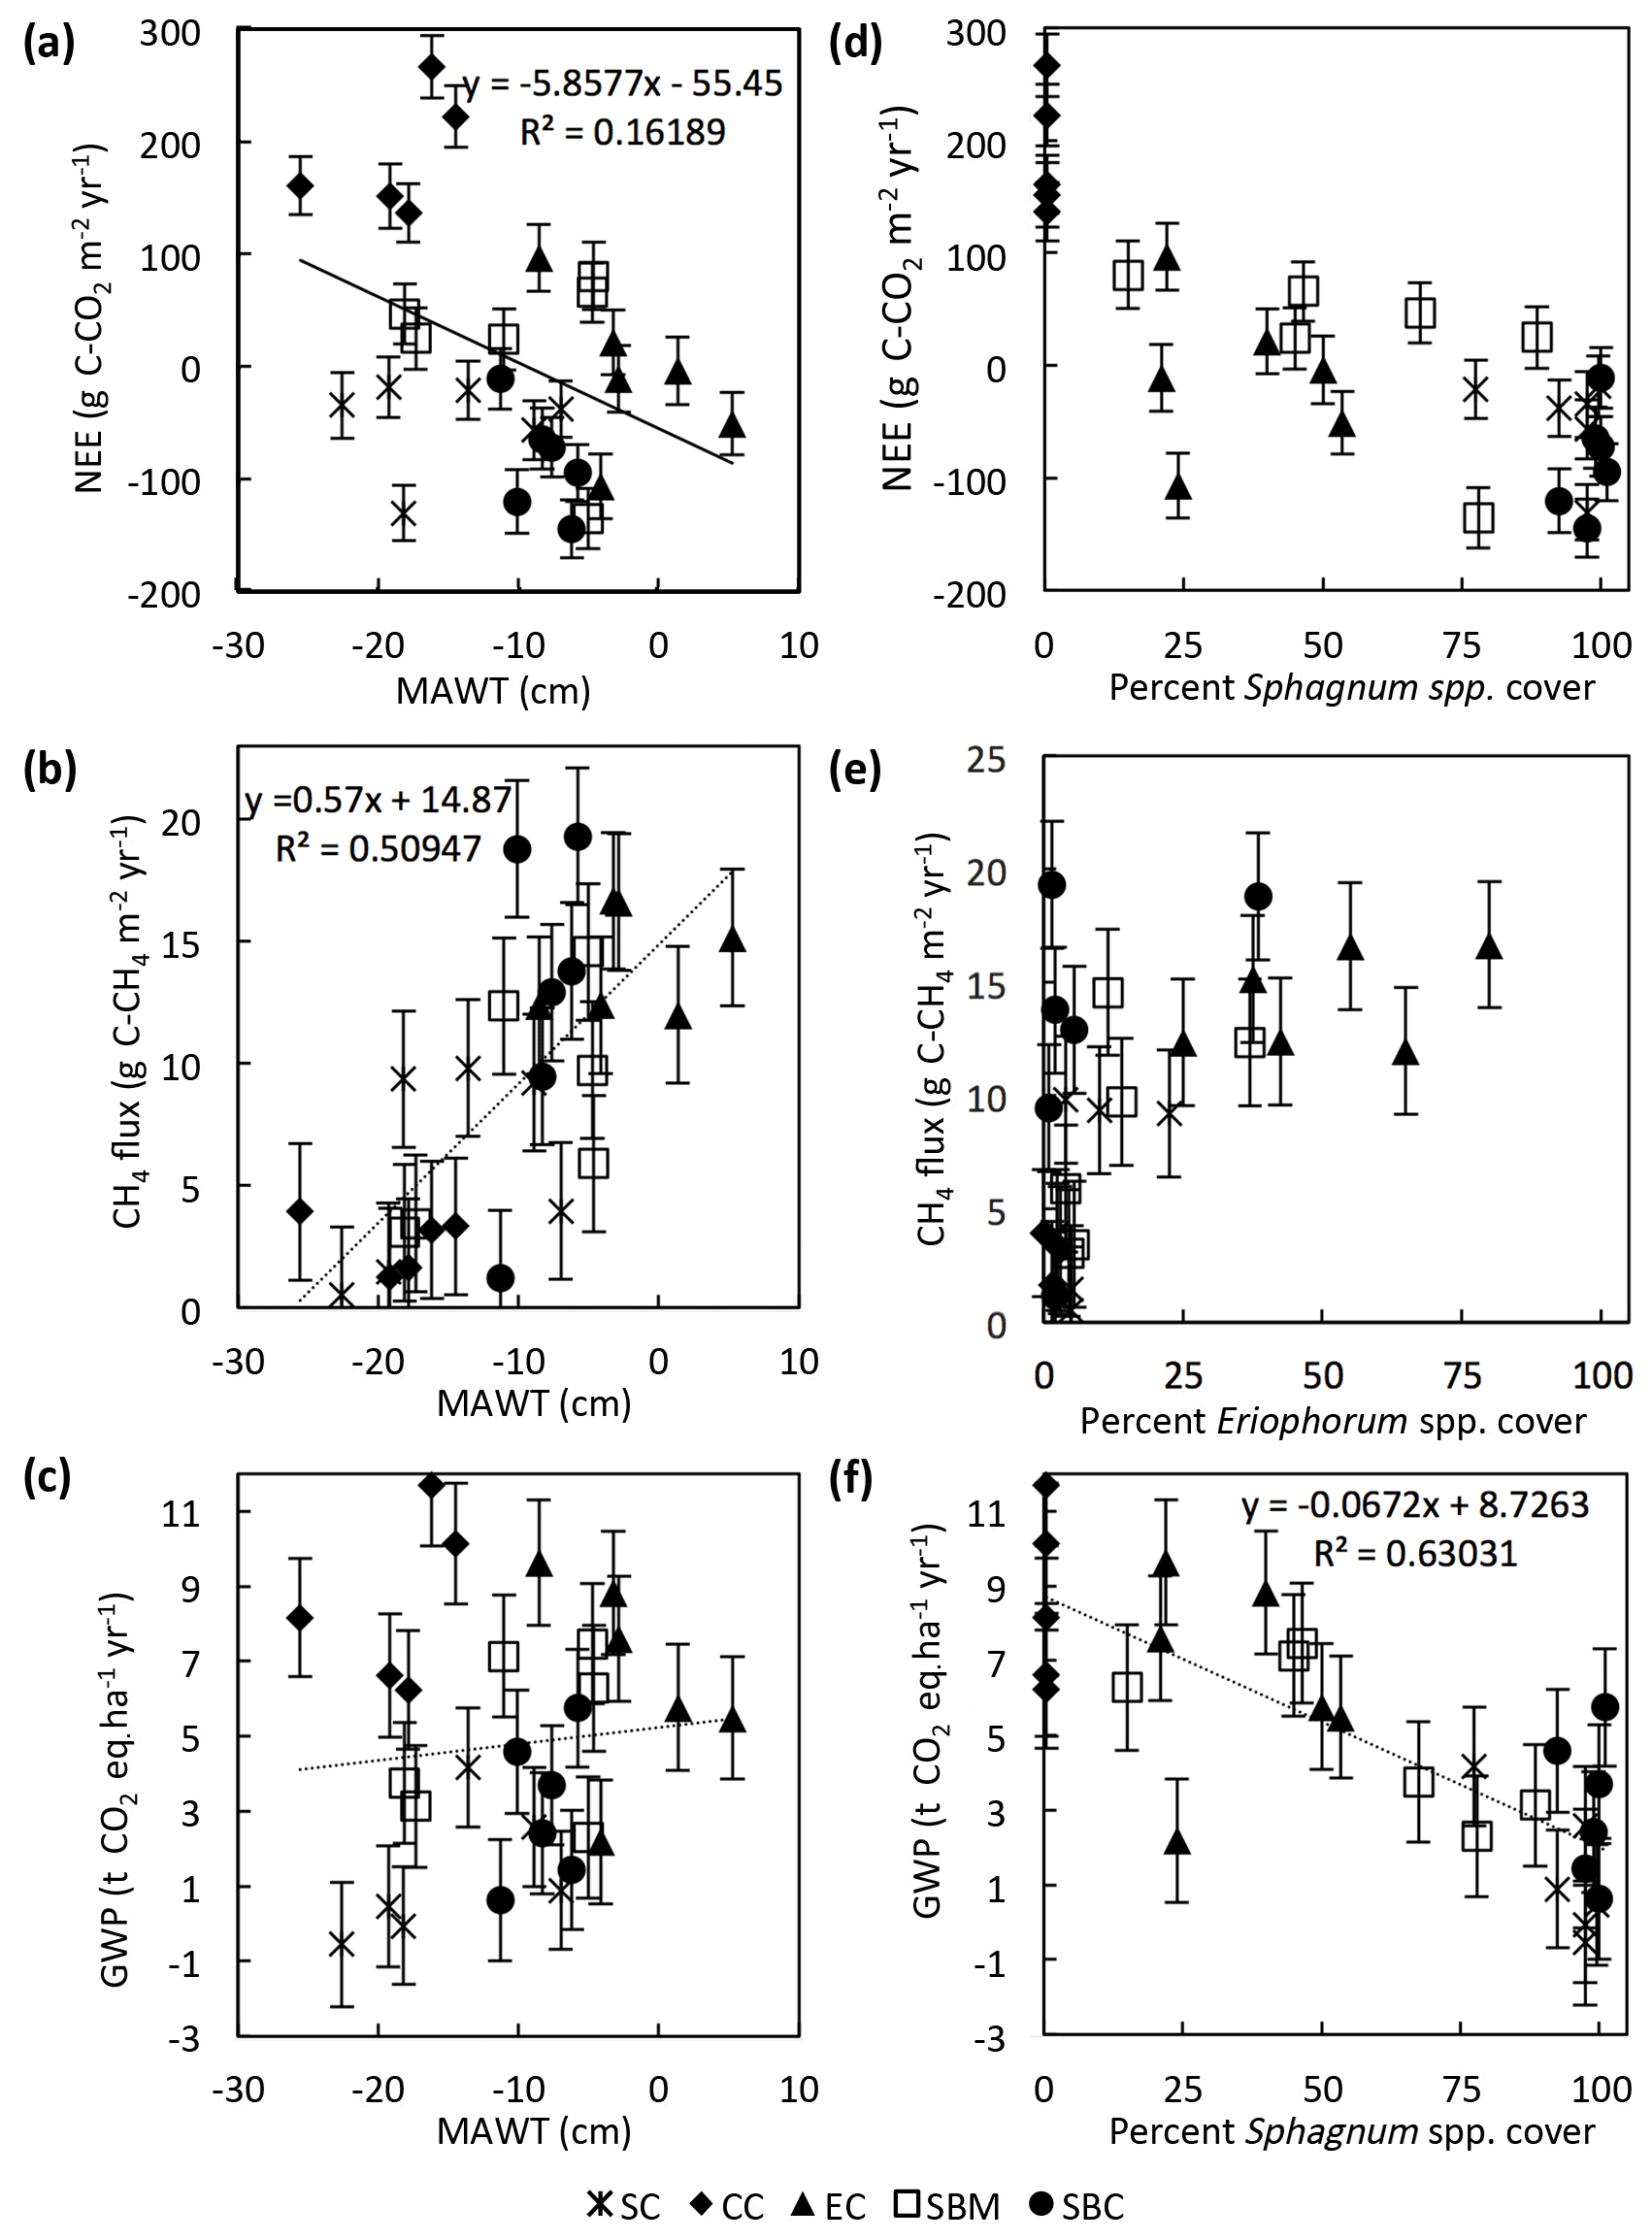
Figure 10Trends in collar annual C balance, CH4 flux, and GWP plotted against mean annual water table (MAWT) (a–c) and percentage of genus cover (d–f). Data are displayed by ecotype with abbreviations in the legend as in Fig. 2.
The collar annual average GWP has a highly significant (slope = , p<0.001, n=1) negative linear correlation (r2=0.63) with the percentage of Sphagnum spp. cover in the collar (Fig. 10f). The percentage of Sphagnum spp. cover and Eriophorum spp. cover in the collar seem to be correlated in a nonlinear fashion with the average annual NEE and the annual CH4 flux, respectively (Fig. 10d, e). In particular, the annual CH4 flux is greater than ∼9 g C-CH4 m−2 yr−1 for all collars in which the percentage of Eriophorum spp. cover is higher than 10 %.
3.6 Comparison with global studies
The annual NEE and CH4 flux from this study were compared to a compilation of literature data from global studies of boreal and temperate peatlands. This comparison is shown graphically in Figs. 11 and 12 and in tabular form in Table S9.

Figure 11Mean annual water table vs. the annual NEE for the five ecotypes in this study (error bars are standard deviation) compared to global studies from boreal and temperate peatlands. (Data are from Wilson et al., 2015, 2016b; Vanselow-Algan et al., 2015; Tuittila et al., 1999; Waddington et al., 2010; Strack et al., 2014; Nilsson et al., 2008; Dinsmore et al., 2010; Koehler et al., 2011; Chimner et al., 2017; Gažovič et al., 2013; Lund et al., 2012; Levy and Grey, 2015; McVeigh et al., 2014; Helfter et al., 2015; Peichl et al., 2014; Strachan et al., 2016; Roulet et al., 2007; Waddington and Roulet, 2000; for more details and additional studies see Table S9). Also, shown to the right of the figure is the mean and 95 % CI NEE from nutrient-poor, wet ( cm) boreal (B) and temperate (T) peatlands (from the review paper Wilson et al., 2016a). Numbers indicate the ecotype with Sphagnum cutover as 1, Calluna cutover as 2, Eriophorum cutover as 3, submarginal as 4, and subcentral as 5.
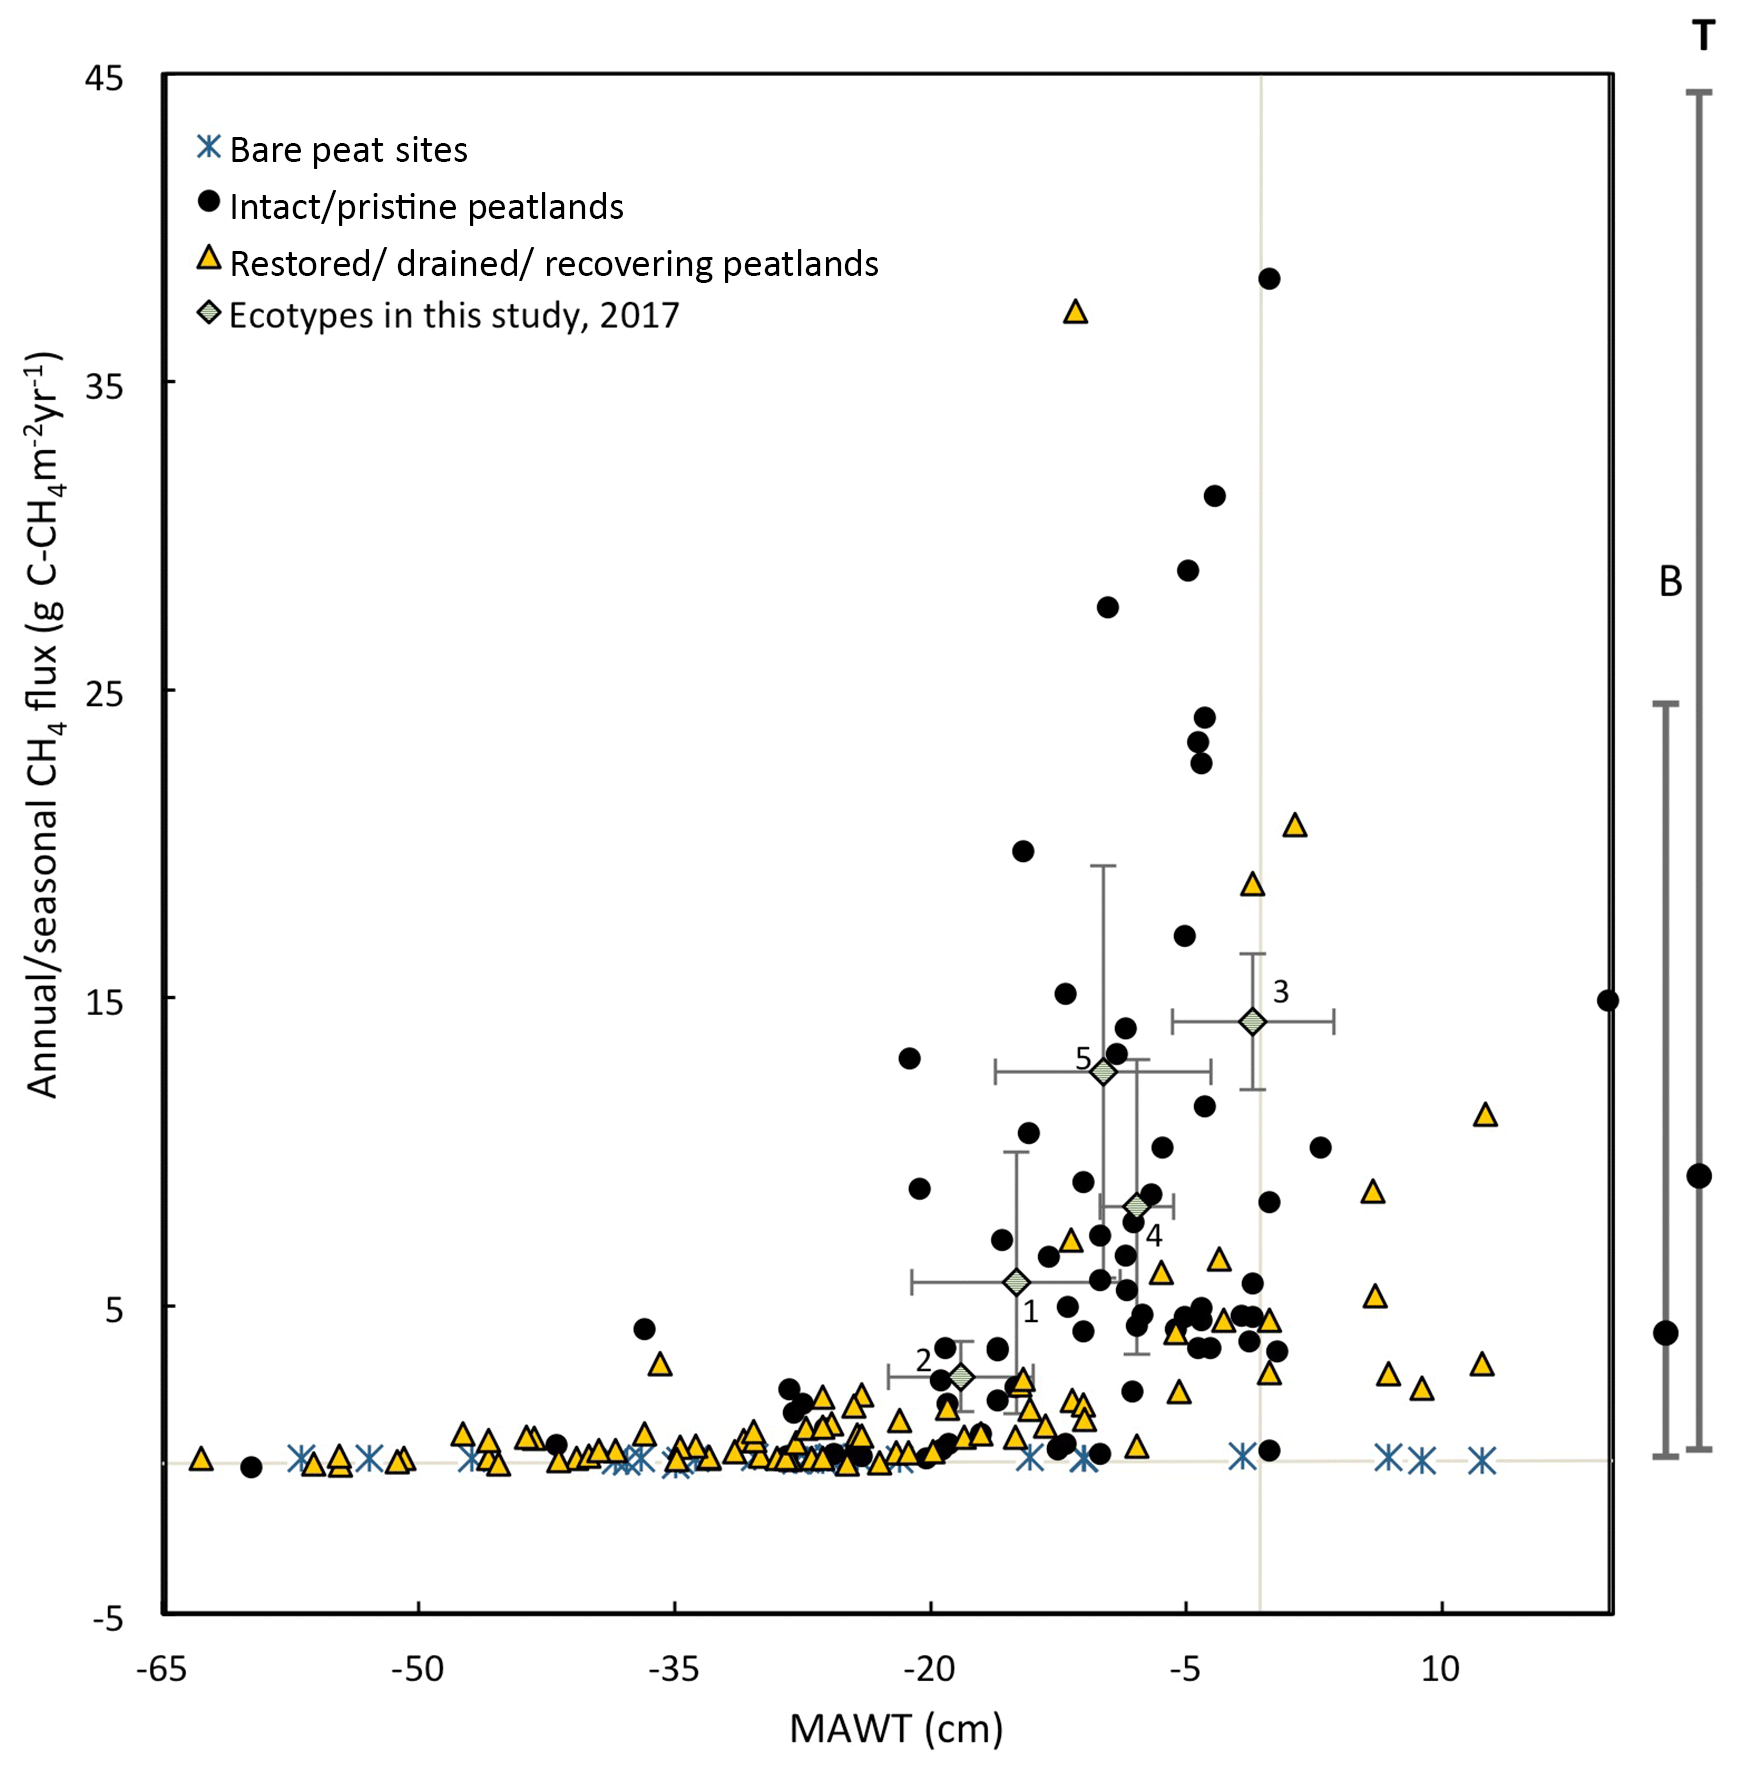
Figure 12This figure shows the mean annual water table plotted against the measured 2017 annual CH4 emissions for each ecotype in this study (error bars are standard deviations) and from global studies of temperate and boreal peatlands (sources: Flessa et al., 1998; Fieldler et al., 1998; Renou-Wilson et al., 2018b; Tuittila et al., 1999; Nykänen et al., 1998; Danevčič et al., 2010; Von Arnold et al., 2005; Laine et al., 1996; Yamulki et al., 2013; Jungkunst and Fiedler, 2007; Jungkunst and Fiedler, 2007; Cooper et al., 2014; Waddington and Day, 2007; Chimner et al., 2017; Waddington and Roulet, 2000; Ballantyne et al., 2014; for more details see Table S9. Also, shown to the right of the figure is the mean and 95 % CI of CH4 emissions from nutrient-poor, wet ( cm) boreal (B) and temperate (T) peatlands (from the review paper Wilson et al., 2016a). Numbering of ecotypes is the same as in Fig. 11.
For both vegetated and bare peat sites, there is a negative correlation between MAWT and NEE (Fig. 11). Annual NEE for vegetated sites followed a linear trend with respect to MAWT with a slope of −4.5 g C-CO2 m−2 yr−1 per centimeter of rise in MAWT and an intercept of −92 g C-CO2 m−1 yr−1.
The Sphagnum-dominated ecotypes in this study (Sphagnum cutover and subcentral) were just below the overall trend line for vegetated sites in Fig. 11. The subcentral ecotype in this study has continuous Sphagnum spp. lawns similar to an intact peatland. This ecotype has a mean annual NEE of g C-CO2 m−2 yr−1 and a mean annual water table of −8.2 cm. This is close to the overall average NEE (−60 g C-CO2 m−2 yr−1) and mean annual water table (−9 cm) for intact peatlands shown in this figure. The other ecotypes in this study were higher than the overall trend line for vegetated sites in Fig. 11. The Calluna cutover ecotype from this study had an exceptionally high average annual NEE (188±79 g C-CO2 m−2 yr−1) for the given average MAWT (−18.6 cm) compared to the NEE (−5 g C-CO2 m−2 yr−1) predicted from the best-fit trend line of vegetated sites.
Similarly, annual or seasonal CH4 emissions are plotted against MAWT (Fig. 12). Reported CH4 emissions from drained peatlands are quite low and typically do not exceed 0.6 g C-CH4 m−2 yr−1 at sites with a MAWT below −30 cm. There is a high degree of variability in CH4 emissions at sites where the MAWT is higher than −20 cm. This figure excludes infilled ditches, which can be hotspots for CH4 emissions (Waddington and Roulet, 2000). For example, Cooper et al. (2014) report 53.9 g C-CH4 m−2 yr−1 for infilled ditches (Cooper et al., 2014). There are few studies that have reported CH4 emissions from bare peat sites, and the results are generally low (mean of −0.03 g C-CH4 m−2 yr−1) even at a high water table. The data from the ecotypes in this study fall well within the range of the CH4 flux values in Fig. 12 for the given MAWTs.
There are a few cautionary notes that should accompany these plots. First, some of these data were collected using the closed-chamber method and some collected using eddy-covariance methods. Although both methods measure the same metric (NEE), closed-chamber methods are inherently micro-scale while eddy-covariance methods are inherently landscape scale, as are the water table measurements accompanying them. Eddy-covariance measurements spatially integrate the micro-variations within the landscape compared to closed-chamber measurements. Many of the NEE data reported in Fig. 11 for intact peatlands are from eddy-covariance flux towers while there are very few studies that have used this technique on degraded/restored/recovering peatlands. This may cause apparently higher variation in NEE for degraded/restored/recovering peatlands. Second, many of the studies on boreal peatlands report only growing season NEE and water table because of frozen winter conditions. Data collected from literature included in Fig. 11 and Fig 12 are reported as is without attempting to account for the differences in growing season vs. annual values. However, nongrowing season gas fluxes can account for ∼15 % of annual fluxes for boreal peatlands (Saarnio et al., 2007). Third, this figure contains data points from different locations as well as the same location over multiple years where data are available. The data used to compile Figs. 11 and 12 and additional studies can be found in Supplement Sect. 3, Table S9.
4.1 Comparison between ecotype NEE and CH4 flux
All of the ecotypes in this study were on average GWP sources both years, which was statistically significant for all but the Sphagnum cutover ecotype both years. This is in agreement with other studies, which have found that even relatively high-quality restored bogs tend to have positive overall GWP (Renou-Wilson et al., 2018b). The Sphagnum spp.-dominated ecotypes (Sphagnum cutover and subcentral) were on average the lowest GWP sources, and plot-scale Sphagnum spp. cover had a statistically significant negative correlation to the GWP. In terms of restoration, this suggests that there is a direct GHG benefit for establishing high-quality bog vegetation such as Sphagnum spp.
There is some debate about the use of GWP as a metric for peatlands because this metric focuses on a 100-year time window, which may not be appropriate. For example, “the long-term sequestration of CO2 into stable organic matter gradually outweighs the warming effect of CH4, due to the shorter atmospheric lifetime of the latter, so that natural peatlands exert a net cooling impact on the atmosphere over longer periods” i.e., the Holocene (Evans et al., 2016; Frolking et al., 2006). This means that peatland preservation is beneficial (in terms of warming impact) despite CH4 emissions. However, peatland restoration projects may impact the eco-hydrological trajectory on a shorter timescale (i.e., decadal as opposed to millennial), in which case, the increased CH4 emissions resulting from restoration works (such as raising the water table) may be proportionally more important to consider for the overall GHG effect. This would mean that the 100-year GWP may be a more appropriate metric for restored peatlands than intact peatlands.
For the cutover ecotypes in this study, it is interesting to observe that ecotypes with identical site history, close physical proximity, similar soils, and only subtle differences in hydrology can have substantial differences in the NEE, CH4 flux, and resulting GWP. In the cutover areas of Abbeyleix Bog, a mosaic of ecotypes has naturally developed in the time since abandonment. The resulting C cycling is highly spatially variable throughout the cutover bog: the Calluna cutover ecotype is a considerable carbon source, the Eriophorum cutover ecotype is approximately carbon neutral, and the Sphagnum cutover ecotype is on average a moderate carbon sink. Also, the Eriophorum cutover ecotype was found to produce much higher CH4 emissions than the other two cutover ecotypes. The Sphagnum cutover ecotype in this study was a statistically significant lower GWP source than the other ecotypes on the cutover bog and a substantially lower CO2 source than the Calluna cutover ecotype, although the Sphagnum cutover ecotype was located within 30 m of the Calluna cutover ecotype.
The Calluna cutover ecotype was not only a larger CO2 source than the other ecotypes in this study, but also much higher than values reported in the literature for degraded/restored/recovering bogs at a comparable MAWT (as in Fig. 11). This may be due to the longer time post-abandonment than many other studies because the CO2 emissions from peat soils can possibly increase with post-extraction time (Rankin et al., 2018; Waddington et al., 2002). If this is true, differences in eco-hydrological trajectory (e.g., between the Sphagnum cutover and Calluna cutover ecotypes) may even result in a divergent trend in the global warming impact over time, which would underscore the importance of restoration as soon as possible post-extraction.
Similarly, the two ecotypes on the restored raised bog share a similar site history, i.e., both were restored by drain blocking 6 years prior to the start of the study. The subcentral ecotype was on average a C sink while the lower-quality submarginal area was on average a moderate carbon source in 2016 and 2017 despite only minor differences in hydrology (Fig. 3). This is an example of where the successful restoration of a continuous Sphagnum moss layer has resulted in an improved C sink. The subcentral ecotype had an average annual NEE that was similar to other studies on intact bog locations (as in Fig. 11 and Helfter et al., 2015; McVeigh et al., 2014; Nugent et al., 2018; etc.). This demonstrates that restored bogs can be returned to a similar CO2 sink as intact bogs with a recovery of eco-hydrological conditions, agreeing with Nugent et al. (2018), but possibly depending on the initial level of disturbance (Renou-Wilson et al., 2018a).
The eco-hydrological conditions seem to be what determines GHG emissions, rather than time since restoration/abandonment. The data here do not support the hypothesis that time since restoration/abandonment per se is an important factor in the GHG emissions (once vegetation is established as discussed below). This is evidenced by the fact that ecotypes with the same site history (e.g., the cutover ecotypes or the raised bog ecotypes) can have very different C cycling. Also, locations with very different site history (e.g., the Sphagnum cutover and subcentral ecotypes) can have similarities in plant ecology, C balance, and GWP.
4.2 Aquatic C losses
Only a handful of previous studies have concurrently quantified annual fluxes of all major aspects of the C balance for a peatland site (Table 2). Of these, only one study, to the authors' knowledge (Nugent et al., 2018), has concurrently measured annual NEE, CH4 flux, and DOC flux for a restored peatland site.
Table 2This table shows the average annual C balance from various studies which have measured multiple aspects of the C balance. All units are in g C m−1 yr−1, with a negative sign convention indicating C uptake to the bog. Where 2 or 3 years of data were available the range is given (min to max); where more years of data were available ± SD is included.
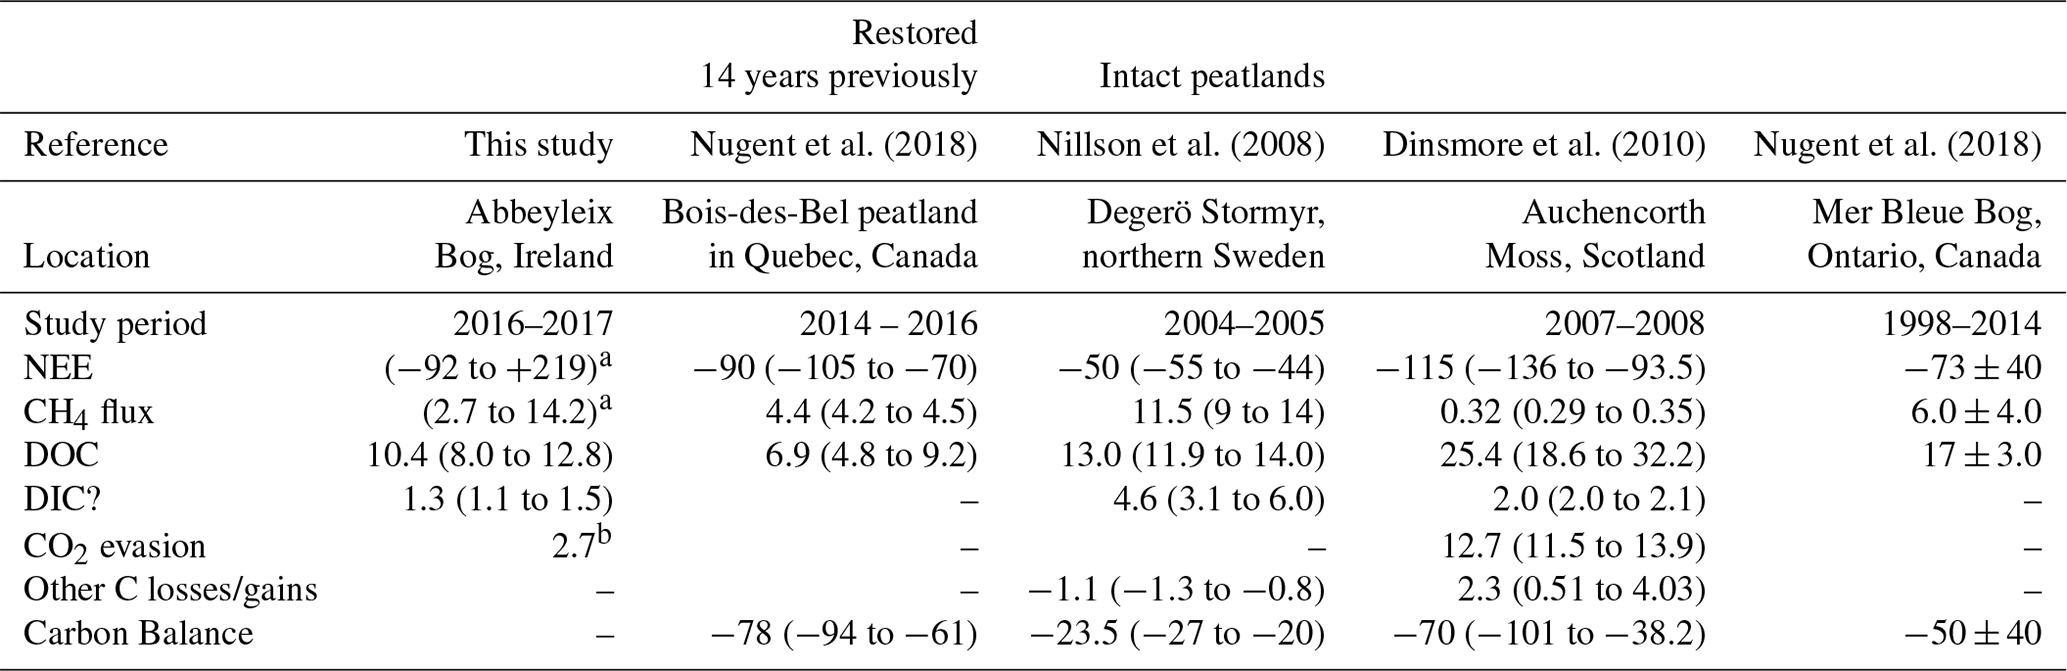
a Range for various ecotypes. Including supersaturated CO2 as DIC. b In the vicinity of the submarginal ecotype, this value was found to be 7.2 g C-CO2 m−1 yr−1 because of larger surface area of open water from blocked ditches.
The annual C export as DOC measured in this study was lower than the value reported in Dinsmore et al. (2010) from Auchencorth Moss, Scotland, which is similarly located in a temperate oceanic climate. The annual DOC export measured at Abbeyleix Bog was also on the lower end of the range (5–36 g C m−2 yr−1) reported for temperate peatlands in the review by Evans et al. (2016). The DIC losses in this study (1.3 g C m−2 yr−1, including super-saturated CO2 as DIC) are lower than the values reported in Nilsson et al. (2008) and Dinsmore et al. (2010) of 2.0 and 4.6 g C m−2 yr−1, respectively. This is partially because the average DIC concentration measured in this study (4.6±1.1 mg C L−1) is somewhat lower than that reported in Nilsson et al. (2008) of 9.6 mg C L−1 and at Auchencorth Moss (Dinsmore et al., 2013) of 8.65 mg C L−1. The annual open-water CO2 evasion found in this study (2.7 or 7.2 g C m−2 yr−1) is lower than what was reported in Dinsmore et al. (2010) (12.7 g C m−2 yr−1), but this is dependent on the geometry of the system as water surface area is a factor in the calculation. Also, the floating chamber method used in this study may have underestimated total CO2 evasion (Dinsmore et al., 2010).
Although the NEE is the most variable component of the C balance and often drives the trends in the overall C balance, it is not necessarily the largest component of the C balance. Other aspects of the C balance become proportionally more important when the NEE is near neutral. For example, the NEE at the Eriophorum cutover ecotype in 2016 was g C-CO2 m−2 yr−1. The magnitude of the aquatic C loss in 2016 (11.8±1.8 g C m−2 yr−1) was actually larger than the average NEE for this ecotype.
4.3 Implications for peatland management and restoration
Peatland management and restoration is primarily able to alter (1) the hydrology, typically managing the water table through drainage or drain blocking, and (2) the plant ecology, through revegetation efforts and controlling invasive species (Andersen et al., 2017). If peatland management is used as a climate change mitigation tool (as suggested in Birkin et al., 2011; Wilson et al., 2013; Leifeld and Menichetti, 2018), then the impact of these actions on C balance, CH4 flux, and GWP must be considered. The trends in Fig. 11 could be used to predict the NEE impact of rewetting and/or revegetating a peatland. However, the trend in NEE with respect to MAWT in Fig. 11 should be interpreted with some caution because of the difficulty of generalizing across sites based on simple water table proxies (Wilson et al., 2016a). For example, there was a “highly peatland-specific dependency (i.e., with different offsets and slopes) of the CO2 response to water table depth” for grassland peatlands in Germany (Tiemeyer et al., 2016). The reader is directed toward various formal literature reviews, which have considered the impact of rewetting or water table on peatland CO2 and CH4 emissions (Haddaway et al., 2014; Jungkunst and Fielder, 2007; Saarnio, et al., 2007; Turetsky et al., 2014; Wilson et al., 2016a).
A higher water table generally corresponds to increased CH4 emissions and reduced CO2 emissions (Wilson et al., 2016a), which was found in this study as well. For sites with a higher water table, the CO2 uptake tends to outweigh the higher CH4 emissions (Junkurst and Fielder, 2007) such that rewetting of a drained peatland has often been observed to result in an overall reduction in GWP (Renou-Wilson et al., 2018b; Wilson et al., 2016a, 2016b). However, this is not necessarily the case because of the high degree of variability for reported methane emissions. For example, in this study, the Eriophorum cutover ecotype (with the highest MAWT) was found to have a higher GWP than the Sphagnum cutover ecotype (with a much lower MAWT) both years. Also, this study found that the plot-scale GWP showed no trend with respect to MAWT.
As shown in Fig. 11, bare peat sites have a higher NEE than vegetated sites at a given MAWT, and these trend lines diverge at a higher MAWT. As it can take decades for vegetation to be established in industrially mined peatlands (Wilson et al., 2015), these data would suggest that restoration to encourage plant colonization could reduce the short-term CO2 emissions even if no other restoration works are undertaken. Further, peatlands may be large C sinks in the years immediately post-restoration as vegetation recovers due to the rapid, subsequent increase in vegetation biomass. For example, an annual NEE of −473 g C-CO2 m−2 yr−1 was reported by Waddington et al. (2010) 1 year post-restoration for sites where herbaceous vegetation increased dramatically. This may explain some of the low outliers in Fig. 11 for degraded/restored/recovering sites. Three of the low outliers in Fig. 11 are from Strack et al. (2014), which is 4 years post-restoration with a growing season NEE of −162, −121, and −126 g C-CO2 m−2 for plots with mean seasonal water tables of −21.3, −24.9 and −28.2 cm, respectively. Conversely, the low CH4 emissions from rewetted bare peat soils suggest that the methanogenesis is limited by substrate availability in cutover peatlands (Tuittila et al., 2000, 1999). Thus, establishing vegetation on a cutover peatland could increase methane emissions compared to bare peat; even so, restored peatlands often have a lower CH4 flux than intact reference sites (e.g., Nugent et al., 2018).
The results from this study demonstrate the importance of establishing a Sphagnum moss for C sink and GWP. This is somewhat contradictory to Wilson et al. (2016b), who found that locations in a restored Irish peatland with only Eriophorum angustifolium had a stronger CO2 sink and lower GWP than locations with Eriophorum and Sphagnum together. Still, the successful restoration of Sphagnum on a mined peatland has been found to result in a stable and strong C sink function (e.g., Nugent et al., 2018). Also, Strack et al. (2016) found that variation in CO2 and CH4 flux was lower for natural sites, with a high percentage of moss cover, than restored sites with a lower percentage of moss cover. Thus, the re-establishment of Sphagnum moss seems to be tied to a consistent C sink function, as was found in this study.
In general, this study found large differences in carbon balance and GWP emissions of various ecotypes in a recovering cutover bog despite the close physical proximity (within 200 m), similarities in soil, and a shared site history. This highlights the importance of microscale hydrological variations in the eco-hydrological trajectory and need for more research on the eco-hydrology of degraded bogs as well as the hydrological requirements for successful restoration. On both a recovering cutover bog and a drain-blocked raised bog, lower GWP was observed where there had been recovery of high-quality peatland vegetation such as Sphagnum spp.
At the plot scale, the trends in CH4 flux and C balance with respect to MAWT offset each other such that there is no trend in GWP with respect to MAWT. The collar annual average GWP showed a highly significant negative linear correlation with the plot-scale percentage of Sphagnum spp. cover. Altogether, this demonstrates the GHG benefit of restoring degraded bogs back to active, Sphagnum-dominated systems.
As degraded peatlands are major aspects of the European landscape and given their importance to global GHG emissions, it is valuable to continue building a database of GHG emissions from peatlands and the effects of peatland management and restoration. This requires three aspects of future research: (1) more field data are needed to thoroughly characterize the wide range of peatlands and drivers of peatland GHG emissions; (2) the types of data collected, methods used, and format of reporting these data need to be streamlined across the scientific community; and (3) the data from the growing number of studies focused on peatland GHG emissions need to be compiled in ways accessible to both the scientific community and policy managers.
Many of the data on the various aspects of the annual C balance including all the data behind Figs. 6, 9, 10, 11, and 12 can be found in the Supplement. All other data used in this study are archived by the authors and are available on request (swensonm@tcd.ie).
Section S1. Includes a description of the NEE and CH4 flux models tested and the thought behind these models. Also, for each of the 29 collars in this study, the empirical fitting parameters and statistical information for the GPP and ER models used are included. Section S2. Eco-hydrological conditions and C balance terms for all collars, both years of this study. Section S3. This section includes data collected from literature on peatland C balance and other site information. This section includes the data behind Figs. 11 and 12 as well as other studies. The supplement related to this article is available online at: https://doi.org/10.5194/bg-16-713-2019-supplement.
Michael Swenson collected and analyzed the majority of the field data and prepared the paper with contributions from other co-authors. Shane Regan attained the grant award, determined the field site location, and contributed to setting up the field equipment and measuring infrastructure. Dirk Bremmers collected CH4 flux data in the field and analyzed gas samples in the lab. Jenna Lawless collected field measurements of DIC and CO2 evasion. Shane Regan, Matt Saunders, and Laurence Gill contributed technical advice and guidance throughout the project implementation and paper writing stages.
The authors declare that they have no conflict of interest.
The authors would like to thank the Environmental
Protection Agency (Ireland) for funding the project (project
ref: 2014-NC-MS-2); Fernando Fernandez and Jim Ryan (National Parks and
Wildlife Service, Ireland); Maria Strack for providing the collar
specific data of NEE and CH4 flux, which are presented but not
explicitly reported in Strack et al. (2014) and were included in Figs. 11 and
12; the Abbeyleix Bog Project, Ltd for endless encouragement and help; and
the
Trinity College lab technicians and support.
Edited by: Christopher A. Williams
Reviewed by: two anonymous referees
Andersen, R., Farrell, C., Graf. M., Muller, F., Calvar, E., Frankard, P., Caporn, S., and Anderson, P.: An overview of the progress and challenges of peatland restoration in Western Europe, Restor. Ecol., 25, 271–282, https://doi.org/10.1111/rec.12415, 2017.
Augustin, J. and Joosten, H.: Peatland rewetting and the greenhouse effect, IIMCG Newsletter, 3, 12–14, 2007.
Bacon, K. L., Baird, A. J., Blundell, A., Bourgault, M.-A., Chapman, P. J., Dargie, G., Dooling, G. P., Gee, C., Holden, J., Kelly, T., McKendrick-Smith, K. A., Morris, P. J., Noble, A., Palmer, S. M., Quillet, A., Swindles, G. T., Watson, E. J., and Young, D. M.: Questioning ten common assumptions about peatlands, Mires and Peat, 19, 1–23, 2017.
Bain, C. G., Bonn, A., Stoneman, R., Chapman, S., Coupar, A., Evans, M., Gearey, B., Howat, M., Joosten, H., Keenleyside, C., Labadz, J., Lindsay, R., Littlewood, N., Lunt, P., Miller, C. J., Moxey, A., Orr, H., Reed, M., Smith, P., Swales, V., Thompson, D. B. A., Thompson, P. S., Van de Noort, R., Wilson, J. D., and Worrall, F.: IUCN UK Commission of Inquiry on Peatlands, IUCN UK Peatland Programme, Edinburgh, 2011.
Baird, A., Holden, J., and Chapman, P.: A Literature Review of Evidence on Emissions of Methane in Peatlands, Defra Project SP0574, 44, 1–54, 2009.
Ballantyne, D. M., Hribljan, J. A., Pypker, T. G., and Chimner, R. A.: Long-term water table manipulations alter peatland gaseous carbon fluxes in Northern Michigan, Wetlands Ecol. Manage., 22, 35–47, https://doi.org/10.1007/s11273-013-9320-8, 2014.
Barry, C. D., Renou-Wilson, F., Wilson, D., Müller, C., and Foy, R. H.: Magnitude, form and bioavailability of fluvial carbon exports from Irish organic soils under pasture, Aqua. Sci., 78, 541–560, 2016.
Billett, M. F., Charman, D. J., Clark, J. M., Evans, C. D., Ostle, N. J., Worrall, F., Burden, A., Dinsmore, K. J., Jones, T., McNamara, N. P. Parry, L., Rowson, J. G., and Rose, R.: Carbon balance of UK peatlands: Current state of knowledge and future research challenges, Clim. Res., 45, 13–29, https://doi.org/10.3354/cr00903, 2010.
Birkin, L. J., Bailey, S., Brewis, F. E., and Way, L.: The requirement for improving greenhouse gases flux estimates for peatlands in the UK, Joint Nature Conservation Committee, JNCC report No:457, ISSN 0963 8901, 2011.
Blodau, C.: Carbon cycling in peatlands – A review of processes and controls, Environ. Rev., 10, 111–134, https://doi.org/10.1139/a02-004, 2002.
Charman, D. J., Beilman, D. W., Blaauw, M., Booth, R. K., Brewer, S., Chambers, F. M., Christen, J. A., Gallego-Sala, A., Harrison, S. P., Hughes, P. D. M., Jackson, S. T., Korhola, A., Mauquoy, D., Mitchell, F. J. G., Prentice, I. C., van der Linden, M., De Vleeschouwer, F., Yu, Z. C., Alm, J., Bauer, I. E., Corish, Y. M. C., Garneau, M., Hohl, V., Huang, Y., Karofeld, E., Le Roux, G., Loisel, J., Moschen, R., Nichols, J. E., Nieminen, T. M., MacDonald, G. M., Phadtare, N. R., Rausch, N., Sillasoo, Ü., Swindles, G. T., Tuittila, E.-S., Ukonmaanaho, L., Väliranta, M., van Bellen, S., van Geel, B., Vitt, D. H., and Zhao, Y.: Climate-related changes in peatland carbon accumulation during the last millennium, Biogeosciences, 10, 929–944, https://doi.org/10.5194/bg-10-929-2013, 2013.
Chimner, R., A., Pypker, T. G., Hribljan, J. A., Moore, P. A., and Waddington, J. M.: Multi-decadal Changes in Water Table Levels Alter Peatland Carbon Cycling, Ecosystems, 20, 1042–1057, https://doi.org/10.1007/s10021-016-0092-x, 2017.
Connolly, J. and Holden, N.: Detecting peatland drains with Object 65 based Image Analysis and Geoeye-1 imagery, Carbon Bal. Manage. 12, 1–13, https://doi.org/10.1186/s13021-017-0075-z, 2017.
Connolly, J. and Holden, N.: Mapping peat soils in Ireland: updating the derived Irish peat map, Irish Geogr., 42, 343–352, 2009.
Cooper, M. D., Evans, C. D., Zielinski, P., Levy, P. E., Gray, A., Peacock, M., Norris, D., Fenner, N., and Freeman, C.: Infilled Ditches are Hotspots of Landscape Methane Flux Following Peatland Rewetting, Ecosystems, 17, 1227–1241, https://doi.org/10.1007/s10021-014-9791-3, 2014.
Danevčič, T., Mandic-Mulec, I., Stres, B., Stopar, D., and Hacin, J.: Emissions of CO2, CH4 and N2O from Southern European peatlands, Soil Biol. Biochem., 42, 1437–1446, 2010.
Dinsmore, K. J., Billett, M. F., and Dyson, K. E.: Temperature and precipitation drive temporal variability in aquatic carbon and GHG concentrations and fluxes in a peatland catchment, Global Change Biol., 19, 2133–2148, https://doi.org/10.1111/gcb.12209, 2013.
Dinsmore, K. J., Billett, M. F., Skiba, U. M., Rees, R. M., Drewer, J., and Helfter, C.: Role of the aquatic pathway in the carbon and greenhouse gas budgets of a peatland catchment, Global Change Biol., 16, 2750–2762, https://doi.org/10.1111/j.1365-2486.2009.02119.x, 2010.
Dise, N. B.: Peatland response to global change, Science, 326, 810–811, 2009.
Evans, C. D., Renou-Wilson, F., and Strack, M.: The role of waterborne carbon in the greenhouse gas balance of drained and re-wetted peatlands, Aqua. Sci., 78, 573–590, https://doi.org/10.1007/s00027-015-0447-y, 2016.
Fiedler, S., Adam, K., Sommer, M., and Stahr, K.: CO2 und CH4 Emissionen aus Böden entlang eines Feuchtegradienten im südwestdeutschen Alpenvorland, Mitteilungen Deutsche Bodenkundliche Gesellschaft, 88, 15–18, 1998.
Flessa, H., Wild, U., Klemisch, M., and Pfadenahauer, J.: Nitrous oxide and methane fluxes from organic soils under agriculture, Eur. J. Soil Sci., 48, 327–335, https://doi.org/10.1046/j.1365-2389.1998.00156.x, 1998.
Frenzel, P. and Karofeld, E.: CH4 emission from a hollow-ridge complex in a raised bog?: The role of CH4 production and oxidation, Biogeochem., 51, 91–112, 2000.
Frenzel, P. and Rudolph, J.: Methane emissions from a wetland plant: the role of CH4 oxidation in Eriophorum, Plant Soil, 202, 27–32, https://doi.org/10.1023/A:100434892, 1998.
Fritz, C., Pancotto, V. A., Elzenga, J. T., Visser, E. J., Grootjans, A. P., Pol, A., Iturranspe, R., Roelofs. J. G., and Smolders, A. J. Zero methane emission bogs: extreme rhizosphere oxygenation by cushion plants in Patagonia, New Pathologist, New Phytologist, 190, 398–408, 2011.
Frolking, S., Roulet, N., and Fuglestvedt, J.: How northern peatlands influence the Earth's radiative budget: Sustained methane emission versus sustained carbon sequestration, J. Geophys. Res.-Biogeosci., 111, 1–10, https://doi.org/10.1029/2005JG000091, 2006.
Gažovič, M., Forbrich, I., Jager, D. F., Kutzbach, L., Wille, C., and Wilmking, M.: Hydrology-driven ecosystem respiration determines the carbon balance of a boreal peatland, Sci. Total Environ., 463–464, 675–682, https://doi.org/10.1016/j.scitotenv.2013.06.077, 2013.
Gelbrecht, J., Fait, M., and Dittrich, M.: Use of GC and equilibrium calculations of CO2 saturation index to indicate whether freshwater bodies in north-eastern Germany are net sources or sinks for atmospheric CO2, Biogeochem., 51, 91–112, 1998.
Gorham, E.: Northern Peatlands?: Role in the Carbon Cycle and Probable Responses to Climatic Warming, Ecol. Appl., 1, 182–195, 1991.
Gray, A., Levy, P. E., Cooper, M. D., Jones, T., Gaiawyn, J., Leeson, S. R., Ward, S. E., Dinsmore, K. J., Dewer, J., Sheppard, L. J., Ostle, N. J., Evans, C. D., Burden, A., and Zielinski, P.: Methane indicator values for peatlands: a comparison of species and 15 functional groups, Global Change Biol., 19, 1141–1150, https://doi.org/10.1111/gcb.12120, 2013.
Haddaway, N. R., Burden, A., Evans, C. D., Healey, J. R., Jones, D. L., Dalrymple, S. E., and Pullin, A. S.: Evaluating effects of land management on greenhouse gas fluxes and carbon balances in boreo-temperate lowland peatland systems, Environ. Evid., 3, 1–30, https://doi.org/10.1186/2047-2382-3-5, 2014.
Helfter, C., Campbell, C., Dinsmore, K. J., Drewer, J., Coyle, M., Anderson, M., Skiba, U., Nemitz, E., Billett, M. F., and Sutton, M. A.: Drivers of long-term variability in CO2 net ecosystem exchange in a temperate peatland, Biogeosciences, 12, 1799–1811, https://doi.org/10.5194/bg-12-1799-2015, 2015.
Jager, D. F., Wilmking, M., and Kukkonen, J. V. K.: The influence of summer seasonal extremes on dissolved organic carbon export from a boreal peatland catchment: evidence from one dry and one wet growing season, The Sci. Total Environ., 407, 1373–1382, https://doi.org/10.1016/j.scitotenv.2008.10.005, 2009.
Joosten, H.: The global peatland CO2 picture. Peatland status and drainage related emissions in all countries of the world, in Wetland International, available at: https://www.wetlands.org/ (last access: 16 July 2018), Ede, The Netherlands, 2010.
Jungkunst, H. F. and Fiedler, S.: Latitudinal differentiated water table control of carbon dioxide, methane and nitrous oxide fluxes from hydromorphic soils: Feedbacks to climate change, Global Change Biol., 13, 2668–2683, https://doi.org/10.1111/j.1365-2486.2007.01459.x, 2007.
Kindler, R., Siemens, J., Kaiser, K., Walmsley, D. C., Bernhofer, C., Buchmann, N., Cellier, P., Eugster, W., Gleixner, G., Grünwold, T., Heim, A., Ibrom, A., Jones, S. K., Jones, M., Klump, K., Kutch, W., Larsen, K. S., Lehuger, S., Loubet, B., McKenzie, R., Moors, E., Osborne, B., Pilegaard, K., Rebmann, C., Saunders, M., Schmidt, M. W. I., Schrumpf, M., Seyfferth, J., Skiba, U., Soussana, J.-F., Sutton, M. A., Tefs, C., Vowinckel, B., Zeeman, M. J., and Kaupenjohann, M.: Dissolved carbon leaching from soil is a crucial component of the net ecosystem carbon balance, Global Change Biol., 17, 1167–1185, https://doi.org/10.1111/j.1365-2486.2010.02282.x, 2011.
Koehler, A. K., Sottocornola, M., and Kiely, G.: How strong is the current carbon sequestration of an Atlantic blanket bog?, Global Change Biol., 17, 309–319, https://doi.org/10.1111/j.1365-2486.2010.02180.x, 2011.
Koehler, A. K., Murphy, K., Kiely, G., and Sottocornola, M.: Seasonal variation of DOC concentration and annual loss of DOC from an Atlantic blanket bog in South Western Ireland, Biogeochem., 95, 231–242, https://doi.org/10.1007/s10533-009-9333-9, 2009.
Laine, J., Silvola, J., Tolonen, K., Alm, J., Nykänen, H., Vasander, H., Sallantaus, T., Savolainen, I., Sinisalo, J., and Martikainen, P. J.: Effect of water-level drawdown on global climatic warming: Northern peatlands, Ambio, 25, 179–184, 1996.
Leifeld. J. and Menichetti, L.: The underappreciated potential of peatlands in global climate change mitigation stratigies, Nat. Commun., 9, 1071, https://doi.org/10.1038/s41467-018-03406-6, 2018.
Levy, P. E. and Gray, A.: Greenhouse gas balance of a pristine peat bog in northern Scotland, Environ. Res. Lett., 10, 1–17, https://doi.org/10.1088/1748-9326/10/9/094019, 2015.
Lund, M., Christensen, T. R., Lindroth, A., and Schubert, P.: Effects of drought conditions on the carbon dioxide dynamics in a temperate peatland, Environ. Res. Lett., 7, 045704, https://doi.org/10.1088/1748-9326/7/4/045704, 2012.
McNamara, N. P., Plant, T., Oakley, S., Ward, S., Wood, C., and Ostle, N.: Gully hotspot contribution to land-scape methane (CH4) and carbon dioxide (CO2) fluxes in a northern peatland, Sci. Total Environ., 404, 354–360, https://doi.org/10.1016/j.scitotenv.2008.03.015, 2008.
McVeigh, P., Sottocornola, M., Foley, N., Leahy, P., and Kiely, G.: Meteorological and functional response partitioning to explain interannual variability of CO2 exchange at an Irish Atlantic blanket bog, Agr. Forest Meteorol., 194, 8–19, https://doi.org/10.1016/j.agrformet.2014.01.017, 2014.
Myhre, G. and Shindell, D.: Chapter 8, Anthropogenic and Natural Radiative Forcing, in Climate Change 2013: The Physical Science Basis, IPCC Working Group I, Contribution to AR5, 2013.
Nilsson, M., Sagerfors, J., Buffam, I., Laudon, H., Eriksson, T., Grelle, A., Klemedtsson, L., Weslien, P., and Lindroth, A.: Contemporary carbon accumulation in a boreal oligotrophic minerogenic mire – A significant sink after accounting for all C-fluxes, Global Change Biol., 14, 2317–2332, https://doi.org/10.1111/j.1365-2486.2008.01654.x, 2008.
Nugent, K. A., Strachan, I. B., Strack, M., Roulet, N. T., and Rochefort, L.: Multi-year net ecosystem carbon balance of a restored peatland reveals a return to carbon sink, Global Change Biol., 2018, 24, 5751–5768, https://doi.org/10.1111/gcb.14449, 2018.
Nykänen, H., Alm, J., Silvola, J., Tolonen, K., and Martikainen, P. J.: Methane fluxes on boreal peatlands of different fertility and the effect of long-term experimental lowering of the water table on flux rates, Global Biogeochem. Cy., 12, 53–69, 1998.
Page, S. and Baird, A.: Peatlands and global change: response and resilience, Ann. Rev. Environ. Resour., 41, 35–57, 2016.
Pärn, J., Verhoeven, J. T. A., Butterbach-Bahl, K., Dise, N. B., Ullah, S., Aasa, A., Egorov, S., and Espenberg, M., Järveoja, J., Jauhiainen, J., Kasak, K., Klemedtsson, L., Kull, A., Laggoun-Défrafe, F., Lapshina, E. D., Lohila, A., Lõhmus, K., Madison, M., Mistch, W. J., Müller, C., Niinemets, Ü., Osborne, B., Pae, T., Salm, J.-O., Sgouridis, F., Sohar, L., Soosaar, K., Storey, K., Teemusk, A., Tenywa, M. M., Tournebize, J., Truu, J., Veber, G., Villa, J. A., Zaw, S. S., and Mander, Ü.: Nitrogen-rich organic soils under warm well-drained conditions are global nitrous oxide emissions hotspots, Nat. Commun., 9, 1135, https://doi.org/10.1038/s41467-018-03540-1, 2018.
Peichl, M., Öquist, M., Löfvenius, M. O., Ilstedt, U., Sagerfors, J., Grelle, A., Lindroth, A., and Nilsson, M. B.: A 12- year record reveals pre-growing season temperature and water table level threshold effects on the net carbon dioxide exchange in a boreal fen, Environ. Res. Lett., 9, 055006, https://doi.org/10.1088/1748-9326/9/5/055006, 2014.
Poulin, M., Rochefort, L., Quinty, F., and Lavoie, C.: Spontaneous revegetation of mined peatlands in eastern Canada, Can. J. Bot., 83, 539–557, https://doi.org/10.1139/b05-025, 2005.
Raghoebarsing, A., Smolders, A. J. P., Schmid, M. C., Rijpstra, W., I. C., Wolters-Arts, M., Derksen, J., Jetten, M. S. M., Schouten, S., Damsté, J. S. S., Lamers, L. P. M., Roelofs, J. G. M., Op den Camp, H. J. M., and Strous, M.: Methanotrophic symbionts provide carbon for photosynthesis in peat bogs, Nature, 436, 1153–1156, https://doi.org/10.1038/nature03802, 2005.
Rankin, T., Strachan, I. B., and Strack, M.: Carbon dioxide and methane exchange at a post-extraction, unrestored peatland, Ecol. Eng., 122, 241–251, https://doi.org/10.1016/j.ecoleng.2018.06.021, 2018.
Renou-Wilson, F., Moser, G., Fallon, D., Farrell, C. A., Müller, C., and Wilson, D.: Rewetting degraded peatlands for climate and biodiversity benefits: Results from two raised bogs, Ecol. Eng., 127, 547–560, https://doi.org/10.1016/j.ecoleng.2018.02.014, 2018a.
Renou-wilson, F., Wilson, D., Rigney, C., Byrne, K., Farrell, C., and Müller, C.: Network Monitoring Rewetted and Restored Peatlands/Organic Soils for Climate and Biodiversity Benefits (NEROS), EPA Research Ireland, Report No. 236, 2018b.
Ryle, T.: Abbeyleix Bog conservation management plan 2015–2020, An Chomhairle Oidhreachta, The Heritage Council, Ireland, 2013.
Saarnio, S., Morero, M., Shurpali, N. J., Tuittila, E.-S., Mäkila, M., and Alm, J.: Annual CO2 and CH4 fluxes of pristine boreal mires as a background for the lifecycle analysis of peat energy, Boreal Environ. Res., 12, 101–113, 2007.
Schouten, M. G. C. (Editor): Conservation and Restoration of Raised Bogs: Geological, Hydrological and Ecological Studies. Duchas – The Heratige Service of the Department of the Environment and Local Government, Ireland, ISBN 0-7557-1559-4, 2002.
Silvola, J., Alm, J., Ahlholm, U., Nykanen, H., and Martikainen, P. J.: CO2 Fluxes from Peat in Boreal Mires under Varying Temperature and Moisture Conditions, J. Ecol., 84, 219–228, 1996.
Strachan, I. B., Pelletier, L., and Bonneville, M-C.: Inter-annual variability in water table depth controls net ecosystem carbon dioxide exchange in a boreal bog, Biogeochem., 127, 99–111, https://doi.org/10.1007/s10533-015-0170-8, 2016.
Strack, M., Cagampan, J., Hassanpour, F. G., and Keith, A. M., Nugent, K., Rankin, T., Robinson, C., Strachan, I. B., Waddington, J. M, and Xu, B.: Controls on plot-scale growing season CO2 and CH4 fluxes in restored peatlands: Do they differ from unrestored and natural sites?, Mires and Peat, 17, 1–18, https://doi.org/10.5194/bg-14-257-2017, 2016.
Strack, M., Keith, A. M., and Xu. B.: Growing season carbon dioxide and methane exchange at a restored peatland on the Western Boreal Plain, Ecol. Eng., 64, 231–239, https://doi.org/10.1016/j.ecoleng.2013.12.013, 2014.
Tanneberger, F., Tegetmeyer, C., and Busse, S. et al.: The peatland map of Europe, Mires and Peat, 19, 1–17, https://doi.org/10.19189/MaP.2016.OMB.264, 2017.
Tiemeyer, B., Borraz, E. A., Augustin, J., Betchtold, M., Beetz, S., Beyer, C., Drösler, M., Ebli, M., Eikenscheidt, T., Fiedler, S., Förster, C., Freibauer, A., Giebels, M., Glatzel, S., Heinichen, J., Hoffman, M., Höper, H., Jurasinski, G., Leiber-Sauheitl, K., Peichl-Brak, M., RoßKOPF, N., Sommer, M., and Zeitz, J.: High emissions of greenhouse gases from grasslands on peat and other organic soils, Global Change Biol., 22, 4134–4149, https://doi.org/10.1111/gcb.13303, 2016.
Tuittila, E. S., Komulainen, V. M., Vasander, H., Nykanen, H., Martikainen, P. J., and Laine, J.: Methane dynamics of a restored cut-away peatland, Global Change Biology, 6, 569–581, https://doi.org/10.1046/j.1365-2486.2000.00341.x, 2000.
Tuittila, E. S., Komulainen, V. M., Vasander, H., and Laine, J.: Restored cut-away peatland as a sink for atmospheric CO2, Oecologia, 120, 563–574, https://doi.org/10.1007/s004420050891, 1999.
Turetsky, M. R., Kotowska, A., Bubier, J., Dise, N. B., Crill, P., Hornibrook, E. R. C., and Wilmking, M.: A synthesis of methane emissions from 71 northern, temperate, and subtropical wetlands, Global Change Biol., 20, 2183–2197, https://doi.org/10.1111/gcb.12580, 2014.
Vanselow-Algan, M., Schmidt, S. R., Greven, M., Fiencke, C., Kutzbach, L., and Pfeiffer, E.-M.: High methane emissions dominated annual greenhouse gas balances 30 years after bog rewetting, Biogeosciences, 12, 4361–4371, https://doi.org/10.5194/bg-12-4361-2015, 2015.
Vitt, D. H., Halsey, L. A., Bauer, I. E., and Campbell, C.: Spatial and temporal trends in carbon storage of peatlands of continental western Canada through the Holocene, Can. J. Earth Sci., 37, 683–693, https://doi.org/10.1139/e99-097, 2000.
Von Arnold, K., Nilsson, M., Hånell, B., Weslien, P., and Klemedtsson, L.: Fluxes of CO2, CH4 and N2O from drained organic soils in deciduous forests, Soil Biol. Biochem., 37, 1059–1071, https://doi.org/10.1016/j.soilbio.2004.11.004, 2005.
Waddington, J. M. and Day, S. M.: Methane emissions from a peatland following restoration, Geophys. Res., 112, 1–11, https://doi.org/10.1029/2007JG000400, 2007.
Waddington, J. M. and Roulet, N. T.: Carbon balance of a Boreal patterned peatland, Global Change Biol., 6, 87–97, https://doi.org/10.1046/j.1365-2486.2000.00283.x, 2000.
Waddington, J. M., Warner, K. D., and Kennedy, G. W.: Cutover peatlands: A persistent source of atmospheric CO2, Global Biogeochem. Cy., 16, 1002, https://doi.org/10.1029/2001GB001398, 2002.
Waddington, J. M., Strack, M., and Greenwood, M. J.: Toward restoring the net carbon sink function of degraded peatlands: Short-term response in CO2 exchange to ecosystem-scale restoration, J. Geophys. Res.-Biogeosci., 115, G01008, https://doi.org/10.1029/2009JG001090, 2010.
Walsh, S.: A summary of Climate Averages, 1981-2010 for Ireland, Climatological Note No. 14, Met Éirean, Dublin, 2012.
Wilson, D., Blain, D., Couwenberg, J., and Evans, C. D., Murdiyarso, D., Page, S. E., Renou-Wilson, F., Rieley, J. O., Sirin, A., Strack, M., and Tuittila, E.-S.: Greenhouse gas emission factors associated with rewetting of organic soils, Mires and Peat, 17, 1–28, https://doi.org/10.19189/MaP.2016.OMB.222, 2016a.
Wilson, D., Farrell, C. A., Fallon, D., Moser, G., Müller, C., and Renou-Wilson, F.: Multi-year greenhouse gas balances at a rewetted temperate peatland, Global Change Biol., 22, 4080–4095, https://doi.org/10.1111/gcb.13325, 2016b.
Wilson, D., Dixon, S. D., Artz, R. R. E., Smith, T. E. L., Evans, C. D., Owen, H. J. F., Archer, E., and Renou-Wilson, F.: Derivation of greenhouse gas emission factors for peatlands managed for extraction in the Republic of Ireland and the United Kingdom, Biogeosciences, 12, 5291–5308, https://doi.org/10.5194/bg-12-5291-2015, 2015.
Wilson, D., Müller, C., and Renou-Wilson, F.: Carbon emissions and removals from Irish peatlands: present trends and future mitigation measures, Irish Geogr., 11, 1–23, https://doi.org/10.1080/00750778.2013.848542, 2013.
Wilson, D., Alm, J., Riutta, T., Laine, J., Byrne, K. A., Farrell, E. P., and Tuittila, E. S.: A high resolution green area index for modelling the seasonal dynamics of CO2 exchange in peatland vascular plant communities, Plant Ecol., 190, 37–51, https://doi.org/10.1007/s11258-006-1891, 2007.
Yamulki, S., Anderson, R., Peace, A., and Morison, J. I. L.: Soil CO2 CH4 and N2O fluxes from an afforested lowland raised peatbog in Scotland: implications for drainage and restoration, Biogeosciences, 10, 1051–1065, https://doi.org/10.5194/bg-10-1051-2013, 2013.
Young, D. M., Baird, A. J., Morris, P. J., and Holden, J.: Simulating the long-term impacts of drainage and restoration on the ecohydrology of peatlands, Water Resour. Res., 53, 6510–6522, 2017.
Yu, Y., Guo, Z., Wu, H., Kahmann, J. A., and Oldfield, F.: Spatial changes in soil organic carbon density and storage of cultivated soils in China from 1980 to 2000, Global Biogeochem. Cy., 23, GB2021, https://doi.org/10.1029/2008GB003428, 2009.
Zhaojun, B., Joosten, H., Hongkai, L., Gaolin, Z., Xingxing, Z., Jinze, M., and Jing, Z.: The response of peatlands to climate warming: A review, Acta Ecol. Sinica, 31, 157–162, https://doi.org/10.1016/j.chnaes.2011.03.006, 2011.