the Creative Commons Attribution 4.0 License.
the Creative Commons Attribution 4.0 License.
 | 20 Feb 2019
Remineralization rate of terrestrial DOC as inferred from CO2 supersaturated coastal waters
Filippa Fransner
Agneta Fransson
Christoph Humborg
Erik Gustafsson
Letizia Tedesco
Robinson Hordoir
Jonas Nycander
Coastal seas receive large amounts of terrestrially derived organic carbon (OC). The fate of this carbon, and its impact on the marine environment, is however poorly understood. Here we combine underway CO2 partial pressure (pCO2) measurements with coupled 3-D hydrodynamical–biogeochemical modelling to investigate whether remineralization of terrestrial dissolved organic carbon (tDOC) can explain CO2 supersaturated surface waters in the Gulf of Bothnia, a subarctic estuary. We find that a substantial remineralization of tDOC and a strong tDOC-induced light attenuation dampening the primary production are required to reproduce the observed CO2 supersaturated waters in the nearshore areas. A removal rate of tDOC of the order of 1 year, estimated in a previous modelling study in the same area, gives a good agreement between modelled and observed pCO2. The remineralization rate is on the same order as bacterial degradation rates calculated from published incubation experiments, suggesting that bacteria has the potential to cause this degradation. Furthermore, the observed high pCO2 values during the ice-covered season argue against photochemical degradation as the main removal mechanism. All of the remineralized tDOC is outgassed to the atmosphere in the model, turning the northernmost part of the Gulf of Bothnia into a source of CO2 to the atmosphere.
- Article
(7893 KB) - Full-text XML
-
Supplement
(2568 KB) - BibTeX
- EndNote


Rivers bring large amounts of organic carbon to the coastal seas, linking the terrestrial and oceanic carbon cycles. The riverine organic carbon influences the carbon cycling in coastal seas by providing an external carbon source for bacteria, as well as hampering the primary production by making the coastal waters more turbid (Hessen et al., 2010; Wikner and Andersson, 2012; Bauer et al., 2013). The fate of terrestrial dissolved organic carbon (tDOC) in coastal and oceanic waters, and to what extent it undergoes remineralization by bacteria and photochemical processes, is however poorly constrained (Blair and Aller, 2012). Whereas conservative mixing of tDOC with salinity (Mantoura and Woodward, 1983; Dittmar and Kattner, 2003) points towards an inert behaviour, other studies suggest that there is a large removal, mainly by bacterial and photochemical degradation (Benner and Kaiser, 2011; Fichot and Benner, 2014). The high pCO2 measured in many inner estuaries (Frankignoulle et al., 1998; Borges et al., 2005; Anderson et al., 2009) further indicates that a substantial remineralization of tDOC could take place, but it is not clear how much of this signal is caused by lateral transport of CO2 oversaturated waters from rivers and wetlands (Raymond et al., 2000; Cai, 2011).
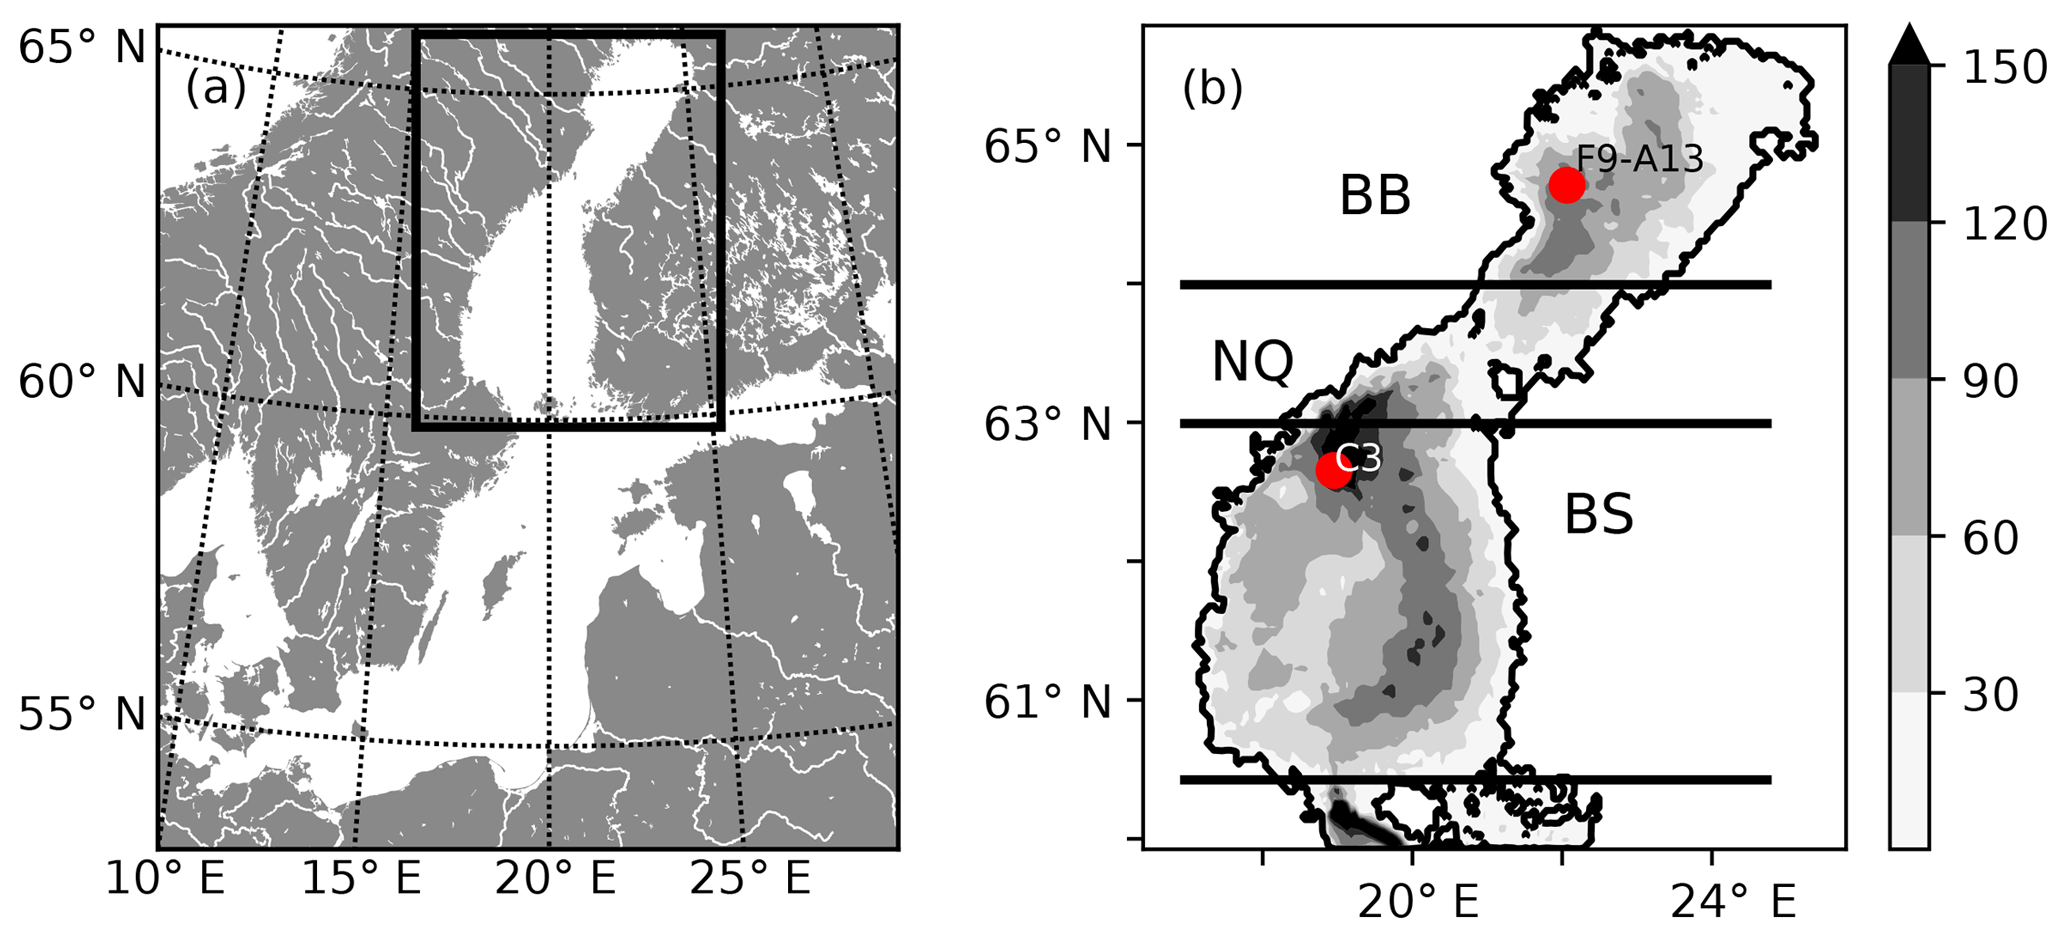
Figure 1(a) Map of the Baltic Sea. The rectangle marks the location of the Gulf of Bothnia and the model domain. (b) Bathymetric chart of the NEMO-GoB configuration. The filled contours show the depth (m). The horizontal lines mark the borders of the subbasins: the Bothnian Bay (BB), the Northern Quark (NQ) and the Bothnian Sea (BS). The two red dots show the position of two stations that are used for evaluation of the model (Figs. S6–S19 in the Supplement).
The Gulf of Bothnia, in the northern Baltic Sea (Fig. 1), is a subarctic estuary that receives large amounts of allochthonous organic carbon (Sandberg et al., 2004; Alling et al., 2008; Deutsch et al., 2012; Hoikkala et al., 2015) originating from surrounding coniferous forests and peatlands. Recent isotope and modelling studies have shown that a majority of this terrestrially derived organic carbon is removed in the transit from estuarine to more oceanic waters (Alling et al., 2008; Deutsch et al., 2012; Gustafsson et al., 2014; Fransner et al., 2016; Seidel et al., 2017), but no direct evidence of the responsible process(es) exists, and the timescales of the removal are unclear (Fransner et al., 2016). Upscaling of small-scale experiments in the Baltic Sea suggests that photochemical remineralization could account for a major removal (Aarnos et al., 2012), while only a small fraction is available for bacterial degradation (Wikner et al., 1999; Asmala et al., 2013, 2014a; Herlemann et al., 2014; Figueroa et al., 2016; Kuliński et al., 2016) and flocculation processes (Asmala et al., 2014b). Other studies, showing that phytoplankton production of organic carbon is not large enough to support the secondary production, suggest that the bacterial production, to a large degree, is supported by tDOC (Zweifel et al., 1995; Kuparinen et al., 1996; Sandberg et al., 2004). Based on observed pCO2 values, mainly from offshore waters, Löffler et al. (2012) calculated that the Bothnian Bay is a slightly heterotrophic system. Whether this net heterotrophy is due to discharge of river waters supersaturated in CO2, or remineralization of tDOC into dissolved inorganic carbon (DIC), remains to be investigated. To better understand the dynamics of tDOC, observations are needed in the nearshore areas, where the largest tDOC concentrations and likely also the largest tDOC removal takes place (Deutsch et al., 2012).
Here we explore the remineralization dynamics of terrestrial dissolved organic carbon in the Gulf of Bothnia by combining high-resolution underway pCO2 measurements with numerical simulations from a 3-D coupled hydrodynamic–biogeochemical model. The underway pCO2 measurements cover CO2 supersaturated nearshore waters next to some of the larger rivers draining into the Gulf of Bothnia as well as offshore waters. A 3-D hydrodynamic model makes it possible to take water movements into account, which cannot be neglected on longer timescales. A suite of modelling experiments is performed to describe the underlying processes behind the observed pCO2. The objectives of this study are to investigate if, and on what timescale, remineralization of tDOC into DIC is needed to explain the observed high pCO2 values in the coastal waters, or if input of CO2 supersaturated river water is enough to explain this pattern. Because there is no clear consensus on which is the dominating remineralization process in the Baltic Sea, it is parameterized as a simple linear decay (after Fransner et al., 2016) that is assumed to include the effects of both bacterial and photochemical remineralization. We further investigate the potentially damping effect the tDOC can have on the primary production and the pCO2 drawdown by increasing the light attenuation in nearshore waters. We conclude by looking at the impact of the tDOC on the air–sea CO2 exchange and whether it turns the Gulf of Bothnia into a net heterotrophic system.
2.1 Model setup
The model setup used for this study (BFM–NEMO-GoB) consists of a 3-D coupled hydrodynamical–biogeochemical model applied to the Gulf of Bothnia (GoB, Fig. 1), (Fransner et al., 2018). It has approximately 2 nautical mile (3704 m) horizontal resolution and 36 vertical levels with increased resolution towards the ocean surface. An open boundary towards the Baltic Proper is located in the southern part of the domain at 59.9∘ N (Fig. 1). The hydrodynamical part is based on the NEMO-Nordic model (Hordoir et al., 2013, 2015, 2019), which is a NEMO 3.6 (http://www.nemo-ocean.eu, last access: 11 February 2019, Madec and the NEMO team, 2016) configuration for the Baltic and the North seas with the LIM3 sea ice model (Vancoppenolle et al., 2009). The performance of the sea ice dynamics in NEMO-Nordic is validated in Pemberton et al. (2017). A comparison between modelled and observed sea ice concentration climatologies can also be found in Fig. S1 in the Supplement. BFM–NEMO-GoB is driven by hourly downscaled ERA-40 data (Samuelsson et al., 2011) and river runoff from the EHYPE model (Donnelly et al., 2016). The biogeochemical part consists of the Biogeochemical Flux Model (BFM; http://bfm-community.eu, last access: 11 February 2019) (Vichi et al., 2007, 2015). BFM is a stoichiometric model that simulates the biogeochemical cycles of carbon (C), nitrogen (N), phosphorus (P) and silica (Si). It has four phytoplankton groups, four zooplankton groups (partitioned into micro- and meso-zooplankton), one group of bacteria, particulate organic matter and two groups of dissolved organic matter of different lability. A separate functional group representing terrestrial dissolved organic matter has been added to the BFM–NEMO-GoB setup (Fransner et al., 2018). While the organic matter that is a built-in feature in BFM is degraded by bacteria, the terrestrial dissolved organic matter is subject to a linear decay, which will be further described in Sect. 2.3. The forcing data for the biogeochemical part consists of river inputs of inorganic and organic C, N, P, Si and total alkalinity, as well as atmospheric depositions of DOC, phosphate, and inorganic and organic nitrogen. The riverine loads have been calculated by multiplying measured concentrations of the chemical species with the volume flow in EHYPE (Fransner et al., 2016, 2018). The riverine input of organic carbon is supposed to consist of 10 % particulate organic carbon (POC) and 90 % DOC (Fransner et al., 2016, 2018). As in Fransner et al. (2016), the DOC of atmospheric origin is considered tDOC. A complete description and evaluation of the BFM–NEMO-GoB setup, including the mean seasonal pCO2 cycle, can be found in Fransner et al. (2018).
2.2 pCO2 data
The pCO2 was measured during 25 cruises, spanning January to October 2012, with the TransPaper cargo (Fransson et al., 2019). The TransPaper cargo sails from Gothenburg on the Swedish west coast, through the Baltic Proper and northwards through the Bothnian Sea and the Bothnian Bay to the ports of Oulu and Kemi in Finland. The pCO2 data were gained by infrared analysis of equilibrator headspace samples. The specific instrument was supplied by General Oceanics® and designed following the principles presented by Pierrot et al. (2009) using two-stage showerhead equilibration and a LI-COR® 7000 non-dispersive infrared detector. The system was calibrated using four highly qualitative reference gases with approximate values of 250, 350, 450 and 550 ppm, traceable to reference standards (National Oceanic and Atmospheric Administration – Earth System Research and Laboratory); see Pierrot et al. (2009) for a more detailed description of the system. The seawater was supplied from an intake located mid-ship, at approximately 7 m in water depth. Temperature was recorded in the surface-water intake using a Sea-Bird CTD and in the equilibrator using 1521 temperature probes from Hart Scientific, with an accuracy of 0.01 ∘C. The mole fraction of CO2 (xCO2) in the atmosphere was measured in air samples, pumped from an air intake located at approximately 50 m a.s.l., where contaminated samples were removed. Air pressure was recorded by a high-precision Druck barometer mounted at the air intake.
The measured pCO2 and the cargo route for every month are displayed in Fig. 2.
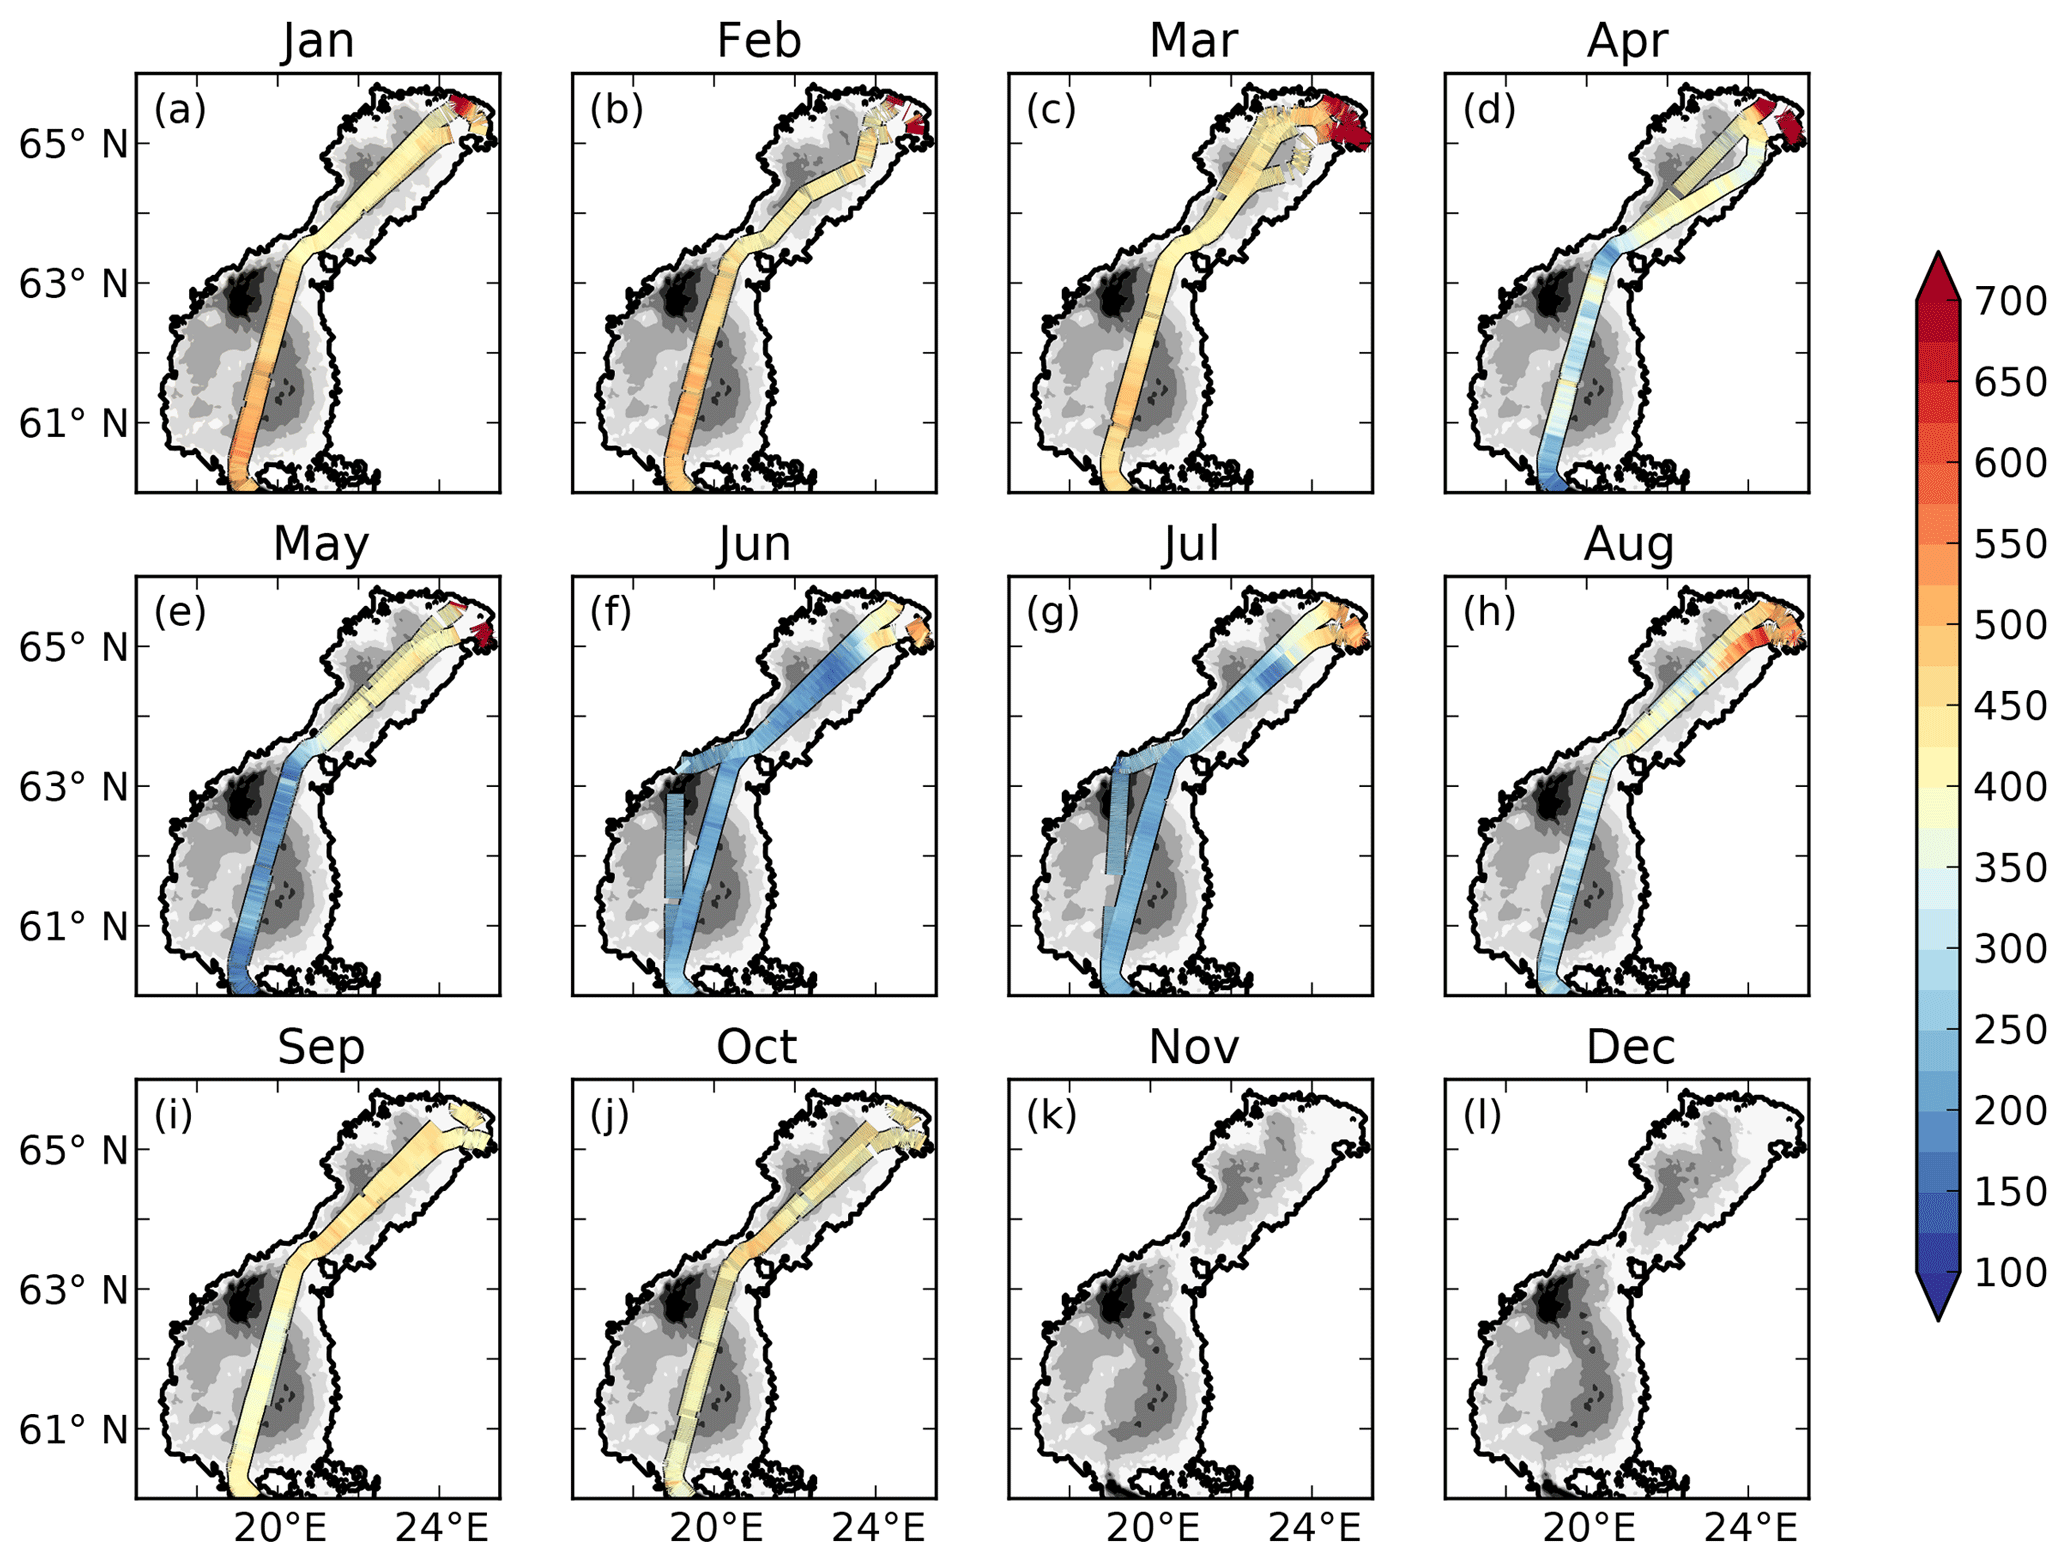
Figure 2Observed (filled lines) pCO2 (µatm) and cargo route for each month. The filled contours show the bathymetry of the model.
2.3 Simulations
The experiments have been performed in three sets (Table 1). In the first set, containing two experiments, all terrestrial organic carbon (both particulate and dissolved) is excluded. The first experiment (CHEM) investigates whether river water oversaturated in CO2 can explain the high pCO2 in the low-salinity region. This is carried out by excluding all biological processes in the water column and in the sediments. The model thus only computes the carbonate chemistry. The only processes affecting the state of the carbonate chemistry in this experiment are river discharge of total alkalinity and DIC, air–sea exchange, and changes in temperature and salinity (due to riverine and atmospheric forcing). In the second experiment, BIO, the biological processes are activated to see whether remineralization of autochthonous organic carbon, in both the sediments and the water column, can explain the waters oversaturated in CO2.
Table 1Experimental setup.
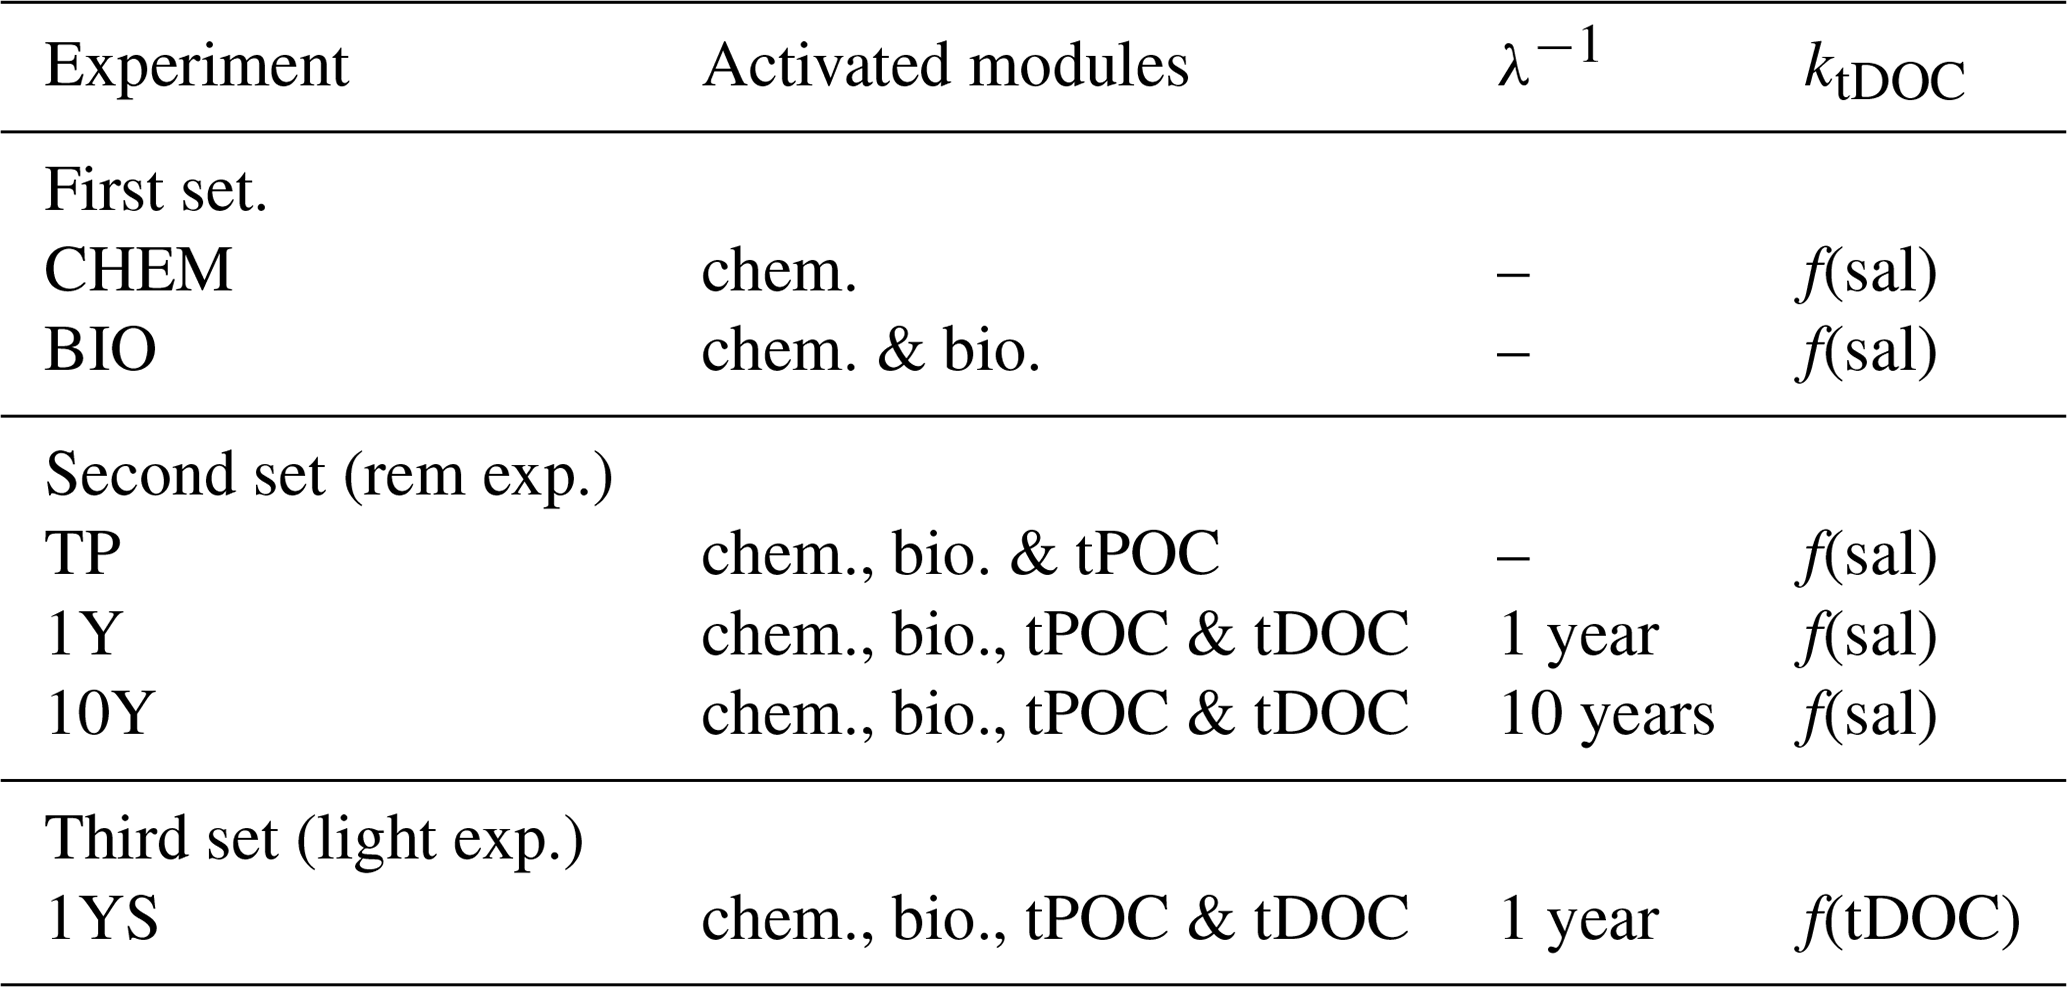
The second column shows the activated modules in the biogeochemical model, where chem. is chemistry, bio. is biology, and tPOC and tDOC mean that there is a remineralization of terrestrial POC and DOC, respectively. The third column shows the remineralization timescale (λ−1) of the terrestrial DOC and the last column, ktDOC, indicates whether the influence of the tDOC on the light attenuation is a linear function of salinity (Eq. A4 in Fransner et al., 2018) or tDOC (Eq. 1).
In the second set, the remineralization experiments (Table 1), the remineralization kinetics of riverine POC and DOC are examined by running three experiments, TP, 1Y and 10Y. The aim of these experiments is to investigate whether remineralization of tPOC is enough to explain the high pCO2 in the low-salinity region, or if a remineralization of tDOC (and in that case on what timescale) is needed. The TP experiment is the same as the BIO experiment, with the addition of the supply of terrestrially derived POC. For simplicity we have not added a separate group for terrestrial POC and it is therefore subject to the same dynamics as the autochthonous POC, meaning that it is degraded by bacteria with a timescale of 10 days. As the terrestrial POC only consists of 10 % of the total load of riverine organic carbon, this assumption does not have a significant impact on our results.
The 10Y and 1Y experiments are the same as the TP experiment, but with the addition of tDOC subject to a linear remineralization rate. These experiments are based on Fransner et al. (2016), who showed, by using a passive tracer representing tDOC in a 3-D physical model of the Baltic Sea, that observed concentrations of tDOC in the Baltic Sea (Deutsch et al., 2012) can be obtained with two different parameterizations of tDOC removal. In the first parameterization, a decay rate on the timescale of 10 years was applied to 100 % of the tDOC entering the Baltic Sea. In the second one, 20 % of the tDOC was assumed to be refractory (resistant to removal), and 80 % was assumed to be labile subject to a decay rate on the timescale of 1 year. Here we apply the same experiments in a biogeochemical model. Because tDOC can be remineralized by both bacteria and solar radiation, and there is no clear consensus on which of these are the dominating processes in the Baltic Sea, we use the same linear decay as in Fransner et al. (2016) that is assumed to include the effect of both of these processes, instead of letting the tDOC be degraded by the bacteria in the model. In the 1Y experiment (similar to the REF experiment in Fransner et al., 2018) a decay constant of 1 year−1 is applied to 80 % of the tDOC (the labile pool) entering the Gulf of Bothnia, and the remaining 20 % is assumed to be refractory. The refractory part of the tDOC is not modelled explicitly and is removed from the river load. In the 10Y experiment a decay constant on the timescale of 10 years is applied to the whole pool of tDOC. The remineralized tDOC goes directly to the DIC pool. Terrestrially derived organic nutrients have been shown to be important nutrient sources for phytoplankton in the Baltic Sea (Stepanauskas et al., 2002). The input and degradation (with a degradation rate on the timescale of 1 year) of terrestrial organic nutrients (Fransner et al., 2018) are constant over all experiments and all three sets to make sure that any differences in pCO2 are not caused by changes in primary production.
The third set contains one experiment (1YS) that is similar to the 1Y experiment, but where a tDOC-dependent light parameterization is used instead of a salinity-dependent one (Eq. A4 in Fransner et al., 2018). The aim of 1YS is to investigate the potential indirect effect tDOC could have on the pCO2 by dampening phytoplankton growth and carbon fixation. Unfortunately, there are few data available for simultaneously measured DOC concentration and photosynthetic available radiation. We have therefore created a simple parameterization in which we let the tDOC-induced light extinction coefficient () vary as a linear function of the labile tDOC according to
where tDOCl is the concentration of the labile tDOC in mg C m−3, the constant 10−3 has the unit m−1 (mg C)−1 m3 and has the unit m−1. This means that is 0.15 at zero labile tDOC concentration and amounts to 7.5 close to river mouths. The reason for to be 0.15 at zero concentration of labile tDOC is to take into account the contribution of the refractory tDOC, which is not modelled explicitly in our experiments. , together with the modelled chlorophyll-a and POC concentration, modulates the total light extinction coefficient kd, which ranges from 0.23 to 7.6 in surface waters (Fig. 3). Ask et al. (2009) measured light extinction coefficients up to 4 in Swedish lakes, and Arst et al. (2008) measured as high as 10 at about the same maximum DOC concentrations as in Finnish rivers that drain into the Gulf of Bothnia, suggesting that our modelled kd lies within a reasonable range. The tDOC-dependent light parameterization results in a steeper gradient in the light extinction coefficient between coastal and offshore waters than in the 1Y experiment (Fig. 3). While kd in the middle of the basins is rather similar in the two simulations, the kd is much larger in the coastal waters in the 1YS experiment.
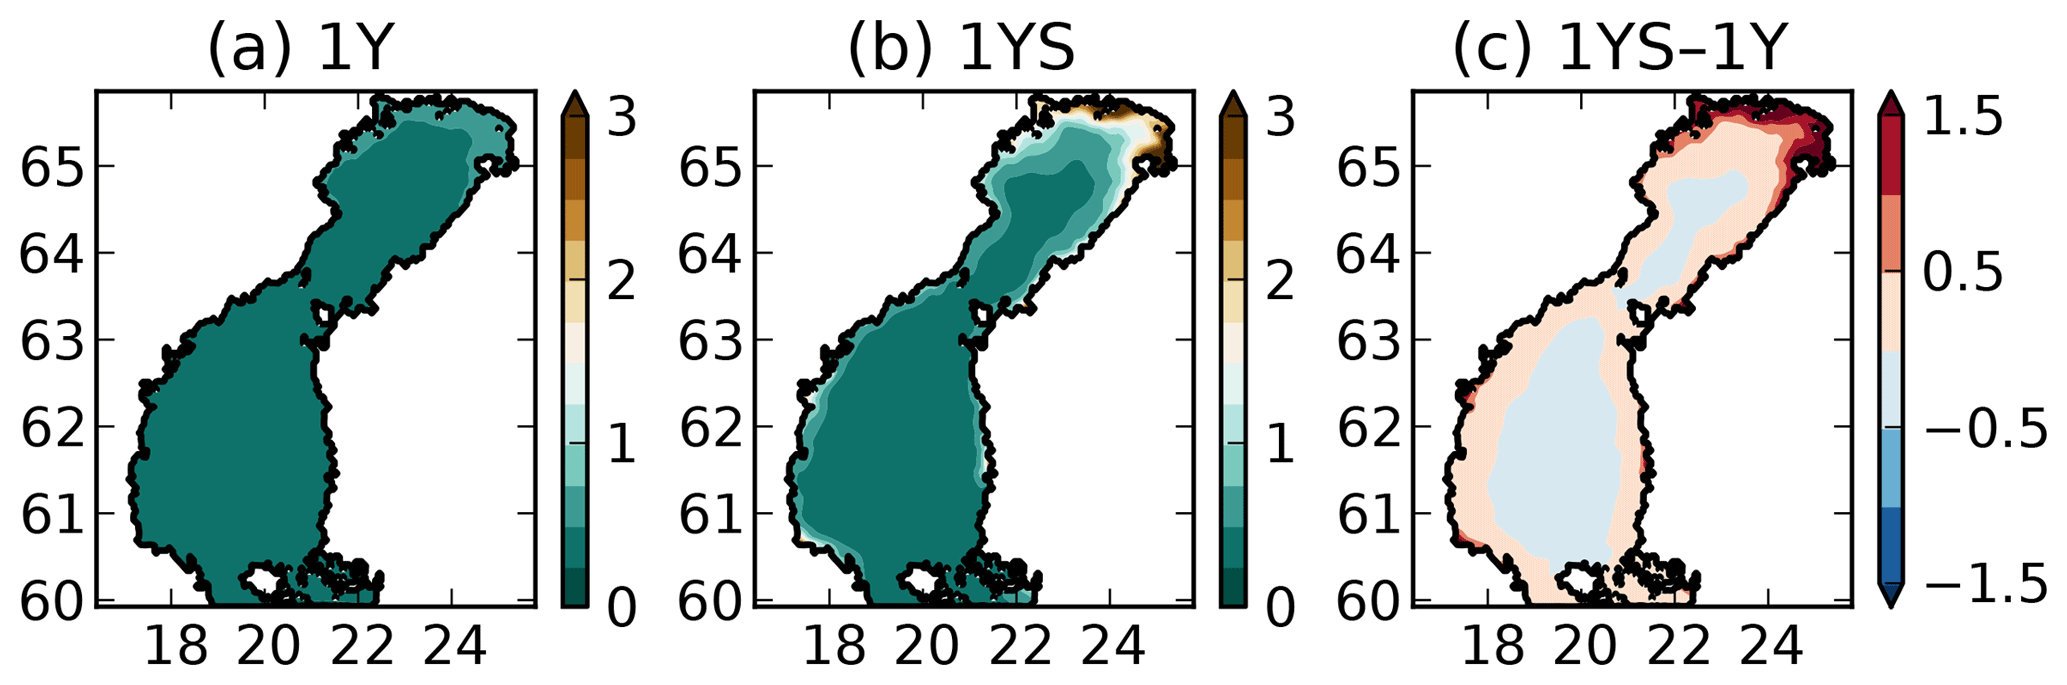
Figure 3Modelled light extinction coefficient (m−1) in the (a) 1Y and the (b) 1YS experiments and (c) the difference (1YS–1Y).
All simulations are run for 20 years, from 1990 to 2010, and the output data are saved at a monthly frequency. The simulations are started from restarts after a 10-year spinup (REF experiment in Fransner et al., 2018). Climatological means (20 years) of the simulations are compared to the observed pCO2. The comparison between modelled and observed pCO2 will be carried out in salinity space as the influence of river discharge on the pCO2 becomes more apparent with these coordinates. Maps of modelled salinities are shown in Fig. S2 in the Supplement.
3.1 Description of observed pCO2
There is a strong seasonal as well as spatial variability in the observed pCO2 (Fig. 2). In January to March rather high pCO2 values of 400–500 µatm are observed in the offshore areas. In the north-eastern parts of the Bothnian Bay, supersaturated waters of up to 1500 µatm are observed. In April the spring bloom begins in the Bothnian Sea and patches of undersaturated waters can be observed. The waters in the Bothnian Bay stay oversaturated. In May, the waters are undersaturated in pCO2 in the Bothnian Sea and oversaturated in the Bothnian Bay. The waters in the north-eastern parts of the Bothnian Bay also stay highly oversaturated (> 1000 µatm) in the observations in April and May. During June and July the waters in almost the entire domain are undersaturated. The waters in the north-eastern parts are, however, slightly oversaturated. In August the pCO2 starts rising due to a combination of lower productivity and mixing/entrainment of CO2-rich deep water, and in October pCO2 returns to 400–500 µatm. In the north-eastern Bothnian Bay no CO2 supersaturated (pCO2 > 1000) waters are found during September and October. During November and December no observational data exist.
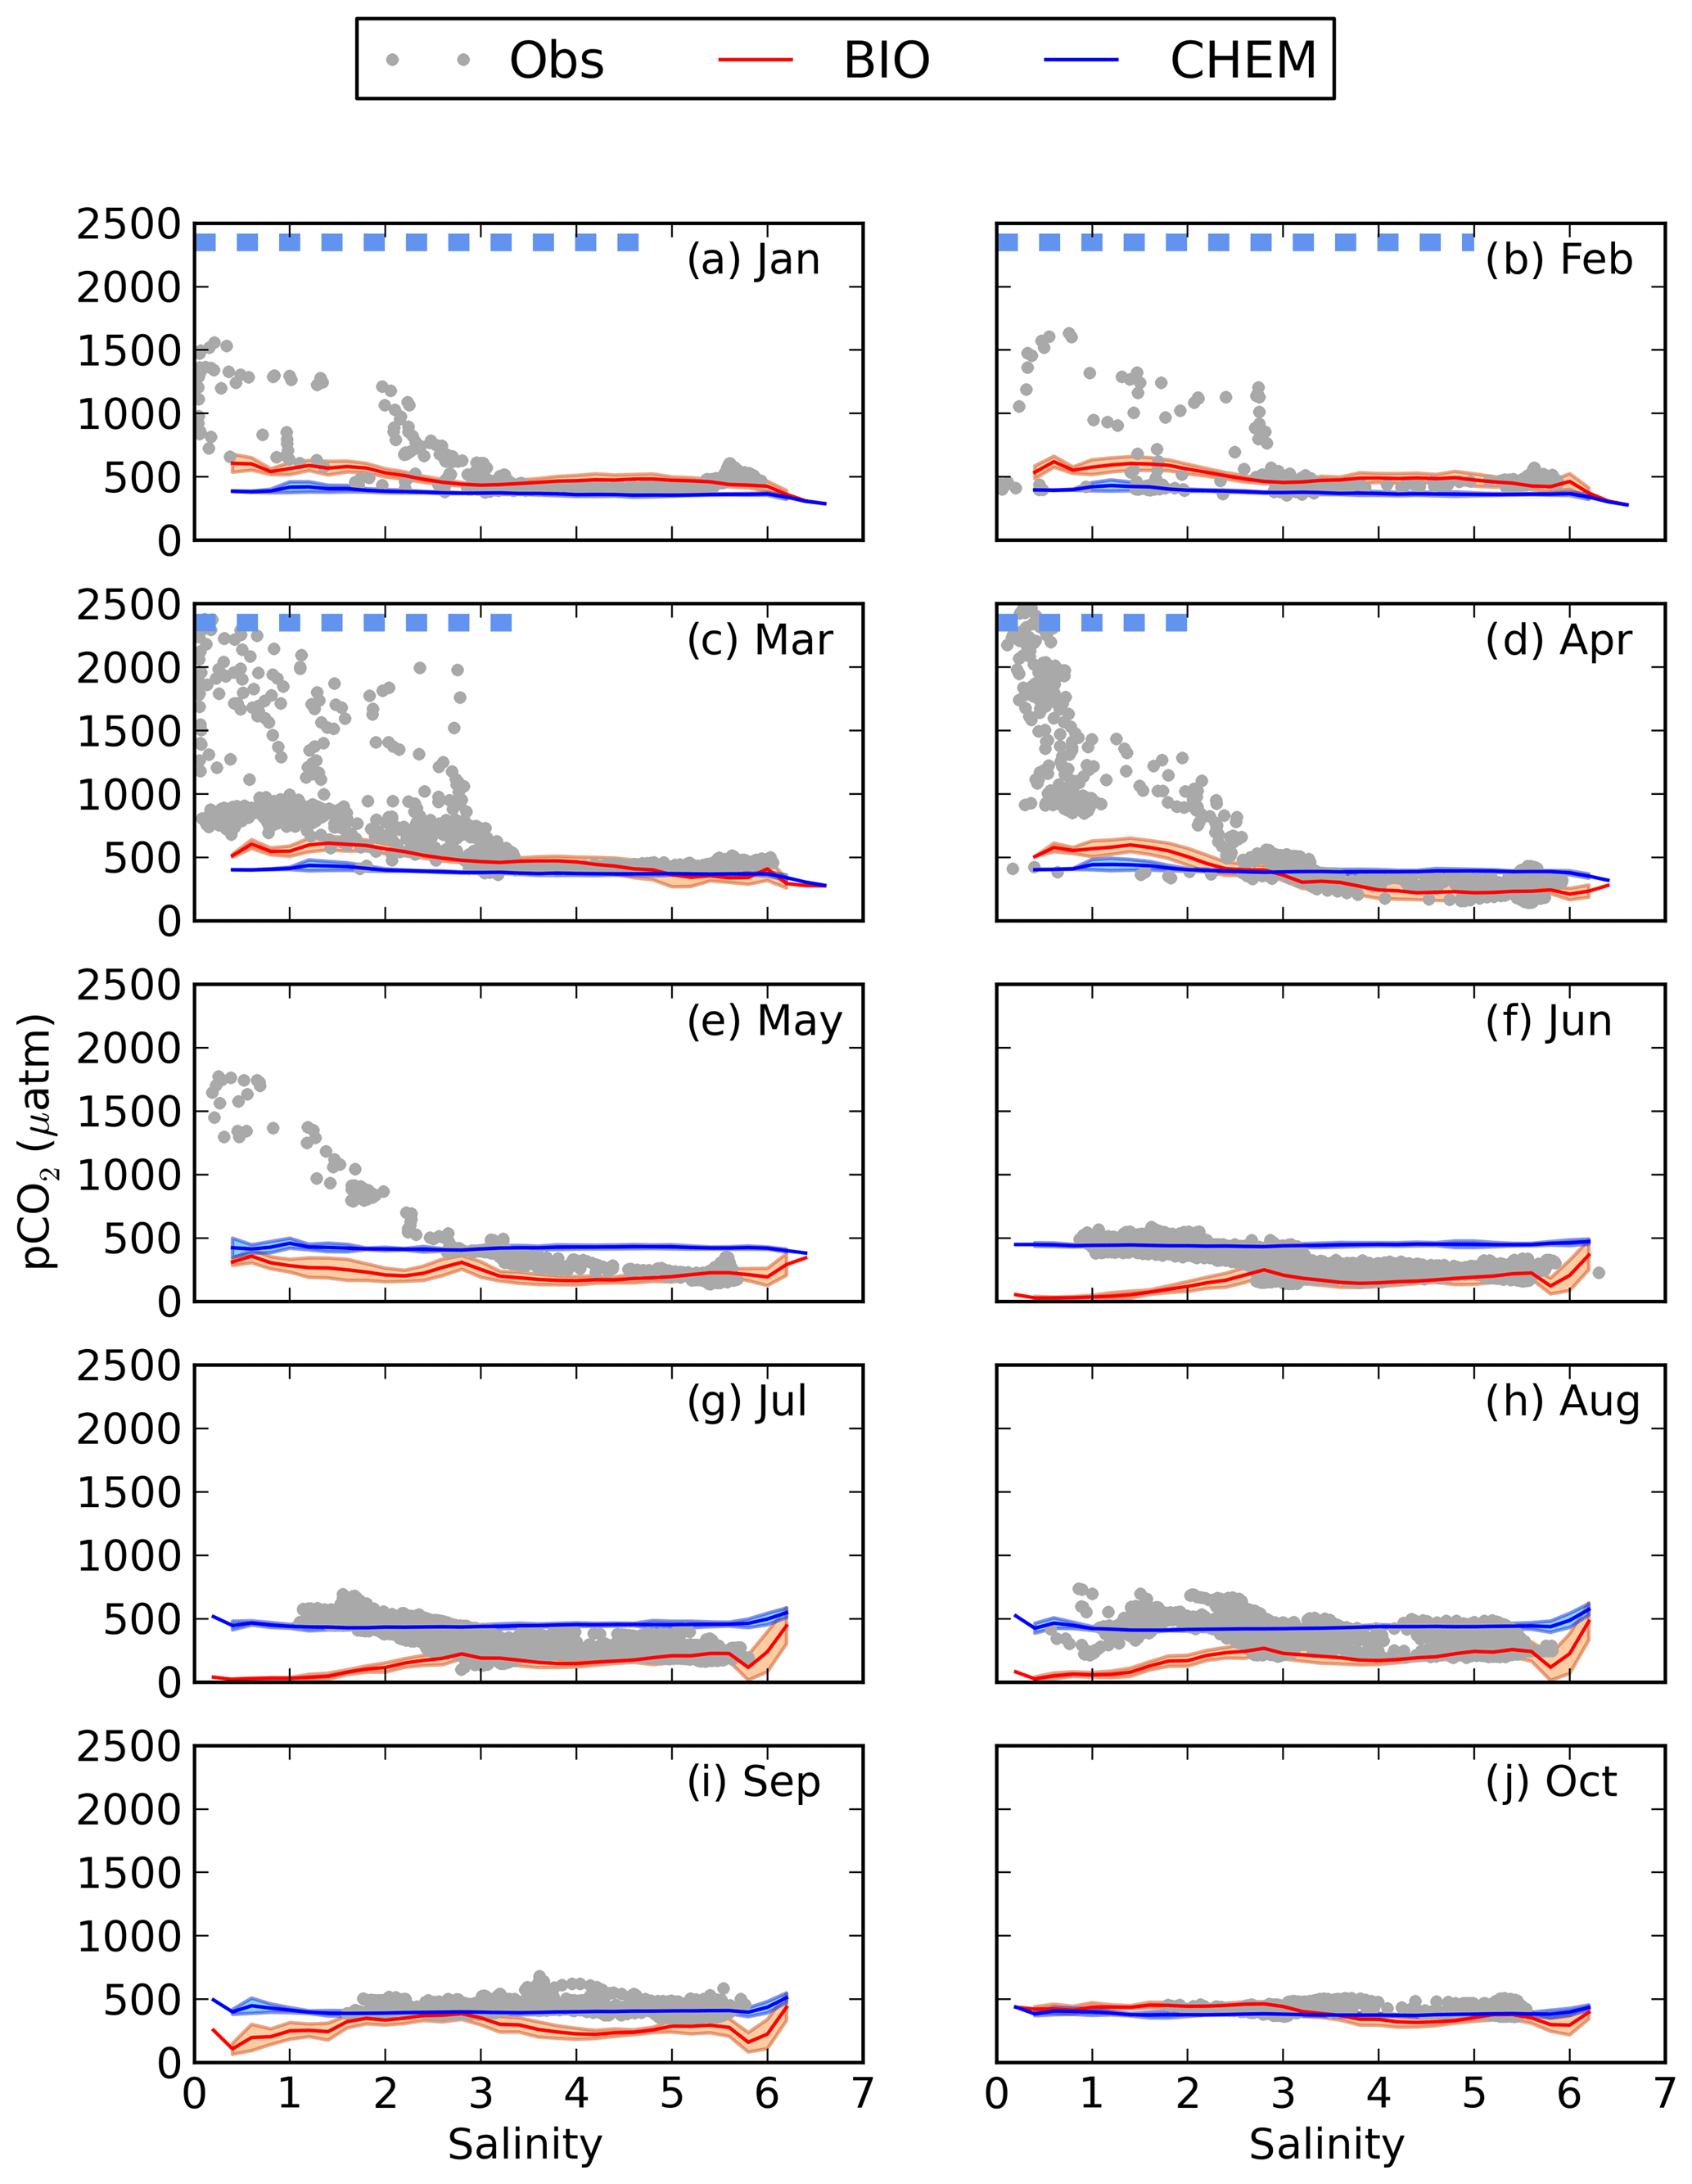
Figure 4pCO2–salinity relationships for January–October (a–j). Grey dots show observed values. The red and blue lines show modelled climatological monthly means for the BIO and the CHEM experiments, with the shaded area displaying the standard deviation at a given salinity. The dashed blue line shows the ice extent (salinities at which the ice concentration is larger than 60 %).
The influence of river water on the pCO2 becomes clearer in salinity coordinates (i.e. if plotting the pCO2 against salinity instead of in lat–long coordinates; Fig. 4). A distinct decrease in pCO2 with increasing salinity is observed in particular from January to May. High pCO2 values well above 1000 µatm are observed at salinities below 3. The pCO2 values in this low-salinity region (0–3) are scattered, but there seems to be a general pattern with two branches, one with higher pCO2 and one with lower. They might correspond to whether the ship was breaking through compact sea ice or going in an already open channel. Also in June and July there is a clear decrease in pCO2 with salinity, although the pCO2 in the low-salinity region is not as high as during the first 5 months of the year. In August the pCO2 values in the low-salinity region are rather scattered. In September and October no pCO2 measurements exist in the waters with the lowest salinity.
3.2 High pCO2 river water and marine organic carbon
When comparing modelled pCO2 in the CHEM experiment with the observations it becomes clear that discharge of river water oversaturated in CO2 cannot explain the observed high pCO2 values in the low-salinity region (Fig. 4). The influence of river water on pCO2 is overall negligible for the pCO2 dynamics in the Gulf of Bothnia, and the modelled pCO2 in the CHEM experiment is close to atmospheric equilibrium, with the exception of temperature effects that causes a seasonal variation in the pCO2 of up to 100 µatm.
When activating the biology and the autochthonous production of organic carbon (the BIO experiment), as well as the water–sediment interaction, the model simulates a slight oversaturation of CO2 in the low-salinity region during January–April (Fig. 4). It is, however, not high enough to explain the observed pCO2 values. During summer the model draws down the pCO2 too much in the low-salinity area, which could be a result of either too little remineralization or a too high primary production.
3.3 Remineralization of terrestrial organic carbon
When adding river discharge of highly degradable terrestrial POC (tPOC) to the BIO setup (TP experiment), the model simulates the lower branch of the observed pCO2 in the low-salinity region from January to March (Fig. 5). It is, however, not enough to explain the observed high pCO2 values, indicating that there is not enough remineralization in this area.

Figure 5pCO2–salinity relationships for January–October (a–j). Grey dots show observed values. The black, red and blue lines show modelled climatological monthly means for the TP, 1Y and 10Y experiments, with the shaded area displaying the standard deviation at a given salinity. The dashed blue line shows the ice extent (salinities at which the ice concentration is larger than 60 %).
Subjecting tDOC to a decay, as in the 1Y and 10Y experiments, results in higher remineralization per volume unit where the highest concentrations of tDOC occur. Consequently, in the north-eastern Bothnian Bay, where the highest tDOC concentrations are found (not shown here, but in Fransner et al., 2016), the remineralization rates are also the highest (Fig. 6). It is in the areas with the highest remineralization that the largest impacts on the pCO2 are seen (Figs. 2 and 6). Adding remineralization of tDOC results in an increase in pCO2 by up to 350 in the coastal waters in the 1Y experiment, while the increase is only 80 in the 10Y experiment, on annual average (Fig. 6).

Figure 6(a, b) Vertically averaged remineralization rates of tDOC (g C m−3 yr−1) in the 1Y and 10Y experiments. (c, d) Difference in modelled pCO2 (µatm) and climatological annual mean between the 1Y and the TP experiments and (d) the 10Y and the TP experiments, respectively.
As seen in Fig. 5, the 1Y experiment reproduces the observed CO2-supersaturated (> 1000 µatm) waters in spring, although it does not capture the highest observed values. The 10Y experiment results in higher pCO2 than the TP experiment in the low-salinity region, but the differences are small, and it barely simulates a pCO2 above 1000 ppm, except at the lowest salinities. Interestingly, the high pCO2 values above 1000 µatm only exist during periods when there is sea ice, in both the 1Y experiment and the observations. When removing the damping effect of sea ice on the air–sea CO2 exchange, the 1Y experiment no longer simulates the higher pCO2 values, and the simulated pCO2 values in the low-salinity region approach the ones in the TP and 10Y experiments (Fig. S3 in the Supplement). This is an additional indication that the two observed branches in the pCO2 during the ice-covered months could be a result of whether the ship has travelled through open or ice-covered water.
During the productive season, none of the remineralization experiments, not even the one with a higher degradation of tDOC, are capable of reproducing the higher pCO2 values in the low-salinity region (Fig. 5e–h). This is probably due to a too high productivity, which will be discussed in Sect. 3.4.
3.4 Terrestrial DOC and light extinction
Adding a linear dependency of the light extinction coefficient on the tDOC concentration, as in experiment 1YS, gives a steeper gradient in the light availability between coastal and offshore waters (Fig. 3). The reduced light availability decreases the primary production and nutrient consumption in coastal areas (Fig. 7), which results in a larger transport of nutrients offshore, partly explaining the increased primary production in the middle of the basins. The parameterization of the light extinction coefficient in the 1YS also results in slightly clearer waters in the middle of the basins, which also increases the primary production. The tDOC-dependent light extinction has the largest effect in the Bothnian Bay, where the primary production is reduced by 25 % (Table 3). In the Northern Quark and the Bothnian Sea, as well for the whole domain, there is barely any change in the total primary production.
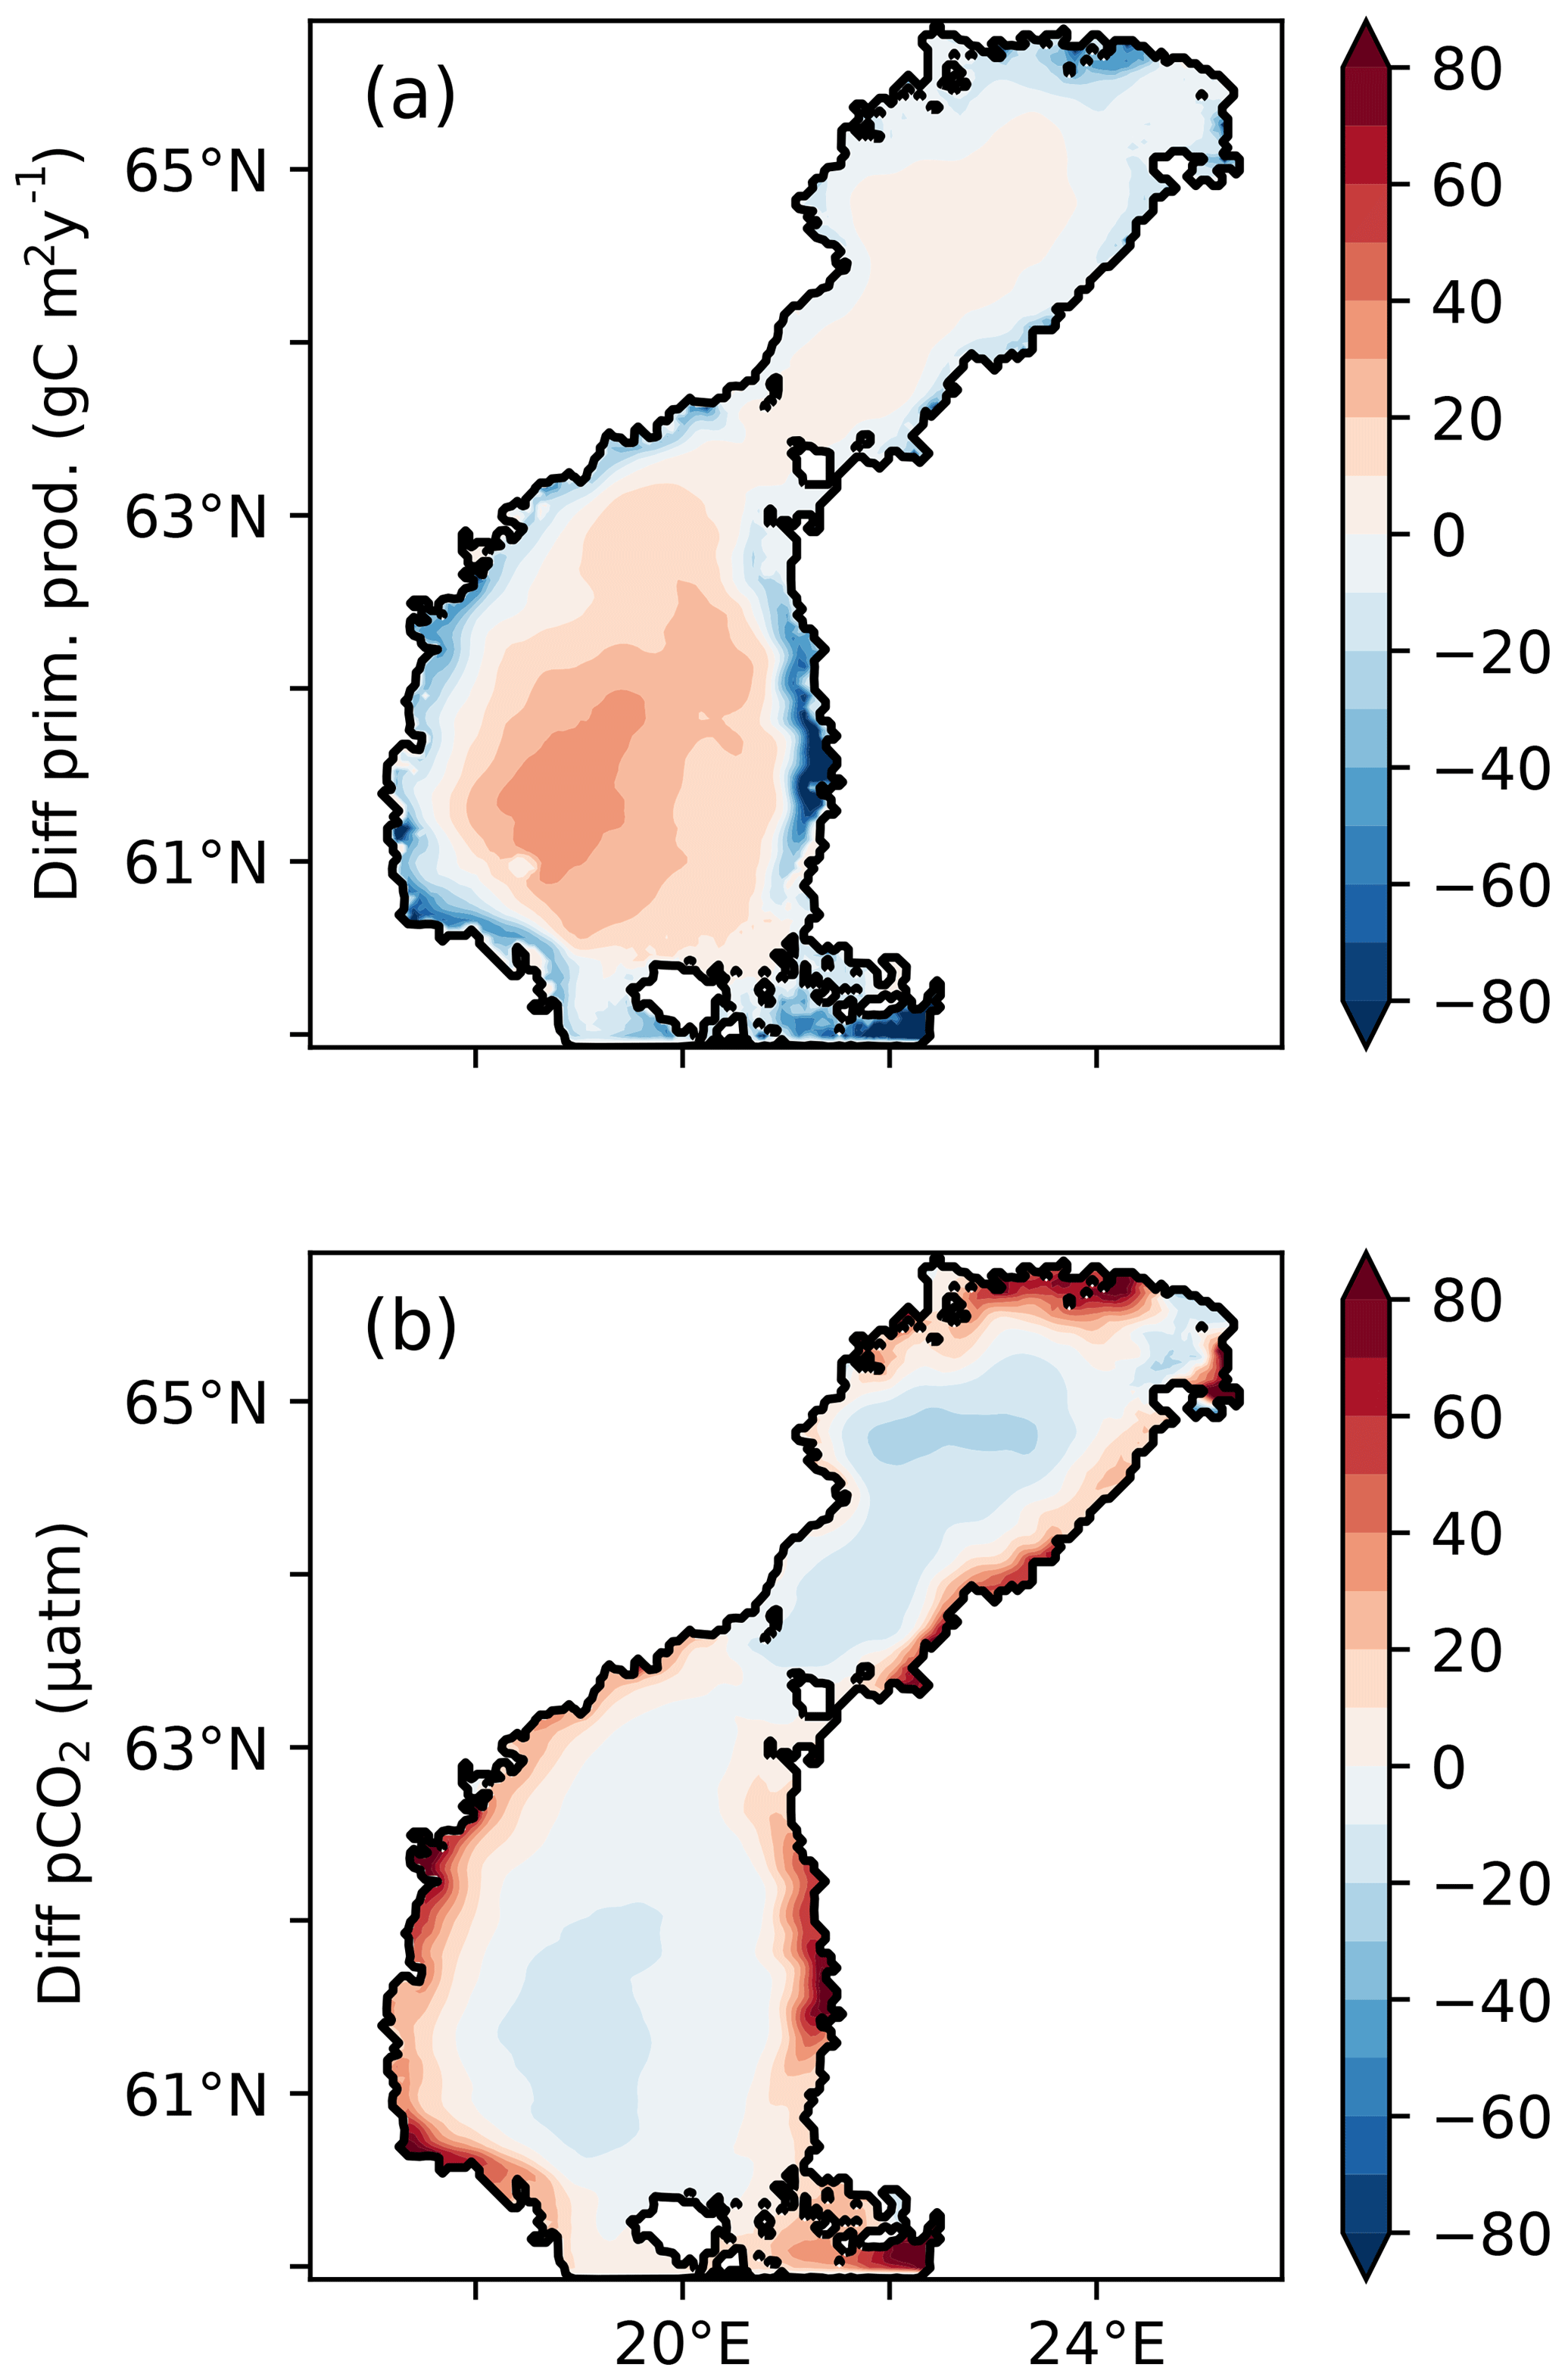
Figure 7Difference in (a) vertically integrated primary production (g C m−2 yr−1) and (b) pCO2 (µatm), between the 1Y and 1YS experiments.
The lower primary production in the coastal areas in the 1YS experiment leads to elevated pCO2 in these areas (Fig. 7). In the low-salinity region, the pCO2 also stays oversaturated during the summer period (Fig. 8) and agrees better with observed pCO2 than the 1Y experiment does. During the winter months the pCO2 in the low-salinity region is slightly decreased. The decrease is caused by the lower primary productivity and consequently the reduced export of organic carbon to the sediments, which leads to a lower DIC efflux from the sediments. A comparison of the simulated pCO2 in 1YS with observations in geographical space is shown in Fig. 9. It shows an overall good agreement with the observations. The largest discrepancies are found in the Bothnian Sea in March and September and are related to the onset of the spring bloom and the autumn mixing, respectively, which causes relatively large changes in pCO2 over a short period of time. Both of these discrepancies can be related to the fact that the model results show a monthly mean, while the measurements have been taken in the first half of the month for March and second half of the month of September. The measurements are therefore biased towards the period of high pCO2 in both March and September. The tDOC-dependent kd parameterization also results in a better agreement between modelled an observed seasonal cycles of nutrients in the north-eastern Bothnian Bay (Figs. S4 and S5 in the Supplement). In the middle of the basins (the stations in Fig. 1) the difference between the 1Y and 1YS experiments is small (Figs. S6–S19 in the Supplement).
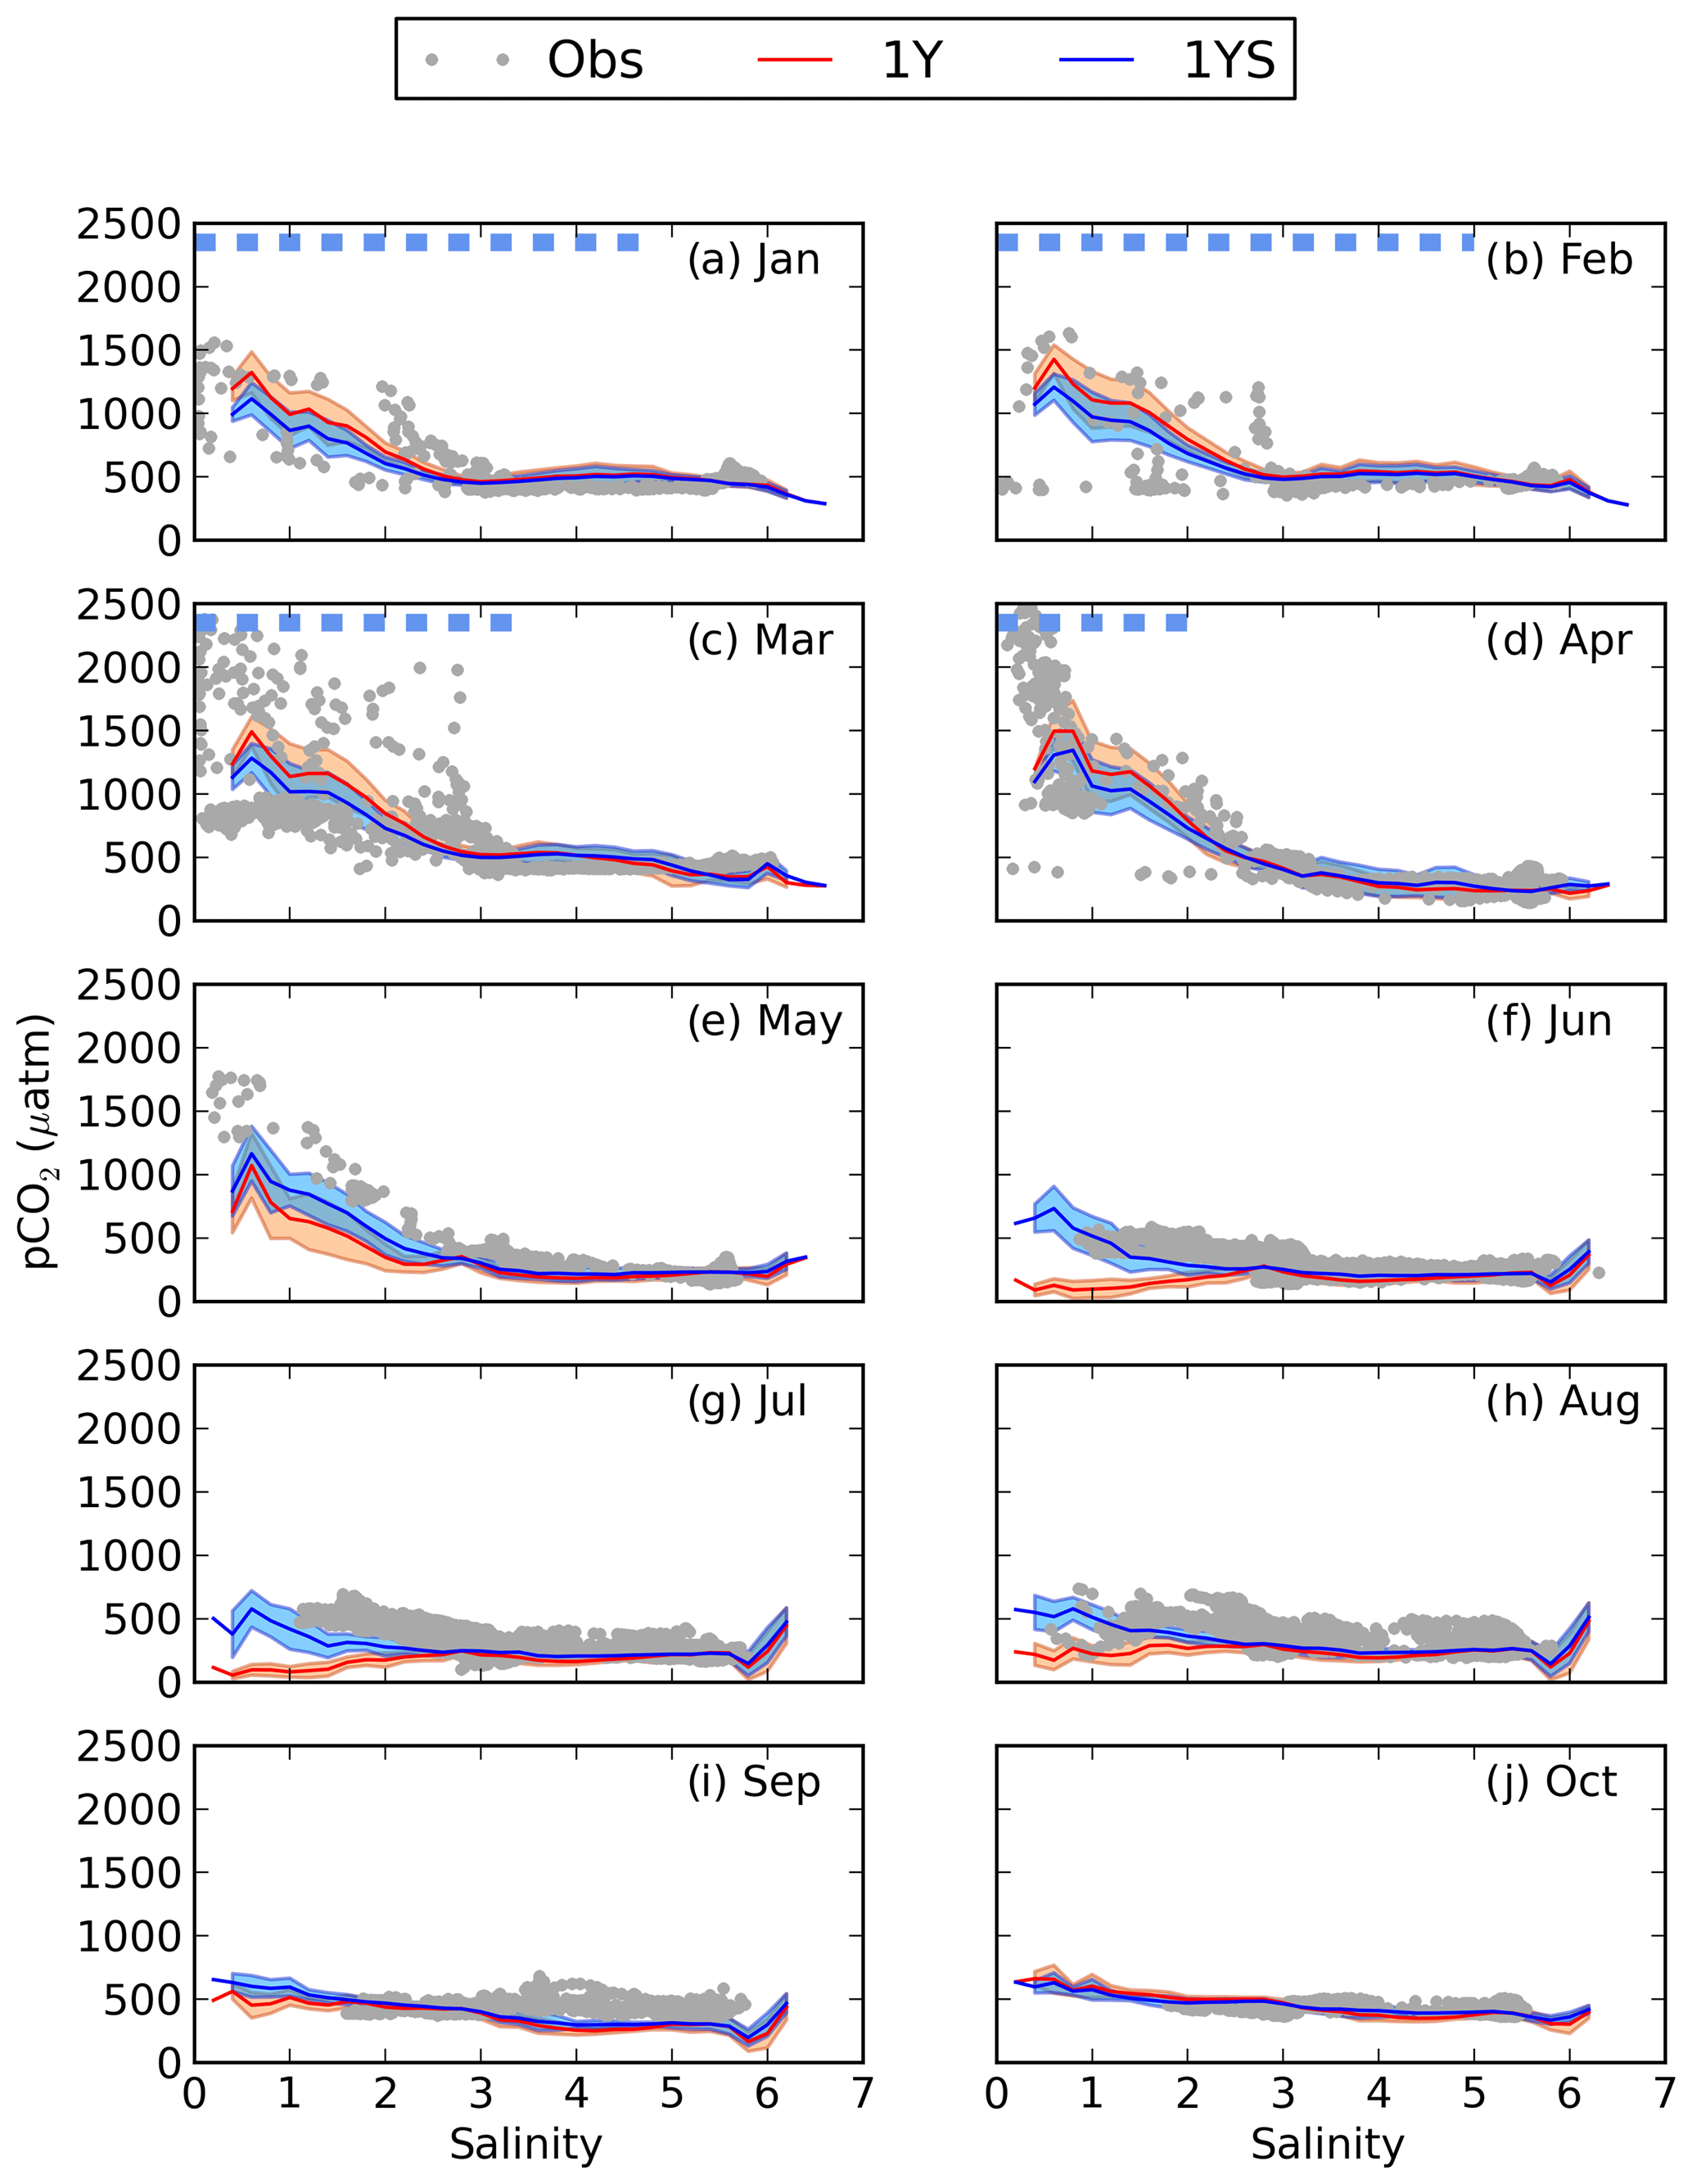
Figure 8pCO2–salinity relationships for January–October (a–j). Grey dots show observed values. The red and blue lines show modelled climatological monthly means for the 1Y and 1YS experiments, with the shaded area displaying the standard deviation at a given salinity. The dashed blue line shows the ice extent (salinities at which the ice concentration is larger than 60 %).
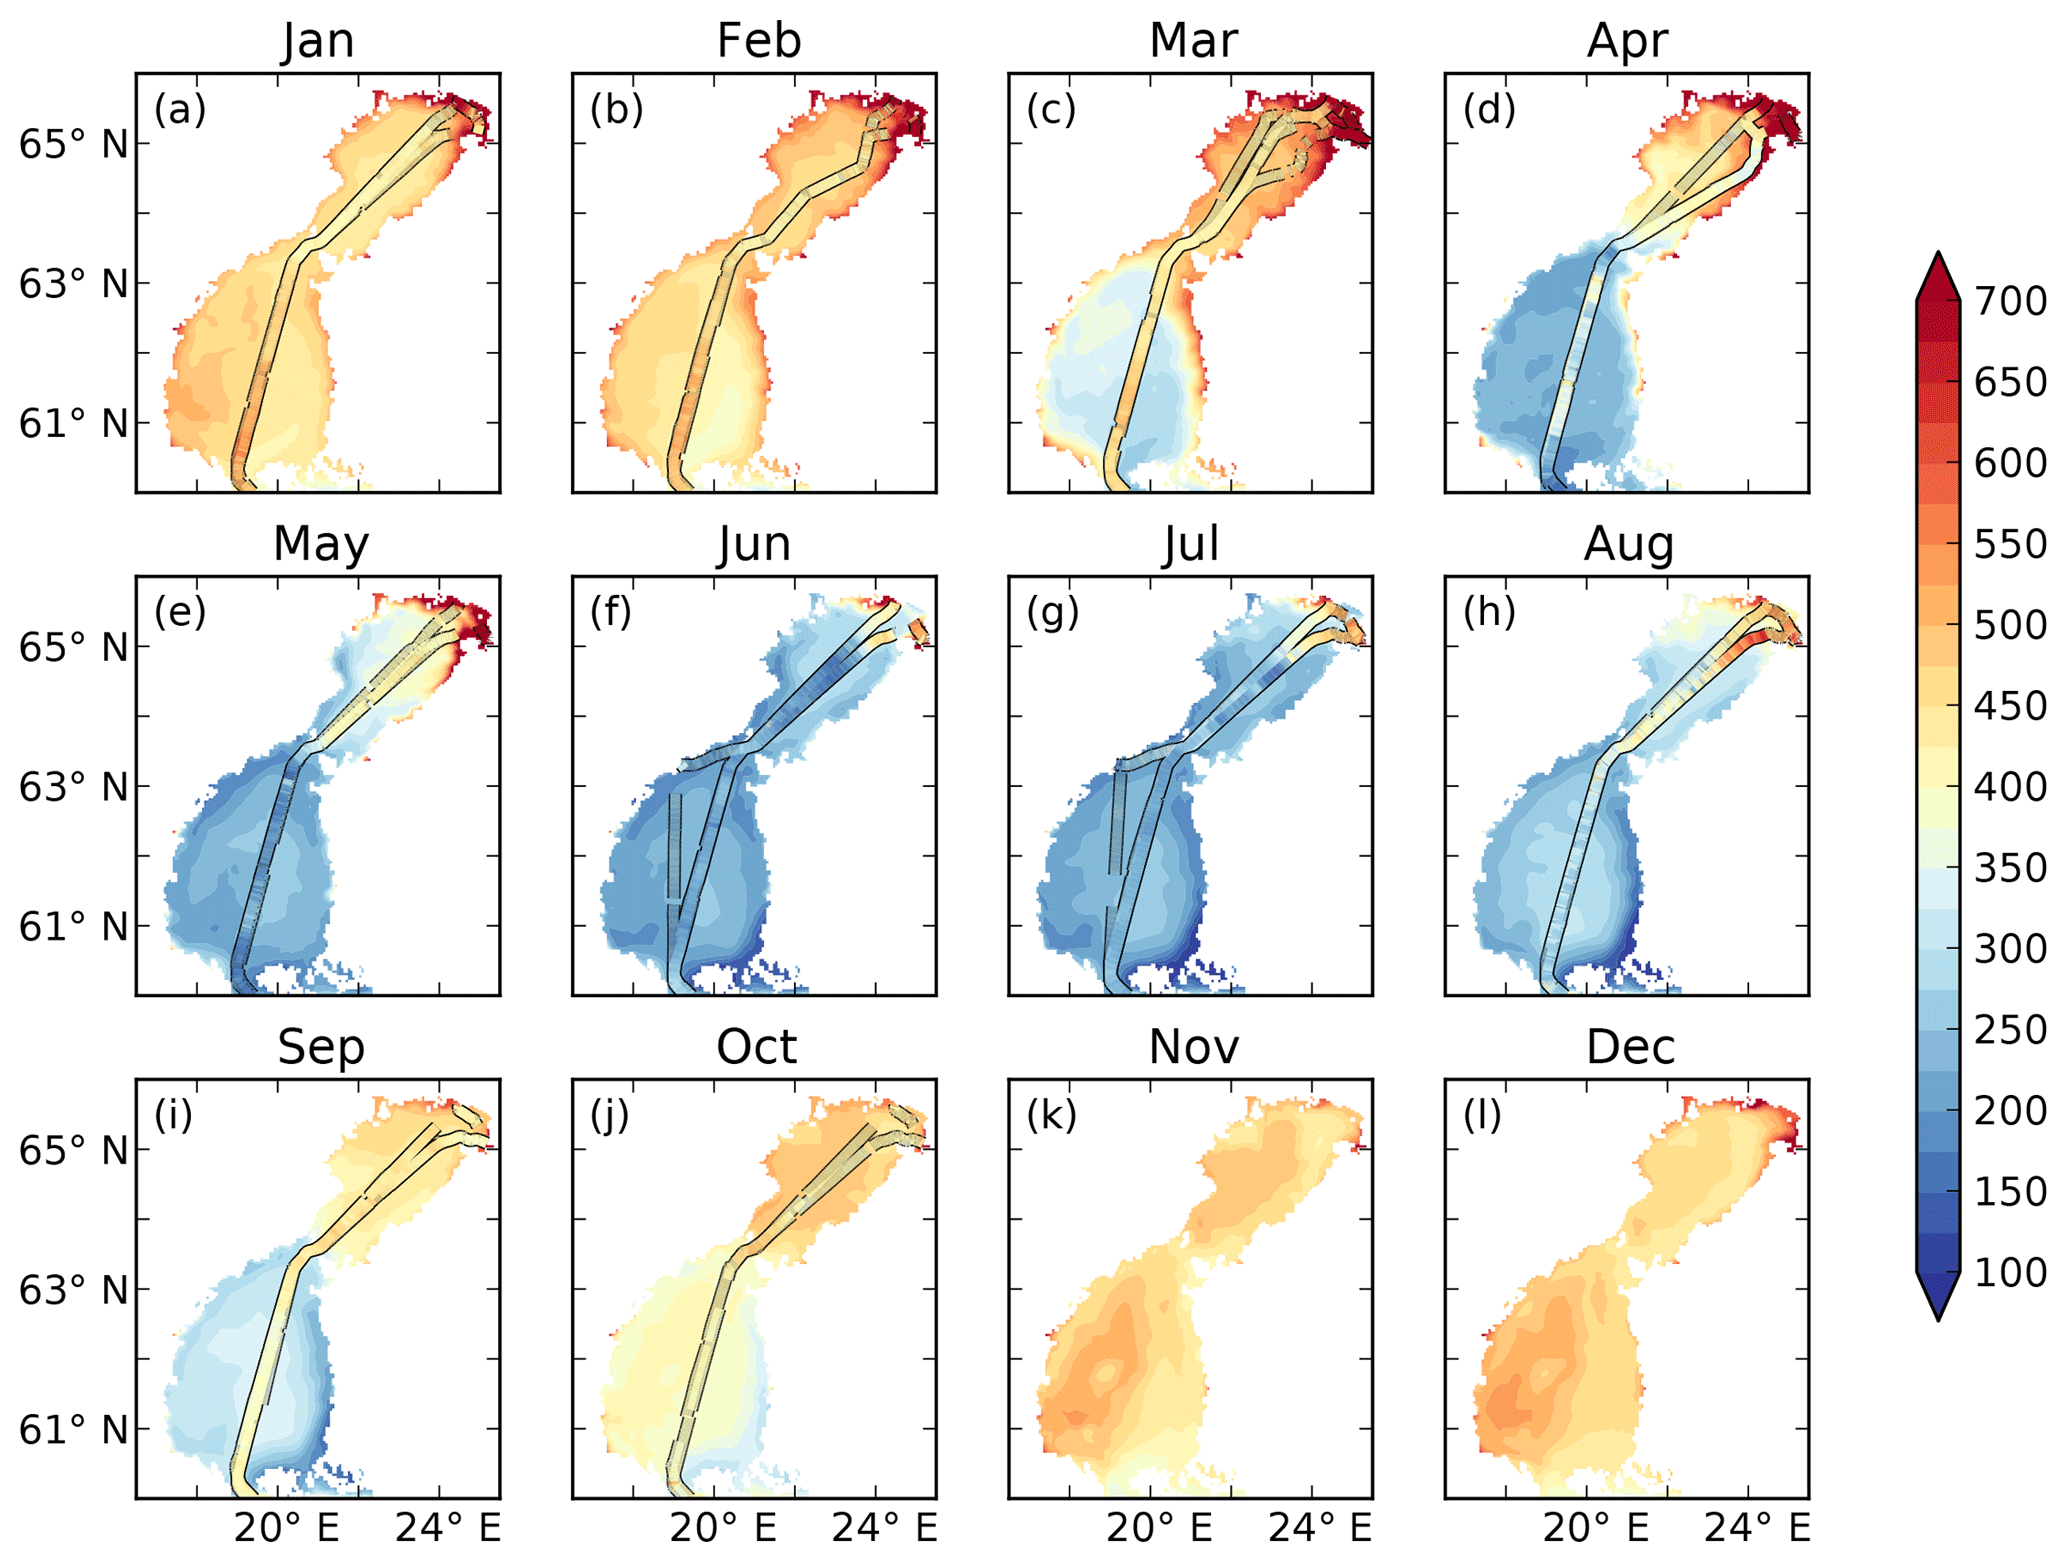
Figure 9Observed (filled lines) and modelled (filled contours) pCO2 (µatm) from the 1YS experiment.
4.1 Remineralization of terrestrial DOC
Our results clearly show that input of river water oversaturated in CO2 is not enough to explain the high pCO2 values observed in the northern Gulf of Bothnia and suggest that it is a result of a substantial remineralization of tDOC into DIC. Here we tried two different rates of remineralization, one on the order of 1 year applied to 80 % of the tDOC and one on the order of 10 years applied to 100 % of the tDOC. These removal rates were derived in a 3-D model (Fransner et al., 2016) to simulate observed concentrations of tDOC in the Baltic Sea (Deutsch et al., 2012). We showed here that only the simulation with the faster rate was able to reproduce the CO2 supersaturated waters, although it did not capture the highest observed values. The reason for this could be that there are more labile pools (with faster degradation rates) of the tDOC that we do not resolve in our relatively simple model. It is well known that organic matter consists of a continuum of pools with different lability that are subject to different remineralization rates (Hansell, 2013; Carlson et al., 2015). Pools with faster remineralization rates than the one we use would be remineralized closer to the river mouth and therefore cause higher pCO2 at lower salinities.
The fact that the removal rate of tDOC in the 1Y experiment not only results in a good agreement between observed and modelled concentrations of tDOC, as shown in Fransner et al. (2016), but also results in a good agreement with observed pCO2 values suggests that remineralization of tDOC into DIC is the main mechanism behind tDOC removal in the Gulf of Bothnia. In other words, flocculation into POC seems only to play a minor role in removal of tDOC from the water column, which also was suggested by Asmala et al. (2014b). The high pCO2 values observed during the ice season, when there is little light reaching the surface water, would further argue against photochemical degradation as the main removal mechanism, in contrast to what was suggested by Aarnos et al. (2012). Incubation experiments do however suggest that only 10 %–20 % of the terrestrial DOC is available to bacterial degradation (Wikner et al., 1999; Asmala et al., 2013, 2014a; Herlemann et al., 2014; Hulatt et al., 2014; Figueroa et al., 2016). The timescale of these incubation experiments is, however, relatively short (on the order of weeks to a few months), and the availability could be larger if exposing the DOC to bacteria during a longer period of time, as discussed in Fransner et al. (2016).
Knowing the incubation length in time, and the relative change in DOC concentration, an average degradation rate of tDOC during the time of incubation can be calculated based on the classical expression for exponential decay:
where λ is the decay constant (degradation rate), t is the incubation length in years, C is the concentration of DOC at the end of the incubation and C0 is the concentration of DOC at the start of the incubation. Rearranging Eq. (2), an expression for λ is obtained:
Table 2Removal of terrestrial DOC in incubation studies from the Gulf of Bothnia area.
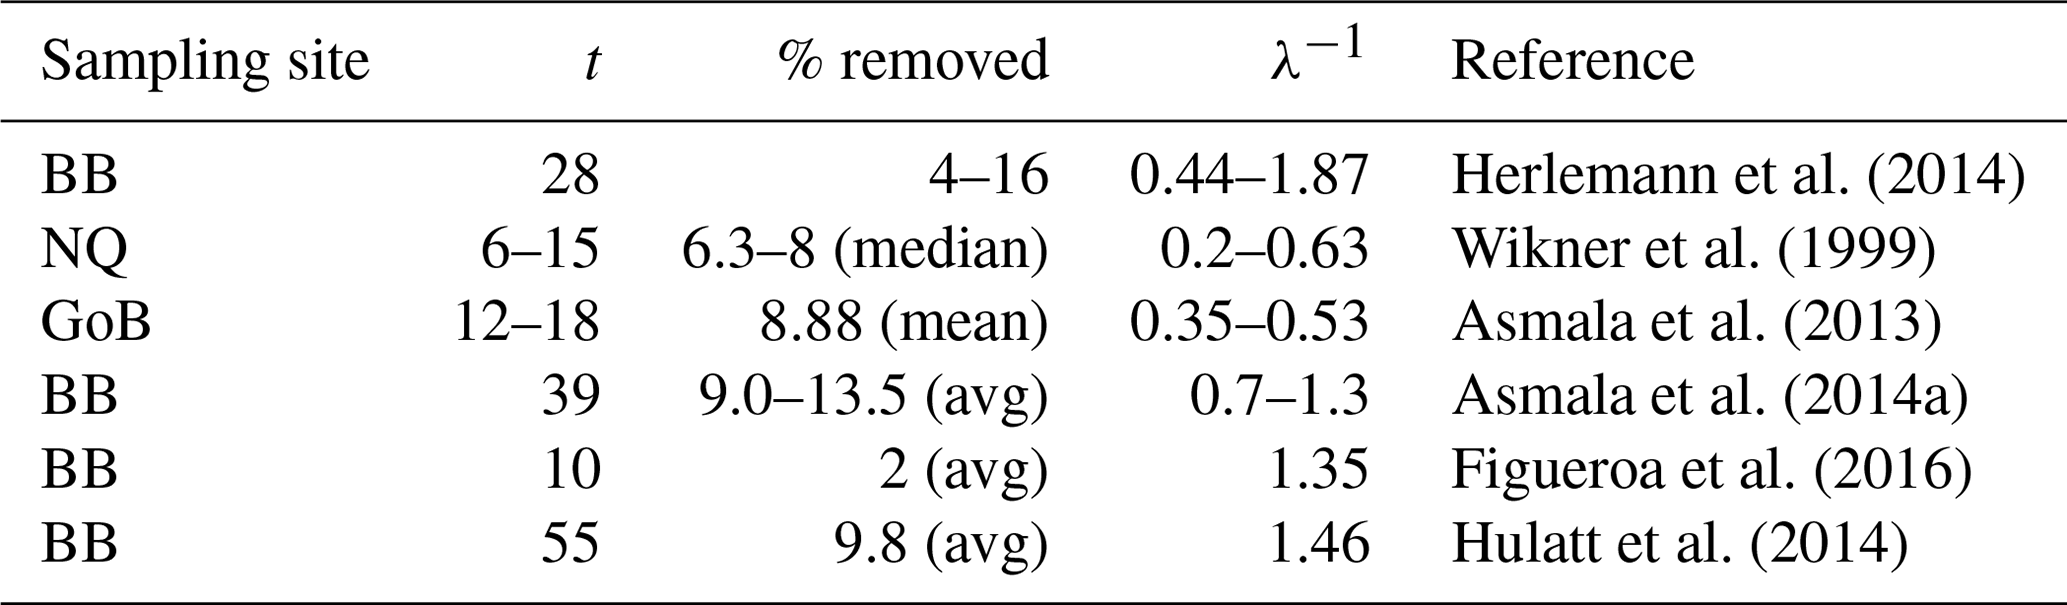
The first column shows the site of the sampling, where BB is Bothnian Bay, NQ is Northern Quark and GoB is the whole Gulf of Bothnia (Fig. 1). The second column shows the length of the incubation in days and the third column shows the percentage of tDOC that has been removed at the end of the incubation (if average values are available these values have been reported, otherwise ranges are reported). The fourth column shows the calculated timescale of degradation based on Eq. (3).
Table 3Primary production (1990–2010) in g C m−2 yr−1 in the 1Y and 1YS experiments (relative change with respect to 1Y).

Interestingly, when calculating the degradation rates for various published incubation experiments from the Gulf of Bothnia, many of them are on the timescale of the order of 1 year (Table 2), the same timescale that we use for the degradation in our 1Y experiment1. This indicates that bacteria could be capable of remineralizing similar amounts of tDOC as in our experiments and in Fransner et al. (2016) (80 % of the load to the Baltic Sea), if only considering longer timescales than those of the incubation experiments. This is in line with what was suggested by Kuparinen et al. (1996) and Sandberg et al. (2004), who, based on extrapolations of the carbon demand of secondary producers, suggested that a large part of the tDOC entering the Gulf of Bothnia is degraded by bacteria. Table 2 gives furthermore an additional indication that the 1Y experiment is more realistic than the 10Y experiment.
Equation (3) is a very simple model of degradation; organic matter tends to consist of several pools subject to different degradation rates (Hansell, 2013; Carlson et al., 2015). Three of the incubation experiments in our comparison (Table 2) have several sampling points in time that indicate that the degradation rate decreases with time and that the tDOC consists of more than two pools of different lability in contrast to our experiment 1Y (Asmala et al., 2014a; Herlemann et al., 2014; Hulatt et al., 2014). Hulatt et al. (2014), for example, calculate the degradation rates with a continuum model at different times during the incubation and report degradation rates on the order of 3 months in the beginning and 5 years in the end of their experiments (after 55 days). When working on larger spatial scales such as the one our model and our in situ measurements cover, it is however difficult to go into these fine details of degradation dynamics.
There are further many aspects that complicate a detailed comparison between results from incubation experiments to what is happening in the natural environment (from which we use observations to compare our model results to). Incubations are rather artificial environments, where effects of turbulence, stratification, sunlight and interactions with other organisms/chemical constituents are often absent (depending on the experimental setup). It has been suggested, for example, that the lability of relatively refractory organic matter can increase in the presence of more labile substrates (priming) (Bianchi, 2011; Blair and Aller, 2011) and solar radiation (Vähätalo et al., 2011), which would not occur in incubation experiments.
4.2 Terrestrial DOC and light extinction
The results from the 1YS experiment show that a strong extinction of light induced by terrestrially derived organic matter, hampering the primary production, could explain why the waters stay oversaturated in pCO2 in summer. It does not only improve the modelled pCO2, but also results in a better agreement between modelled and observed seasonal cycles of nutrients in the north-eastern Bothnian Bay (Figs. S4 and S5 in the Supplement), further suggesting that this parameterization is reasonable. The measurements in Arst et al. (2008) and Ask et al. (2009) show a large spread in the light extinction coefficients for different lakes, and we based our parameterization on the upper values that they present. We also conducted experiments in which the effect of tDOC on the light attenuation was weaker and kd reached up to 1 at the lowest salinities. This was however not strong enough to prevent a too large drawdown of the pCO2. Local measurements of kd and DOC would be needed to better understand the influence of tDOC on light attenuation in the Gulf of Bothnia and to create a more precise parameterization.
Although the tDOC-dependent light parameterization has an overall negligible effect on the primary production in the Gulf of Bothnia (Table 3), it has quite large local effects. The primary production is reduced in coastal waters, leading to a larger offshore transport of nutrients. The filtering effect of coastal waters (Asmala et al., 2017) is thus decreased. Clearly, more measurements of the relationship between light and DOC are needed to better understand not only the carbon fixation in coastal waters, but also the exchange of nutrients between coastal and offshore waters.
4.3 The influence of terrestrial DOC on the air–sea CO2 exchange
The remineralization of tDOC in the 1Y experiment reduces uptake of atmospheric CO2 by 43 % in total (Table 4), compared to the simulation with no terrestrial DOC (TP simulation). The reduction in the atmospheric CO2 uptake (17.5, 8.3, 6.7, 10.0 m−2 yr−1) corresponds well to the amount of remineralized tDOC in each subbasin (18.2, 8.2, 6.6 and 10.1 mg m−2 yr−1 for BB, NQ, BS and the whole domain, respectively), indicating that almost all of the remineralized tDOC is outgassed to the atmosphere and that a negligible fraction of the remineralized DOC (1 %) adds to the DIC pool. A surplus of remineralized DIC is transported from the BB to the southern basins, which is why there is a slightly larger reduction in atmospheric uptake in these basins than calculated from the remineralized tDOC. The large amount of remineralized tDOC in the Bothnian Bay turns it to a source of atmospheric CO2 (Fig. 10), in agreement with estimations by Löffler et al. (2012). However, the modelled outflux of CO2 to the atmosphere in the Bothnian Bay is larger than their estimations. The simulated air–sea exchange in the 1Y and 1YS experiments agrees better with the estimations by Löffler et al. (2012) overall, than the simulation without any remineralization of tDOC, strengthening our findings that a remineralization of tDOC into DIC takes place.
Löffler et al. (2012)Table 4Air–sea CO2 exchange (1990–2010) in g C m−2 yr−1 in the TP, 1Y(relative change with respect to TP) and 1YS (relative change with respect to 1Y) experiments. Negative values indicate outgassing of CO2 to the atmosphere and positive uptake of CO2 from the atmosphere.
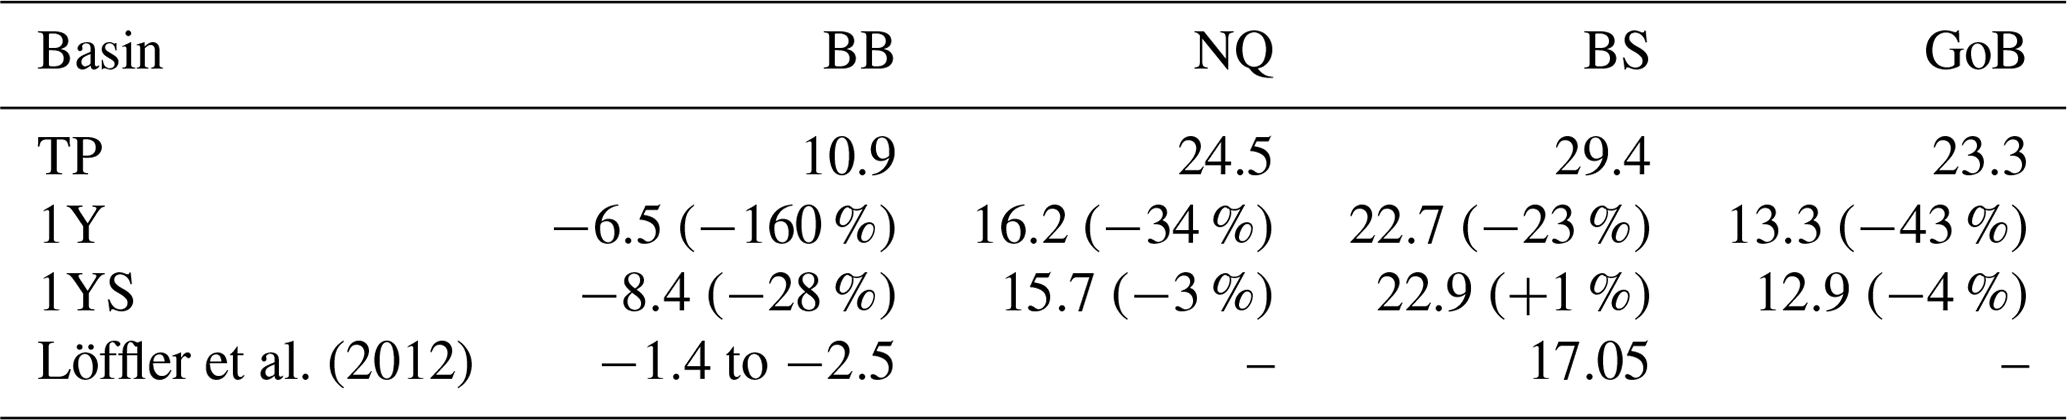
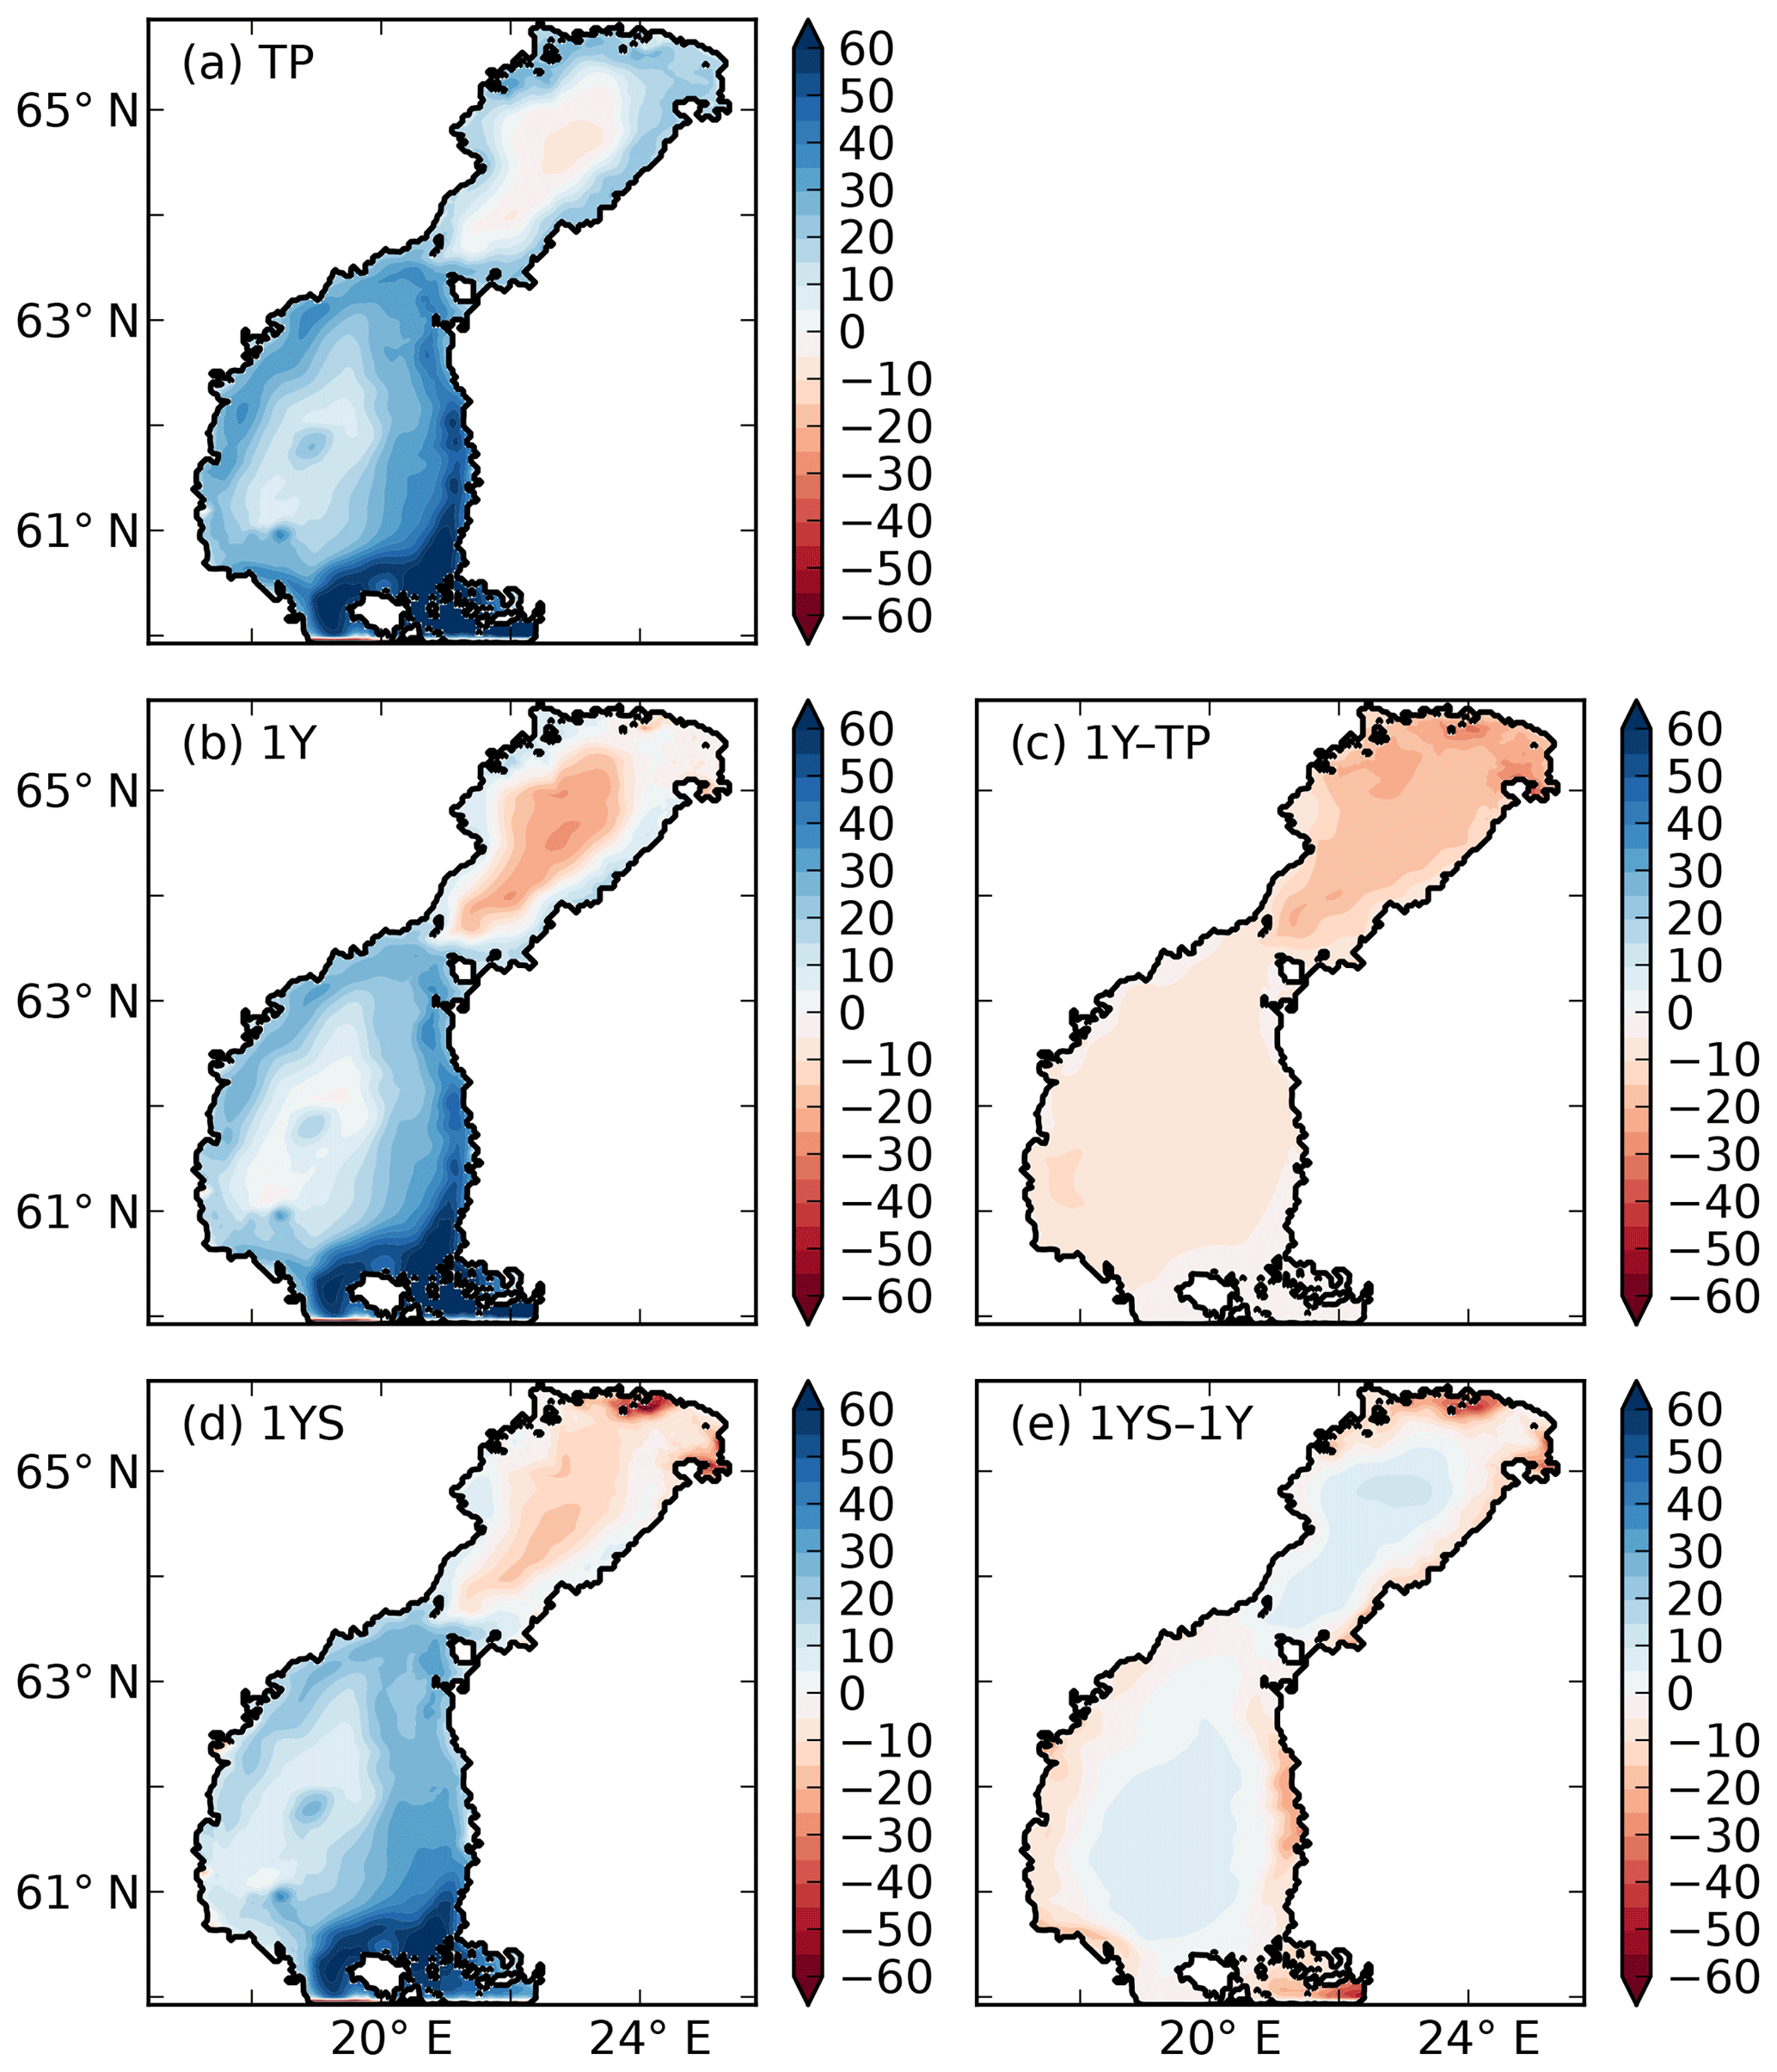
Figure 10Air–sea CO2 exchange (g C m−2 yr−1) in the (a) TP, (b) 1Y and (d) 1YS experiments. Red indicates outgassing of CO2 to the atmosphere, and blue indicates uptake from the atmosphere. Panels (c) and (d) show the difference in air–sea CO2 exchange between the 1Y and TP experiments and the 1YS and the 1Y experiments, respectively.
Adding a dependency of the light extinction on the tDOC increases the heterotrophy of the nearshore areas and the Bothnian Bay. Compared to the 1Y experiment (Table 4 and Fig. 10), the outgassing of CO2 is increased by 28 % in the Bothnian Bay. In the central parts of the Bothnian Bay and the Bothnian Sea, however, the outgassing (uptake) slightly decreases (increases) due to the increased primary production in these areas. The overall effect on air–sea CO2 exchange is minor with only a decrease of 4 %.
4.4 Future studies
In this study we have shown that remineralization is an important pathway for terrestrial DOC entering the Gulf of Bothnia. Considering that there is a large remineralization taking place under the sea ice (arguing against photochemical degradation), and that the rate we find is comparable to degradation rates calculated from bacterial incubation studies, we argue that bacteria has the potential to be responsible for this large removal. This needs to be investigated further, and an interesting next step from a modelling point of view would be to let the bacteria degrade the tDOC within the model and compare modelled bacterial biomass and growth rates to measured ones. Interesting studies, which would be possible to perform with a stoichiometric flexible model, could for example be carried out on the quality of terrestrial DOM (based on its nutrient content) and on the competition for inorganic nutrients between bacteria and phytoplankton, which has been shown to be dependent on the availability of organic carbon relative to nutrients (e.g. Bratbak and Thingstad, 1985; Joint et al., 2002; Thingstad et al., 2008).
4.5 Uncertainty analysis
In shallow areas such as the north-eastern parts of the Bothnian Bay, sediment fluxes have a particularly large impact on the carbon cycling and the air–sea CO2. The highest sediment–water DIC flux in the model is found next to the river mouths. The maximum modelled sediment–water flux in the Bothnian Bay during winter, when DIC is accumulated under the sea ice, is about 200 mg m−2 d−1 in the 1Y experiment, which is in good agreement with Silvennoinen et al. (2008), who measured fluxes of around 180–240 mg C m−2 d−1 in the mouth of the river Temmesjoki at low temperatures (5 ∘C). The modelled sediment DIC fluxes in the more central parts of the basins further agree well with Winogradow and Pempkowiak (2014). They calculated a mean flux of 9.9 mg C m−2 d−1 from four stations in the Gulf of Bothnia. The mean flux in the model, calculated from the same four positions, equals 8.6 mg C m−2 d−1. A sensitivity experiment was performed to investigate the sensitivity of the results to sediment fluxes. It was similar to the TP experiment, but the permanent burial of carbon was turned off, which leads to a higher carbon content in the sediments and consequently a higher remineralization and DIC efflux. This experiment almost reproduced pCO2 values as high as in the 1Y experiment. However, the DIC efflux from the sediments was also much higher than observations; the maximum modelled sediment–water fluxes in the Bothnian Bay during winter amounted to 400 mg m−2 d−1, and the modelled DIC flux at the four stations in the more central parts of the basins amounted to 17 m−2 d−1, which is about double the flux in the 1Y experiment and the observations.
In this study the remineralization of terrestrial DOC, and its influence on the pCO2 and the air–sea CO2 exchange, is studied in the Gulf of Bothnia. This is performed by combining results from a coupled physical–biogeochemical model together with high-resolution underway measurements of pCO2 data. Our conclusions are the following:
-
High pCO2 values are explained by remineralization of terrestrial DOC, with a remineralization timescale of 1 year.
-
The remineralization rate agrees well with bacterial uptake rates of terrestrial DOC calculated from incubation experiments from the northern Baltic Sea.
-
In addition to the terrestrial DOC remineralization, a high light attenuation induced by terrestrial DOC is needed to dampen the primary production and to reproduce the summer pCO2.
The BFM and NEMO source codes can be obtained at http://bfm-community.eu (last access: 11 February 2019, BFM Consortium, 2019) and http://www.nemo-ocean.eu (last access: 11 February 2019, NEMO Consortium, 2019), respectively. The input files needed to reproduce the simulations can be obtained upon request to the corresponding author (filippa.fransner@hotmail.se). The pCO2 is a part of a bigger pCO2 dataset of the Baltic Sea which will be presented (and made publicly available) in an article that is in preparation (Fransson et al., 2019). Until then the data can be obtained upon request to Agneta Fransson (agneta.fransson@npolar.no). The nutrient data used to produce Fig. S4 in the Supplement come from the ICES data portal (http://ocean.ices.dk/Helcom/Helcom.aspx?Mode=1) (last access: 11 February 2019, ICES, 2019).
The supplement related to this article is available online at: https://doi.org/10.5194/bg-16-863-2019-supplement.
The authors declare that they have no conflict of interest.
We acknowledge the use of the BFM (http://bfm-community.eu) and NEMO
(http://www.nemo-ocean.eu) models. The simulations were performed on
resources provided by the Swedish National Infrastructure for
Computing (SNIC) at the Triolith system. Per Pemberton at SMHI is
acknowledged for sharing the observations of sea ice in the Baltic Sea. This
work was partly funded by Baltic Ecosystem Adaptive Management (BEAM), a
strategic research program at Stockholm University, Sweden, and by the
Swedish Agency of Environment (Naturvårdsverket). The Baltic Nest
Institute is supported by the Swedish Agency for Marine and Water Management
through their grant 1:11 – Measures for marine and water environment.
Letizia Tedesco acknowledges support from the BONUS COCOA project (grant
agreement 2112932-1), funded jointly by the European Union and the Academy of
Finland. Robinson Hordoir was supported by the Strategic Research Council at
the Academy of Finland, project SmartSea (grant number 292985). We want to
thank the two anonymous reviewers for their suggestions that significantly
improved our work.
The article processing
charges for this open-access
publication were covered by
Stockholm University.
Edited by: Stefano
Ciavatta
Reviewed by two anonymous referees
Aarnos, H., Ylöstalo, P., and Vähätalo, A. V.: Seasonal phototransformation of dissolved organic matter to ammonium, dissolved inorganic carbon, and labile substrates supporting bacterial biomass across the Baltic Sea, J. Geophys. Res.-Biogeo., 117, https://doi.org/10.1029/2010JG001633, 2012. a, b
Alling, V., Humborg, C., Mörth, C.-M., Rahm, L., and Pollehne, F.: Tracing terrestrial organic matter by δ34 and δ13C signatures in a subarctic estuary, Limnol. Oceanogr., 53, 2594–2602, https://doi.org/10.4319/lo.2008.53.6.2594, 2008. a, b
Anderson, L. G., Jutterström, S., Hjalmarsson, S., Wåhlström, I., and Semiletov, I. P.: Out-gassing of CO2 from Siberian Shelf seas by terrestrial organic matter decomposition, Geophys. Res. Lett., 36, L20601, https://doi.org/10.1029/2009GL040046, 2009. a
Arst, H., Erm, A., Herlevi, A., Kutser, T., Leppäranta, M., Reinart, A., and Virta, J.: Optical properties of boreal lake waters in Finland and Estonia, Boreal Environ. Res., 13, 133–158, 2008. a, b
Ask, J., Karlsson, J., Persson, L., Ask, P., Byström, P., and Jansson, M.: Terrestrial organic matter and light penetration: Effects on bacterial and primary production in lakes, Limnol. Oceanogr., 54, 2034–2040, https://doi.org/10.4319/lo.2009.54.6.2034, 2009. a, b
Asmala, E., Autio, R., Kaartokallio, H., Pitkänen, L., Stedmon, C. A., and Thomas, D. N.: Bioavailability of riverine dissolved organic matter in three Baltic Sea estuaries and the effect of catchment land use, Biogeosciences, 10, 6969–6986, https://doi.org/10.5194/bg-10-6969-2013, 2013. a, b, c
Asmala, E., Autio, R., Kaartokallio, H., Stedmon, C. A., and Thomas, D. N.: Processing of humic-rich riverine dissolved organic matter by estuarine bacteria: effects of predegradation and inorganic nutrients, Aquat. Sci., 76, 451–463, https://doi.org/10.1007/s00027-014-0346-7, 2014a. a, b, c, d
Asmala, E., Bowers, D. G., Autio, R., Kaartokallio, H., and Thomas, D. N.: Qualitative changes of riverine dissolved organic matter at low salinities due to flocculation, J. Geophys. Res.-Biogeo., 119, 1919–1933, https://doi.org/10.1002/2014JG002722, 2014b. a, b
Asmala, E., Carstensen, J., Conley, D. J., Slomp, C. P., Stadmark, J., and Voss, M.: Efficiency of the coastal filter: Nitrogen and phosphorus removal in the Baltic Sea, Limnol. Oceanogr., 62, S222–S238, https://doi.org/10.1002/lno.10644, 2017. a
Bauer, J. E., Cai, W.-J., Raymond, P. A., Bianchi, T. S., Hopkinson, C. S., and Regnier, P. A. G.: The changing carbon cycle of the coastal ocean, Nature, 504, 61–70, https://doi.org/10.1038/nature12857, 2013. a
Benner, R. and Kaiser, K.: Biological and photochemical transformations of amino acids and lignin phenols in riverine dissolved organic matter, Biogeochemistry, 102, 209–222, https://doi.org/10.1007/s10533-010-9435-4, 2011. a
BFM Consortium: Biogeochemical Flux Model, available at: http://bfm-community.eu, last access: 11 February 2019. a
Bianchi, T. S.: The role of terrestrially derived organic carbon in the coastal ocean: A changing paradigm and the priming effect, P. Natl. Acad. Sci. USA, 108, 19473, https://doi.org/10.1073/pnas.1017982108, 2011. a
Blair, N. E. and Aller, R. C.: The Fate of Terrestrial Organic Carbon in the Marine Environment, Annu. Rev. Mar. Sci., 4, 401–423, https://doi.org/10.1146/annurev-marine-120709-142717, 2011. a
Blair, N. E. and Aller, R. C.: The Fate of Terrestrial Organic Carbon in the Marine Environment, Annu. Rev. Mar. Sci., 4, 401–423, https://doi.org/10.1146/annurev-marine-120709-142717, 2012. a
Borges, A. V., Delille, B., and Frankignoulle, M.: Budgeting sinks and sources of CO2 in the coastal ocean: Diversity of ecosystems counts, Geophys. Res. Lett., 32, L14601, https://doi.org/10.1029/2005GL023053, 2005. a
Bratbak, G. and Thingstad, T. F.: Phytoplankton-bacteria interactions: an apparent paradox? Analysis of a model system with both competition and commensalisms, Mar. Ecol. Prog. Ser., 25, 23–30, 1985. a
Cai, W.-J.: Estuarine and Coastal Ocean Carbon Paradox: CO2 Sinks or Sites of Terrestrial Carbon Incineration?, Annu. Rev. Mar. Sci., 3, 123–145, https://doi.org/10.1146/annurev-marine-120709-142723, 2011. a
Carlson, C. A., Hansell, D. A., Hansell, D. A., and Carlson, C. A.: Chapter 3 – DOM Sources, Sinks, Reactivity, and Budgets, Academic Press, Boston, MA, USA, 65–126, https://doi.org/10.1016/B978-0-12-405940-5.00003-0, 2015. a, b
Deutsch, B., Alling, V., Humborg, C., Korth, F., and Mörth, C. M.: Tracing inputs of terrestrial high molecular weight dissolved organic matter within the Baltic Sea ecosystem, Biogeosciences, 9, 4465–4475, https://doi.org/10.5194/bg-9-4465-2012, 2012. a, b, c, d, e
Dittmar, T. and Kattner, G.: The biogeochemistry of the river and shelf ecosystem of the Arctic Ocean: a review, Mar. Chem., 83, 103–120, https://doi.org/10.1016/S0304-4203(03)00105-1, 2003. a
Donnelly, C., Andersson, J. C., and Arheimer, B.: Using flow signatures and catchment similarities to evaluate the E-HYPE multi-basin model across Europe, Hydrolog. Sci. J., 61, 255–273, https://doi.org/10.1080/02626667.2015.1027710, 2016. a
Fichot, C. G. and Benner, R.: The fate of terrigenous dissolved organic carbon in a river-influenced ocean margin, Global Biogeochem. Cy., 28, 300–318, https://doi.org/10.1002/2013GB004670, 2014. a
Figueroa, D., Rowe, O. F., Paczkowska, J., Legrand, C., and Andersson, A.: Allochthonous Carbon – a Major Driver of Bacterioplankton Production in the Subarctic Northern Baltic Sea, Microb. Ecol., 71, 789–801, https://doi.org/10.1007/s00248-015-0714-4, 2016. a, b, c
Frankignoulle, M., Abril, G., Borges, A., Bourge, I., Canon, C., Delille, B., Libert, E., and Théate, J.-M.: Carbon Dioxide Emission from European Estuaries, Science, 282, 434–436, https://doi.org/10.1126/science.282.5388.434, 1998. a
Fransner, F., Nycander, J., Mörth, C.-M., Humborg, C., Meier, M. H. E., Hordoir, R., Gustafsson, E., and Deutsch, B.: Tracing terrestrial DOC in the Baltic Sea – A 3-D model study, Global Biogeochem. Cy., 30, 134–148, https://doi.org/10.1002/2014GB005078, 2016. a, b, c, d, e, f, g, h, i, j, k, l, m
Fransner, F., Gustafsson, E., Tedesco, L., Vichi, M., Hordoir, R., Roquet, F., Spilling, K., Kuznetsov, I., Eilola, K., Mörth, C.-M., Humborg, C., and Nycander, J.: Non-Redfieldian Dynamics Explain Seasonal pCO2 Drawdown in the Gulf of Bothnia, J. Geophys. Res.-Oceans, 123, 166–188, https://doi.org/10.1002/2017JC013019, 2018. a, b, c, d, e, f, g, h, i, j
Fransson, A., Anderson, L., Andreasson, K., Johansson, S., Karlson, B., Kronsell, J., Stranne, C., Sahlsten, E., and Willstrand-Wranne, A.: Seasonal and spatial variability of the surface-water fCO2 in the Baltic Sea and Skagerrak-Kattegat: implications for ocean acidification, in preparation, 2019. a, b
Gustafsson, E., Deutsch, B., Gustafsson, B., Humborg, C., and Mörth, C.-M.: Carbon cycling in the Baltic Sea – The fate of allochthonous organic carbon and its impact on air–sea CO2 exchange, J. Mar. Syst., 129, 289–302, https://doi.org/10.1016/j.jmarsys.2013.07.005, 2014. a
Hansell, D. A.: Recalcitrant Dissolved Organic Carbon Fractions, Annu. Rev. Mar. Sci., 5, 421–445, https://doi.org/10.1146/annurev-marine-120710-100757, 2013. a, b
Herlemann, D. P. R., Manecki, M., Meeske, C., Pollehne, F., Labrenz, M., Schulz-Bull, D., Dittmar, T., and Jürgens, K.: Uncoupling of Bacterial and Terrigenous Dissolved Organic Matter Dynamics in Decomposition Experiments, PLOS ONE, 9, 1–12, https://doi.org/10.1371/journal.pone.0093945, 2014. a, b, c, d
Hessen, D. O., Carroll, J., Kjeldstad, B., Korosov, A. A., Pettersson, L. H., Pozdnyakov, D., and Sørensen, K.: Input of organic carbon as determinant of nutrient fluxes, light climate and productivity in the Ob and Yenisey estuaries, Estuar. Coast. Shelf S., 88, 53–62, https://doi.org/10.1016/j.ecss.2010.03.006, 2010. a
Hoikkala, L., Kortelainen, P., Soinne, H., and Kuosa, H.: Dissolved organic matter in the Baltic Sea, J. Marine Syst., 142, 47–61, https://doi.org/10.1016/j.jmarsys.2014.10.005, 2015. a
Hordoir, R., Dieterich, C., Basu, C., Dietze, H., and Meier, H.: Freshwater outflow of the Baltic Sea and transport in the Norwegian current: A statistical correlation analysis based on a numerical experiment, Cont. Shelf Res., 64, 1–9, https://doi.org/10.1016/j.csr.2013.05.006, 2013. a
Hordoir, R., Axell, L., Löptien, U., Dietze, H., and Kuznetsov, I.: Influence of sea level rise on the dynamics of salt inflows in the Baltic Sea, J. Geophys. Res.-Oceans, 120, 6653–6668, https://doi.org/10.1002/2014JC010642, 2015. a
Hordoir, R., Axell, L., Höglund, A., Dieterich, C., Fransner, F., Gröger, M., Liu, Y., Pemberton, P., Schimanke, S., Andersson, H., Ljungemyr, P., Nygren, P., Falahat, S., Nord, A., Jönsson, A., Lake, I., Döös, K., Hieronymus, M., Dietze, H., Löptien, U., Kuznetsov, I., Westerlund, A., Tuomi, L., and Haapala, J.: Nemo-Nordic 1.0: a NEMO-based ocean model for the Baltic and North seas – research and operational applications, Geosci. Model Dev., 12, 363–386, https://doi.org/10.5194/gmd-12-363-2019, 2019. a
Hulatt, C. J., Kaartokallio, H., Asmala, E., Autio, R., Stedmon, C. A., Sonninen, E., Oinonen, M., and Thomas, D. N.: Bioavailability and radiocarbon age of fluvial dissolved organic matter (DOM) from a northern peatland-dominated catchment: effect of land-use change, Aquat. Sci., 76, 393–404, https://doi.org/10.1007/s00027-014-0342-y, 2014. a, b, c, d
ICES: ICES Baltic Sea monitoring data, International Council for the Exploration of the Sea, available at: http://ocean.ices.dk/Helcom/Helcom.aspx?Mode=1, last access: 11 February 2019. a
Joint, I., Henriksen, P., Fonnes, G. A., Bourne, D., Thingstad, T. F., and Riemann, B.: Competition for inorganic nutrients between phytoplankton and bacterioplankton in nutrient manipulated mesocosms, Aquat. Microb. Ecol., 29, 145–159, https://www.int-res.com/abstracts/ame/v29/n2/p145-159/ (last access: 11 February 2019), 2002. a
Kuliński, K., Hammer, K., Schneider, B., and Schulz-Bull, D.: Remineralization of terrestrial dissolved organic carbon in the Baltic Sea, Mar. Chem., 181, 10–17, https://doi.org/10.1016/j.marchem.2016.03.002, 2016. a
Kuparinen, J., Leonardsson, K., Mattila, J., and Wikner, J.: Food Web Structure and Function in the Gulf of Bothnia, the Baltic Sea, Ambio, Special Report Number 8, 13–21, http://www.jstor.org/stable/25094545 (last access: 11 February 2019), 1996. a, b
Löffler, A., Schneider, B., Perttilä, M., and Rehder, G.: Air–sea CO2 exchange in the Gulf of Bothnia, Baltic Sea, Cont. Shelf Res., 37, 46–56, https://doi.org/10.1016/j.csr.2012.02.002, 2012. a, b, c, d
Madec, G. and the NEMO team: Nemo ocean engine, version 3.6 stable, Note du Pole de modélisation, Institut Pierre-Simon Laplace (IPSL), Paris, France, no. 27, issn no. 1288-1619 edn., 2016. a
Mantoura, R. and Woodward, E.: Conservative behaviour of riverine dissolved organic carbon in the Severn Estuary: chemical and geochemical implications, Geochim. Cosmochim. Ac., 47, 1293– 309, https://doi.org/10.1016/0016-7037(83)90069-8, 1983. a
NEMO Consortium: NEMO community ocean model, available at: http://www.nemo-ocean.eu, last access: 11 February 2019. a
Pemberton, P., Löptien, U., Hordoir, R., Höglund, A., Schimanke, S., Axell, L., and Haapala, J.: Sea-ice evaluation of NEMO-Nordic 1.0: a NEMO–LIM3.6-based ocean–sea-ice model setup for the North Sea and Baltic Sea, Geosci. Model Dev., 10, 3105–3123, https://doi.org/10.5194/gmd-10-3105-2017, 2017. a
Pierrot, D., Neill, C., Sullivan, K., Castle, R., Wanninkhof, R., Lüger, H., Johannessen, T., Olsen, A., Feely, R. A., and Cosca, C. E.: Recommendations for autonomous underway pCO2 measuring systems and data-reduction routines, Deep-Sea Res. Pt. II, 56, 512–522, https://doi.org/10.1016/j.dsr2.2008.12.005, 2009. a, b
Raymond, P. A., Bauer, J. E., and Cole, J. J.: Atmospheric CO2 evasion, dissolved inorganic carbon production, and net heterotrophy in the York River estuary, Limnol. Oceanogr., 45, 1707–1717, https://doi.org/10.4319/lo.2000.45.8.1707, 2000. a
Samuelsson, P., Jones, C. G., Willén, U., Ullerstig, A., Gollvik, S., Hansson, U., Jansson, C., Kjellström, E., Nikulin, G., and Wyser, K.: The Rossby Centre Regional Climate model RCA3: model description and performance, Tellus A, 63, 4–23, https://doi.org/10.1111/j.1600-0870.2010.00478.x, 2011. a
Sandberg, J., Andersson, A., Johansson, S., and Wikner, J.: Pelagic food web structure and carbon budget in the northern Baltic Sea: potential importance of terrigenous carbon, Mar. Ecol. Prog. Ser., 268, 13–29, https://www.int-res.com/abstracts/meps/v268/p13-29/ (last access: 11 February 2019), 2004. a, b, c
Seidel, M., Manecki, M., Herlemann, D. P. R., Deutsch, B., Schulz-Bull, D., Jürgens, K., and Dittmar, T.: Composition and Transformation of Dissolved Organic Matter in the Baltic Sea, Front. Earth Sci., 5, 31, https://doi.org/10.3389/feart.2017.00031, 2017. a
Silvennoinen, H., Liikanen, A., Torssonen, J., Stange, C. F., and Martikainen, P. J.: Denitrification and N2O effluxes in the Bothnian Bay (northern Baltic Sea) river sediments as affected by temperature under different oxygen concentrations, Biogeochemistry, 88, 63–72, https://doi.org/10.1007/s10533-008-9194-7, 2008. a
Stepanauskas, R., JØrgensen, N. O. G., Eigaard, O. R., Žvikas, A., Tranvik, L. J., and Leonardson, L.: Summer inputs of riverine nutrients to the Baltic Sea: bioavailability and eutrophication relevance, Ecol. Monogr., 72, 579–597, https://doi.org/10.1890/0012-9615(2002)072[0579:SIORNT]2.0.CO;2, 2002. a
Thingstad, T. F., Bellerby, R. G. J., Bratbak, G., Børsheim, K. Y., Egge, J. K., Heldal, M., Larsen, A., Neill, C., Nejstgaard, J., Norland, S., Sandaa, R. A., Skjoldal, E. F., Tanaka, T., Thyrhaug, R., and Töpper, B.: Counterintuitive carbon-to-nutrient coupling in an Arctic pelagic ecosystem, Nature, 455, 387–390, https://doi.org/10.1038/nature07235, 2008. a
Vähätalo, A., Aarnos, H., Hoikkala, L., and Lignell, R.: Photochemical transformation of terrestrial dissolved organic matter supports hetero- and autotrophic production in coastal waters, Mar. Ecol. Prog. Ser., 423, 1–14, https://www.int-res.com/abstracts/meps/v423/p1-14/ (last access: 11 February 2019), 2011. a
Vancoppenolle, M., Fichefet, T., Goosse, H., Bouillon, S., Madec, G., and Maqueda, M. A. M.: Simulating the mass balance and salinity of Arctic and Antarctic sea ice, 1. Model description and validation, Ocean Model., 27, 33–53, https://doi.org/10.1016/j.ocemod.2008.10.005, 2009. a
Vichi, M., Pinardi, N., and Masina, S.: A generalized model of pelagic biogeochemistry for the global ocean ecosystem, Part I: Theory, J. Marine Syst., 64, 89–109, https://doi.org/10.1016/j.jmarsys.2006.03.006, contributions from Advances in Marine Ecosystem Modelling Research, 27-29 June, 2005, Plymouth, UK, 2007. a
Vichi, M., Lovato, T., Lazzari, P., Cossarini, G., Gutierrez Mlot, E., Mattia, G., Masina, S., McKiver, W. J., Pinardi, N., Solidoro, C., Tedesco, L., and Zavatarelli, M.: The Biogeochemical Flux Model (BFM): Equation Description and User Manual, BFM version 5.1, BFM Consortium, 2015. a
Wikner, J. and Andersson, A.: Increased freshwater discharge shifts the trophic balance in the coastal zone of the northern Baltic Sea, Global Change Biol., 18, 2509–2519, https://doi.org/10.1111/j.1365-2486.2012.02718.x, 2012. a
Wikner, J., Cuadros, R., and Jansson, M.: Differences in consumption of allochthonous DOC under limnic and estuarine conditions in a watershed, Aquat. Microb. Ecol., 17, 289–299, https://www.int-res.com/abstracts/ame/v17/n3/p289-299/ (last access: 11 February 2019), 1999. a, b, c
Winogradow, A. and Pempkowiak, J.: Organic carbon burial rates in the Baltic Sea sediments, Estuar. Coast. Shelf S., 138, 27–36, https://doi.org/10.1016/j.ecss.2013.12.001, 2014. a
Zweifel, U. L., Wikner, J., Hagström, Å., Lundberg, E., and Norrman, B.: Dynamics of dissolved organic carbon in a coastal ecosystem, Limnol. Oceanogr., 40, 299–305, https://doi.org/10.4319/lo.1995.40.2.0299, 1995. a
In contrast to the model of remineralization in 1Y that has two pools of tDOC of different lability, Eq. (3) only considers one pool. The results of these two models are comparable until the labile pool starts to be depleted (after 1 year), which is why we can compare the degradation rate of the labile pool in 1Y and the degradation rates calculated for incubation experiments with a time duration of up to 55 days.