the Creative Commons Attribution 4.0 License.
the Creative Commons Attribution 4.0 License.
 | 22 Apr 2020
Regulation of nitrous oxide production in low-oxygen waters off the coast of Peru
Hermann W. Bange
Eric P. Achterberg
Amal Jayakumar
Carolin R. Löscher
Damian L. Arévalo-Martínez
Elizabeth León-Palmero
Mingshuang Sun
Xin Sun
Ruifang C. Xie
Sergey Oleynik
Bess B. Ward
Oxygen-deficient zones (ODZs) are major sites of net natural nitrous oxide (N2O) production and emissions. In order to understand changes in the magnitude of N2O production in response to global change, knowledge on the individual contributions of the major microbial pathways (nitrification and denitrification) to N2O production and their regulation is needed. In the ODZ in the coastal area off Peru, the sensitivity of N2O production to oxygen and organic matter was investigated using 15N tracer experiments in combination with quantitative PCR (qPCR) and microarray analysis of total and active functional genes targeting archaeal amoA and nirS as marker genes for nitrification and denitrification, respectively. Denitrification was responsible for the highest N2O production with a mean of 8.7 nmol L−1 d−1 but up to 118±27.8 nmol L−1 d−1 just below the oxic–anoxic interface. The highest N2O production from ammonium oxidation (AO) of 0.16±0.003 nmol L−1 d−1 occurred in the upper oxycline at O2 concentrations of 10–30 µmol L−1 which coincided with the highest archaeal amoA transcripts/genes. Hybrid N2O formation (i.e., N2O with one N atom from and the other from other substrates such as ) was the dominant species, comprising 70 %–85 % of total produced N2O from , regardless of the ammonium oxidation rate or O2 concentrations. Oxygen responses of N2O production varied with substrate, but production and yields were generally highest below 10 µmol L−1 O2. Particulate organic matter additions increased N2O production by denitrification up to 5-fold, suggesting increased N2O production during times of high particulate organic matter export. High N2O yields of 2.1 % from AO were measured, but the overall contribution by AO to N2O production was still an order of magnitude lower than that of denitrification. Hence, these findings show that denitrification is the most important N2O production process in low-oxygen conditions fueled by organic carbon supply, which implies a positive feedback of the total oceanic N2O sources in response to increasing oceanic deoxygenation.
- Article
(4102 KB) - Full-text XML
-
Supplement
(1707 KB) - BibTeX
- EndNote


Nitrous oxide (N2O) is a potent greenhouse gas (IPCC, 2013) and precursor for nitric oxide (NO) radicals, which can catalyze the destruction of ozone in the stratosphere (Crutzen, 1970; Johnston, 1971) and is now the single most important ozone-depleting emission (Ravishankara et al., 2009). The ocean is a significant N2O source, accounting for up to one-third of all natural emissions (IPCC, 2013), and this source may increase substantially as a result of eutrophication, warming and ocean acidification (see, e.g., Capone and Hutchins, 2013; Breider et al., 2019). Major sites of oceanic N2O emissions are regions with steep oxygen (O2) gradients (oxycline), which are usually associated with coastal upwelling regions with high primary production at the surface. There, high microbial respiratory activity during organic matter decomposition leads to the formation of anoxic waters also called oxygen-deficient zones (ODZs), in which O2 may decline to functionally anoxic conditions (O2 < 10 nmol kg−1, Tiano et al., 2014). The most intense ODZs are found in the eastern tropical North Pacific (ETNP), the eastern tropical South Pacific (ETSP) and the northwestern Indian Ocean (Arabian Sea). The anoxic waters are surrounded by large volumes of hypoxic waters (below 20 µmol L−1 O2), which are strong net N2O sources (Codispoti, 2010; Babbin et al., 2015). Latest estimates of global, marine N2O fluxes (Buitenhuis et al., 2018; Ji et al., 2018a) agree well with the 3.8 Tg N yr−1 (1.8–9.4 Tg N yr−1) reported by the IPCC (2013) but have large variability in the resolution on the regional scale, particularly along coasts where N2O cycling is more dynamic. The expansion of ODZs is predicted in global change scenarios and has already been documented in recent decades (Stramma et al., 2008; Schmidtko et al., 2017). This might lead to further intensification of marine N2O emissions, which will constitute a positive feedback on global warming (Battaglia and Joos, 2018). However, decreasing N2O emissions have also been predicted based on reduced nitrification rates due to reduced primary and export production (Martinez-Rey et al., 2015; Landolfi et al., 2017) and ocean acidification (Beman et al., 2011; Breider et al., 2019). The parametrization of N2O production and consumption in global ocean models is crucial for realistic future predictions, and therefore better understanding of their controlling mechanisms is needed.
N2O can be produced by both nitrification and denitrification. Nitrification is a two-step process, comprising the oxidation of ammonia (NH3) to nitrite () (ammonia oxidation, AO) and to nitrate () ( oxidation). The relative contributions to AO by autotrophic ammonia-oxidizing archaea (AOA) and ammonia-oxidizing bacteria (AOB) have been inferred, based on the abundance of the archaeal and bacterial amoA genes, which encode subunit A of the key enzyme ammonia monooxygenase (e.g., Francis et al., 2005; Mincer et al., 2007; Santoro et al., 2010; Wuchter et al., 2006). These studies consistently revealed the dominance of archaeal over bacterial ammonia oxidizers, particularly in marine settings (Francis et al., 2005; Wuchter et al., 2006; Newell et al., 2011). In oxic conditions, AO by AOB and AOA forms N2O as a by-product (Anderson, 1964; Vajrala et al., 2013; Stein, 2019), and AOA contribute significantly to N2O production in the ocean (Santoro et al., 2011; Löscher et al., 2012). While hydroxylamine (NH2OH) was long thought to be the only obligate intermediate in AO, NO has recently been identified as an obligate intermediate for AOB (Caranto and Lancaster, 2017) and presumably AOA (Carini et al., 2018). Both intermediates are present in and around ODZs and correlated with nitrification activity (Lutterbeck et al., 2018; Korth et al., 2019). Specific details about the precursor of NO to form N2O in AOA remain controversial. Stiegelmeier et al. (2014) concluded that NO is derived from reduction to form N2O, while Carini et al. (2018) hypothesized that NO is derived from NH2OH oxidation, which can then form N2O. A hybrid N2O production mechanism in AOA has been suggested, where NO from reacts with NH2OH from , which is thought to be abiotic, i.e., nonenzymatic (Kozlowski et al., 2016). Abiotic N2O production, also known as chemodenitrification, from intermediates like NH2OH, NO or can occur under acidic conditions (Frame et al., 2017), or in the presence of reduced metals like Fe or Mn and catalyzing surfaces (Zhu-Barker et al., 2015), but the evidence of abiotic N2O production/chemodenitrification in ODZs is still lacking.
When O2 concentrations fall below 20 µmol L−1, nitrifiers produce N2O from , a process referred to as nitrifier denitrification (Frame and Casciotti, 2010), which has been observed in cultures of AOB (Frame and Casciotti, 2010) and AOA (Santoro and Casciotti, 2011). During nitrifier denitrification (and denitrification), two molecules form one N2O, which thus differentiates this process from hybrid N2O production. It has also been suggested that high concentration of organic particles creates high- and low-O2 microenvironments enhancing nitrifier denitrification (Charpentier et al., 2007). Overall, the yield of N2O per generated from AO is lower in AOA than AOB (Hink et al., 2017a, b), but it should be noted that the degree to which N2O yield increases with decreasing O2 concentrations varies with cell density in cultures and among field sites (Cohen and Gordon, 1978; Yoshida, 1988; Goreau et al., 1980; Frame and Casciotti, 2010; Santoro et al., 2011; Löscher et al., 2012; Ji et al., 2015b, 2018a).
The anaerobic oxidation of ammonia by (anammox) to form N2 is strictly anaerobic and important in the removal of fixed N from the system, but it is not known to contribute to N2O production (Kartal et al., 2007; van der Star et al., 2008; Hu et al., 2019). In suboxic and O2-free environments, oxidized nitrogen is respired by bacterial denitrification, which is the stepwise reduction of to elemental N2 via , NO and N2O. N2O as an intermediate can be consumed or produced, but at the core of the ODZ N2O consumption through denitrification is enhanced, leading to an undersaturation in this zone (Bange, 2008; Kock et al., 2016). Reducing enzymes are highly regulated by O2 concentrations, and of the enzymes in the denitrification sequence, N2O reductase is the most sensitive to O2 (Zumft, 1997), which can lead to the accumulation of N2O along the upper and lower ODZ boundaries (Kock et al., 2016). N2O accumulation during denitrification is mostly linked to O2 inhibiting the N2O reductase, but other factors such as sulfide accumulation (Dalsgaard et al., 2014), pH (Blum et al., 2018), high or concentrations (Ji et al., 2018b), or copper limitation (Granger and Ward, 2003) may also be relevant. Recent studies contrast the view of nitrification vs. denitrification as the main N2O source in ODZs (Nicholls et al., 2007; Babbin et al., 2015; Ji et al., 2015b; Yang et al., 2017). They show the importance of denitrification in N2O production in the ETNP from model outputs (Babbin et al., 2015) and in the ETSP from tracer incubation experiments (Dalsgaard et al., 2012; Ji et al., 2015b), based on natural abundance isotopes in N2O (Casciotti et al., 2018) or from water mass analysis of apparent N2O production (ΔN2O) and apparent O2 utilization (AOU) (Carrasco et al., 2017). 45,46N2O production from the addition of 15N-labeled , and/or revealed nitrification as a source of N2O within the oxic–anoxic interface, but overall denitrification dominated N2O production with higher rates at the interface and in anoxic waters (Ji et al., 2015b, 2018a). Denitrification is driven by organic matter exported from the photic zone and fuels blooms of denitrifiers, leading to high N2 production (Dalsgaard et al., 2012; Jayakumar et al., 2009; Babbin et al., 2014). Denitrification to N2 is enhanced by organic matter additions, and the degree of stimulation varies with quality and quantity of organic matter (Babbin et al., 2014). Because N2O is an intermediate in denitrification, we hypothesize that its production should also be stimulated by organic matter, possibly leading to episodic and variable N2O fluxes.
N2O concentration profiles around ODZs appear to be at a steady state (Babbin et al., 2015) but are much more variable in regions of intense coastal upwelling where high N2O emissions can occur (Arévalo-Martínez et al., 2015). The contributions of and controls on the two N2O production pathways under different conditions of O2 and organic matter supply are not well understood and may contribute to this variability. Hence, the goal of this study is to understand the factors regulating N2O production around ODZs in order to better constrain how future changes in O2 concentration and carbon export will impact production, distribution and emissions of oceanic N2O. Our goal was to determine the impact of O2 and particulate organic matter (POM) on N2O production rates using 15N tracer experiments in combination with quantitative PCR (qPCR) and functional gene microarray analysis of the marker genes, nirS for denitrification and amoA for AO by archaea, to assess how the abundance and structure of the community impacts N2O production rates from the different pathways. 15N-labeled and were used to trace the production of single-labeled (45N2O) and double-labeled (46N2O) N2O to investigate the importance of hybrid N2O production during AO along an O2 gradient.
2.1 Sampling sites, sample collection and incubation experiments
Seawater was collected from nine stations in the upwelling area off the coast of Peru in June 2017 on board R/V Meteor (Fig. 1). Water samples were collected from 10 L Niskin bottles on a rosette with a conductivity–temperature–depth profiler (CTD, Sea-Bird Electronics 9plus system). In situ O2 concentrations (detection limit 2 µmol L−1 O2), temperature, pressure and salinity were recorded during each CTD cast. and concentrations were measured on board by standard spectrophotometric methods (Hydes et al., 2010) using a QuAAtro autoanalyzer (SEAL Analytical GmbH, Germany). concentrations were determined fluorometrically using ortho-phthaldialdehyde according to Holmes et al. (1999). For N2O, bubble-free triplicate samples were immediately sealed with butyl stoppers and aluminum crimps and fixed with 50 µL of saturated mercuric chloride (HgCl2). A 10 mL He headspace was created, and after an equilibration period of at least 2 h the headspace sample was measured with a gas chromatograph equipped with an electron capture detector (GC/ECD) according to Kock et al. (2016). The detection limit for N2O concentration is 2 nM ± 0.7 nM. At all experimental depths nucleic acid samples were collected by filtering up to 5 L of seawater onto 0.2 µm pore size Sterivex-GP capsule filters (Millipore, Inc., Bedford, MA, USA). Immediately after, collection filters were flash frozen in liquid nitrogen and kept at −80 ∘C until extraction.
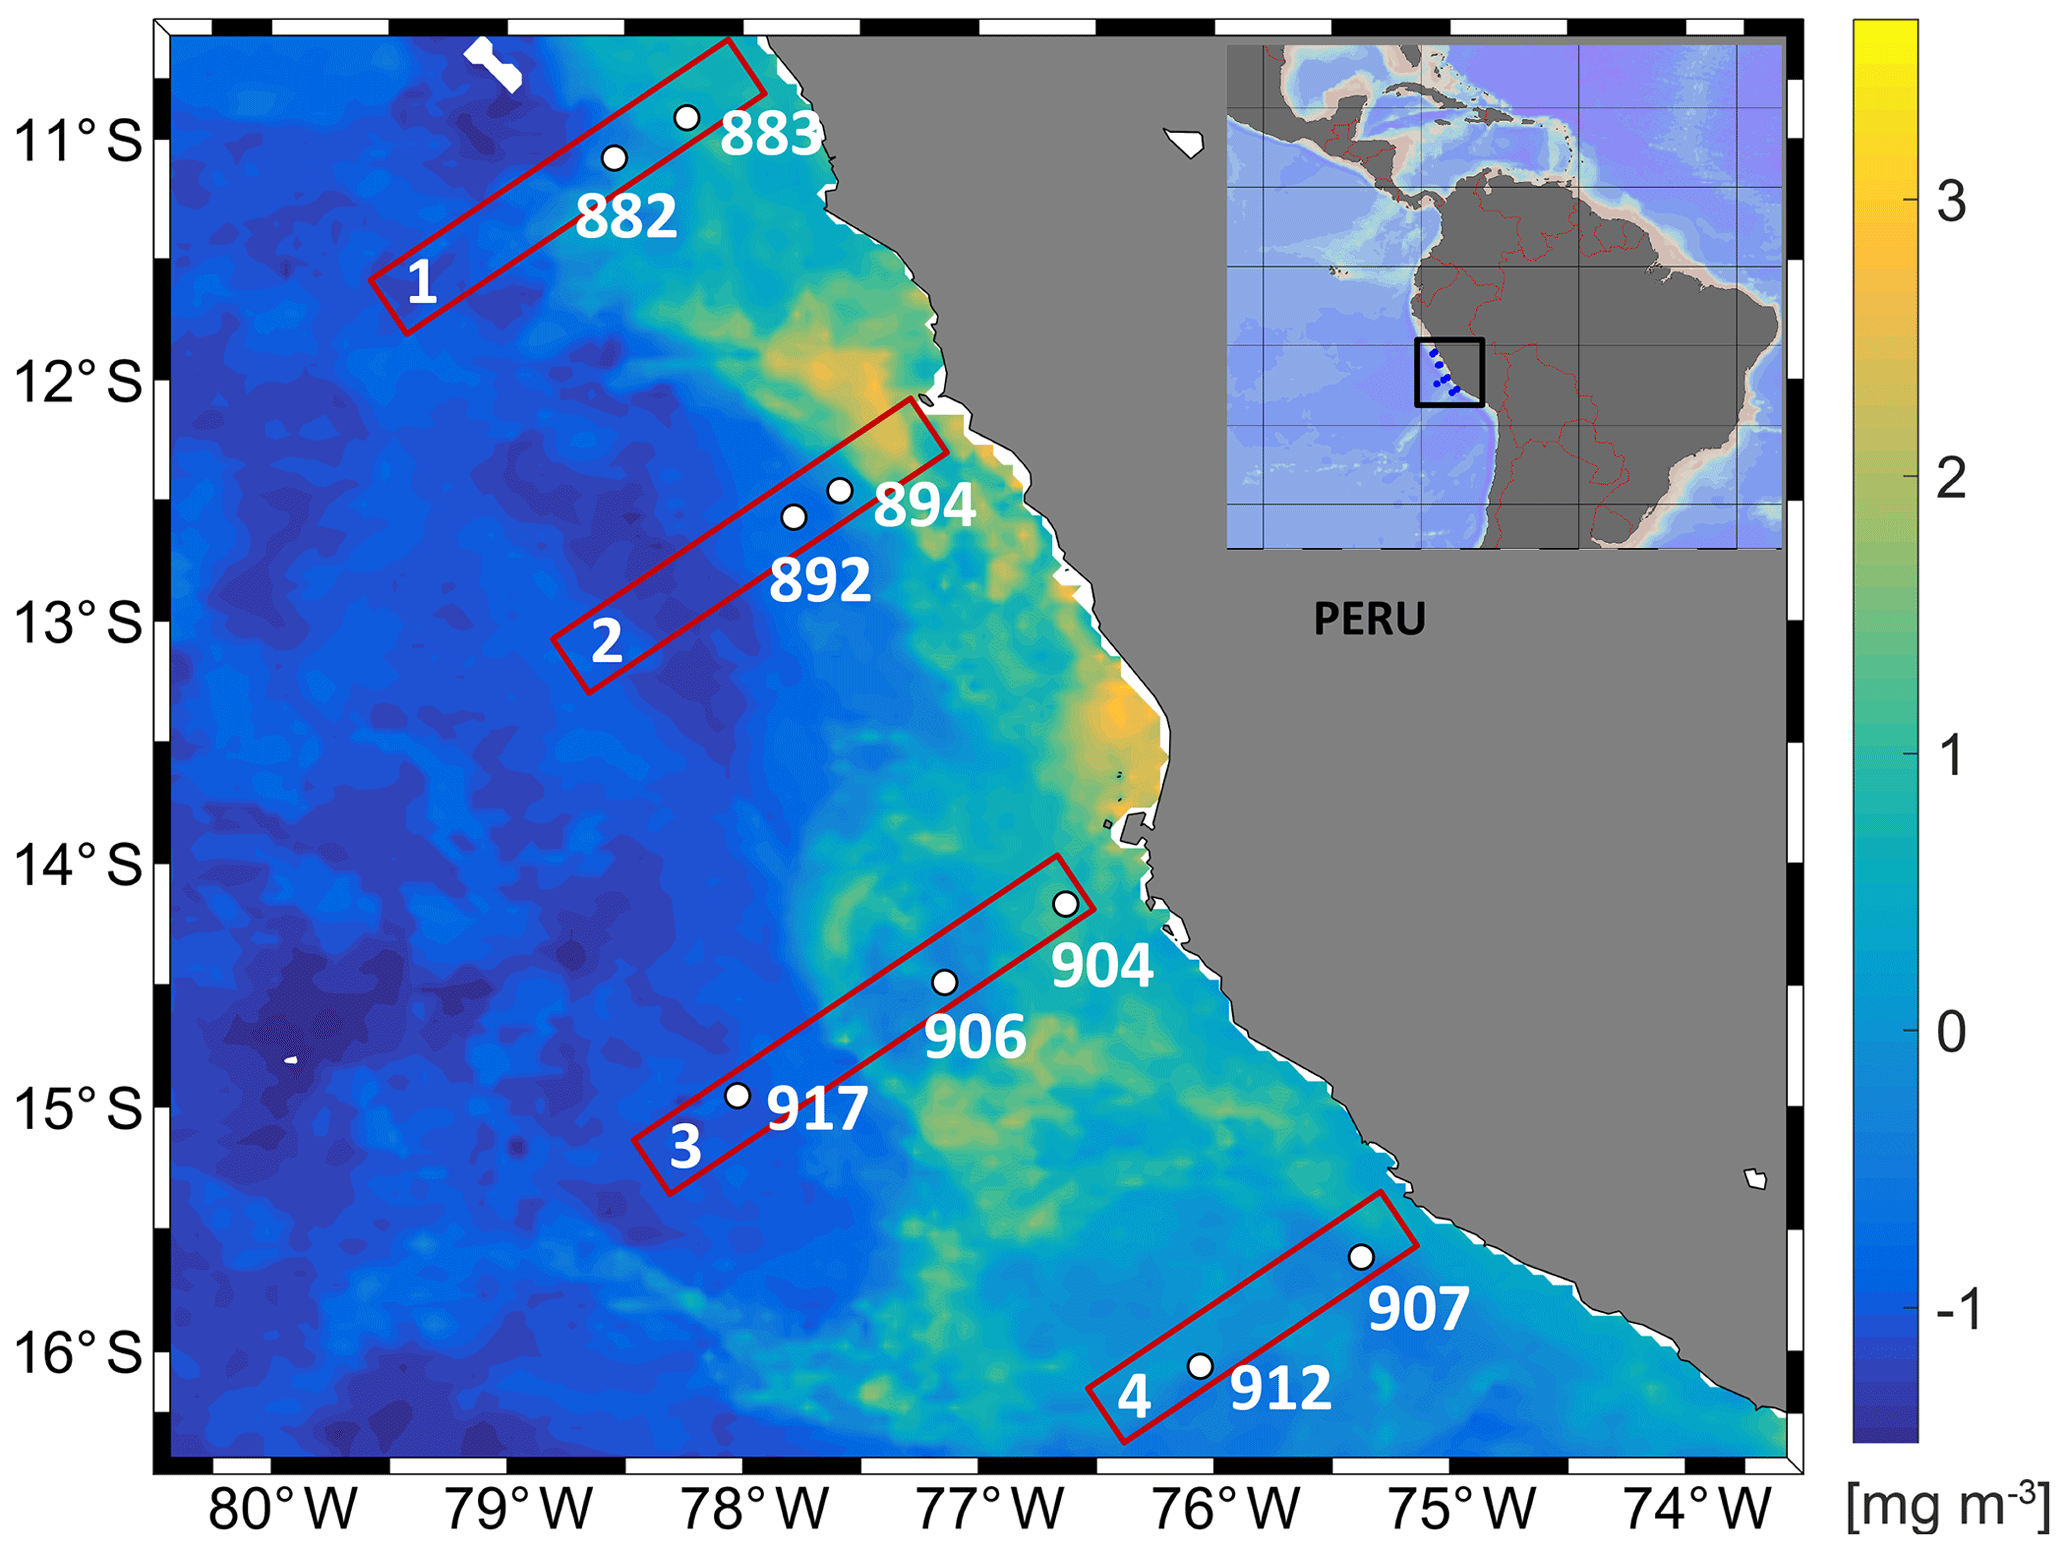
Figure 1Study area with the distribution of near-surface chlorophyll concentrations (monthly averaged for June 2017) from MODIS obtained from the NASA Ocean Color Web site at 4 km resolution. Study site showing transect and station numbers in the eastern tropical South Pacific during cruise M138.
Three different experiments were carried out at coastal stations, continental slope and offshore stations. Experiments 1 and 2 aimed to investigate the influence of O2 concentration along a natural and artificial O2 gradient, and experiment 3 targeted the impact of large particles (>50 µm) on N2O production. Serum bottles were filled from the Niskin bottles with Tygon tubing after overflowing three times to minimize O2 contamination. Bottles were sealed bubble-free with grey butyl rubber septa (National Scientific) and crimped with aluminum seals immediately after filling. The grey butyl rubber septa were boiled in Milli-Q for 30 min to degas and kept in a He atmosphere until usage. A 3 mL helium (He) headspace was created, and samples from anoxic (O2 < below detection) water depths were He purged for 15 min. He purging removed dissolved oxygen contamination, which is likely introduced during sampling, and the headspace prevents possible oxygen leakage from the rubber seals (De Brabandere et al., 2012). Natural abundance 2000 ppb N2O carrier gas (1000 µL in He) was injected to trap the produced labeled N2O and to ensure a sufficient mass for isotope analysis. For all experiments, 15N-, 15N- and 15N- tracer (15N∕(14N + 15N) = 99 at. %) were injected into five bottles each from the same depth to a final concentration of 0.5 µmol L−1, except for the incubations where 2 µmol L−1 final concentration were anticipated to obtain 10 % label of the pool. The fraction labeled of the substrate pools was 0.76–0.99 for , 0.11–0.99 for and 0.055–0.11 for . In the 15N- treatment, 14N- was added to trap the label in the product pool for reduction rates, and in the 15N- treatment, 14N- was added to a final concentration of 0.5 µmol L−1 to trap the label in the product pool for AO rates.
For the O2 manipulation experiments, all serum bottles were He purged, and after the addition of different amounts of air saturated site water a final headspace volume of 3 mL was achieved. Site water from the incubation depth was shaken and exposed to air to reach full O2 saturation. Then 0, 0.2, 0.5, 2 and 5 mL of O2-saturated seawater was added into serum bottles and to reach final measured O2 concentration of 0±0.18, 0.4±0.24, 1.6±0.12, 5.2±0.96 and 11.7±1.09 µM in seawater. For the 15N- incubations two more O2 treatments with 21.5±2.8 and 30.2±3.35 µM O2 were carried out to extend the range of a previous study in which N2O production from did not decrease in the presence of up to 7 µM O2 (Ji et al., 2018b). The O2 concentration was monitored with an O2 sensor spot in one serum bottle per treatment using an O2 probe and meter (FireSting, PyroScience, Aachen, Germany; Fig. S1 in the Supplement). The sensor spots are highly sensitive in the nanomolar range and prepared according to Larsen et al. (2016).
For the organic matter additions, concentrated particles >50 µm from three different depths were collected with a Challenger stand-alone pump system (SAPS in situ pumps, Liu et al., 2005), autoclaved and He purged. A total of 200 µL of POC (particulate organic carbon) solution was added to each serum bottle before 15N- or 14N- tracer injection. The final particle concentrations and C∕N ratios varied between 0.18 and 1.37 µM C and between 8.1 and 15.4, respectively (Table 2). The concentration and C∕N ratio of PON (particulate organic nitrogen) and POC of the stock solutions were analyzed by mass spectrometry using a GC Isoprime mass spectrometer.
A set of five bottles was incubated per time course. One bottle was sacrificed at t0, two bottles at t1 and two at t2 to determine a single rate. Total incubation times were adjusted to prevent bottle effects, which become significant after 20 h based on respiration rate measurements (Tiano et al., 2014). Hence, experiments lasted from 12 h (at the shelf stations) to 24 h (at the slope stations). Incubation was terminated by adding 0.1 mL of saturated mercuric chloride (HgCl2). All samples were stored at room temperature in the dark and shipped back to the lab.
2.2 Isotope measurement and rate determination
The total N2O in each incubation bottle was extracted with a purge–trap system according to Ji et al. (2015b). Briefly, serum bottles were flushed with He for 35 min (38 mL min−1); N2O was trapped by liquid nitrogen; H2O was removed with an ethanol trap, a Nafion® trap and a Mg(ClO4)2 trap; CO2 was removed with an Ascarite CO2-adsorbance column; and afterwards mass 44, 45, and 46 and isotope ratios 45∕44 and 46∕44 were detected with a GC–IRMS system (Delta V Plus, Thermo). Every two to three samples, a 20 mL glass vial with a known amount of N2O gas was measured to calibrate for the N2O concentration (linear correlation between N2O peak size and concentration, r2=0.99). The isotopic composition of the reference N2O was ‰ and ‰ present in 15N14N16O or 14N15N16O for 45N2O and the less abundant 15N15N16O for 46N2O. To evaluate the analyses of 15N-enriched N2O samples, internal isotope standards for 15N2O were prepared by mixing natural abundance KNO3 of known δ15N values with 99 % Na15NO3 (Cambridge Isotope Laboratories) and converted to N2O using the denitrifier method (Sigman et al., 2001; Weigand et al., 2016). Measured and expected values were compared based on a binominal distribution of 15N and 14N within the N2O pool (Frame et al., 2017).
After N2O analysis, samples incubated with and were analyzed for to determine rates of oxidation and reduction, respectively. The individual sample size, adjusted to contain 20 nmol of N2O, was transferred into 20 mL glass vials and He purged for 10 min. was converted to N2O using sodium azide in acetic acid (McIlvin and Altabet, 2005), and the nitrogen isotope ratio was measured on a Delta V Plus (Thermo).
For each serum bottle, total N2O concentration (moles) and 45N2O ∕44N2O and 46N2O ∕44N2O ratios were converted to moles of 44N2O, 45N2O and 46N2O. N2O production rates were calculated from the slope of the increase in mass 44, 45 and 46 over time (Fig. S2). To quantify the pathways for N2O production, rates were calculated based on the equations for N2 production for denitrification and anammox (Thamdrup and Dalsgaard, 2002). In incubations with and unlabeled , it is assumed that AO produces 46N2O from two labeled (Eq. 1) and some 45N2O-labeled N2O based on binomial distribution (Eq. 2). If more single-labeled N2O is produced than expected (Eqs. 2 and 3), a hybrid formation of one nitrogen atom from and one from (Eq. 4) is assumed to be taking place as found in archaeal ammonia oxidizers (Kozlowski et al., 2016). In incubations with 15, we assume that 46N2O comes from nitrifier denitrification or denitrification, which cannot be distinguished (Eq. 1). Hence, any production of 45N2O not attributed to denitrification stems from hybrid N2O formation by archaeal nitrifiers (Eq. 4). In incubations with , denitrification produces 46N2O, and it was the only process considered and hence was calculated based on Eq. (1). Rates (R) are calculated as nmol N2O L−1 d−1 (Trimmer et al., 2016):
where fN is the fraction of 15N in the substrate pool (, or ), which is assumed to be constant over the incubation time. Hence, changing fN due to any other concurrent N-consumption or production process during the incubation is neglected. Nevertheless, the assumption of constant fN has implications that may affect the results. There is a potential for overestimating hybrid N2O production in incubations by 5 % in samples with high reduction rates. But in incubations from anoxic depths with high reduction rates, no hybrid N2O production was found at all. For example, accounting for a decrease in fN of the pool by active oxidation, the process with the highest rates (Sun et al., 2017) had an effect of only ±0.2 % on the final rate estimate. The presence of dissimilatory nitrate reduction to ammonium (DNRA) complicates 15N-labeling incubations because it can change fN in all three tracer experiments. In incubations, active DNRA produces and from , which can contribute to 46N2O production by AO. Even if a maximum DNRA rate (20 nM d−1, Lam et al., 2009) is assumed to produce 0.02 nM during the 24 h incubations and all of it is oxidized (maximum N2O production from AO 0.16 nM d−1, this study), its contribution to 46N2O production is likely minor and within the standard error of the high N2O production rates from NO3. Hence an overestimation of the N2O production rates is unlikely. The same applies in incubations with 15N- when DNRA produces ; additional 46N2O can be produced with a hybrid mechanism by AO. In incubations with high starting fN (>0.7) the production of by reduction (which decreases fN) leads to an underestimation by up to 9 %, whereas in incubations with a low fN (<0.3) the effect is less (up to 3 % underestimation of N2O production rates). In incubations (fN>0.9), the maximum DNRA rate would lead to an underestimation of 3.5 %. The slope of 46N2O and slope of 45N2O represent the 46N2O and 45N2O production rates, which were tested for significance based on a linear regression (n=5, Student's t test, R2>0.80, p<0.05). Linear regressions that were not significantly different from zero were reported as 0. The error for each N2O production rate was calculated as the standard error of the slope. Detection limits were 0.002 nmol L−1 d−1 for N2O production from AO and 0.1 nmol L−1 d−1 for N2O production from denitrification based on the average measured standard error for rates (Dalsgaard et al., 2012). The curve-fitting tool of SigmaPlot was used for the O2 sensitivity experiments. A one-way ANOVA was performed on the N2O production rates to determine if rates were significantly different between POM treatments.
The rates (R) of oxidation to and reduction to were calculated based on the slope of the linear regression of 15 enrichment over time (n=5) (Eq. 6).
where fN is the fraction of 15N in the substrate pool ( or ).
Yield (%) of N2O production during oxidation was defined as the ratio of the production rates (Eq. 7).
Yields of N2O production during denitrification were calculated based on the fact that N2O is not a side product during reduction to but rather the next intermediate during denitrification (Eq. 8).
All rates, yields and errors are reported in Table S3 in the Supplement.
2.3 Molecular analysis – qPCR and microarrays
DNA and RNA were extracted using the AllPrep DNA/RNA Mini Kit (Qiagen) followed by immediate cDNA synthesis from purified and DNA-cleaned RNA using a SuperScript III First-Strand Synthesis System (Invitrogen). The PicoGreen dsDNA quantification kit (Invitrogen) was used for DNA quantification, and the Quant-iT OliGreen ssDNA quantification kit (life technologies) was used for cDNA quantification.
The abundances of total and active nirS and archaeal amoA communities were determined by qPCR with assays based on SYBR Green staining according to methods described previously (Jayakumar et al., 2013; Peng et al., 2013). Primers nirS1F and nirS3R (Braker et al., 1998) were used to amplify a 260 bp conserved region within the nirS gene. The nirS primers are not specific for epsilon-proteobacteria (Murdock and Juniper, 2017), but in previous metagenomes from the ETSP epsilon-proteobacteria below 3 %–4 % of the reads or not found, except in very sulfidic, coastal stations (Stewart et al., 2011; Wright et al., 2012; Ganesh et al., 2014; Schunck et al., 2013; Kalvelage et al., 2015). Primers Arch-amoAF and Arch-amoAR (Francis et al., 2005) were used to quantify archaeal amoA abundance. A standard curve containing six serial dilutions of a plasmid with either an archaeal amoA fragment or a nirS fragment was used on respective assay plates. Assays were performed in a StratageneMx3000P qPCR cycler (Agilent Technologies) in triplicates of 20–25 ng DNA or cDNA, along with a no-primer control and a no-template control. Cycle thresholds (Ct values) were determined automatically and used to calculate the number of nirS or archaeal amoA copies in each reaction, which was then normalized to copies per milliliter of seawater (assuming 100 % recovery). The detection limit was around 15 copies mL−1 based on the Ct values of the no-template control.
Microarray experiments were carried out to describe the community composition of the total and active nirS and archaeal amoA groups using the DNA and cDNA qPCR products. Pooled qPCR triplicates were purified and cleaned using the QIAquick PCR Purification Kit (Qiagen). Microarray targets were prepared according to Ward and Bouskill (2011). Briefly, dUaa was incorporated into DNA and cDNA targets during linear amplification with random octomers and a Klenow polymerase using the BioPrime kit (Invitrogen) and then labeled with Cy3, purified and quantified. Each probe is a 90-mer oligonucleotide consisting of a 70-mer archetype sequence combined with a 20-mer reference oligonucleotide as a control region bound to the glass slide. Each archetype probe represents a group of related sequences with 87±3 % sequence identity of the 70-mer sequence. Microarray targets were hybridized in duplicates on a microarray slide, washed and scanned using a laser scanner 4200 (Agilent Technologies), and analyzed with GenePix Pro 6.0. The resulting fluorescence ratio (FR) of each archaeal amoA or nirS probe was divided by the FR of the maximum archaeal amoA or nirS FR on the same microarray to calculate the normalized FR (nFR). The nFR represents the relative abundance of each archetype and was used for further analyses.
Two different arrays were used: BCO16, which contains 99 archaeal amoA archetype probes representing ∼8000 archaeal amoA sequences (Biller et al., 2012); and BCO15, which contains 167 nirS archetype probes representing ∼ 2000 sequences (collected from NCBI in 2009). A total of 74 assays were performed with 21 nirS cDNA targets, 21 nirS DNA targets, 16 amoA cDNA targets and 16 amoA DNA samples. The original microarray data from BCO15 and BC016 are available via GEO (Gene Expression Omnibus; http://www.ncbi.nlm.nih.gov/geo/, last access: 16 April 2020) at NCBI (National Center for Biotechnology Information) under GEO accession no. GSE142806.
2.4 Data analysis
Spearman Rank correlation was performed from all N2O production rates, AO and reduction rates, environmental variables, nirS and archaeal amoA gene and transcript abundance, and the 20 most abundant archetypes of total and active nirS and amoA using R. Only significant values (p<0.05) are shown. Archetype abundance (nFR) data were square root transformed, and beta-diversity was calculated with the Bray–Curtis coefficient. Alpha diversity of active and total nirS and amoA communities was estimated by calculating the Shannon diversity index using PRIMER6. Bray–Curtis dissimilarities were used to perform a Mantel test to determine significant differences between active and total communities of nirS and amoA using R (version 3.0.2, package vegan; Oksanen et al., 2019). Canonical correspondence analysis (CCA) (Legendre and Legendre, 2012) was used to visualize differences in community composition dependent upon environmental conditions using the software PAST (Hammer et al., 2001). Before CCA, a forward selection (Borcard et al., 1992) of the parameters that described the environmental and biological variables likely to explain the most significant part of the changes in the archetypes was performed.
The make.lefse command in mothur was used to create a linear discriminant analysis (LDA) effect size (LEfSe) (Segata et al., 2011) input file from the mothur shared file. This was followed by a LEfSe (https://huttenhower.sph.harvard.edu/galaxy, last access: 16 April 2020) to test for discriminatory archetypes between O2 levels. With a normalized relative abundance matrix, LEfSe uses the Kruskal–Wallis rank sum test to detect features with significantly different abundances between assigned archetypes in the different O2 levels and performs an LDA to estimate the effect size of each feature. A significant alpha of 0.05 and an effect size threshold of 2 were used for all marker genes discussed in this study.
3.1 Hydrographic conditions
The upwelling system off Peru is a hotspot for N2O emissions (Arévalo-Martínez et al., 2015), with the most intense upwelling in austral winter but maximum chlorophyll during December to March (Chavez and Messié, 2009; Messié and Chavez, 2015). The sampling campaign took place during austral fall in the absence of intense upwelling or maximum chlorophyll. The focus of this study was the region close to the coast, which has highly variable N2O concentration profiles (Kock et al., 2016) and N2O emissions (Arévalo-Martínez et al., 2015). The Peru coastal water (PCW, temperature <19.5 ∘C, salinity 34.9–35.1) and the equatorial subsurface waters (ESSW, temperature 8–12 ∘C, salinity 34.7–34.9) (Pietri et al., 2013) were the dominant water masses off the Peruvian coast sampled for N2O production rate measurements (Table 1). At the southernmost transect at 15.5–16∘ S a mesoscale anticyclonic mode water eddy (McGillicuddy et al., 2007), which was about to detach from the coast, was detected from deepening/shoaling of the main/seasonal pycnoclines (Fig. S3). Generally, the stations were characterized by a thick anoxic layer (254–427 m) reaching to the seafloor at two shelf stations (894, 883). concentration accumulated only up to 2 µmol L−1 in the secondary maximum (SNM) at the northern transect (stations 882, 883) but up to 7.19 µmol L−1 along the southern transect (Fig. 2, station 907, 912). N2O concentration profiles showed a high variability with respect to depth and O2 concentrations (Fig. 2). The southern transect (station 907, 912) showed the lowest N2O concentrations (5 nmol L−1) in the center of the anoxic zones. At the same time, station 912 in the center of the eddy showed the highest N2O concentration with 78.9 nmol L−1 at [O2] below detection limit in the upper part of the anoxic zone. Above the ODZ, the maximum N2O peak ranged from 57.9 to 78.9 nmol L−1 and was found at an O2 concentration range from below detection (883, 894, 892, 912) up to 67 µmol L−1 (907). Three stations (892, 894 and 904) showed high surface N2O concentrations of 64 nmol L−1.
Table 1Overview of characteristics of samples. bd – below detection limit of the Winkler method and Sea-Bird sensor (2 µmol L−1); × – analysis includes qPCR and microarray with qPCR products; – only qPCR, no microarray.
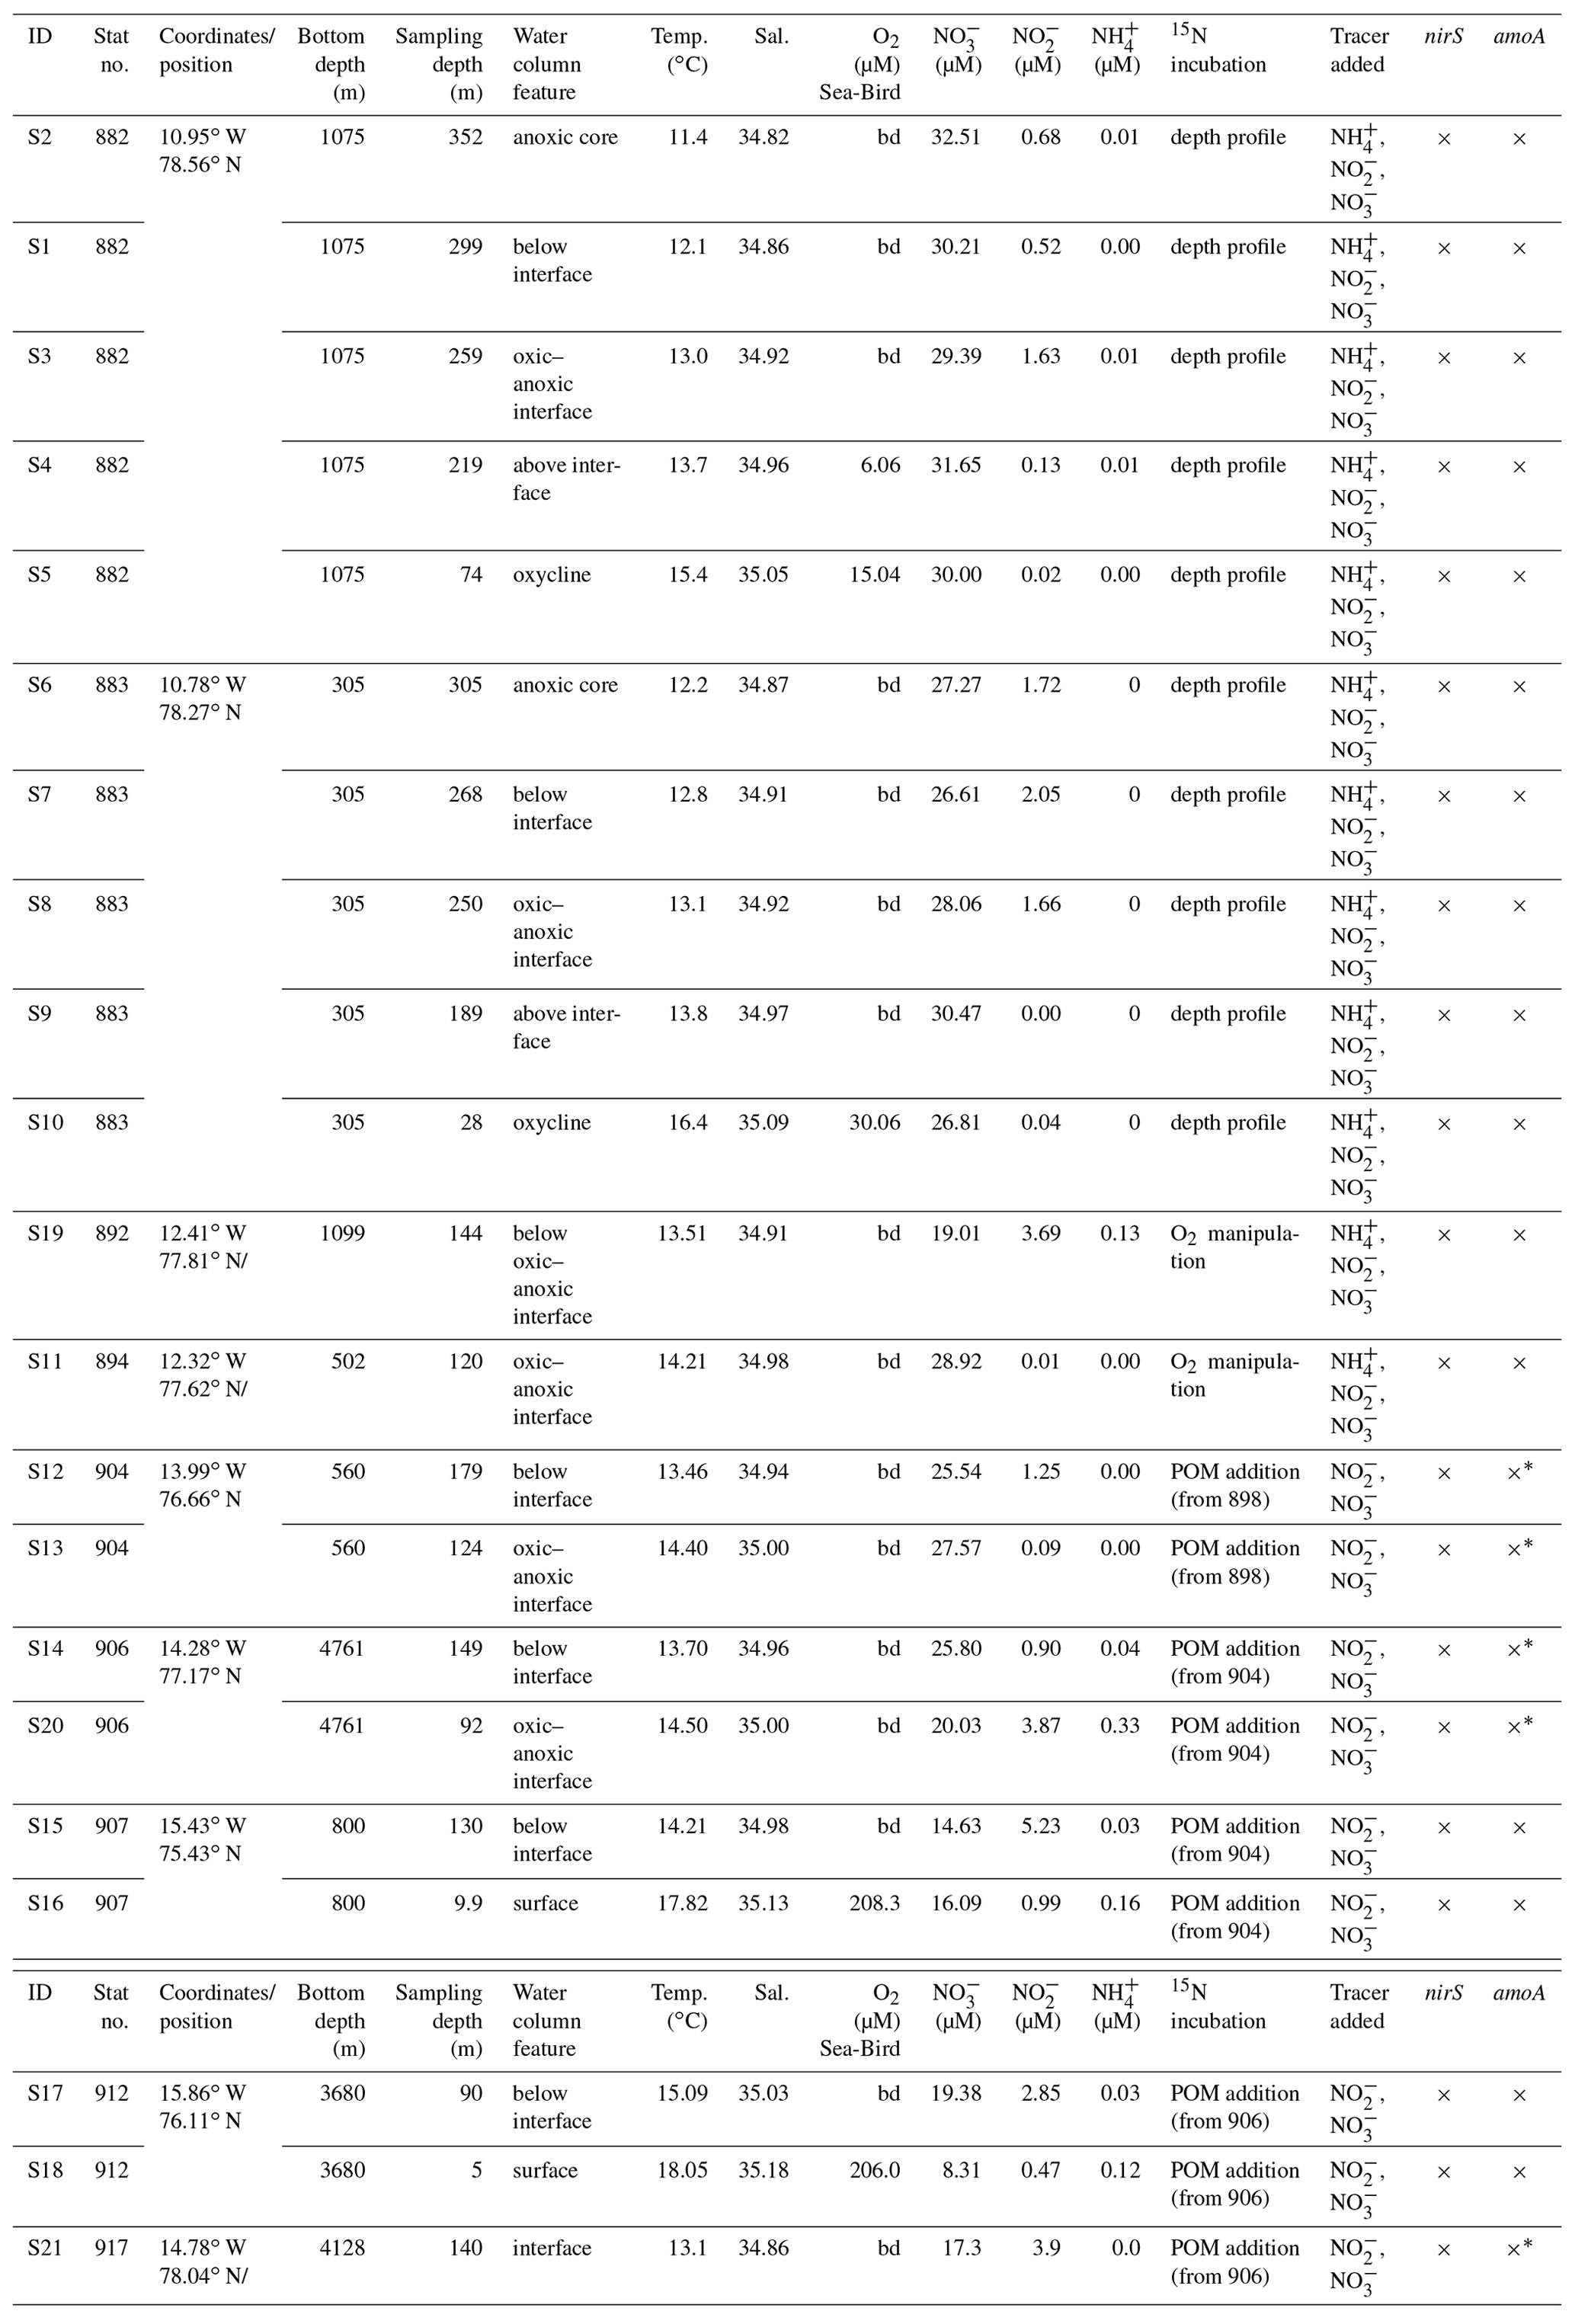

Figure 2Depth profiles of O2, nutrients and N2O in the upper 400 m for all stations. Panels (a)–(d) refer to the transect numbers 1–4.
3.2 Depth distribution of N2O production rates and total and active nirS and amoA abundance
N2O production varied with depth and substrate (Fig. 3, Table S3). In the oxycline, the highest AO (34±0.1 and 35±9.2 nmol L−1 d−1) coincided with the highest N2O production from AO (0.141±0.003 and 0.159±0.003 nmol L−1 d−1) at both stations of the northern transect, stations 883 and 882, respectively (Fig. 3I.a, b). oxidation and its N2O production decreased to zero in the ODZ. The rates of the reductive source pathways for N2O increased with depth. N2O production from and displayed similar patterns with the highest production at or below the oxic -anoxic interface (Fig. 3II). N2O production from showed the highest rates of 3.06±1.17 nmol L−1 d−1 (912) and 2.37±0.54 nmol L−1 d−1 (906) further south (Fig. 3II.m, q) compared to lower rates at northern stations, where the maximum rate was 0.71±0.38 nmol L−1 d−1 (Fig. 3II.c, 883). A similar trend was found for N2O production from : lower maximum rates at northern stations with 2.7±0.4 nmol L−1 d−1 (882) and 5.7±2.8 nmol L−1 d−1 (883, Fig. 3II.b) and the highest rates in southern transects with 7.2±1.64 nmol L−1 d−1 (Fig. 3II.l, 904) in transect 3 and up to 118.0±27.8 nmol L−1 d−1 (Fig. 3II.p, 912) in transect 4. Generally, N2O production rates from and were 10- to 100-fold higher than from AO.
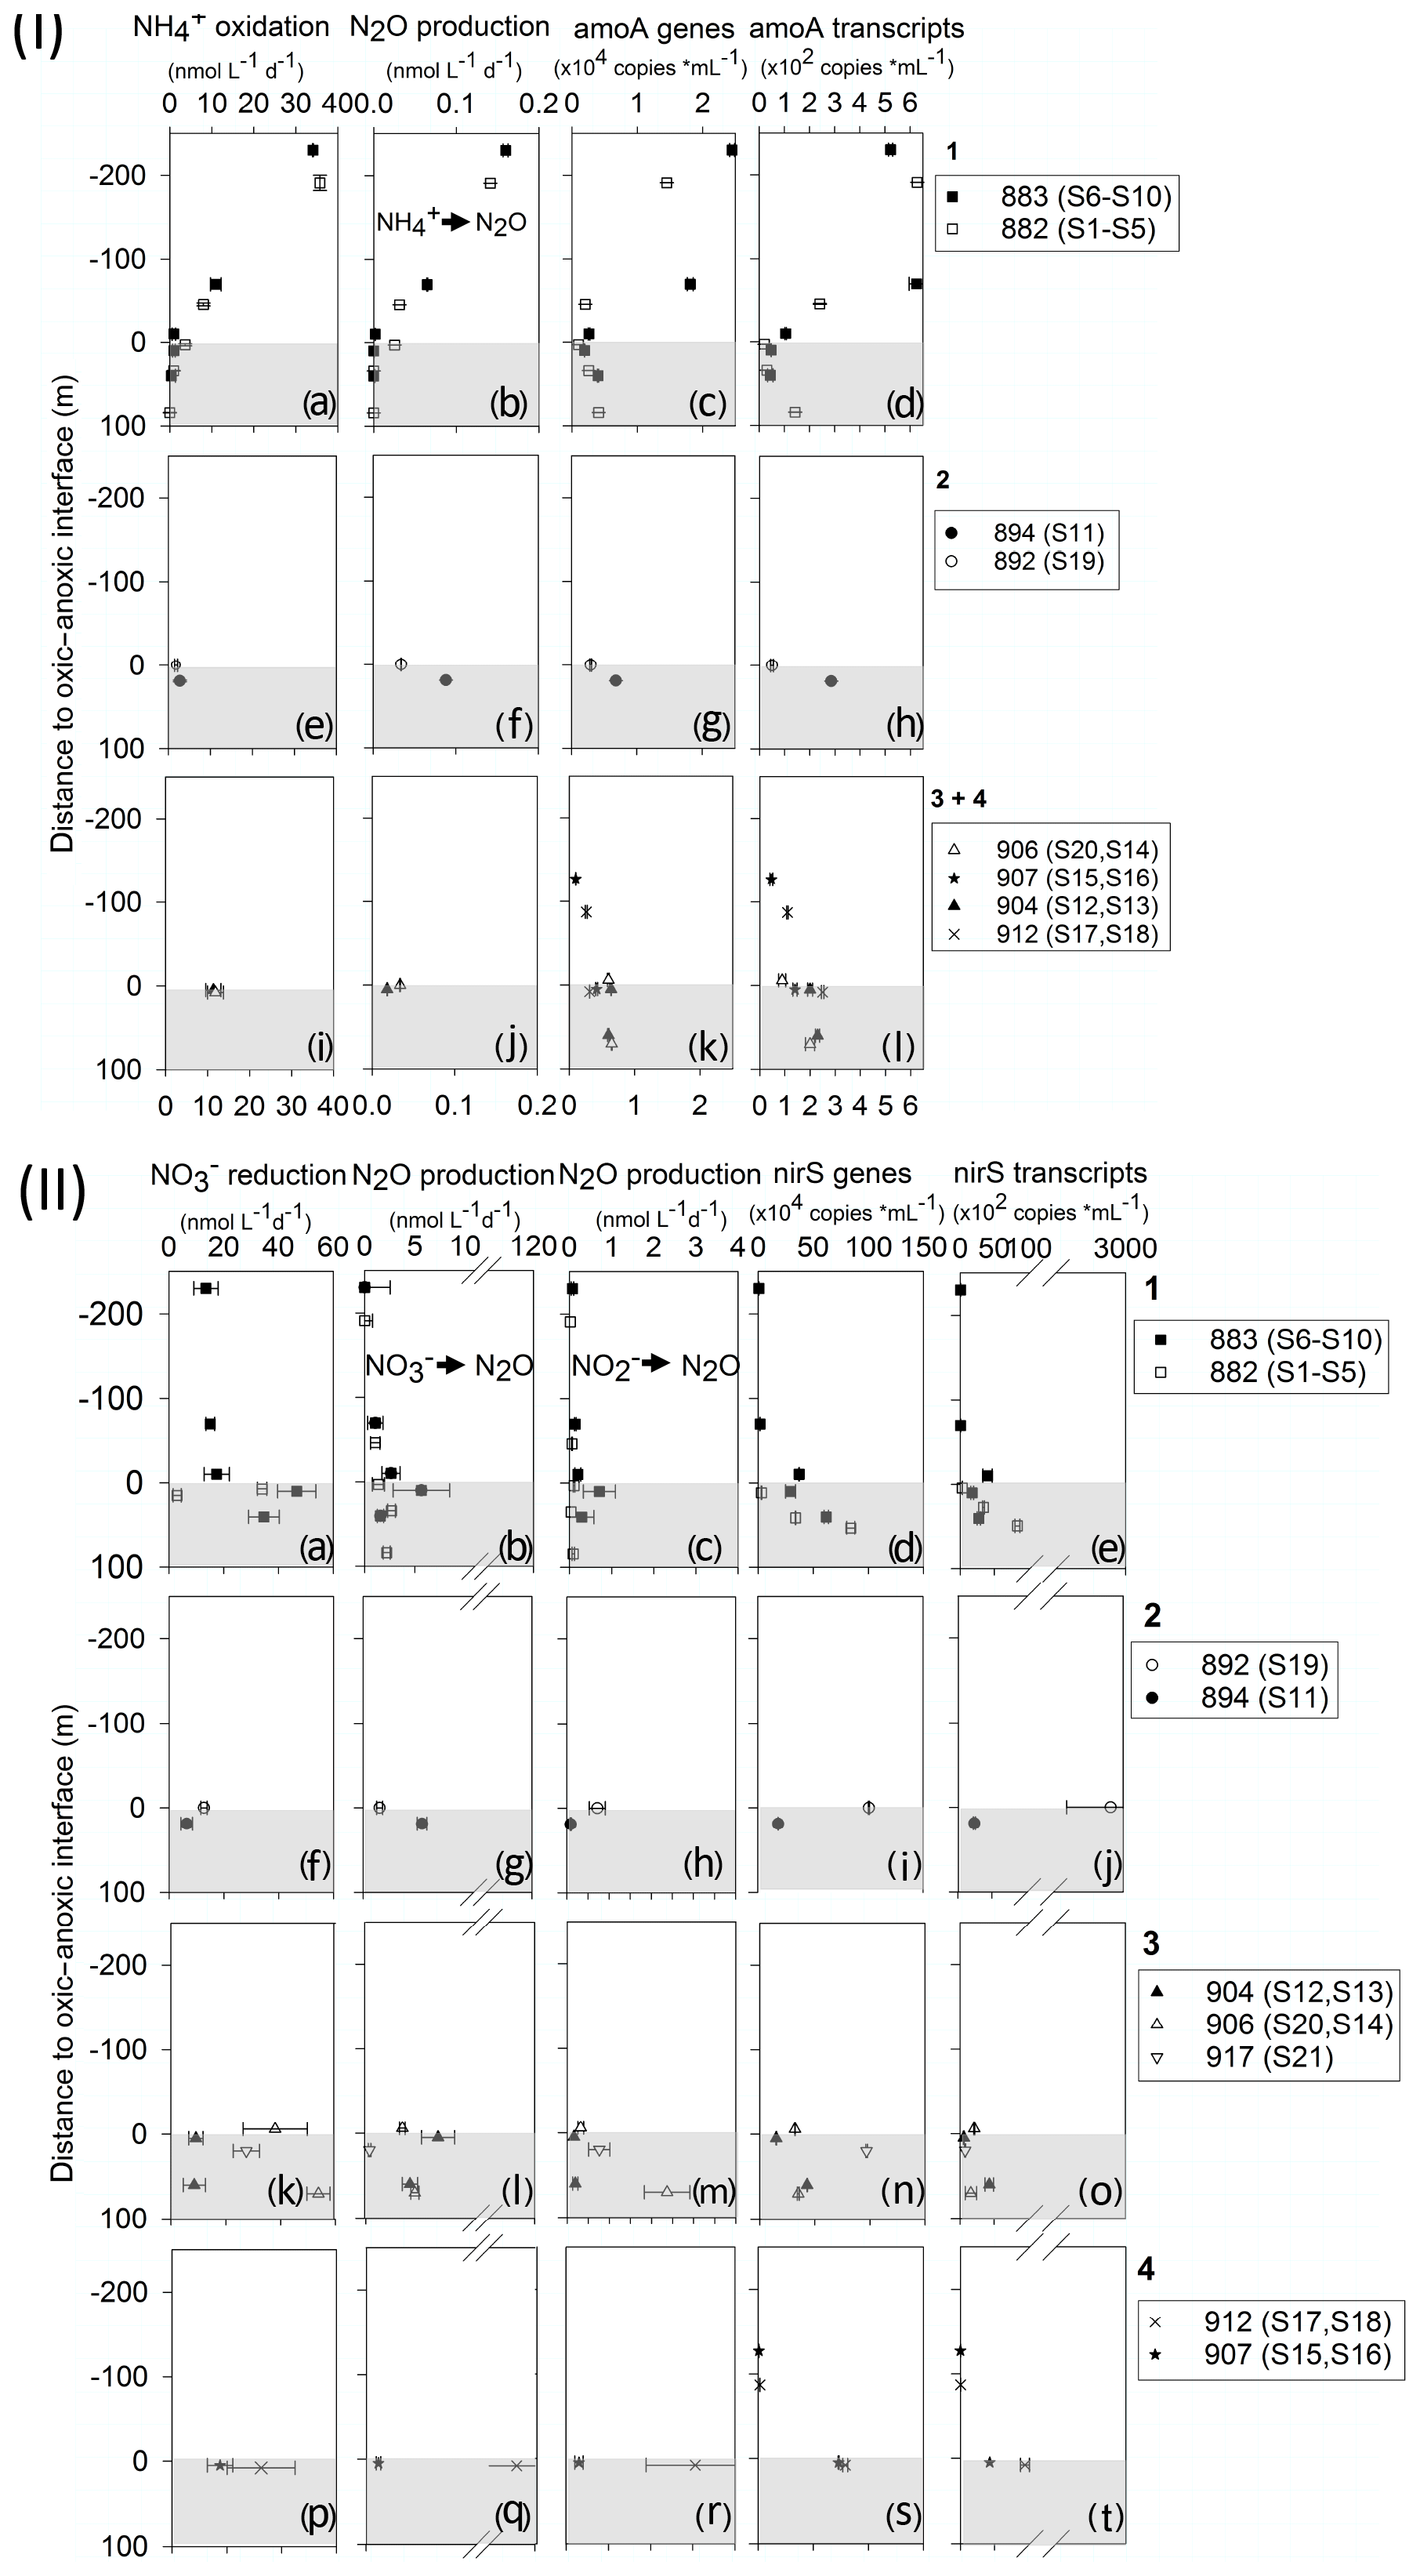
Figure 3(I) Profiles of AO (a, e, i), N2O production rates from (b, f, j), archaeal amoA gene (c, g, k) and transcript copy numbers per milliliter (d, h, l). (II) Profiles of reduction rates (a, f, k, p), N2O production rates from (b, g, l, q) and (c, h, m, r), and nirS gene (d, i, n, s) and transcript copy numbers per milliliter (e, j, m, t). In (I) and (II), the panel numbers 1–4 correspond to transect numbers. Negative values on the y axis represent shallower, oxic depths, and the positive values represent deeper, anoxic depth (0 = interface). Shaded area indicates the anoxic zone. Note the different scale for N2O production rates.
qPCR analysis detected the lowest gene and transcript numbers of archaeal amoA and nirS in the surface mixed layer (Fig. 3I.k, l, II.r, s). The highest archaeal amoA gene and transcript abundance was in the oxycline (1–40 µmol L−1 O2) with 24 500 ± 340 and 626±29 copies mL−1 at station 883 (Fig. 3I.c, d). amoA gene and transcript number decreased in the ODZ to 1000–6500 gene copies mL−1 and 20–250 transcript copies mL−1. The profiles of nirS gene and transcript abundance were similar to each other (Fig. 3II.d, e), with the highest abundance in the ODZ up to 1×10⁶ and 2.9×10⁵ copies mL−1, respectively. Denitrifier nirS genes and transcripts peaked in the anoxic layer and were significantly correlated with N2O production from but not from . Archaeal amoA gene and transcript abundances were significantly correlated with AO and N2O production from AO (Fig. S5). N2O concentrations did not correlate with any of the measured variables (Fig. S5).
3.3 Influence of O2 concentration on N2O production
N2O production along the in situ O2 gradient for the substrates and decreased exponentially with increasing O2 concentrations (Fig. 4b, c), while for , the N2O production was highest at the highest sampled O2 concentration (Fig. 4a). At in situ O2 levels above 8.4 µmol L−1, N2O production decreased by 100 % and 98 % from and , respectively (Fig. 4b, c).
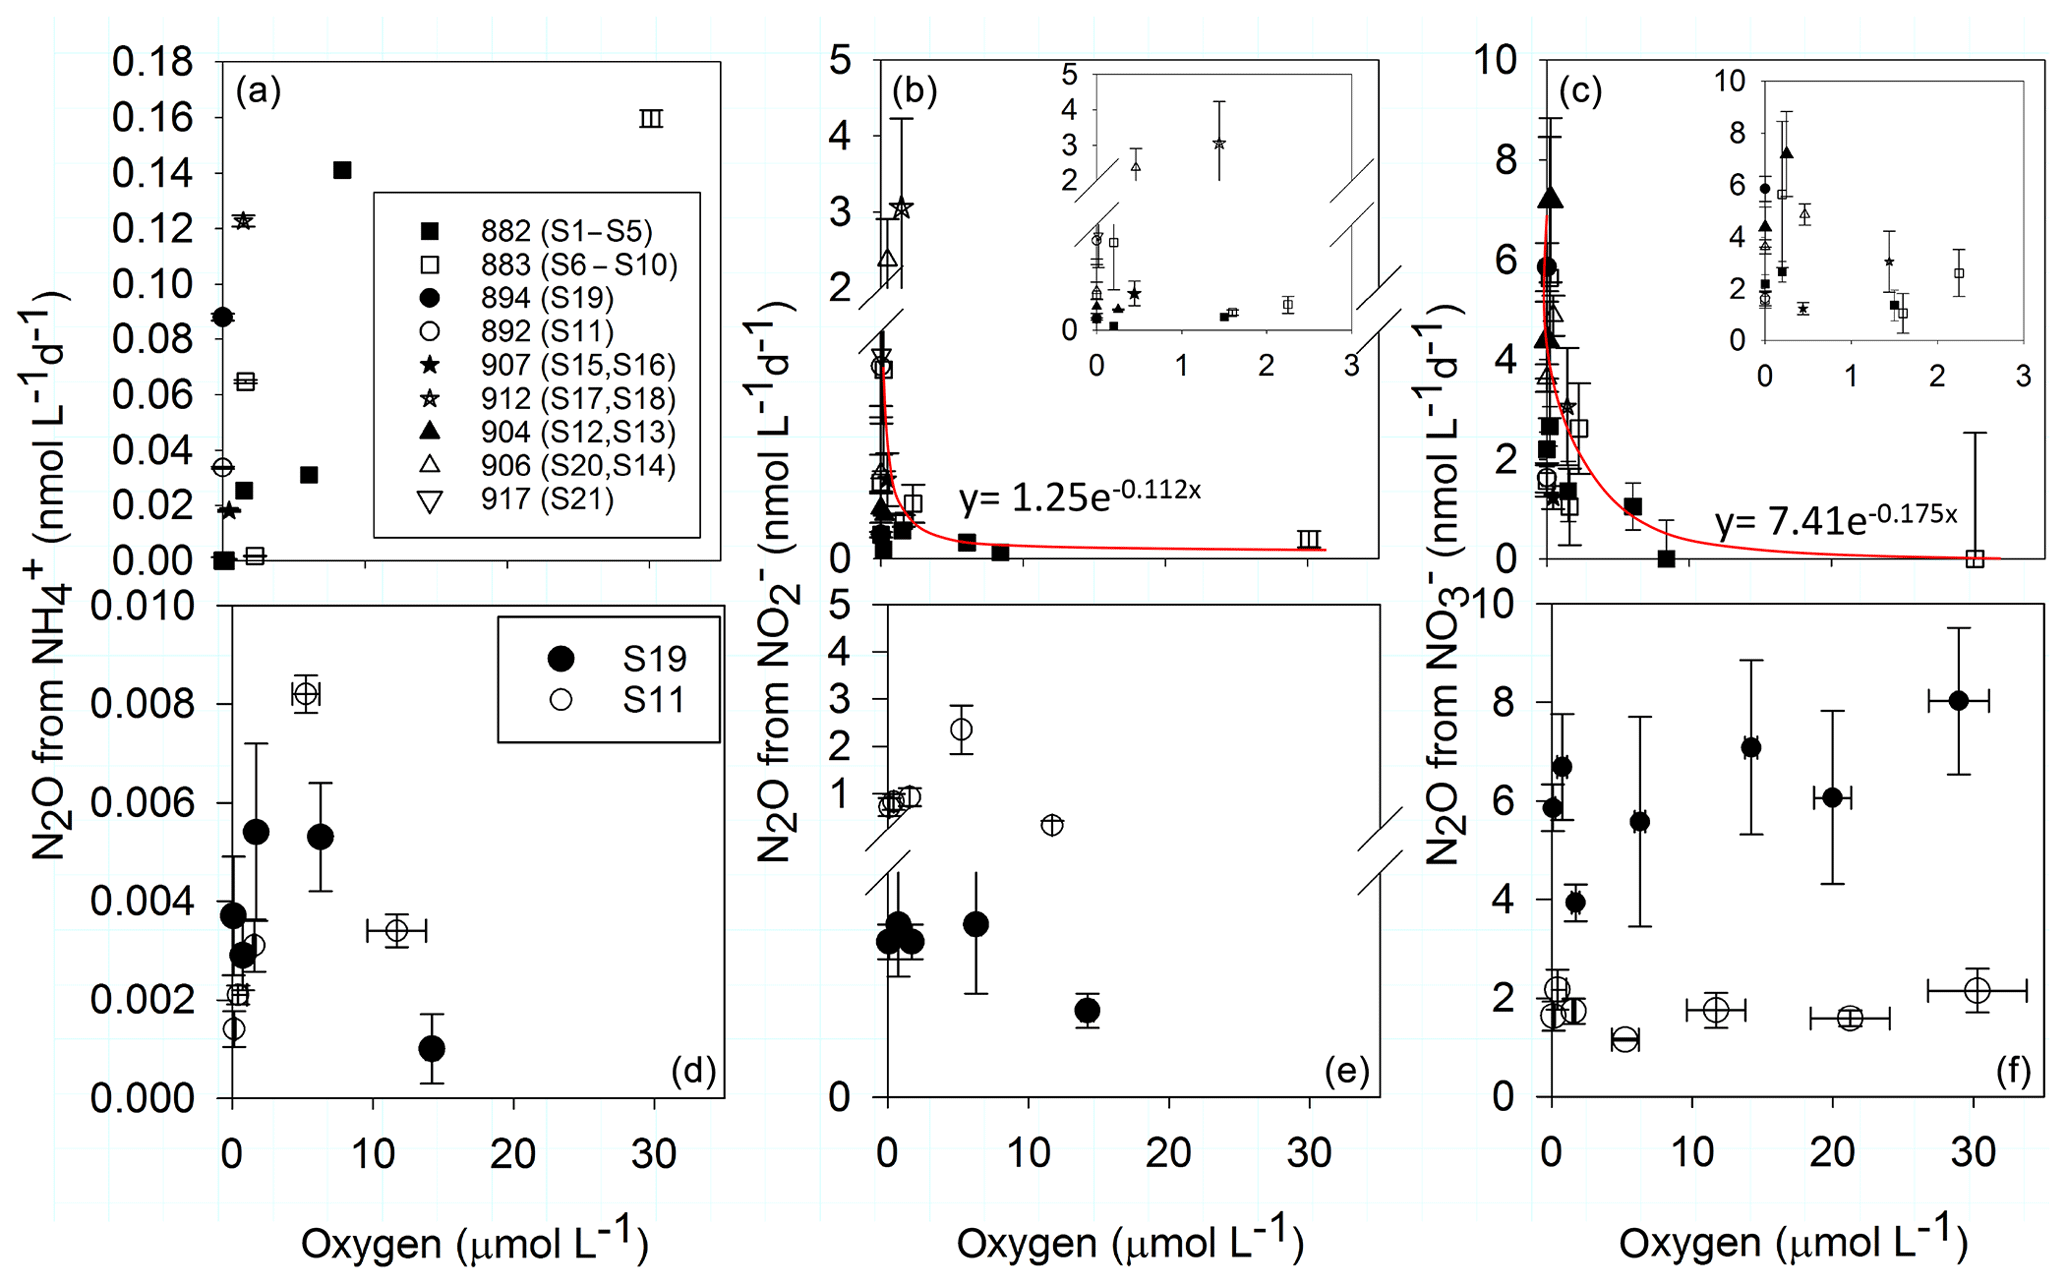
Figure 4O2 dependence of N2O production rates from (a, d), (b, e) and (c, f). Upper panels (a–c) is N2O production along a natural O2 gradient from all stations. Panels (b) and (c) are additionally zoomed in to oxygen concentrations below 5 µmol L−1. Lower panels (d–f) show N2O production in manipulated O2 experiments with water from the oxic–anoxic interface from slope station 892 (S11, 0 µmol L−1 O2, 145 m) and shelf station 894 (S19, 0 µmol L−1, 120 m). Note the different scale for N2O production rates from . Vertical error bars represent ± standard error (n=5 per time course). Horizontal error bars represent ± standard error of measured O2 over the time of incubations (n=6).
In the manipulated O2 treatments from the oxic–anoxic interface (S11, S19) a unimodal response of N2O production from and to O2 is apparent (Fig. 4d, e). Increasing and decreasing O2 concentrations inhibited N2O production from and , with the highest N2O production rate between 1.4 and 6 µmol O2 L−1. However, this response was only significant in sample S11 (Fig. 4d, e). There was no significant response to O2 concentration of N2O production from . O2 did not inhibit N2O production from up to 23 µmol L−1 (Fig. 4f).
The proportion of hybrid N2O produced during AO, i.e., the formation of N2O from one 15 and one N compound (excluding ) such as , NH2OH or NO, was consistently between 70 % and 85 % across different O2 concentrations for manipulated and natural O2 concentrations (Fig. 5a, c). Hybrid formation during N2O production from varied between 0 % and 95 % along the natural O2 gradient (Fig. 5b). In manipulated O2 treatments hybrid formation from did not change across different O2 treatments but with respect to the original depth – 0 % in sample S11, which originated from 145 m of station 892, or 78 % in sample S19 from 120 m of station 894 (Fig. 5d).
The highest N2O yields during AO (over 1 %) occurred between 1.4 and 2 µmol O2 L−1 and decreased at both higher and lower O2 concentrations (Fig. 6a). However, only the increase in yield from nmol O2 to 1.4–2 µmol L−1 O2 was significant (t test, p<0.05), and the following decrease in yield was not (t test, p>0.05). In the manipulated O2 treatment of sample S19 (Fig. 6c) the same significant pattern was observed, whereas in S11 the highest yield was found at 12 µmol L−1 O2. N2O yield during reduction to decreased to zero at 8.4 µmol L−1 O2 along the natural O2 gradient (Fig. 6b), while no significant response occurred in the manipulated O2 treatments (Fig. 6d). There, reduction was decreasing with increasing O2, but N2O production was steady with increasing O2, leading to high yields between 38.8±9 % and 91.2±47 % at 23 µmol L−1 O2.
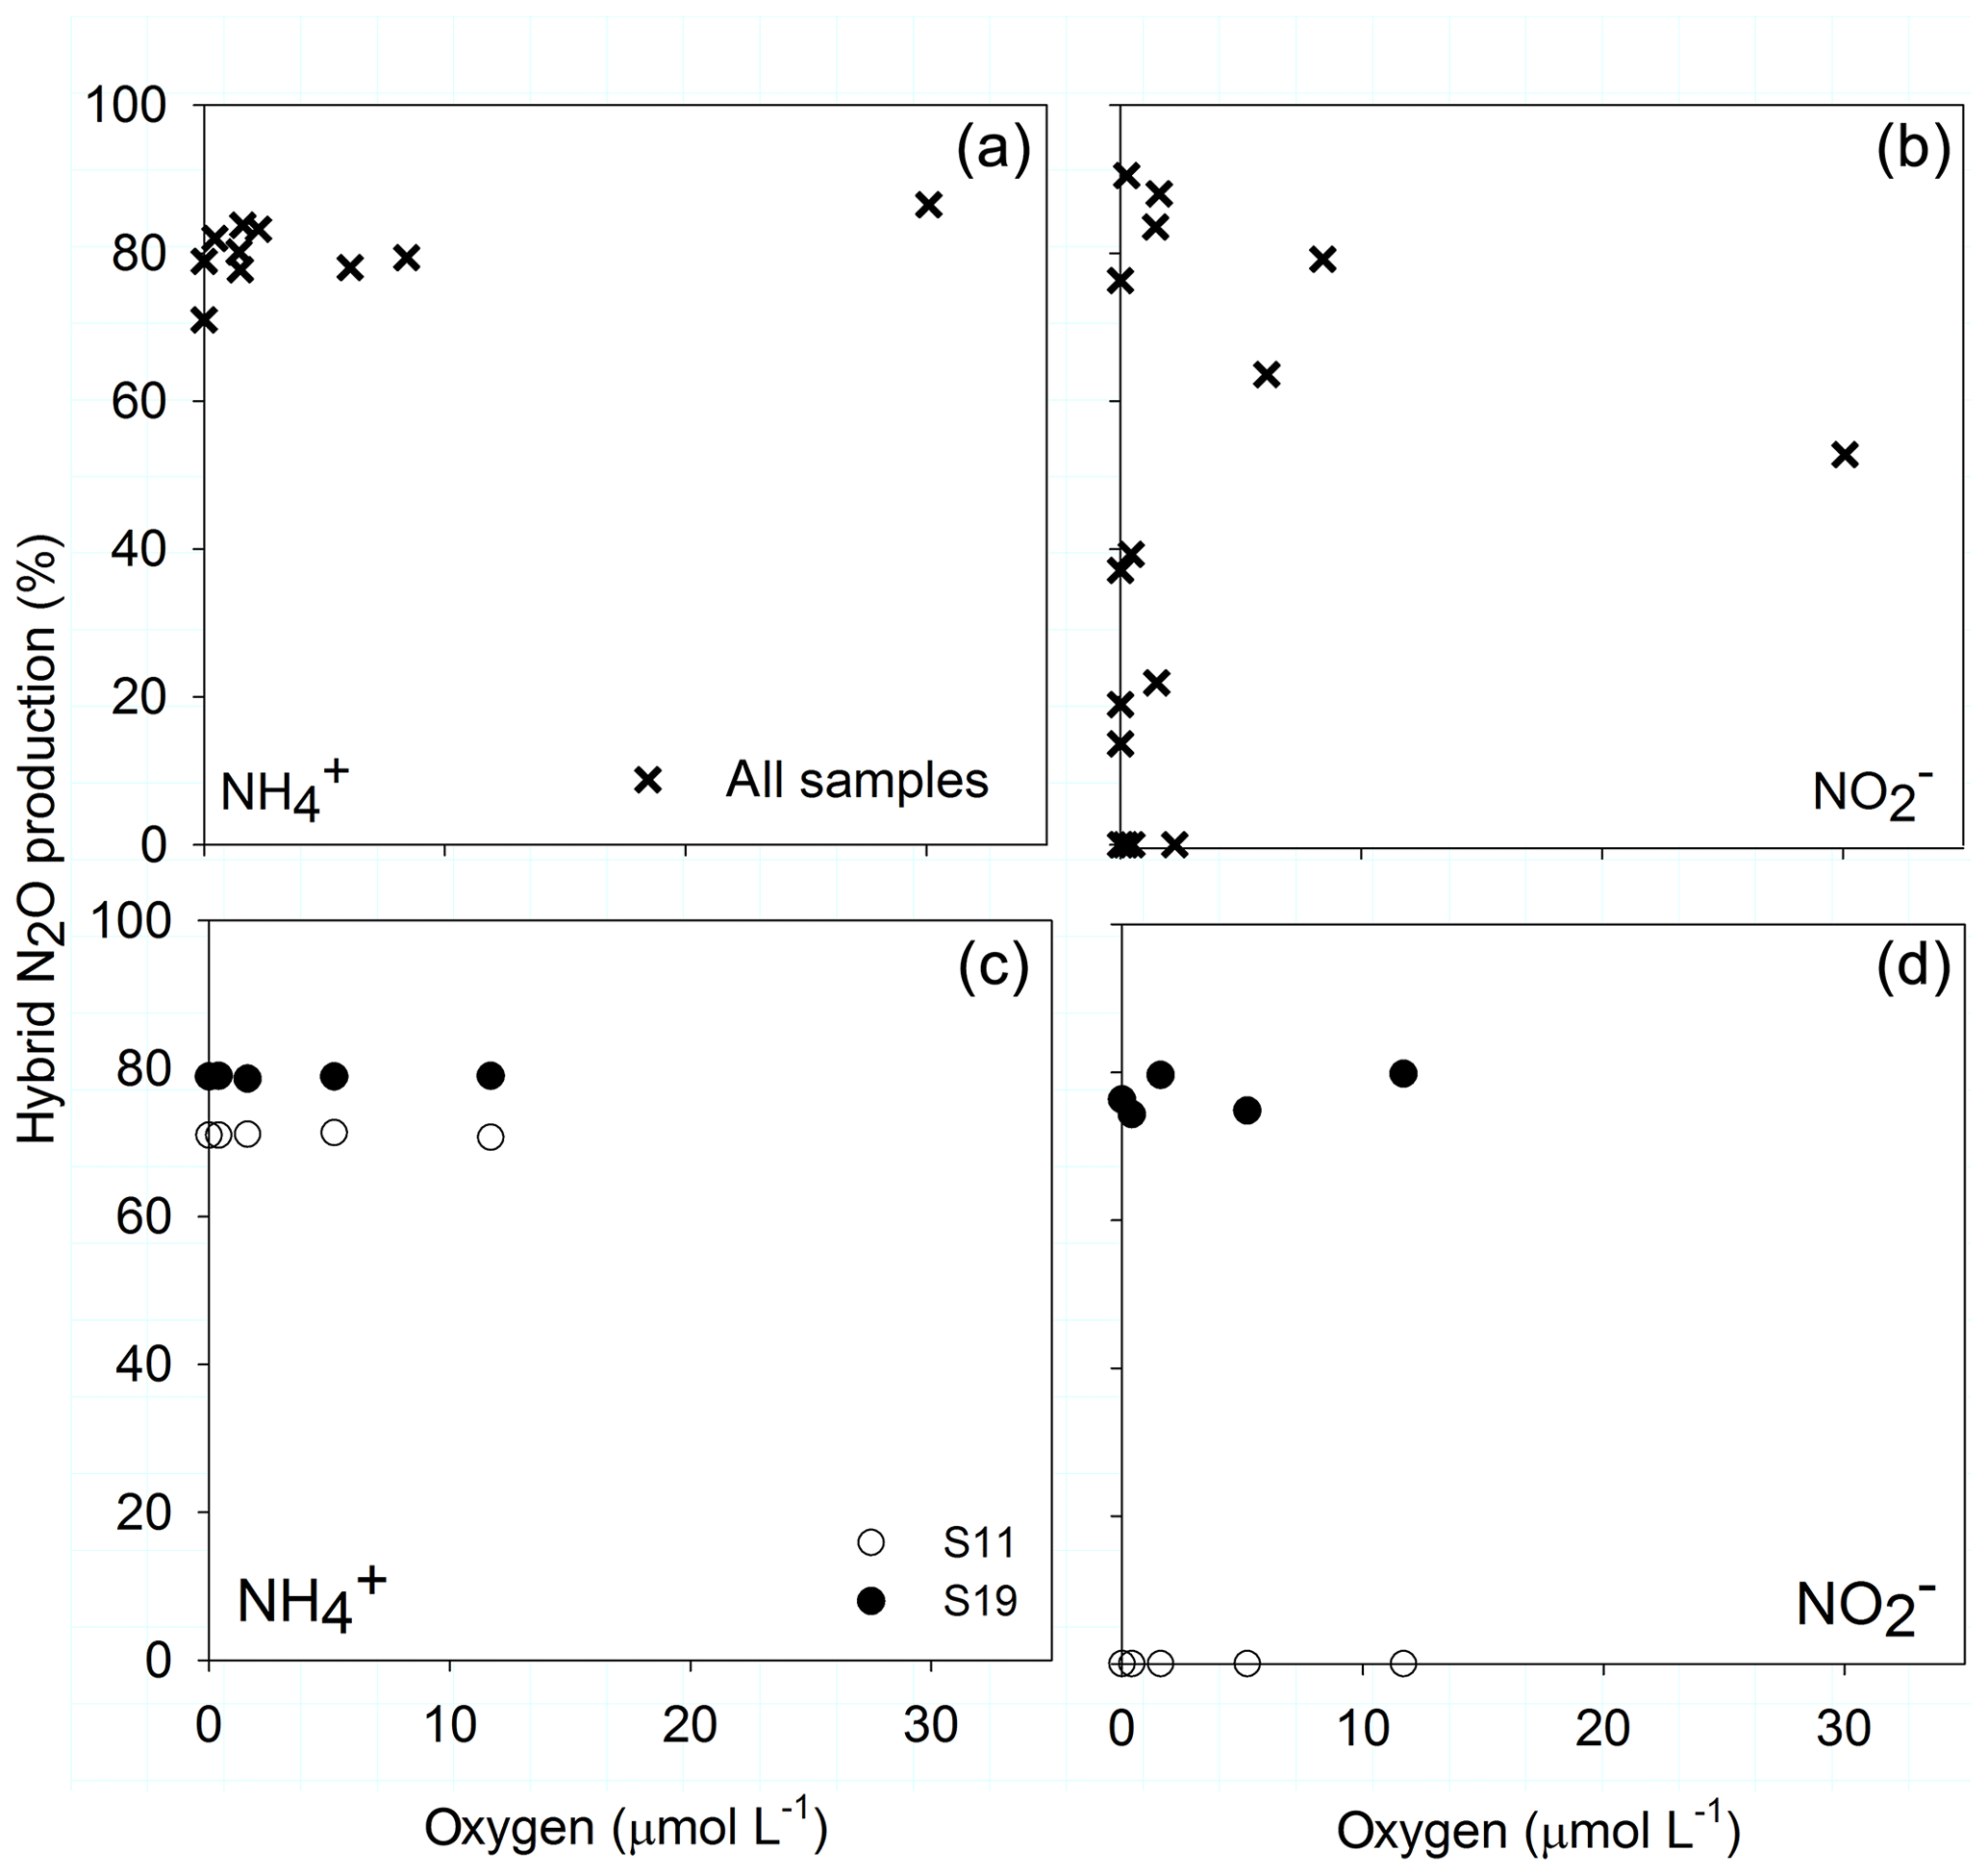
Figure 5O2 dependency of hybrid N2O formation from (a, c) and (b, d) along the natural O2 gradient (a, b) and for the O2 manipulations (c, d) from sample S11 (0 µmol L−1 O2, 145 m) and S19 (894, 0 µmol L−1, 120 m).
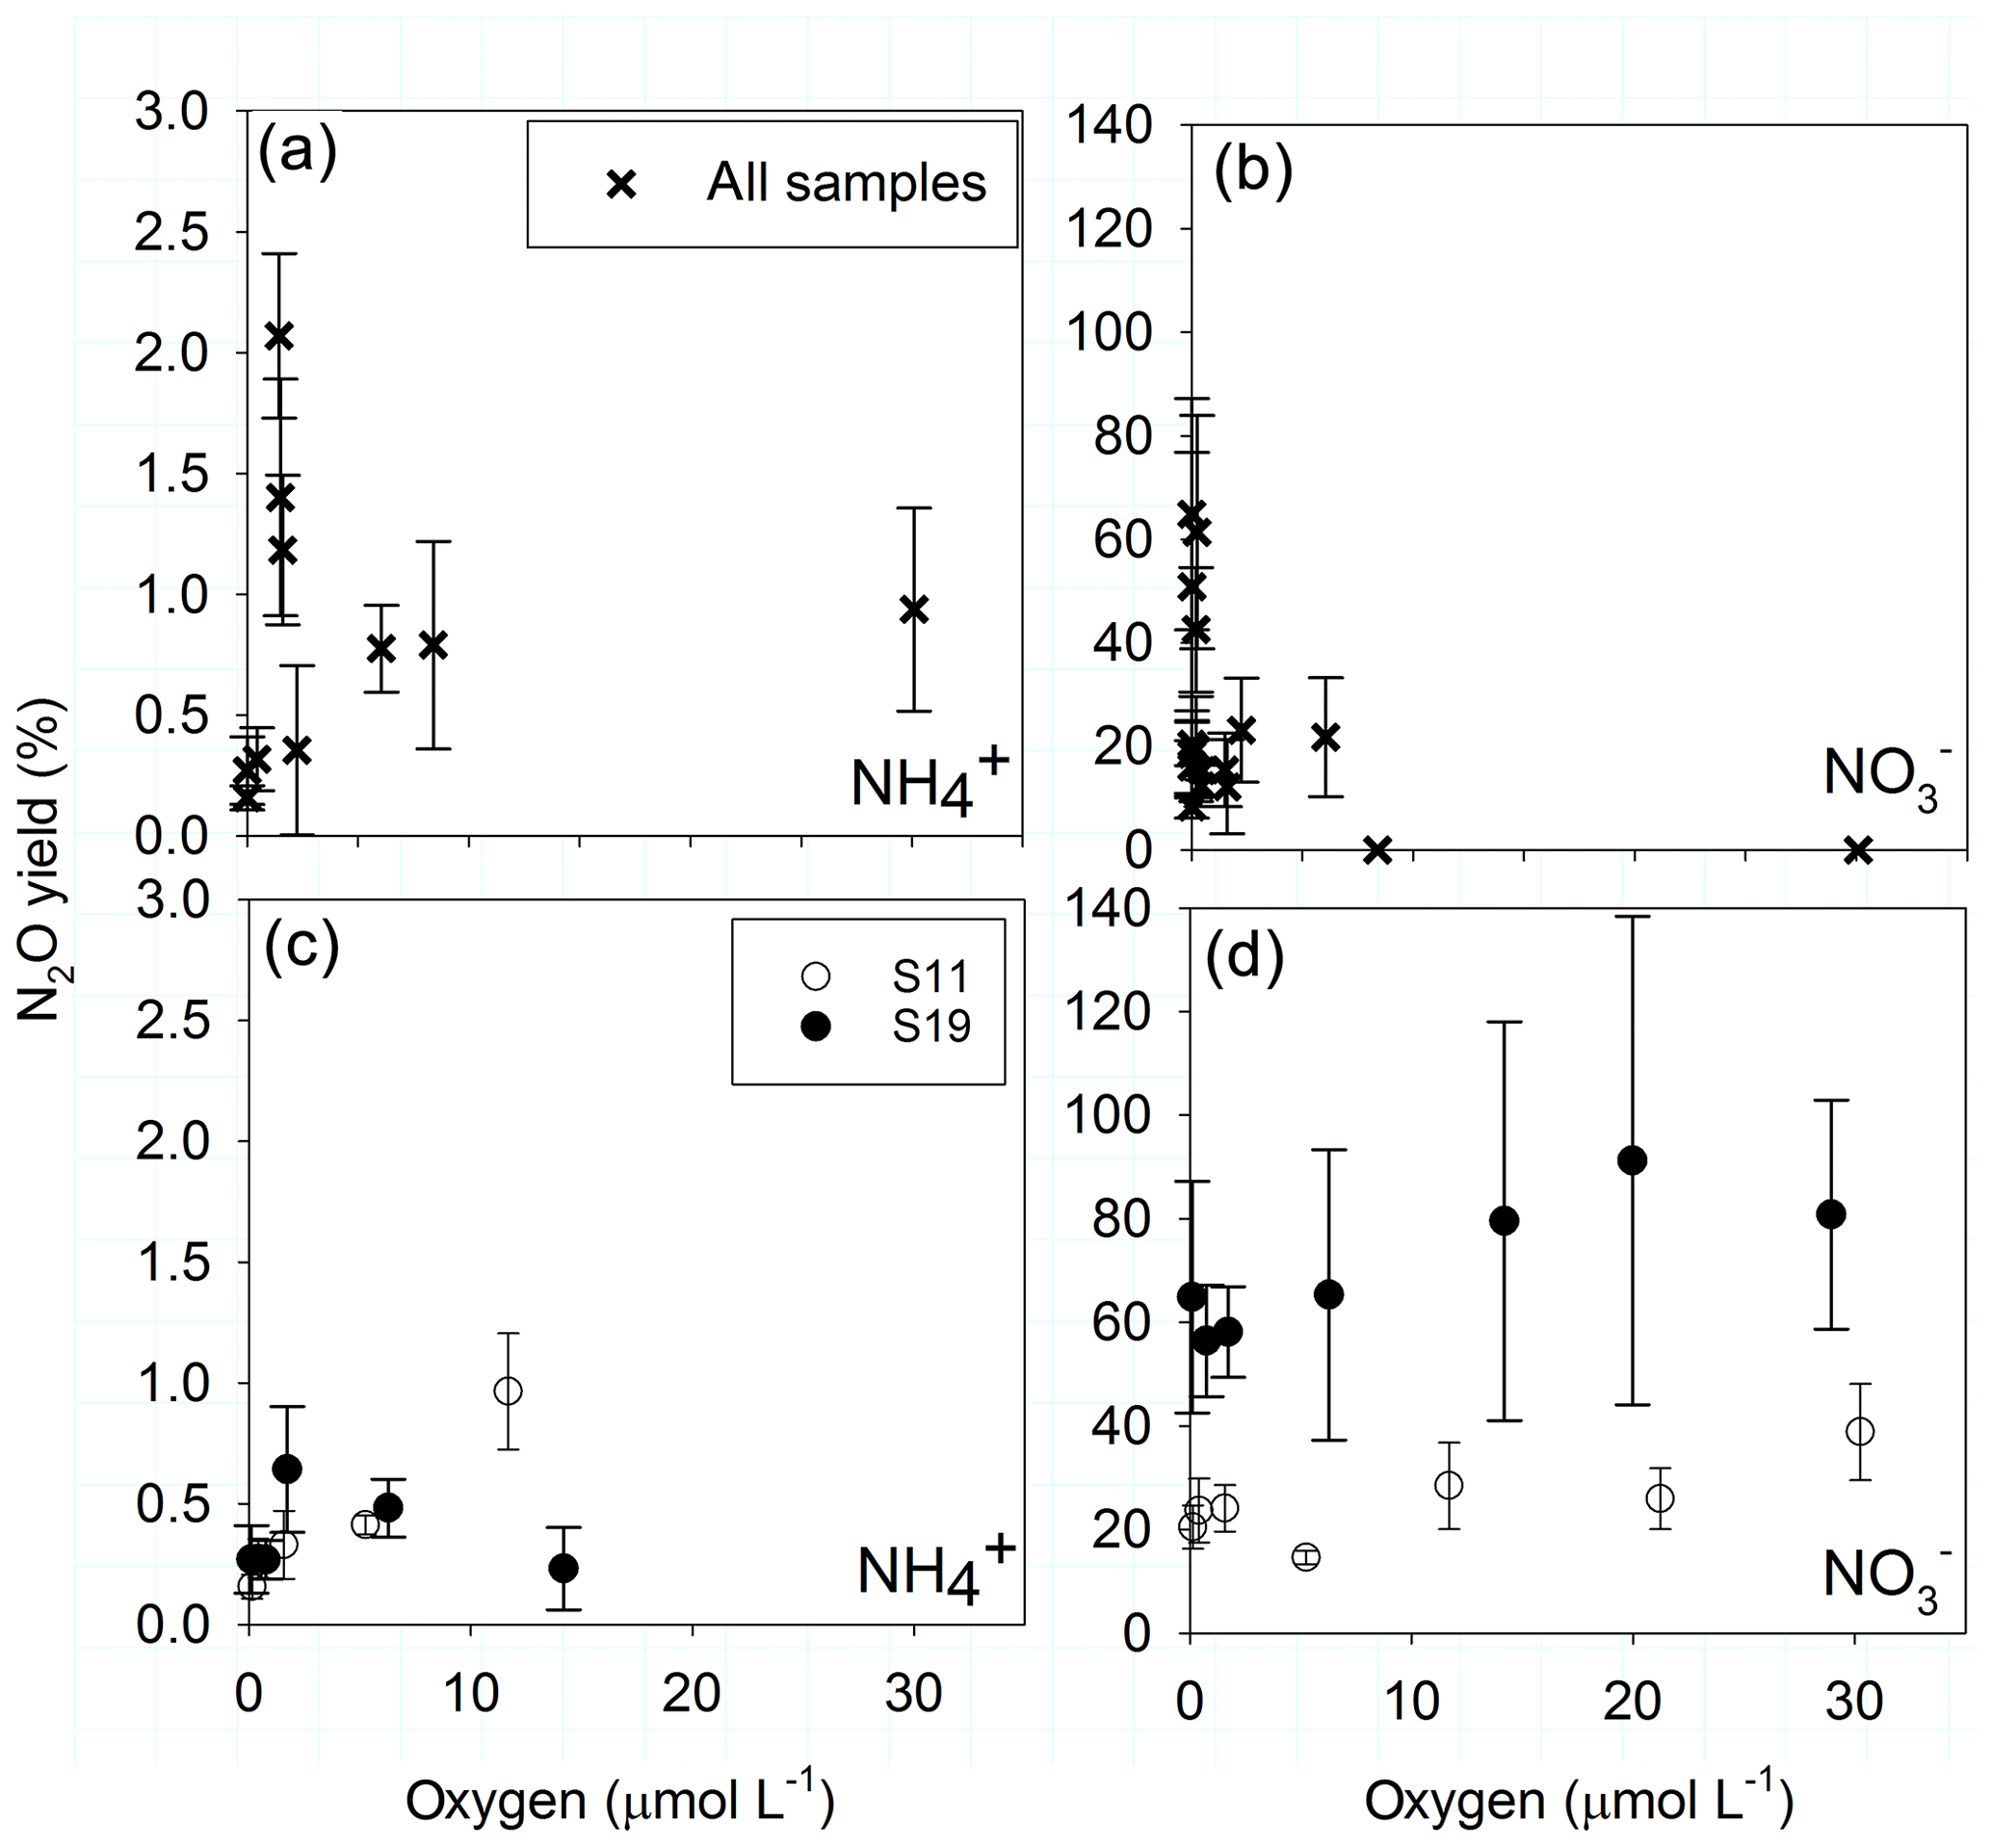
Figure 6Yields (%) of N2O production during oxidation (a, c) and during reduction (b, d) along the natural O2 gradient (a, b) and for the O2 manipulations (c, d) from sample S11 (892, 0 µmol L−1 O2, 145 m) and S19 (894, 0 µmol L−1, 120 m). Error bars present ± SD calculated as error propagation.
3.4 Effect of large particulate organic matter on N2O production
The autoclaving of the concentrated POM solution liberated from the particles, reducing the N∕C ratio of the particles compared to nonautoclaved particles (Table 2). The highest accumulation is found in samples with the largest difference in N∕C ratios between autoclaved and nonautoclaved particles (Table 2, 904–20, 898–100 m). Addition of 0.17–1.37 µmol C L−1 of autoclaved particles >50 µm (Table 2) produced a significant increase in N2O production by up to 5.2- and 4.8-fold in 10 and 7 out of 19 additions for and respectively (Fig. 7a, b). There was no linear correlation of the origin (mixed layer depth, oxycline or anoxic zone), the quality (N∕C ratio) or the quantity of the organic matter on the magnitude of the increase. Only samples S20 and S17 were not stimulated by particle addition, and N2O production from denitrification did not significantly differ from the control (Fig. 7b).
Table 2Quality (N∕C), quantity (addition µmol L−1) and origin (station and depth) of added, autoclaved and nonautoclaved particulate organic matter (POM) and increase in concentration after autoclaving.
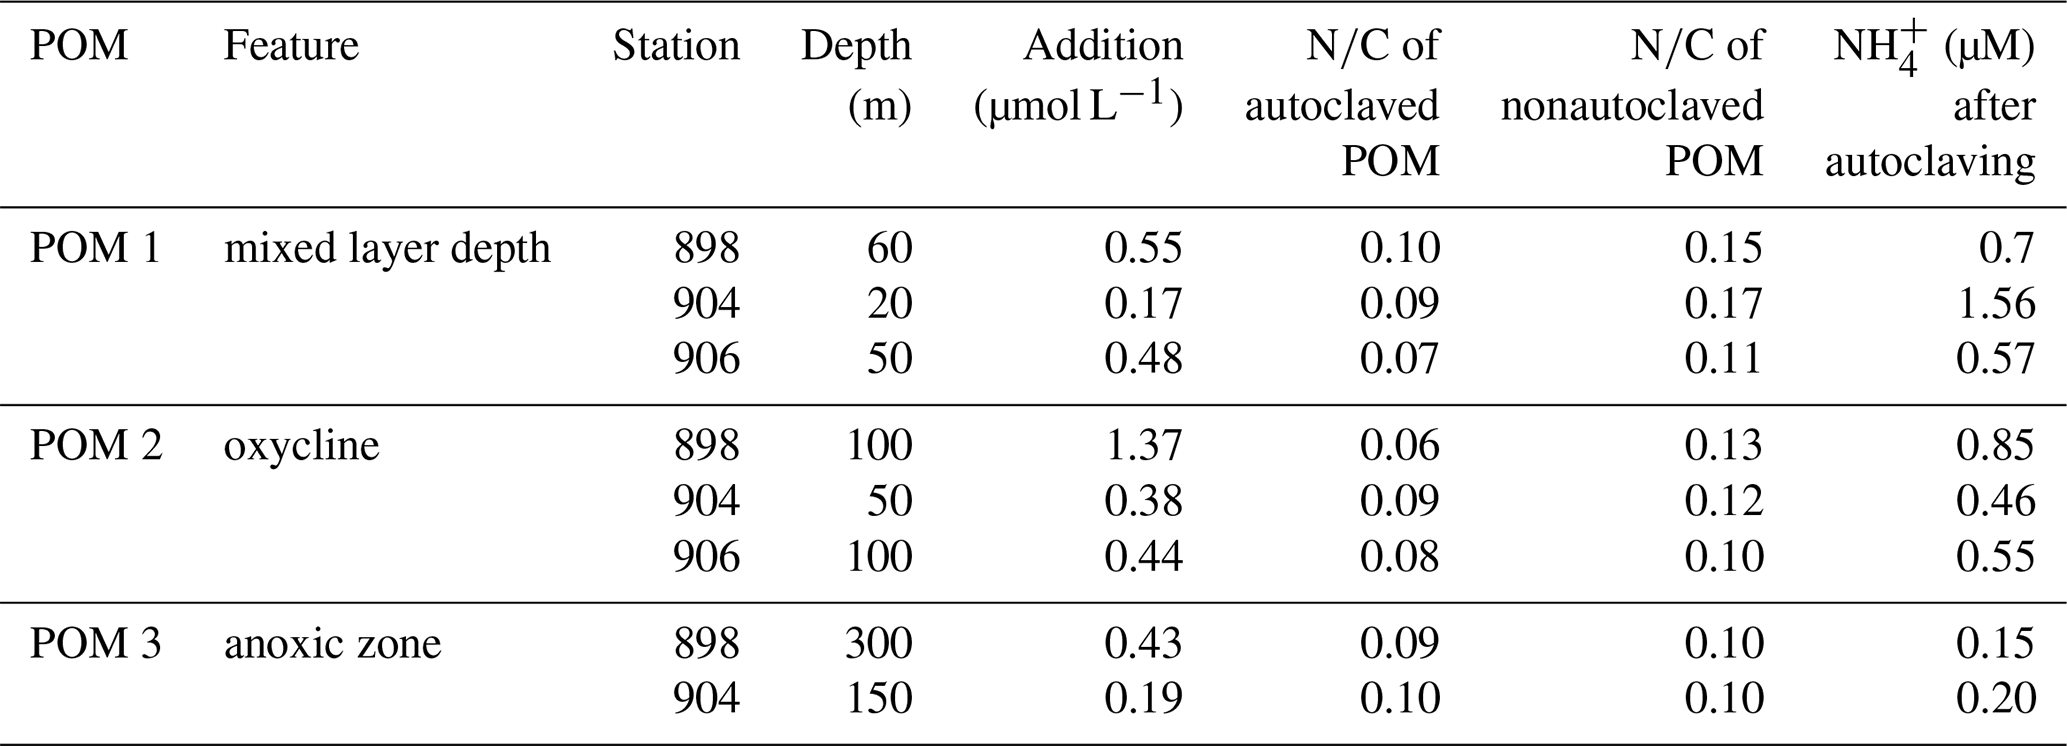
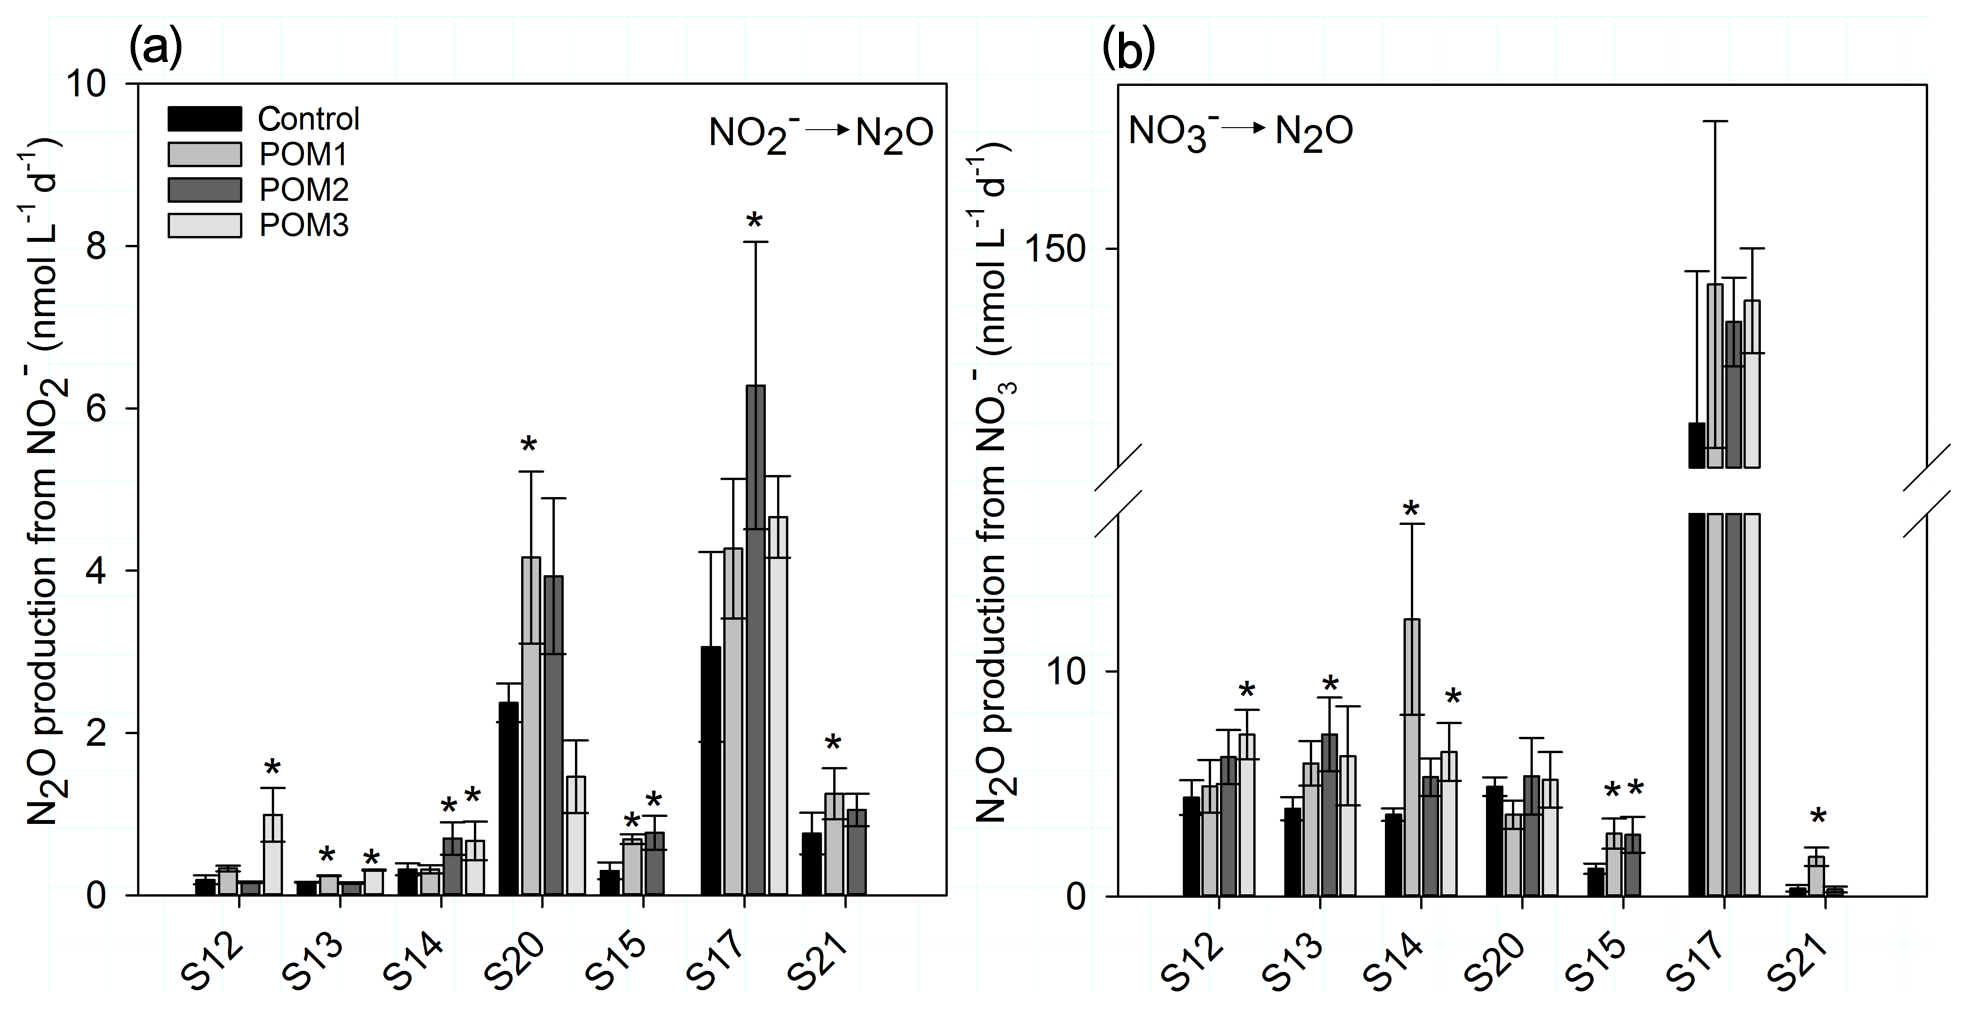
Figure 7Bar plots of N2O production after additions of autoclaved suspended and sinking particles >50 µm (See Table 2). POM1: mixed layer depth; POM2: oxycline; POM3: ODZ. Error bars represent ± SE of linear regression. * indicates significant difference to control rate (p<0.05).
3.5 Diversity and community composition of total and active nirS and amoA assemblages and its correlation with environmental parameters
nFR values from functional gene microarrays were used to describe the nitrifier and denitrifier community composition of AOA and nirS assemblages, respectively. The nFR was averaged from duplicate microarrays, which replicated well (R2 = 0.89–0.99). Alpha-diversities of nirS and archaeal amoA were not statistically different for total and active communities (Student's t test, p>0.05) but were overall lower for RNA (3.2±0.3) than DNA (3.8±0.4) (Table S1). Principal coordinate analysis of Bray–Curtis similarity for each probe group on the microarray indicated that the community structure of archaeal amoA genes was significantly different from that of archaeal amoA transcripts, whereas community structure of nirS genes and transcripts did not differ significantly (Fig. S4). To identify which archetypes were important in explaining differences in community structure of key nitrification and denitrification genes, we identified archetypes that accounted for more than 1 % of the total fluorescence for their probe set and that were significantly different with respect to ambient O2 using a LEfSe analysis (Table S2). Furthermore, we used CCA to test whether the community composition, or even single archetypes, could explain the N2O production rates.
The nFR distribution showed greater variability in the active (cDNA) AOA community than in the total community (DNA) among depths, stations and O2 concentrations (Fig. 8a, b). Archetypes over 1 % made up between 76 % (DNA) and 83 % (cDNA) of the amoA assemblage and only between 61 % (DNA) and 68 % (cDNA) of the nirS assemblage. The four most abundant AOA archetypes – AOA55, AOA3, AOA21 and AOA32 – made up 20 %–65 % of the total and active community (Fig. 8a, b). DNA of archetypes AOA55 and AOA79, both related to uncultured AOA in soils, significantly correlated with in situ concentrations (Fig. S5). DNA and cDNA from AOA3 and AOA83 were significantly enriched in oxic waters, and AOA7, closely related with crenarchaeote SCGC AAA288-M23 isolated from station ALOHA near Hawaii (Swan et al., 2011), was significantly enriched in anoxic and hypoxic waters for DNA and cDNA respectively (Table S2). All other archetypes did not vary with O2 levels. DNA of AOA 3, closely related to Candidatus Nitrosopelagicus brevis (CN25), identified as the only archetype to be significantly correlated with N2O production and yield from AO (Fig. S5).
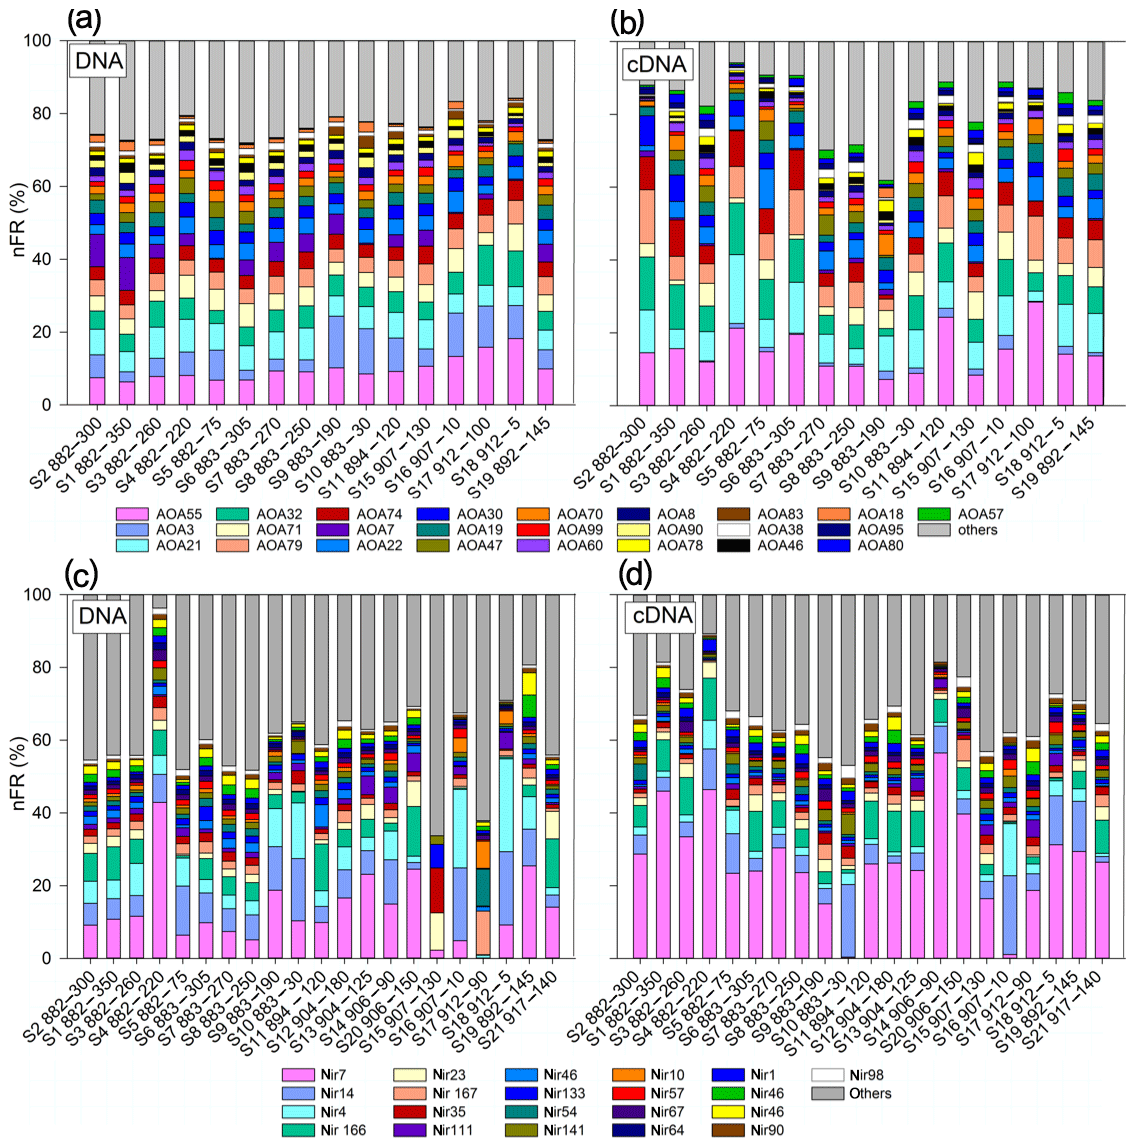
Figure 8Stacked bar plot of community composition of AOA amoA archetypes (a, b) and nirS archetypes (c, d). Only archetypes over 1 % contribution are shown. (a, c) Total community composition (DNA). (b, d) Active community composition (cDNA).
The total and active denitrifier communities were dominated by Nir7, derived from an uncultured clone from the ODZ in the ETSP (Lam et al., 2009), and Nir7 was significantly more enriched in the active community (Fig. 8c, d). DNA from ODZ depths of the eddy, S15 (907, 130 m) and S17 (912, 90 m), diverged most obviously from the rest and from each other (Fig. 8c, d). Interestingly, these two samples were not divergent among the active nirS community (Figs. 8c and d, S2, and S4). DNA of Nir35, belonging to the Flavobacteriaceae derived from coastal waters of the Arabian Sea (Goréguès et al., 2004), was most abundant (12.3 %) at the eddy edge (S15) as opposed to the eddy center (S17) where nir167, representing anammox sequences from Peru, was most abundant (12.0 %). Interestingly, Nir4 and Nir14, among the top five abundant archetypes, were significantly enriched in oxic water masses (Table S2). The nFR signal of nir166, belonging to Candidatus Scalindua, and Nir23 were among the top five abundant archetypes and significantly enriched in anoxic depths.
CCA is a direct gradient analysis, where the gradient in environmental variables is known a priori and the archetypes are considered to be a response to this gradient. Composition from total and active AOA community did not differ between stations, and all samples cluster close together (Fig. S6a, b). S18 (912, 5 m) is a surface sample with the lowest concentration (8 µmol L−1) and the highest temperature and salinity of the data set, and the DNA is positively related with O2 and driven by AOA55, AOA32 and AOA79. RNA of S17 (912, 90 m) clusters with AOA70. AOA55 was abundant, and its distribution is driven by O2 and (Fig. S5).
CCA clustered the denitrifier community DNA into one main group with a few exceptions (Fig. S6c). Two surface samples (S16, S18) clustered separately and were positively correlated with Nir4 and Nir14 and O2. Two anoxic samples from the eddy core (S17) and eddy edge (S15) clustered separately, with S17 being driven by three nirS archetypes – Nir54, Nir10 and Nir167 – and S15 by Nir23, Nir35 and Nir133 (Fig. S6c). Total and active nirS community composition did not differ as a function of O2. Although the composition of active and total nirS communities was not significantly different, the active community clustered slightly differently. For nirS RNA, surface and oxycline samples (S16 and S10) grouped together and were correlated positively with O2, temperature and salinity, whereas the anoxic eddy samples did not differ from the rest (Fig. S6d). N2O production from significantly correlated with nirS gene and transcript abundance, but both reductive N2O production pathways were not linked with a single dominant nirS archetype (Fig. S5).
Most samples originated from Peru coastal water (PCW) characterized by supersaturated N2O concentrations (Kock et al., 2016; Bourbonnais et al., 2017). Only the deepest sample (S1, 882–350 m) saw the presence of a different water mass, the equatorial subsurface waters. Thus, our findings about regulation of N2O production at different stations probably apply to the region as a whole. Several studies indicate that water mass hydrography plays an important role in shaping microbial community diversity (Biller et al., 2012; Hamdan et al., 2012), and a coupling of amoA alpha diversity to physical conditions such as salinity, temperature and depth has been shown in coastal waters off Chile (Bertagnolli and Ulloa, 2017). While salinity, temperature and depth were prominent factors in shaping the community compositions of nitrifiers and denitrifiers (Fig. S6), for N2O production rates correlations with physical and chemical parameters were not consistent. On one hand, oxidative N2O production from positively correlated with temperature, salinity, and oxygen and negatively with depth and concentration. On the other hand, reductive N2O production from positively correlated with and concentrations but negatively with concentrations (Fig. S5), suggesting, when is abundant, denitrifiers are less likely to use for N2O production during denitrification. Both oxidative (AO) and reductive ( and reduction) N cycling processes produced N2O with differential effects of O2 on them. Measured N2O production rates were always highest from , followed by and , which is consistent with previous studies that showed denitrification as a dominant N2O source in Peruvian coastal waters harboring an ODZ (Ji et al., 2015b; Casciotti et al., 2018). A low contribution of AO to N2O production in low-O2 waters is in line with a previous study in this area estimating N2O production based on isotopomer measurements combined with a 3-D-reaction-advection-diffusion box model (Bourbonnais et al., 2017). The low percentage that AO contributed to total N2O production was between 0.5 % and 6 %, with one exception in the shallowest sample S5 with 30 µmol L−1 O2, where AO contributed 86 % to total N2O production. We found strong positive effects of decreasing O2 concentration and increasing particulate matter concentrations on N2O production in the upper oxycline.
The occurrence of an anticyclonic mode water eddy at 16∘ S (transect 4, stations 912, 907) at the time of sampling was not unusual, as such eddies have been reported at a similar position (Stramma et al., 2013). High N loss, a large SNM with low concentrations and strong N2O depletion in the core of ODZ of the eddy result in reduced N2O inside of this kind of eddy as the eddies age and are advected westward (Cornejo D'Ottone et al., 2016; Arévalo-Martínez et al., 2016). Our study found similar patterns with the largest SNM (5.23 µM ) and the lowest (14 µmol L−1) and N2O (4 nmol L−1) concentrations in the eddy center. For the first time N2O production rates were measured in an eddy, and the rates of up to 118±27 nmol L−1 d−1 are the highest N2O production rates from denitrification reported in the ETSP. Previously reported maximum rates were up to 86 nmol L−1 d−1 (Dalsgaard et al., 2012) based on 15N tracer incubations. Much smaller maximum rates, 49 nmol L−1 d−1 (Bourbonnais et al., 2017) and 50 nmol L−1 d−1 (Farías et al., 2009), were obtained using N2O isotope and isotopomer approaches, which provide time and process integrated signals. Hence, the deviation of maximum rates can be explained by (1) the different approaches and (2) the sampling of the core of the eddy. N2 production measurements (from anammox and denitrification) were not performed in this study but should be in future studies to account for potential artefacts by co-occurring reduction processes. Here, it cannot be determined whether the eddy only stimulated N2O production but not N2 production from denitrification (i.e., increasing the N2O∕N2 yield) or whether the eddy also increased complete denitrification to N2 by 10 times compared to stations outside of the eddy. Considering that at some depths only incomplete denitrification (also known as “stop-and-go denitrification”) to N2O is at work, it would not be surprising that N2O production can reach the same order of magnitude as N2 production from complete denitrification. Aged eddies also show lower N2O concentration maxima at the upper oxycline (Arévalo-Martínez et al., 2016), which was not the case in this study where a young eddy was just about to detach from the coast. In fact, the eddy stations show the highest N2O peak in the upper oxycline within this data set. Eddies and their age imprint mesoscale patchiness and heterogeneity in biogeochemical cycling. It appears that young eddies close to the coast with high N2O concentrations and high N2O production rates have a great potential for high N2O emissions compared to aged eddies or waters surrounding eddies.
4.1 Effect of O2 on reductive and oxidative N2O production
The relationship between O2 concentrations and N2O production by nitrification and denitrification is very complex in ODZs. While poorly constrained, the reported O2 threshold level (1.7 µmol L−1 O2) for reductive N2O production is lower (Dalsgaard et al., 2014) than the reported O2 threshold level (8 µmol L−1) for N2O consumption in the ETSP (Cornejo and Farías, 2012). Nevertheless, the suboxic zone between 1 and 8 µmol L−1 O2 carries high N2O concentrations indicating higher N2O production than consumption. In this study, we focused on these suboxic water masses above the ODZ and determined bulk kinetics of O2 sensitivity in batch experiments, which reflect the metabolism of the microbial community. The effect of O2 on N2O production differed between natural O2 concentrations with varying communities and manipulated O2 concentrations within a community. While N2O production from and decreased exponentially along the natural O2 gradient, it did not always decrease for the manipulated O2 treatments. Unchanged N2O production with higher O2 levels in treatments showed that at least a portion of the community can respond very differently to a sudden increase in O2 than predicted from natural O2 gradients with communities acclimated to a certain O2 concentration. In the ETNP, this pattern has been observed before (Ji et al., 2018b), but the mechanism behind it is unknown. Different responses of N2O production rates to O2 between in situ assemblages and incubated samples were not unexpected because different rates at different depths were likely not only due to O2 differences but also other factors such as different organic matter fluxes and different amounts and types of N2O producers at different depths. In addition, sampling with Niskin bottles and purging can induce stress responses (Stewart et al., 2012) and shift the richness and structure of the microbial community from the in situ community (Torres-Beltrán et al., 2019). The removal of other gases like H2S during purging is another potential artifact. However, it is unlikely as measurable H2S concentrations have mostly been found at very shallow coastal stations (<100 m deep) (Callbeck et al., 2018), which are not the environment of this study. On the contrary, high abundances (up to 12 %) of sulfur-oxidizing gamma proteobacteria, like SUP05, can be found in eddy-transported offshore waters where they actively contributed to autotrophic denitrification (Callbeck et al., 2018). In this study, we cannot differentiate between autotrophic or organotrophic denitrification, but a contribution of autotrophic denitrification in the eddy center is likely. Off the Chilean coast, active N2O production by denitrification was found at up to 50 µmol L−1 O2 (Farías et al., 2009). These results reinforce prior studies showing that distinct steps of multistep metabolic pathways, such as denitrification, can differ in O2 sensitivity (Dalsgaard et al., 2014; Bristow et al., 2016a, b). In various bacterial strains and natural communities, the reductase enzyme (Nar) which catalyzes the first step in denitrification, is reportedly the most O2 tolerant, followed by the more O2 sensitive steps of reduction (nir) and N2O reduction (Körner and Zumft, 1989; McKenney et al., 1994; Kalvelage et al., 2011). The fact that N2O production is insensitive to manipulated O2 in the treatments and not in the treatments is evidence that it is not due to inhibition of the reduction of N2O to N2 at higher O2 because then both treatments would look similar. It further indicates that high N2O production from in high-oxygen treatments is not likely an effect of anoxic microniches. While anoxic microniches in batch incubations can never be fully ruled out, there is no reason why they should systematically change N2O production in from incubations at the same oxygen treatment. We suggest a stimulation of incomplete denitrification, which leads to the accumulation of N2O in the serum bottles rather than a stimulation of overall denitrification rates to N2. While reduction was inhibited by higher O2 concentrations, N2O production was not, leading to very high yields of N2O production per produced. We hypothesize that there is a direct channeling of reduced to N2O without exchange of an internal pool with the surrounding . Long turnover times for have been inferred from δ18O of , which was fully equilibrated with water in the offshore waters (Bourbonnais et al., 2015) and more dynamic in the coastal waters (Hu et al., 2016), supporting our hypothesis. If does not exchange, our rate estimates for reduction based on produced 15N- are underestimated, resulting in high yields. A low exchange rate has been shown before (Ji et al., 2018b). Based on the assumption that all labeled N2O from 15 has gone through the pool, we include the pool in the calculation of fN. In 15 incubations the enrichment of the substrate pool was low (fN = 0.05–0.1), and including resulted in an underestimation of no more than 5 %, depending on the in situ concentration, and thus does not explain the high rates.
One N2O-producing process not considered in this study is fungal denitrification, but it deserves mentioning because in soils and coastal sediments it contributes substantially to N2O production (Wankel et al., 2017; Shoun et al., 2012). With 15N-labeling experiments it is not possible to distinguish between bacterial and fungal denitrification. In ODZs, marine fungal communities show a wide diversity (Jebaraj et al., 2012), and a high adaptive capability is suggested (Richards et al., 2012). Most fungal denitrifiers lack the capability to reduce N2O to N2; hence all reduction results in N2O production (Richards et al., 2012). In a culture study, the fungus, Fusarium oxysporum, needed O2 exposure before it started to denitrify (Zhou et al., 2001). To what extent marine fungi play a role in denitrification in open ocean ODZs and their O2 sensitivity remains to be investigated.
N2O production from did not decrease exponentially with increasing O2 as shown previously for the ETSP (Qin et al., 2017; Ji et al., 2018a; Santoro et al., 2011). N2O production rather increased with increasing in situ oxygen and had an optimum between 1.4 and 6 µmol O2 L−1 in manipulated O2 treatments. A similar optimum curve was observed in cultures of the marine AOA Nitrosopumilus maritimus, where N2O production reached maxima at O2 concentrations between 2 and 10 µmol L−1 (Hink et al., 2017a). Furthermore, N2O production by N. viennensis and N. maritimus was not affected by O2 but instead by the rate of AO (Stieglmeier et al., 2014; Hink et al., 2017a). To find out if this is the case in our study, we plotted the AO rate against N2O production from for natural and manipulated O2 samples (Fig. S7). The resulting significant linear fit (R2=0.75, p<0.0001) implies that the rate of AO was the main driver for the intensity of N2O production from and oxygen had a secondary effect.
Discrepancies in estimates of the O2 sensitivity of N2O production by nitrification and denitrification are likely due to a combination of taxonomic variation as well as differences in sensitivity among the various enzymes of each pathway.
4.2 N2O yields and hybrid N2O formation from
N2O yields of AO were 0.15 %–2.07 % (N2O-N mol -N mol−1 = –), which are at the higher end of most marine AOA culture or field studies (Hink et al., 2017b; Qin et al., 2017; Santoro et al., 2011; Stieglmeier et al., 2014). A higher maximum yield of 3.14 % was reported off the coast of Peru only in 2015 (Ji et al., 2018a). While high N2O yields are usually found in low-O2 waters (<6 µmol L−1), in this study AO also had high yields at higher oxygen concentrations: 0.9 % at 30 µmol L−1 O2 compared to previous studies (0.06 % at >50 µmol L−1; Ji et al., 2018a). In near-coastal regions, higher N2O yield at higher O2 concentrations expands the overall water volume where N2O production by AO contributes to high N2O concentration, which is more likely to be emitted to the atmosphere.
Insight into the production mechanism of N2O is gained from hybrid N2O formation based on differentiating between production of single-labeled (45N2O) and double-labeled (46N2O) N2O. If the production of 45N2O is higher than what is expected based on the binomial distribution, then an additional source of 14N can be assumed. In 15 incubations, as potential 14N substrates (besides ), , NH2OH and HNO are most likely. Even though, in situ is below detection in almost all water depths (fN>0.9), there remains the potential for pool dilution by remineralization and DNRA during the incubation. Studies have shown fast turnover for , despite low concentrations (e.g., Klawonn et al., 2019). Even if hybrid N2O production rates are overestimated, it remains the major N2O production mechanism from AO in this study. In future 15N-labeling studies, co-occurrence of production by DNRA or degradation should be measured along with N2O production to account for pool dilution. Whether hybrid N2O formation is purely abiotic, a mix of biotic and abiotic or biotic reactions is debatable (Stieglmeier et al., 2014; Kozlowski et al., 2016; Carini et al., 2018; Lancaster et al., 2018; Stein, 2019). Hybrid N2O production from was variable with depth and oxygen, which can be explained by the different proportions of nitrifier versus denitrifier reduction to N2O. For example, in the interface sample S19 (892, 144 m, 3.69 µmol L−1 ), N2O production from (0.72±0.19 nmol L−1 d−1) was 20 times higher than from (0.033±0.0004 nmol L−1 d−1) and no hybrid N2O formation from was found (Fig. 5d). There, the major N2O production mechanism seems to be by denitrification rather than nitrification, and even if there was a hybrid production we were not able to detect it within the given error ranges. Hybrid N2O production from was independent of the rate at which N2O production took place and independent of the O2 concentration and varied little (70 %–86 % of total N2O production) during AO. Therefore, a purely abiotic reaction outside and without the vicinity of the cell can be excluded because concentrations of potential substrates for abiotic N2O production like Fe(II), Mn, NO and NH2OH vary with depth and O2 concentration (Zhu-Barker et al., 2015; Kondo and Moffet, 2015; Lutterbeck et al., 2018; Korth et al., 2019). Additionally, at four depths the potential for abiotic N2O production in addition experiments showed variations with depth and no significant impact of HgCl2 fixation (Fig. S9). Hence, any 14N which is integrated into N2O to produce a hybrid/single-labeled N2O has to be passively or actively taken up by the cell first (Fig. 9). There, it reacts with an intermediate product (15NO or 15NH2OH) of AO inside the cell. With this set of experiments, it is not possible to disentangle if hybrid production is based on an enzymatic reaction or an abiotic reaction inside the cell. Caranto et al. (2017) showed that the main substrate of NH2OH oxidation is NO, making NO an obligate intermediate of AO in AOB, and suggested the existence of an unknown enzyme that catalyzes NO oxidation to (further details also in Stein, 2019). If NO is an obligate intermediate of AO in AOA (Lancaster et al., 2018), a constant rate of spontaneous abiotic or enzymatic N2O production is very likely, which always depends on the amount of NO produced in the first place. This could explain why we consistently find ∼80 % hybrid formation at high as well as at low AO rates. Further studies are needed to investigate the full mechanisms.
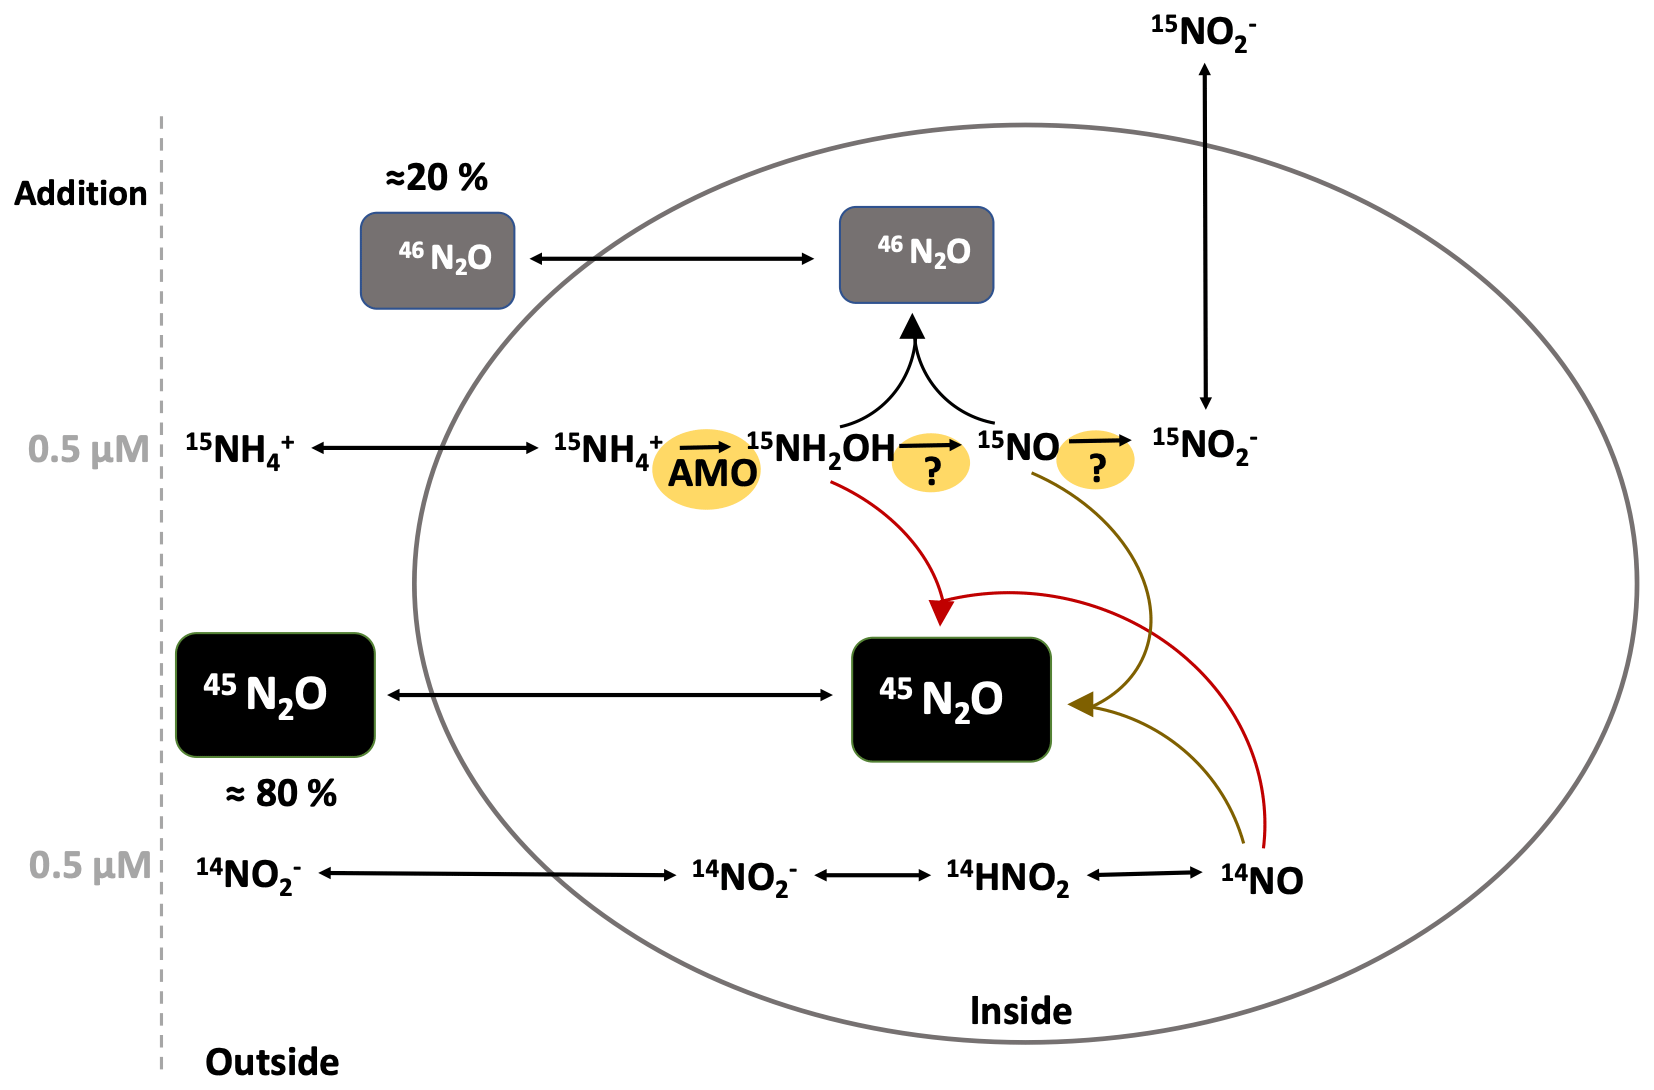
Figure 9Scheme illustrating the possible reactions for hybrid N2O formation. The ellipse represents an AOA cell.
4.3 Effect of particulate organic matter on N2O production
A positive stimulation of N2O production from denitrification by particulate organic matter was found, indicating carbon limitation of denitrification in the ETSP. The experimental POM amendments simulated a low POC export flux and represented a flux that happens over 2–15 d, assuming an export flux of 3.8 mmol m−2 d−1 and that 8 % of the total POC pool is >50 µm (Boyd et al., 1999; Martin et al., 1987; Haskell et al., 2015). We are aware that the POM collected by in situ pumps is a mix of suspended and sinking particles, and hence the flux should be considered a rough estimate. However, the particle size (>50 µm) used in the experiments is indicative of sinking particles. The stimulation of N2 production from denitrification by particulate organic matter has been shown in ODZs before (Ward et al., 2008; Chang et al., 2014), with quantity and quality of organic matter influencing the degree of stimulation (Babbin et al., 2014). In this study, amendments of POM at different degradation stages resulted in variable magnitudes of N2O production from and with no significant correlations between magnitude of the rates and amount, origin, or quality of POM added. The processing of the particles has reduced the original N∕C ratios of POM from the mixed layer more than of the POM from the ODZ, resulting in similar N∕C ratios of particles from different depths. This could be one possible explanation for a lack of correlation of N2O production with origin of the POM. Furthermore, N2 production was not quantified, and hence it is not possible to evaluate potential relationships between overall N loss and POM additions or whether the partitioning between N2O and N2 varied among treatments and depths. The N2O∕N2 production ratio can vary from 0 % to 100 % (Dalsgaard et al., 2014; Bonaglia et al., 2016). A temporary accumulation of N2O before further reduction to N2 in the incubations can be ruled out as N2O accumulated linearly over time. The only station where POM additions did not stimulate N2O production was in the center of the young eddy (912-S17). There, the highest rates of N2O production from (118 nmol L−1 d−1) were found, indicating that denitrification was not carbon limited. This is consistent with previous studies on anticyclonic eddies, which have shown high N loss in the core of a young eddy that weakened with aging of the eddy (Stramma et al., 2013; Bourbonnais et al., 2015; Löscher et al., 2016). A direct link between the freshly produced POM fueling N loss on the one hand and decreased N loss with aging due to POM export out of the eddy on the other hand was proposed (Bourbonnais et al., 2015; Löscher et al., 2016). In this study, the young eddy is a hotspot for N2O production.
Besides carbon availability as electron donor for denitrification, copper limitation and high availability may play a role. Copper limitation has been argued to lead to N2O accumulation by inhibiting the copper-dependent N2O reductase (Granger and Ward, 2003; Bonaglia et al., 2016), but it was not a limiting factor for denitrification in the three major ODZs previously (Ward et al., 2008). Water sampling from Niskin bottles in our study was not trace metal clean and could be contaminated with copper from the sampling system, making a limitation of trace metals in our incubations unlikely. However, OM-fueled N2O production may have become limited by the availability of copper during the incubation.
High availability increases N2O production from denitrification in salt marshes (Ji et al., 2015a) and in soils (Weier et al., 1993), systems which are generally not carbon limited. Also, at the oxic–anoxic interface of the Chesapeake Bay, the ratio of to concentration was identified as a driver for high N2O production from (Ji et al., 2018b). This study also found higher N2O production rates from than , which linearly correlated with the ratio of concentrations (Fig. S8). Intracellularly produced does not seem to exchange with the surrounding pool, but ambient is directly converted to N2O, a process identified as “ shunting” in N2 production studies (de Brabandere et al., 2014; Chang et al., 2014). POM as electron donor is an important regulator for reductive N2O production.
4.4 Effect of abundance of total and active community composition on N2O production rates
The abundances of both amoA and nirS genes found in the ETSP are similar to those reported in earlier studies in the ETSP (Peng et al., 2013; Ji et al., 2015b; Jayakumar et al., 2013). The amoA gene abundances were similar to those reported for the coastal ETSP by Lam et al. (2009), but nirS abundances reported here were higher than the nirS abundances in that study, probably due to the use of different PCR primers. The community composition of AOA did not significantly differ along the O2 gradient as shown previously (Peng et al., 2013), but a significant correlation between archaeal amoA transcript abundance and N2O production was shown in this study. The combination of qPCR and microarray analysis offered a great advantage to relate the total abundances to the production rates and additionally link particular community components to biogeochemical activities. To determine whether a particular archetype drives the correlation of N2O production by AO, a Bray–Curtis dissimilarity matrix revealed archetype AOA3 related to Candidatus Nitrosopelagicus brevis (CN25) to be significantly correlated with the N2O production by AO. This clade is abundant in the surface ocean and typically found in high abundances in the lower euphotic zone (Santoro et al., 2011, 2015). With the demonstration of high abundances of AOA3 coincident with high nitrification rates and high N2O production rates, we suggest that Candidatus Nitrosopelagicus brevis-related AOA likely play an important role in N2O production in near-surface waters in the eastern tropical South Pacific.
The lack of significant correlation between community composition or single members of the community and reductive N2O production is consistent with the fact that nirS is not the enzyme directly synthesizing N2O and nirS communities are sources as well as sinks for N2O. Taxonomic analysis of the nirS gene and transcripts suggested that there is high taxonomic diversity among the denitrifiers, which is likely linked to a high variability of the total denitrification gene assembly (including nos, nor, nir). In particular the abundance and diversity of nitric oxide reductase (nor), the enzyme directly synthesizing N2O, would be of interest, but it is present in nitrifiers and denitrifiers (Casciotti and Ward, 2005), and one goal of this study was to differentiate among N2O produced by nitrifiers and denitrifiers. However, nirS gene and transcript abundance correlated with N2O production from , making it a possible indicator for one part of reductive N2O production. It is also worth noting that anammox-related nirS genes and transcripts (nirS 166, 167) contribute up to 12 % of the total copy numbers, putting a wrinkle on nirS abundance as a marker gene for denitrifiers only. The subtraction of the anammox-related nirS genes from total copy numbers did not change the results from Bray–Curtis analysis. These data indicate that the extent to which gene or transcript abundance patterns or community composition of marker genes of processes can be used as proxies for process rate measurements is variable, likely due to complex factors, including the relative dominance of different community members, the modular nature of denitrification, differences in the level of metabolic regulation (transcriptional, translational and enzymatic) and the range of environmental conditions being observed.
4.5 Summary and conclusion
In this study we used a combined approach of 15N tracer techniques and molecular techniques in order to investigate the factors that control N2O production within the upper oxycline of the ODZ in the ETSP. Our results suggest that denitrification is a major N2O source along the oxic–anoxic interface of the upper oxycline. The highest N2O production rates from and were found at or below the oxic–anoxic interface, whereas the highest N2O production from AO was slightly shallower in the oxycline. Overall, the in situ O2 threshold below 8 µmol L−1 favored and reduction to N2O and high N2O yields from AO up to 2.2 %. A different pattern was observed for the community response to increasing oxygen, with the highest N2O production from and between 1.4 and 6 µmol L−1 O2 and high N2O production from even at O2 concentrations up to 22 µmol L−1. This study highlights the diversity of N2O production regulation and the need to conduct further experiments where single community members can be better constrained. Our experiments provide the first insights into N2O regulation by particulate organic matter in the ETSP with particles greatly enhancing N2O production (up to 5-fold). Furthermore, the significant positive correlation between Candidatus Nitrosopelagicus brevis (CN25) and N2O produced from AO could indicate its importance in N2O production and points out the great value of combining biogeochemical rate measurements with molecular analysis to investigate multifaceted N2O cycling. This study shows that short-term oxygen increase can lead to high N2O production even from denitrification and extends the existing O2 thresholds for high reductive N2O production up to 22 µmol L−1 O2. Together with high N2O yields from AO up to O2 levels of 30 µmol L−1, an expansion of low-oxygen waters around ODZs predicted for the future can significantly increase marine N2O production.
Regardless of which processes are responsible for N2O production in the ODZ, high N2O production at the oxic–anoxic interface of the upper oxycline sustains high N2O concentration peaks with a potential for intense N2O emission to the atmosphere during upwelling events. An average total N2O production rate of 3.1 nmol N2O L−1 d−1 in a 50 m thick suboxic layer with 0–20 µmol L−1 O2 leads to an annual N2O efflux of 0.5 Tg N yr−1 in the Peruvian upwelling (2.22×10⁵ km2, Arévalo-Martínez et al., 2015), which is within the estimates based on surface N2O concentration measurements from 2012 to 2013 (Arévalo-Martínez et al., 2015; Bourbonnais et al., 2017). The importance of the Peru upwelling system for global N2O emissions (5 %–22 % of global marine N2O emissions) is directly linked to the extreme N2O accumulations in coastal waters. Coastal N2O hotspots are well known (Bakker et al., 2014), and this study shows that they can be explained by considering denitrification as a major N2O source. While this study does not help to resolve temporal variability, manipulation experiments give valuable insights into the short-term response of N2O production to oxygen and particles. With the further parametrization of POM export as a driver for N2O production from denitrification, models may be able to better predict N2O emissions in highly productive coastal upwelling regions and to evaluate how fluxes might change with changing stratification and deoxygenation.
The microarray data presented here are available via GEO (Gene Expression Omnibus; http://www.ncbi.nlm.nih.gov/geo/, NCBI, 2020) at NCBI (National Center for Biotechnology Information) under GEO accession no GSE142806. The N2O production rates were archived in the PANGAEA data archive (https://doi.pangaea.de/10.1594/PANGAEA.914948, Frey et al., 2020). The N2O data are available from the Marine Methane and Nitrous Oxide (MEMENTO) database (https://memento.geomar.de/de/n2o, last access: 16 April 2020; Kock and Bange, 2015).
The supplement related to this article is available online at: https://doi.org/10.5194/bg-17-2263-2020-supplement.
CF, HWB and BBW conceptualized the study. CF and MS performed the experiment. CF and ELP analyzed samples. RCX and EPA collected POM. DLAM sampled and measured N2O concentrations. AJ performed qPCR. SO supported the mass spectrometer analysis. XS supported the experimental methods and assisted with data analysis. CF analyzed data and led the writing effort, with substantial contributions from all coauthors.
The authors declare that they have no conflict of interest.
This article is part of the special issue “Ocean deoxygenation: drivers and consequences – past, present and future (BG/CP/OS inter-journal SI)”. It is a result of the International Conference on Ocean Deoxygenation, Kiel, Germany, 3–7 September 2018.
We thank the captain and crew of R/V Meteor. A great thanks goes to Annette Kock for helping to pack, ship, order material for the cruise. Moreover, we thank the Peruvian authorities for the permission to work in their territorial waters. We thank the editor S. Wajih A. Naqvi, Annie Bourbonnais and an anonymous reviewer for their thoughtful, constructive comments which greatly improved this paper.
The work presented here was made possible by the DFG-funded Collaborative Research Center 754 (SFB754) phase III (http://www.sfb754.de, last access: 16 April 2020) and by a fellowship of the German Academic Exchange Service (DAAD) program Postdoctoral Researchers International Mobility Experience (PRIME, ID 57350888) awarded to Claudia Frey. Mingshuang Sun was supported by the China Scholarship Council (no. 201406330054). Elizabeth León-Palmero had a FPU PhD fellowship (014/02917) from the Spanish Ministry of Education and a PhD International Mobility scholarship from the Universidad de Granada. Carolin R. Löscher was funded by a EU H2020 Marie Curie Individual Fellowship (NITROX, grant no. 704272) and by the Villum Foundation (grant no. 16518). Eric P. Achterberg, Hermann W. Bange and Ruifang C. Xie were funded by the DFG-funded Collaborative Research Center 754 (SFB754) program. Bess B. Ward, Xin Sun and Amal Jayakumar were funded by the National Science Foundation (NSF, OCE- 1657663).
The article processing charges for this open-access
publication were covered by a Research
Centre of the Helmholtz Association.
This paper was edited by S. Wajih A. Naqvi and reviewed by Annie Bourbonnais and one anonymous referee.
Anderson, J. H.: The metabolism of hydroxylamine to nitrite by Nitrosomonas, Biochem. J., 91, 8–17, https://doi.org/10.1042/bj0910008, 1964.
Arévalo-Martínez, D. L., Kock, A., Löscher, C. R., Schmitz, R. A., Bange, H. W., Arevalo-Martínez, D., Kock, A., Löscher, C. R., Schmitz, R. A., and Bange, H. W.: Massive nitrous oxide emissions from the tropical South Pacific Ocean, Nat. Geosci., 8, 530–533, https://doi.org/10.1038/NGEO2469, 2015.
Arévalo-Martínez, D. L., Kock, A., Löscher, C. R., Schmitz, R. A., Stramma, L., and Bange, H. W.: Influence of mesoscale eddies on the distribution of nitrous oxide in the eastern tropical South Pacific, Biogeosciences, 13, 1105–1118, https://doi.org/10.5194/bg-13-1105-2016, 2016.
Babbin, A. R., Keil, R. G., Devol, A. H., and Ward, B. B.: Organic matter stoichiometry, flux, and oxygen control nitrogen loss in the ocean, Science, 344, 406–408, https://doi.org/10.1126/science.1248364, 2014.
Babbin, A. R., Bianchi, D., Jayakumar, A., and Ward, B. B.: Rapid nitrous oxide cycling in the suboxic ocean, Science, 348, 1127–1129, https://doi.org/10.1126/science.aaa8380, 2015.
Bakker, D. C. E., Bange, H. W., Gruber, N., Johannessen, T., Upstill-Goddard, R. C., Borges, A. V., Delille, B., Löscher, C. R., Naqvi, W. A., Omar, A. M., and Santana-Casiano, J. M.: Air-Sea Interactions of Natural Long-Lived Greenhouse Gases (CO2, N2O, CH4) in a Changing Climate, in: Ocean-Atmosphere Interactions of Gases and Particles, 55–112, Springer, Berlin, Heidelberg, 2014.
Bange, H. W.: Gaseous nitrogen compounds (NO, N2O, N2, NH3) in the ocean, in: Nitrogen in the marine environment, 51–94, Elsevier, Amsterdam, 2008.
Battaglia, G. and Joos, F.: Marine N2O Emissions From Nitrification and Denitrification Constrained by Modern Observations and Projected in Multimillennial Global Warming Simulations, Global Biogeochem. Cy., 32, 92–121, https://doi.org/10.1002/2017GB005671, 2018.
Beman, J. M., Chow, C., King, A. L., Feng, Y., and Fuhrman, J. A.: Global declines in oceanic nitrification rates as a consequence of ocean acidification, P. Natl. Acad. Sci. USA, 108, 208–213, https://doi.org/10.1073/pnas.1011053108, 2011.
Bertagnolli, A. D. and Ulloa, O.: Hydrography shapes community composition and diversity of amoA-containing Thaumarchaeota in the coastal waters off central Chile, Env. Microb. Rep., 9, 717–728, https://doi.org/10.1111/1758-2229.12579, 2017.
Biller, S. J., Mosier, A. C., Wells, G. F., and Francis, C. A.: Global Biodiversity of Aquatic Ammonia-Oxidizing Archaea is Partitioned by Habitat, Front. Microbiol., 3, 252, https://doi.org/10.3389/fmicb.2012.00252, 2012.
Blum, J. M., Su, Q., Ma, Y., Valverde-Pérez, B., Domingo-Félez, C., Jensen, M. M., and Smets, B. F.: The pH dependency of N-converting enzymatic processes, pathways and microbes: effect on net N2O production, Environ. Microbiol., 20, 1623–1640, https://doi.org/10.1111/1462-2920.14063, 2018.
Bonaglia, S., Klawonn, I., De Brabandere, L., Deutsch, B., Thamdrup, B., and Brüchert, V.: Denitrification and DNRA at the Baltic Sea oxic–anoxic interface: Substrate spectrum and kinetics, Limnol. Oceanogr., 61, 1900–1915, https://doi.org/10.1002/lno.10343, 2016.
Borcard, D., Legendre, P., and Drapeau, P.: Partialling out the Spatial Component of Ecological Variation, Ecology, 73, 1045–1055, https://doi.org/10.2307/1940179, 1992.
Bourbonnais, A., Altabet, M. A., Charoenpong, C. N., Larkum, J., Hu, H., Bange, H. W., and Stramma, L.: N-loss isotope effects in the Peru oxygen minimum zone studied using a mesoscale eddy as a natural tracer experiment, Global Biogeochem. Cy., 29, 793–811, https://doi.org/10.1002/2014GB005001, 2015.
Bourbonnais, A., Letscher, R. T., Bange, H. W., Échevin, V., Larkum, J., Mohn, J., Yoshida, N., and Altabet, M. A.: N2O production and consumption from stable isotopic and concentration data in the Peruvian coastal upwelling system, Global Biogeochem. Cy., 31, 678–698, https://doi.org/10.1002/2016GB005567, 2017.
Boyd, P. W., Sherry, N. D., Berges, J. A., Bishop, J. K. B., Calvert, S. E., Charette, M. A., Giovannoni, S. J., Goldblatt, R., Harrison, P. J., Moran, S. B., Roy, S., Soon, M., Strom, S., Thibault, D., Vergin, K. L., Whitney, F. A., and Wong, C. S.: Transformations of biogenic particulates from the pelagic to the deep ocean realm, Deep-Sea Res. Pt. II, 46, 2761–2792, https://doi.org/10.1016/S0967-0645(99)00083-1, 1999.
Braker, G., Fesefeldt, A., and Witzel, K. P.: Development of PCR primer systems for amplification of nitrite reductase genes (nirK and nirS) to detect denitrifying bacteria in environmental samples, Appl. Environ. Microb., 64, 3769–3775, 1998.
Breider, F., Yoshikawa, C., Makabe, A., Toyoda, S., Wakita, M., Matsui, Y., Kawagucci, S., Fujiki, T., Harada, N., and Yoshida, N.: Response of N2O production rate to ocean acidification in the western North Pacific, Nat. Clim. Change, 9, 954–958, https://doi.org/10.1038/s41558-019-0605-7, 2019.
Bristow, L. A., Dalsgaard, T., Tiano, L., Mills, D. B., Bertagnolli, A. D., Wright, J. J., Hallam, S. J., Ulloa, O., Canfield, D. E., Revsbech, N. P., and Thamdrup, B.: Ammonium and nitrite oxidation at nanomolar oxygen concentrations in oxygen minimum zone waters, P. Natl. Acad. Sci. USA, 113, 201600359, https://doi.org/10.1073/pnas.1600359113, 2016a.
Bristow, L. A., Callbeck, C. M., Larsen, M., Altabet, M. A., Dekaezemacker, J., Forth, M., Gauns, M., Glud, R. N., Kuypers, M. M. M., Lavik, G., Milucka, J., Naqvi, S. W. A., Pratihary, A., Revsbech, N. P., Thamdrup, B., Treusch, A. H., and Canfield, D. E.: N2 production rates limited by nitrite availability in the Bay of Bengal oxygen minimum zone, Nat. Geosci., 10, 24–29, https://doi.org/10.1038/ngeo2847, 2016b.
Buitenhuis, E. T., Suntharalingam, P., and Le Quéré, C.: Constraints on global oceanic emissions of N2O from observations and models, Biogeosciences, 15, 2161–2175, https://doi.org/10.5194/bg-15-2161-2018, 2018.
Callbeck, C. M., Lavik, G., Ferdelman, T. G., Fuchs, B., Gruber-Vodicka, H. R., Hach, P. F., Littmann, S., Schoffelen, N. J., Kalvelage, T., Thomsen, S., Schunck, H., Löscher, C. R., Schmitz, R. A., and Kuypers, M. M. M.: Oxygen minimum zone cryptic sulfur cycling sustained by offshore transport of key sulfur oxidizing bacteria, Nat. Commun., 9, 1–11, https://doi.org/10.1038/s41467-018-04041-x, 2018.
Capone, D. G. and Hutchins, D. A.: Microbial biogeochemistry of coastal upwelling regimes in a changing ocean, Nat. Geosci., 6, 711–717, https://doi.org/10.1038/ngeo1916, 2013.
Caranto, J. D., Lancaster, K. M., Ma, C., Jensen, M. M., Smets, B. F., Thamdrup, B., Jayakumar, A., Chang, B. X., Widner, B., Bernhardt, P., Mulholland, M. R., Ward, B. B., Sinha, E., Michalak, A. M., Balaji, V., Lycus, P., Bøthun, K., Bergaust, L., Shapleigh, J., Bakken, L., Frostegård, Å., Massicotte, P., Asmala, E., Stedmon, C., Markager, S., Caranto, J. D., and Lancaster, K. M.: Nitric oxide is an obligate bacterial nitrification intermediate produced by hydroxylamine oxidoreductase, P. Natl. Acad. Sci. USA, 114, 8217–8222, https://doi.org/10.1073/pnas.1704504114, 2017.
Carini, P., Dupont, C. L., and Santoro, A. E.: Patterns of thaumarchaeal gene expression in culture and diverse marine environments, Environ. Microbiol., 20, 2112–2124, https://doi.org/10.1111/1462-2920.14107, 2018.
Carrasco, C., Karstensen, J., and Farias, L.: On the Nitrous Oxide Accumulation in Intermediate Waters of the Eastern South Pacific Ocean, Front. Mar. Sci., 4, 24, https://doi.org/10.3389/fmars.2017.00024, 2017.
Casciotti, L. and Ward, B. B.: Phylogenetic analysis of nitric oxide reductase gene homologues from aerobic ammonia-oxidizing bacteria, FEMS Microbiol. Ecol., 52, 197–205, https://doi.org/10.1016/j.femsec.2004.11.002, 2005.
Casciotti, K. L., Forbes, M., Vedamati, J., Peters, B., Martin, T., and Mordy, C. W.: Nitrous oxide cycling in the Eastern Tropical South Pacific as inferred from isotopic and isotopomeric data, Deep-Sea Res. Pt. II, 156, 155–167, https://doi.org/10.1016/J.DSR2.2018.07.014, 2018.
Chang, B. X., Rich, J. R., Jayakumar, A., Naik, H., Pratihary, A., Keil, R. G., Ward, B. B., and Devol, A. H.: The effect of organic carbon on fixed nitrogen loss in the eastern tropical South Pacific and Arabian Sea oxygen deficient zones, Limnol. Oceanogr., 59, 1267–1274, https://doi.org/10.4319/lo.2014.59.4.1267, 2014.
Charpentier, J., Farias, L., Yoshida, N., Boontanon, N., and Raimbault, P.: Nitrous oxide distribution and its origin in the central and eastern South Pacific Subtropical Gyre, Biogeosciences, 4, 729–741, https://doi.org/10.5194/bg-4-729-2007, 2007.
Chavez, F. P. and Messié, M.: A comparison of Eastern Boundary Upwelling Ecosystems, Prog. Oceanogr., 83, 80–96, https://doi.org/10.1016/j.pocean.2009.07.032, 2009.
Codispoti, L. A.: Interesting Times for Marine N2O, Science, 332, 1339–1340, 2010.
Cohen, Y. and Gordon, L.: Nitrous oxide in the oxygen minimum of eastern tropical North Pacific: evidence for its consumption during denitrification and possble mechanisms for its production, Deep-Sea Res., 25, 509–524, 1978.
Cornejo, M. and Farías, L.: Following the N2O consumption in the oxygen minimum zone of the eastern South Pacific, Biogeosciences, 9, 3205–3212, https://doi.org/10.5194/bg-9-3205-2012, 2012.
Cornejo D'Ottone, M., Bravo, L., Ramos, M., Pizarro, O., Karstensen, J., Gallegos, M., Correa-Ramirez, M., Silva, N., Farias, L., and Karp-Boss, L.: Biogeochemical characteristics of a long-lived anticyclonic eddy in the eastern South Pacific Ocean, Biogeosciences, 13, 2971–2979, https://doi.org/10.5194/bg-13-2971-2016, 2016.
Crutzen, P. J.: The influence of nitrogen oxides on the atmospheric ozone content, Q. J. Roy. Meteor. Soc., 96, 320–325, https://doi.org/10.1002/qj.49709640815, 1970.
Dalsgaard, T., Thamdrup, B., Farías, L., Peter Revsbech, N., and Revsbech, N. P.: Anammox and denitrification in the oxygen minimum zone of the eastern South Pacific, Limnol. Oceanogr., 57, 1331–1346, https://doi.org/10.4319/lo.2012.57.5.1331, 2012.
Dalsgaard, T., Stewart, F. J., Thamdrup, B., De Brabandere, L., Revsbech, N. P., Ulloa, O., Canfield, D. E., and Delong, E. F.: Oxygen at nanomolar levels reversibly suppresses process rates and gene expression in anammox and denitrification in the oxygen minimum zone off northern Chile, MBio, 5, e01966, https://doi.org/10.1128/mBio.01966-14, 2014.
De Brabandere, L., Canfield, D. E., Dalsgaard, T., Friederich, G. E., Revsbech, N. P., Ulloa, O., and Thamdrup, B.: Vertical partitioning of nitrogen-loss processes across the oxic-anoxic interface of an oceanic oxygen minimum zone, Environ. Microbiol., 16, 3041–3054, https://doi.org/10.1111/1462-2920.12255, 2014.
Farías, L., Castro-González, M., Cornejo, M., Charpentier, J. J., Faúndez, J., Boontanon, N., and Yoshida, N.: Denitrification and nitrous oxide cycling within the upper oxycline of the eastern tropical South Pacific oxygen minimum zone, Limnol. Oceanogr., 54, 132–144, https://doi.org/10.4319/lo.2009.54.1.0132, 2009.
Frame, C. H. and Casciotti, K. L.: Biogeochemical controls and isotopic signatures of nitrous oxide production by a marine ammonia-oxidizing bacterium, Biogeosciences, 7, 2695–2709, https://doi.org/10.5194/bg-7-2695-2010, 2010.
Frame, C. H., Lau, E., Nolan, E. J., Goepfert, T. J., and Lehmann, M. F.: Acidification Enhances Hybrid N2O Production Associated with Aquatic Ammonia-Oxidizing Microorganisms, Front. Microbiol., 7, 2104, https://doi.org/10.3389/fmicb.2016.02104, 2017.
Francis, C. A., Roberts, K. J., Beman, J. M., Santoro, A. E., and Oakley, B. B.: Ubiquity and diversity of ammonia-oxidizing archaea in water columns and sediments of the ocean, P. Natl. Acad. Sci. USA, 102, 14683–14688, https://doi.org/10.1073/pnas.0506625102, 2005.
Frey, C., Bange, H. W., Achterberg, E. P., Jayakumar, A., Löscher, C. R., Arévalo-Martínez, D. L., León-Palmero, E., Sun, M., Sun, X., Xie, R. C., Oleynik, S., and Ward, B. B.: Nitrous oxide production rates in the eastern tropical South Pacific during METEOR cruise M138, PANGAEA, https://doi.org/10.1594/PANGAEA.914948, 2020.
Ganesh, S., Parris, D. J., Delong, E. F., and Stewart, F. J.: Metagenomic analysis of size-fractionated picoplankton in a marine oxygen minimum zone, ISME J., 8, 187–211, https://doi.org/10.1038/ismej.2013.144, 2014.
Goreau, T. J., Kaplan, W. A., Wofsy, S. C., McElroy, M. B., Valois, F. W., and Watson, S. W.: Production of and N2O by Nitrifying Bacteria at Reduced Concentrations of Oxygen, Appl. Environ. Microbiol., 40, 526–532, 1980.
Goréguès, C., Michotey, V., and Bonin, P.: Isolation of hydrocarbonoclastic denitrifying bacteria from berre microbial mats, Ophelia, 58, 263–270, https://doi.org/10.1080/00785236.2004.10410234, 2004.
Granger, J. and Ward, B. B.: Accumulation of nitrogen oxides in copper-limited cultures of denitrifying bacteria, Limnol. Oceanogr., 48, 313–318, https://doi.org/10.4319/lo.2003.48.1.0313, 2003.
Hamdan, L. J., Coffin, R. B., Sikaroodi, M., Greinert, J., Treude, T., and Gillevet, P. M.: Ocean currents shape the microbiome of Arctic marine sediments, ISME J., 7, 685–696, https://doi.org/10.1038/ismej.2012.143, 2012.
Hammer, Ø., Harper, D. A. T., and Ryan, P. D.: PAST: Paleontological statistics software package, Palaeontol. Electron., 4, 1–9, https://doi.org/10.1016/j.bcp.2008.05.025, 2001.
Haskell, W. Z., Kadko, D., Hammond, D. E., Knapp, A. N., Prokopenko, M. G., Berelson, W. M., and Capone, D. G.: Upwelling velocity and eddy diffusivity from 7Be measurements used to compare vertical nutrient flux to export POC flux in the Eastern Tropical South Pacific, Mar. Chem., 168, 140–150, https://doi.org/10.1016/J.MARCHEM.2014.10.004, 2015.
Hink, L., Nicol, G. W., and Prosser, J. I.: Archaea produce lower yields of N2O than bacteria during aerobic ammonia oxidation in soil, Environ. Microbiol., 19, 4829–4837, https://doi.org/10.1111/1462-2920.13282, 2017a.
Hink, L., Lycus, P., Gubry-Rangin, C., Frostegård, Å., Nicol, G. W., Prosser, J. I., and Bakken, L. R.: Kinetics of NH3-oxidation, NO-turnover, N2O-production and electron flow during oxygen depletion in model bacterial and archaeal ammonia oxidisers, Environ. Microbiol., 19, 4882–4896, https://doi.org/10.1111/1462-2920.13914, 2017b.
Holmes, R. M., Aminot, A., Kérouel, R., Hooker, B. A., and Peterson, B. J.: A simple and precise method for measuring ammonium in marine and freshwater ecosystems, Can. J. Fish. Aquat. Sci., 56, 1802–1808, 1999.
Hu, H., Bourbonnais, A., Larkum, J., Bange, H. W., and Altabet, M. A.: Nitrogen cycling in shallow low-oxygen coastal waters off Peru from nitrite and nitrate nitrogen and oxygen isotopes, Biogeosciences, 13, 1453–1468, https://doi.org/10.5194/bg-13-1453-2016, 2016.
Hu, Z., Wessels, H. J. C. T., Alen, T., Jetten, M. S. M., and Kartal, B.: Nitric oxide-dependent anaerobic ammonium oxidation, Nat. Commun., 10, 1–7, https://doi.org/10.1038/s41467-019-09268-w, 2019.
Hydes, D., Aoyama, M., Aminot, A., Bakker, K., Becker, S., Coverly, S., Daniel, A., Dickson, A. G., Grosso, O., Kerouel, R., van Ooijen, J., Sato, K., Tanhua, T., Woodward, E. M. S., and Zhang, J. Z.: Determination of dissolved nutrients (N, P, Si) in seawater with high precision and inter-comparability using gas-segmented continuous flow analysers, Go-sh. Repeat Hydrogr. Man. IOCCP Rep., 134, 1–87, 2010.
IPCC: Climate Change 2013: The Physical Science Basis. Contribution of Working Group I to the Fifth Assessment Report of the Intergovernmental Panel on Climate Change, Cambridge University Press, Cambridge UK and New York, USA, 2013.
Jayakumar, A., Peng, X., and Ward, B.: Community composition of bacteria involved in fixed nitrogen loss in the water column of two major oxygen minimum zones in the ocean, Aquat. Microb. Ecol., 70, 245–259, https://doi.org/10.3354/ame01654, 2013.
Jayakumar, D. A., Naqvi, S. W. A., and Ward, B. B.: Distribution and relative quantification of key genes involved in fixed nitrogen loss from the Arabian Sea oxygen minimum zone, Indian Ocean Biogeochemcal Process. Ecol. Var., 185, 187–203, 2009.
Jebaraj, C. S., Forster, D., Kauff, F., and Stoeck, T.: Molecular Diversity of Fungi from Marine Oxygen-Deficient Environments (ODEs), 189–208, Springer, Berlin, Heidelberg, 2012.
Ji, Q., Babbin, A. R., Peng, X., Bowen, J. L., Ward, B. B., and Ji, Q.: Nitrogen substrate–dependent nitrous oxide cycling in salt marsh sediments, J. Mar. Res., 7373, 71–92, 2015a.
Ji, Q., Babbin, A. R., Jayakumar, A., and Ward, B. B.: Nitrous oxide production by nitrification and denitrification in the Eastern Tropical South Pacific oxygen minimum zone, Geophys. Res. Lett., 42, 10755–10764, https://doi.org/10.1002/2015GL066853, 2015b.
Ji, Q., Buitenhuis, E., Suntharalingam, P., Sarmiento, J. L., and Ward, B. B.: Global nitrous oxide production determined by oxygen sensitivity of nitrification and denitrification, Global Biogeochem. Cy., 32, 1790–1802, https://doi.org/10.1029/2018GB005887, 2018a.
Ji, Q., Frey, C., Sun, X., Jackson, M., Lee, Y.-S., Jayakumar, A., Cornwell, J. C., and Ward, B. B.: Nitrogen and oxygen availabilities control water column nitrous oxide production during seasonal anoxia in the Chesapeake Bay, Biogeosciences, 15, 6127–6138, https://doi.org/10.5194/bg-15-6127-2018, 2018b.
Johnston, H.: Reduction of Stratospheric Ozone by Nitrogen.Oxide Catalysts from Supersonic Transport Exhaust, Science, 173, 517–522, 1971.
Kalvelage, T., Jensen, M. M., Contreras, S., Revsbech, N. P., Lam, P., Günter, M., LaRoche, J., Lavik, G., and Kuypers, M. M. M. M.: Oxygen sensitivity of anammox and coupled N-cycle processes in oxygen minimum zones, PLoS One, 6, e29299, https://doi.org/10.1371/journal.pone.0029299, 2011.
Kalvelage, T., Lavik, G., Jensen, M. M., Revsbech, N. P., Loescher, C., Schunck, H., Desai, D. K., Hauss, H., Kiko, R., Holtappels, M., LaRoche, J., Schmitz, R. A., Graco, M. I., and Kuypers, M. M. M.: Aerobic Microbial Respiration In Oceanic Oxygen Minimum Zones, PLoS One, 10, e0133526, https://doi.org/10.1371/journal.pone.0133526, 2015.
Kartal, B., Kuypers, M. M. M., Lavik, G., Schalk, J., Op den Camp, H. J. M., Jetten, M. S. M., and Strous, M.: Anammox bacteria disguised as denitrifiers: nitrate reduction to dinitrogen gas via nitrite and ammonium, Environ. Microbiol., 9, 635–642, https://doi.org/10.1111/j.1462-2920.2006.01183.x, 2007.
Klawonn, I., Bonaglia, S., Whitehouse, M. J., Littmann, S., Tienken, D., Kuypers, M. M. M., Brüchert, V., and Ploug, H.: Untangling hidden nutrient dynamics: rapid ammonium cycling and single-cell ammonium assimilation in marine plankton communities, ISME J., 13, 1960–1974, https://doi.org/10.1038/s41396-019-0386-z, 2019.
Kock, A. and Bange, H. W.: Counting the ocean's greenhouse gas emissions, EOS (Washington. DC), 96, 10–13, https://doi.org/10.1029/2015EO023665, 2015 (data available at: https://memento.geomar.de/de/n2o, last access: 16 April 2020).
Kock, A., Arévalo-Martínez, D. L., Löscher, C. R., and Bange, H. W.: Extreme N2O accumulation in the coastal oxygen minimum zone off Peru, Biogeosciences, 13, 827–840, https://doi.org/10.5194/bg-13-827-2016, 2016.
Kondo, Y. and Moffett, J. W.: Iron redox cycling and subsurface offshore transport in the eastern tropical South Pacific oxygen minimum zone, Mar. Chem., 168, 95–103, https://doi.org/10.1016/J.MARCHEM.2014.11.007, 2015.
Körner, H. and Zumft, W. G.: Expression of denitrification enzymes in response to the dissolved oxygen level and respiratory substrate in continuous culture of Pseudomonas stutzeri, Appl. Environ. Microb., 55, 1670–1676, 1989.
Korth, F., Kock, A., Arévalo-Martínez, D. L., and Bange, H. W.: Hydroxylamine as a Potential Indicator of Nitrification in the Open Ocean, Geophys. Res. Lett., 46, 2158–2166, https://doi.org/10.1029/2018GL080466, 2019.
Kozlowski, J. A., Stieglmeier, M., Schleper, C., Klotz, M. G., and Stein, L. Y.: Pathways and key intermediates required for obligate aerobic ammonia-dependent chemolithotrophy in bacteria and Thaumarchaeota, ISME J., 10, 1–10, https://doi.org/10.1038/ismej.2016.2, 2016.
Lam, P., Lavik, G., Jensen, M. M., van de Vossenberg, J., Schmid, M., Woebken, D., Gutiérrez, D., Amann, R., Jetten, M. S. M., and Kuypers, M. M. M.: Revising the nitrogen cycle in the Peruvian oxygen minimum zone, P. Natl. Acad. Sci. USA, 106, 4752–4757, 2009.
Lancaster, K. M., Caranto, J. D., Majer, S. H., and Smith, M. A.: Alternative Bioenergy?: Updates to and Challenges in Nitrification Metalloenzymology, Joule, 2, 421–441, https://doi.org/10.1016/j.joule.2018.01.018, 2018.
Landolfi, A., Somes, C. J., Koeve, W., Zamora, L. M., and Oschlies, A.: Oceanic nitrogen cycling and N2O flux perturbations in the Anthropocene, Global Biogeochem. Cy., 31, 1236–1255, https://doi.org/10.1002/2017GB005633, 2017.
Larsen, M., Lehner, P., Borisov, S. M., Klimant, I., Fischer, J. P., Stewart, F. J., Canfield, D. E., and Glud, R. N.: In situ quantification of ultra-low O2 concentrations in oxygen minimum zones: Application of novel optodes, Limnol. Oceanogr.-Meth., 14, 784–800, https://doi.org/10.1002/lom3.10126, 2016.
Legendre, P. and Legendre, L.: Numerical ecology, Elsevier, New York, NY, USA, 2012.
Liu, Z., Stewart, G., Kirk Cochran, J., Lee, C., Armstrong, R. A., Hirschberg, D. J., Gasser, B., and Miquel, J.-C.: Why do POC concentrations measured using Niskin bottle collections sometimes differ from those using in-situ pumps?, Deep-Sea Res. Pt. I, 52, 1324–1344, https://doi.org/10.1016/J.DSR.2005.02.005, 2005.
Löscher, C. R., Kock, A., Könneke, M., LaRoche, J., Bange, H. W., and Schmitz, R. A.: Production of oceanic nitrous oxide by ammonia-oxidizing archaea, Biogeosciences, 9, 2419–2429, https://doi.org/10.5194/bg-9-2419-2012, 2012.
Löscher, C. R., Bange, H. W., Schmitz, R. A., Callbeck, C. M., Engel, A., Hauss, H., Kanzow, T., Kiko, R., Lavik, G., Loginova, A., Melzner, F., Meyer, J., Neulinger, S. C., Pahlow, M., Riebesell, U., Schunck, H., Thomsen, S., and Wagner, H.: Water column biogeochemistry of oxygen minimum zones in the eastern tropical North Atlantic and eastern tropical South Pacific oceans, Biogeosciences, 13, 3585–3606, https://doi.org/10.5194/bg-13-3585-2016, 2016.
Lutterbeck, H. E., Arévalo-Martínez, D. L., Löscher, C. R., and Bange, H. W.: Nitric oxide (NO) in the oxygen minimum zone off Peru, Deep-Sea Res. Pt. II, 156, 148–154, https://doi.org/10.1016/j.dsr2.2017.12.023, 2018.
Martin, J. H., Knauer, G. A., Karl, D. M., and Broenkow, W. W.: VERTEX: carbon cycling in the northeast Pacific, Deep-Sea Res. Pt. A, 34, 267–285, https://doi.org/10.1016/0198-0149(87)90086-0, 1987.
Martinez-Rey, J., Bopp, L., Gehlen, M., Tagliabue, A., and Gruber, N.: Projections of oceanic N2O emissions in the 21st century using the IPSL Earth system model, Biogeosciences, 12, 4133–4148, https://doi.org/10.5194/bg-12-4133-2015, 2015.
McGillicuddy Jr., D. J., Anderson, L. A., Bates, N. R., Bibby, T., Buesseler, K. O., Carlson, C. A., Davis, C. S., Ewart, C., Falkowski, P. G., Goldthwait, S. A., Hansell, D. A., Jenkins, W. J., Johnson, R., Kosnyrev, V. K., Ledwell, J. R., Li, Q. P., Siegel, D. A., and Steinberg, D. K.: Eddy/Wind Interactions Stimulate Extraordinary Mid-Ocean Plankton Blooms, Science, 316, 1021–1026, https://doi.org/10.1126/science.1136256, 2007.
McIlvin, M. R. and Altabet, M. A.: Chemical Conversion of Nitrate and Nitrite to Nitrous Oxide for Nitrogen and Oxygen Isotopic Analysis in Freshwater and Seawater, Anal. Chem., 77, 5589–5595, 2005.
McKenney, D. J., Drury, C. F., Findlay, W. I., Mutus, B., McDonnell, T., and Gajda, C.: Kinetics of denitrification by Pseudomonas fluorescens: Oxygen effects, Soil Biol. Biochem., 26, 901–908, 1994.
Messié, M. and Chavez, F. P.: Seasonal regulation of primary production in eastern boundary upwelling systems, Prog. Oceanogr., 134, 1–18, https://doi.org/10.1016/j.pocean.2014.10.011, 2015.
Mincer, T. J., Church, M. J., Taylor, L. T., Preston, C., Karl, D. M., and DeLong, E. F.: Quantitative distribution of presumptive archaeal and bacterial nitrifiers in Monterey Bay and the North Pacific Subtropical Gyre, Environ. Microbiol., 9, 1162–1175, https://doi.org/10.1111/j.1462-2920.2007.01239.x, 2007.
Murdock, S. A. and Juniper, S. K.: Capturing Compositional Variation in Denitrifying Communities: a Multiple-Primer Approach That Includes Epsilonproteobacteria, Appl. Environ. Microb., 83, 1–16, 2017.
NCBI: Gene Expression Omnibus, available at: http://www.ncbi.nlm.nih.gov/geo/, last access: 16 April 2020.
Newell, S. E., Babbin, A. R., Jayakumar, A., and Ward, B. B.: Ammonia oxidation rates and nitrification in the Arabian Sea, Global Biogeochem. Cy., 25, 1–10, https://doi.org/10.1029/2010gb003940, 2011.
Nicholls, J. C., Davies, C. A., and Trimmer, M.: High-resolution profiles and nitrogen isotope tracing reveal a dominant source of nitrous oxide and multiple pathways of nitrogen gas formation in the central Arabian Sea, Limnol. Oceanogr., 52, 156–168, https://doi.org/10.4319/lo.2007.52.1.0156, 2007.
Oksanen, J., Blanchet, F. G., Friendly, M., Kindt, R., Legendre, P., Mcglinn, D., Minchin, P. R., O'Hara, R. B., Simpson, G. L., Solymos, P., Henry, M., Stevens, H., Szoecs, E., and Maintainer, H. W.: Package “vegan” Title Community Ecology Package, Community Ecol. Packag., 2, 1–297, 2019.
Peng, X., Jayakumar, A., and Ward, B. B.: Community composition of ammonia-oxidizing archaea from surface and anoxic depths of oceanic oxygen minimum zones, Front. Microbiol., 4, 1–12, https://doi.org/10.3389/fmicb.2013.00177, 2013.
Pietri, A., Testor, P., Echevin, V., Chaigneau, A., Mortier, L., Eldin, G., Grados, C., Pietri, A., Testor, P., Echevin, V., Chaigneau, A., Mortier, L., Eldin, G., and Grados, C.: Finescale Vertical Structure of the Upwelling System off Southern Peru as Observed from Glider Data, J. Phys. Oceanogr., 43, 631–646, https://doi.org/10.1175/JPO-D-12-035.1, 2013.
Qin, W., Meinhardt, K. A., Moffett, J. W., Devol, A. H., Armbrust, E. V., Ingalls, A. E., and Stahl, D. A.: Influence of Oxygen Availability on the Activities of Ammonia-oxidizing Archaea, Env. Microbiol. Rep., 9, 250–256, https://doi.org/10.1111/1758-2229.12525, 2017.
Ravishankara, A. R., Daniel, J. S., and Portmann, R. W.: Nitrous oxide (N2O): the dominant ozone-depleting substance emitted in the 21st century, Science, 326, 123–125, https://doi.org/10.1126/science.1176985, 2009.
Richards, T. A., Jones, M. D. M., Leonard, G., and Bass, D.: Marine Fungi: Their Ecology and Molecular Diversity, Annu. Rev. Mar. Sci., 4, 495–522, https://doi.org/10.1146/annurev-marine-120710-100802, 2012.
Santoro, A. E. and Casciotti, K. L.: Enrichment and characterization of ammonia-oxidizing archaea from the open ocean: phylogeny, physiology and stable isotope fractionation, ISME J., 5, 1796–808, https://doi.org/10.1038/ismej.2011.58, 2011.
Santoro, A. E., Casciotti, K. L., and Francis, C. A.: Activity, abundance and diversity of nitrifying archaea and bacteria in the central California Current, Environ. Microbiol., 12, 1989–2006, https://doi.org/10.1111/j.1462-2920.2010.02205.x, 2010.
Santoro, A. E., Buchwald, C., McIlvin, M. R., and Casciotti, K. L.: Isotopic Signature of N2O Produced by Marine Ammonia-Oxidizing Archaea, Science, 333, 1282–1285, https://doi.org/10.1126/science.1208239, 2011.
Santoro, A. E., Dupont, C. L., Richter, R. A., Craig, M. T., Carini, P., McIlvin, M. R., Yang, Y., Orsi, W. D., Moran, D. M., and Saito, M. A.: Genomic and proteomic characterization of “Candidatus Nitrosopelagicus brevis”: An ammonia-oxidizing archaeon from the open ocean, P. Natl. Acad. Sci. USA, 112, 1173–1178, https://doi.org/10.1073/PNAS.1416223112, 2015.
Schmidtko, S., Stramma, L., and Visbeck, M.: Decline in global oceanic oxygen content during the past five decades, Nature, 542, 335–339, https://doi.org/10.1038/nature21399, 2017.
Schunck, H., Lavik, G., Desai, D. K., Großkopf, T., Kalvelage, T., Löscher, C. R., Paulmier, A., Contreras, S., Siegel, H., Holtappels, M., Rosenstiel, P., Schilhabel, M. B., Graco, M., Schmitz, R. A., Kuypers, M. M. M., and Laroche, J.: Giant hydrogen sulfide plume in the oxygen minimum zone off Peru supports chemolithoautotrophy, PLoS One, 8, e68661, https://doi.org/10.1371/journal.pone.0068661, 2013.
Segata, N., Izard, J., Waldron, L., Gevers, D., Miropolsky, L., Garrett, W. S., and Huttenhower, C.: Metagenomic biomarker discovery and explanation, Genome Biol., 12, R60, https://doi.org/10.1186/gb-2011-12-6-r60, 2011.
Shoun, H., Fushinobu, S., Jiang, L., Kim, S. W., and Wakagi, T.: Fungal denitrification and nitric oxide reductase cytochrome P450nor, P. T. Roy. Soc. B, 367, 1186–1194, https://doi.org/10.1098/rstb.2011.0335, 2012.
Sigman, D. M., Casciotti, K. L., Andreani, M., Barford, C., Galanter, M., and Böhlke, J. K.: A Bacterial Method for the Nitrogen Isotopic Analysis of Nitrate in Seawater and Freshwater, Anal. Chem., 73, 4145–4153, 2001.
Stein, L. Y.: Insights into the physiology of ammonia-oxidizing microorganisms, Curr. Opin. Chem. Biol., 49, 9–15, https://doi.org/10.1016/J.CBPA.2018.09.003, 2019.
Stewart, F. J., Ulloa, O., and Delong, E. F.: Microbial metatranscriptomics in a permanent marine oxygen minimum zone, Environ. Microbiol., 14, 23–40, https://doi.org/10.1111/j.1462-2920.2010.02400.x, 2011.
Stewart, F. J., Dalsgaard, T., Young, C. R., Thamdrup, B., Revsbech, N. P., Ulloa, O., Canfield, D. E., and Delong, E. F.: Experimental incubations elicit profound changes in community transcription in OMZ bacterioplankton, PLoS One, 7, e37118, https://doi.org/10.1371/journal.pone.0037118, 2012.
Stieglmeier, M., Mooshammer, M., Kitzler, B., Wanek, W., Zechmeister-Boltenstern, S., Richter, A., and Schleper, C.: Aerobic nitrous oxide production through N-nitrosating hybrid formation in ammonia-oxidizing archaea, ISME J., 8, 1135–46, https://doi.org/10.1038/ismej.2013.220, 2014.
Stramma, L., Johnson, G. C., Sprintall, J., and Mohrholz, V.: Expanding Oxygen-Minimum Zones in the Tropical Oceans, Science, 320, 655–659, 2008.
Stramma, L., Bange, H. W., Czeschel, R., Lorenzo, A., and Frank, M.: On the role of mesoscale eddies for the biological productivity and biogeochemistry in the eastern tropical Pacific Ocean off Peru, Biogeosciences, 10, 7293–7306, https://doi.org/10.5194/bg-10-7293-2013, 2013.
Sun, X., Ji, Q., Jayakumar, A., and Ward, B. B.: Dependence of nitrite oxidation on nitrite and oxygen in low-oxygen seawater, Geophys. Res. Lett., 44, 7883–7891, https://doi.org/10.1002/2017GL074355, 2017.
Swan, B. K., Martinez-Garcia, M., Preston, C. M., Sczyrba, A., Woyke, T., Lamy, D., Reinthaler, T., Poulton, N. J., Masland, E. D. P., Gomez, M. L., Sieracki, M. E., DeLong, E. F., Herndl, G. J., and Stepanauskas, R.: Potential for chemolithoautotrophy among ubiquitous bacteria lineages in the dark ocean, Science, 333, 1296–1300, https://doi.org/10.1126/science.1203690, 2011.
Thamdrup, B. and Dalsgaard, T.: Production of N2 through Anaerobic Ammonium Oxidation Coupled to Nitrate Reduction in Marine Sediments, Appl. Environ. Microb., 68, 1312–1318, https://doi.org/10.1128/aem.68.3.1312-1318.2002, 2002.
Tiano, L., Garcia-Robledo, E., Dalsgaard, T., Devol, A. H., Ward, B. B., Ulloa, O., Canfield, D. E., and Revsbech, N. P.: Oxygen distribution and aerobic respiration in the north and south eastern tropical Pacific oxygen minimum zones, Deep-Sea Res. Pt. I, 94, 173–183, https://doi.org/10.1016/j.dsr.2014.10.001, 2014.
Torres-Beltrán, M., Mueller, A., Scofield, M., Pachiadaki, M. G., Taylor, C., Tyshchenko, K., Michiels, C., Lam, P., Ulloa, O., Jürgens, K., Hyun, J. H., Edgcomb, V. P., Crowe, S. A., and Hallam, S. J.: Sampling and processing methods impact microbial community structure and potential activity in a seasonally anoxic fjord: Saanich inlet, British Columbia, Front. Mar. Sci., 6, 1–16, https://doi.org/10.3389/fmars.2019.00132, 2019.
Trimmer, M., Chronopoulou, P.-M., Maanoja, S. T., Upstill-Goddard, R. C., Kitidis, V., and Purdy, K. J.: Nitrous oxide as a function of oxygen and archaeal gene abundance in the North Pacific, Nat. Commun., 7, 13451, https://doi.org/10.1038/ncomms13451, 2016.
Vajrala, N., Martens-Habbena, W., Sayavedra-Soto, L. A., Schauer, A., Bottomley, P. J., Stahl, D. A., and Arp, D. J.: Hydroxylamine as an intermediate in ammonia oxidation by globally abundant marine archaea, P. Natl. Acad. Sci. USA, 110, 1006–1011, https://doi.org/10.1073/pnas.1214272110, 2013.
Van Der Star, W. R. L., Van De Graaf, M. J., Kartal, B., Picioreanu, C., Jetten, M. S. M., and Van Loosdrecht, M. C. M.: Response of anaerobic ammonium-oxidizing bacteria to hydroxylamine, Appl. Environ. Microb., 74, 4417–4426, https://doi.org/10.1128/AEM.00042-08, 2008.
Wankel, S. D., Ziebis, W., Buchwald, C., Charoenpong, C., De Beer, Di., Dentinger, J., Xu, Z., and Zengler, K.: Evidence for fungal and chemodenitrification based N2O flux from nitrogen impacted coastal sediments, Nat. Commun., 8, 1–11, https://doi.org/10.1038/ncomms15595, 2017.
Ward, B. B. and Bouskill, N. J.: The utility of functional gene arrays for assessing community composition, relative abundance, and distribution of ammonia-oxidizing bacteria and archaea, in: Methods in Enzymology, Vol. 496, 373–396, Academic Press Inc., 2011.
Ward, B. B., Tuit, C. B., Jayakumar, A., Rich, J. J., Moffett, J., and Naqvi, S. W. A.: Organic carbon, and not copper, controls denitrification in oxygen minimum zones of the ocean, Deep-Sea Res. Pt. I, 55, 1672–1683, https://doi.org/10.1016/j.dsr.2008.07.005, 2008.
Weier, K. L., Doran, J. W., Power, J. F., and Walters, D. T.: Denitrification and the Dinitrogen/Nitrous Oxide Ratio as Affected by Soil Water, Available Carbon, and Nitrate, Soil Sci. Soc. Am. J., 57, 66–72, https://doi.org/10.2136/sssaj1993.03615995005700010013x, 1993.
Weigand, M. A., Foriel, J., Barnett, B., Oleynik, S., and Sigman, D. M.: Updates to instrumentation and protocols for isotopic analysis of nitrate by the denitrifier method, Rapid Commun. Mass Sp., 30, 1365–1383, https://doi.org/10.1002/rcm.7570, 2016.
Wright, J. J., Konwar, K. M., and Hallam, S. J.: Microbial ecology of expanding oxygen minimum zones, Nat. Rev. Microbiol., 10, 381–394, https://doi.org/10.1038/nrmicro2778, 2012.
Wuchter, C., Abbas, B., Coolen, M. J. L., Herfort, L., van Bleijswijk, J., Timmers, P., Strous, M., Teira, E., Herndl, G. J., Middelburg, J. J., Schouten, S., and Sinninghe Damsté, J. S.: Archaeal nitrification in the ocean, P. Natl. Acad. Sci. USA, 103, 12317–12322, https://doi.org/10.1073/pnas.0600756103, 2006.
Yang, S., Gruber, N., Long, M. C., and Vogt, M.: High ENSO driven variability of denitrification and suboxia in the Eastern Pacific Ocean, Global Biogeochem. Cy., 31, 1470–1487, https://doi.org/10.1002/2016GB005596, 2017.
Yoshida, N.: 15N-depleted N2O as a product of nitrification, Nature, 335, 528–529, https://doi.org/10.1038/335528a0, 1988.
Zhou, Z., Takaya, N., Sakairi, M. A. C., and Shoun, H.: Oxygen requirement for denitrification by the fungus Fusarium oxysporum, Arch. Microbiol., 175, 19–25, https://doi.org/10.1007/s002030000231, 2001.
Zhu-Barker, X., Cavazos, A. R., Ostrom, N. E., Horwath, W. R., and Glass, J. B.: The importance of abiotic reactions for nitrous oxide production, Biogeochemistry, 126, 251–267, https://doi.org/10.1007/s10533-015-0166-4, 2015.
Zumft, W. G.: Cell biology and molecular basis of denitrification, Microbiol. Mol. Biol. Rev., 61, 533–616, 1997.