the Creative Commons Attribution 4.0 License.
the Creative Commons Attribution 4.0 License.
 | 11 Jun 2020
The soil organic carbon stabilization potential of old and new wheat cultivars: a 13CO2-labeling study
Marijn Van de Broek
Shiva Ghiasi
Charlotte Decock
Andreas Hund
Samuel Abiven
Cordula Friedli
Roland A. Werner
Johan Six
Over the past decades, average global wheat yields have increased by about 250 %, mainly due to the cultivation of high-yielding wheat cultivars. This selection process not only affected aboveground parts of plants, but in some cases also reduced root biomass, with potentially large consequences for the amount of organic carbon (OC) transferred to the soil. To study the effect of wheat breeding for high-yielding cultivars on subsoil OC dynamics, two old and two new wheat cultivars from the Swiss wheat breeding program were grown for one growing season in 1.5 m deep lysimeters and pulse labeled with 13CO2 to quantify the amount of assimilated carbon that was transferred belowground and can potentially be stabilized in the soil. The results show that although the old wheat cultivars with higher root biomass transferred more assimilated carbon belowground compared to more recent cultivars, no significant differences in net rhizodeposition were found between the different cultivars. As a consequence, the long-term effect of wheat cultivar selection on soil organic carbon (SOC) stocks will depend on the amount of root biomass that is stabilized in the soil. Our results suggest that the process of wheat selection for high-yielding cultivars resulted in lower amounts of belowground carbon translocation, with potentially important effects on SOC stocks. Further research is necessary to quantify the long-term importance of this effect.
- Article
(2982 KB) - Full-text XML
-
Supplement
(999 KB) - BibTeX
- EndNote


Soil management has a large influence on the size of the soil organic carbon (SOC) stock in managed arable soils. This is evident from the large decrease in SOC that is generally observed after soils under natural vegetation are converted to arable land (Don et al., 2011; Guo and Gifford, 2002; Poeplau et al., 2011). As a consequence, the mineralization of SOC and the loss of forest caused by land use change has contributed about 30 % to the increase in atmospheric CO2 concentration since the onset of the industrial revolution (Le Quéré et al., 2018). Current contributions of the agricultural sector to global warming have been estimated to be about 11 % but are mostly in the form of N2O and CH4 and not anymore as CO2 (Tubiello et al., 2015).
The rising awareness that there is potentially an opportunity to increase subsoil organic carbon (OC) stocks (Chen et al., 2018) has led to the proposal that agricultural soils can be a sink of atmospheric CO2 by applying appropriate climate-smart agricultural practices (Chenu et al., 2018; Minasny et al., 2017; Paustian et al., 2016). Multiple management practices have been shown to increase the OC content of cultivated soils, including the application of organic amendments to soils (Sandén et al., 2018), increasing the amount of crop residues returned to the field (Lehtinen et al., 2014) and planting of cover crops (Kong and Six, 2010; Poeplau and Don, 2015).
In addition, growing crops with deeper roots and/or higher root biomass has been put forward as a strategy to increase OC sequestration in arable soils (Kell, 2011), while deep rooting can also decrease the effect of drought in climates where deep soil water is available during the main cropping season (Wasson et al., 2012). However, a direct or marker-assisted selection for root traits is very rare in conventional breeding programs. Accordingly, we have very limited knowledge on if and how breeders alter the root system and potentially affect belowground carbon cycling. One way to evaluate the effect of breeder's selection on root characteristics and subsoil carbon cycling is to compare old and new varieties of the same breeding program. For the Swiss wheat breeding programs, the selection process reduced the mass and depth of roots under well-watered conditions (Friedli et al., 2019), as has been found for other breeding programs (Aziz et al., 2017), but modern genotypes enhanced root allocation to deep soil layers under drought. However, this pattern has not been observed consistently (Cholick et al., 1977; Feil, 1992; Lupton et al., 1974). To the best of our knowledge, there is no information about the effect of breeding on changes in subsoil OC dynamics and root respiration.
One reason for the lack of quantitative data about the effects of rooting depth on SOC sequestration is related to difficulties in measuring the amount of carbon transferred from roots to the soil (gross rhizodeposition) and the proportion of carbon that is eventually stabilized there (net rhizodeposition), after a portion of gross rhizodeposits are lost from the soil through microbial mineralization or leaching. The fact that rhizodeposition occurs below the soil surface greatly prevents direct observations of this “hidden half of the hidden half” of the SOC cycle (Pausch and Kuzyakov, 2018). First of all, direct measurements of root exudation rates are hampered by the fact that rhizodeposits are used by rhizosphere microorganisms within a couple of hours after they are released, resulting in very low concentrations of root carbon exudates in the soil (Kuzyakov, 2006). Second, the release of carbon exudates by agricultural crops is not equally divided throughout the growing season but mainly occurs in the first 1–2 months of the growing period and decreases sharply thereafter (Gregory and Atwell, 1991; Keith et al., 1986; Kuzyakov and Domanski, 2000; Pausch and Kuzyakov, 2018; Swinnen et al., 1994). Third, measurements of the effects of rhizodeposits on changes in SOC stocks are further complicated by the priming effect, i.e., their positive effect on the mineralization of native SOC (Fontaine et al., 2007; de Graaff et al., 2009).
To overcome these difficulties, rates of C rhizodeposition can be measured by labeling plants with 13CO2 or 14CO2 (Jones et al., 2009; Kuzyakov and Domanski, 2000) and subsequently tracing the amount of photosynthetically assimilated 13C or 14C label in the soil at the end of the growing season (Kong and Six, 2010, 2012). However, the continuous application of 13CO2 or 14CO2 during the course of an entire growing season to plants is often not feasible, as this requires the setup of open-top chambers while continuously supplying the crops with the isotopic label, which comes at a high financial cost. Therefore, plants are commonly labeled at fixed time intervals during the growing season (repeated pulse labeling). This results in reliable estimates of the partitioning of assimilated carbon to different plant compartments, as well as into the soil (Kong and Six, 2010; Kuzyakov and Domanski, 2000; Sun et al., 2018).
In addition, assessing the magnitude of the carbon transfer from roots to the soil is not straightforward, particularly under field conditions. While carbon inputs from crops to the soil are often derived from yield measurements (Keel et al., 2017; Kong et al., 2005; Taghizadeh-Toosi et al., 2016), these quantities are often poorly related to root biomass or the magnitude of root exudates (Hirte et al., 2018; Hu et al., 2018). A better understanding of the factors controlling the rates of carbon rhizodeposition by different agricultural crops is thus necessary to assess how different crops affect SOC cycling and to provide SOC models with reliable rates of carbon inputs to the soil.
The present study addresses the following research question: do wheat cultivars with shallow roots and lower root biomass lead to less net carbon rhizodeposition compared to wheat cultivars with deeper roots and higher root biomass? To address this question, four different bread wheat cultivars from a century of Swiss wheat breeding (Fossati and Brabant, 2003; Friedli et al., 2019) were grown in large mesocosms, which allowed us to study the plant–soil system under controlled conditions that closely resemble a field situation. We hypothesized that wheat cultivars with shallow roots and lower root biomass would result in less net carbon rhizodeposition over the course of a growing season, compared to cultivars with deeper roots and higher root biomass.
2.1 Experimental setup
2.1.1 ETH mesocosm platform
To assess the effect of wheat root characteristics on net rhizodeposition in a realistic soil environment under controlled conditions, an experiment was set up at the mesocosm platform of the Sustainable Agroecosystems Group at the Research Station for Plant Sciences Lindau (ETH Zürich, Switzerland). The platform was located inside a greenhouse and consisted of 12 cylindrical lysimeters with a diameter of 0.5 m and a height of 1.5 m, constructed using 10 mm wide polyethylene (Fig. S1 in the Supplement). The lysimeters were equipped with probes installed at five different depths (0.075, 0.30, 0.60, 0.90 and 1.20 m below the surface) to measure the volumetric moisture content at a temporal resolution of 30 min (ECH2O EC-5, Decagon Devices, US) and to sample soil pore water (Prenart, Frederiksberg, Denmark) and soil pore air (Membrana, Wuppertal, Germany). The lysimeters were filled with mechanically homogenized soil, collected from an agricultural field in Estavayer-le-Lac, Switzerland. The upper 0.15 m of the lysimeters was filled with topsoil, collected from the A horizon, while the remainder (0.15–1.35 m depth) was filled with subsoil. The bottom 0.15 m of the lysimeters (1.35–1.50 m depth) consisted of a layer of gravel (Blähton, Erik Schweizer, Switzerland) to facilitate drainage of soil water through the bottom of the lysimeters. The top and subsoil had a sandy clay loam texture with 21 % silt, 21 % clay, and 58 % sand, and top- and subsoil pH values were 7.8 and 7.5, respectively. The OC concentration of the top- and subsoil was 0.77±0.01 % and 0.40±0.01 %, respectively, with a C:N ratio of 6.9 and 5.0, respectively. No carbonates were detected in the soil.
At the top of each lysimeter, pneumatically activated chambers were placed, which were automatically closed when applying the 13CO2 label (see Sect. 2.1.3). These chambers were made of stainless steel with fitted plexiglass panes and covered a rectangular area of 0.5 m×0.5 m with an initial height of 0.1 m. Chamber heights were extended with increasing plant height, using one or two height extensions of 0.5 m each (Fig. S1).
2.1.2 Wheat cultivars and growth conditions
Four wheat (Triticum aestivum L.) cultivars from the Swiss wheat breeding program (Fossati and Brabant, 2003; Friedli et al., 2019) with different breeding ages were selected: Mont-Calme 268 (introduced in 1926), Probus (1948), Zinal (2003) and CH Claro (2007). Generally, more recent cultivars of this program on average have more shallow roots and lower root biomass under well-watered conditions compared to the older cultivars (Friedli et al., 2019). CH Claro was selected as a modern variety with relatively deep rooting.
Before the wheat plants were transplanted to the lysimeters, wheat seeds were germinated in a greenhouse for 2–3 d on perforated antialgae foil laid over 2 mm moistened fleece at a warm temperature (20 ∘C during day and 18 ∘C during night) and good light conditions. Next, the seedlings were planted in containers filled with the same topsoil used to fill the lysimeters and transferred to a climate chamber for vernalization for 52 d (Baloch et al., 2003). First, the seedlings were kept 45 d at 4 ∘C, with 8 h of light per day and a light intensity of 10 klx. During the 3 subsequent days, daylight intensity was increased to 36 klx, daytime temperature was increased to 12 ∘C and night temperature was increased to 10 ∘C. During the last 4 d, daytime temperature was increased to 16 ∘C and night temperature to 12 ∘C. The relative humidity was maintained at 60±10 % during the entire vernalization period. After vernalization, 70 seedlings were transplanted to every lysimeter, corresponding to a plant density of 387 plants m−2. At the timing of transplanting, the plants were at the onset of tillering.
The experimental setup consisted of a randomized complete block design. Each of the four wheat cultivars was planted in three lysimeters, i.e., three replicates per cultivar, resulting in a total of 12 lysimeters. These were placed in three blocks of four rows, where each wheat cultivar was planted in one lysimeter in each block. The plants were grown in the greenhouse for about 5 months, between 24 August 2015 and 1 February 2016. Despite uneven maturing of plants within and between the lysimeters, all plants had reached flowering stage at the time of harvest. Fertilizer was applied to the soil lysimeters a first time on 5 October 2015, at a rate of 84 kg N ha−1, 36 kg P2O5 ha−1, 48 kg K2O ha−1 and 9 kg Mg ha−1, and a second time on 4 December 2015, at a rate of 56 kg N ha−1, 24 kg P2O5 ha−1, 32 kg K2O ha−1 and 6 kg Mg ha−1. The lysimeters were watered manually twice per week with a similar amount of water to keep soil moisture close to field capacity. Differences in the amount of water used by the different cultivars resulted in differences in the soil water content between the cultivars (Fig. S2). The temperature in the greenhouse was set to 20 ∘C during the day and 15 ∘C during the night. During the experiment, the average temperature in the greenhouse was 16.9 ∘C, with a minimum and maximum of 9.3 and 29.8 ∘C respectively. The average humidity was 63.7 %, with a minimum and maximum of 35.3 % and 86.4 % respectively.
2.1.3 Repeated 13C pulse labeling
In order to study carbon allocation within the atmosphere–plant–soil system, a 13C-pulse-labeling approach was used. 99 at. % 13CO2 (Euriso-top, Saint-Aubin, France) was applied once per week (14:00 local time on Thursdays) by injecting 15, 56 or 98 mL CO2 into each chamber depending on the chamber extension used, in order to yield a target 13CO2 content of 58 at. %. A weekly labeling frequency has been shown to ensure a sufficient abundance of root-derived 13C in the soil at the end of the experiment (Bromand et al., 2001; Kong and Six, 2010). After chamber closure, CO2 concentration in one chamber was monitored using a CO2 analyzer (Li-820, LICOR, Lincoln, US). Throughout the experiment, CO2 concentrations were measured in the same chamber. After the CO2 concentration dropped below 200 ppm, another 13CO2 pulse was injected to yield a postlabel CO2 concentration of 570 ppm in the chamber headspace. The chamber lids were kept closed for 2 h after label injection to achieve sufficient uptake and then reopened to avoid condensation. On the same day of pulse labeling, all chambers were closed overnight to recuperate 13C lost through night respiration and allowed to be taken up by the plants in the morning before reopening the chambers.
2.2 Measurements
2.2.1 Belowground CO2 concentration and δ13CO2
Soil gas sampling was performed once per week (Wednesdays) by attaching a pre-evacuated 110 mL crimp serum vial to a sampling port at each depth, leaving it equilibrating overnight. For each sample, a 20 mL subsample was transferred to a pre-evacuated Labco exetainer (12 mL) and used to determine the CO2 concentration. The CO2 concentration of each sample was determined using a gas chromatograph equipped with a thermal conductivity detector (Bruker 456-GC, Germany). In addition, the δ13C value of CO2 was measured for CO2 samples collected along the depth profiles on the last sampling date, using a GasBench II modified as described by Zeeman et al. (2008) coupled to a Deltaplus XP isotope ratio mass spectrometer (IRMS, ThermoFisher, Germany). The standard deviation of the measurements was <0.15 ‰.
2.2.2 Sampling and general soil analyses
At the end of the experiment, the aboveground biomass of the wheat plants was harvested separately for each lysimeter and separated into leaves, ears and stems. Soil from the lysimeters was collected by destructive sampling to analyze bulk density, root biomass and other soil properties. The sampling was done layer by layer. After a soil layer had been sampled, it was removed completely from the lysimeter and the next layer was sampled. From each depth increment (0–0.15, 0.15–0.45, 0.45–0.75, 0.75–1.05, 1.05–1.35 m depth), five soil cores were collected per lysimeter using a soil core sampler (5.08 cm diameter, Giddings Machine Company Inc., Windsor, CO, US). Three of the five cores per lysimeter and depth increment were used for the determination of root biomass based on a combination of buoyancy and sieving through a 530 µm sieve, using a custom-built root washing station. The remaining two soil cores were sieved at 8 mm, air-dried and stored for further analysis. Prior to air-drying, the fresh weight and volume for each core was determined, and a subsample was taken for the determination of gravimetric soil moisture content. Bulk density was calculated based on fresh weight, gravimetric moisture content and core volume. Soil texture was measured using a particle size analyzer (LS 13 320, Beckman Coulter, Indianapolis, USA). Prior to analysis 0.1 g of soil was shaken for 4 h with 4 mL of 10 % sodium hexametaphosphate and sonicated for 1 min.
2.2.3 Soil microbial biomass
Soil microbial biomass was extracted from soil samples that had been frozen at −20 ∘C for 6 months immediately after sampling. Two subsamples of 40 g were taken from each sieved soil sample. One set was fumigated for 24 h using chloroform. Next, total dissolved OC was extracted from each fumigated and nonfumigated subsample by shaking it in 200 mL 0.05 M K2SO4 for 1 h, prior to filtering through a Whatman 42 filter paper. Total OC concentrations in K2SO4 extracts were determined using a CN analyzer (multi N/C 2100S analyzer, Analytik Jena, Germany). To determine microbial biomass carbon per unit of dry soil, the gravimetric soil water content was determined by drying about 10 g of each soil sample at 105 ∘C and subtracting the weights before and after drying. The carbon content of the soil microbial biomass was calculated according to Vance et al. (1987) as
where TOCF and TOCNF are the total OC in fumigated and nonfumigated samples, respectively. The remainder of the filtered samples was freeze-dried in order to analyze the δ13C value. The δ13C value of soil microbial biomass was calculated using mass balance according to Ruehr et al. (2009):
where CF and CNF represent total organic carbon content of the fumigated and nonfumigated samples, respectively.
2.2.4 Organic carbon concentration and isotopic composition of plant material, soil organic carbon and microbes
The OC concentration and isotopic composition (δ13C) of above- and belowground plant material; extracts from fumigated and nonfumigated soil; and bulk soil were measured by weighing 2, 4, 50, 50 and 100 mg, respectively, of each sample into Sn capsules (9 mm×5 mm Säntis, CH) for analysis with a Flash EA 1112 series elemental analyzer (ThermoFisher, Germany) coupled to a Deltaplus XP IRMS via a ConFlo III (Brooks et al., 2003; Werner et al., 1999; Werner and Brand, 2001). The measurement precision (SD) of the quality control standards, tyrosine Tyr-Z1 and caffeine Caf-Z1, was 0.37 (‰) and 0.08 (‰), respectively, for above- and belowground plant material, microbes, and the soil samples.
2.3 Data processing
2.3.1 Excess 13C calculations
The mass of 13C label that was recovered in (i) the aboveground vegetation, (ii) roots of wheat plants and (iii) the soil was calculated following Studer et al. (2014):
where mE(13C) is the mass of recovered 13C label (g m−2), χE(13C) is the excess atom fraction (unitless, calculated following Coplen, 2011), m(C) is the total mass (g m−2) of C, M(12C) and M(13C) are the molar weight of 12C and 13C (g mol−1), respectively, and χ(12C) and χ(13C) are the 12C and 13C atom fraction (unitless), respectively.
To calculate the excess atom fraction (χE(13C)) of the soil compartment, the isotopic composition of the soil at the start of the experiment was used as the reference value ( ‰ for the topsoil, ‰ for the subsoil). As all lysimeters were labeled with 13CO2, no control treatment for the wheat plants was present. Therefore, a δ13C reference value of −28 ‰ was assumed for the aboveground parts and roots of all wheat plants. The calculation of excess 13C is very sensitive to variability in input parameter values, including the δ13C value of plant biomass and soil. Therefore, a sensitivity analysis was used to show that varying the initial δ13C value of the wheat plants with ±3 ‰, a typical range over which δ13C values can vary in the field because of, e.g., precipitation (Kohn, 2010), led to changes in calculated mE(13C) on the order of ±1 % for aboveground biomass and ± 1 %–5 % for belowground biomass. The effect of the initial δ13C value of the biomass on the calculated amount of recovered 13C label in the wheat plants was thus limited. Calculations of the effect of wheat cultivar on belowground excess 13C were only performed for the upper 0.45 m of the lysimeters, as missing data for deeper soil layers prevented including these layers in the statistical analyses and the majority of root biomass was present in the upper 0.45 m (Fig. 1).
2.3.2 Net carbon rhizodeposition
The absolute amount of carbon rhizodeposition for the different depth segments in the lysimeters was calculated following Janzen and Bruinsma (1989):
where rhizodeposition C is expressed in grams per kilogram (g kg−1) for the considered layer; and are the excess 13C atom fraction in the soil and roots respectively, calculated as described in Sect. 2.3.1; and Csoil is the OC concentration of the considered soil layer (g kg−1). This approach assumes that the isotopic enrichment of rhizodeposits and roots is equal. The absolute amount of carbon rhizodeposition for each soil layer was calculated by multiplying rhizodeposition C (g kg−1) with the carbon content (kg) present in each of the respective layers. We note that data on the C concentration and δ13C value of root biomass could not be obtained from a number of soil layer below 0.45 m depth for certain cultivars, due to the limited root biomass that could be retrieved. Therefore, net C rhizodeposition was only calculated for the two uppermost soil layers (0–0.45 m depth), as only for these layers all necessary data to calculate net C rhizodeposition were available for the three replicates of every cultivar.
2.3.3 Subsoil CO2 production
Depth profiles of subsoil CO2 production in the lysimeters were calculated using the weekly measured depth profiles of CO2 concentration throughout the experiment. To assess the variability among the different lysimeters, these calculations were performed separately for every lysimeter and average CO2 production depth profiles were calculated for each cultivar. Measurements of CO2 concentration, soil temperature and soil moisture content were performed at discrete depths (0.075, 0.30, 0.60, 0.90 and 1.20 m depth). Continuous depth profiles of these variables at a vertical resolution of 0.05 m were obtained using linear interpolation. Depth profiles of CO2 production were calculated using the discretized form of the mass balance equation of CO2 in a diffusive one-dimensional medium, following Goffin et al. (2014):
where P(z) is the CO2 production in layer i (µmol CO2 m−3 s−1) over time span Δt, t is the time (s), εi is the air-filled porosity in layer i (m3 m−3), is the CO2 concentration of layer i (µmol CO2 m−3), and are the CO2 fluxes transported through the upper and lower boundaries of layer i (µmol CO2 m−2 s−1) during time span Δt, respectively, and z is the depth (m). The vertical CO2 fluxes are calculated as (Goffin et al., 2014):
where is the harmonic average of the effective diffusivity coefficient (Ds) between layers i and j, and Δz is the layer thickness. The effective diffusivity coefficient is calculated using a formula appropriate for repacked soils (Moldrup et al., 2000):
where D0 is the gas diffusion coefficient of CO2 in free air over time span Δt (m2 s−1), εi is the air-filled porosity of layer i over time span Δt (m3 m−3) and Φi is the total soil porosity of layer i (m3 m−3). The total soil porosity was calculated as , where ρi is the soil bulk density (t m−3) and ρp is the particle density (2.65 t m−3). Due to the large vertical variability in measured bulk density depth profiles, a constant bulk density profile was assumed for the subsoil (below 0.15 m depth), calculated as the average of the measured bulk density values for these layers. The air-filled porosity over time span Δt was calculated as the difference between the total porosity (m3 m−3) and the average measured water-filled pore space over time span Δt (m3 m−3). The latter was measured throughout the experiment (see Sect. 2.1.1) and corrected based on differences between these measurements at the end of the experiment and the measured volumetric water content of the sampled soil at the end of the experiment. For this purpose, different correction equations were used for (i) the upper soil layer (0–15 cm) and (ii) all deeper layers combined.
The gas diffusion coefficient in free air was corrected for the individual lysimeters for variations in temperature and soil moisture throughout the experiment (Massman, 1998), as
where D0,stp is the gas diffusion coefficient for CO2 in free air under standard temperature (0 ∘C) and pressure (1 atm) ( m2 s−1; Massman, 1998) and α is a coefficient (1.81; Massman, 1998). Semicontinuous measurements of soil temperature in every lysimeter were used to calculate D0 values throughout the experiment, while a constant atmospheric pressure of 1 atm throughout the experiment was assumed.
To obtain depth profiles of the total amount of CO2 produced by the different wheat cultivars during the experiment (expressed as g CO2 m−2), the calculated CO2 production rates between all measurement days (P(z)) were summed for the time span of the experiment and converted to grams of CO2 per square meter (g CO2 m−2) using the molecular mass of CO2 (44.01 g mol−1). We applied the boundary condition of the absence of a flux of CO2 at the bottom of the lysimeters. It is noted that these calculations do not make a distinction between the source of CO2 production, thereby combining both autotrophic and heterotrophic CO2 production (total soil respiration). For more information about these methods, reference is made to Goffin et al. (2014).
2.4 Statistics
To account for the three blocks in the randomized complete block design, statistically significant differences between aboveground characteristics of different cultivars were checked using a two-way analysis of variance (ANOVA) without interactions (Dean et al., 2015), followed by a Tukey test, based on the values obtained for the individual replicates (n=3 for every cultivar) using a significance level of 0.05. This was done after checking for homogeneity of variance (Levene's test) and normality (Shapiro–Wilk test) using a confidence level of 0.05. These analyses were performed in MATLAB®. The effects of cultivar and depth on soil bulk density, belowground biomass, belowground C allocation and net C rhizodeposition were assessed using a linear mixed-effects model, with cultivar and depth being fixed effects and blocks being treated as a random effect (lmer function in R; R Core Team, 2019). Next, a pair-wise comparison was used to check for statistically significant differences between the cultivars (emmeans package in R). Belowground biomass was log-transformed to increase normality and homogeneity of variances for the latter analysis. Uncertainties on reported variables are expressed as standard errors (n=3).
3.1 Aboveground biomass
The aboveground biomass produced at the end of the experiment was significantly different between Zinal and Probus, while the aboveground biomass of CH Claro and Mont-Calme 268 was not significantly different from any other cultivar (Fig. 1, Table 1). The biomass of the ears was significantly higher for Zinal, compared to CH Claro, Probus and Mont-Calme (Fig. 1, Table S1 in the Supplement). It is noted that these data should be interpreted with care, since not all plants reached maturity at the time of harvest and are potentially not representative for the biomass of the ears of full-grown plants. No significant differences were found between the δ13C values of aboveground biomass of the different cultivars (Fig. 2). The high δ13C values of the aboveground biomass of all wheat cultivars (266 ‰ on average) showed that a substantial amount of the 13CO2 tracer was incorporated by all wheat plants (Fig. 2).

Figure 1Aboveground (a) and root (b) biomass of the different wheat cultivars at the end of the experiment. Bars represent the average per wheat cultivar, error bars show the standard error (n=3) and circles show the individual data points. The inset in (b) shows a detail of the subsoil root biomass. If statistically significant differences were present, these are indicated with letters, with variables sharing a letter not being significantly different.
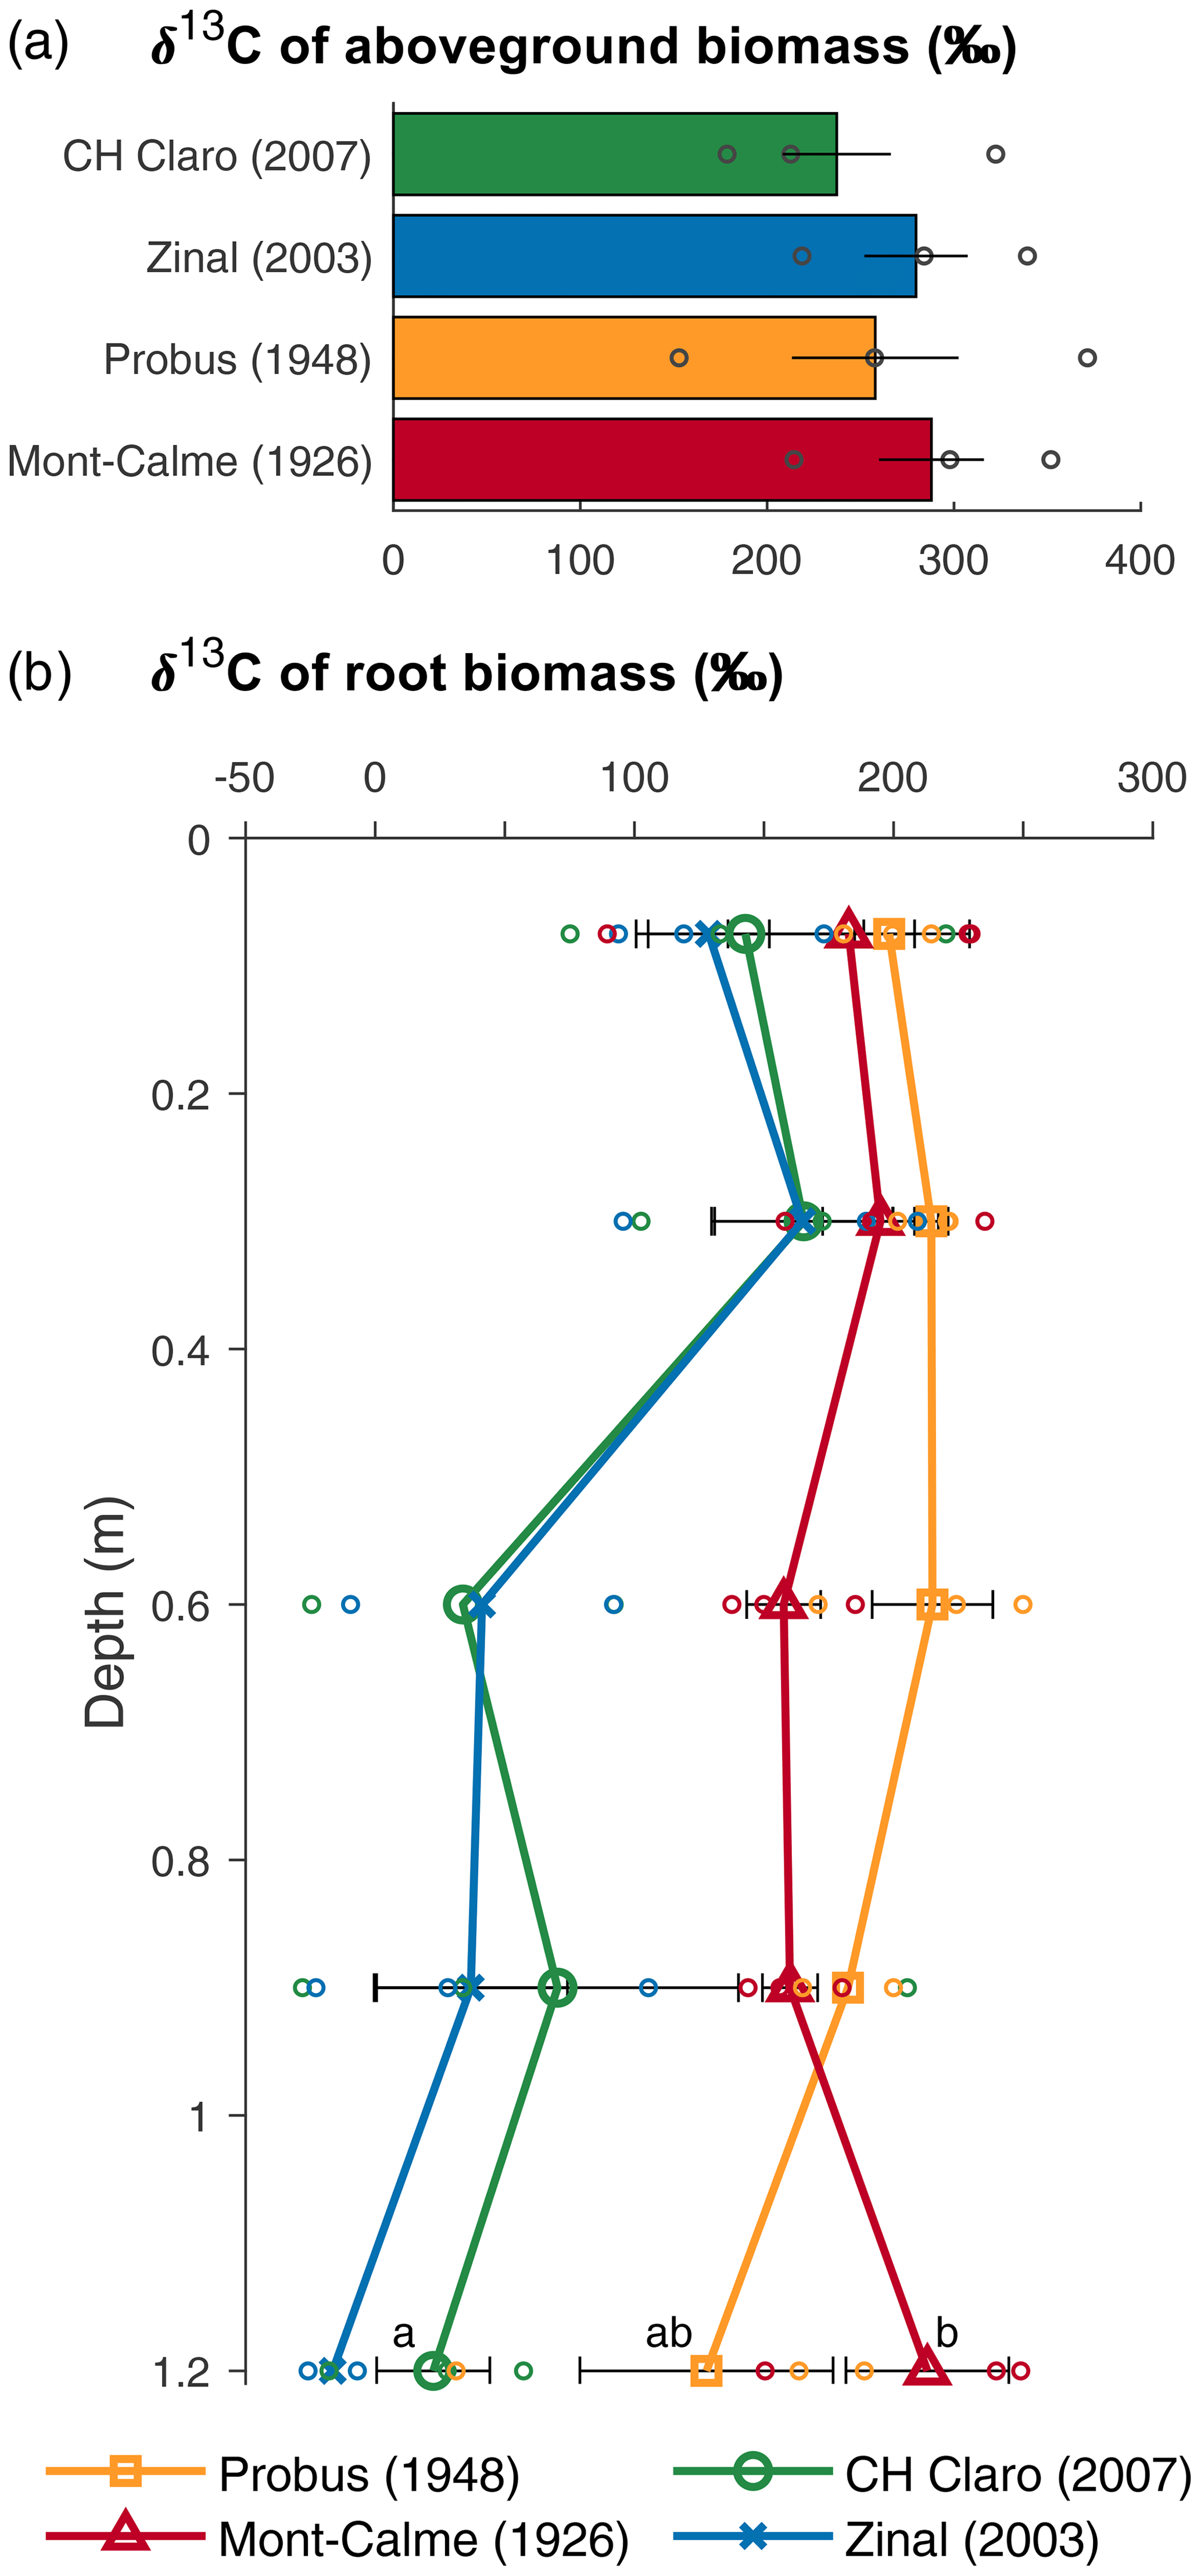
Figure 2δ13C values of aboveground (a) and belowground (b) biomass for the different wheat cultivars at the end of the experiment. Bars (a) and symbols (b) represent the average per wheat cultivar, error bars show the standard error (n=3), and symbols without error bars indicate samples for which no three replicates were available. Circles show the individual data points. If statistically significant differences were present for root biomass at the same depth, these are indicated with letters, with variables sharing a letter not being significantly different and data points without error bars being left out of the analyses.
Table 1Characteristics (± standard error, n=3) of the biomass of the different wheat cultivars at the end of the experiment. Values that share a letter in the same column are not significantly different.
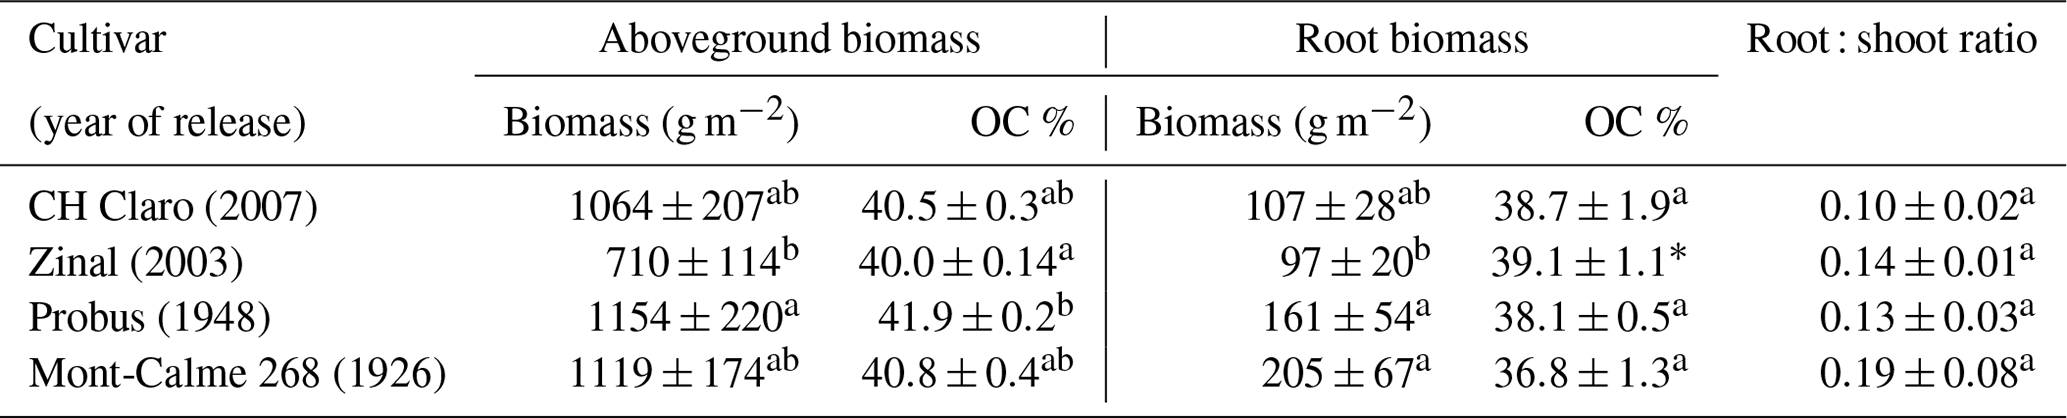
* Was excluded from statistical analysis due to missing data.
3.2 Belowground biomass
The average root biomass was highest in the topsoil and significantly lower in the subsoil layers of all four wheat cultivars (Fig. 1b). Root biomass of Zinal was significantly lower compared to the root biomass of Probus and Mont-Calme 268, while the root biomass of CH Claro was not significantly different from any of the other cultivars (Fig. 1b). These differences were mostly present in the two uppermost soil layers, while root biomass was not significantly different between different cultivars at any depth, except for Zinal and Mont-Calme 268 between 0.45 and 0.75 m depth (Fig. 1). The root : shoot ratio varied between 0.10±0.02 and 0.19±0.08 and was not significantly different between the different cultivars (Table 1).
The depth profiles of the δ13C of root biomass were different between the old and more recent wheat cultivars (Fig. 2). In the two uppermost soil layers, no significant differences were detected between the δ13C values of root biomass of the different cultivars. These differences could not be checked for statistical significance in deeper soil layers due to a lack of sufficient recovered root biomass in each lysimeter. The δ13C values of the roots of the old wheat cultivars showed only limited variation with depth, with values between ca. 150 ‰ and 200 ‰. In contrast, the δ13C values of the roots of the more recent wheat cultivars were highest in the two uppermost soil layers (0–45 cm) and showed an abrupt decrease with depth in deeper soil layers.
3.3 Soil and soil organic carbon characteristics
The SOC concentration in the lysimeters was similar to the OC concentration of the initial soil (Fig. 3a). A direct comparison between the SOC concentration before and after the experiment could not be made, as no measurements of the OC concentration of the soil in the lysimeters before the start of the experiment could be made. However, the SOC concentration measured at the different depths in the lysimeters was similar to the OC concentration measured on the soil that was used to fill the lysimeters (Fig. 3a). No statistically significant differences in SOC concentration were found between the different cultivars at any depth.
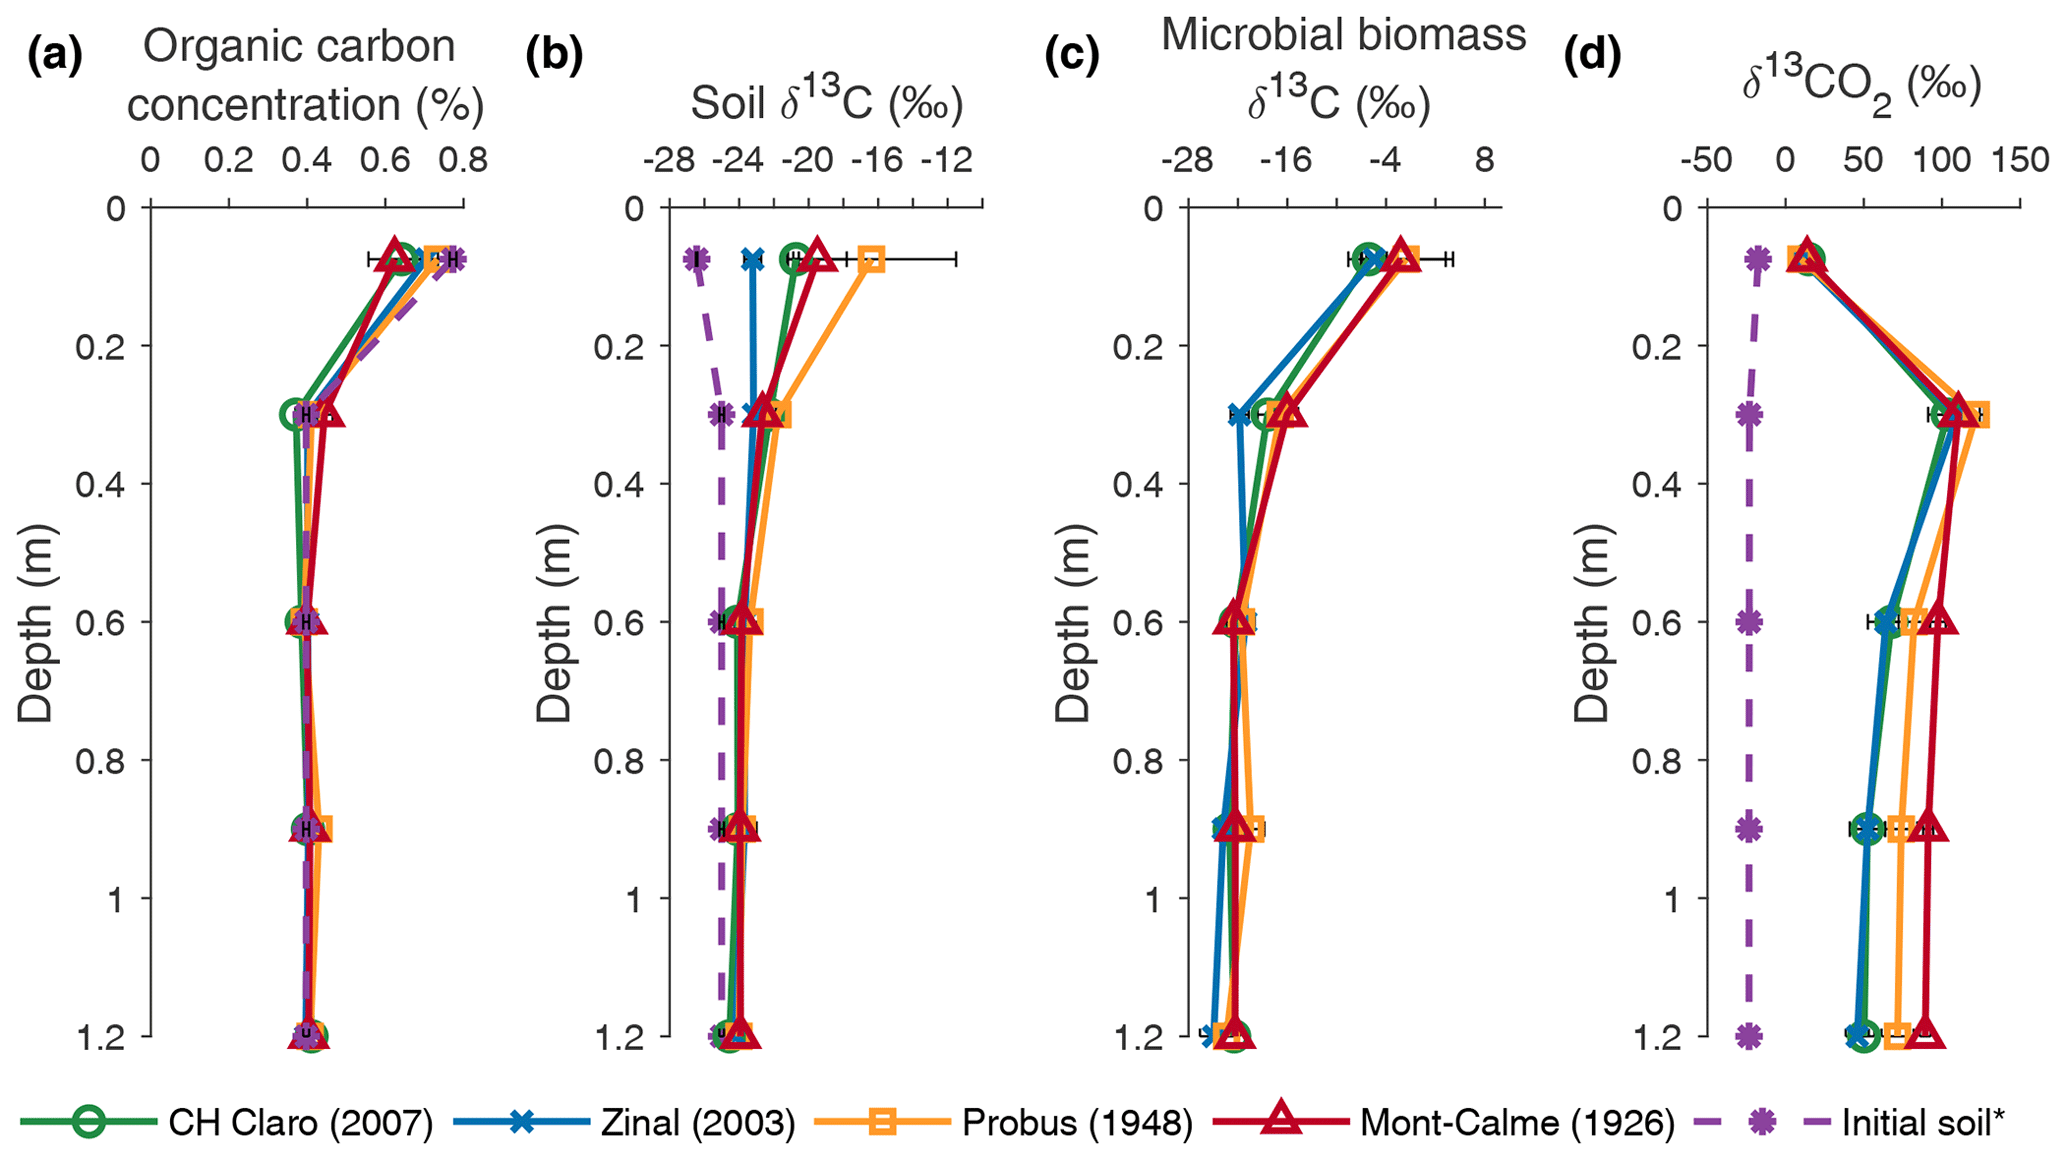
Figure 3Depth profiles of organic carbon concentration (a), the δ13C value of organic carbon (b), the δ13C value of microbial biomass (c) and the δ13C value of soil CO2 (d), averaged per wheat cultivar at the end of the experiment. Error bars represent the standard error (n=3). * The initial soil indicates measurements performed on the soil that was used to fill the lysimeters prior to the experiments in (a) and (b) and measurements of the δ13CO2 depth profile at the beginning of the experiment in (d).
The SOC in the two uppermost soil layers (0–45 cm) of all wheat cultivars was enriched in 13C compared to the soil that was used to fill the lysimeters (Fig. 3b). Although the δ13C value of SOC was not significantly different at any depth between any of the cultivars, the largest increase in the δ13C value of topsoil OC was observed for Probus and Mont-Calme 268 (Fig. 3b), indicating that the soil under the old cultivars incorporated more of the 13C label compared to the more recent cultivars. The limited difference between (i) the δ13C values of the soil used to fill the lysimeters and (ii) the measurements at the end of the experiment below a depth of 0.45 m indicates a lower amount of incorporated 13C label in the subsoil. Similarly, the δ13C value of topsoil microbial biomass was more positive compared to deeper soil layers for all cultivars, indicating that microbes utilized more substrate enriched in 13C in the two uppermost soil layers, compared to deeper soil layers (Fig. 3c). Statistically significant differences were only detected in the layer between 0.15 and 0.45 m depth, where the δ13C value of microbial biomass under Zinal was significantly lower compared to Mont-Calme 268. However, as the microbial biomass under Zinal was substantially higher compared to under Mont-Calme 268 in this layer (Fig. S3), this does not necessarily imply that microbes under Mont-Calme 268 incorporated more excess 13C compared to under Zinal. Depth profiles of microbial biomass carbon were relatively constant (200–500 µg C g soil−1), with no consistent differences between different cultivars (Fig. S3). The δ13C values of soil CO2 (δ13CO2) at the end of the experiment were similar for all wheat cultivars for the two uppermost layers (0–0.45 m) (Fig. 3d). Deeper down the profile, the CO2 under the old wheat cultivars was more enriched in 13C compared to the more recent cultivars, by an average of ca. 30 ‰. The only statistically significant differences were detected in the lowermost layer, where the δ13C values of CO2 of Zinal and CH Claro were significantly lower compared to Mont-Calme 268.
There was no significant effect of cultivar on the bulk density of the soil at the end of the experiment (, p=0.23), while there was a significant effect of depth on bulk density (, p<0.0005). The average bulk density of all lysimeters was highest in the topsoil (1.67±0.12 Mg m−3) and varied with depth (Fig. S4a). The gravimetric moisture content in the lysimeters at the end of the experiment increased with depth for all cultivars, from ca 0.1 g g−1 in the top layer to ca. 0.15 g g−1 in the bottom layer (Fig. S4b), and was only significantly different between Mont-Calme 268 and Zinal in the uppermost soil layer. The soil moisture content changed relatively little throughout the experiment for all lysimeters, after an initial phase of decreasing soil moisture content at the onset of the experiment (Fig. S2).
3.4 Excess 13C and carbon rhizodeposition
The total amount of 13C label that was present in the plant–soil system at the end of the experiment, expressed as excess 13C, differed significantly between different wheat cultivars (Fig. 4a). When accounting for excess 13C in aboveground biomass and in the soil and roots down to a depth of 0.45 m, the lowest amount of 13C label was found in the Zinal lysimeters (1.19±0.11 g m−2), followed by CH Claro (1.64±0.06 g m−2) and the older wheat cultivars (2.05±0.09 g m−2 for Mont-Calme 268 and 2.01±0.19 g m−2 for Probus), with the majority of 13C tracer in the aboveground biomass (Fig. 4a). Despite these differences, the relative distribution of the assimilated 13C between aboveground biomass, roots and soil was similar between the different wheat cultivars (Fig. 4b). On average, 80.7±1.7 % of the assimilated tracer ended up in aboveground biomass, 8.4±1.5 % in root biomass and 10.9±1.4 % in the soil. It is noted that root-respired 13C label is not included in this analysis, which may lead to an underestimation of the fraction of 13C label that was allocated belowground.
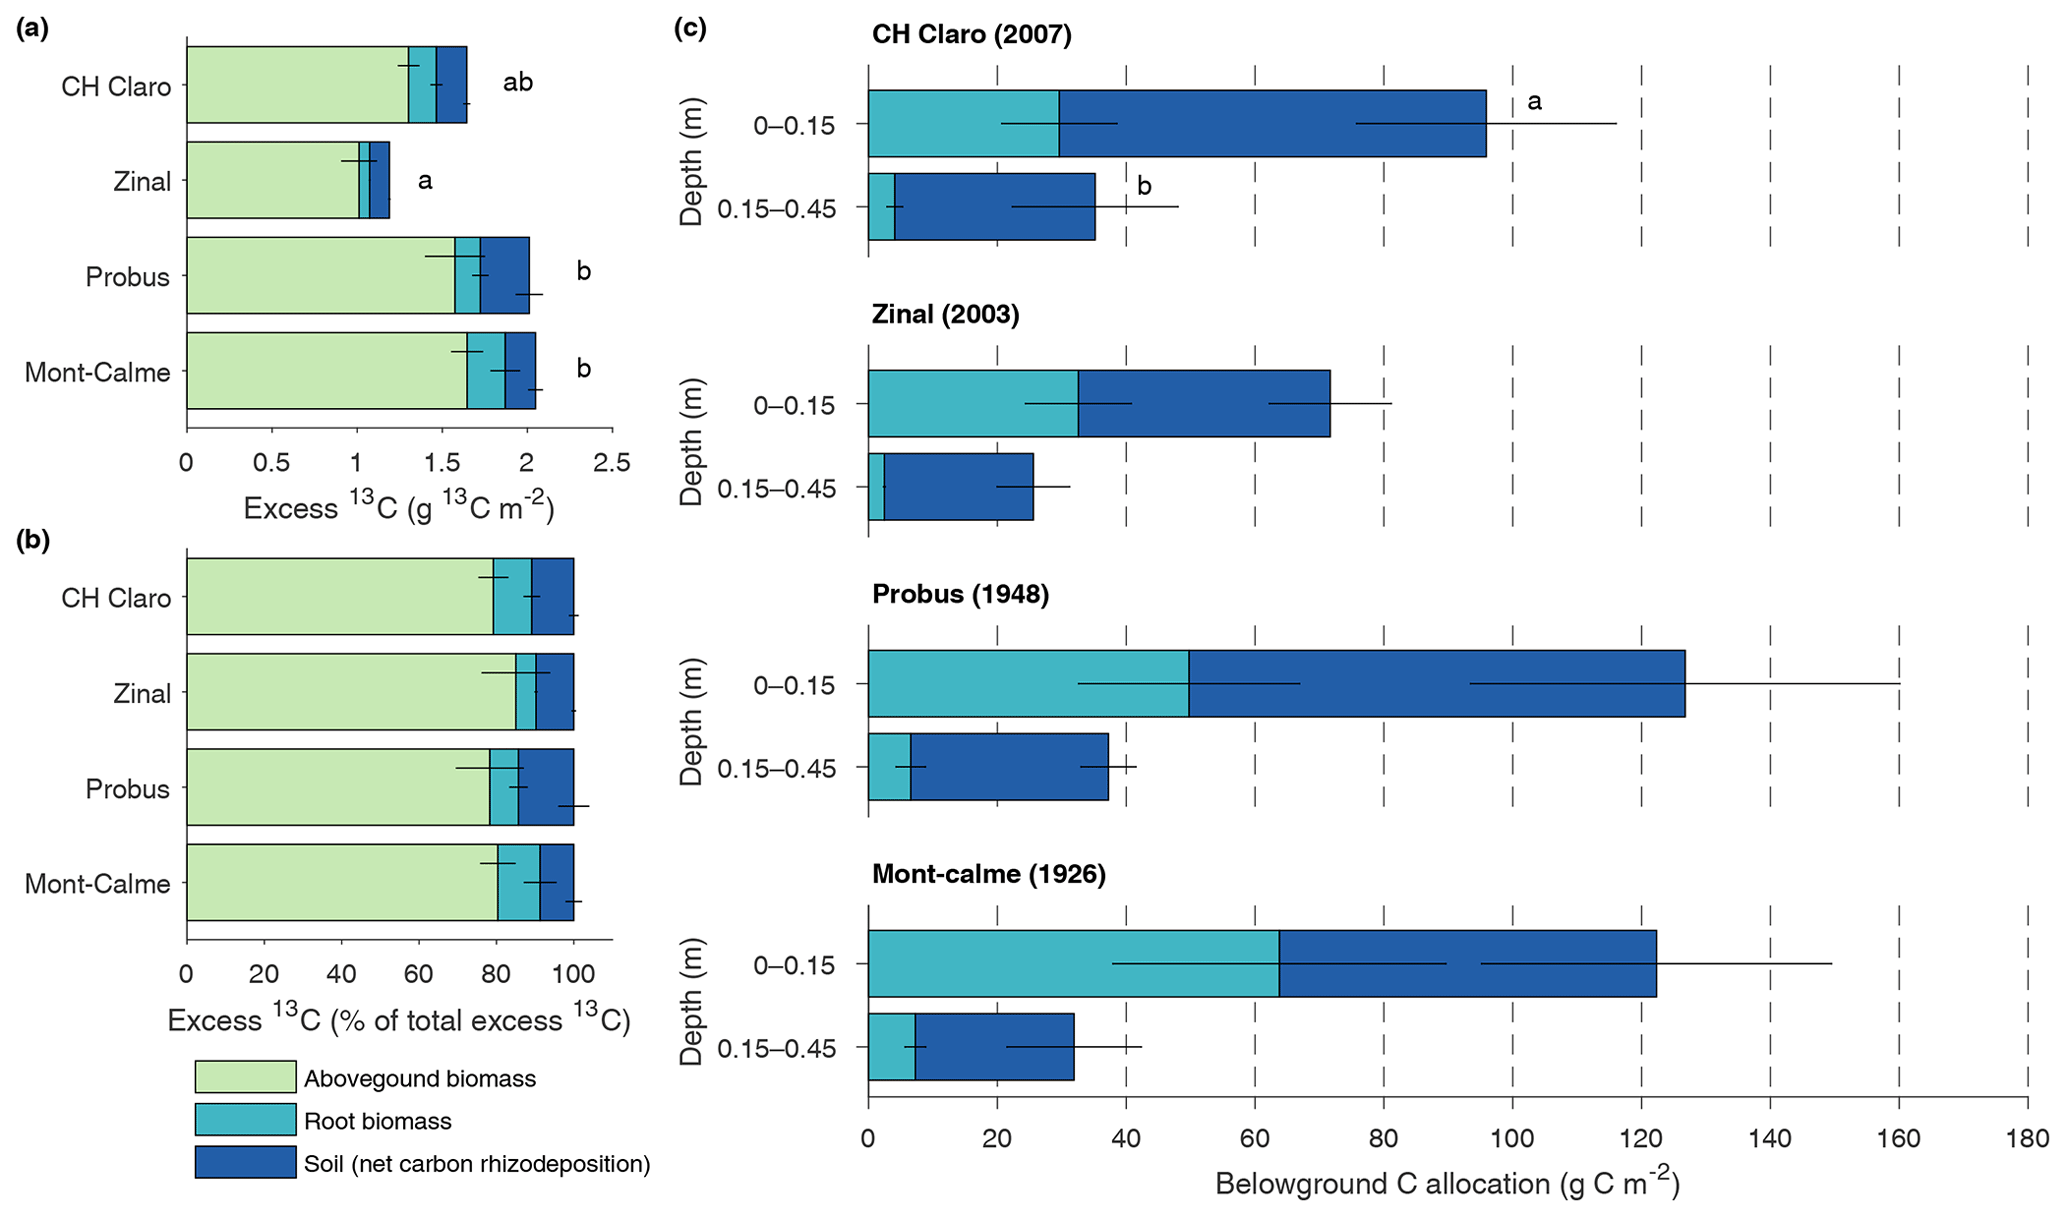
Figure 4Absolute (a) and relative (b) distribution of excess 13C between aboveground biomass, root biomass and soil for the different wheat cultivars. Soil compartments are calculated down to 0.45 m depth. Panel (c) shows the total carbon rhizodeposition and root carbon for the upper two soil layers for the different wheat cultivars (0–0.45 m depth). Error bars represent the standard error (n=3). In (a), letters indicate significant differences between the total amount of excess 13C of the different cultivars. No significant differences in the amount of excess 13C in aboveground biomass, root biomass or soil between the different cultivars were found. In (c), letters are provided when the total belowground C allocation differed between the different depth layers, which was only the case for CH Claro.
The total amount of net carbon rhizodeposition measured at the end of the experiment down to 0.45 m decreased with depth for all wheat cultivars (Fig. 4c), with this difference only being statistically significant for CH Claro. The highest amount of net carbon rhizodeposition was observed for Probus (108±34 g C m−2), followed by CH Claro (97±24 g C m−2), Mont-Calme (83±29 g C m−2) and Zinal (62±11 g C m−2). There was thus no clear relationship between the amount of net carbon rhizodeposition and year of release of the wheat cultivars.
3.5 CO2 concentration and production
Throughout the experiment, the change in the CO2 concentration of the two uppermost soil layers was limited, with average values for the topsoil between 470 and 761 ppm for all cultivars (Fig. 5). Deeper down the lysimeters, relatively constant CO2 concentrations were observed during the first 3 weeks of the experiment, ca. 5000–10 000 ppm. After 3 weeks, subsoil CO2 concentrations abruptly increased and remained high throughout the experiment. These were substantially larger for the older cultivars (with maximum values of ca. 30 000 ppm) compared to the younger cultivars (with maximum values ca. 24 000 ppm).

Figure 5Changes in the CO2 concentration (ppm) in the lysimeters throughout the experiment for the four wheat cultivars. The average CO2 concentration of three replicates are shown (n=3). Dots indicate the measured data points.
Despite these high CO2 concentrations in the subsoil, CO2 production was mainly taking place in the topsoil, with the highest rates of CO2 production between 0.10 and 0.20 m depth for all cultivars (Fig. 6). For the young cultivars (Zinal and CH Claro), 95 % of CO2 was produced above a depth of 0.3 m. In contrast, in older cultivars (Probus and Mont-Calme 268) 95 % of CO2 was produced above a depth of 0.55 and 0.6 m, respectively. Despite these observations, neither the calculated total amount of subsoil CO2 production nor the depth above which 95 % of CO2 was produced was significantly different between any of the cultivars.
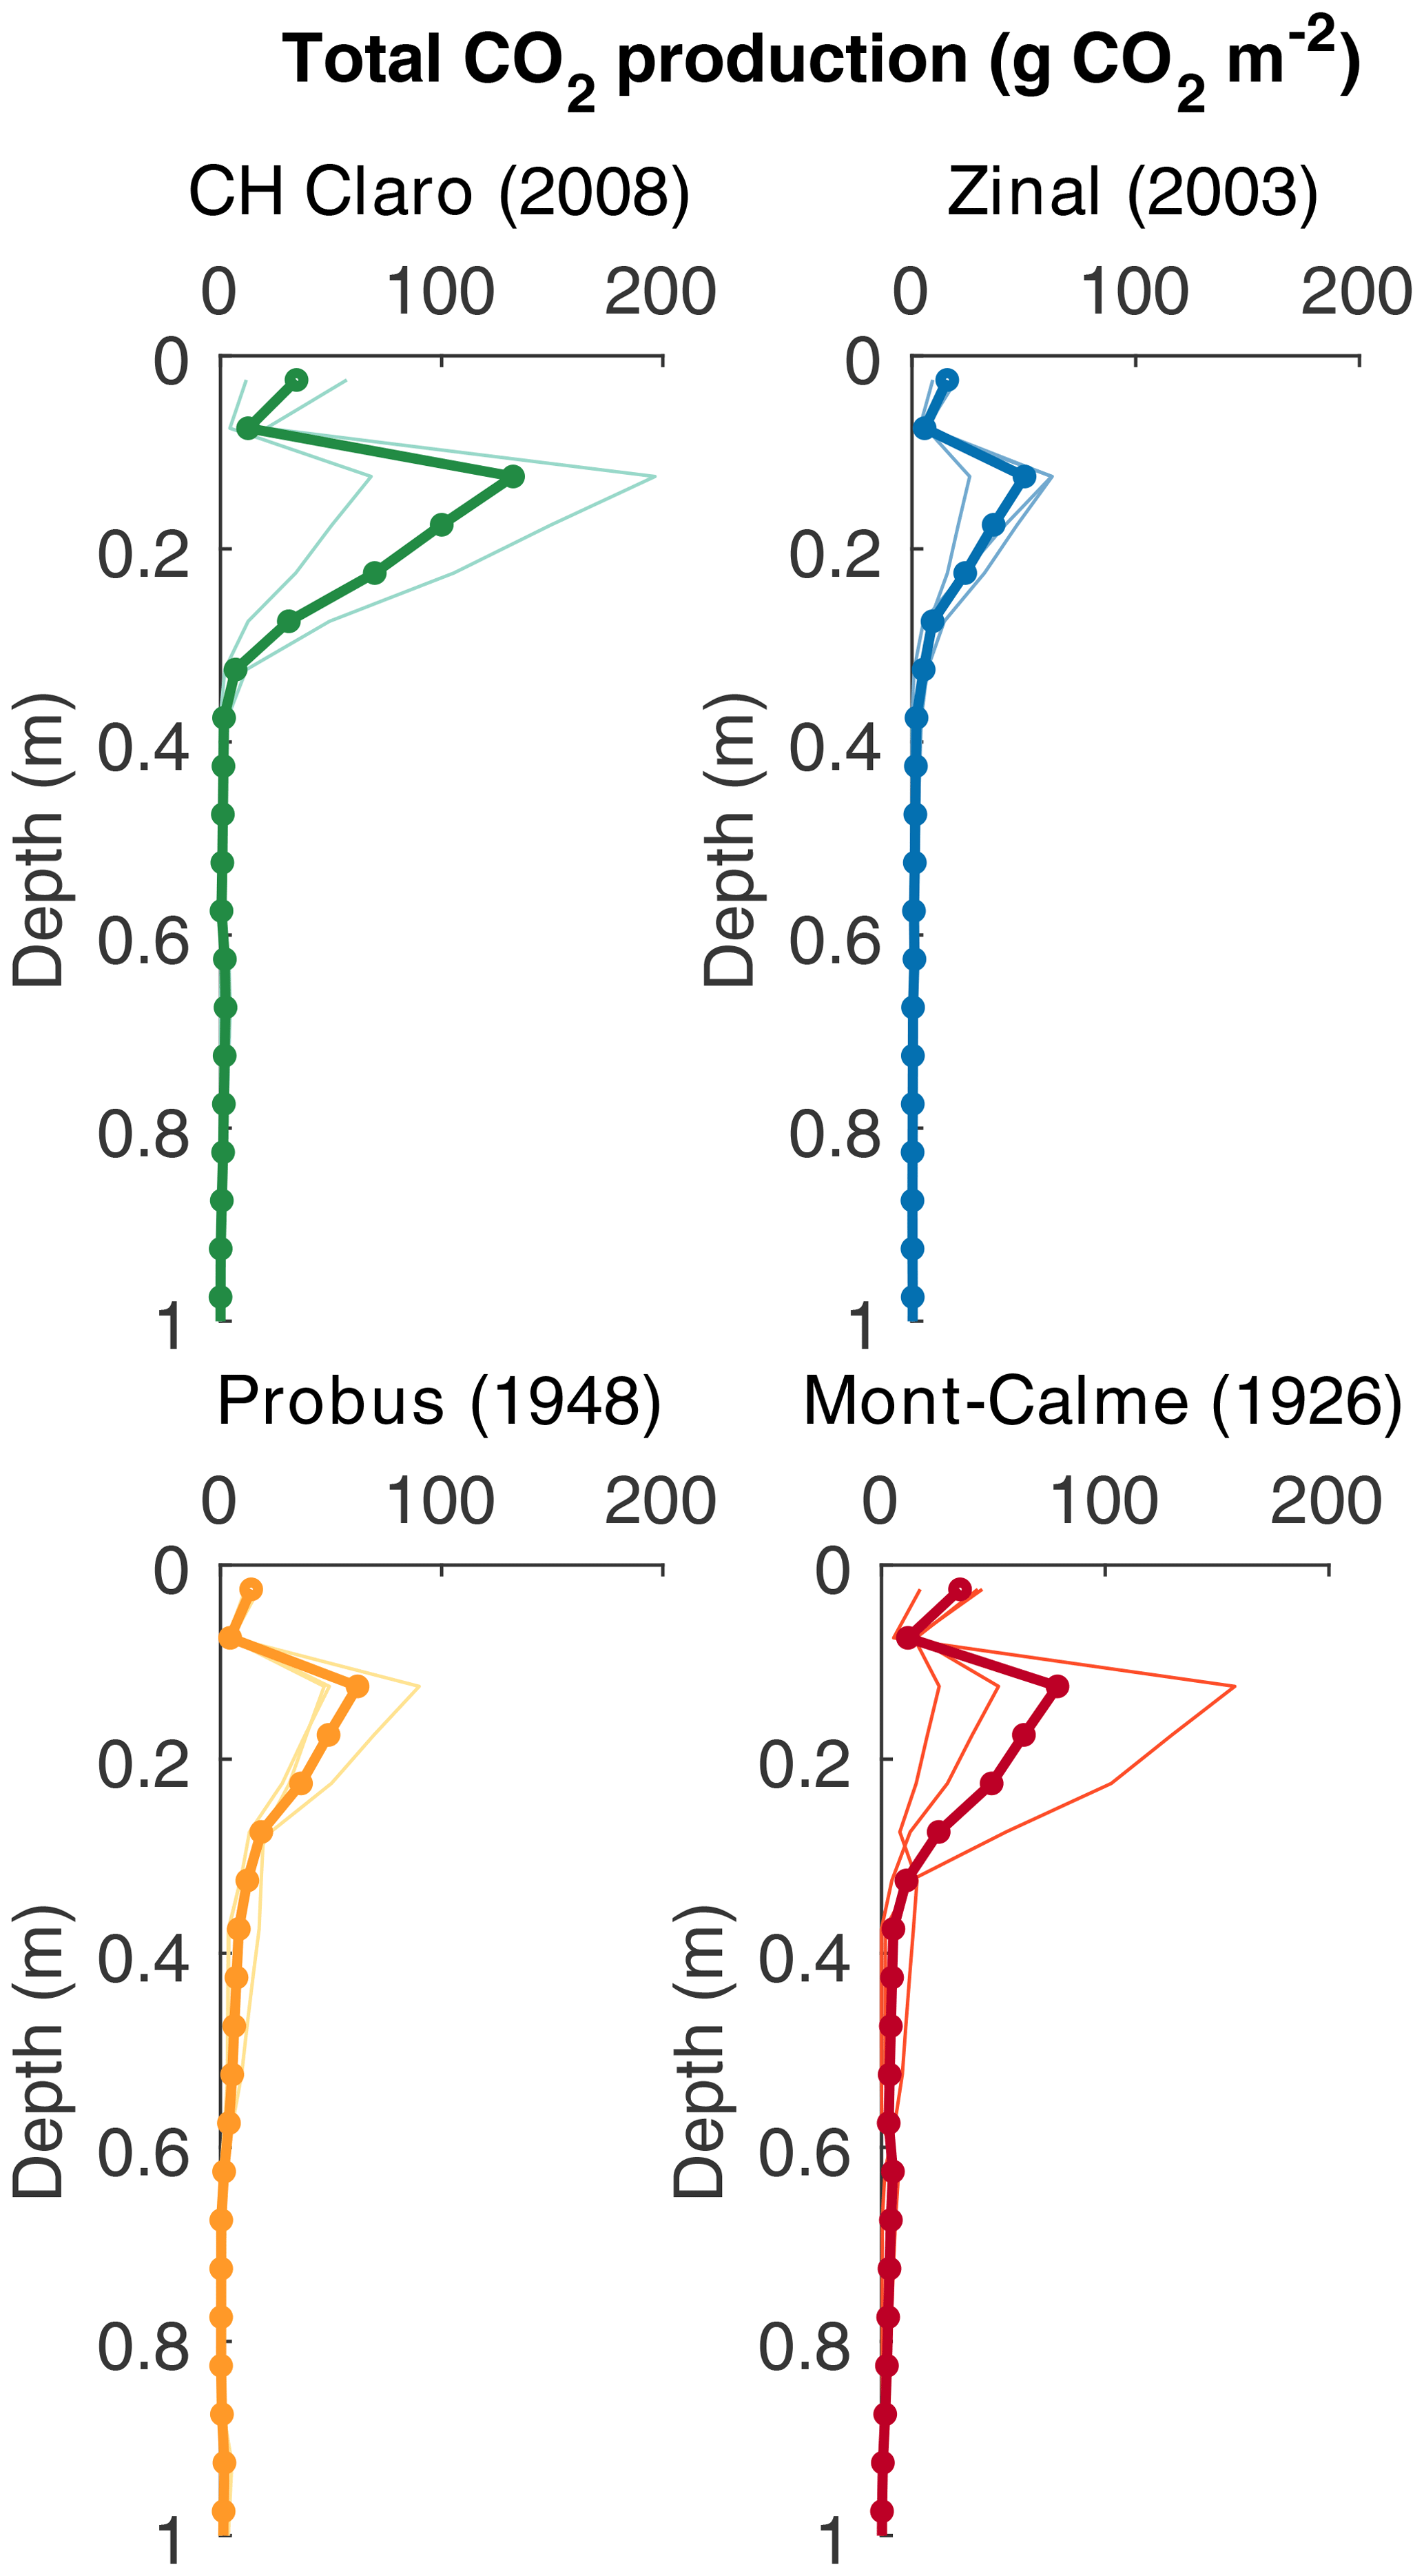
Figure 6Depth profiles of calculated cumulative CO2 production (g CO2 m−2 per 0.05 m depth layer). Dots show the calculated production rates, thin lines show the calculated CO2 production for the individual lysimeters and the thick lines show the average based on three replicates (two for CH Claro).
The aim of the present study was to assess differences in belowground carbon transfer and net rhizodeposition by wheat cultivars with different root biomass and rooting depth. Our results show that although there are marked differences in both the amount of carbon transferred belowground and the timing of belowground carbon transfer, there is no clear relationship between root characteristics and the amount of net rhizodeposition. Therefore, the fate of root biomass might determine the total amount of subsoil carbon stabilization in the long term.
4.1 Plant biomass carbon dynamics and CO2 production
No consistent differences in total aboveground biomass between old and new wheat cultivars were observed. The aboveground biomass values were at the high end of reported values for wheat plants in the field (Mathew et al., 2017), while the lack of consistent differences in the biomass of wheat cultivars released over a time span of multiple decades has generally been observed (Brancourt-Hulmel et al., 2003; Feil, 1992; Lupton et al., 1974; Wacker et al., 2002).
The fraction of biomass in the grain-bearing ears was, however, much larger for the modern wheat cultivars (on average 9 % and 47 % of total aboveground biomass for CH Claro and Zinal respectively) compared to the old wheat cultivars (on average 1 % and 2 % for Mont-Calme 268 and Probus respectively). While an increase in the fraction of biomass allocated to grains is generally observed in old versus modern wheat cultivars (Brancourt-Hulmel et al., 2003; Feil, 1992; Shearman et al., 2005), mostly as a consequence of the introduction of reduced height genes (Tester and Langridge, 2010), the harvest index reported here for the old cultivars might have been underestimated because older cultivars were not yet fully mature at plant harvest.
The total root biomass of the older wheat cultivars was substantially larger compared to the more recent cultivars, although these differences were not consistently significant between all modern and old varieties (Table 1). These differences were mostly apparent in the top 0.45 m of the lysimeters (Fig. 1). It is not clear if the lack of statistically significant differences in the root biomass within the deeper soil layers was due to (i) inability to collect all fine roots from the soil or (ii) actual differences in root biomass. These results are in line with a recent study on the biomass of roots of different wheat cultivars of the Swiss wheat breeding program, including the cultivars used in our experiment (Friedli et al., 2019). This study showed that, under well-watered conditions, older wheat cultivars had a substantially higher root biomass compared to the more recently released wheat cultivars. Similar results have been obtained for wheat cultivars released in, e.g., Australia (Aziz et al., 2017) and other countries around the world (Waines and Ehdaie, 2007). The root : shoot ratios of the wheat cultivars in our study (0.10±0.2–0.19±0.08, Table 1) were at the low end of reported values for wheat plants globally (Mathew et al., 2017) but in line with reported values for wheat cultivars of the Swiss wheat breeding program, including the cultivars used in our study (an average value of 0.14 for all cultivars studied by Friedli et al., 2019).
The maximum rooting depth was similar between the old and recent wheat cultivars (Fig. 1b). This is in contrast with the results from Friedli et al. (2019), who found that the older wheat cultivars had deeper roots (the depth above which 95 % of roots were found (D95) was on average 101 cm) compared to the more recent cultivars included in the present study (average D95 of 85 cm). These differences might partly arise from the different setup used in both studies. Both experiments were carried out in a controlled greenhouse environment, but Friedli et al. (2019) used soil columns with a diameter of 0.11 m, while in our study lysimeters with a diameter of 0.5 m were used. Additional information about subsoil root dynamics could be obtained from the measured depth profiles of the CO2 concentration and 13CO2, with the latter only being measured in the last phase of the experiment. The calculated depth profiles of CO2 production showed that CO2 was being produced down to greater depths under the old wheat cultivars (Fig. 6). Combined with the higher δ13C values of subsoil CO2 of the lysimeters under the old wheat cultivars at the end of the experiment (Fig. 3d), this suggests that the roots of the old wheat cultivars respired CO2 at greater depths compared to the recent wheat cultivars.
The δ13C values of root biomass suggest that the temporal root carbon dynamics of the old and recent wheat cultivars differed substantially (Fig. 2b). The root biomass of the old wheat cultivars had a high δ13C value at all measured depths, indicating that the 13CO2 label was allocated to the roots at all depths throughout the experiment. In contrast, the root biomass of the recent wheat cultivars was greatly enriched in 13C in the top 0.45 m, while deeper roots were much less enriched in 13C. This suggests that both old and more recent wheat cultivars grew roots down to depths of >1 m in the beginning of the experiment (when the total amount of 13C assimilated by the plants was limited), while only the old cultivars kept on allocating carbon down to deep roots (>0.45 m) throughout the experiment (thus having assimilated more 13C over the period of root growth compared to the more recent cultivars). The similar δ13C value of the aboveground biomass of all wheat cultivars (Fig. 2a) suggests that the differences in δ13C values of the root biomass are unlikely to be caused by differences in the relative amount of 13CO2 assimilated by the plants, relative to unlabeled CO2. Thus, these results suggest that old wheat cultivars allocate photosynthates down to their roots throughout a substantial part of the plant growth phase, while this is not the case for more recent cultivars.
4.2 Carbon allocation by wheat plants
The partitioning of the 13C label was very similar between the different wheat cultivars (Fig. 4b). It is noted that the amount of rhizosphere-respired 13CO2 could not be included in these calculations, although this typically accounts for ca. 7 %–14 % of assimilated carbon in crops, or 40 % of total belowground C allocation (Kuzyakov and Domanski, 2000; Pausch and Kuzyakov, 2018). The fraction of assimilated carbon that is transferred belowground reported here is therefore underestimated. The belowground transfer of ca. 20 % of assimilated C for all cultivars is in line with previous studies, which have reported fractions of similar magnitude for wheat plants, when not accounting for rhizosphere CO2 respiration: 18 %–25 % (Hirte et al., 2018), 18 % (as reviewed by Kuzyakov and Domanski, 2000), 15 % (Keith et al., 1986), 17 % (Gregory and Atwell, 1991) and 31 % (Sun et al., 2018). In contrast, reported values of the partitioning of belowground translocated carbon by wheat plants to (i) roots and/or (ii) net rhizodeposition are much more variable, with reported net rhizodeposition carbon as a percentage of total belowground carbon (root carbon and net rhizodeposition carbon combined) for wheat plants between 23 % (as summarized by Kuzyakov and Domanski, 2000) and 72 % (Sun et al., 2018). The results obtained here (68 %) are thus at the high end of reported values. However, they were similar to results from a field study in Switzerland which used two modern Swiss wheat cultivars, among which was CH Claro (58 %; Hirte et al., 2018).
4.3 Rates of net carbon rhizodeposition
The total amount of carbon assimilated by the wheat cultivars that was transferred to roots and soil in the top 0.45 m at the end of the experiment ranged between 97±14 g m−2 (Zinal) and 164±38 g m−2 (Probus) (Table 2). It is noted that the total amount of belowground carbon translocation by the wheat plants is underestimated, as rhizosphere respiration could not be included in our calculations. These numbers are in the range of reported values for wheat plants of 94–295 g m−2 (as summarized by Keith et al., 1986) and the value reported by Kuzyakov and Domanski (2000) (150 g m−2), as well as the reported amount for two recent wheat cultivars of the Swiss wheat breeding program (including CH Claro) of 110–134 g m−2 (Hirte et al., 2018).
Table 2Average belowground carbon allocation (net rhizodeposition and root biomass combined) and net carbon rhizodeposition by the different wheat cultivars, calculated down to a depth of 0.45 m (variation is reported as the standard error, n=3). No statistically significant differences in belowground C allocation or net C rhizodeposition between any of the cultivars were detected.

In contrast to the total amount of carbon translocated belowground, the amount of net carbon rhizodeposition was not consistently different between the old and more recent wheat cultivars (62±11–108±34 g m−2) (Fig. 4, Table 2). These values are higher compared to values calculated by Pausch and Kuzyakov (2018) (18–34 g m−2, depth unknown) and Hirte et al. (2018) (63–73 g m−2; down to 0.75 m depth).
A large uncertainty associated with calculated values of subsoil carbon sequestration using isotopic labeling approaches is related to the assumption that the isotopic enrichment of roots and rhizodeposits is similar (Eq. 4). This simplification is made because of the difficulties in measuring quantitative characteristics of rhizodeposits in a soil medium (Oburger and Jones, 2018) but leads to erroneous calculations of the amount of carbon rhizodeposition when this assumption is violated (Stevenel et al., 2019). To assess the uncertainty of calculated values of subsoil carbon sequestration, we calculated how these values differ when the value of root δ13C is varied with ±25 % (Fig. S5). This results in calculated values of total carbon rhizodeposition, down to a depth of 0.45 m, of 69–105 g m−2 for Mont-Calme 268, 88–138 g m−2 for Probus, 51–78 g m−2 for Zinal and 81–121 g m−2 for CH Claro, or uncertainties in the amount of carbon rhizodeposits between −18 % and +28 %. Further research on the effect of the assumption of using root δ13C values as a proxy for carbon rhizodeposits is thus necessary to better quantify the effect on estimates of carbon sequestration.
4.4 The effect of old and recent wheat cultivars on net carbon rhizodeposition
Our results indicate that the old wheat cultivars, with deeper active roots throughout the experiment and larger root biomass, allocated more assimilated carbon belowground, although the differences were not statistically significant (Fig. 4c, Table 2). However, we found no evidence that wheat cultivars with larger root biomass lead to higher net carbon rhizodeposition (Table 2). Our hypothesis, which stated that wheat cultivars with larger root biomass and deeper roots would lead to larger amounts of net carbon rhizodeposition, could therefore not be confirmed.
The total amount of OC that will be stabilized in the soil by the studied wheat cultivars will therefore depend on the long-term fate of the root biomass. The root biomass was higher for the old wheat cultivars, although these differences were mainly limited to the upper 0.45 m of the soil. Due to the destructive sampling of vegetation and soil at the end of the experiment, the fate of root biomass after harvest could not be assessed. Based on the results, one could therefore hypothesize that the higher root biomass of old wheat cultivars would lead to larger rates of carbon sequestration in the long term. Similarly, Mathew et al. (2017) suggested that growing grasses and maize plants would lead to larger SOC stocks because these plants have the highest total and root biomass compared to growing crops with a lower biomass. However, it is not straightforward to make predictions about the amount of root biomass that will be stabilized in the soil in the long term, as this depends on the efficiency with which plant-derived biomass is incorporated in microbial biomass (Cotrufo et al., 2013) and interactions between soil depth, the microbial community composition and its substrate preference (e.g., Kramer and Gleixner, 2008), among other factors. During the past century, there has been a continuing increase in the importance of wheat cultivars with smaller root biomass (Fossati and Brabant, 2003; Friedli et al., 2019; Waines and Ehdaie, 2007). This can have profound implications for OC stocks of soils under wheat cultivation, as rhizodeposition and root-derived carbon are the most important inputs of OC to the soil (Kong and Six, 2010). Testing the long-term effect of the gradual change in wheat cultivars on OC inputs to the soil would thus require experiments that run over multiple growing seasons and allow the quantification of the amount of root carbon that is eventually stabilized in the soil.
Correct knowledge on the amount of OC that is transferred belowground by plants is necessary to reliably model SOC dynamics. However, this knowledge is currently limited and changes in belowground carbon allocation due to the cultivation of different cultivars are generally not considered in SOC models. Moreover, it has recently been shown that accounting for changes in belowground carbon allocation by relating this to changes in aboveground biomass does not improve model results (Taghizadeh-Toosi et al., 2016). Rather, it has been suggested that more reliable model results are obtained when crop-specific amounts of belowground carbon allocation are used, independent of aboveground biomass production (Taghizadeh-Toosi et al., 2016). Since model results are very sensitive to the amount of carbon inputs (Keel et al., 2017), and cereal crops are grown on ca. 20 % of croplands globally (Leff et al., 2004) (covering ca. 12 % of global land mass and storing ca. 10 % of global SOC in the upper meter of soil; Govers et al., 2013), a correct assessment of a potential decrease in belowground carbon inputs by wheat plants over the past century through the cultivation of different cultivars will have important implications for the simulation of changes in SOC on the global scale.
Assessing the overall impact of the past evolution of wheat cultivars on SOC stocks also requires taking into account the amount of land needed to produce sufficient food. For example, if future research would show that more recent wheat cultivars lead to less SOC stabilization compared to older cultivars, this does not necessarily imply a net loss of SOC as a consequence of the historical shift to planting recently developed wheat cultivars. If the aim is to increase overall SOC stocks, it might be more favorable to grow high-yield wheat cultivars that sequester less OC per unit area compared to a low-yielding cultivar, if this results in a larger area of arable land that can be taken out of cultivation. This land can be put under native vegetation, such as forest or grassland, which stores substantially more SOC compared to arable land (Jobbágy and Jackson, 2000).
In this study, four different wheat cultivars were grown in lysimeters and labeled with 13CO2 using repeated pulse labeling to quantify the effect of rooting depth and root biomass on net carbon rhizodeposition. Our results show that there is no clear trend between the time of cultivar development and the amount of net carbon rhizodeposition, with large variabilities being observed between replicates of the same cultivars. Based on these results, the hypothesis that wheat cultivars with a larger root biomass and deeper roots would promote net carbon rhizodeposition was rejected. An important remaining uncertainty is related to the fate of root biomass after harvest, which might contribute to the stabilized SOC pool over the long term.
Additional figures and tables can be found in the Supplement. The data associated with this paper are available in the Supplement and at https://doi.org/10.17632/75f349dpdr.2 (Van de Broek and Ghiasi, 2020).
The supplement related to this article is available online at: https://doi.org/10.5194/bg-17-2971-2020-supplement.
CD, SA, AH, CF and JS conceived the idea for the study. CD set up the lysimeter and labeling experiments and collected the data. SG, CD, SA and RAW performed lab analyses. MVdB, SG, CD and JS analyzed and interpreted the data and performed the statistics. MVdB and SG wrote the paper, with contributions from CD, AH, SA, JS, CF and RAW. MVdB and SG contributed equally to this paper.
The authors declare that they have no conflict of interest.
The authors are very grateful to Matti Barthel, Benjamin Wild and Christopher Mikita for their help with setting up the lysimeters, data collection and interpretation. The authors also appreciate the Grassland Sciences Group of ETH Zürich for providing the laboratory facility to perform part of the analyses performed in this study. We thank Brigitta Herzog and Hansueli Zellweger for their help with greenhouse management and plant protection at the ETH Research Station for Plant Sciences in Lindau. Stefan Karlowsky and one anonymous reviewer are thanked for their comprehensive feedback, which improved the quality of this paper.
This research has been supported by Plant Fellows, a postdoctoral fellowship administered by the Zurich Basel Plant Science Center and funded under the European Union's Seventh Framework Programme for research, technological development and demonstration (grant no. GA-2010-267243 – Plant Fellows); the Swiss National Science Foundation (project numbers 205321_153545 “CarIN” and 200021_160232); and ETH core start-up funds provided to Johan Six.
This paper was edited by Sara Vicca and reviewed by Stefan Karlowsky and one anonymous referee.
Aziz, M. M., Palta, J. A., Siddique, K. H. M., and Sadras, V. O.: Five decades of selection for yield reduced root length density and increased nitrogen uptake per unit root length in Australian wheat varieties, Plant Soil, 413, 181–192, https://doi.org/10.1007/s11104-016-3059-y, 2017.
Baloch, D. M., Karow, R. S., Marx, E., Kling, J. G., and Witt, M. D.: Vernalization Studies with Pacific Northwest Wheat, Agron. J., 95, 1201–1208, https://doi.org/10.2134/agronj2003.1201, 2003.
Brancourt-Hulmel, M., Doussinault, G., Lecomte, C., Bérard, P., Le Buanec, B., and Trottet, M.: Genetic improvement of agronomic traits of winter wheat cultivars released in France from 1946 to 1992, Crop Sci., 43, 37–45, 2003.
Bromand, S., Whalen, J. K., Janzen, H. H., Schjoerring, J. K., and Ellert, B. H.: A pulse-labelling method to generate 13C-enriched plant materials, Plant Soil, 235, 253–257, https://doi.org/10.1023/A:1011922103323, 2001.
Brooks, P. D., Geilmann, H., Werner, R. A., and Brand, W. A.: Improved precision of coupled δ13C and δ15N measurements from single samples using an elemental analyzer/isotope ratio mass spectrometer combination with a post-column six-port valve and selective CO2 trapping; improved halide robustness of the combustion, Rapid Commun. Mass Sp., 17, 1924–1926, https://doi.org/10.1002/rcm.1134, 2003.
Chen, S., Martin, M. P., Saby, N. P. A., Walter, C., Angers, D. A., and Arrouays, D.: Fine resolution map of top- and subsoil carbon sequestration potential in France, Sci. Total Environ., 630, 389–400, https://doi.org/10.1016/j.scitotenv.2018.02.209, 2018.
Chenu, C., Angers, D. A., Barré, P., Derrien, D., Arrouays, D., and Balesdent, J.: Increasing organic stocks in agricultural soils: Knowledge gaps and potential innovations, Soil Till. Res., 188, 41–52, https://doi.org/10.1016/j.still.2018.04.011, 2018.
Cholick, F. A., Welsh, J. R., and Cole, C. V.: Rooting Patterns of Semi-dwarf and Tall Winter Wheat Cultivars under Dryland Field Conditions, Crop Sci., 17, 637–639, 1977.
Coplen, T. B.: Guidelines and recommended terms for expression of stable-isotope-ratio and gas-ratio measurement results, Rapid Commun. Mass Sp., 25, 2538–2560, https://doi.org/10.1002/rcm.5129, 2011.
Cotrufo, M. F., Wallenstein, M. D., Boot, C. M., Denef, K., and Paul, E.: The Microbial Efficiency-Matrix Stabilization (MEMS) framework integrates plant litter decomposition with soil organic matter stabilization: Do labile plant inputs form stable soil organic matter?, Glob. Change Biol., 19, 988–995, https://doi.org/10.1111/gcb.12113, 2013.
Dean, A., Morris, M., Stufken, J., and Bingham, D. (Eds.): Handbook of design and analysis of experiments, CRC Press, Boca Raton, FL, 2015.
de Graaff, M.-A., Van Kessel, C., and Six, J.: Rhizodeposition-induced decomposition increases N availability to wild and cultivated wheat genotypes under elevated CO2, Soil Biol. Biochem., 41, 1094–1103, https://doi.org/10.1016/j.soilbio.2009.02.015, 2009.
Don, A., Schu, J., and Freibauer, A.: Impact of tropical land-use change on soil organic carbon stocks – a meta-analysis, Glob. Change Biol., 17, 1658–1670, https://doi.org/10.1111/j.1365-2486.2010.02336.x, 2011.
Feil, B.: Breeding Progress in Small Grain Cereals – A Comparison of Old and Modern Cultivars, Plant Breed., 108, 1–11, 1992.
Fontaine, S., Barot, S., Barré, P., Bdioui, N., Mary, B., and Rumpel, C.: Stability of organic carbon in deep soil layers controlled by fresh carbon supply, Nature, 450, 277–280, https://doi.org/10.1038/nature06275, 2007.
Fossati, D. and Brabant, C.: La sélection du blé en Suisse Le programme des stations fédérales Une progression impressionnante, Rev. Suisse Agric., 35, 169–180, 2003.
Friedli, C. N., Abiven, S., Fossati, D., and Hund, A.: Modern wheat semi-dwarfs root deep on demand: response of rooting depth to drought in a set of Swiss era wheats covering 100 years of breeding, Euphytica, 215, 1–15, https://doi.org/10.1007/s10681-019-2404-7, 2019.
Goffin, S., Aubinet, M., Maier, M., Plain, C., Schack-Kirchner, H., and Longdoz, B.: Characterization of the soil CO2 production and its carbon isotope composition in forest soil layers using the flux-gradient approach, Agr. Forest Meteorol., 188, 45–57, https://doi.org/10.1016/j.agrformet.2013.11.005, 2014.
Govers, G., Merckx, R., Van Oost, K., and van Wesemael, B.: Managing Soil Organic Carbon for Global Benefits: A STAP Technical Report, Global Environmental Facility, Washington, D.C., 2013.
Gregory, P. J. and Atwell, B. J.: The fate of carbon in pulse-labelled crops of barley and wheat, Plant Soil, 136, 205–213, https://doi.org/10.1007/BF02150051, 1991.
Guo, L. B. and Gifford, R. M.: Soil carbon stocks and land use change: a meta analysis, Glob. Change Biol., 8, 345–360, https://doi.org/10.1046/j.1354-1013.2002.00486.x, 2002.
Hirte, J., Leifeld, J., Abiven, S., Oberholzer, H.-R., and Mayer, J.: Below ground carbon inputs to soil via root biomass and rhizodeposition of field-grown maize and wheat at harvest are independent of net primary productivity, Agr. Ecosyst. Environ., 265, 556–566, https://doi.org/10.1016/j.agee.2018.07.010, 2018.
Hu, T., Sørensen, P., Wahlström, E. M., Chirinda, N., Sharif, B., Li, X., and Olesen, J. E.: Root biomass in cereals, catch crops and weeds can be reliably estimated without considering aboveground biomass, Agr. Ecosyst. Environ., 251, 141–148, https://doi.org/10.1016/j.agee.2017.09.024, 2018.
Janzen, H. H. and Bruinsma, Y.: Methodology for the quantification of root and rhizosphere nitrogen dynamics by exposure of shoots to 15N-labelled ammonia, Soil Biol. Biochem., 21, 189–196, https://doi.org/10.1016/0038-0717(89)90094-1, 1989.
Jobbágy, E. G. and Jackson, R. B.: The vertical distribution of soil organic carbon and its relation to climate and vegetation, Ecol. Appl., 10, 423–436, https://doi.org/10.1890/1051-0761(2000)010[0423:TVDOSO]2.0.CO;2, 2000.
Jones, D. L., Nguyen, C., and Finlay, R. D.: Carbon flow in the rhizosphere: carbon trading at the soil–root interface, Plant Soil, 321, 5–33, https://doi.org/10.1007/s11104-009-9925-0, 2009.
Keel, S. G., Leifeld, J., Mayer, J., Taghizadeh-Toosi, A., and Olesen, J. E.: Large uncertainty in soil carbon modelling related to method of calculation of plant carbon input in agricultural systems, Eur. J. Soil Sci., 68, 953–963, https://doi.org/10.1111/ejss.12454, 2017.
Keith, H., Oades, J. M., and Martin, J. K.: Input of carbon to soil from wheat plants, Soil Biol. Biochem., 18, 445–449, 1986.
Kell, D. B.: Breeding crop plants with deep roots: their role in sustainable carbon, nutrient and water sequestration, Ann. Bot., 108, 407–418, https://doi.org/10.1093/aob/mcr175, 2011.
Kohn, M. J.: Carbon isotope compositions of terrestrial C3 plants as indicators of (paleo)ecology and (paleo)climate, P. Natl. Acad. Sci. USA, 107, 19691–19695, https://doi.org/10.1073/pnas.1004933107, 2010.
Kong, A. Y. Y. and Six, J.: Tracing Root vs. Residue Carbon into Soils from Conventional and Alternative Cropping Systems, Soil Sci. Soc. Am. J., 74, 1201, https://doi.org/10.2136/sssaj2009.0346, 2010.
Kong, A. Y. Y. and Six, J.: Microbial community assimilation of cover crop rhizodeposition within soil microenvironments in alternative and conventional cropping systems, Plant Soil, 356, 315–330, https://doi.org/10.1007/s11104-011-1120-4, 2012.
Kong, A. Y. Y., Six, J., Bryant, D. C., Denison, R. F., and van Kessel, C.: The Relationship between Carbon Input, Aggregation, and Soil Organic Carbon Stabilization in Sustainable Cropping Systems, Soil Sci. Soc. Am. J., 69, 1078–1085, https://doi.org/10.2136/sssaj2004.0215, 2005.
Kramer, C. and Gleixner, G.: Soil organic matter in soil depth profiles: Distinct carbon preferences of microbial groups during carbon transformation, Soil Biol. Biochem., 40, 425–433, https://doi.org/10.1016/j.soilbio.2007.09.016, 2008.
Kuzyakov, Y.: Sources of CO2 efflux from soil and review of partitioning methods, Soil Biol. Biochem., 38, 425–448, https://doi.org/10.1016/j.soilbio.2005.08.020, 2006.
Kuzyakov, Y. and Domanski, G.: Carbon Input By Plants in the Soil. Review, J. Plant Nutr. Soil Sci., 163, 421–431, https://doi.org/10.1002/1522-2624(200008)163:4<421::AID-JPLN421>3.0.CO;2-R, 2000.
Leff, B., Ramankutty, N., and Foley, J. A.: Geographic distribution of major crops across the world, Global Biogeochem. Cy., 18, 1–27, https://doi.org/10.1029/2003GB002108, 2004.
Lehtinen, T., Schlatter, N., Baumgarten, A., Bechini, L., Krüger, J., Grignani, C., Zavattaro, L., Costamagna, C., and Spiegel, H.: Effect of crop residue incorporation on soil organic carbon and greenhouse gas emissions in European agricultural soils, Soil Use Manage., 30, 524–538, https://doi.org/10.1111/sum.12151, 2014.
Le Quéré, C., Andrew, R. M., Friedlingstein, P., Sitch, S., Pongratz, J., Manning, A. C., Korsbakken, J. I., Peters, G. P., Canadell, J. G., Jackson, R. B., Boden, T. A., Tans, P. P., Andrews, O. D., Arora, V. K., Bakker, D. C. E., Barbero, L., Becker, M., Betts, R. A., Bopp, L., Chevallier, F., Chini, L. P., Ciais, P., Cosca, C. E., Cross, J., Currie, K., Gasser, T., Harris, I., Hauck, J., Haverd, V., Houghton, R. A., Hunt, C. W., Hurtt, G., Ilyina, T., Jain, A. K., Kato, E., Kautz, M., Keeling, R. F., Klein Goldewijk, K., Körtzinger, A., Landschützer, P., Lefèvre, N., Lenton, A., Lienert, S., Lima, I., Lombardozzi, D., Metzl, N., Millero, F., Monteiro, P. M. S., Munro, D. R., Nabel, J. E. M. S., Nakaoka, S., Nojiri, Y., Padin, X. A., Peregon, A., Pfeil, B., Pierrot, D., Poulter, B., Rehder, G., Reimer, J., Rödenbeck, C., Schwinger, J., Séférian, R., Skjelvan, I., Stocker, B. D., Tian, H., Tilbrook, B., Tubiello, F. N., van der Laan-Luijkx, I. T., van der Werf, G. R., van Heuven, S., Viovy, N., Vuichard, N., Walker, A. P., Watson, A. J., Wiltshire, A. J., Zaehle, S., and Zhu, D.: Global Carbon Budget 2017, Earth Syst. Sci. Data, 10, 405–448, https://doi.org/10.5194/essd-10-405-2018, 2018.
Lupton, F. G. H., Oliver, R. H., Ellis, F. B., Barnes, B. T., Howse, K. R., Welbank, P. J., and Taylor, P. J.: Root and shoot growth of semi-dwarf and taller winter wheats, Ann. Appl. Biol., 77, 129–144, 1974.
Massman, W. J.: A review of the molecular diffusivities of H2O, CO2, CH4, CO, O3, SO2, NH3, N2O, NO, and NO2 in air, O2 and N2 near STP, Atmos. Environ., 32, 1111–1127, https://doi.org/10.1016/S1352-2310(97)00391-9, 1998.
Mathew, I., Shimelis, H., Mutema, M., and Chaplot, V.: What crop type for atmospheric carbon sequestration: Results from a global data analysis, Agr. Ecosyst. Environ., 243, 34–46, https://doi.org/10.1016/j.agee.2017.04.008, 2017.
Minasny, B., Malone, B. P., McBratney, A. B., Angers, D. A., Arrouays, D., Chambers, A., Chaplot, V., Chen, Z.-S., Cheng, K., Das, B. S., Field, D. J., Gimona, A., Hedley, C. B., Hong, S. Y., Mandal, B., Marchant, B. P., Martin, M., McConkey, B. G., Mulder, V. L., O'Rourke, S., Richer-de-Forges, A. C., Odeh, I., Padarian, J., Paustian, K., Pan, G., Poggio, L., Savin, I., Stolbovoy, V., Stockmann, U., Sulaeman, Y., Tsui, C.-C., Vågen, T.-G., van Wesemael, B., and Winowiecki, L.: Soil carbon 4 per mille, Geoderma, 292, 59–86, https://doi.org/10.1016/j.geoderma.2017.01.002, 2017.
Moldrup, P., Olesen, T., Gamst, J., Schjønning, P., Yamaguchi, T., and Rolston, D. E.: Predicting the Gas Diffusion Coefficient in Repacked Soil, Soil Sci. Soc. Am. J., 64, 1588–1594, https://doi.org/10.2136/sssaj2000.6451588x, 2000.
Oburger, E. and Jones, D. L.: Sampling root exudates – Mission impossible?, Rhizosphere, 6, 116–133, https://doi.org/10.1016/j.rhisph.2018.06.004, 2018.
Pausch, J. and Kuzyakov, Y.: Carbon input by roots into the soil: Quantification of rhizodeposition from root to ecosystem scale, Glob. Change Biol., 24, 1–12, https://doi.org/10.1111/gcb.13850, 2018.
Paustian, K., Lehmann, J., Ogle, S., Reay, D., Robertson, G. P., and Smith, P.: Climate-smart soils, Nature, 532, 49–57, https://doi.org/10.1038/nature17174, 2016.
Poeplau, C. and Don, A.: Carbon sequestration in agricultural soils via cultivation of cover crops – A meta-analysis, Agr. Ecosyst. Environ., 200, 33–41, https://doi.org/10.1016/j.agee.2014.10.024, 2015.
Poeplau, C., Don, A., Vesterdal, L., Le, J., van Wesemael, B., Schumacher, J., and Gensior, A.: Temporal dynamics of soil organic carbon after land-use change in the temperate zone – carbon response functions as a model approach, Glob. Change Biol., 17, 2415–2427, https://doi.org/10.1111/j.1365-2486.2011.02408.x, 2011.
R Core Team: R: A language and environment for statistical computing. R Foundation for Statistical Computing, Vienna, Austria, available at: https://www.R-project.org/ (last access: 28 May 2020), 2019.
Ruehr, N. K., Offermann, C. A., Gessler, A., Winkler, J. B., Ferrio, J. P., Buchmann, N., and Barnard, R. L.: Drought effects on allocation of recent carbon: from beech leaves to soil CO2 efflux, New Phytol., 184, 950–961, https://doi.org/10.1111/j.1469-8137.2009.03044.x, 2009.
Sandén, T., Spiegel, H., Stüger, H.-P., Schlatter, N., Haslmayr, H.-P., Zavattaro, L., Grignani, C., Bechini, L., D'Hose, T., Molendijk, L., Pecio, A., Jarosz, Z., Guzmán, G., Vanderlinden, K., Giráldez, J. V., Mallast, J., and ten Berge, H.: European long-term field experiments: knowledge gained about alternative management practices, edited by: Aitkenhead, M., Soil Use Manage., 34, 167–176, https://doi.org/10.1111/sum.12421, 2018.
Shearman, V. J., Sylvester-bradley, R., Scott, R. K., and Foulkes, M. J.: Physiological Processes Associated with Wheat Yield Progress in the UK, Crop Sci., 45, 175–185, 2005.
Stevenel, P., Frossard, E., Abiven, S., Rao, I. M., Tamburini, F., and Oberson, A.: Using a Tri-Isotope (13C, 15N, 33P) Labelling Method to Quantify Rhizodeposition, in: Methods in Rhizosphere Biology Research, edited by: Reinhardt, D. and Sharma, A. K., 169–195, Springer, Singapore, 2019.
Studer, M. S., Siegwolf, R. T. W., and Abiven, S.: Carbon transfer, partitioning and residence time in the plant-soil system: a comparison of two 13CO2 labelling techniques, Biogeosciences, 11, 1637–1648, https://doi.org/10.5194/bg-11-1637-2014, 2014.
Sun, Z., Chen, Q., Han, X., Bol, R., Qu, B., and Meng, F.: Allocation of photosynthesized carbon in an intensively farmed winter wheat–soil system as revealed by 14CO2 pulse labelling, Sci. Rep.-UK, 8, 1–10, https://doi.org/10.1038/s41598-018-21547-y, 2018.
Swinnen, J., van Veen, J. A., and Merckx, R.: 14C pulse-labeling of field-grown spring wheat: an evaluation of its use in rhizosphere carbon budget estimations, Soil Biol. Biochem., 26, 161–170, 1994.
Taghizadeh-Toosi, A., Christensen, B. T., Glendining, M., and Olesen, J. E.: Consolidating soil carbon turnover models by improved estimates of belowground carbon input, Sci. Rep.-UK, 6, 1–7, https://doi.org/10.1038/srep32568, 2016.
Tester, M. and Langridge, P.: Breeding technologies to increase crop production in a changing world, Science, 327, 818–822, https://doi.org/10.1126/science.1183700, 2010.
Tubiello, F. N., Salvatore, M., Ferrara, A. F., House, J., Federici, S., Rossi, S., Biancalani, R., Condor Golec, R. D., Jacobs, H., Flammini, A., Prosperi, P., Cardenas-Galindo, P., Schmidhuber, J., Sanz Sanchez, M. J., Srivastava, N., and Smith, P.: The Contribution of Agriculture, Forestry and other Land Use activities to Global Warming, 1990–2012, Glob. Change Biol., 21, 2655–2660, https://doi.org/10.1111/gcb.12865, 2015.
Vance, E. D., Brookes, P. C., and Jenkinson, D. S.: An extraction method for measuring soil microbial biomass C, Soil Biol. Biochem., 19, 703–707, https://doi.org/10.1016/0038-0717(87)90052-6, 1987.
Van de Broek, M. and Ghiasi, S.: Supplementary data for Van de Broek et al. 2020, Biogeosciences, Mendeley Data, v2, https://doi.org/10.17632/75f349dpdr.2, 2020.
Wacker, L., Jacomet, S., and Körner, C.: Trends in Biomass Fractionation in Wheat and Barley from Wild Ancestors to Modern Cultivars, Plant Biol., 4, 258–265, https://doi.org/10.1055/s-2002-25735, 2002.
Waines, J. G. and Ehdaie, B.: Domestication and Crop Physiology: Roots of Green-Revolution Wheat, Ann. Bot., 100, 991–998, https://doi.org/10.1093/aob/mcm180, 2007.
Wasson, A. P., Richards, R. A., Chatrath, R., Misra, S. C., Prasad, S. V. S., Rebetzke, G. J., Kirkegaard, J. A., Christopher, J., and Watt, M.: Traits and selection strategies to improve root systems and water uptake in water-limited wheat crops, J. Exp. Bot., 63, 3485–3498, https://doi.org/10.1093/jxb/ers111, 2012.
Werner, R. A. and Brand, W. A.: Referencing strategies and techniques in stable isotope ratio analysis, Rapid Commun. Mass Sp., 15, 501–519, https://doi.org/10.1002/rcm.258, 2001.
Werner, R. A., Bruch, B. A., and Brand, W. A.: ConFlo III – an interface for high precision δ13C and δ15N analysis with an extended dynamic range, Rapid Commun. Mass Sp., 13, 1237–1241, https://doi.org/10.1002/(SICI)1097-0231(19990715)13:13<1237::AID-RCM633>3.0.CO;2-C, 1999.
Zeeman, M. J., Werner, R. A., Eugster, W., Siegwolf, R. T. W., Wehrle, G., Mohn, J., and Buchmann, N.: Optimization of automated gas sample collection and isotope ratio mass spectrometric analysis of δ13C of CO2 in air, Rapid Commun. Mass Sp., 22, 3883–3892, https://doi.org/10.1002/rcm.3772, 2008.