the Creative Commons Attribution 4.0 License.
the Creative Commons Attribution 4.0 License.
 | 13 Aug 2020
Soils from cold and snowy temperate deciduous forests release more nitrogen and phosphorus after soil freeze–thaw cycles than soils from warmer, snow-poor conditions
Juergen Kreyling
Rhena Schumann
Robert Weigel
The effects of global warming are most pronounced in winter. A reduction in snow cover due to warmer atmospheric temperature in formerly cold ecosystems, however, could counteract an increase in soil temperature by reduction of insulation. Thus, soil freeze–thaw cycles (FTCs) might increase in frequency and magnitude with warming, potentially leading to a disturbance of the soil biota and release of nutrients.
Here, we assessed how soil freeze–thaw magnitude and frequency affect short-term release of nutrients in temperate deciduous forest soils by conducting a three-factorial gradient experiment with ex situ soil samples in climate chambers. The fully crossed experiment included soils from forests dominated by Fagus sylvatica (European beech) that originate from different winter climate (mean coldest month temperature range ΔT>4 K), a range of FTC magnitudes from no (T=4.0 ∘C) to strong ( ∘C) soil frost, and a range of FTC frequencies (f=0–7). We hypothesized that higher FTC magnitude and frequency will increase the release of nutrients. Furthermore, soils from cold climates with historically stable winter soil temperatures due to deep snow cover will be more responsive to FTCs than soils from warmer, more fluctuating winter soil climates.
FTC magnitude and, to a lesser extent, also FTC frequency resulted in increased nitrate, ammonium, and phosphate release almost exclusively in soils from cold, snow-rich sites. The hierarchical regression analyses of our three-factorial gradient experiment revealed that the effects of climatic origin (mean minimum winter temperature) followed a sigmoidal curve for all studied nutrients and was modulated either by FTC magnitude (phosphate) or by FTC magnitude and frequency (nitrate, ammonium) in complex twofold and, for all studied nutrients, in threefold interactions of the environmental drivers. Compared to initial concentrations, soluble nutrients were predicted to increase to 250 % for nitrate (up to 16 µg NO3-N kg−1DM), to 110 % for ammonium (up to 60 µg NH4-N kg−1DM), and to 400 % for phosphate (2.2 µg PO4-P kg−1DM) at the coldest site for the strongest magnitude and highest frequency. Soils from warmer sites showed little nutrient release and were largely unaffected by the FTC treatments except for above-average nitrate release at the warmest sites in response to extremely cold FTC magnitude.
We suggest that currently warmer forest soils have historically already passed the point of high responsiveness to winter climate change, displaying some form of adaptation either in the soil biotic composition or in labile nutrient sources. Our data suggest that previously cold sites, which will lose their protective snow cover during climate change, are most vulnerable to increasing FTC frequency and magnitude, resulting in strong shifts in nitrogen and phosphorus release. In nutrient-poor European beech forests of the studied Pleistocene lowlands, nutrients released over winter may be leached out, inducing reduced plant growth rates in the following growing season.
- Article
(1148 KB) - Full-text XML
-
Supplement
(7062 KB) - BibTeX
- EndNote


Climate is warming overproportionately in northern latitudes and during winter (IPCC, 2013). This has potentially important consequences for nutrient cycling and ecosystem functioning (Kreyling, 2020). Cold-temperate deciduous forests are experiencing more fluctuating soil temperatures and potentially also more frequent soil freeze–thaw cycles (FTCs) with climate change because reduced or completely missing snow cover exposes them to strongly fluctuating air temperatures (Kreyling, 2020). These forests are typically nitrogen limited (Bontemps et al., 2011) with phosphorus co-limitation increasing in the face of nitrogen deposition and climate change (Talkner et al., 2015; Peñuelas et al., 2013). Soil nitrogen and phosphorus release in response to FTC frequency and FTC magnitude of forests differing in their past and present climate is therefore of high ecological and economical importance.
1.1 Winter climate change in the temperate deciduous forests of central Europe
Winters in temperate regions are projected to become warmer, more variable, and wetter, with precipitation increasing and changing from snow to rain (Stocker, 2014; Yang and Christensen, 2012). The largest decreases in snowfall are expected for regions with winter mean air temperatures ranging from −5 to +5 ∘C, while colder regions (boreal, arctic) might even receive increased snowfall (Brown and Mote, 2009; Scherrer and Appenzeller, 2006). The shift from snow to rain drastically reduces soil insulation and exposes soils to the fluctuations of air temperatures (Groffman et al., 2001). While insulation by snow can prevent soil freezing even in boreal climates (Isard and Schaetzl, 1998), missing snow can lead to increased soil frost in regions with sustained air frost (Groffman et al., 2001; Brown and DeGaetano, 2011; Henry, 2008), increased frequency of FTCs in regions where air temperatures fluctuate around 0 ∘C (Henry, 2008; Campbell et al., 2010), or reduced soil frost where even minimum air temperatures rarely drop below the freezing point (Kreyling and Henry, 2011).
1.2 Ecological consequences of altered soil temperatures
Many relevant ecological processes are driven by winter soil temperatures such as activity and survival of organs and organisms (Kreyling, 2010; Campbell et al., 2005). Soil freezing represents an important threshold for microbial activity because of reduced availability of liquid water (Mikan et al., 2002). However, temperatures colder than 0 ∘C are typically required to cause microbial lysis as microbial growth can continue below freezing (McMahon et al., 2009). Sub-lethal effects of freezing on soil microorganisms are not well understood, and the length of freezing, the number of FTCs, and the rate of freezing can all increase cell damage for a given freezing magnitude (Elliott and Henry, 2009; Vestgarden and Austnes, 2009). In addition, soil microorganisms which survive freezing and desiccation can be lethally damaged via osmotic shock upon exposure to meltwater (Jefferies et al., 2010), and the physiological reactivation of microbes when soils are thawing can lead to carbon and nutrient release (Schimel et al., 2007). Consequently, soil freezing can disrupt soil microbial activity (Bolter et al., 2005; Yanai et al., 2004) and affect key microbial processes such as ammonification, nitrification, and denitrification (Urakawa et al., 2014; Watanabe et al., 2019; Hosokawa et al., 2017). Furthermore, soil freezing can damage plant roots (Tierney et al., 2001; Reinmann and Templer, 2018; Kreyling et al., 2012a; Weih and Karlsson, 2002), induce soil nitrogen (N) leaching (Joseph and Henry, 2009; Matzner and Borken, 2008), increase soil trace gas losses (Reinmann and Templer, 2018; Matzner and Borken, 2008), reduce nitrogen uptake by trees (Campbell et al., 2014), decrease plant productivity (Göbel et al., 2019; Comerford et al., 2013; Reinmann et al., 2019), and ultimately lead to plant mortality (Schaberg et al., 2008; Buma et al., 2017). In addition to direct frost damage, the listed consequences of soil freezing on plant performance are commonly explained by altered nutrient, mainly nitrogen and phosphorus, availabilities (Kreyling, 2020). Freezing can also affect release of these nutrients by physically breaking up soil aggregates (Oztas and Fayetorbay, 2003) or organic compounds (Hobbie and Chapin, 1996) and by reducing soil water flow rates (Iwata et al., 2010).
Changes in FTC frequency can affect microbial communities, e.g., increasing saprotrophic fungal activity (Kreyling et al., 2012b). Nitrogen leaching from soil columns subjected to FTCs remaining high even after 10 FTCs further emphasizes the importance of FTC frequency (Joseph and Henry, 2008). A recent meta-analysis indicates that FTCs increase ammonium (+19 %) and nitrate (+18 %) concentrations, nitrate leaching (+67 %), and N2O emissions (+145 %) while soil total nitrogen (−26 %) and microbial biomass nitrogen (−5 %) decreased (Gao et al., 2018). Interestingly, temperate ecosystems appeared to be more responsive than arctic or alpine systems in this study. Taken together, FTCs can affect soil nutrient release through damage and lysis of microbial and plant cells, through altered soil biotic activity, and/or through physical disruption of abiotic and dead organic particles. In particular for nutrient-limited ecosystems, altered occurrence of FTCs with climate change could consequently affect ecosystem functioning.
1.3 Beech forests of Pleistocene lowlands as important and potentially affected ecosystem
Beech forests are the zonal vegetation of temperate central Europe and face multiple anthropogenic pressures while still providing vast ecosystem services (Ammer et al., 2018). Beech (Fagus sylvatica L.) naturally dominates all over central Europe under a wide range of soil conditions and occurs in regions with less than 550 to more than 2000 mm of annual rainfall on nearly all geological substrates if drainage is sufficient (Leuschner et al., 2006). Even when growing on marginal soils, beech forests have a nitrogen demand of about 100 kg-N ha−1 yr−1 which is several times higher than current atmospheric N deposition in European beech forests that ranges from 6 to 45 kg-N ha−1 yr−1 (Rennenberg and Dannenmann, 2015). Nitrogen availability is consequently still the most limiting factor of beech growth at marginal as well as at productive sites (Bontemps et al., 2011). Nitrogen availability is largely determined by internal nitrogen cycling through microbial mineralization and immobilization (Guo et al., 2013). Any alteration in the microbial community and activity, such as in response to FTCs, therefore has the potential to affect nutrient cycling and, thereby, ecosystem functioning of this ecologically and economically important ecosystem (Simon et al., 2017).
Linked to the increased growth of forest trees with nitrogen deposition, phosphorus (P) nutrition is becoming another limiting factor for beech growth in particular on nutrient-poor soils (Talkner et al., 2015). As phosphorus input into unfertilized ecosystems such as forests still relies solely on bedrock weathering while nitrogen and carbon input strongly increases with global change, phosphorus deficiency and unparalleled imbalances in carbon : nitrogen : phosphorus stoichiometry occur (Peñuelas et al., 2013). Generally, increasing substrate nitrogen : phosphorus ratios are related to forest growth declines, and increasing phosphorus limitation with forest age is a global phenomenon (Wardle et al., 2004). Implications of climate change on phosphorus release of beech forest soils should therefore also be investigated.
1.4 Hypotheses
We hypothesized that soil FTCs induce nutrient release following saturation curves with both increased FTC magnitude and increased FTC frequency. We expected the combination of FTC magnitude and FTC frequency to be additive. We further hypothesized that soils from colder macroclimates which are characterized by more persistent and protective snow cover are more responsive in release of nutrients in the face of FTCs than soils from warmer sites with more fluctuating winter soil temperatures.
The effects of FTC magnitude, i.e., the minimum temperature reached during the freezing phase of an FTC, and FTC frequency, i.e., the number of consecutive FTCs, on the short-term release of nutrients in temperate deciduous forest soils was assessed in a three-factorial gradient experiment with ex situ soil samples in climate chambers. The fully crossed experiment included soils from seven forests dominated by Fagus sylvatica (beech) that (1) originate from different winter climates (mean winter minimum temperature range ΔT>4 K) and were exposed to (2) a range of FTC magnitudes from no (T=4.0 ∘C) to strong ( ∘C) soil frost and (3) a range of FTC frequencies (f=0–7).
2.1 Forest sites and soil sample collection
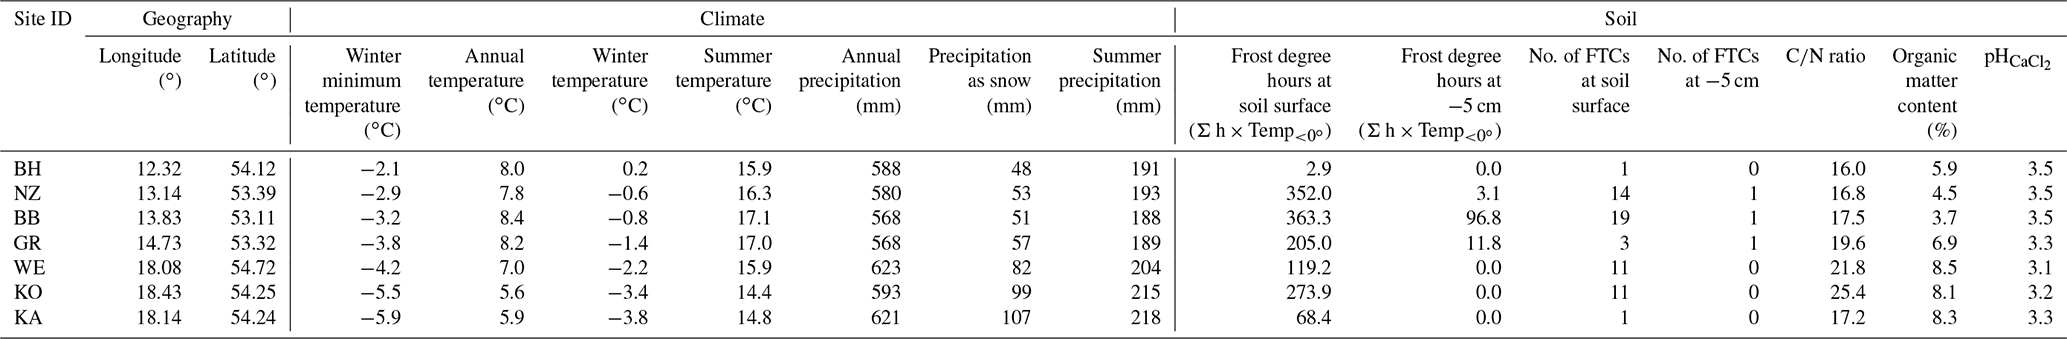
Soil samples for this study stemmed from seven sites located between Rostock (Germany) and Gdańsk (Poland) which are mono-dominated by mature European beech. Along the 500 km study gradient, the sites differ markedly in winter climate, with mean average winter air temperatures (ΔT=4.0 K) and mean minimum winter air temperatures (ΔT=3.8 K) decreasing towards the east, which overproportionately drives the differences in mean annual temperature (ΔT=2.8 K; for details see Table 1). From west to east, mean annual precipitation as snow increases from 50 to 110 mm while annual precipitation is rather uniform (540 to 630 mm). With respect to winter air temperature differences, the study area is representative of a large part of the temperature range of beech as the major forest tree in Europe, while for summer precipitation, which is considered to be a major driver of beech growth (Hacket-Pain et al., 2018), differences are relatively small (Table 1).
Table 1Site characteristics for the seven sampled beech forest stands, ordered by decreasing winter minimum air temperature. All climatic data are displayed as means for the reference period 1961–1990 according to “climateEU” 4.63 (Hamann et al., 2013; Wang et al., 2012); winter refers to December–February; summer refers to June–August. Soil parameters were measured directly on site. “No. of FTCs” indicates the number of freeze–thaw cycles at the specified soil depth for the years 2016–2019 measured at half-hourly intervals by TMC20-HD temperature sensors connected to HOBO UX120-006M analog data loggers (Onset Computer Corporation, Bourne, USA).
The study sites are located in the Pleistocene lowlands with glacial deposits as bedrock. All sites share the same soil type (sandy Cambisol) and similar soil texture (sandy silt to silty sand). Sites were selected for similar forest stand structure, i.e., tree height of about 30 m (ranging between 27 and 39 m), tree diameter of about 45 cm (ranging between 37 and 52 cm), and canopy closure of 70 %–80 %. In order to achieve this uniform stand structure, differences in mean tree age across sites were accepted (76–167 years). At each site, we systematically selected the sampling sites in proximity to site-representative target trees. A dendroecological pre-study (Weigel et al., 2018) identified these target tree individuals by selecting for the best correlations between individual tree-ring series and the site chronology (the mean of all individual tree-ring series of a site) during the last 30 years (three target trees out of 20 at all but the coldest site, three out of 40 at the coldest site). Consequently, the three selected target trees within each site showed very similar growth patterns over the past 30 years and ideally represented the growth–environment relationship of the whole stand. At each site, we randomly selected one of those three target trees and took three soil sub-samples (later on mixed) at a distance of 3 m in the northeast, south, and northwest directions from each selected individual. Sampling occurred at 0–10 cm soil depth starting below the litter layer. The litter layer was, as is typical for beech forests, very thin at the time of sampling in early November. Sampling was timed before the natural FTC would interfere with our treatments. Samples were stored at 4 ∘C until the start of the treatments in early February, which is the time when, typically, the most intensive FTC happens in our study area.
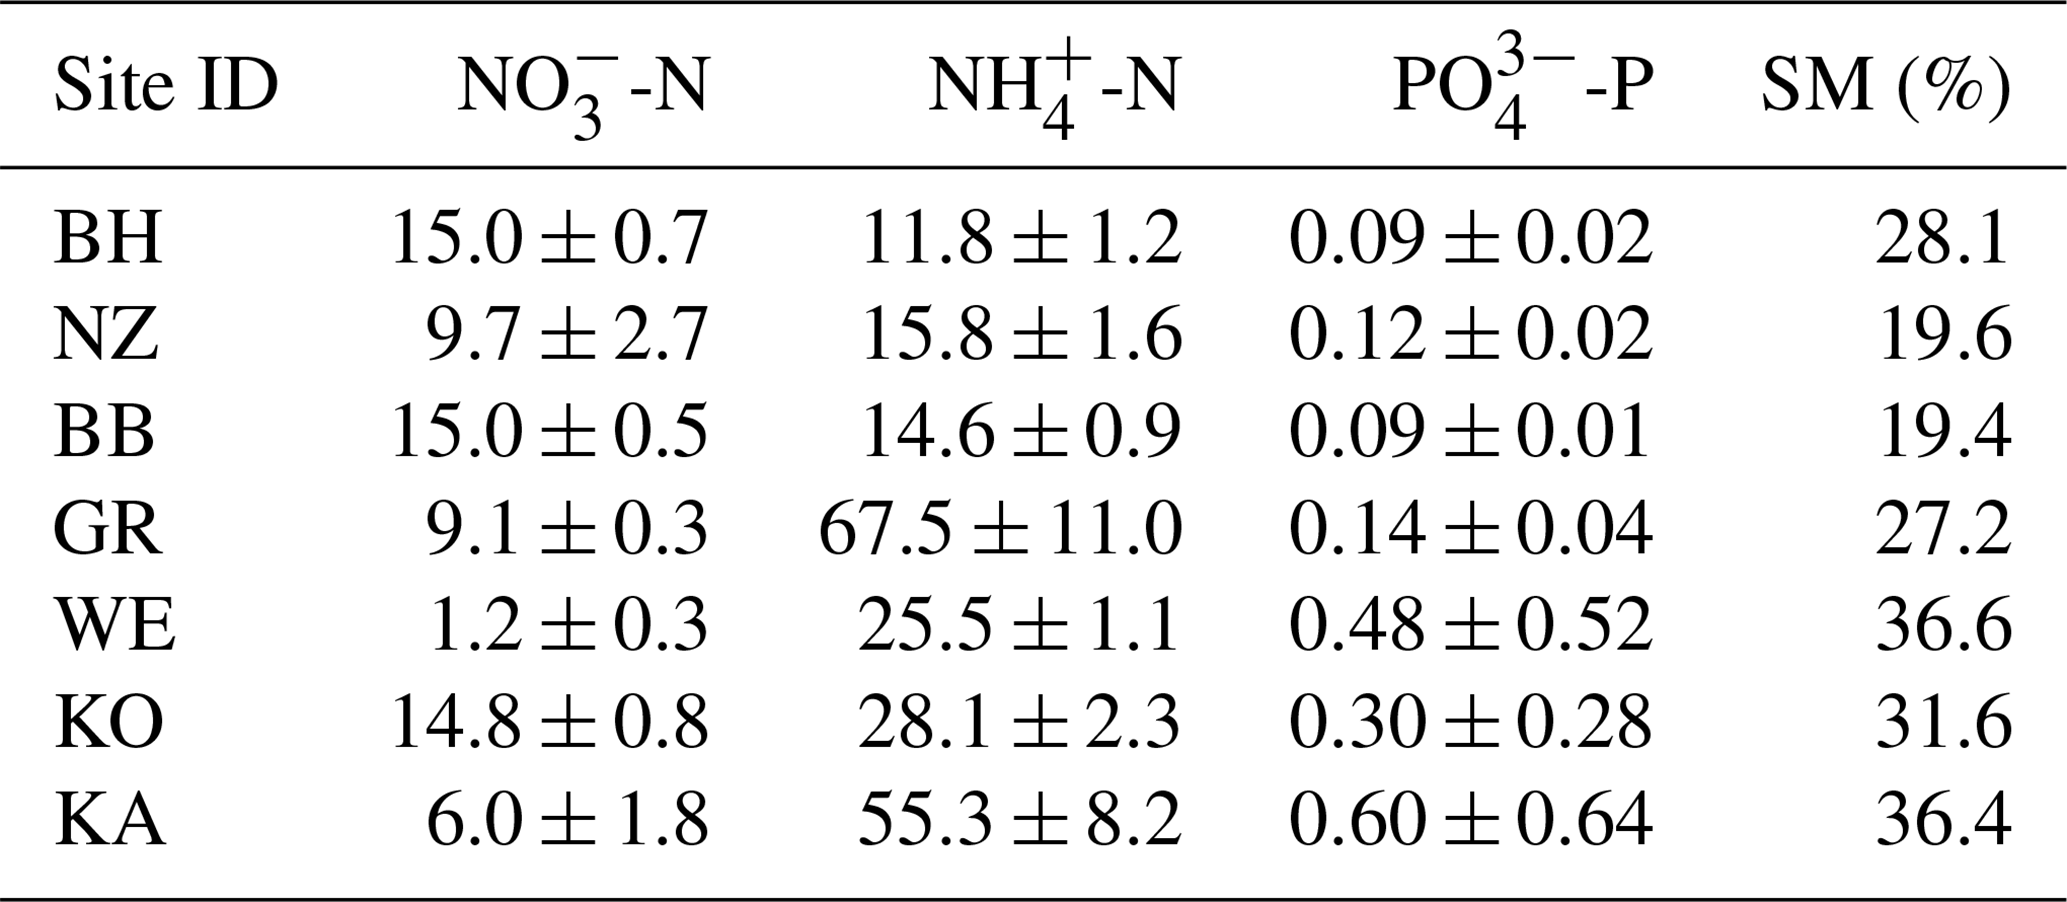
The mixed samples per site were carefully homogenized and subsampled to 10 g for the subsequent FTC treatment (see below). This small amount ensured homogeneous temperature dynamics throughout the samples. Soil moisture at the start of the FTC treatment ranged between 19.46 % and 36.6 % between the sites and was not significantly related to climate at site origin (correlation to mean minimum air temperature: R2=0.33, p=0.103). The samples were kept sealed during the experiment, and, hence, soil moisture was assumed to stay constant. Initial values for the analyzed nutrients were also recorded at the start of the FTC treatment with the same methodology as described below and are presented in Table 2.
Table 2Initial nutrient concentrations (µg kg−1 DM; mean ± SD) and gravimetric soil moisture at the start of the FTC treatment. Site IDs correspond to Table 1.
2.2 FTC treatment
The FTC treatment was set up as a fully factorial combination of sample site, FTC magnitude, and FTC frequency in a gradient design consisting of seven sites along a gradient of winter climate (see above), seven FTC magnitudes (realized at −1.9, −2.5, −3.4, −4.6, −6.6, −7.8, and −11.1 ∘C), and seven FTC frequencies (f=1–7). In addition, three control samples without FTCs (T=4.0 ∘C and f=0) were analyzed at the end (day 8) of the experiment for each site. In total, this resulted in 364 samples (7 sites ×7 FTC magnitudes ×7 FTC frequencies controls). Gradient experiments with unique (unreplicated) sampling at each factorial combination have recently been shown to outperform classical, replicated designs in terms of detecting and characterizing potentially nonlinear ecological response surfaces of interacting environmental drivers (Kreyling et al., 2018). Such designs profit from expanding the range of environmental drivers and are therefore recommended to include extreme and rather unrealistic values such as the maximum FTC magnitude in our example. Soil temperatures of −12 ∘C rarely occur in temperate forests. However, they can help elucidate response patterns and might even become possible as future warming of the Polar Ocean might increase advection of polar air masses, potentially causing unprecedented cold extremes over Europe (Petoukhov and Semenov, 2010; Yang and Christensen, 2012).
The simulated FTCs followed typical FTCs for temperate ecosystems with daily cycles between thawed and frozen states. The FTC treatment was realized for all samples in parallel in programmable climate chambers (Percival LT-36VLX, Percival Scientific, Inc., Perry, Iowa). One FTC lasted 24 h with 2 h at the preset minimum temperature and 12 h at +1 ∘C (sufficient for thawing but too cold for considerable microbial activity). The rates of temperature change consequently differed between FTC magnitudes but were <3 K h−1 even for the coldest magnitude. Temperature was monitored for each of the 49 frequency–magnitude treatment combinations (see above) with seven sensors per FTC magnitude, directly at the incubated soil samples (LogTag TRIX 8, LogTag Recorders Lt, Auckland, New Zealand), and the realized minimum temperatures per treatment combination rather than the preset temperature of the climate chambers were used for further analysis (see Supplement A for a visual display of the treatments). Directly after the planned FTC frequency was reached for each sample, nutrient extraction and the subsequent chemical analysis started.
2.3 Nutrient extraction and chemical analysis
Samples were shaken in 50 mL KCl solution (0.5 M) for 1 h and subsequently filtered through filter paper of 2–3 µm pore size. Afterwards, the filtrates were stored frozen at −20 ∘C upon further analysis.
Nitrate was measured after conversion to nitrite at a cadmium reductor column as an azo dye (Hansen and Koroleff, 1999). Samples had to be diluted with ultrapure water (Purelab Flex, Elga) by a factor of 50. Nitrite was not measured, because its concentration was expected to be <10 % of nitrate. The nitrate-named data are, therefore, the sum of nitrate and nitrite (NOx). The samples were measured in a segmented flow analyzer (FlowSys, Alliance Instruments) equipped with a 5 cm cuvette (Armstrong et al., 1967). The determination limit for nitrate was 0.32 µmol L−1 (4.5 µg nitrate-N L−1). The combined standard uncertainty was 4.2 % for samples and the 5 µM standards.
Ammonium was measured as an indophenol blue dye photometrically (Hansen and Koroleff, 1999). Samples had to be diluted by a factor of 50–100. The samples were measured in the same segmented flow analyzer (Kérouel and Aminot, 1997). The determination limit for ammonium was 0.43 µmol L−1 (6.0 µg ammonium-N L−1). The combined standard uncertainty was 7.7 % for samples and the 5 µM standards.
Phosphate concentrations were measured by the molybdenum blue reaction photometrically (Murphy and Riley, 1962). This was done in the abovementioned autoanalyzer (Malcolme-Lawes and Wong, 1990). The determination limit was 0.1 µmol L−1. The combined standard uncertainty was 4.2 % for samples and the 5 µM standards.
Fresh weight of each sample was determined before the start of the FTC treatment. Based on the relation between dry weight and fresh weight of a further subsample, dry weight of the samples was calculated and nutrient concentrations are reported in relation to dry weight.
2.4 Statistical analyses
Hierarchical regression analysis was applied to detect and characterize the underlying response patterns in our threefold interactive gradient experiment according to the recommendations by Kreyling et al. (2018). In short, the hierarchical regression analysis accepts a more complex model only if it explains the data better than a simpler model, indicated by a lower Akaike information criterion (AIC) and, for nested designs, by significant ANOVA comparing the models. Consequently, the final model of a hierarchical regression analysis contains only those parameters and interactions which help represent the underlying data, i.e., which are significant for the interpretation of the data.
We first performed linear regression for each single environmental driver (climatic origin expressed as mean minimum air temperature at the respective sampling site, FTC magnitude expressed as the minimum temperature experienced during the FTC treatment, and FTC frequency expressed as the number of FTCs). Based on the hypothesized nonlinear relationship of nutrient release with these environmental drivers, we then set up different nonlinear candidate models for each environmental driver individually. We chose models known for their ability to describe a wide variety of ecological and biological processes, i.e., a saturating model (Michaelis–Menten function) and a sigmoidal model (Gompertz function). We used the model performance index AICc (Akaike information criterion corrected for small sample sizes; Hurvich and Tsai, 1989) to determine the best model, which is indicated by the lowest AICc value. In the case of assessing model performance of linear models or comparing model performance of nested models, we also used ANOVA to test whether the more complex model explained variation significantly better than the simpler model. We continued by additive combination of the two best explaining individual models and kept this new model only if it further increased explained variation (lower AICc and significant model difference in ANOVA). Likewise, we tested whether addition of interactive terms and the third environmental driver and all other interactive terms between the three drivers to the previous best model further increased model quality. All steps and all model formulations are documented in Tables 3–5.
All analyses were performed in R 3.4.3 (R Core Team, 2017). Candidate models were fit to the data using “nlsLM()” of package “minpack.lm” version 1.2-1. The AICc was quantified using “AICc()” of package “AICcmodavg” 2.2-1. The overall best model for each response parameter was visualized using “scatter3D()” of package “plot3D” version 1.1.1, and a correlation between measured nutrient release and predicted nutrient release by the model was used to quantify its goodness of fit.
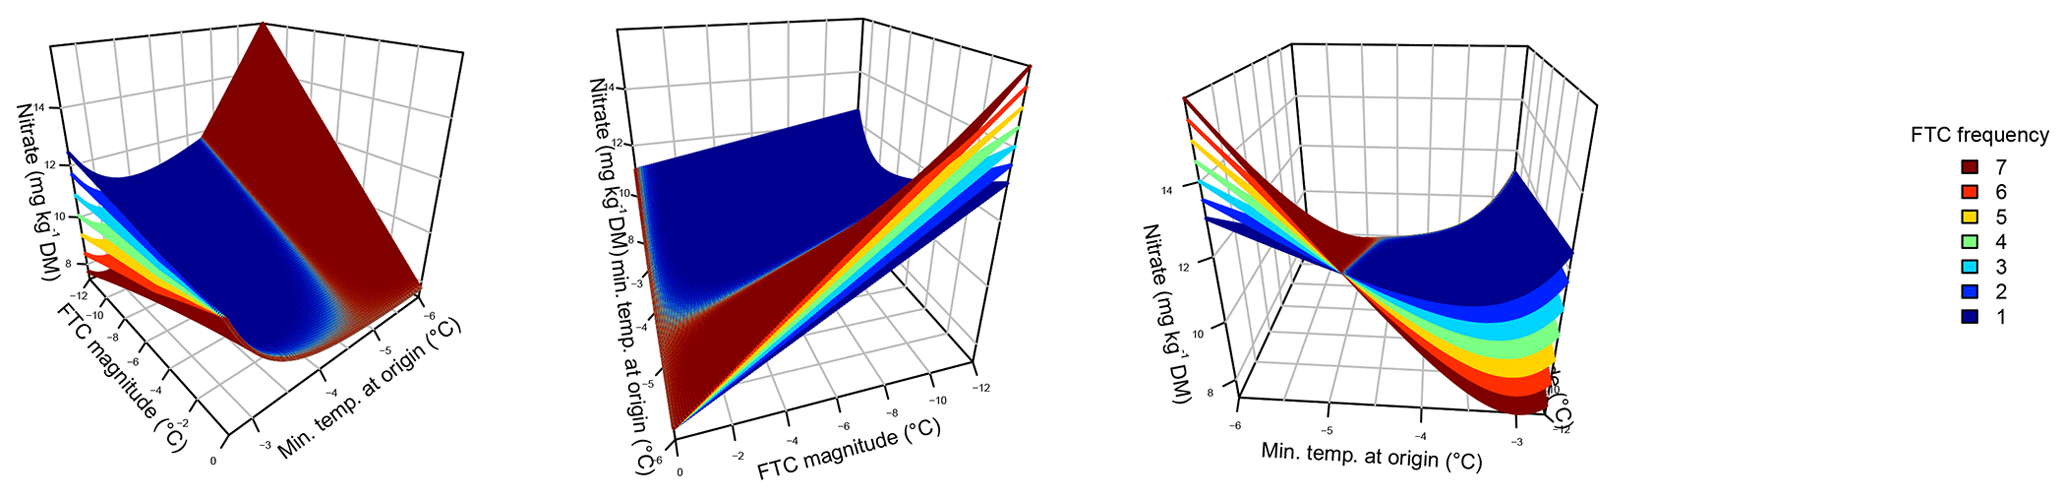
Figure 1Nitrate concentrations were best explained by the threefold interactive effects of winter climatic origin (expressed as long-term mean minimum winter temperature at the origin), FTC magnitude (expressed as the minimum temperature experienced during the FTC manipulation and displayed for freezing temperatures), and FTC frequency during the FTC manipulation. FTC: freeze–thaw cycle. The four-dimensional representation is displayed from three different angles (see Supplement B for an animated version) and is based on the best model fit in the hierarchical regression analysis (model 15 in Table 3 with coefficients a1=7.70092; ; a3=1.52874; a4=0.06754; a5=0.15402; a6=0.03231).
3.1 Nitrate
Variation in initial mobile nitrate concentration was large between sample sites (10.1 µg NO3-N per kilogram of dry matter on average ±5.2 µg NO3-N standard deviation across site averages). Nitrate concentrations at the end of our three-way gradient experiment followed a sigmoid increase towards colder winter minimum temperatures at the sample's origin, which was further modulated by an interaction with FTC magnitude, an interaction between FTC magnitude with FTC frequency, and the three-way interaction between mean minimum temperature at origin, FTC magnitude, and FTC frequency (Table 3, model 15). This model achieved a correlation between measured and predicted nitrate concentrations of 0.46. According to this model, the highest nitrate concentrations and highest frost sensitivity occurred for the combination of the coldest site, the strongest FTC magnitude, and the highest FTC frequency (Fig. 1) with predicted values of up to 16 µg NO3-N per kilogram of dry matter, i.e., a 2.5-fold increase compared to the initial nitrate concentration before the start of the experiment at this site (site KA, Table 2). For this combination, the maximum measured value was also found with nitrate concentrations of 37.3 µg NO3-N per kilogram of dry matter. A single, strong FTC ( and f=1), however, also released above-average amounts of nitrate for the warmest site. The lowest nitrate concentrations were found for all sites at the mildest FTC magnitude irrespective of FTC frequency. For mild FTC magnitudes, all sites showed below-average nitrate concentrations with the highest, still below-average, concentrations for the warmest site.
Table 3Results of the hierarchical regression analysis for nitrate concentrations of beech forest soils with changes in FTC magnitude (x1), FTC frequency (x2) and climatic origin (x3; expressed as mean minimum winter temperature at origin) at the end of the FTC treatments. Tested are linear, saturating (Michaelis–Menten function), and sigmoid (Gompertz function) relationships on the single environmental drivers and their interactions. Bold AICc (Akaike information criterion corrected for small sample sizes) values indicate the best model. AICc in italics indicate the best single-factor models. a1 to an are the fitted parameters of the respective model. FTC: freeze–thaw cycle.
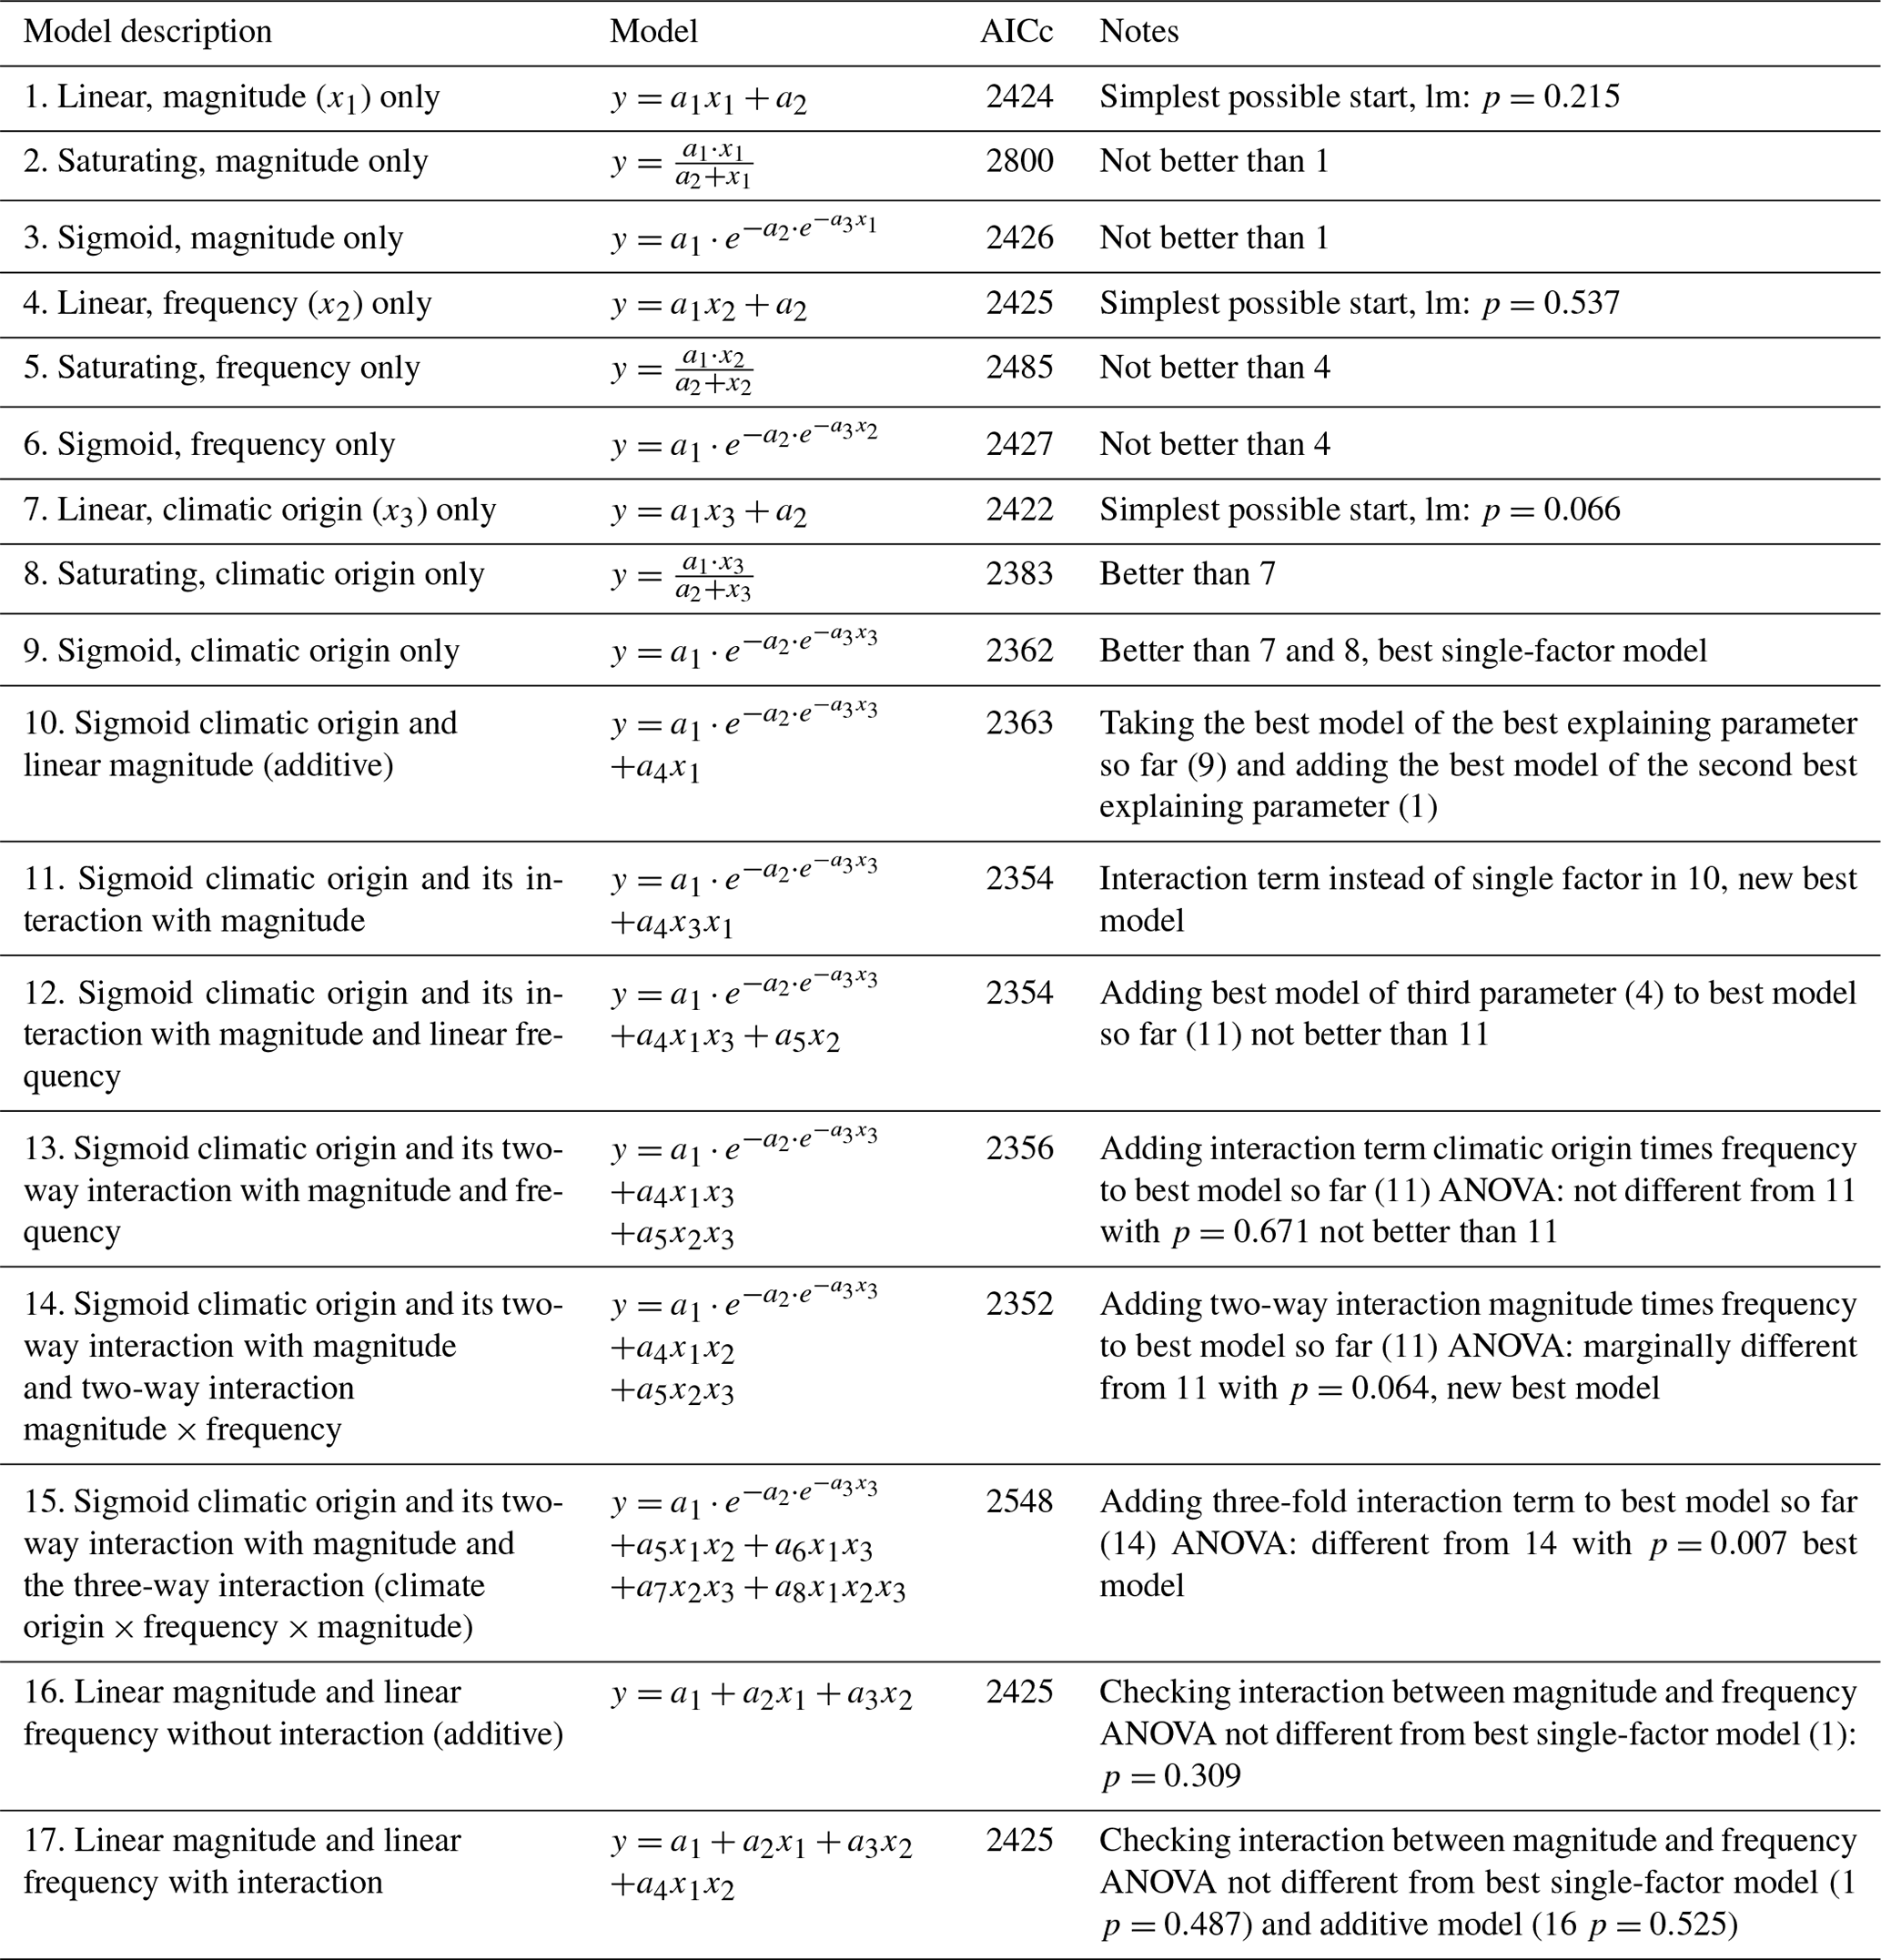
Individually, neither FTC magnitude nor FTC frequency was able to significantly explain nitrate concentrations, with more complex saturating or sigmoid models being indistinguishable from the (nonsignificant) linear model for both parameters (Table 3 models 1–6.).
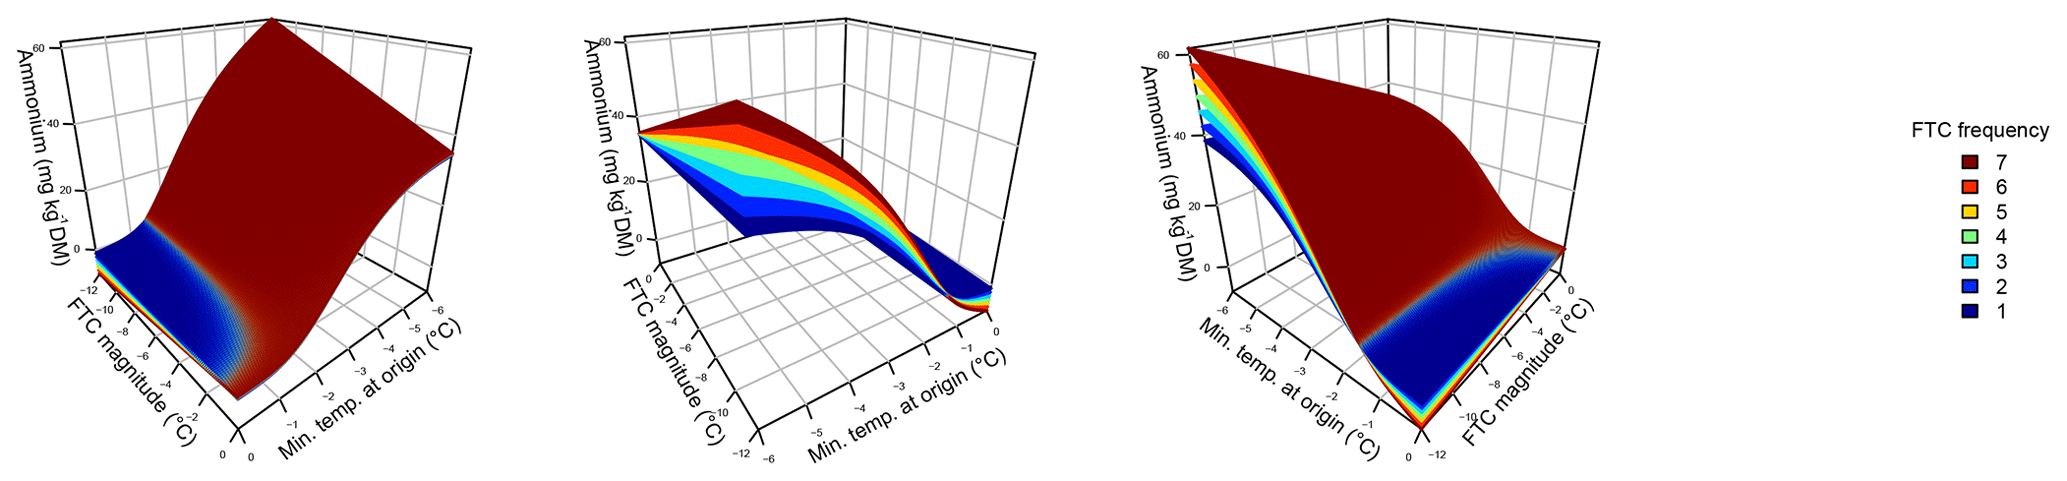
Figure 2Ammonium concentrations were best explained by the three-fold interactive effects of winter climatic origin (expressed as long-term mean minimum winter temperature at the origin), FTC magnitude (expressed as the minimum temperature experienced during the FTC manipulation and displayed for freezing temperatures), and FTC frequency during the FTC manipulation. FTC: freeze–thaw cycle. The four-dimensional representation is displayed from three different angles (see Supplement C for an animated version) and is based on the best model fit in the hierarchical regression analysis (model 15 in Table 4 with coefficients a1=35.77052; a2=9.00972; a3=0.94421; a4=0.06278; a5=0.10997; a6=0.07065).
3.2 Ammonium
Variation in initial mobile ammonium concentration was large between sample sites (31.2 µg NH4-N per kilogram of dry matter on average ±21.7 µg NH4-N standard deviation across site averages). Ammonium concentrations after the FTC treatments followed a sigmoid increase with colder winter minimum temperature at the sample's origin and an additive linear increase with FTC frequency and were further modulated by an interaction between FTC magnitude and FTC frequency and the three-way interaction between mean minimum temperature at origin, FTC magnitude, and FTC frequency (Table 4, model 15). This model achieved a correlation between measured and predicted ammonium concentrations of 0.61. According to this model, the highest ammonium concentrations and highest frost sensitivity occurred for the combination of the coldest site, the strongest FTC magnitude, and the highest FTC frequency (Fig. 2) with predicted values of up to 60 µg NH4-N per kilogram of dry matter, i.e., a 10 % increase compared to the initial ammonium concentration before the start of the experiment at this site (site KA, Table 2). For this combination, the maximum measured value was also found with ammonium concentrations of 149.7 µg NH4-N per kilogram of dry matter. At this site, FTC frequency had its highest and positively modulating effect while almost no effect of FTC frequency was found for mild FTC magnitude across all origins. Predicted ammonium concentrations and sensitivity to frost decreased rapidly towards the warmer sites with the inflection point of the sigmoid shape at around −3 ∘C for high FTC magnitudes and −2 ∘C for mild FTC magnitudes. The lowest ammonium concentrations were predicted for the warmest site almost irrespective of FTC magnitude and FTC frequency.
Table 4Results of the hierarchical regression analysis for ammonium concentrations of beech forest soils to changes in FTC magnitude (x1), FTC frequency (x2), and climatic origin (x3; expressed as mean minimum winter temperature at origin) at the end of the FTC treatments. Tested are linear, saturating (Michaelis–Menten function), and sigmoid (Gompertz function) relationships on the single environmental drivers and their interactions. Bold AICc (Akaike information criterion corrected for small sample sizes) values indicate the best model. AICc in italics indicate the best single-factor models. a1 to an are the fitted parameters of the respective model. FTC: freeze–thaw cycle.
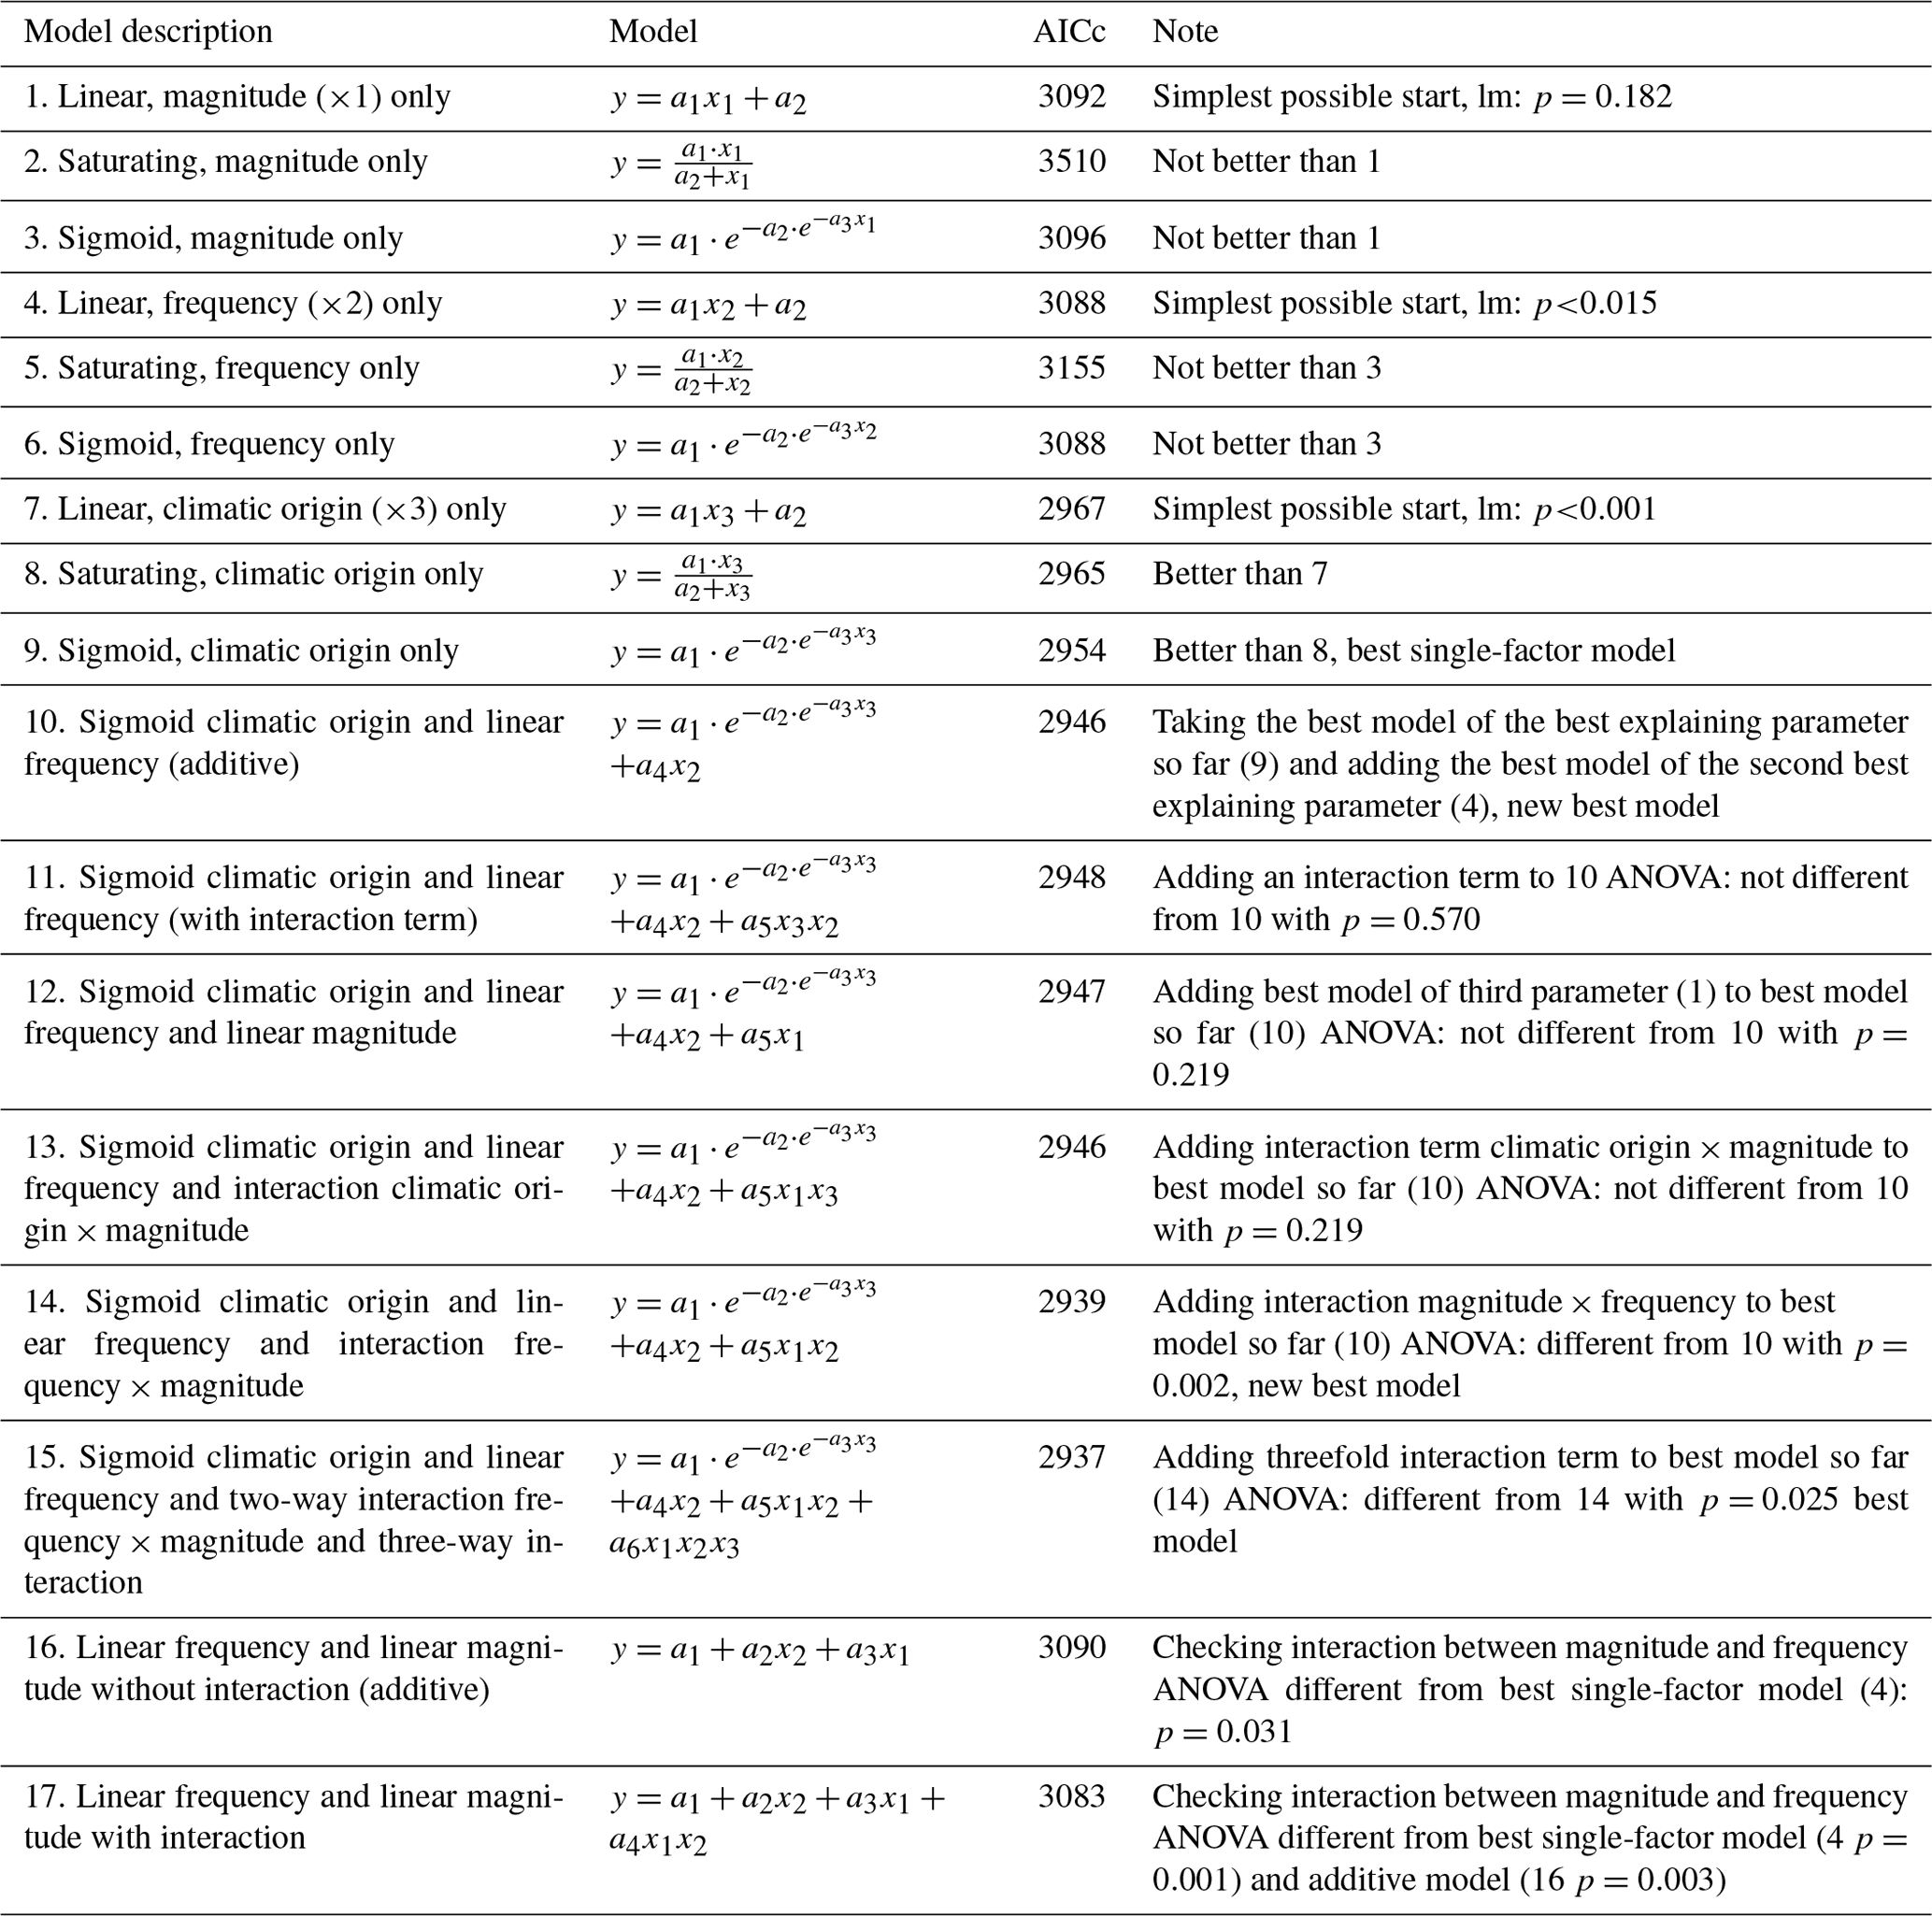
Individually, FTC frequency, but not FTC magnitude, was able to significantly explain ammonium concentrations, more complex saturating or sigmoid models being indistinguishable from the linear model for both parameters (Table 4, models 1–6). Their interaction appeared relevant and nonadditive (Table 4, models 16 and 17).
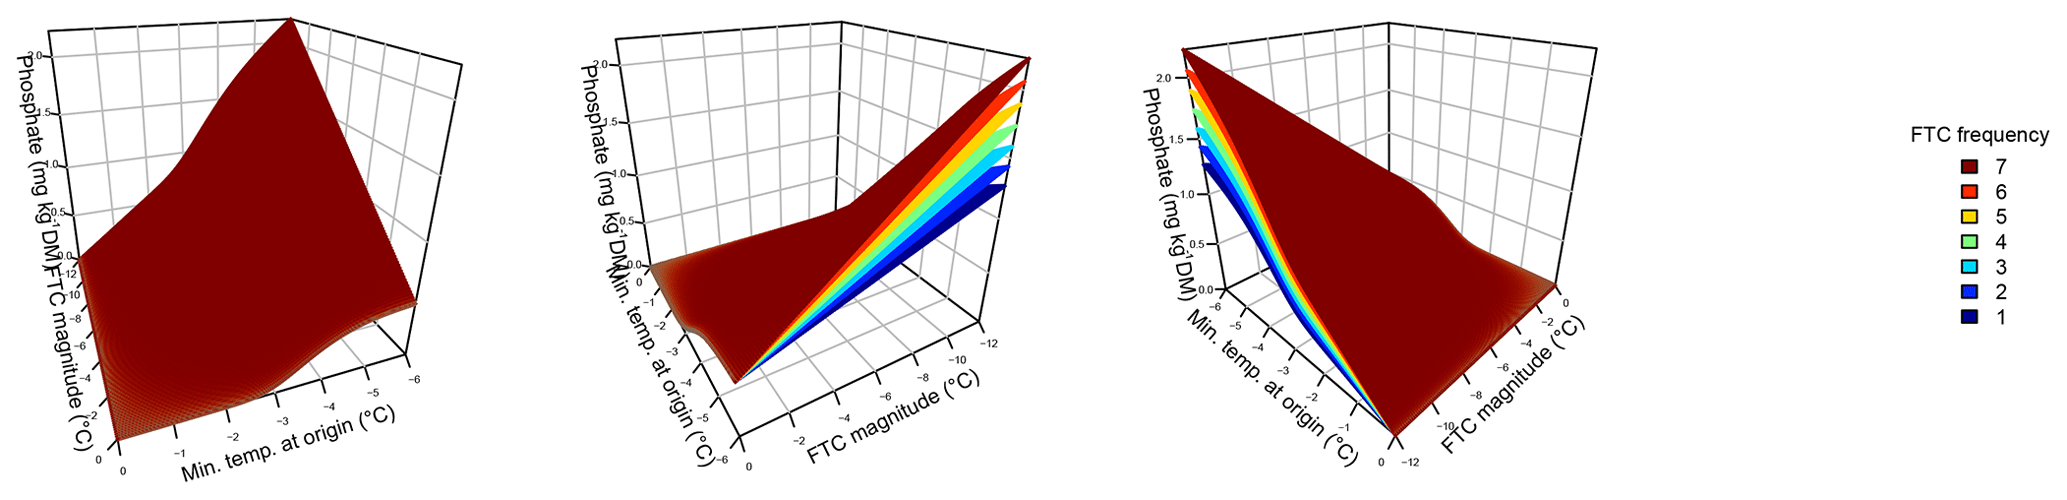
Figure 3Phosphate concentrations depended on the three-fold interactive effects of winter climatic origin (expressed as long-term mean minimum winter temperature at the origin), FTC magnitude (expressed as the minimum temperature experienced during the FTC manipulation and displayed for freezing temperatures), and FTC frequency during the FTC manipulation. FTC: freeze–thaw cycle. The four-dimensional representation is displayed from three different angles (see Supplement D for an animated version) and is based on the best model fit in the hierarchical regression analysis (model 15 in Table 5 with coefficients a1=0.49455; a2=0.01253; a3=1.37580; a4=0.00890; a5=0.00217).
3.3 Phosphate
Variation in initial mobile phosphate concentration was large between sample sites (0.25 µg PO4-P per kilogram of dry matter on average ±0.21 µg PO4-P standard deviation across site averages). Phosphate concentrations after the FTC treatment followed a sigmoid increase with colder winter minimum temperature at the sample's origin, modulated by an interaction with FTC magnitude, and the three-way interaction between mean minimum temperature at origin, FTC magnitude, and FTC frequency (Table 5, model 15). This model achieved a correlation between measured and predicted phosphate concentrations of 0.49. According to this model, the highest phosphate concentrations occurred for the combination of the coldest site, the strongest FTC magnitude, and the highest FTC frequency (Fig. 3) with predicted values of up to 2.2 µg PO4-P per kilogram of dry matter, i.e., almost a 4-fold increase compared to the initial phosphate concentration before the start of the experiment at this site (site KA, Table 2). The highest measured value for the coldest site was 4.60 µg PO4-P per kilogram of dry matter while the absolute maximum measured occurred for the strongest FTC magnitude and the highest FTC frequency at site WE (6.70 µg PO4-P per kilogram of dry matter). The positively modulating effects of FTC frequency increased with decreasing winter minimum temperature at the samples' origins while almost no effect of FTC frequency was found for mild FTC magnitude across all origins. Predicted phosphate concentrations decreased rapidly towards the warmer sites with the inflection point of the sigmoid shape at around −3 ∘C for high FTC magnitudes and −5 ∘C for mild FTC magnitudes. The lowest phosphate concentrations were predicted for the warmest site with no visible modulation by FTC magnitude and FTC frequency.
Table 5Results of the hierarchical regression analysis for phosphate concentrations of beech forest soils with changes in FTC magnitude (x1), FTC frequency (x2), and climatic origin (x3; expressed as mean minimum winter temperature at origin) at the end of the FTC treatments. Tested are linear, saturating (Michaelis–Menten function), and sigmoid (Gompertz function) relationships on the single environmental drivers and their interactions. Bold AICc (Akaike information criterion corrected for small sample sizes) values indicate the best model. AICc in italics indicate the best single-factor models. a1 to an are the fitted parameters of the respective model. FTC: freeze–thaw cycle.
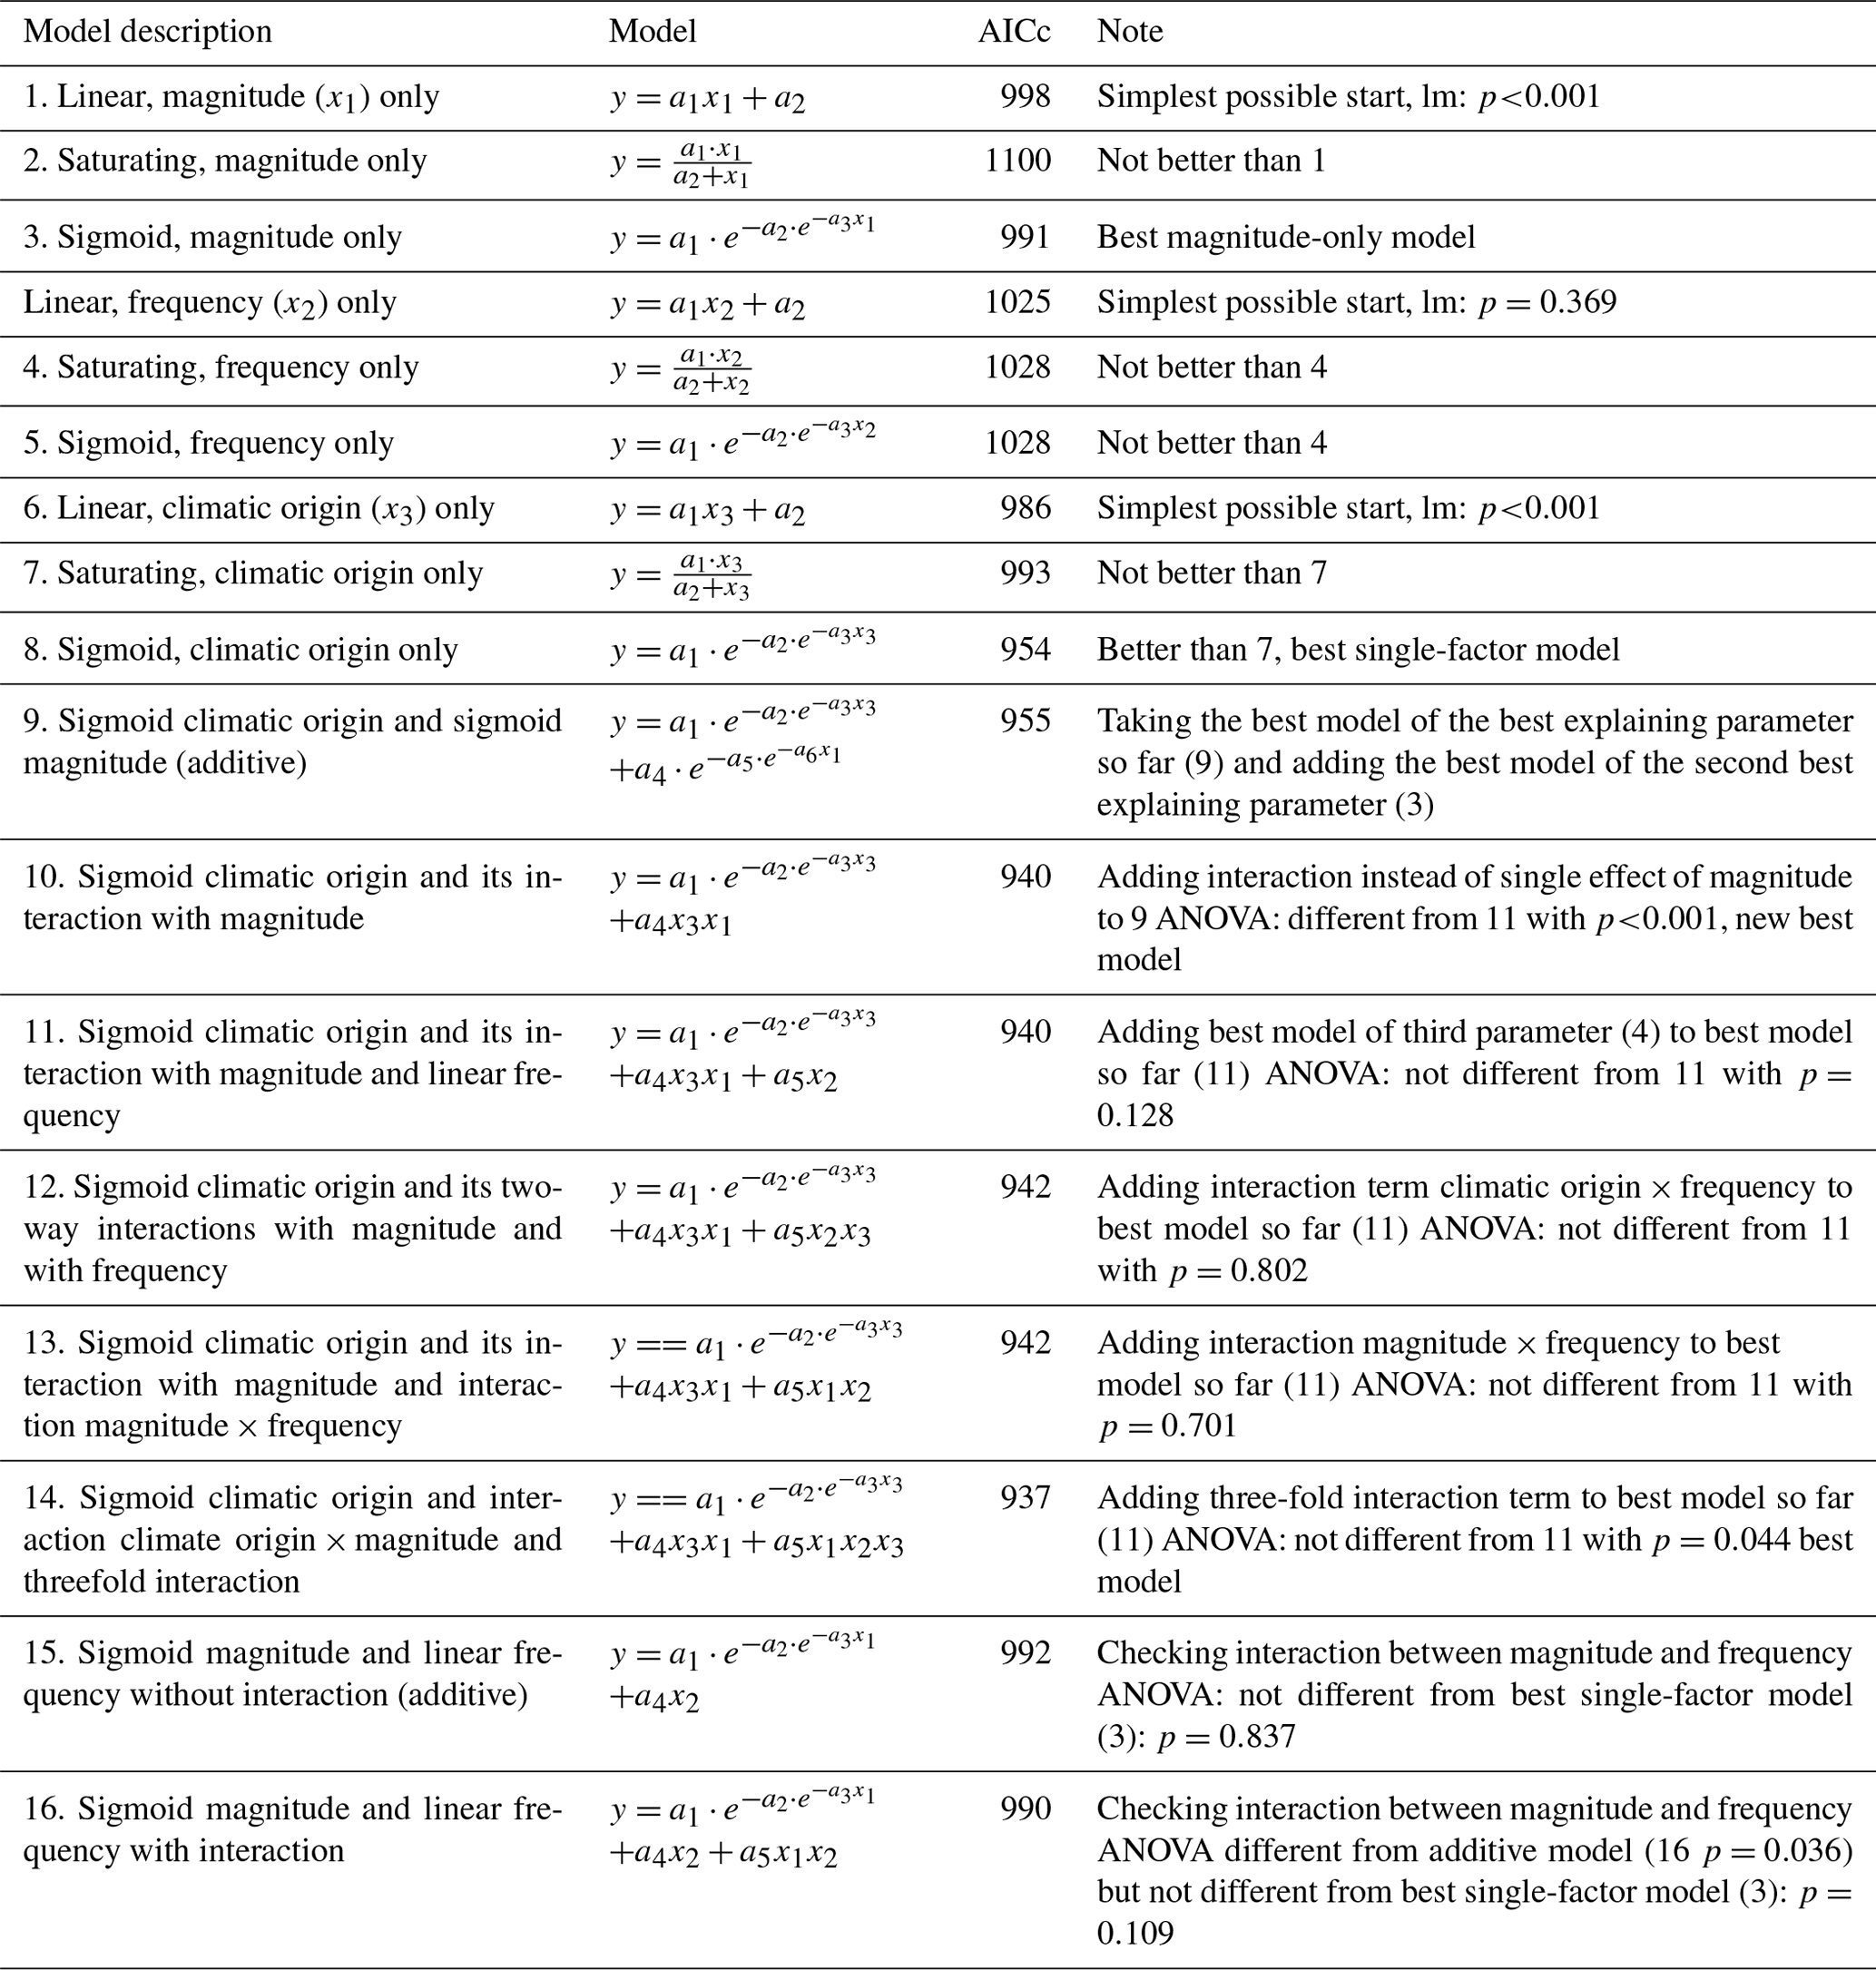
Individually, FTC magnitude, but not FTC frequency, was able to significantly explain phosphate concentrations, the more complex saturating or sigmoid models being indistinguishable from the linear model for both parameters (Table 5, models 1–6). Their interaction appeared relevant and nonadditive (Table 5, models 16 and 17).
4.1 FTCs induce nitrogen release, but response patterns are indistinguishable from linear for increased magnitude and increased frequency
FTC-induced nutrient release at high FTC magnitude and frequency in our experiment. Increased nitrate leaching following soil freezing has been explained by decreased root uptake due to lethal or sublethal root damage (Campbell et al., 2014; Matzner and Borken, 2008), and FTCs are further reported to increase ammonium production and mineralization rates (Austnes and Vestgarden, 2008; Vestgarden and Austnes, 2009; Shibata et al., 2013; Hosokawa et al., 2017). However, soil frost commonly reduces nitrification rates and nitrate production (Hosokawa et al., 2017; Hishi et al., 2014; Shibata et al., 2013) as nitrifying bacteria are sensitive to low temperatures (Cookson et al., 2002; Dalias et al., 2002). Lysis of microbial cells is reported to occur at minimum temperatures of −7 ∘C (Skogland et al., 1988) to −11 ∘C (Soulides and Allison, 1961) and should consequently have resulted in some form of threshold or nonlinear pattern along our gradient of FTC magnitude. As no such threshold was distinguishable, our results are hardly explainable with frost-driven lysis. Based on these aspects, we assume that the processes driving the increase in nitrogen and phosphorus concentrations in our experiment are osmotic shock upon exposure to meltwater (Jefferies et al., 2010) and/or physical destruction of organic and mineral soil particles (Oztas and Fayetorbay, 2003; Hobbie and Chapin, 1996) rather than altered mineralization rates as those should be coupled to the highest mineral N availability in the unfrozen control. However, FTCs increase DON and DOC in temperate deciduous forest soils, quickly leading to enhanced growth of soil microbes and net mineralization, resulting in increased availability of ammonium (Watanabe et al., 2019). Further studies focusing on discrimination between the single processes are clearly needed in light of the strong increases in nitrate (2.5-fold increase) and phosphate (4-fold increase) concentrations over just 1 week of FTC treatment for the coldest site and highest FTC magnitudes and frequencies.
Here, we expected to find saturation of nutrient release with both increased FTC magnitude and frequency. However, the observed response patterns of nutrient release along these two drivers were indistinguishable from linear in our experiment. This finding has to be treated with care, though, as both drivers were involved in complex interactions with each other and the site of soil origin (see below).
4.2 The combination effect of magnitude and frequency of FTCs on nutrient release is not additive
We assumed FTC magnitude and frequency effects on nutrient release to be additive, but this was not supported by our data. For ammonium, we observed a significant interaction between FTC magnitude and frequency resulting in overproportionately large release for high magnitude and frequency. However, for all three analyzed nutrients, both these drivers were further involved in significant three-way interactions with the site of soil origin and should be interpreted in this sense (see below).
4.3 Soils from colder and snowier forests are more responsive to strong and frequent FTCs
Nitrogen and phosphorus release in response to FTCs was high for soils from colder and snowier sites. Warmer sites with historically low snow cover showed almost no response to FTCs for ammonium and phosphate, while nitrate tended to also be released by strong frost irrespective of FTC frequency in soils from the warmest site. Overall, the strong sigmoidal increase in nutrient concentrations with soils from colder sites was modulated by FTC magnitude and frequency in all studied nutrients. Nitrate concentrations increased with FTC magnitude over the whole range of soil origins, peaking for the highest frequencies and the coldest sites. The effect of FTC magnitude on ammonium and phosphate concentrations over the climatic gradient was less obvious, but high FTC frequencies mattered only for the coldest sites and high FTC magnitude, then leading to maximum release. All these response shapes show that soils from warmer sites are surprisingly irresponsive to FTCs while soils from colder sites are highly sensitive. All studied soils developed under comparable bedrock (sandy Pleistocene deposits) and under the same vegetation types (mono-dominant, mature beech forest with little to no understory). Still, their sensitivity to FTCs differed dramatically. Over historic times, the most obvious difference with relevance for FTC sensitivity is winter soil temperature fluctuations, which are generally small at cold sites characterized by stable, insulating snow cover and which are large at the warmer sites with their soils over winter being exposed to air temperature fluctuations (Henry, 2008). Over three winters (2016–2019), our sites reflect this expectation well with the strongest frost occurrence and FTC at the center of our gradient and few soil frost incidents at the warm (western) and cold (eastern) extremes (Table 1). In light of the air temperatures and the amount of precipitation as snow, the soils at the coldest sites obviously benefitted from insulation by snow (Table 1). While the soil C∕N ratio appeared irresponsive to the climatic gradient in our study, soil organic matter content increased towards the coldest sites (Table 1). High organic matter content generally increases the susceptibility of soils for nutrient loss with climate change (Liu et al., 2017). Here, we cannot answer how strongly this pattern in organic matter is driven by historic winter soil temperature and occurrence of FTCs, but the expectation of increased mineralization with winter soil warming (Gao et al., 2018) would fit to the observed decrease in soil organic matter content with warmer winter climate (Liu et al., 2017). Moreover, the larger pool of organically bound nutrients at the coldest sites may contribute to their observed responsiveness to FTC warming (Gao et al., 2018).
The higher magnitude of FTC changes microbial community composition and functioning, leading to increased tolerance of FTCs in temperate forest soils (Urakawa et al., 2014). In light of these results, we suggest that our warmer sites already experienced high winter soil temperature fluctuations with past warming, and their microbial community and soil organic matter content adapted to these conditions, making them comparably irresponsive to our FTC treatments. In contrast, our coldest sites rarely experienced serious FTCs in the past, exposing an unadapted microbial community and large pools of organic matter to FTC stress and leading to high rates of mortality and release in consequence. These spatial differences in adaptation or legacy of past conditions might also help explain why microbial responses to mild FTCs appear highly divergent with either little to no effect on microbial biomass and nutrient dynamics (Lipson and Monson, 1998; Grogan et al., 2004) or temperature fluctuations in FTCs down to only −4 ∘C affecting microbial biomass and nutrient leaching (Larsen et al., 2002; Joseph and Henry, 2008). In consequence, the largest effects of winter climate change on microbial communities and nutrient dynamics are to be expected for sites where snow cover is currently disappearing (Kreyling, 2020).
The fate of the nutrients released in response to FTCs in those regions where snow cover is disappearing is of crucial importance for ecosystem functioning, e.g., tree growth and nitrogen leaching. An increase in available nutrients could increase plant growth. But if the fluctuations in soil temperature lead to lethal or sublethal damage of plant roots (Tierney et al., 2001; Reinmann and Templer, 2018; Kreyling et al., 2012a; Weih and Karlsson, 2002) in parallel to lysis of microbes, the excess nutrients might be leached out of the ecosystem due to reduced root uptake (Matzner and Borken, 2008; Campbell et al., 2014). The projected increase in winter rain for temperate ecosystems (Stocker, 2014) could then further exacerbate nutrient leaching with the downward flow of the additional water (Bowles et al., 2018).
Phosphate is much less mobile in the soil than nitrate, and, consequently, leaching of phosphate is not to be expected. Stoichiometric imbalance between nitrogen and phosphorus nutrition is a global phenomenon, mainly because of the atmospheric deposition of reactive nitrogen and no comparable analogue for phosphorus in unfertilized ecosystems (Peñuelas et al., 2013). In light of the surprisingly high mobilization of phosphorus in our study and the potential leaching losses of nitrate, an aggravation of the imbalance between nitrogen and phosphorus of temperate deciduous forests in response to altered winter soil temperature regimes in absence of phosphorus leaching is therefore not to be expected.
The applied gradient design analyzed by hierarchical regression analysis (Kreyling et al., 2018) proved instrumental for the detection and characterization of nonlinear response shapes modulated by complex interactions of the environmental drivers. A traditional, replicated design at few treatment levels along the environmental drivers would not have provided these insights about the complexity of the relationships of the studied drivers.
FTC magnitude and, to a lesser extent, also FTC frequency resulted in increased nitrate, ammonium, and phosphate release almost exclusively in soils from cold, snow-rich sites with high organic matter content while soils from warmer sites characterized by a history of infrequent snow cover and largely fluctuating soil temperatures were comparably irresponsive to FTCs. We propose that currently warmer forest soils have historically already passed the point of high responsiveness to winter climate change and might have lost organic matter, displaying some form of adaptation either in the soil biotic composition or in labile nutrient sources. This suggests that previously cold sites losing their protective snow cover with climate change are most vulnerable to strong shifts in nitrogen and phosphorus release. In nutrient-poor European beech forests of the studied Pleistocene lowlands, nutrients released over winter may get lost when microbes and plant roots are damaged by soil frost and induce reduced plant growth and increased nutrient leaching rates.
The data and the R code to reproduce the analyses are available and can be processed at Dryad: https://doi.org/10.5061/dryad.rxwdbrv5n (Kreyling et al., 2020).
The supplement related to this article is available online at: https://doi.org/10.5194/bg-17-4103-2020-supplement.
JK and RW designed the study, RW conducted the fieldwork and the experiment, and RS performed the chemical analyses. JK analyzed the data and wrote the manuscript with contributions from all co-authors.
The authors declare that they have no conflict of interest.
We kindly thank the regional forest management (Forst Brandenburg including the Landeskompetenzzentrum Forst Eberswalde, Landesforst Mecklenburg-Vorpommern, National Forest Holding of Poland's State Forests in Szczecin, Gdańsk, and Toruń) for granting access, assistance with site selection, and help during the sampling. We are grateful for the help during field sampling, conducting the experiment, and lab analysis by Marcin Klisz, Marc Glaw, Marie E. Meininghaus, and Jonas Schmeddes.
This research has been supported by the DFG (grant nos. KR 3309/9-1 and Research Training Group RESPONSE (RTG 2010)).
This paper was edited by Frank Hagedorn and reviewed by two anonymous referees.
Ammer, C., Fichtner, A., Fischer, A., Gossner, M. M., Meyer, P., Seidl, R., Thomas, F. M., Annighöfer, P., Kreyling, J., Ohse, B., Berger, U., Feldmann, E., Häberle, K.-H., Heer, K., Heinrichs, S., Huth, F., Krämer-Klement, K., Mölder, A., Müller, J., Mund, M., Opgenoorth, L., Schall, P., Scherer-Lorenzen, M., Seidel, D., Vogt, J., and Wagner, S.: Key ecological research questions for Central European forests, Basic Appl. Ecol., 32, 3–25, https://doi.org/10.1016/j.baae.2018.07.006, 2018.
Armstrong, F. A. J., Stearns, C. R., and Strickland, J. D. H.: The measurement of upwelling and subsequent biological process by means of the Technicon Autoanalyzer®and associated equipment, Deep Sea Research and Oceanographic Abstracts, 14, 381–389, https://doi.org/10.1016/0011-7471(67)90082-4, 1967.
Austnes, K. and Vestgarden, L. S.: Prolonged frost increases release of C and N from a montane heathland soil in southern Norway, Soil Biol. Biochem., 40, 2540–2546, 2008.
Bolter, M., Soethe, N., Horn, R., and Uhlig, C.: Seasonal development of microbial activity in soils of northern Norway, Pedosphere, 15, 716–727, 2005.
Bontemps, J.-D., Hervé, J.-C., Leban, J.-M., and Dhôte, J.-F.: Nitrogen footprint in a long-term observation of forest growth over the twentieth century, Trees, 25, 237–251, https://doi.org/10.1007/s00468-010-0501-2, 2011.
Bowles, T. M., Atallah, S. S., Campbell, E. E., Gaudin, A. C. M., Wieder, W. R., and Grandy, A. S.: Addressing agricultural nitrogen losses in a changing climate, Nature Sustainability, 1, 399–408, https://doi.org/10.1038/s41893-018-0106-0, 2018.
Brown, P. J. and DeGaetano, A. T.: A paradox of cooling winter soil surface temperatures in a warming northeastern United States, Agr. Forest Meteorol., 151, 947–956, https://doi.org/10.1016/j.agrformet.2011.02.014, 2011.
Brown, R. D. and Mote, P. W.: The response of northern hemisphere snow cover to a changing climate, J. Climate, 22, 2124–2145, https://doi.org/10.1175/2008JCLI2665.1, 2009.
Buma, B., Hennon, P. E., Harrington, C. A., Popkin, J. R., Krapek, J., Lamb, M. S., Oakes, L. E., Saunders, S., and Zeglen, S.: Emerging climate-driven disturbance processes: Widespread mortality associated with snow-to-rain transitions across 10∘ of latitude and half the range of a climate-threatened conifer, Glob. Change Biol., 23, 2903–2914, https://doi.org/10.1111/gcb.13555, 2017.
Campbell, J. L., Mitchell, M. J., Groffman, P. M., Christenson, L. M., and Hardy, J. P.: Winter in northeastern North America: a critical period for ecological processes, Front. Ecol. Environ., 3, 314–322, 2005.
Campbell, J. L., Ollinger, S. V., Flerchinger, G. N., Wicklein, H., Hayhoe, K., and Bailey, A. S.: Past and projected future changes in snowpack and soil frost at the Hubbard Brook Experimental Forest, New Hampshire, USA, Hydrol. Process., 24, 2465–2480, https://doi.org/10.1002/hyp.7666, 2010.
Campbell, J. L., Socci, A. M., and Templer, P. H.: Increased nitrogen leaching following soil freezing is due to decreased root uptake in a northern hardwood forest, Glob. Change Biol., 20, 2663–2673, 2014.
Comerford, D. P., Schaberg, P. G., Templer, P. H., Socci, A. M., Campbell, J. L., and Wallin, K. F.: Influence of experimental snow removal on root and canopy physiology of sugar maple trees in a northern hardwood forest, Oecologia, 171, 261–269, https://doi.org/10.1007/s00442-012-2393-x, 2013.
Cookson, W. R., Cornforth, I. S., and Rowarth, J. S.: Winter soil temperature (2–15 ∘C) effects on nitrogen transformations in clover green manure amended or unamended soils; a laboratory and field study, Soil Biol. Biochem., 34, 1401–1415, https://doi.org/10.1016/S0038-0717(02)00083-4, 2002.
Dalias, P., Anderson, J. M., Bottner, P., and Coûteaux, M.-M.: Temperature responses of net nitrogen mineralization and nitrification in conifer forest soils incubated under standard laboratory conditions, Soil Biol. Biochem., 34, 691–701, https://doi.org/10.1016/S0038-0717(01)00234-6, 2002.
Elliott, A. C. and Henry, H. A. L.: Freeze-thaw cycle amplitude and freezing rate effects on extractable nitrogen in a temperate old field soil, Biol. Fert. Soils, 45, 469–476, 2009.
Gao, D., Zhang, L., Liu, J., Peng, B., Fan, Z., Dai, W., Jiang, P., and Bai, E.: Responses of terrestrial nitrogen pools and dynamics to different patterns of freeze-thaw cycle: A meta-analysis, Glob. Change Biol., 24, 2377–2389, https://doi.org/10.1111/gcb.14010, 2018.
Göbel, L., Coners, H., Hertel, D., Willinghöfer, S., and Leuschner, C.: The role of low soil temperature for photosynthesis and stomatal conductance of three graminoids from different elevations, Front. Plant Sci., 10, 330, https://doi.org/10.3389/fpls.2019.00330, 2019.
Groffman, P. M., Driscoll, C. T., Fahey, T. J., Hardy, J. P., Fitzhugh, R. D., and Tierney, G. L.: Colder soils in a warmer world: A snow manipulation study in a northern hardwood forest ecosystem, Biogeochemistry, 56, 135–150, 2001.
Guo, C., Simon, J., Gasche, R., Naumann, P. S., Bimüller, C., Pena, R., Polle, A., Kögel-Knabner, I., Zeller, B., Rennenberg, H., and Dannenmann, M.: Minor contribution of leaf litter to N nutrition of beech (Fagus sylvatica) seedlings in a mountainous beech forest of Southern Germany, Plant Soil, 369, 657–668, https://doi.org/10.1007/s11104-013-1603-6, 2013.
Hacket-Pain, A. J., Ascoli, D., Vacchiano, G., Biondi, F., Cavin, L., Conedera, M., Drobyshev, I., Liñán, I. D., Friend, A. D., Grabner, M., Hartl, C., Kreyling, J., Lebourgeois, F., Levanič, T., Menzel, A., van der Maaten, E., van der Maaten-Theunissen, M., Muffler, L., Motta, R., Roibu, C.-C., Popa, I., Scharnweber, T., Weigel, R., Wilmking, M., and Zang, C. S.: Climatically controlled reproduction drives interannual growth variability in a temperate tree species, Ecol. Lett., 21, 1833–1844, https://doi.org/10.1111/ele.13158, 2018.
Hamann, A., Wang, T., Spittlehouse, D. L., and Murdock, T. Q.: A comprehensive, high-resolution database of historical and projected climate surfaces for Western North America, B. Am. Meteorol. Soc., 94, 1307–1309, https://doi.org/10.1175/BAMS-D-12-00145.1, 2013.
Hansen, H. P. and Koroleff, F.: Determination of nutrients, in: Methods of seawater analysis, 3rd, completely revieved and extended edited by: Grasshoff, K. and Anderson, L. G., Wiley VCH, Weinheim, 159–228, 1999.
Henry, H. A. L.: Climate change and soil freezing dynamics: historical trends and projected changes, Clim. Change, 87, 421–434, 2008.
Hishi, T., Urakawa, R., Tashiro, N., Maeda, Y., and Shibata, H.: Seasonality of factors controlling N mineralization rates among slope positions and aspects in cool-temperate deciduous natural forests and larch plantations, Biol. Fert. Soils, 50, 343–356, https://doi.org/10.1007/s00374-013-0863-x, 2014.
Hobbie, S. E. and Chapin, F. S.: Winter regulation of tundra litter carbon and nitrogen dynamics, Biogeochemistry, 35, 327–338, https://doi.org/10.1007/BF02179958, 1996.
Hosokawa, N., Isobe, K., Urakawa, R., Tateno, R., Fukuzawa, K., Watanabe, T., and Shibata, H.: Soil freeze–thaw with root litter alters N transformations during the dormant season in soils under two temperate forests in northern Japan, Soil Biol. Biochem., 114, 270–278, https://doi.org/10.1016/j.soilbio.2017.07.025, 2017.
Hurvich, C. M. and Tsai, C.-L.: Regression and time series model selection in small samples, Biometrika, 76, 297–307, https://doi.org/10.1093/biomet/76.2.297, 1989.
IPCC (Ed.): Climate Change 2013: The Physical Science Basis. Contribution of Working Group I to the Fifth Assessment Report of the Intergovernmental Panel on Climate Change, Cambridge University Press, Cambridge, United Kingdom and New York, NY, USA, 2013.
Isard, S. A. and Schaetzl, R. J.: Effects of winter weather conditions on soil freezing in southern Michigan, Phys. Geogr., 19, 71–94, 1998.
Iwata, Y., Hayashi, M., Suzuki, S., Hirota, T., and Hasegawa, S.: Effects of snow cover on soil freezing, water movement, and snowmelt infiltration: A paired plot experiment, Water Resour. Res., 46, W09504, 2010.
Jefferies, R. L., Walker, N. A., Edwards, K. A., and Dainty, J.: Is the decline of soil microbial biomass in late winter coupled to changes in the physical state of cold soils?, Soil Biol. Biochem., 42, 129–135, 2010.
Joseph, G. and Henry, H. A. L.: Soil nitrogen leaching losses in response to freeze-thaw cycles and pulsed warming in a temperate old field, Soil Biol. Biochem., 40, 1947–1953, 2008.
Joseph, G. and Henry, H. A. L.: Retention of surface nitrate additions in a temperate old field: implications for atmospheric nitrogen deposition over winter and plant nitrogen availability, Plant Soil, 319, 209–218, 2009.
Kérouel, R. and Aminot, A.: Fluorometric determination of ammonia in sea and estuarine waters by direct segmented flow analysis, Mar. Chem., 57, 265–275, https://doi.org/10.1016/S0304-4203(97)00040-6, 1997.
Kreyling, J.: Winter climate change: A critical factor for temperate vegetation performance, Ecology, 91, 1939–1948, https://doi.org/10.1890/09-1160.1, 2010.
Kreyling, J.: The ecological importance of winter in temperate, boreal, and arctic ecosystems in times of climate change, in: Progress in Botany Vol. 81, edited by: Cánovas, F. M., Lüttge, U., Leuschner, C., Risueño, M.-C., Springer International Publishing, Cham, 377–399, 2020.
Kreyling, J. and Henry, H. A. L.: Vanishing winters in Germany: soil frost dynamics and snow cover trends, and ecological implications, Clim. Res., 46, 269–276, https://doi.org/10.3354/cr00996, 2011.
Kreyling, J., Haei, M., and Laudon, H.: Absence of snow cover reduces understory plant cover and alters plant community composition in boreal forests, Oecologia, 168, 577–587, https://doi.org/10.1007/s00442-011-2092-z, 2012a.
Kreyling, J., Persoh, D., Werner, S., Benzenberg, M., and Wöllecke, J.: Short-term impacts of soil freeze-thaw cycles on roots and root-associated fungi of Holcus lanatus and Calluna vulgaris, Plant Soil, 353, 19–31, 2012b.
Kreyling, J., Schweiger, A. H., Bahn, M., Ineson, P., Migliavacca, M., Morel-Journel, T., Christiansen, J. R., Schtickzelle, N., and Larsen, K. S.: To replicate, or not to replicate – that is the question: How to tackle nonlinear responses in ecological experiments, Ecol. Lett., 21, 1629–1638, https://doi.org/10.1111/ele.13134, 2018.
Kreyling, J., Schumann, R., and Weigel, R.: Kreyling et al._raw data and R code_FTC nutrient mobilization, Dryad, available at: https://doi.org/10.5061/dryad.rxwdbrv5n, 2020.
Leuschner, C., Meier, I. C., and Hertel, D.: On the niche breadth of Fagus sylvatica: soil nutrient status in 50 Central European beech stands on a broad range of bedrock types, Ann. Forest Sci., 63, 355–368, https://doi.org/10.1051/forest:2006016, 2006.
Liu, Y., Wang, C., He, N., Wen, X., Gao, Y., Li, S., Niu, S., Butterbach-Bahl, K., Luo, Y., and Yu, G.: A global synthesis of the rate and temperature sensitivity of soil nitrogen mineralization: latitudinal patterns and mechanisms, Glob. Change Biol., 23, 455–464, https://doi.org/10.1111/gcb.13372, 2017.
Malcolme-Lawes, D. J. and Wong, K. H.: Determination of orthophosphate in waters and soils using a flow analyser, Analyst, 115, 65–67, https://doi.org/10.1039/AN9901500065, 1990.
Matzner, E. and Borken, W.: Do freeze-thaw events enhance C and N losses from soils of different ecosystems?: A review, Eur. J. Soil Sci., 59, 274–284, 2008.
McMahon, S. K., Wallenstein, M. D., and Schimel, J. P.: Microbial growth in Arctic tundra soil at-2 degrees C, Env. Microbiol. Rep., 1, 162–166, 2009.
Mikan, C. J., Schimel, J. P., and Doyle, A. P.: Temperature controls of microbial respiration in arctic tundra soils above and below freezing, Soil Biol. Biochem., 34, 1785–1795, 2002.
Murphy, J. and Riley, J. P.: A modified single solution method for the determination of phosphate in natural waters, Anal. Chim. Acta., 27, 31–36, https://doi.org/10.1016/S0003-2670(00)88444-5, 1962.
Oztas, T. and Fayetorbay, F.: Effect of freezing and thawing processes on soil aggregate stability, Catena, 52, 1–8, 2003.
Peñuelas, J., Poulter, B., Sardans, J., Ciais, P., van der Velde, M., Bopp, L., Boucher, O., Godderis, Y., Hinsinger, P., Llusia, J., Nardin, E., Vicca, S., Obersteiner, M., and Janssens, I. A.: Human-induced nitrogen-phosphorus imbalances alter natural and managed ecosystems across the globe, Nat. Commun., 4, 2934, https://doi.org/10.1038/ncomms3934, 2013.
Petoukhov, V. and Semenov, V. A.: A link between reduced Barents-Kara sea ice and cold winter extremes over northern continents, J. Geophys. Res.-Atmos., 115, 10, https://doi.org/10.1029/2009JD013568, 2010.
R Core Team: R: A Language and Environment for Statistical Computing.: R version 3.4.3, R Foundation for Statistical Computing, available at: http://www.R-project.org (last access: 7 August 2020), Vienna, Austria, 2017.
Reinmann, A. B., Susser, J. R., Demaria, E. M. C., and Templer, P. H.: Declines in northern forest tree growth following snowpack decline and soil freezing, Glob. Change Biol., 25, 420–430, https://doi.org/10.1111/gcb.14420, 2019.
Reinmann, A. B. and Templer, P. H.: Increased soil respiration in response to experimentally reduced snow cover and increased soil freezing in a temperate deciduous forest, Biogeochemistry, 140, 359–371, https://doi.org/10.1007/s10533-018-0497-z, 2018.
Rennenberg, H. and Dannenmann, M.: Nitrogen nutrition of trees in temperate forests – the significance of nitrogen availability in the pedosphere and atmosphere, Forests, 6, 2820–2835, https://doi.org/10.3390/f6082820, 2015.
Schaberg, P. G., Hennon, P. E., D'Amore, D. V., and Hawley, G. J.: Influence of simulated snow cover on the cold tolerance and freezing injury of yellow-cedar seedlings, Glob. Change Biol., 14, 1282–1293, 2008.
Scherrer, S. C. and Appenzeller, C.: Swiss Alpine snow pack variability: Major patterns and links to local climate and large-scale flow, Clim. Res., 32, 187–199, https://doi.org/10.3354/cr032187, 2006.
Schimel, J., Balser, T. C., and Wallenstein, M.: Microbial stress-response physiology and its implications for ecosystem function, Ecology, 88, 1386–1394, https://doi.org/10.1890/06-0219, 2007.
Shibata, H., Hasegawa, Y., Watanabe, T., and Fukuzawa, K.: Impact of snowpack decrease on net nitrogen mineralization and nitrification in forest soil of northern Japan, Biogeochemistry, 116, 69–82, https://doi.org/10.1007/s10533-013-9882-9, 2013.
Simon, J., Dannenmann, M., Pena, R., Gessler, A., and Rennenberg, H.: Nitrogen nutrition of beech forests in a changing climate: importance of plant-soil-microbe water, carbon, and nitrogen interactions, Plant Soil, 418, 89–114, https://doi.org/10.1007/s11104-017-3293-y, 2017.
Skogland, T., Lomeland, S., and Goksoyr, J.: Respiratory burst after freezing and thawing of soil – experiments with soil bacteria, Soil Biol. Biochem., 20, 851–856, 1988.
Soulides, D. A. and Allison, F. E.: Effect of drying and freezing soils on carbon dioxide production, available mineral nutrients, aggregation, and bacterial population, Soil Sci., 91, 291–298, 1961.
Stocker, T. (Ed.): Climate change 2013: The physical science basis Working Group I contribution to the Fifth assessment report of the Intergovernmental Panel on Climate Change, Cambridge University Press, Cambridge, 1535, 2014.
Talkner, U., Meiwes, K. J., Potočić, N., Seletković, I., Cools, N., Vos, B. de, and Rautio, P.: Phosphorus nutrition of beech (Fagus sylvatica L.) is decreasing in Europe, Ann. Forest Sci., 72, 919–928, https://doi.org/10.1007/s13595-015-0459-8, 2015.
Tierney, G. L., Fahey, T. J., Groffman, P. M., Hardy, J. P., Fitzhugh, R. D., and Driscoll, C. T.: Soil freezing alters fine root dynamics in a northern hardwood forest, Biogeochemistry, 56, 175–190, 2001.
Urakawa, R., Shibata, H., Kuroiwa, M., Inagaki, Y., Tateno, R., Hishi, T., Fukuzawa, K., Hirai, K., Toda, H., Oyanagi, N., Nakata, M., Nakanishi, A., Fukushima, K., Enoki, T., and Suwa, Y.: Effects of freeze–thaw cycles resulting from winter climate change on soil nitrogen cycling in ten temperate forest ecosystems throughout the Japanese archipelago, Soil Biol. Biochem., 74, 82–94, https://doi.org/10.1016/j.soilbio.2014.02.022, 2014.
Vestgarden, L. S. and Austnes, K.: Effects of freeze-thaw on C and N release from soils below different vegetation in a montane system: a laboratory experiment, Glob. Change Biol., 15, 876–887, 2009.
Wang, T., Hamann, A., Spittlehouse, D. L., and Murdock, T. Q.: ClimateWNA—High-resolution spatial climate data for Western North America, J. Appl. Meteorol. Clim., 51, 16–29, https://doi.org/10.1175/JAMC-D-11-043.1, 2012.
Wardle, D. A., Walker, L. R., and Bardgett, R. D.: Ecosystem properties and forest decline in contrasting long-term chronosequences, Science (New York, NY), 305, 509–513, https://doi.org/10.1126/science.1098778, 2004.
Watanabe, T., Tateno, R., Imada, S., Fukuzawa, K., Isobe, K., Urakawa, R., Oda, T., Hosokawa, N., Sasai, T., Inagaki, Y., Hishi, T., Toda, H., and Shibata, H.: The effect of a freeze-thaw cycle on dissolved nitrogen dynamics and its relation to dissolved organic matter and soil microbial biomass in the soil of a northern hardwood forest, Biogeochemistry, 142, 319–338, https://doi.org/10.1007/s10533-019-00537-w, 2019.
Weigel, R., Muffler, L., Klisz, M., Kreyling, J., van der Maaten-Theunissen, M., Wilmking, M., and van der Maaten, E.: Winter matters: Sensitivity to winter climate and cold events increases towards the cold distribution margin of European beech (Fagus sylvatica L.), J. Biogeogr., 45, 2779–2790, https://doi.org/10.1111/jbi.13444, 2018.
Weih, M. and Karlsson, P. S.: Low winter soil temperature affects summertime nutrient uptake capacity and growth rate of mountain birch seedlings in the subarctic, Swedish lapland, Arct. Antarct. Alp. Res., 34, 434–439, 2002.
Yanai, Y., Toyota, K., and Okazaki, M.: Effects of successive soil freeze-thaw cycles on soil microbial biomass and organic matter decomposition potential of soils, Soil Sci. Plant Nutr., 50, 821–829, 2004.
Yang, S. and Christensen, J. H.: Arctic sea ice reduction and European cold winters in CMIP5 climate change experiments, Geophys. Res. Lett., 39, 890, https://doi.org/10.1029/2012GL053338, 2012.