the Creative Commons Attribution 4.0 License.
the Creative Commons Attribution 4.0 License.
 | 26 Aug 2020
The impact of intertidal areas on the carbonate system of the southern North Sea
Fabian Schwichtenberg
Michael Ernst Böttcher
Helmuth Thomas
Vera Winde
Kay-Christian Emeis
The coastal ocean is strongly affected by ocean acidification because of its shallow water depths, low volume, and the closeness to terrestrial dynamics. Earlier observations of dissolved inorganic carbon (DIC) and total alkalinity (TA) in the southern part of the North Sea, a northwest European shelf sea, revealed lower acidification effects than expected. It has been assumed that anaerobic degradation and subsequent TA release in the adjacent back-barrier tidal areas (Wadden Sea) in summertime is responsible for this phenomenon. In this study the exchange rates of TA and DIC between the Wadden Sea tidal basins and the North Sea and the consequences for the carbonate system in the German Bight are estimated using a 3D ecosystem model. The aim of this study is to differentiate the various sources contributing to observed high summer TA in the southern North Sea. Measured TA and DIC in the Wadden Sea are considered as model boundary conditions. This procedure acknowledges the dynamic behaviour of the Wadden Sea as an area of effective production and decomposition of organic material. According to the modelling results, 39 Gmol TA yr−1 were exported from the Wadden Sea into the North Sea, which is less than a previous estimate but within a comparable range. The interannual variabilities in TA and DIC, mainly driven by hydrodynamic conditions, were examined for the years 2001–2009. Dynamics in the carbonate system are found to be related to specific weather conditions. The results suggest that the Wadden Sea is an important driver for the carbonate system in the southern North Sea. On average 41 % of TA inventory changes in the German Bight were caused by riverine input, 37 % by net transport from adjacent North Sea sectors, 16 % by Wadden Sea export, and 6 % were caused by internal net production of TA. The dominant role of river input for the TA inventory disappears when focusing on TA concentration changes due to the corresponding freshwater fluxes diluting the marine TA concentrations. The ratio of exported TA versus DIC reflects the dominant underlying biogeochemical processes in the Wadden Sea. Whereas aerobic degradation of organic matter played a key role in the North Frisian Wadden Sea during all seasons of the year, anaerobic degradation of organic matter dominated in the East Frisian Wadden Sea. Despite the scarcity of high-resolution field data, it is shown that anaerobic degradation in the Wadden Sea is one of the main contributors of elevated summer TA values in the southern North Sea.
- Article
(1963 KB) - Full-text XML
-
Supplement
(622 KB) - BibTeX
- EndNote


Shelf seas are highly productive areas constituting the interface between the inhabited coastal areas and the global ocean. Although they represent only 7.6 % of the world ocean's area, current estimates assume that they contribute approximately 21 % to total global ocean CO2 sequestration (Borges, 2011). At the global scale the uncertainties in these estimates are significant due to the lack of spatially and temporally resolved field data. Some studies have investigated regional carbon cycles in detail (e.g. Kempe and Pegler, 1991; Brasse et al., 1999; Reimer et al., 1999; Thomas et al., 2004, 2009; Artioli et al., 2012; Lorkowski et al., 2012; Burt et al., 2016; Shadwick et al., 2011; Laruelle et al., 2014; Carvalho et al., 2017) and pointed out sources of uncertainties specifically for coastal settings.
However, natural pH dynamics in coastal and shelf regions, for example, have been shown to be up to an order of magnitude higher than in the open ocean (Provoost et al., 2010).
Also, the nearshore effects of CO2 uptake and acidification are difficult to determine, because of the shallow water depth and a possible superposition by benthic–pelagic coupling, and strong variations in fluxes of total alkalinity (TA) are associated with inflow of nutrients from rivers, pelagic nutrient-driven production and respiration (Provoost et al., 2010), submarine groundwater discharge (SGD; Winde et al., 2014), and benthic–pelagic pore water exchange (e.g. Billerbeck et al., 2006; Riedel et al., 2010; Moore et al., 2011; Winde et al., 2014; Santos et al., 2012, 2015; Brenner et al., 2016; Burt et al., 2014, 2016; Seibert et al., 2019). Finally, shifts within the carbonate system are driven by impacts from watershed processes and modulated by changes in ecosystem structure and metabolism (Duarte et al., 2013).
Berner et al. (1970) and Ben-Yakoov (1973) were among the first who investigated elevated TA and pH variations caused by microbial dissimilatory sulfate reduction in the anoxic pore water of sediments. At the Californian coast, the observed enhanced TA export from sediments was related to the burial of reduced sulfur compounds (pyrite; Dollar et al., 1991; Smith and Hollibaugh, 1993; Chambers et al., 1994). Other studies conducted in the Satilla and Altamaha estuaries and the adjacent continental shelf found non-conservative mixing lines of TA versus salinity, which was attributed to anaerobic TA production in nearshore sediments (Wang and Cai, 2004; Cai et al., 2010). Iron dynamics and pyrite formation in the Baltic Sea were found to impact benthic TA generation from the sediments (Gustafsson et al., 2019; Łukawska-Matuszewska and Graca, 2017).
The focus of the present study is the southern part of the North Sea, located on the northwest European shelf. This shallow part of the North Sea is connected with the tidal basins of the Wadden Sea via channels between barrier islands enabling an exchange of water and dissolved and suspended material (Rullkötter, 2009; Lettmann et al., 2009; Kohlmeier and Ebenhöh, 2009). The Wadden Sea extends from Den Helder (the Netherlands) in the west to Esbjerg (Denmark) in the north and covers an area of about 9500 km2 (Ehlers, 1994). The entire system is characterised by semidiurnal tides with a tidal range of between 1.5 m in the westernmost part and 4 m in the estuaries of the rivers Weser and Elbe (Streif, 1990). During low tide about 50 % of the area falls dry (van Beusekom et al., 2019). Large rivers discharge nutrients into the Wadden Sea, which in turn shows a high degree of eutrophication, aggravated by mineralisation of organic material imported into the Wadden Sea from the open North Sea (van Beusekom et al., 2012).
In comparison to the central and northern part of the North Sea, TA levels in the southern part are significantly elevated during summer (Salt et al., 2013; Thomas et al., 2009; Brenner et al., 2016; Burt et al., 2016). The observed high TA levels have been attributed to an impact from the adjacent tidal areas (Hoppema, 1990; Kempe and Pegler, 1991; Brasse et al., 1999; Reimer et al., 1999; Thomas et al., 2009; Winde et al., 2014), but this impact has not been rigorously quantified. Using several assumptions, Thomas et al. (2009) calculated an annual TA export from the Wadden Sea and Southern Bight of 73 Gmol TA yr−1 to close the TA budget for the southern North Sea.
The aim of this study is to reproduce the elevated summer levels of TA in the southern North Sea with a 3D biogeochemical model that has TA as a prognostic variable. With this tool at hand, we balance the budget TA in the relevant area on an annual basis. Quantifying the different budget terms, like river input, Wadden Sea export, internal pelagic and benthic production, degradation, and respiration, allows us to determine the most important contributors to TA variations. In this way we refine the budget terms by Thomas et al. (2009) and replace the original closing term with data. The new results are discussed against the background of the budget approach proposed by Thomas et al. (2009).
2.1 Model specifications
2.1.1 Model domain and validation area
The ECOHAM model domain for this study (Fig. 1) was first applied by Pätsch et al. (2010). For model validations (validation area in magenta, Fig. 1), an area was chosen that includes the German Bight as well as parts along the Danish and the Dutch coast. The western boundary of the validation area is situated at 4.5∘ E. The southern and northern boundaries are at 53.5 and 55.5∘ N, respectively. The validation area is divided by the dashed magenta line at 7∘ E into the western and eastern part. For the calculation of box averages of dissolved inorganic carbon (DIC) and TA a bias towards the deeper areas with more volume and more data should be avoided. Therefore, each water column covered with data within the validation area delivered one mean value, which is calculated by vertical averaging. These mean water column averages were horizontally interpolated onto the model grid. After this procedure average box values were calculated. In the case of box-averaging model output, the same procedure was applied but without horizontal interpolation.

Figure 1(a) Map of the southeastern North Sea and the bordering land. (b, c) Model domains of ECOHAM (red) and FVCOM (blue); positions of rivers 1–16 (b; see Table 2), and the Wadden Sea export areas grid cells (c). The magenta edges identify the validation area; western and eastern part separated by the dashed magenta line.
2.1.2 The hydrodynamic module
The physical parameters temperature, salinity, and horizontal and vertical advection as well as turbulent mixing were calculated by the submodule HAMSOM (Backhaus, 1985), which was integrated into the ECOHAM model. It is a baroclinic primitive equation model using the hydrostatic and Boussinesq approximation. It is applied to several regional sea areas worldwide (Mayer et al., 2018; Su and Pohlmann, 2009). Details are described by Backhaus and Hainbucher (1987) and Pohlmann (1996). The hydrodynamic model ran prior to the biogeochemical part. Daily result fields were stored for driving the biogeochemical model in offline mode. Surface elevation, temperature, and salinity resulting from the northwest European shelf model application (Lorkowski et al., 2012) were used as boundary conditions at the southern and northern boundaries. The temperature of the shelf run by Lorkowski et al. (2012) showed a constant offset compared with observations (their Fig. 3), because incoming solar radiation was calculated too high. For the present simulations the shelf run has been repeated with adequate solar radiation forcing.
River-induced horizontal transport due to the hydraulic gradient is incorporated (Große et al., 2017; Kerimoglu et al., 2018). This component of the hydrodynamic horizontal transport corresponds to the amount of freshwater discharge.
Within this study we use the term flushing time. It is the average time when a basin is filled with laterally advected water. The flushing time depends on the specific basin: large basins have usually higher flushing times than smaller basins. High flushing times correspond with low water renewal times.
2.1.3 The biogeochemical module
The relevant biogeochemical processes and their parameterisations have been detailed in Lorkowski et al. (2012). The model structure is shown as carbon interaction diagram in the Supplement S1. In former model setups TA was restored to prescribed values derived from observations (Thomas et al., 2009) with a relaxation time of 2 weeks (Kühn et al., 2010; Lorkowski et al., 2012). The changes in TA treatment for the study at hand is described below. Results from the northwest European shelf model application (Lorkowski et al., 2012) were used as boundary conditions for the recent biogeochemical simulations at the southern and northern boundaries (Fig. 1).
The main model extension was the introduction of a prognostic treatment of TA in order to study the impact of biogeochemically and physically driven changes in TA on the carbonate system and especially on acidification (Pätsch et al., 2018). The physical part contains advective and mixing processes as well as dilution by riverine freshwater input. The pelagic biogeochemical part is driven by planktonic production and respiration, formation and dissolution of calcite, pelagic and benthic degradation and remineralisation, and also by atmospheric deposition of reduced and oxidised nitrogen. All these processes impact TA. In this model version benthic denitrification has no impact on pelagic TA. Other benthic anaerobic processes are not considered. Only the carbonate ions from benthic calcite dilution increase pelagic TA. Aerobic remineralisation releases ammonium and phosphate, which enter the pelagic system across the benthic–pelagic interface and alter the pelagic TA. The theoretical background to this has been outlined by Wolf-Gladrow et al. (2007).
The years 2001 to 2009 were simulated with 3 spin-up years in 2000. Two different scenarios (A and B) were conducted. Scenario A is the reference scenario without implementation of any Wadden Sea processes. For scenario B we used the same model configuration as for scenario A and additionally implemented Wadden Sea export rates of TA and DIC as described in Sect. 2.3.1. The respective Wadden Sea export rates (Fig. 2) are calculated by the temporal integration of the product of wad_sta and wad_exc over 1 month (see Sect. 2.3.1, Eq. 2).
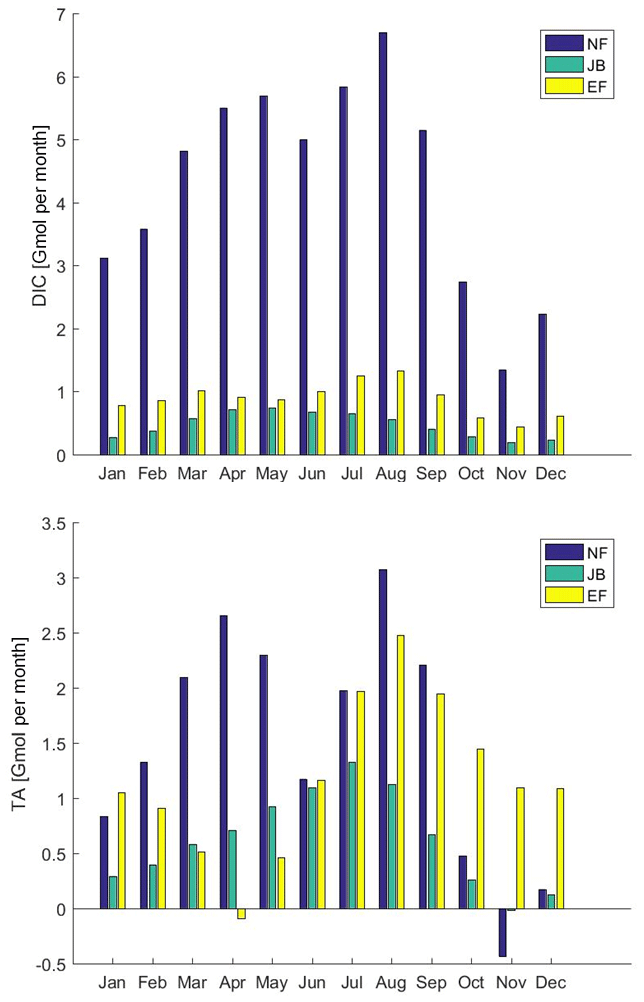
Figure 2Monthly Wadden Sea export of DIC and TA (Gmol per month) at the North Frisian coast (NF), East Frisian coast (EF), and Jade Bight (JB) in scenario B. The export rates were calculated for DIC and TA based on measured concentrations and simulated water fluxes.
2.2 External sources and boundary conditions
2.2.1 Freshwater discharge
Daily data of freshwater fluxes from 16 rivers were used (Fig. 1). For the German Bight and the other continental rivers daily observations of runoff provided by Pätsch and Lenhart (2008) were incorporated. The discharges of the rivers Elbe, Weser, and Ems were increased by 21 %, 19 %, and 30 % in order to take additional drainage that originated from the area downstream of the respective points of observation into account (Radach and Pätsch, 2007). The respective tracer loads were increased accordingly. The data of Neal (2002) were implemented for the British rivers for all years with daily values for fresh water. The annual amounts of fresh water of the different rivers are shown in the Appendix (Table A1). Riverine freshwater discharge was also considered for the calculation of the concentrations of all biogeochemical tracers in the model.
2.2.2 River input
Data sources
River load data for the main continental rivers were taken from the report by Pätsch and Lenhart (2008) that was kept up to date continuously so that data for the years 2007–2009 were also available (https://wiki.cen.uni-hamburg.de/ifm/ECOHAM/DATA_RIVER, last access: 22 January 2019). They calculated daily loads of nutrients and organic matter based on data provided by the different river authorities. Additionally, loads of the Eider were calculated according to Johannsen et al. (2008).
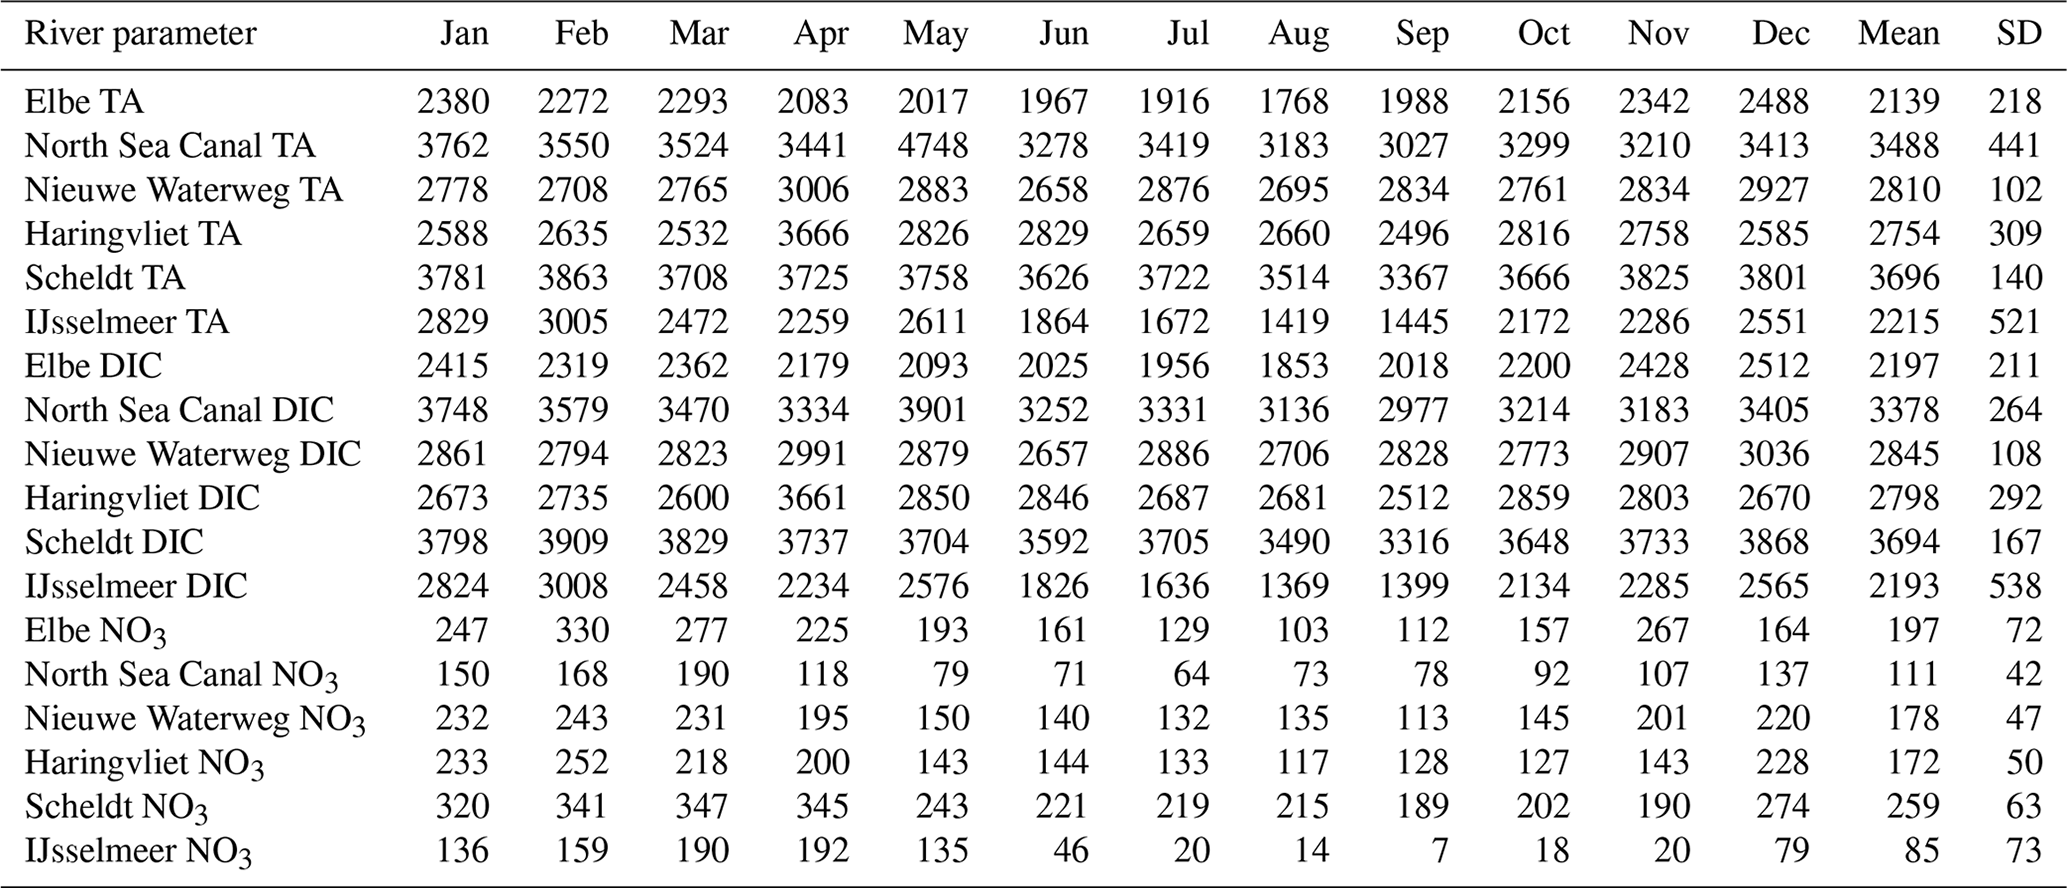
Up to now, all ECOHAM applications used constant riverine DIC concentrations. TA was not used. For the study at hand we introduced time-varying riverine TA and DIC values. New data of freshwater discharge were introduced, as well as TA and DIC loads for the British rivers (Neal, 2002). Monthly mean concentrations of nitrate, TA, and DIC were added for the Dutch rivers (https://data.europa.eu/euodp/de/data/dataset/data_waterbase-rivers-7, last access: 15 June 2020) and for the German river Elbe (Amann et al., 2015). The Dutch river data were observed in the years 2007–2009. The Elbe data were taken in the years 2009–2011. These concentration data were prescribed for all simulation years as mean annual cycle.
The data sources and positions of the river mouths of all 16 rivers are shown in Table A2 and in Fig. 1. The respective riverine concentrations of TA and DIC are given in Table A3. Schwichtenberg (2013) describes the river data in detail.
A few small floodgates (Siele) and rivers transport fresh water from the recharge areas into the intertidal areas (Streif, 1990). The recharge areas for these inlets differ considerably from each other, leading to different relative contributions for the freshwater input. Whereas the catchments of Schweiburger Siel (22.2 km2) and the Hooksieler Binnentief are only of minor importance, the Vareler Siel, the Eckenwarder Siel, and the Maade Siel are of medium importance, and the highest contribution may originate from Wangersiel, Dangaster Siel, and Jade-Wapeler Siel (Lipinski, 1999).
Effective river input
In order to analyse the net effect on concentrations in the sea due to river input, the effective river input (Riveff; Gmol yr−1) is introduced:
with ΔC|riv (µmol kg−1) being the concentration change in the river mouth cell due to river load (riv) and the freshwater flux from the river. V (L) is the volume of the river mouth cell; ρ (kg L−1) is density of water; yr is 1 year; C (10−15) is a constant.
Bulk alkalinity discharged by rivers is quite large, but most of the rivers entering the North Sea (here the German Bight) have lower TA concentrations than the seawater. In the case of identical concentrations, the effective river load Riveff is zero. The TA-related molecules enter the sea, and in most cases, they leave it via transport. In the case of tracing or budgeting both the real TA river discharge and the transport must be recognised. In order to understand TA concentration changes in the sea, Riveff is appropriate.
2.2.3 Meteorological forcing
The meteorological forcing was provided by NCEP Reanalysis (Kalnay et al., 1996) and interpolated on the model grid field. It consisted of 6-hourly fields of air temperature, relative humidity, cloud coverage, wind speed, atmospheric pressure, and wind stress for every year. Mean shortwave radiation were calculated 2-hourly and daily from astronomic insolation and cloudiness with an improved formula (Lorkowski et al., 2012).
2.3 The Wadden Sea
2.3.1 Implementation of Wadden Sea dynamics
For the present study the exchange of TA and DIC between the North Sea and the Wadden Sea was implemented into the model by defining sinks and sources of TA and DIC for some of the southeastern cells of the North Sea grid (Fig. 1). The cells with adjacent Wadden Sea were separated into three exchange areas: the East Frisian Wadden Sea, the North Frisian Wadden Sea, and Jade Bight, marked by E, N, and J (Fig. 1c).
Two parameters were determined in order to quantify the TA and DIC exchange between the Wadden Sea and the North Sea:
-
concentration changes in pelagic TA and DIC in the Wadden Sea during one tide and
-
water mass exchange between the back-barrier islands and the open sea during one tide.
Measured concentrations of TA and DIC (Winde, 2013; Winde et al., 2014) as well as modelled water mass exchange rates of the export areas by Grashorn (2015) served as bases for the calculated exchange. Details on flux calculations and measurements are described below. The daily Wadden Sea exchange of TA and DIC was calculated as
Differences in measured concentrations in the Wadden Sea during rising and falling water levels, as described in Sect. 2.3.2, were temporally interpolated and summarised as wad_sta (mmol m−3). Modelled daily Wadden Sea exchange rates of water masses (tidal prisms during falling water levels) were defined as wad_exc (m3 d−1), and the volume of the corresponding North Sea grid cell was vol (m3). The daily concentration changes in TA and DIC in the respective North Sea grid cells were defined as wad_flu (mmol m−3 d−1).
In fact, some amounts of the tidal prisms return without mixing with North Sea water, and calculations of Wadden Sea–North Sea exchange should therefore consider flushing times in the respective back-barrier areas. Since differences in measured concentrations between rising and falling water levels were used, this effect is already assumed to be represented in the data. This approach enabled the use of tidal prisms without consideration of any flushing times.
2.3.2 Wadden Sea – measurements
The flux calculations for the Wadden Sea–North Sea exchange were carried out in tidal basins of the East and North Frisian Wadden Sea (Spiekeroog island, Sylt–Rømø) as well as in Jade Bight. For the present study seawater samples represented tidal cycles during different seasons (Winde, 2013). The mean concentrations of TA and DIC during rising and falling water levels and the respective differences (ΔTA and ΔDIC) are given in Table 1. Measurements in August 2002 were taken from Moore et al. (2011). The Δ values were used as wad_sta and were linearly interpolated between the times of observations for the simulations. In this procedure, the linear progress of the Δ values does not represent the natural behaviour perfectly, especially if only few data are available. As a consequence, possible short events of high TA and DIC export rates that occurred in periods outside the observation periods may have been missed.
Table 1Mean TA and DIC concentrations (µmol L−1) during rising and falling water levels and the respective differences (Δ values) that were used as wad_sta in (1). Areas are the North Frisian Wadden Sea (N), the East Frisian Wadden Sea (E), and Jade Bight (J).
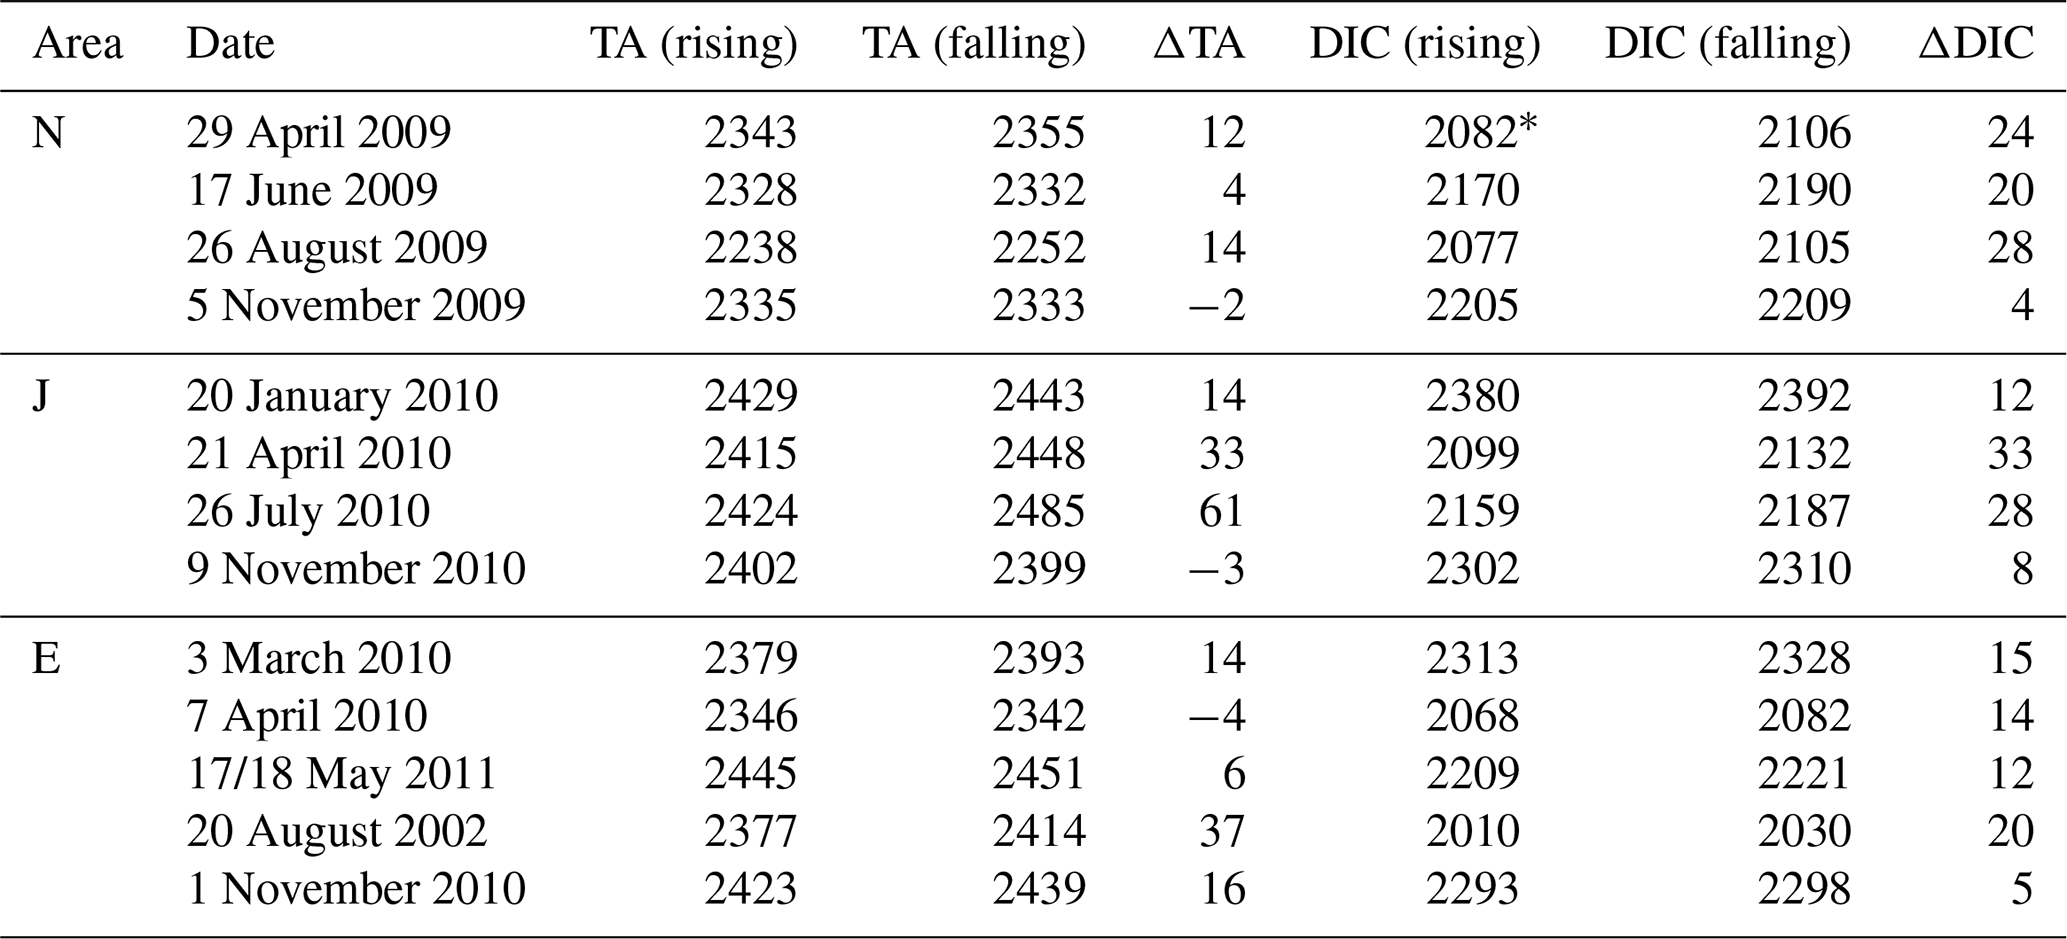
∗ This value was estimated.
Due to the low number of concentration measurements a statistical analysis of uncertainties in ΔTA and ΔDIC was not possible. They were measured with a lag of 2 h after low tide and high tide. This was done in order to obtain representative concentrations of rising and falling water levels. As a consequence, only two to three measurements for each location and season were considered for calculations of ΔTA and ΔDIC.
2.3.3 Wadden Sea – modelling the exchange rates
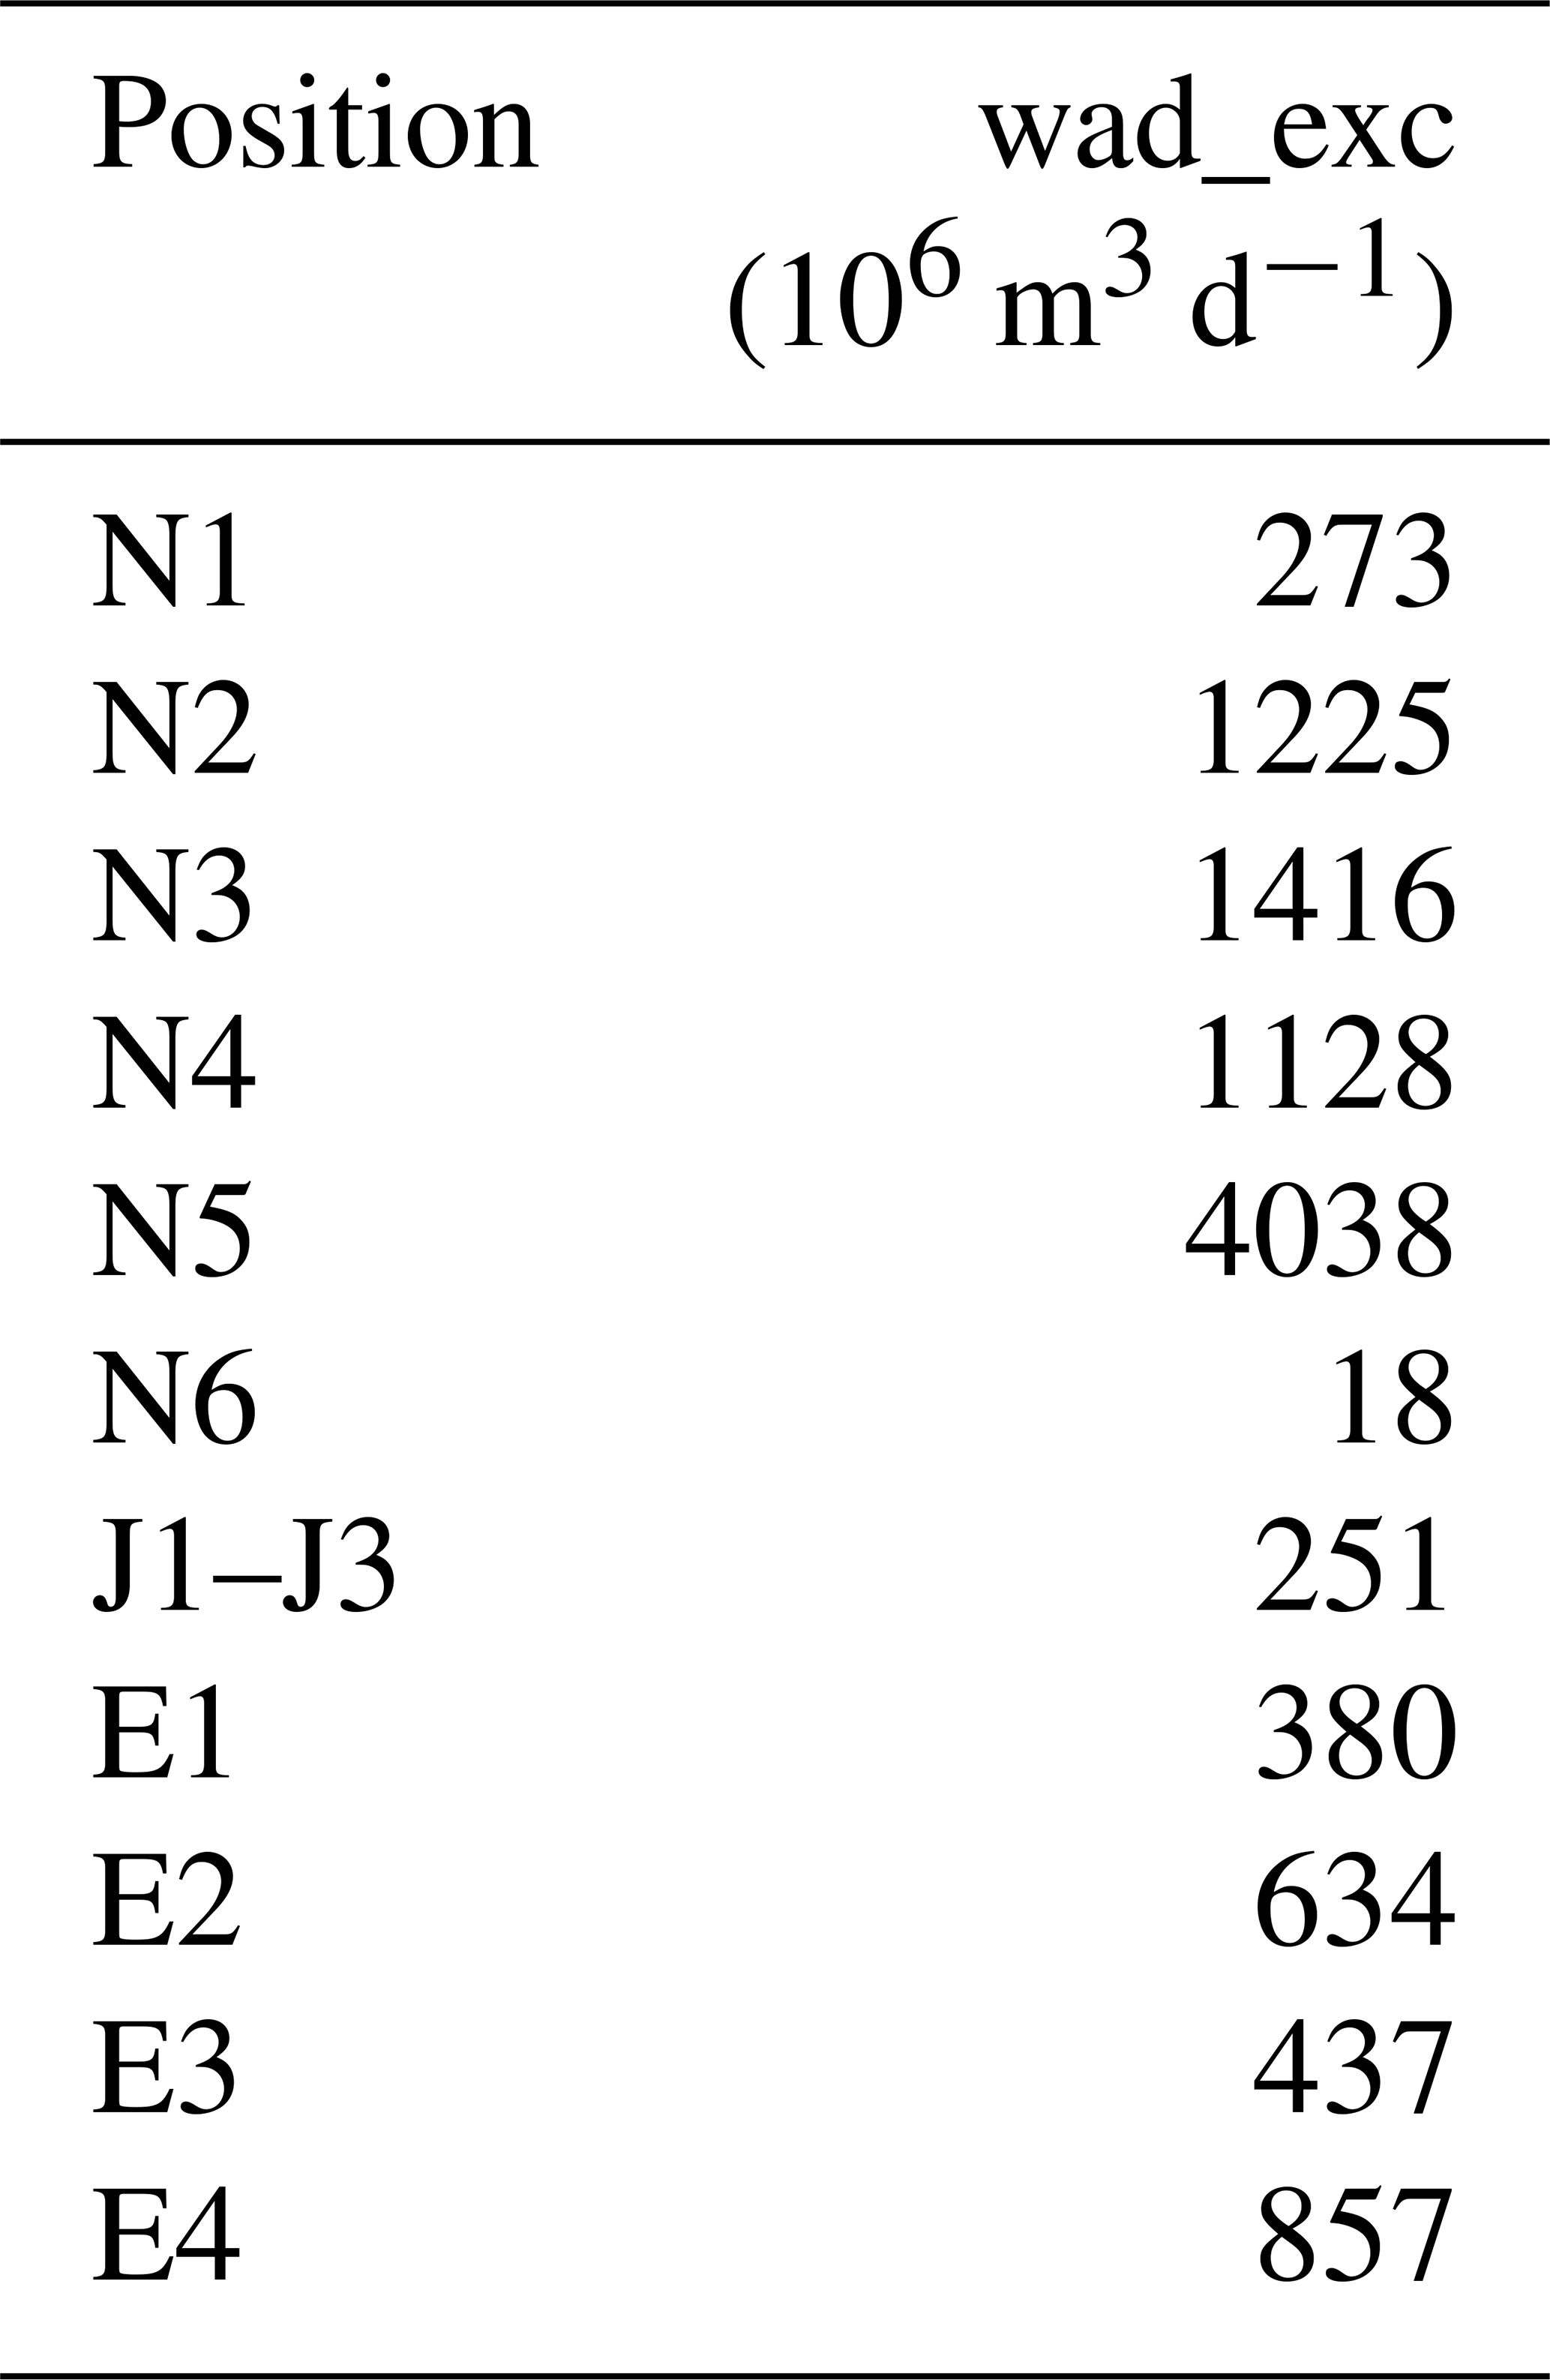
Grashorn (2015) performed the hydrodynamic computations of exchanged water masses (wad_exc) with the model FVCOM (Chen et al., 2003) by adding up the cumulative seaward transport during falling water levels (tidal prisms) between the back-barrier islands that were located near the respective ECOHAM cells with adjacent Wadden Sea area. These values are given in Table 2 for each ECOHAM cell in the respective export areas. The definition of the first cell N1 and the last cell E4 is in accordance with the clockwise order in Fig. 1c. The mean daily runoff of all N, J, and E positions was 8.1, 0.8, and 2.3 km3 d−1, respectively.
Table 2Daily Wadden Sea runoff to the North Sea at different export areas.
2.3.4 Additional Sampling of DIC and TA
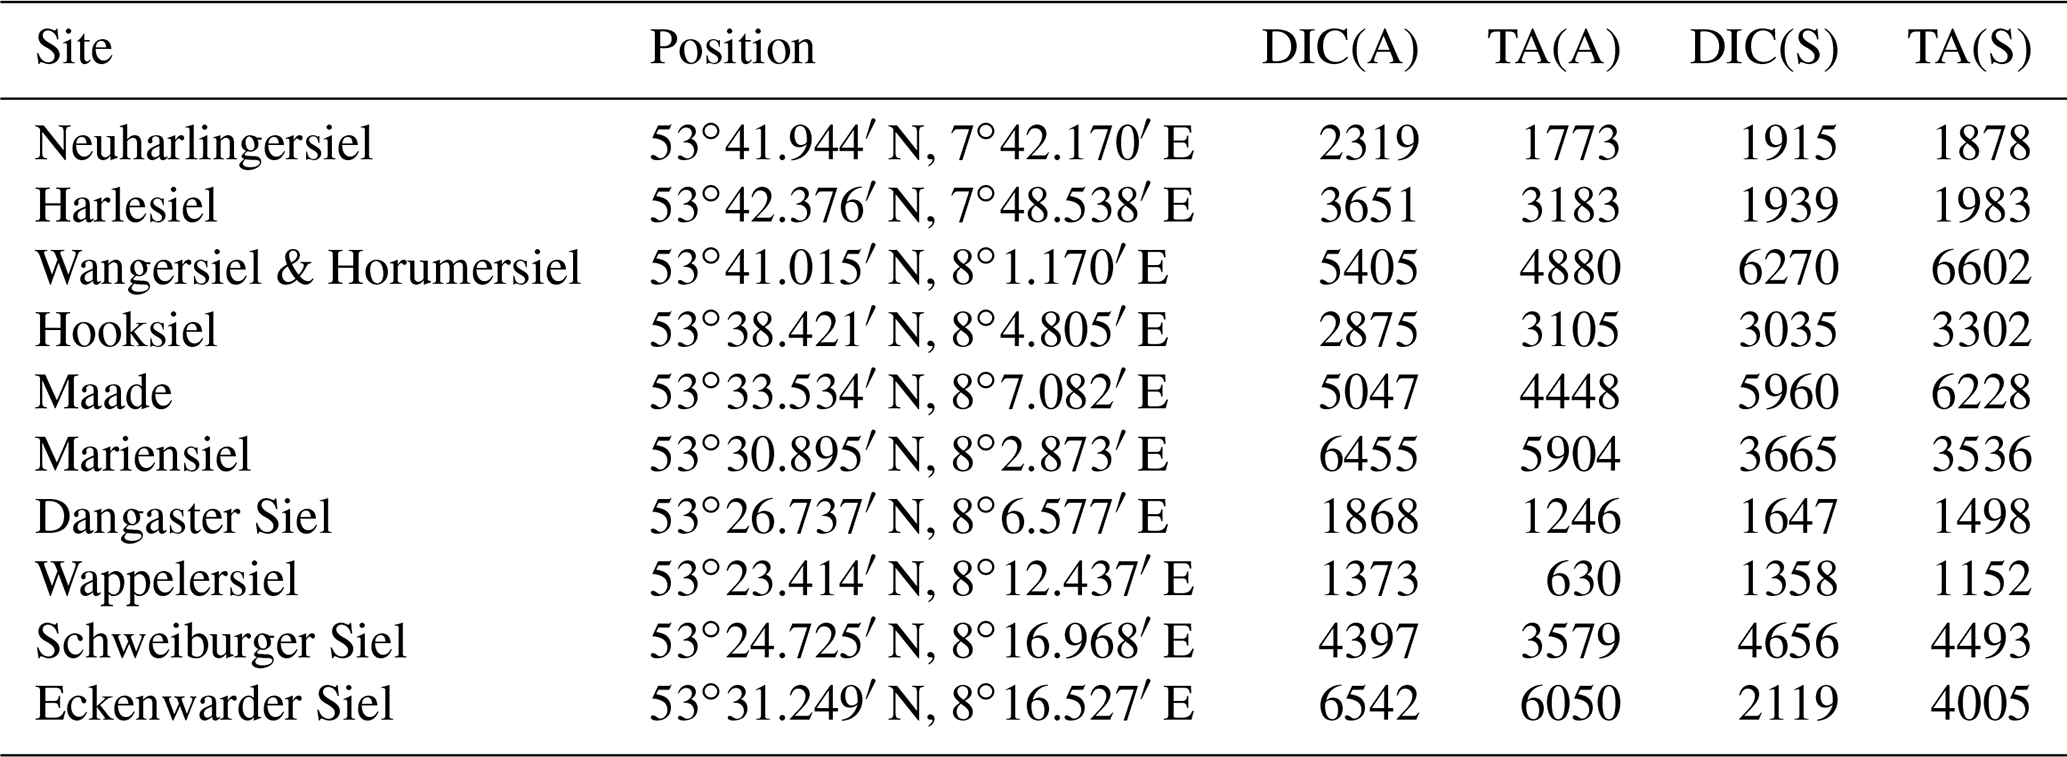
DIC and TA for selected freshwater inlets sampled in October 2010 and May 2011 are presented in Table 3. Sampling and analyses took place as described by Winde et al. (2014) and are here reported for completeness and input for discussion only. The autumn data are deposited under https://doi.org/10.1594/PANGEA.841976. The samples for TA measurements were filled without headspace into pre-cleaned 12 cm3 Exetainer® vials, filled with 0.1 mL saturated HgCl2 solution. The samples for DIC analysis were completely filled into 250 cm3 ground-glass-stoppered bottles and then poisoned with 100 µL of a saturated HgCl2 solution. The DIC concentrations were determined at the Leibniz Institute for Baltic Sea Research (IOW) by coulometric titration according to Johnson et al. (1993), using reference material provided by Andrew G. Dickson (University of California, San Diego; Dickson et al., 2003) for the calibration (batch 102). TA was measured by potentiometric titration using HCl with a Schott titri plus equipped with an IoLine electrode A157. Standard deviations for DIC and TA measurements were better than ±2 and ±10 µmol kg−1, respectively.
Table 3Examples for the carbonate system composition of small freshwater inlets draining into Jade Bight and the back-barrier tidal area of Spiekeroog island, given in micromoles per kilogram. Autumn results (A; 31 October 2010) are taken from Winde et al. (2014); spring sampling (S) took place on 20 May 2011.
2.4 Statistical analysis
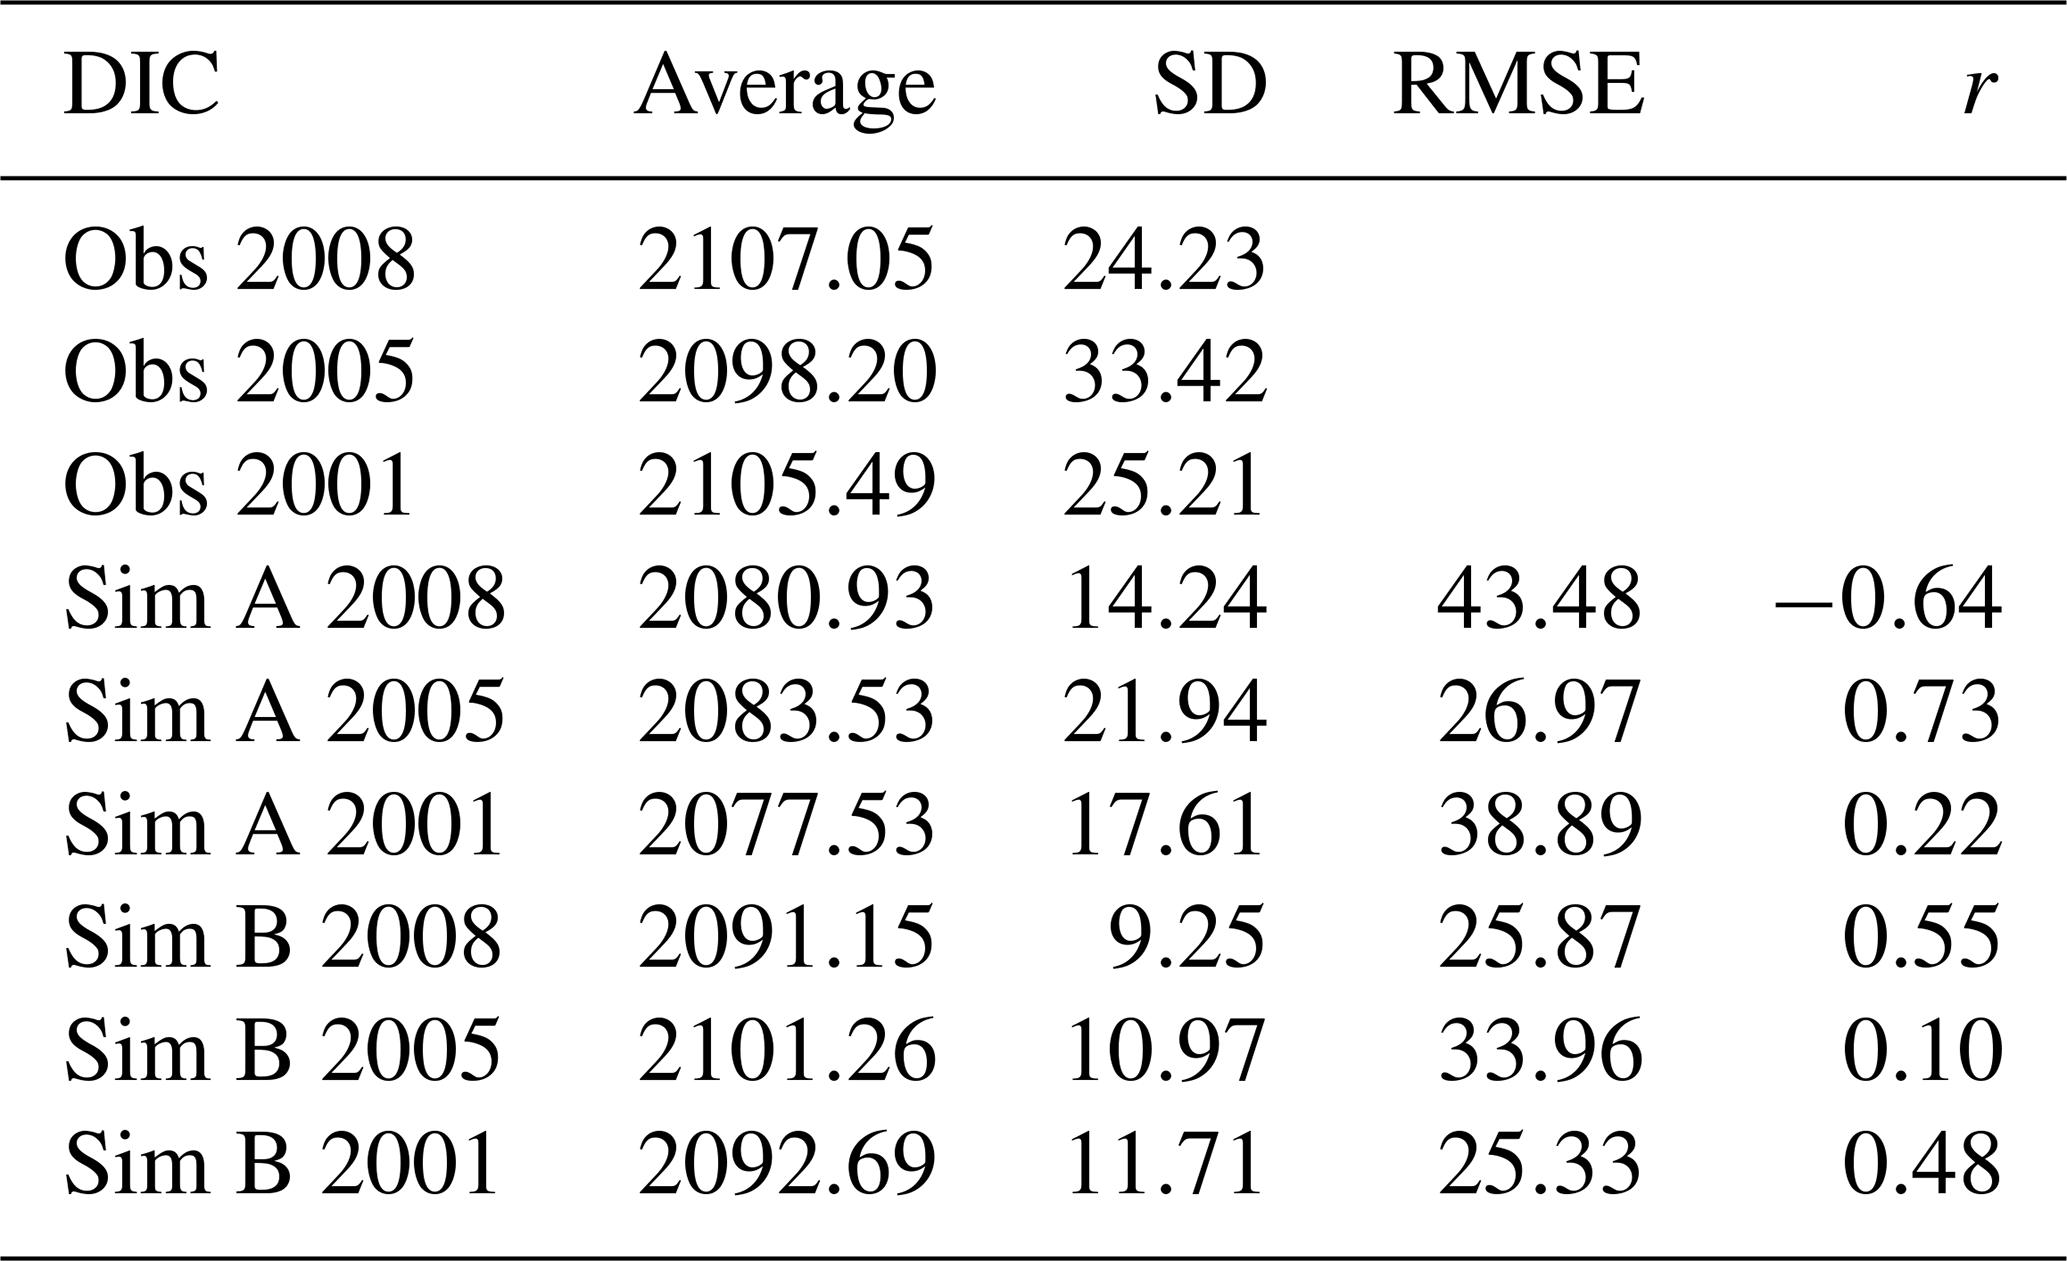
A statistical overview of the simulation results in comparison to the observations (Salt et al., 2013) is given in Tables 4 and 5. In the validation area (magenta box in Fig. 1) observations of 10 different stations were available, each with four to six measurements at different depths (51 measured points). Measured TA and DIC of each point were compared with modelled TA and DIC in the respective grid cells, respectively. The standard deviation (SD), root mean square error (RMSE), and correlation coefficient (r) were calculated for each simulation. In addition to the year 2008, which we focus on in this study, observations were performed at the same positions in summer 2005 and 2001. These data are also statistically compared with the model results.
Table 4Average (µmol kg−1), standard deviation (µmol kg−1), RMSE (µmol kg−1), and correlation coefficient r for the observed TA concentrations and the corresponding scenarios A and B within the validation area.
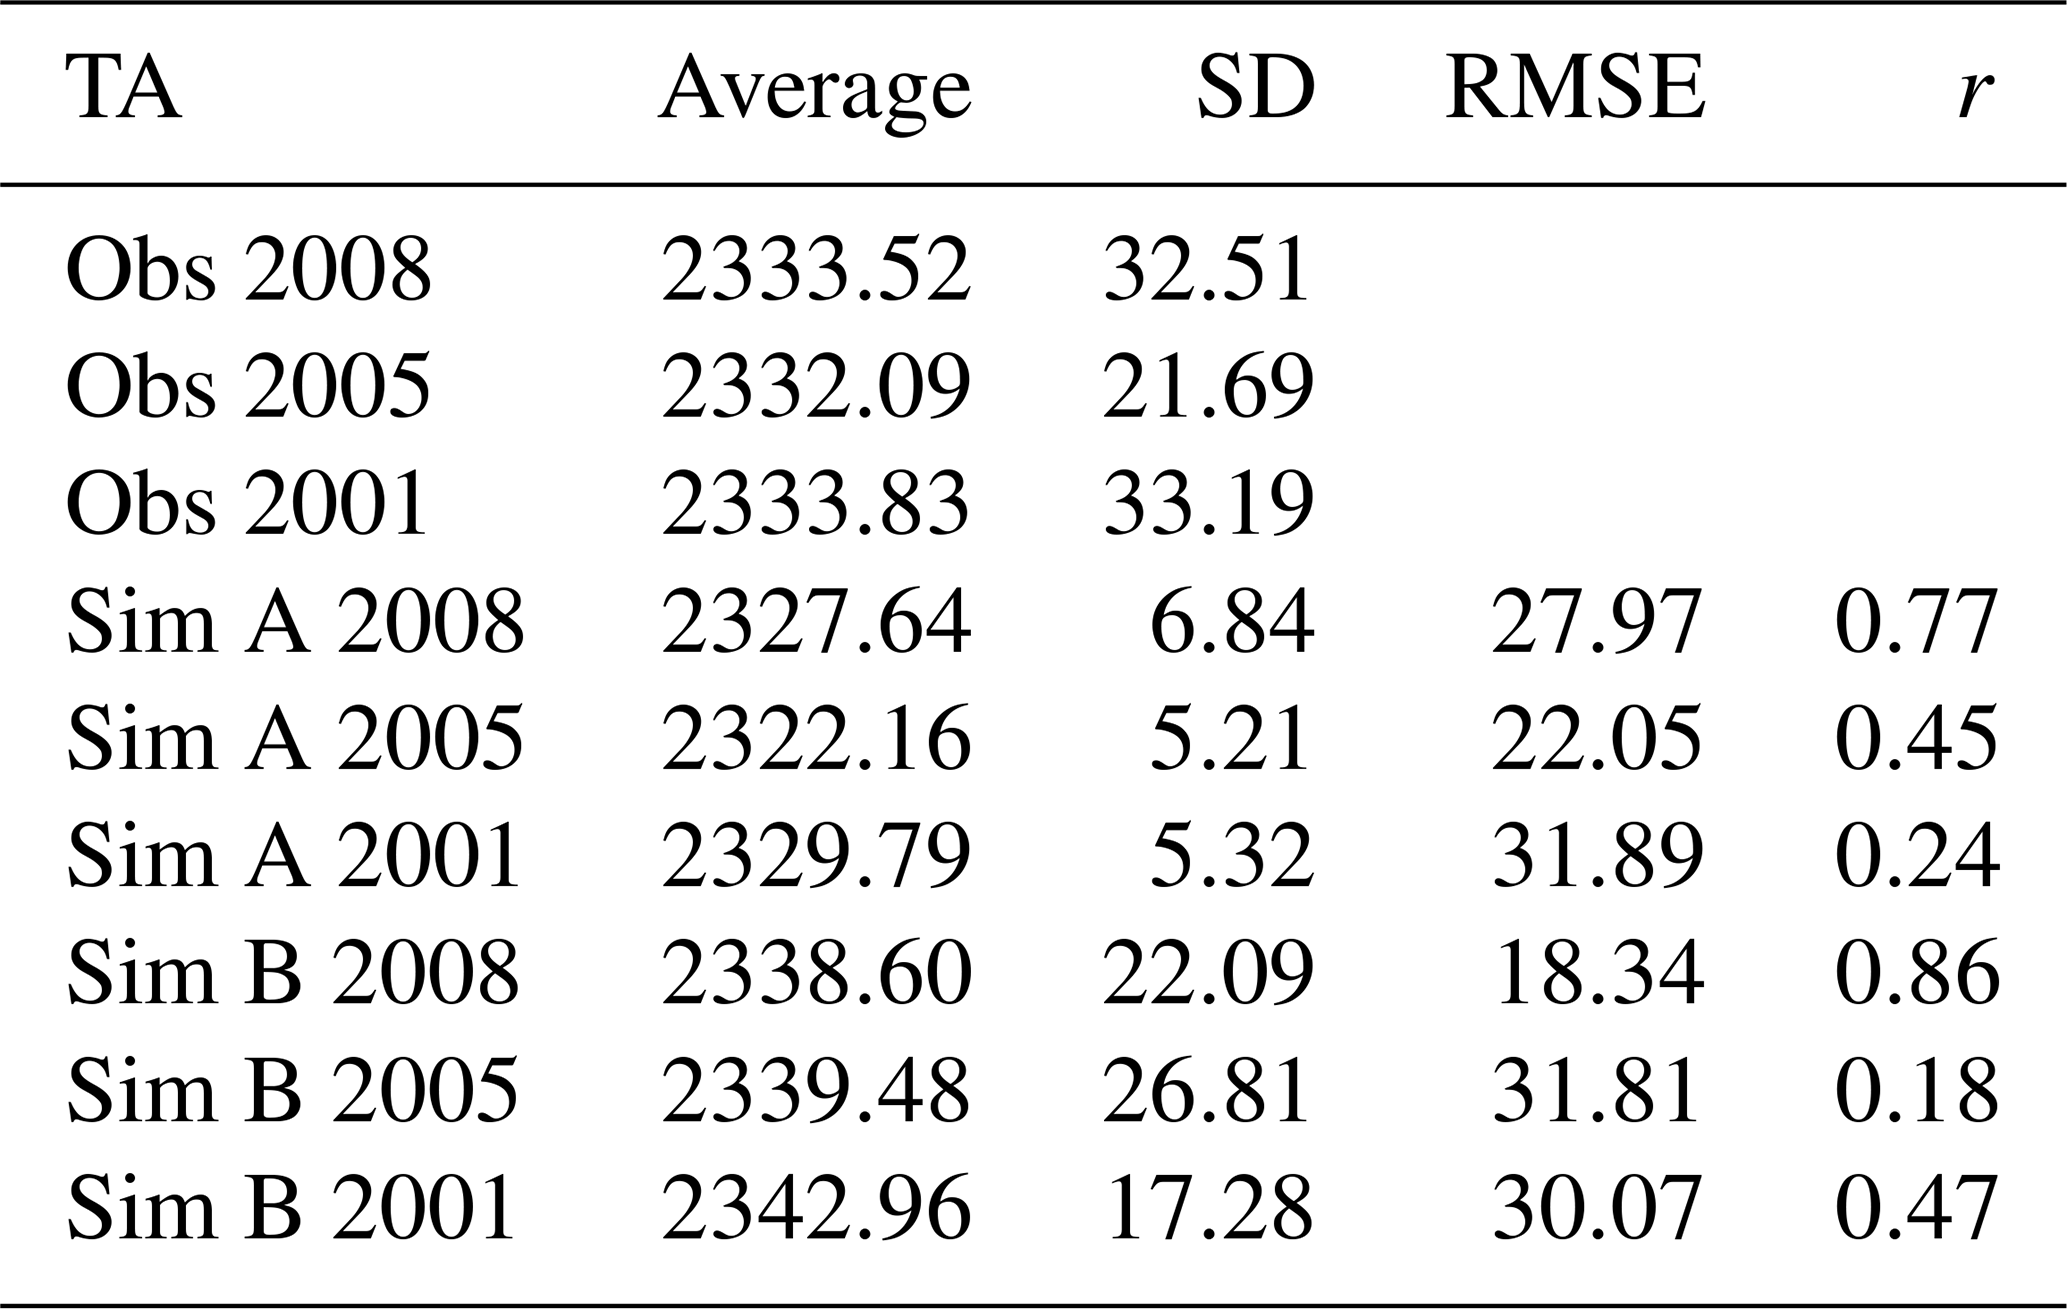
Table 5Average (µmol kg−1), standard deviation (µmol kg−1), RMSE (µmol kg−1), and correlation coefficient r for the observed DIC concentrations and the corresponding scenarios A and B within the validation area.
3.1 Model validation – TA in summer 2008
The results of scenarios A and B were compared with observations of TA in August 2008 (Salt et al., 2013) for surface water. The observations revealed high TA levels in the German Bight (east of 7∘ E and south of 55∘ N) and around the Danish coast (around 56∘ N) as shown in Fig. 3a. The observed concentrations in these areas ranged between 2350 and 2387 µmol TA kg−1. These findings were in accordance with observed TA in August and September 2001 (Thomas et al., 2009). TA in other parts of the observation domain ranged between 2270 µmol TA kg−1 near the British coast (53–56∘ N) and 2330 µmol TA kg−1 near the Dutch coast and the English Channel. In the validation box the overall average and the standard deviation of all observed TA concentrations (SD) was 2334 and 33 µmol TA kg−1, respectively.
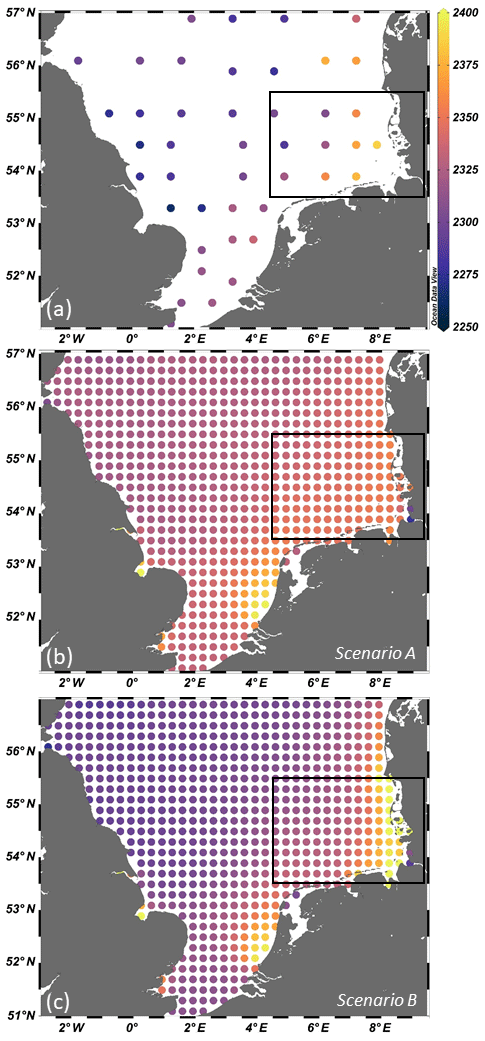
Figure 3Surface TA (µmol TA kg−1) in August 2008 observed (a) and simulated with scenario A (b) and B (c). The black lines indicate the validation box.
In scenario A the simulated surface TA showed a more homogeneous pattern than observations with maximum values of 2396 µmol TA kg−1 at the western part of the Dutch coast and even higher values (2450 µmol TA kg−1) in the river mouth of the Wash estuary at the British coast. Minimum values of 2235 and 2274 µmol TA kg−1 were simulated at the mouths of the rivers Elbe and Forth. The modelled TA ranged from 2332 to 2351 µmol TA kg−1 in the German Bight and in Jade Bight. The strongest underestimations in relation to observations are located in a band close to the coast stretching from the East Frisian Islands to 57∘ N at the Danish coast (Fig. 4a). The deviation of simulation results of scenario A from observations in the validation box was represented by an RMSE of 28 µmol TA kg−1. The standard deviation was 7 µmol TA kg−1, and the correlation amounted to r=0.77 (Table 4). In the years 2005 and 2001 similar statistical values are found, but the correlation coefficient was smaller.
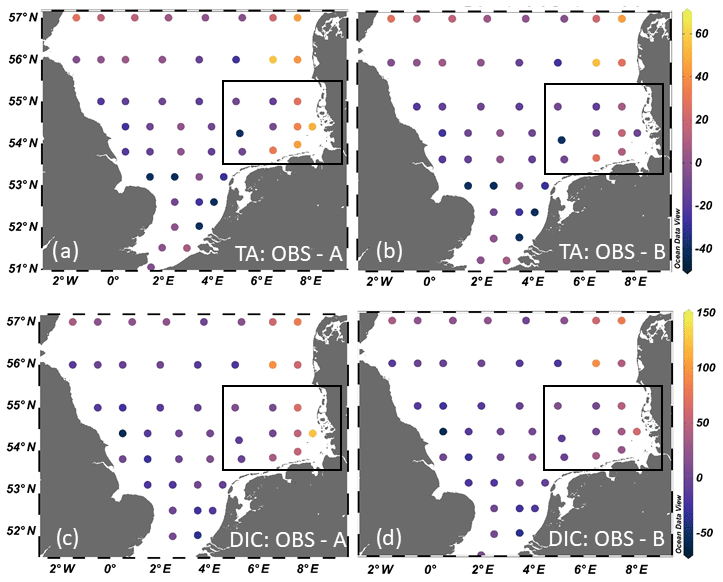
Figure 4Differences between TA surface summer observations and results from scenario A (a) and B (b) and the differences between DIC surface observations and results from scenario A (c) and B (d), all in micromoles per kilogram. The black lines indicate the validation box.
Scenario B was based on a Wadden Sea export of TA and DIC as described above. The major difference in TA of this scenario compared to scenario A occurred east of 6.5∘ E. Surface TA there peaked in Jade Bight (2769 µmol TA kg−1) and was elevated off the North Frisian and Danish coasts from 54.2 to 56∘ N (>2400 µmol TA kg−1). The strongest underestimations in relation to observations are noted off the Danish coast between 56 and 57∘ N (Fig. 4b). In the German Bight the model overestimated the observations slightly, while at the East Frisian Islands the model underestimates TA. When approaching the Dutch Frisian Islands the simulation overestimates TA compared to observations, and the strongest overestimations can be seen near the river mouth of the Rhine. Compared to scenario A the simulation of scenario B was closer to the observations in terms of RMSE (18 µmol TA kg−1) and the standard deviation (SD = 22 µmol TA kg−1). Also, the correlation (r=0.86) improved (Table 4). In the years 2001 and 2005 the observed mean values are slightly overestimated by the model. The statistical values for 2001 are better than for 2005, where scenario A better compares with the observations.
3.2 Model validation – DIC concentrations in summer 2008
Analogously to TA the simulation results were compared with surface observations of DIC in summer 2008 (Salt et al., 2013). They also revealed high values in the German Bight (east of 7∘ E and south of 55∘ N) and around the Danish coast (near 56∘ N), which is shown in Fig. 5. The observed DIC concentrations in these areas ranged between 2110 and 2173 µmol DIC kg−1. Observed DIC concentrations in other parts of the model domain ranged between 2030 and 2070 µmol DIC kg−1 in the northwestern part and between 2080 and 2117 µmol DIC kg−1 at the Dutch coast. In the validation box the overall average and the standard deviation of all observed DIC concentrations were 2108 and 25.09 µmol DIC kg−1, respectively.
Figure 5Surface DIC concentrations (µmol DIC kg−1) in August 2008 observed (a) and simulated with scenario A (b) and B (c). The black lines indicate the validation box.
The DIC concentrations in scenario A ranged between 1935 and 1977 µmol DIC kg−1 at the North Frisian and Danish coast (54.5–55.5∘ N) and 1965 µmol DIC kg−1 in Jade Bight. Maxima of up to 2164 µmol DIC kg−1 were modelled at the western part of the Dutch coast north of the mouth of the Rhine (Fig. 5). The DIC concentrations in the German Bight showed a heterogeneous pattern in the model, and sometimes values decreased from west to east, which contrasts the observations (Fig. 5a). This may be the reason for the negative correlation coefficient between model and observations (Table 5). The significant deviation from observations of results from scenario A is also indicated by the RMSE of 43 µmol DIC kg−1 and a standard deviation of 14 µmol DIC kg−1. In 2001 and 2005 the simulation results of this scenario A are better, which is expressed in positive correlation coefficients and small RMSE values.
In scenario B the surface DIC concentrations at the Wadden Sea coasts increased: the North Frisian coast shows concentrations of up to 2200 µmol DIC kg−1, while the German Bight has values of 2100–2160 µmol DIC kg−1, and Jade Bight concentrations were higher than 2250 µmol DIC kg−1. The other areas are comparable to scenario A. In scenario B the RMSE in the validation box decreased to 26 µmol DIC kg−1 in comparison to scenario A. The standard deviation decreased to 9.1 µmol DIC kg−1, and the correlation improved to r=0.55 (Table 5). The average values are close to the observed ones for all years, even though in 2005 a large RMSE was found.
The comparison between observations and simulation results of scenario A (Fig. 4c) clearly show model underestimations in the southeastern area, which are strongest in the inner German Bight towards the North Frisian coast (> 120 µmol DIC kg−1). Scenario B also models values lower than observations in the southeastern area (Fig. 4d), but the agreement between observations and model results is reasonable. Only off the Danish coast near 6.5∘ E, 56∘ N, the model underestimates DIC by 93 µmol DIC kg−1.
3.3 Hydrodynamic conditions and flushing times
The calculations of Wadden Sea TA export in Thomas et al. (2009) were based on several assumptions concerning riverine input of bulk TA and nitrate, atmospheric deposition of NOx, water column inventories of nitrate, and the exchange between the Southern Bight and the adjacent North Sea (Lenhart et al., 1995). The latter was computed by considering that the water in the Southern Bight is flushed with water of the adjacent open North Sea at timescales of 6 weeks. For the study at hand, flushing times in the validation area in summer and winter are presented for the years 2001 to 2009 in Fig. 6. Additionally, monthly mean flow patterns of the model area are presented for June, July, and August for the years 2003 and 2008, respectively (Fig. 7). They were chosen to highlight the pattern in summer 2003 with one of the highest flushing times (lowest water renewal times) and that in 2008 corresponding to one of the lowest flushing times (highest water renewal times).

Figure 6Flushing times in the validation area in summer (June to August) and winter (January to March). The whole validation area is represented in blue; green is the western part of the validation area (4.5 to 7∘ E), and red is the eastern part (east of 7∘ E).
Figure 7Monthly mean simulated streamlines for summer months 2003 and 2008.
The flushing times were determined for the three areas: 1 – validation area, 2 – western part of the validation area, 3 – eastern part of the validation area. They were calculated by dividing the total volume (Vi) of the respective areas 1–3 by the total inflow (Fi) into the areas
Flushing times (rounded to integer values) were consistently higher in summer than in winter, meaning that the highest inflow occurred in winter. Summer flushing times in the whole validation area ranged from 54 d in 2008 to 81 d in 2003 and 2006, whereas the winter values in the same area ranged from 32 d in 2008 to 51 d in 2003 and 2009. The flushing times in the western and eastern part of the validation area were smaller due to the smaller box sizes. Due to the position, flushing times in the western part were consistently shorter than in the eastern part. These differences ranged from 5 d in winter 2002 to 14 d in summer 2006 and 2008. The interannual variabilities in all areas were higher in summer than in winter.
The North Sea is mainly characterised by an anti-clockwise circulation pattern (Otto et al., 1990; Pätsch et al., 2017). This can be observed for the summer months in 2008 (Fig. 7). More disturbed circulation patterns in the southeastern part of the model domain occurred in June 2003: in the German Bight and in the adjacent western area two gyres with reversed rotating direction are dominant. In August 2003 the complete eastern part shows a clockwise rotation which is due to the effect of easterly winds as opposed to prevalent westerlies. In this context such a situation is called a meteorological blocking situation.
3.4 Seasonal and interannual variability in TA and DIC
The period from 2001 to 2009 was simulated for the scenarios A and B. For both scenarios monthly mean surface TA was calculated in the validation area and is shown in Fig. 8a and b. The highest TA in scenario A was 2329 µmol TA kg−1 and occurred in July 2003. The lowest TA in each year was about 2313 to 2318 µmol TA kg−1 and occurred in February and March. Scenario B showed generally higher values: summer concentrations were in the range of 2348 to 2362 µmol TA kg−1, and the values peaked in 2003. The lowest values occurred in the years 2004–2008. Also, winter values were higher in scenario B than in scenario A: they range from 2322 to 2335 µmol TA kg−1.
Figure 8Simulated monthly mean TA (scenario A in a, scenario B in b; µmol TA kg−1) and DIC (scenario A in c, scenario B in d; µmol DIC kg−1) in the validation area for the years 2001–2009.
Corresponding to TA, monthly mean surface DIC in the validation area is shown in Fig. 8c and d. In scenario A the concentrations increased from October to February and decreased from March to August (Fig. 8c). In scenario B the time interval with increasing concentrations was extended into March. Maximum values of 2152 to 2172 µmol DIC kg−1 in scenario A occur in February and March of each model year, and minimum values of 2060 to 2080 µmol DIC kg−1 occur in August. Scenario B shows generally higher values: the highest values in February and March are 2161 to 2191 µmol DIC kg−1. The lowest values in August range from 2095 to 2112 µmol DIC kg−1. The amplitude of the annual cycle is smaller in scenario B, because the Wadden Sea export shows the highest values in summer (Fig. 2).
The patterns of monthly TA and DIC of the reference scenario A differ drastically in that TA does not show a strong seasonal variability, whereas DIC does vary significantly. In the case of DIC this is due to the biological drawdown during summer. Contrariwise, the additional input (scenario B) from the Wadden Sea in summer creates a strong seasonality for TA and instead flattens the variations in DIC.
Thomas et al. (2009) estimated the contribution of shallow intertidal and subtidal areas to the alkalinity budget of the SE North Sea. That estimate (by closure of mass fluxes) was about 73 Gmol TA yr−1 originating from the Wadden Sea fringing the southern and eastern coast. These calculations were based on observations from the CANOBA dataset in 2001 and 2002. The observed high TA levels in the southeastern North Sea were also encountered in August 2008 (Salt et al., 2013), and these measurements were used for the main model validation in this study. Our simulations result in 39 Gmol TA yr−1 as export from the Wadden Sea into the North Sea. Former modelling studies of the carbonate system of the North Sea (Artioli et al., 2012; Lorkowski et al., 2012) did not consider the Wadden Sea as a source of TA and DIC, and good to reasonable agreement with observations from the CANOBA dataset was only achieved in the open North Sea in 2001–2002 (Thomas et al., 2009). Subsequent simulations that included TA export from aerobic and anaerobic processes in the sediment improved the agreement between data and models (Pätsch et al., 2018). When focusing on the German Bight, however, the observed high TA levels in summer measurements east of 7∘ E could not be simulated satisfactorily.
The present study confirms the Wadden Sea as an important TA source for the German Bight and quantifies the annual Wadden Sea TA export rate at 39 Gmol TA yr−1. Additionally, the contributions by most important rivers have been more precisely quantified and narrow down uncertainties in the budgets of TA and DIC in the German Bight. All steps that were required to calculate the budget including uncertainties are discussed in the following.
4.1 Uncertainties in Wadden Sea–German Bight exchange rates of TA and DIC
The Wadden Sea is an area of effective benthic decomposition of organic material (Böttcher et al., 2004; Billerbeck et al., 2006; Al-Raei et al., 2009; van Beusekom et al., 2012) originating both from land and from the North Sea (Thomas et al., 2009). In general, anaerobic decomposition of the organic matter generates TA and increases the CO2 buffer capacity of seawater. On longer timescales TA can only be generated by processes that involve permanent loss of anaerobic remineralisation products (Hu and Cai, 2011). A second precondition is the nutrient availability to produce organic matter, which in turn serves as a necessary component of anaerobic decomposition (Gustafsson et al., 2019). The Wadden Sea export rates of TA and DIC modelled in the present study are based on concentration measurements during tidal cycles in the years 2002 and 2009 to 2011 (Table 1) and on calculated tidal prisms of 2 d periods that are considered to be representative of annual mean values. This approach introduces uncertainties with respect to the true amplitudes of concentrations differences in the tidal cycle and in seasonality due to the fact that differences in concentrations during falling and rising water levels were linearly interpolated. These interpolated values are based on four to five measurements in the three export areas and were conducted in different years. Consequently, the approach does not reproduce the exact TA and DIC levels in the years 2001 to 2009, because only meteorological forcing, river loads, and nitrogen deposition were specified for these particular years. The simulation of scenario B thus only approximates Wadden Sea export rates. More measurements distributed with higher resolution over the annual cycle would clearly improve our estimates. Nevertheless, the implementation of Wadden Sea export rates here results in improved reproduction of observed high TA levels in the German Bight in summer in comparison to the reference run A (Fig. 3).
We calculated the sensitivity of our modelled annual TA export rates on uncertainties in the Δ values of Table 1. As the different areas of the North and East Frisian Wadden Sea and Jade Bight have different exchange rates of water, for each region the uncertainty of 1 µmol kg−1 in ΔTA at all times has been calculated. The East Frisian Wadden Sea export would differ by 0.84 Gmol TA yr−1, the Jade Bight export by 0.09 Gmol TA yr−1, and the North Frisian export by 3 Gmol TA yr−1.
Primary processes that contribute to the TA generation in the Wadden Sea are denitrification, sulfate reduction, or processes that are coupled to sulfate reduction and other processes (Thomas et al., 2009). In our model, the implemented benthic denitrification does not generate TA (Seitzinger and Giblin, 1996), because modelled benthic denitrification does not consume nitrate (Pätsch and Kühn, 2008). Benthic denitrification is coupled to nitrification in the upper layer of the sediment (Raaphorst et al., 1990), giving reason for neglecting TA generation by this process in the model. The modelled production of N2 by benthic denitrification falls in the range of 20–25 Gmol N yr−1 in the validation area, which would result in a TA production of about 19–23 Gmol TA yr−1 (Brenner et al., 2016). In the model nitrate uptake by phytoplankton produces about 40 Gmol TA yr−1. Assuming large parts of organic matter are exported out of the validation area, this production compensates for the missing TA generation by benthic denitrification. This amount of nitrate would not fully be available for primary production if parts of it were to be consumed by denitrification. Differently from this, the TA budget of Thomas et al. (2009) included estimates for the entire benthic denitrification as a TA generating process.
Sulfate reduction (not modelled here) also contributes to alkalinity generation. On longer timescales the net effect is vanishing as the major part of the reduced components are immediately reoxidised in contact with oxygen. Iron and sulfate reduction generates TA but only their reaction product iron sulfide (essentially pyrite) conserves the reduced components from reoxidation. As the formation of pyrite consumes TA, the TA contribution of iron reduction in the North Sea is assumed to be small and to balance that of pyrite formation (Brenner et al., 2016).
Atmospheric nitrogen deposition is taken into account in the simulations. Oxidised N species (NOx) dominate reduced species (NHy) slightly in the validation area during 6 out of 9 simulation years. This implies that the deposition of dissolved inorganic nitrogen decreases TA in 6 of 9 years. The average decrease within 6 years is about 0.4 Gmol TA yr−1, whereas the average increase within 3 years is only 0.1 Gmol TA yr−1. Thomas et al. (2009) also assumed a dominance of oxidised species and consequently defined a negative contribution to the TA budget.
Dissolution of biogenic carbonates may be an efficient additional enhancement of the CO2 buffer capacity (that is, source of TA), since most of the tidal flat surface sediments contain carbonate shell debris (Hild, 1997). Shallow oxidation of biogenic methane formed in deep or shallow tidal flat sediments (not modelled; Höpner and Michaelis, 1994; Neira and Rackemann, 1996; Böttcher et al., 2007) has the potential to both lower and enhance the buffer capacity, thus counteracting or promoting the respective effect of carbonate dissolution. The impact of methane oxidation on the developing TA ∕ DIC ratio in surface sediments, however, is complex and controlled by a number of superimposing biogeochemical processes (e.g. Akam et al., 2020).
The net effect of evaporation and precipitation in the Wadden Sea also has to be considered in budgeting TA. Although these processes are balanced in the North Sea (Schott, 1966), enhanced evaporation can occur in the Wadden Sea due to increased heating during low tide at around noon. Onken and Riethmüller (2010) estimated an annual negative freshwater budget in the Hörnum Basin based on long-term hydrographic time series from observations in a tidal channel. From these data a mean salinity difference between flood and ebb currents of approximately −0.02 is calculated. This would result in an increase in TA by 1 µmol TA kg−1, which is within the range of the uncertainty in measurements. Furthermore, the enhanced evaporation estimated from subtle salinity changes interferes with potential input of submarine groundwater into the tidal basins, which has been identified by Moore et al. (2011), Winde et al. (2014), and Santos et al. (2015). The magnitude of this input is difficult to estimate at present, for example from salinity differences between flood and ebb tides, because the composition of SGD passing the sediment–water interfacial mixing zone has to be known. Although first characteristics have been reported (Moore et al., 2011; Winde et al., 2014; Santos et al., 2015), the quantitative effect of additional DIC, TA, and nutrient input via both fresh and recirculated SGD into the Wadden Sea remains unclear.
Small inlets that provide fresh water as well as DIC and TA (Table 3) are of potential significance. The current database for seasonal dynamics of this source, however, is limited, and, therefore, this source cannot yet be considered quantitatively in budgeting approaches.
4.2 TA ∕ DIC ratios over the course of the year
Ratios of TA and DIC generated in the tidal basins (Table 1) give some indication of the dominant biogeochemical mineralisation and reoxidation processes occurring in the sediments of individual Wadden Sea sectors, although these processes have not been explicitly modelled here (Chen and Wang, 1999; Zeebe and Wolf-Gladrow, 2001; Thomas et al., 2009; Sippo et al., 2016; Wurgaft et al., 2019; Akam et al., 2020). Candidate processes are numerous, and the export ratios certainly express various combinations, but the most quantitatively relevant are likely aerobic degradation of organic material (resulting in a reduction in TA due to nitrification of ammonia to nitrate with a TA ∕ DIC ratio of −0.16), denitrification (TA ∕ DIC ratio of 0.8; see Rassmann et al., 2020), and anaerobic processes related to sulfate reduction in organoclastic material (TA ∕ DIC ratio of 1; see Sippo et al., 2016). Other processes are aerobic (adding only DIC) and anaerobic (TA ∕ DIC ratio of 2) oxidation of upward diffusing methane, oxidation of sedimentary sulfides upon resuspension into an aerated water column (no effect on TA ∕ DIC) followed by oxidation of iron (consuming TA), and nitrification of ammonium (consuming TA; TA ∕ DIC ratio is −2; see Pätsch et al., 2018, and Zhai et al., 2017).
The TA ∕ DIC export ratios of DIC and TA for the individual tidal basins in three Wadden Sea sectors (East Frisian, Jade Bight, and North Frisian) as calculated from observed ΔTA and ΔDIC over tidal cycles in different seasons are depicted in Fig. 9. They may give an indication of regionally and seasonally varying processes occurring in the sediments of the three study regions. The ratios vary between 0.2 and 0.5 in the North Frisian Wadden Sea with slightly more TA than DIC generated in spring, summer, and autumn and winter having a negative ratio of −0.5. The winter ratio coincides with very small measured differences in DIC in imported and exported waters ( µmol kg−1), and the negative TA ∕ DIC ratio may thus be spurious. The range of ratios in the other seasons is consistent with sulfate reduction and denitrification as the dominant processes in the North Frisian tidal basins.
Figure 9Temporally interpolated TA∕DIC ratio of the export rates in the North Frisian Wadden Sea, East Frisian Wadden Sea, and Jade Bight. These ratios are calculated using the Δ values of Table 1.
The TA ∕ DIC ratios in the Jade Bight samples were consistently higher than those in the North Frisian tidal basin and vary between 1 and 2 in spring and summer, suggesting a significant contribution by organoclastic sulfate reduction and anaerobic oxidation of methane (Al-Raei et al., 2009). The negative ratio of −0.4 in autumn is difficult to explain with remineralisation or reoxidation processes, but as with the fall ratio in the Frisian tidal basin, it coincides with a small change in ΔDIC (−3 µmol kg−1) at positive ΔTA (8 µmol kg−1). Taken at face value, the resulting negative ratio of −0.4 implicates a reoxidation of pyrite, normally at timescales of early diagenesis that is thermodynamically stable (Hu and Cai, 2011), possibly promoted by increasing wind forces and associated aeration and sulfide oxidation of anoxic sediment layers (Kowalski et al., 2013). The DIC export rate from Jade Bight had its minimum in autumn, consistent with a limited supply and mineralisation of organic matter, possibly modified by seasonally changing impacts from small tidal inlets (Table 3).
The TA ∕ DIC ratio of the East Frisian Wadden Sea is in the approximate range of those in Jade Bight but has one unusually high ratio in November caused by a significant increase in TA of 14 µmol kg−1 and a low increase of 5 µmol kg−1 in DIC. Barring an analytical artefact, the maximum ratio of 3 may reflect a short-term effect of iron reduction.
Based on these results, processes in the North Frisian Wadden Sea export area differ from the East Frisian Wadden Sea and the Jade Bight areas. The DIC export rates suggest that significant amounts of organic matter were degraded in North Frisian tidal basins, possibly controlled by higher daily exchanged water masses in the North Frisian (8.1 km3 d−1) than in the East Frisian (2.3 km3 d−1) Wadden Sea and in Jade Bight (0.8 km3 d−1; compare Table 2). However, TA export rates of the North Frisian and the East Frisian Wadden Sea were in the same range.
Regional differences in organic matter mineralisation in the Wadden Sea have been discussed by van Beusekom et al. (2012) and Kowalski et al. (2013) in the context of connectivity with the open North Sea and influences of eutrophication and sedimentology. They suggested that the organic matter turnover in the entire Wadden Sea is governed by organic matter import from the North Sea but that regionally different eutrophication effects as well as sediment compositions modulate this general pattern. The reason for regional differences may be related to the shape and size of the individual tidal basins. Van Beusekom et al. (2012) found that wider tidal basins with a large distance between barrier islands and mainland, as is the case in the North Frisian Wadden Sea, generally have a lower eutrophication status than narrower basins predominating in the East Frisian Wadden Sea. Together with the high-water exchange rate, the accumulation of organic matter is reduced in the North Frisian Wadden Sea, and the oxygen demand per volume is lower than in the narrower eutrophicated basins. Therefore, aerobic degradation of organic matter dominated in the North Frisian Wadden Sea, where the distance between barrier islands and the mainland is large. This leads to less TA production (in relation to DIC production) than in the East Frisian Wadden Sea, where anaerobic degradation of organic matter dominated in more restricted tidal basins.
4.3 TA budgets and variability in TA inventory in the German Bight
Modelled TA and DIC in the German Bight have a high interannual and seasonal variability (Fig. 8). The interannual variability in the model results is mainly driven by the physically prescribed environment. Overall, the TA variability is more sensitive to Wadden Sea export rates than DIC variability, because the latter is dominated by biological processes. However, the inclusion of Wadden Sea DIC export rates improved correspondence with observed DIC concentrations in the near-coastal North Sea.
It is a logical step to attribute the TA variability to variabilities in the different sources. In order to calculate a realistic budget, scenario B was considered. Annual and seasonal budgets of TA sources and sinks in this scenario are shown in Table 6. Note that Riveff is not taken into account for the budget calculations. This is explained in the method section in Sect. 2.2.2 “River input”.
Table 6Annual TA budgets in the validation area of the years 2001 to 2009; annual averages and seasonal budgets of January to March, April to June, July to September, and October to December (Gmol). Net flow is the annual net TA transport across the boundaries of the validation area. Negative values indicate a net export from the validation area to the adjacent North Sea. Δ content indicates the difference in the TA contents between the last and the first time steps of the simulated year or quarter. The letter t denotes 3 months.
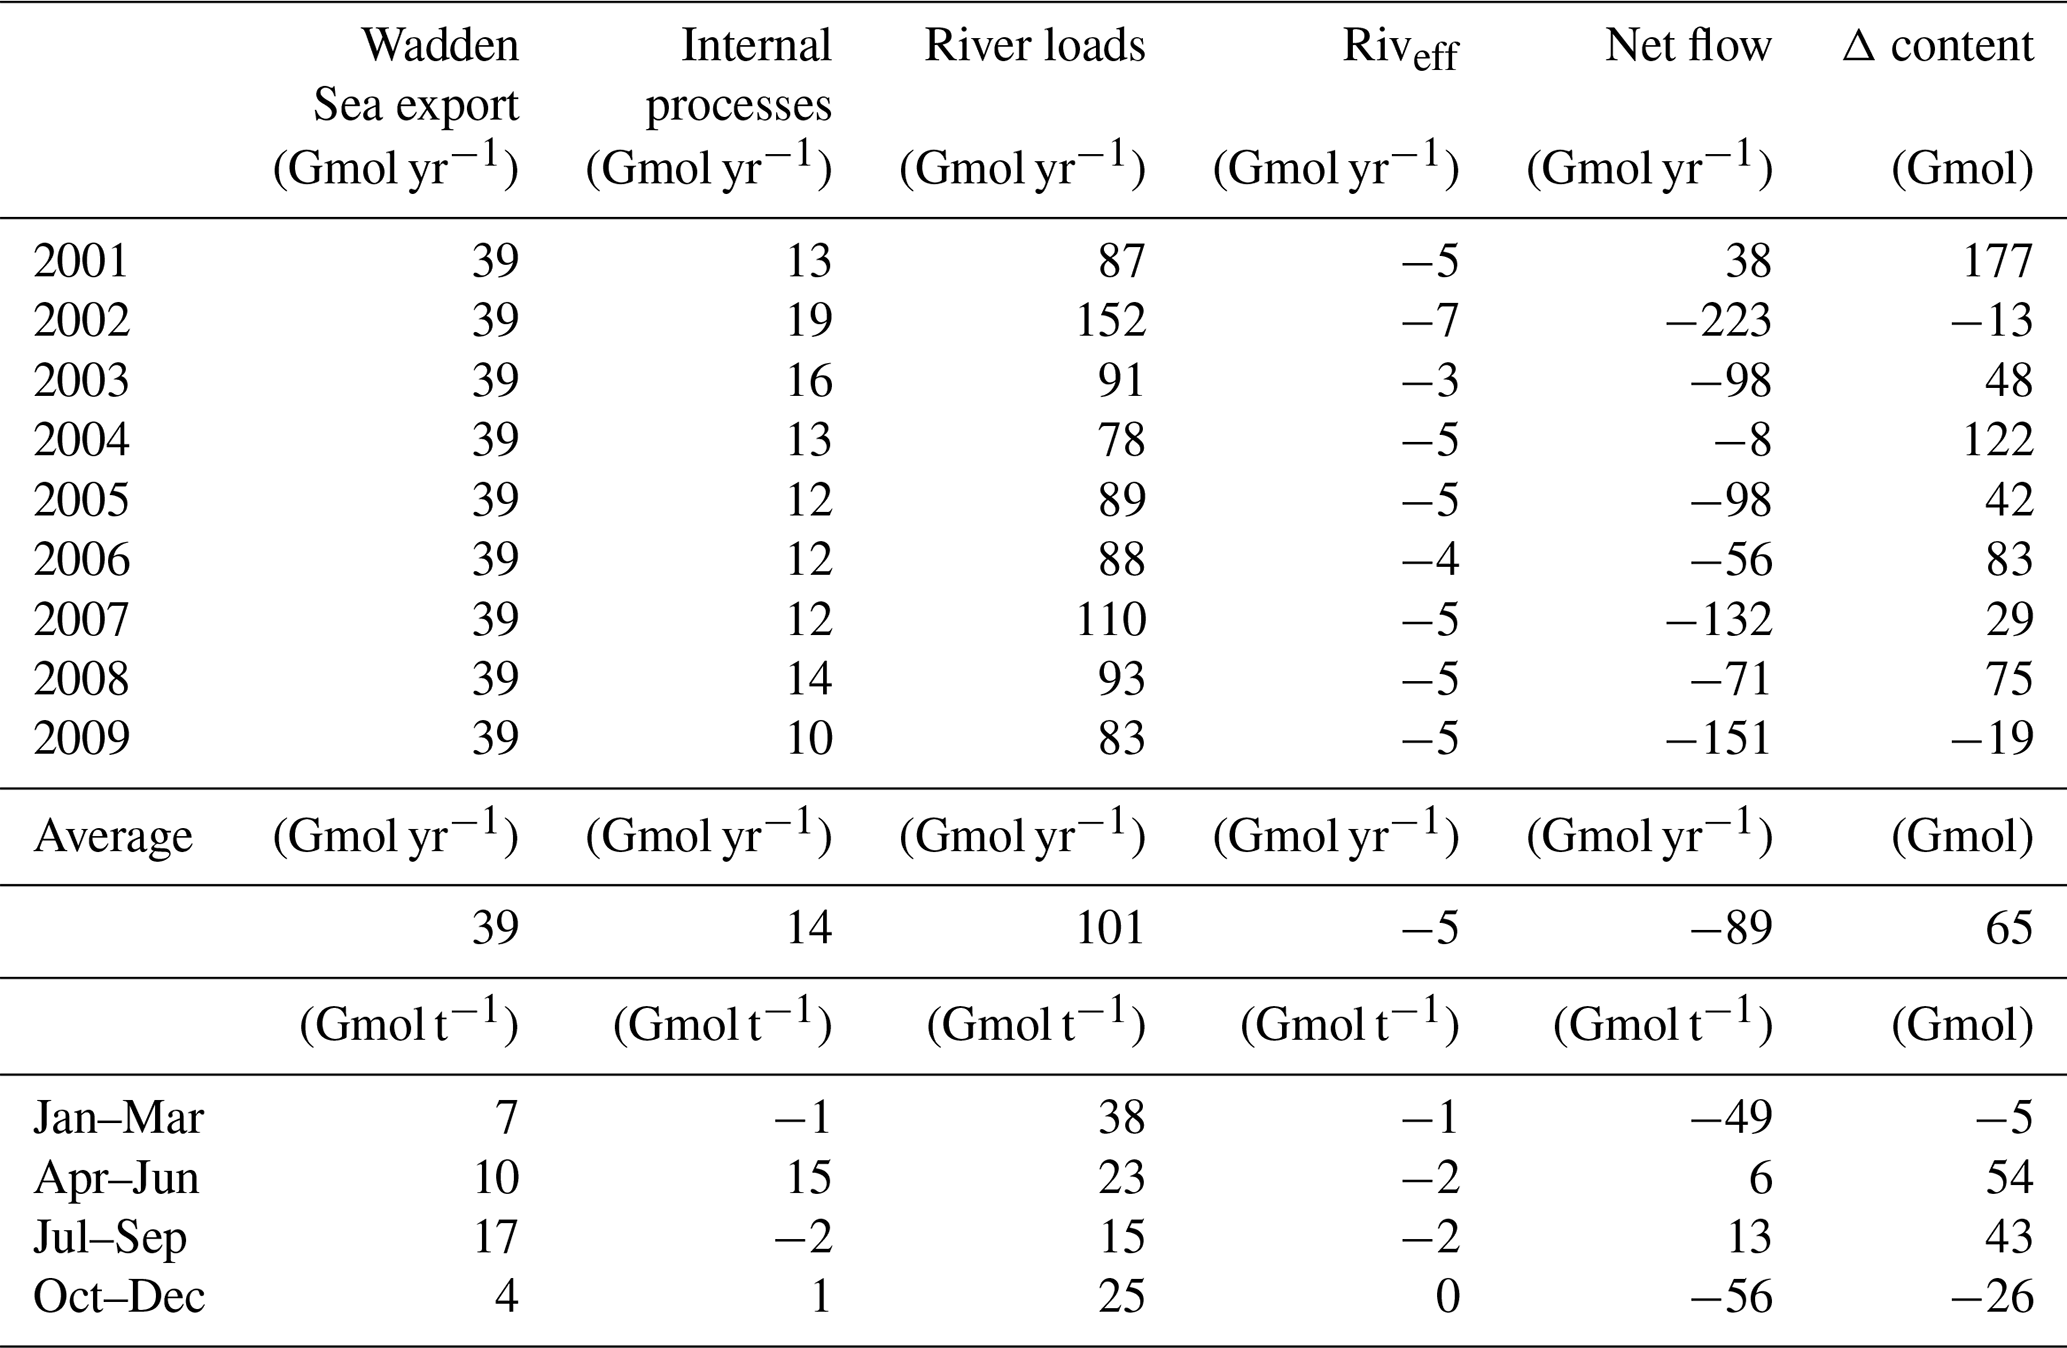
Comparing the absolute values of all sources and sinks of the mean year results in a relative ranking of the processes. Of all TA inventory changes in the validation area, 41 % were due to river loads, 37 % were due to net transport, 16 % were due to Wadden Sea export rates, and 6 % were due to internal processes. River input ranged from 78 to 152 Gmol TA yr−1 and had the highest absolute variability in all TA sources in the validation area. This is mostly due to the high variability in annual freshwater discharge, which is indicated by low (negative) values of Riveff. The latter values show that the riverine TA loads together with the freshwater flux induce a small dilution of TA in the validation area for each year. Certainly, this ranking depends mainly on the characteristics of the Elbe estuary. Due to high TA in the rivers Rhine and Meuse (the Netherlands) they had an effective river input of +24 Gmol TA yr−1 in 2008, which constitutes a much greater impact on TA changes than the Elbe river. In a sensitivity test, we switched off the TA loads of rivers Rhine and Meuse for the year 2008 and found that the net flow of −71 Gmol TA yr−1 decreased to −80 Gmol TA yr−1, which indicates that water entering the validation box from the western boundary is less TA-rich in the test case than in the reference run.
At seasonal timescales (Table 6, lower part) the net transport dominated the variations from October to March, while internal processes played a more important role from April to June (28 %). The impact of effective river input was less than 5 % in every quarter. The Wadden Sea TA export rates had an impact of 36 % on TA mass changes in the validation area from July to September. Note that these percentages are related to the sum of the absolute values of the budgeting terms.
Summing up the sources and sinks, Wadden Sea exchange rates, internal processes, and effective river loads resulted in the highest sums in 2002 and 2003 (51 and 52 Gmol TA yr−1) and the lowest sums in 2009 (44 Gmol TA yr−1). For the consideration of TA variation we excluded net transport and actual river loads, because these fluxes are diluted and do not necessarily change the TA concentrations. In agreement with this, the highest TA was simulated in summer 2003 (Fig. 8). The high interannual variability in summer concentrations was driven essentially by hydrodynamic differences between the years. Flushing times and their interannual variability were higher in summer than in winter (Fig. 6) of every year. High flushing times or less strong circulation do have an accumulating effect on exported TA in the validation area. To understand the reasons for the different flushing times, monthly stream patterns were analysed (Fig. 7). Distinct anticlockwise stream patterns defined the hydrodynamic conditions in every winter. Summer stream patterns were in most years weaker, especially in the German Bight (compare Fig. 7, June 2003). In August 2003 the eastern part of the German Bight shows a clockwise rotation, which transports TA-enriched water from July back to the Wadden Sea area for further enrichment. This could explain the highest concentrations in summer 2003.
Thomas et al. (2009) estimated that 73 Gmol TA yr−1 was produced in the Wadden Sea. Their calculations were based on measurements in 2001 and 2002. The presented model was validated with data measured in August 2008 (Salt et al., 2013) at the same positions. High TA in the German Bight was observed in summer 2001 and in summer 2008. Due to the scarcity of data, the West Frisian Wadden Sea was not considered in the simulations, but, as the western area is much larger than the eastern area, the amount of exported TA from that area can be assumed to be in the same range as from the East Frisian Wadden Sea (10 to 14 Gmol TA yr−1). With additional export from the West Frisian Wadden Sea, the maximum overall Wadden Sea export may be as high as 53 Gmol TA yr−1. Thus, the TA export from the Wadden Sea calculated in this study is 20 to 34 Gmol TA yr−1 lower than that assumed in the study of Thomas et al. (2009). This is mainly due to the flushing time that was assumed by Thomas et al. (2009). They considered the water masses to be flushed within 6 weeks (Lenhart et al., 1995). Flushing times calculated in the present study were significantly longer and more variable in summer. Since the Wadden Sea export calculated by Thomas et al. (2009) was defined as a closing term for the TA budget, underestimated summerly flushing times led to an overestimation of the exchange with the adjacent North Sea.
Table 4 shows that our scenario B underestimates observed TA by about 5.1 µmol kg−1 in 2008. Scenario A has lower TA than scenario B in the validation area. The difference is about 11 µmol kg−1. This means that the Wadden Sea export of 39 Gmol TA yr−1 results in a concentration difference of 11 µmol kg−1. Assuming linearity, the deviation between scenario B and the observations (5.1 µmol kg−1) would be compensated by an additional Wadden Sea export of about 18 Gmol TA yr−1. If we assume that the deviation between observations and scenario B is entirely due to uncertainties or errors in the Wadden Sea export estimate, then the uncertainty in this export is 18 Gmol TA yr−1.
Another problematic aspect in the TA export estimate by Thomas et al. (2009) is the fact that their TA budget merges the sources of anaerobic TA generation from sediment and from the Wadden Sea into a single source: “anaerobic processes in the Wadden Sea”. Burt et al. (2014) found a sediment TA generation of 12 mmol TA m−2 d−1 at one station in the German Bight based on Ra measurements. This fits into the range of microbial gross sulfate reduction rates reported by Al-Raei et al. (2009) in the back-barrier tidal areas of Spiekeroog island and by Brenner et al. (2016) at the Dutch coast. Within the latter paper, the different sources of TA from the sediment were quantified. The largest term was benthic calcite dissolution, which would be cancelled out in terms of TA generation, assuming a steady-state compensation by biogenic calcite production. Extrapolating the southern North Sea TA generation (without calcite dissolution) from the data for one station of Brenner et al. (2016) results in an annual TA production of 12.2 Gmol in the German Bight (area = 28.415 km2). This is likely an upper limit of sediment TA generation, as the measurements were made in summer when seasonal fluxes are maximal. This calculation reduces the annual Wadden Sea TA generation estimated by Thomas et al. (2009) from 73 to 61 Gmol, which is still higher than our present estimate. In spite of the unidentified additional TA fluxes, both the estimate by Thomas et al. (2009) and our present model-based quantification confirm the importance of the Wadden Sea export fluxes of TA to the North Sea carbonate system at present and in the future.
4.4 The impact of exported TA and DIC on the North Sea and influences on export magnitude
Observed high TA and DIC in the SE North Sea are mainly caused by TA and DIC export from the Wadden Sea (Figs. 3–5). TA could be better reproduced than DIC in the model experiments, which was mainly due to the higher sensitivity of DIC to modelled biology. Nevertheless, from a present point of view the Wadden Sea is the main driver of TA in the German Bight. Future forecast studies of the evolution of the carbonate system in the German Bight will have to specifically focus on the Wadden Sea and on processes occurring there. In this context the Wadden Sea evolution during future sea level rise is the most important factor. The balance between sediment supply from the North Sea and sea level rise is a general precondition for the persistence of the Wadden Sea (Flemming and Davis, 1994; van Koningsveld et al., 2008). An accelerating sea level rise could lead to a deficient sediment supply from the North Sea and shift the balance at first in the largest tidal basins and ultimately in the smallest basins (CPSL, 2001; van Goor et al., 2003). The share of intertidal flats as potential sedimentation areas is larger in smaller tidal basins (van Beusekom et al., 2012), whereas larger basins have a larger share of subtidal areas. Thus, assuming an accelerating sea level rise, large tidal basins will turn into lagoons, while tidal flats may still exist in smaller tidal basins. This effect could decrease the overall Wadden Sea export rates of TA, because sediments would no longer be exposed to the atmosphere and the products of sulfate reduction would reoxidise in the water column. Moreover, benthic–pelagic exchange in the former intertidal flats would be more diffusive and less advective then today due to a lowering of the hydraulic gradients during ebb tides, when parts of the sediment become unsaturated with water. This would decrease TA export into the North Sea. Caused by changes in hydrography and sea level the sedimentological composition may also change. If sediments become more sandy, aerobic degradation of organic matter is likely to become more important (de Beer et al., 2005). In fine-grained silt, diffusive transport plays a key role, while in the upper layer of coarse (sandy) sediments advection is the dominant process. Regionally, the North Frisian Wadden Sea will be more affected by rising sea level because there the tidal basins are larger than the tidal basins in the East Frisian Wadden Sea and even larger than the inner Jade Bight.
The Wadden Sea export of TA and DIC is driven by the turnover of organic material. Decreasing anthropogenic eutrophication can lead to decreasing phytoplankton biomass and production (Cadée and Hegeman, 2002; van Beusekom et al., 2009). Thus, the natural variability in the North Sea primary production becomes more important in determining the organic matter turnover in the Wadden Sea (McQuatters-Gollop et al., 2007; McQuatters-Gollop and Vermaat, 2011). pH values in Dutch coastal waters decreased from 1990 to 2006 drastically. Changes in nutrient variability were identified as possible drivers (Provoost et al., 2010), which is consistent with model simulations by Borges and Gypens (2010). Moreover, despite the assumption of decreasing overall TA export rates from the Wadden Sea, the impact of the North Frisian Wadden Sea on the carbonate system of the German Bight could potentially adjust to a change in tidal prisms and thus a modulation in imported organic matter. If less organic matter is remineralised in the North Frisian Wadden Sea, less TA and DIC will be exported into the North Sea.
In the context of climate change, processes that have impact on the freshwater budget of tidal mud flats will gain in importance. Future climate change will have an impact on coastal hydrology due to changes in groundwater formation rates (Faneca Sànchez et al., 2012; Sulzbacher et al., 2012) that may change both surface and subterranean runoff into the North Sea. An increasing discharge of small rivers and groundwater into the Wadden Sea is likely to increase DIC, TA, and possibly nutrient loads and may enhance the production of organic matter. Evaporation could also increase due to increased warming and become a more important process than today (Onken and Riethmüller, 2010), as will methane-cycling change due to nutrient changes and sea level and temperature rise (e.g. Höpner and Michaelis, 1994; Akam et al., 2020).
Concluding, in the course of climate change the North Frisian Wadden Sea will be affected first by sea level rise, which will result in decreased TA and DIC export rates due to less turnover of organic matter there. This could lead to a decreased buffering capacity in the German Bight for atmospheric CO2. Overall, less organic matter will be remineralised in the Wadden Sea.
We present a budget calculation of TA sources in the German Bight and relate 16 % of the annual TA inventory changes to TA exports from the Wadden Sea. The impact of riverine bulk TA seems to be less important due to the comparatively low TA levels in the Elbe estuary, a finding that has to be proven by future research.
The evolution of the carbonate system in the German Bight under future changes depends on the development of the Wadden Sea. The amount of TA and DIC that is exported from the Wadden Sea depends on the quantity of organic matter and/or nutrients that are imported from the North Sea and finally remineralised in the Wadden Sea. Decreasing riverine nutrient loads have led to decreasing phytoplankton biomass and production (Cadée and Hegeman, 2002; van Beusekom et al., 2009), a trend that is expected to continue in the future (Marine Strategy Framework Directive – MSFD; 2008/56/Ec, 2008). However, altered natural dynamics of nutrient cycling and productivity can override the decreasing riverine nutrient loads (van Beusekom et al., 2012), but these will not generate TA in the magnitude of denitrification of river-borne nitrate.
Sea level rise in the North Frisian Wadden Sea will potentially be more affected by a loss of intertidal areas than the East Frisian Wadden Sea (van Beusekom et al., 2012). This effect will likely reduce the turnover of organic material in this region of the Wadden Sea, which may decrease TA production and transfer into the southern North Sea.
Thomas et al. (2009) estimated that the Wadden Sea facilitates approximately 7 %–10 % of the annual CO2 uptake of the North Sea. This is motivation for model studies on the future role of the Wadden Sea in the CO2 balance of the North Sea under regional climate change.
Future research will also have to address the composition and amount of submarine groundwater discharge, as well as the magnitude and seasonal dynamics in discharge and composition of small water inlets at the coast, which are in this study only implicitly included and in other studies mostly ignored due to a lacking database.
Table A1Annual riverine freshwater discharge (km3 yr−1). The numbering refers to Fig. 1.
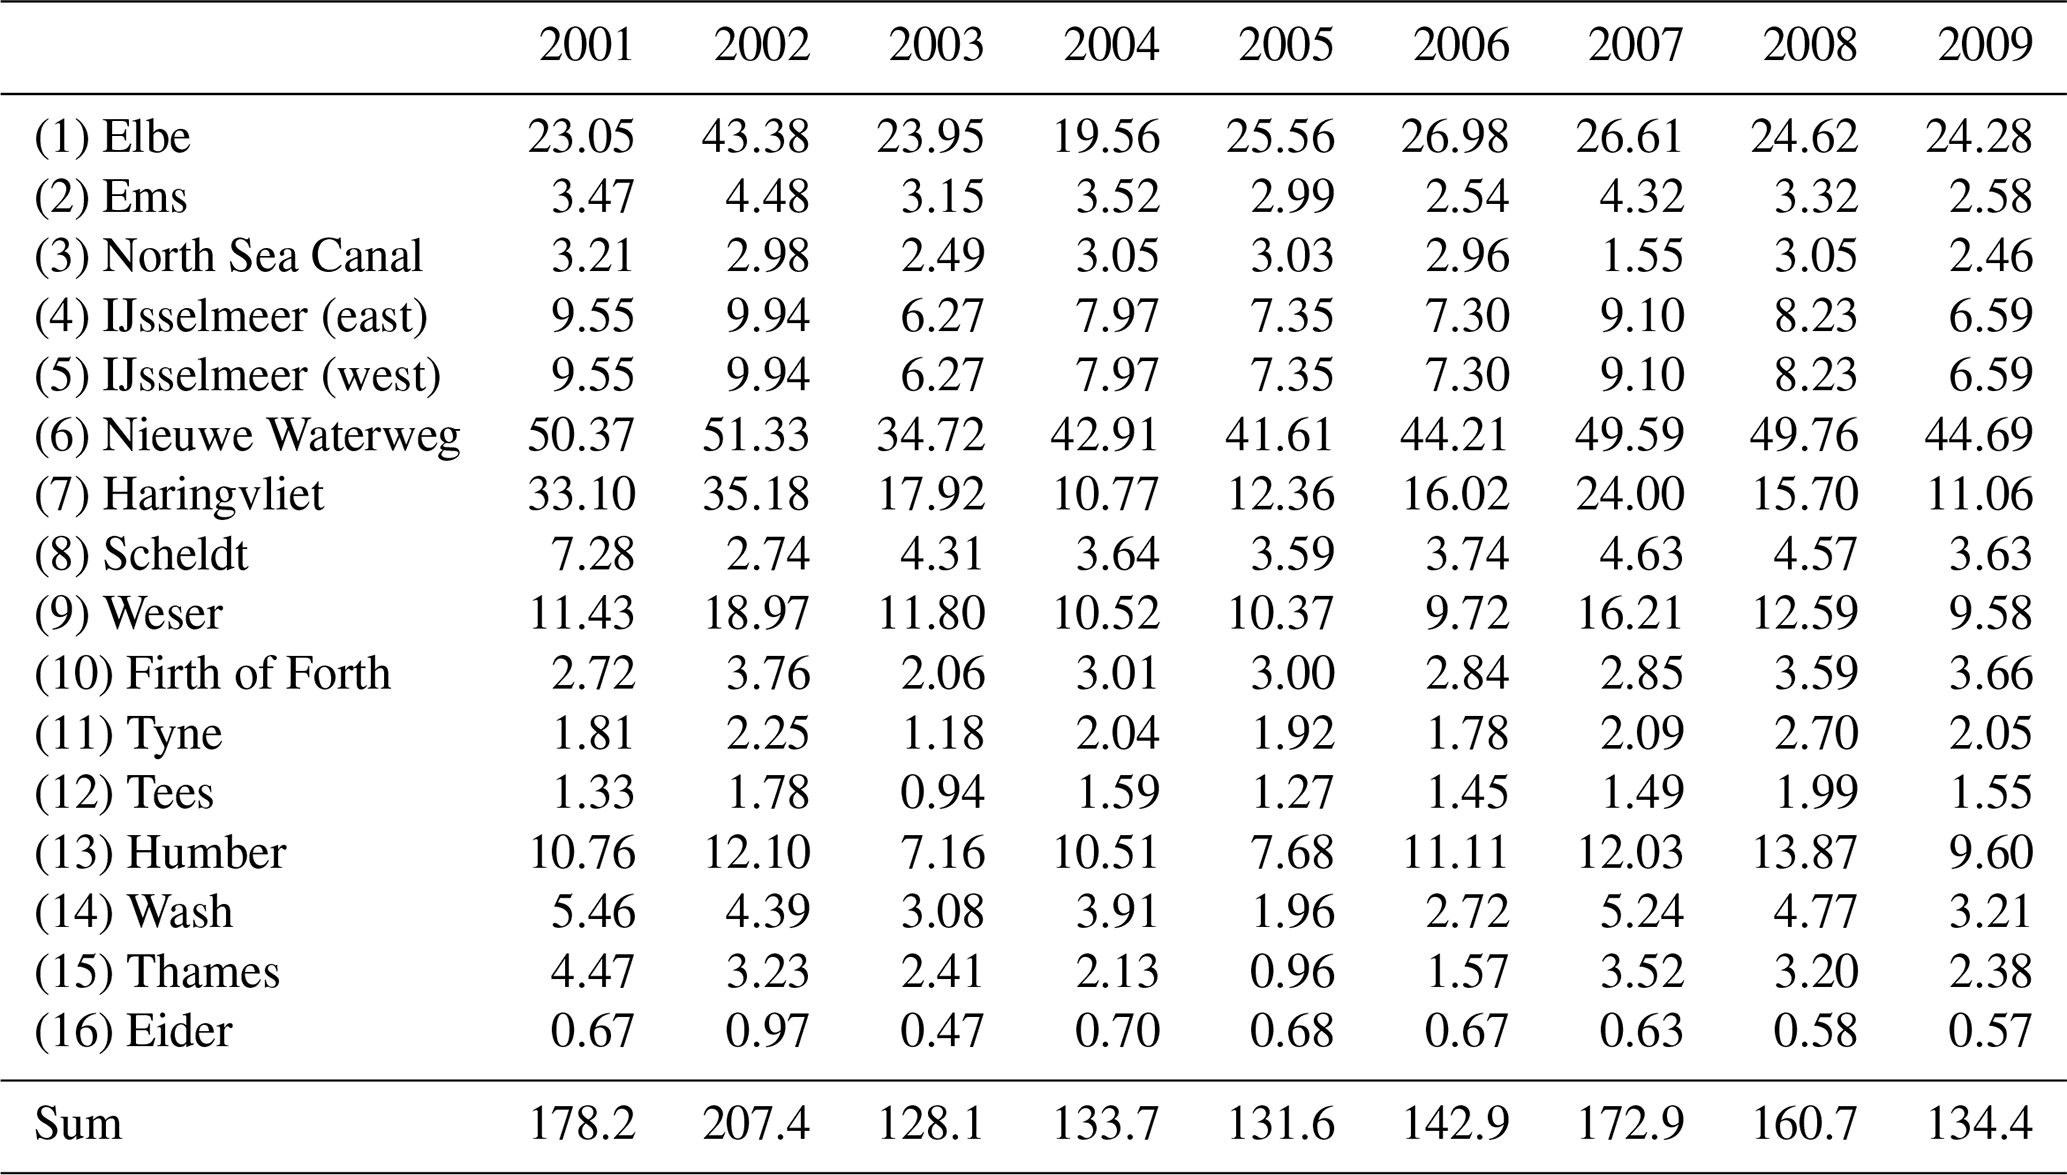
Table A2River numbers in Fig. 1, their positions, and source of data.
Table A3Monthly values of TA, DIC, and NO3 concentrations (µmol kg−1) of rivers, the annual mean, and the standard deviation.
The river data are available at https://wiki.cen.uni-hamburg.de/ifm/ECOHAM/DATA_RIVER (Uni Hamburg, 2020) and https://data.europa.eu/euodp/de/data/dataset/data_waterbase-rivers-7 (EEA, 2020). Meteorological data are stored at https://psl.noaa.gov/ (NOAA, 2020; Kalnay et al., 1996). The North Sea TA and DIC data are stored at https://doi.org/10.1594/PANGAEA.438791 (Thomas, 2006) and https://doi.org/10.1594/PANGAEA.441686 (Thomas and Borges, 2006). The data of the North Sea cruise 2008 have not been published yet but can be requested via the CODIS data portal (https://www.nioz.nl/en/research/dataportal, last access: 20 August 2020; registration required). Additional Wadden Sea TA and DIC data are deposited under https://doi.org/10.1594/PANGAEA.841976 (Winde et al., 2015).
The supplement related to this article is available online at: https://doi.org/10.5194/bg-17-4223-2020-supplement.
The scientific concept for this study was originally developed by JP and MEB. FS wrote the basic manuscript as part of his PhD thesis. VW provided field analytical data as part of her PhD thesis. JP developed the original text further with contributions from all co-authors.
The authors declare that they have no conflict of interest.
The authors appreciate the two constructive reviews, which greatly helped to improve the manuscript, and the editorial handling by Jack Middelburg. Ina Lorkowski, Wilfried Kühn, and Fabian Große are acknowledged for stimulating discussions, Sebastian Grashorn for providing tidal prisms, and Peter Escher for laboratory support. This work was financially supported by BMBF during the joint research project BIOACID (TP 5.1, 03F0608L and TP 3.4.1, 03F0608F), with further support from the Leibniz Institute for Baltic Sea Research. We also acknowledge the support by the Cluster of Excellence CliSAP (EXC177), University of Hamburg, funded by the German Science Foundation (DFG) and the support by the German Academic Exchange Service (DAAD; MOPGA-GRI, no. 57429828) with funds of the German Federal Ministry of Education and Research (BMBF).
This research has been supported by the Federal Ministry of Education and Research (BMBF; BIOACID grant nos. 03F0608L and 03F0608F), the German Science Foundation (DFG; CliSAP grant no. EXC177), and the German Academic Exchange Service (DAAD; MOPGA-GRI, no. 57429828) with funds of the German Federal Ministry of Education and Research (BMBF).
The article processing charges for this open-access
publication were covered by a Research
Centre of the Helmholtz Association.
This paper was edited by Jack Middelburg and reviewed by two anonymous referees.
2008/56/Ec: M. Commission of the European Communities Directive 2008/56/EC of the European Parliament and of the Council of 17 June 2008. Establishing a Framework for Community Action in the Field of Marine Environmental Policy (Marine Strategy Framework Directive), Official Journal of the European Union L 164, 2008.
Akam, S. A., Coffin, R. B., Abdulla, H. A. N., and Lyons T. W.: Dissolved inorganic carbon pump in methane-charged shallow marine sediments: State of the art and new model perspectives, Front. Mar. Sci., 7, 206, https://doi.org/10.3389/FMARS.2020.00206, 2020.
Al-Raei, A. M., Bosselmann, K., Böttcher, M. E., Hespenheide, B., and Tauber, F.: Seasonal dynamics of microbial sulfate reduction in temperate intertidal surface sediments: Controls by temperature and organic matter, Ocean Dynam., 59, 351–370, 2009.
Amann, T., Weiss, A., and Hartmann, J.: Inorganic Carbon Fluxes in the Inner Elbe Estuary, Germany, Estuar. Coast., 38, 192–210, https://doi.org/10.1007/s12237-014-9785-6, 2015.
Artioli, Y., Blackford, J. C., Butenschön, M., Holt, J. T., Wakelin, S. L., Thomas, H., Borges, A. V., and Allen, J. I.: The carbonate system in the North Sea: Sensitivity and model validation, J. Marine Syst., 102–104, 1–13, https://doi.org/10.1016/j.jmarsys.2012.04.006, 2012.
Backhaus, J. O.: A three-dimensional model for the simulation of shelf sea dynamics, Ocean Dynam., 38, 165–187, https://doi.org/10.1016/0278-4343(84)90044-X, 1985.
Backhaus, J. O. and Hainbucher, D.: A finite difference general circulation model for shelf seas and its application to low frequency variability on the North European Shelf, Elsev. Oceanogr. Serie., 45, 221–244, https://doi.org/10.1016/S0422-9894(08)70450-1, 1987.
Ben-Yaakov, S.: pH BUFFERING OF PORE WATER OF RECENT ANOXIC MARINE SEDIMENTS, Limnol. Oceanogr., 18, 86–94, https://doi.org/10.4319/lo.1973.18.1.0086, 1973.
Berner, R. A., Scott, M. R., and Thomlinson, C.: Carbonate alkalinity in the pore waters of anoxic marine sediments, Limnol. Oceanogr., 15, 544–549, https://doi.org/10.4319/lo.1970.15.4.0544, 1970.
Billerbeck, M., Werner, U., Polerecky, L., Walpersdorf, E., de Beer, D., and Hüttel, M.: Surficial and deep pore water circulation governs spatial and temporal scales of nutrient recycling in intertidal sand flat sediment, Mar. Ecol.-Prog. Ser., 326, 61–76, 2006.
Böttcher, M. E., Hespenheide, B., Brumsack, H.-J., and Bosselmann, K.: Stable isotope biogeochemistry of the sulfur cycle in modern marine sediments: I. Seasonal dynamics in a temperate intertidal sandy surface sediment, Isotopes Environ. Health Stud., 40, 267–283, 2004.
Böttcher, M. E., Al-Raei, A. M., Hilker, Y., Heuer, V., Hinrichs, K.-U., and Segl, M.: Methane and organic matter as sources for excess carbon dioxide in intertidal surface sands: Biogeochemical and stable isotope evidence, Geochim. Cosmochim. Ac., 71, A111, https://doi.org/10.1016/j.gca.2007.06.012, 2007.
Borges, A. V.: Present day carbon dioxide fluxes in the coastal ocean and possible feedbacks under global change, in: Oceans and the atmospheric carbon content, edited by: da Silva Duarte, P. M. Santana Casiano, J. M., Chapter 3, 47–77, https://doi.org/10.1007/978-90-481-9821-4, Springer, Dordrecht, Heidelberg, London, New York, 2011.
Borges, A. V. and Gypens, N.: Corbonate chemistry in the coastal zone responds more strongly to eutrophication than to ocean acidification, Limnol. Oceanogr., 55, 346–353, 2010.
Brasse, J., Reimer, A., Seifert, R., and Michaelis, W.: The influence of intertidal mudflats on the dissolved inorganic carbon and total alkalinity distribution in the German Bight, southeastern North Sea, J. Sea Res., 42, 93–103, https://doi.org/10.1016/S1385-1101(99)00020-9, 1999.
Brenner, H., Braeckman, U., Le Guitton, M., and Meysman, F. J. R.: The impact of sedimentary alkalinity release on the water column CO2 system in the North Sea, Biogeosciences, 13, 841–863, https://doi.org/10.5194/bg-13-841-2016, 2016.
Burt, W. J., Thomas, H., Pätsch, J., Omar, A. M., Schrum, C., Daewel, U., Brenner, H., and de Baar, H. J. W.: Radium isotopes as a tracer of sediment-water column exchange in the North Sea, Global Biogeochem. Cy., 28, 19, https://doi.org/10.1002/2014GB004825, 2014.
Burt, W. J., Thomas, H., Hagens, M., Pätsch, J., Clargo, N. M., Salt, L. A., Winde, V., and Böttcher, M. E.: Carbon sources in the North Sea evaluated by means of radium and stable carbon isotope tracers, Limnol. Oceanogr., 61, 666–683, https://doi.org/10.1002/lno.10243, 2016.
Cadée, G. C. and Hegeman, J.: Phytoplankton in the Marsdiep at the end of the 20th century; 30 years monitoring biomass, primary production, and Phaeocystis blooms, J. Sea Res., 48, 97–110, https://doi.org/10.1016/S1385-1101(02)00161-2, 2002.
Cai, W.-J., Hu, X., Huang, W.-J., Jiang, L.-Q., Wang, Y., Peng, T.-H., and Zhang, X.: Surface ocean alkalinity distribution in the western North Atlantic Ocean margins, J. Geophys. Res., 115, C08014, https://doi.org/10.1029/2009JC005482, 2010.
Carvalho, A. C. O., Marins, R. V., Dias, F. J. S., Rezende, C. E., Lefèvre, N., Cavalcante, M. S., and Eschrique, S. A.: Air-sea CO2 fluxes for the Brazilian northeast continental shelf in a climatic transition region, J. Marine Syst., 173, 70–80, https://doi.org/10.1016/j.jmarsys.2017.04.009, 2017.
Chambers, R. M., Hollibaugh, J. T., and Vink, S. M.: Sulfate reduction and sediment metabolism in Tomales Bay, California, Biogeochemistry, 25, 1–18, https://doi.org/10.1007/BF00000509, 1994.
Chen, C., Liu, H., and Beardsley, R. C.: An Unstructured Grid, Finite-Volume, Three-Dimensional, Primitive Equations Ocean Model: Application to Coastal Ocean and Estuaries, J. Atmos. Ocean. Tech., 20, 159–186, https://doi.org/10.1175/1520-0426(2003)020<0159:AUGFVT>2.0.CO;2, 2003.
Chen, C.-T. A. and Wang, S.-L.: Carbon, alkalinity and nutrient budgets on the East China Sea continental shelf, J. Geophys. Res., 104, 20675–20686, https://doi.org/10.1029/1999JC900055, 1999.
CPSL: Final Report of the Trilateral Working Group on Coastal Protection and Sea Level Rise, Wadden Sea Ecosystem No. 13, Common Wadden Sea Secretariat, Wilhelmshaven, Germany, 2001.
de Beer, D., Wenzhöfer, F., Ferdelman, T. G., Boehme, S., Huettel, M., van Beusekom, J., Böttcher, M. E., Musat, N., and Dubilier, N.: Transport and mineralization rates in North Sea sandy intertidal sediments (Sylt-Rømø Basin, Waddensea), Limnol. Oceanogr., 50, 113–127, 2005.
Dickson, A. G., Afghan, J. D., and Anderson, G. C.: Reference materials for oceanic CO2 analysis: a method for the certification of total alkalinity, Mar. Chem., 80, 185–197, 2003.
Dollar, S. J., Smith, S. V., Vink, S. M., Obrebski, S., and Hollibaugh, J. T.: Annual cycle of benthic nutrient fluxes in Tomales Bay, California, and contribution of the benthos to total ecosystem metabolism, Mar. Ecol.-Prog. Ser., 79, 115–125, https://doi.org/10.3354/meps079115, 1991.
Duarte, C. M., Hendriks, I. E., Moore, T. S., Olsen, Y. S., Steckbauer, A., Ramajo, L., Carstensen, J., Trotter, J. A., and McCulloch, M.: Is Ocean Acidification an Open-Ocean Syndrome? Understanding Anthropogenic Impacts on Seawater pH, Estuar. Coast., 36, 221–236, 2013.
EEA: Waterbase – Rivers, available at: https://data.europa.eu/euodp/de/data/dataset/data_waterbase-rivers-7, last access: 20 August 2020.
Ehlers, J.: Geomorphologie und Hydrologie des Wattenmeeres, in: Warnsignale aus dem Wattenmeer, edited by: Lozan, J. L., Rachor, E., Von Westernhagen, H., Lenz, W., Blackwell Wissenschaftsverlag, Berlin, 1–11, 1994.
Faneca Sànchez, M., Gunnink, J. L., van Baaren, E. S., Oude Essink, G. H. P., Siemon, B., Auken, E., Elderhorst, W., and de Louw, P. G. B.: Modelling climate change effects on a Dutch coastal groundwater system using airborne electromagnetic measurements, Hydrol. Earth Syst. Sci., 16, 4499–4516, https://doi.org/10.5194/hess-16-4499-2012, 2012.
Flemming, B. W. and Davis, R. A. J.: Holocene evolution, morphodynamics and sedimentology of the Spiekeroog barrier island system (southern North Sea), Senck. Marit., 25, 117–155, 1994.
Grashorn, S., Lettmann, K. A., Wolff, J.-O., Badewien, T. H., and Stanev, E. V.: East Frisian Wadden Sea hydrodynamics and wave effects in an unstructured-grid model, Ocean Dynam., 65, 419–434, https://doi.org/10.1007/s10236-014-0807-5, 2015.
Große, F., Kreus, M., Lenhart, H.-J., Pätsch, J., and Pohlmann, T.: A Novel Modeling Approach to Quantify the Influence of Nitrogen Inputs on the Oxygen Dynamics of the North Sea, Front. Mar. Sci., 4, 21 pp., https://doi.org/10.3389/fmars.2017.00383, 2017.
Gustafsson, E., Hagens, M., Sun, X., Reed, D. C., Humborg, C., Slomp, C. P., and Gustafsson, B. G.: Sedimentary alkalinity generation and long-term alkalinity development in the Baltic Sea, Biogeosciences, 16, 437–456, https://doi.org/10.5194/bg-16-437-2019, 2019.
HASEC: OSPAR Convention for the Protection of the Marine Environment of the North-East Atlantic, Meeting of the Hazardous Substances and Eutrophication Committee (HASEC), Oslo 27 February–2 March 2012, available at: https://www.ospar.org/meetings/archive?q=2012 (last access: 20 August 2020), 2012.
Hild, A.: Geochemie der Sedimente und Schwebstoffe im Rückseitenwatt von Spiekeroog und ihre Beeinflussung durch biologische Aktivität, Forschungszentrum Terramare Berichte, 5, 71 pp., Tectum Verlag, Marburg, 1997.
Höpner, T. and Michaelis, H.: Sogenannte “Schwarze Flecken” – ein Eutrophierungssymptom des Wattenmeeres, in: Warnsignale aus dem Wattenmeer, edited by: Lozán, L., Rachor, E., Reise, K., von Westernhagen, H., und Lenz, W., Blackwell, Berlin, 153–159, 1994.
Hoppema, J. M. J.: The distribution and seasonal variation of alkalinity in the southern bight of the North Sea and in the western Wadden Sea, Neth. J. Sea Res., 26, 11–23, https://doi.org/10.1016/0077-7579(90)90053-J, 1990.
Hu, X. and Cai, W.-J.: An assessment of ocean margin anaerobic processes on oceanic alkalinity budget, Global Biogeochem. Cy., 25, 1–11, 2011.
Johannsen, A., Dähnke, K., and Emeis, K.-C.: Isotopic composition of nitrate in five German rivers discharging into the North Sea, Org. Geochem., 39, 1678–1689 https://doi.org/10.1016/j.orggeochem.2008.03.004, 2008.
Johnson, K. M., Wills, K. D., Buttler, D. B., Johnson, W. K., and Wong, C. S.: Coulometric total carbon dioxide analysis for marine studies: maximizing the performance of an automated gas extraction system and coulometric detector, Mar. Chem., 44, 167–187, 1993.
Kalnay, E., Kanamitsu, M., Kistler, R., Collins, W., Deaven, D., Gandin, L., Iredell, M., Saha S., White, G., Woollen, J., Zhu, Y., Chelliah, M., Ebisuzaki, W., Higgins, W., Janowiak, J., Mo, K. C., Ropelewski, C., Wang, J., Leetmaa, A., Reynolds, R., Jenne, R., and Joseph, D.: The NCEP/NCAR 40-year reanalysis project, B. Am. Meteorol. Soc., 77, 437–471, https://doi.org/10.1175/1520-0477(1996)077<0437:TNYRP>2.0.CO;2, 1996.
Kempe, S. and Pegler, K.: Sinks and sources of CO2 in coastal seas: the North Sea, Tellus B, 43, 224–235, https://doi.org/10.3402/tellusb.v43i2.15268, 1991.
Kerimoglu, O., Große, F., Kreus, M., Lenhart, H.-J., and van Beusekom, J. E. E.: A model-based projection of historical state of a coastal ecosystem: Relevance of phytoplankton stoichiometry, Sci. Total Environ., 639, 1311–1323, https://doi.org/10.1016/j.scitotenv.2018.05.215, 2018.
Kohlmeier, C. and Ebenhöh, W.: Modelling the biogeochemistry of a tidal flat ecosystem with EcoTiM, Ocean Dynam., 59, 393–415, https://doi.org/10.1007/s10236-009-0188-3, 2009.
Kowalski, N., Dellwig, O., Beck, M., Gräwe, U., Pierau, N., Nägler, T., Badewien, T., Brumsack, H.-J., van Beusekom, J. E., and Böttcher, M. E. Pelagic molybdenum concentration anomalies and the impact of sediment resuspension on the molybdenum budget in two tidal systems of the North Sea, Geochim. Cosmochim. Ac., 119, 198–211, 2013.
Kühn, W., Pätsch, J., Thomas, H., Borges, A. V., Schiettecatte, L.-S., Bozec, Y., and Prowe, A. E. F.: Nitrogen and carbon cycling in the North Sea and exchange with the North Atlantic-A model study, Part II: Carbon budget and fluxes, Cont. Shelf Res., 30, 1701–1716, https://doi.org/10.1016/j.csr.2010.07.001, 2010.
Laruelle, G. G., Lauerwald, R., Pfeil, B., and Regnier, P.: Regionalized global budget of the CO2 exchange at the air-water interface in continental shelf seas, Global Biogeochem. Cy., 28, 1199–1214, https://doi.org/10.1002/2014gb004832, 2014.
Lenhart, H.-J., Radach, G., Backhaus, J. O., and Pohlmann, T.: Simulations of the North Sea circulation, its variability, and its implementation as hydrodynamical forcing in ERSEM, Neth. J. Sea Res., 33, 271–299, https://doi.org/10.1016/0077-7579(95)90050-0, 1995.
Lettmann, K. A., Wolff, J.-O., and Badewien, T. H.: Modeling the impact of wind and waves on suspended particulate matter fluxes in the East Frisian Wadden Sea (southern North Sea), Ocean Dynam., 59, 239–262, https://doi.org/10.1007/s10236-009-0194-5, 2009.
Lipinski, M.: Nährstoffelemente und Spurenmetalle in Wasserproben der Hunte und Jade, Diploma thesis, C.v.O. University of Oldenburg, 82 pp., 1999.
Lorkowski, I., Pätsch, J., Moll, A., and Kühn, W.: Interannual variability of carbon fluxes in the North Sea from 1970 to 2006 – Competing effects of abiotic and biotic drivers on the gas-exchange of CO2, Estuar. Coast. Shelf S., 100, 38–57, https://doi.org/10.1016/j.ecss.2011.11.037, 2012.
Łukawska-Matuszewska, K. and Graca, B.: Pore water alkalinity below the permanent halocline in the Gdańsk Deep (Baltic Sea) – Concentration variability and benthic fluxes, Mar. Chem., 204, 49–61, 2017.
Mayer, B., Rixen, T., and Pohlmann, T.: The Spatial and Temporal Variability of Air-Sea CO2 Fluxes and the Effect of Net Coral Reef Calcification in the Indonesian Seas: A Numerical Sensitivity Study, Front. Mar. Sci., 5, https://doi.org/10.3389/fmars.2018.00116, 2018.
McQuatters-Gollop, A. and Vermaat, J. E.: Covariance among North Sea ecosystem state indicators during the past 50 years e contrasts between coastal and open waters, J. Sea Res., 65, 284–292, https://doi.org/10.1016/j.seares.2010.12.004, 2011.
McQuatters-Gollop, A., Raitsos, D. E., Edwards, M., Pradhan, Y., Mee, L. D., Lavender, S. J., and Attrill, M. J.: A long-term chlorophyll data set reveals regime shift in North Sea phytoplankton biomass unconnected to nutrient trends, Limnol. Oceanogr., 52, 635–648, https://doi.org/10.4319/lo.2007.52.2.0635, 2007.
Moore, W. S., Beck, M., Riedel, T., Rutgers van der Loeff, M., Dellwig, O., Shaw, T. J., Schnetger, B., and Brumsack, H.-J.: Radium-based pore water fluxes of silica, alkalinity, manganese, DOC, and uranium: A decade of studies in the German Wadden Sea, Geochim. Cosmochim. Ac., 75, 6535–6555, https://doi.org/10.1016/j.gca.2011.08.037, 2011.
Neal, C.: Calcite saturation in eastern UK rivers, Sci Total Environ., 282–283, 311–326, https://doi.org/10.1016/S0048-9697(01)00921-4, 2002.
Neira, C. and Rackemann, M.: Black spots produced by buried macroalgae in intertidal sandy sediments of the Wadden Sea: Effects on the meiobenthos, J. Sea Res., 36, 153–170, 1996.
NOAA: Physical Sciences Laboratory (PSL), available at: https://psl.noaa.gov/, last access: 20 August 2020.
Onken, R. and Riethmüller, R.: Determination of the freshwater budget of tidal flats from measurements near a tidal inlet, Cont. Shelf Res., 30, 924–933, https://doi.org/10.1016/j.csr.2010.02.004, 2010.
Otto, L., Zimmerman, J. T. F., Furnes, G. K., Mork, M., Saetre, R., and Becker, G.: Review of the physical oceanography of the North Sea, Neth. J. Sea Res., 26, 161–238, https://doi.org/10.1016/0077-7579(90)90091-T, 1990.
Pätsch, J. and Kühn, W.: Nitrogen and carbon cycling in the North Sea and exchange with the North Atlantic – a model study Part I: Nitrogen budget and fluxes, Cont. Shelf Res., 28, 767–787, https://doi.org/10.1016/j.csr.2007.12.013, 2008.
Pätsch, J. and Lenhart, H.-J.: Daily Loads of Nutrients, Total Alkalinity, Dissolved Inorganic Carbon and Dissolved Organic Carbon of the European Continental Rivers for the Years 1977–2006, Berichte aus dem Zentrum für Meeres- und Klimaforschung, available at: https://wiki.cen.uni-hamburg.de/ifm/ECOHAM/DATA_RIVER (last access: 22 January 2019), 2008.
Pätsch, J., Serna, A., Dähnke, K., Schlarbaum, T., Johannsen, A., and Emeis, K.-C.: Nitrogen cycling in the German Bight (SE North Sea) – Clues from modelling stable nitrogen isotopes, Cont. Shelf Res., 30, 203–213, https://doi.org/10.1016/j.csr.2009.11.003, 2010.
Pätsch, J., Burchard, H., Dieterich, C., Gräwe, U., Gröger, M., Mathis, M., Kapitza, H., Bersch, M., Moll, A., Pohlmann, T., Su, J., Ho-Hagemann, H. T. M., Schulz, A., Elizalde, A., and Eden, C.: An evaluation of the North Sea circulation in global and regional models relevant for ecosystem simulations, Ocean Model., 116, 70–95, https://doi.org/10.1016/j.ocemod.2017.06.005, 2017.
Pätsch, J., Kühn, W., and Six, K. D.: Interannual sedimentary effluxes of alkalinity in the southern North Sea: model results compared with summer observations, Biogeosciences, 15, 3293–3309, https://doi.org/10.5194/bg-15-3293-2018, 2018.
Pohlmann, T.: Predicting the thermocline in a circulation model of the North Sea – Part I: model description, calibration and verification, Cont. Shelf Res., 16, 131–146, https://doi.org/10.1016/0278-4343(95)90885-S, 1996.
Provoost, P., van Heuven, S., Soetaert, K., Laane, R. W. P. M., and Middelburg, J. J.: Seasonal and long-term changes in pH in the Dutch coastal zone, Biogeosciences, 7, 3869–3878, https://doi.org/10.5194/bg-7-3869-2010, 2010.
Raaphorst, W., Kloosterhuis H. T., Cramer, A., and Bakker, K. J. M.: Nutrient early diagenesis in the sandy sediments of the Dogger Bank area, North Sea: pore water results, Neth. J. Sea Res., 26, 25–52, https://doi.org/10.1016/0077-7579(90)90054-K, 1990.
Radach, G. and Pätsch, J.: Variability of Continental Riverine Freshwater and Nutrient Inputs into the North Sea for the Years 1977–2000 and Its Consequences for the Assessment of Eutrophication, Estuar. Coast., 30, 66–81, https://doi.org/10.1007/BF02782968, 2007.
Rassmann, J., Eitel, E. M., Lansard, B., Cathalot, C., Brandily, C., Taillefert, M., and Rabouille, C.: Benthic alkalinity and dissolved inorganic carbon fluxes in the Rhône River prodelta generated by decoupled aerobic and anaerobic processes, Biogeosciences, 17, 13–33, https://doi.org/10.5194/bg-17-13-2020, 2020.
Reimer, S., Brasse, S., Doerffer, R., Dürselen, C. D., Kempe, S., Michaelis, W., and Seifert, R.: Carbon cycling in the German Bight: An estimate of transformation processes and transport, Deutsche Hydr. Zeitschr., 51, 313–329, https://doi.org/10.1007/BF02764179, 1999.
Riedel, T., Lettmann, K., Beck, M., and Brumsack, H.-J.: Tidal variations in groundwater storage and associated discharge from an intertidal coastal aquifer, J. Geophys. Res., 115, 1–10, 2010.
Rullkötter, J.: The back-barrier tidal flats in the southern North Sea – a multidisciplinary approach to reveal the main driving forces shaping the system, Ocean Dynam., 59, 157–165, https://doi.org/10.1007/s10236-009-0197-2, 2009.
Salt, L. A., Thomas, H., Prowe, A. E. F., Borges, A. V., Bozec, Y., and de Baar, H. J. W.: Variability of North Sea pH and CO2 in response to North Atlantic Oscillation forcing, J. Geophys. Res.-Biogeo., 118, 1584–1592, https://doi.org/10.1002/2013JG002306, 2013.
Santos, I. R., Eyre, B. D., and Huettel, M.: The driving forces of porewater and groundwater flow in permeable coastal sediments: A review, Estuar. Coast. Shelf S., 98, 1–15, https://doi.org/10.1016/j.ecss.2011.10.024, 2012.
Santos, I. R., Beck, M., Brumsack, H.-J., Maher, D. T., Dittmar, T., Waska, H., and Schnetger, B.: Porewater exchange as a driver of carbon dynamics across a terrestrial-marine transect: Insights from coupled 222Rn and pCO2 observations in the German Wadden Sea, Mar. Chem., 171, 10–20, https://doi.org/10.1016/j.marchem.2015.02.005, 2015.
Schott, F.: Der Oberflächensalzgehalt in der Nordsee, Deutsche Hydr. Zeitschr., Reije A Nr. 9, 1–29, 1966.
Schwichtenberg, F.: Drivers of the carbonate system variability in the southern North Sea: River input, anaerobic alkalinity generation in the Wadden Sea and internal processes, Doktorarbeit/PhS, Universität Hamburg, Hamburg, Germany, 161 pp., 2013.
Seibert, S. L., Greskowiak, J., Prommer, H., Böttcher, M. E., Waska, H., and Massmann, G.: Modeling biogeochemical processes in a barrier island freshwater lens (Spiekeroog, Germany), J. Hydrol., 575, 1133–1144, 2019.
Seitzinger, S. and Giblin, A. E.: Estimating denitrification in North Atlantic continental shelf sediments, Biogeochemistry, 35, 235–260, https://doi.org/10.1007/BF02179829, 1996.
Shadwick, E. H., Thomas, H., Azetsu-Scott, K., Greenan, B. J. W., Head, E., and Horne, E.: Seasonal variability of dissolved inorganic carbon and surface water pCO2 in the Scotian Shelf region of the Northwestern Atlantic, Mar. Chem., 124, 23–37, https://doi.org/10.1016/j.marchem.2010.11.004, 2011.
Sippo, J. Z., Maher, D. T., Tait, D. R., Holloway, C., and Santos, I. R.: Are mangroves drivers or buffers of coastal acidification? Insights from alkalinity and dissolved inorganic carbon export estimates across a latitudinal transect, Global Biogeochem. Cy., 30, 753–766, 2016.
Smith, S. V. and Hollibaugh, J. T.: Coastal metabolism and the oceanic organic carbon balance, Rev. Geophys., 31, 75–89, https://doi.org/10.1029/92RG02584, 1993.
Streif, H.: Das ostfriesische Wattenmeer. Nordsee, Inseln, Watten und Marschen, Gebrüder Borntraeger, Berlin, 1990.
Su, J. and Pohlmann, T.: Wind and topography influence on an upwelling system at the eastern Hainan coast, J. Geophys. Res.-Ocean., 114, C06017, https://doi.org/10.1029/2008jc005018, 2009.
Sulzbacher, H., Wiederhold, H., Siemon, B., Grinat, M., Igel, J., Burschil, T., Günther, T., and Hinsby, K.: Numerical modelling of climate change impacts on freshwater lenses on the North Sea Island of Borkum using hydrological and geophysical methods, Hydrol. Earth Syst. Sci., 16, 3621–3643, https://doi.org/10.5194/hess-16-3621-2012, 2012.
Thomas, H.: Hydrochemistry measured on water bottle samples during PELAGIA cruise 64PE184. Department of Oceanography, Dalhousie University, Halifax, PANGAEA, https://doi.org/10.1594/PANGAEA.438791, 2006.
Thomas, H. and Borges, A. V.: Hydrochemistry measured on water bottle samples during PELAGIA cruise 64PE239, PANGAEA, https://doi.org/10.1594/PANGAEA.441686, 2006.
Thomas, H., Bozec, Y., Elkalay, K., and de Baar, H. J. W.: Enhanced open ocean storage of CO2 from shelf sea pumping, Science, 304, 1005–1008, https://doi.org/10.1126/science.1095491, 2004.
Thomas, H., Schiettecatte, L.-S., Suykens, K., Kone, Y. J. M., Shadwick, E. H., Prowe, A. E. F., Bozec, Y., De Baar, H. J. W., and Borges, A. V.: Enhanced ocean carbon storage from anaerobic alkalinity generation in coastal sediments, Biogeosciences, 6, 267–274, https://doi.org/10.5194/bg-6-267-2009, 2009.
Uni Hamburg: ECOHAMDATA_RIVER, available at: https://wiki.cen.uni-hamburg.de/ifm/ECOHAM/DATA_RIVER, last access: 20 August 2020.
van Beusekom, J. E. E., Loebl, M., and Martens, P.: Distant riverine nutrient supply and local temperature drive the long-term phytoplankton development in a temperate coastal basin, J. Sea Res., 61, 26–33, https://doi.org/10.1016/j.seares.2008.06.005, 2009.
van Beusekom, J. E. E., Buschbaum, C., and Reise, K.: Wadden Sea tidal basins and the mediating role of the North Sea in ecological processes: scaling up of management?, Ocean Coast. Manage., 68, 69–78, https://doi.org/10.1016/j.ocecoaman.2012.05.002, 2012.
van Beusekom, J. E. E., Carstensen, J., Dolch, T., Grage, A., Hofmeister, R., Lenhart , H.-J., Kerimoglu, O., Kolbe, K., Pätsch, J., Rick, J., Rönn, L., and Ruiter, H.: Wadden Sea Eutrophication: Long-Term Trends and Regional Differences, Front. Mar. Sci., 6, https://doi.org/10.3389/fmars.2019.00370, 2019.
van Goor, M. A., Zitman, T. J., Wang, Z. B., and Stive, M. J. F.: Impact of sea-level rise on the equilibrium state of tidal inlets, Mar. Geol., 202, 211–227, https://doi.org/10.1016/S0025-3227(03)00262-7, 2003.
van Koningsveld, M., Mulder, J. P. M., Stive, M. J. F., Van der Valk, L., and Van der Weck, A. W.: Living with sea-level rise and climate change: a case study of the Netherlands, J. Coast. Res., 24, 367–379, https://doi.org/10.2112/07A-0010.1, 2008.
Wang, Z. A. and Cai, W.-J.: Carbon dioxide degassing and inorganic carbon export from a marsh-dominated estuary (the Duplin River): A marsh CO2 pump, Limnol. Oceanogr., 49, 341–354, https://doi.org/10.4319/lo.2004.49.2.0341, 2004.
Winde, V.: Zum Einfluss von benthischen und pelagischen Prozessen auf das Karbonatsystem des Wattenmeeres der Nordsee, Dr.rer.nat. thesis, EMA University of Greifswald, 2013.
Winde, V., Böttcher, M. E., Escher, P., Böning, P., Beck, M., Liebezeit, G., and Schneider, B.: Tidal and spatial variations of DI13C and aquatic chemistry in a temperate tidal basin during winter time, J. Marine Syst., 129, 396–404, https://doi.org/10.1016/j.jmarsys.2013.08.005, 2014.
Winde, V., Böttcher, M. E., Escher, P., Böning, P., Beck, M., and Schneider, B.: Tidal and spatial variations of DI13C and aquatic chemistry in a temperate tidal basin during winter time, PANGAEA, https://doi.org/10.1594/PANGAEA.841976, 2015.
Wolf-Gladrow, D. A., Zeebe, R. E., Klaas, C., Kortzinger, A., and Dickson, A. G.: Total alkalinity: The explicit conservative expression and its application to biogeochemical processes, Mar. Chem., 106, 287–300, https://doi.org/10.1016/j.marchem.2007.01.006, 2007.
Wurgaft, E., Findlay, A. J., Vigderovich, H., Herut, B., and Sivan, O.: Sulfate reduction rates in the sediments of the Mediterranean continental shelf inferred from combined dissolved inorganic carbon and total alkalinity profiles, Mar. Chem., 211, 64–74, 2019.
Zeebe, R. E. and Wolf-Gladrow, D.: CO2 in seawater: Equilibrium, Kinetics, Isotopes, Elsevier Science Ltd., Amsterdam, London, New York, Oxford, Paris, Shannon, Tokyo, 2001.
Zhai, W.-D., Yan, X.-L., and Qi, D.: Biogeochemical generation of dissolved inorganic carbon and nitrogen in the North Branch of inner Changjiang Estuary in a dry season, Estuar. Coast. Shelf S., 197, 136–149, 2017.