the Creative Commons Attribution 4.0 License.
the Creative Commons Attribution 4.0 License.
 | 28 Aug 2020
Impact of reactive surfaces on the abiotic reaction between nitrite and ferrous iron and associated nitrogen and oxygen isotope dynamics
Scott D. Wankel
Pascal A. Niklaus
James M. Byrne
Andreas A. Kappler
Moritz F. Lehmann
Anaerobic nitrate-dependent Fe(II) oxidation (NDFeO) is widespread in various aquatic environments and plays a major role in iron and nitrogen redox dynamics. However, evidence for truly enzymatic, autotrophic NDFeO remains limited, with alternative explanations involving the coupling of heterotrophic denitrification with the abiotic oxidation of structurally bound or aqueous Fe(II) by reactive intermediate nitrogen (N) species (chemodenitrification). The extent to which chemodenitrification is caused (or enhanced) by ex vivo surface catalytic effects has not been directly tested to date. To determine whether the presence of either an Fe(II)-bearing mineral or dead biomass (DB) catalyses chemodenitrification, two different sets of anoxic batch experiments were conducted: 2 mM Fe(II) was added to a low-phosphate medium, resulting in the precipitation of vivianite (Fe3(PO4)2), to which 2 mM nitrite () was later added, with or without an autoclaved cell suspension ( cells mL−1) of Shewanella oneidensis MR-1. Concentrations of nitrite (), nitrous oxide (N2O), and iron (Fe2+, Fetot) were monitored over time in both set-ups to assess the impact of Fe(II) minerals and/or DB as catalysts of chemodenitrification. In addition, the natural-abundance isotope ratios of and N2O (δ15N and δ18O) were analysed to constrain the associated isotope effects. Up to 90 % of the Fe(II) was oxidized in the presence of DB, whereas only ∼65 % of the Fe(II) was oxidized under mineral-only conditions, suggesting an overall lower reactivity of the mineral-only set-up. Similarly, the average reduction rate in the mineral-only experiments (0.004±0.003 mmol L−1 d−1) was much lower than in the experiments with both mineral and DB (0.053±0.013 mmol L−1 d−1), as was N2O production (204.02±60.29 nmol L−1 d−1). The N2O yield per mole reduced was higher in the mineral-only set-ups (4 %) than in the experiments with DB (1 %), suggesting the catalysis-dependent differential formation of NO. N- isotope ratio measurements indicated a clear difference between both experimental conditions: in contrast to the marked 15N isotope enrichment during active reduction ( ‰) observed in the presence of DB, loss in the mineral-only experiments exhibited only a small N isotope effect (<+1 ‰). The -O isotope effect was very low in both set-ups ( <1 ‰), which was most likely due to substantial O isotope exchange with ambient water. Moreover, under low-turnover conditions (i.e. in the mineral-only experiments as well as initially in experiments with DB), the observed isotope systematics suggest, transiently, a small inverse isotope effect (i.e. decreasing δ15N and δ18O with decreasing concentrations), which was possibly related to transitory surface complexation mechanisms. Site preference (SP) of the 15N isotopes in the linear N2O molecule for both set-ups ranged between 0 ‰ and 14 ‰, which was notably lower than the values previously reported for chemodenitrification. Our results imply that chemodenitrification is dependent on the available reactive surfaces and that the (rather than the N2O) isotope signatures may be useful for distinguishing between chemodenitrification catalysed by minerals, chemodenitrification catalysed by dead microbial biomass, and possibly true enzymatic NDFeO.
- Article
(2433 KB) - Full-text XML
-
Supplement
(764 KB) - BibTeX
- EndNote


Iron (Fe) is essential for all living beings, and its biogeochemical cycling has been studied extensively (Expert, 2012; Lovley, 1997). Although Fe is ubiquitous in most environments, it is not always bioavailable (Andrews et al., 2003; Ilbert and Bonnefoy, 2013), and microorganisms must often cope with Fe limitation in their respective environments (Braun and Hantke, 2013; Ilbert and Bonnefoy, 2013). This is especially true at circumneutral pH and oxic conditions, where Fe(II) is quickly oxidized by O2 and, thus, only present as poorly soluble Fe(III)(oxyhydr)oxides (Cornell and Schwertmann, 2003; Stumm and Sulzberger, 1992). In contrast, under anoxic conditions, Fe is mainly present as either dissolved Fe2+ or as mineral-bound Fe(II) in Fe phosphates or carbonates (Charlet et al., 1990; Luna-Zaragoza et al., 2009). Here, microbes use electron acceptors other than O2 for respiration (He et al., 2016b; Lovley, 2012; Straub et al., 1996). One redox pair that has been proposed to be exploited by microbes under anoxic conditions through a mechanism known as nitrate-dependent Fe(II) oxidation (NDFeO) is (Ilbert and Bonnefoy, 2013; Straub et al., 1996). To date, genetic evidence that clearly supports this metabolic capacity of the studied microorganisms remains lacking (Price et al., 2018), and biogeochemical evidence is rare and putative. The latter is mostly based on experiments with the chemolithoautotrophic culture KS, which is a consortium of four different strains, including a relative of the microaerophilic Sideroxydans/Gallionella. This enrichment culture has been shown to oxidize Fe(II) without the addition of any organic co-substrates (Tominski et al., 2018). Tian et al. (2020) confirmed that Gallionellaceae are able to perform autotrophic Fe(II)-dependent denitrification. Another more indirect line of evidence includes results from slurry microcosm experiments with marine coastal sediments. In these experiments, Fe(II) oxidation was still detected even after all bioavailable organics of the sediments were consumed and only was left (Laufer et al., 2016). With regard to other studies where NDFeO was initially thought to be performed by autotrophs (Chakraborty et al., 2011; Weber et al., 2009), it was subsequently shown that the microbes rely on an organic co-substrate and must in fact be considered mixotrophic (Klueglein et al., 2014; Muehe et al., 2009). However, the exact mechanism promoting NDFeO in the microorganisms that have been investigated so far, e.g. Acidovorax delafieldii strain 2AN and Pseudogulbenkiania ferrooxidans strain 2002 (Chakraborty et al., 2011; Weber et al., 2009), is still not fully understood. It has been suggested that extracellular electron transfer (EET) might play a major role in NDFeO, particularly in the presence of high levels of extracellular polymeric substances (EPS; Klueglein et al., 2014; Liu et al., 2018; Zeitvogel et al., 2017). EPS have been demonstrated to act as electron shuttles; hence, EET may indeed provide a plausible explanation for the observed Fe(II) oxidation in these cultures (Liu et al., 2018). The existence of such an electron transfer would imply that NDFeO is not necessarily a completely enzymatically catalysed reaction. Considering that all putative NDFeO strains were grown under high (up to 10 mM) nitrate () and Fe(II) concentrations and accumulated up to several millimoles of nitrite () from enzymatic reduction, other studies suggested that the observed Fe(II) oxidation in these pure cultures may be due to the abiotic side reaction between the generated and Fe(II) (Buchwald et al., 2016; Dhakal, 2013; Klueglein et al., 2014). This abiotic reaction between and Fe(II) is known as chemodenitrification (Eq. 1) and is proposed to lead to an enhanced production of N2O (Anderson and Levine, 1986; Buchwald et al., 2016; Zhu-Barker et al., 2015).
Several studies have noted that the presence of reactive surfaces may enhance the abiotic reaction (Heil et al., 2016; Sorensen and Thorling, 1991). For example, Klueglein and Kappler (2013) tested the impact of goethite on Fe-coupled chemodenitrification in the presence of high Fe(II) and concentrations, and they confirmed the concentration dependency of this reaction with regard to both species (Van Cleemput and Samater, 1995). Possible catalytic effects (e.g. by reactive surfaces and/or organic matter) were not tested specifically in these studies. However, multiple factors have been shown to affect the abiotic reaction between and Fe(II) and may need to be considered, i.e. pH, temperature, Fe2+ concentrations, solubility of Fe(III)(oxyhydr)oxides, crystallinity of Fe(II) minerals, other metal ion concentrations, and catalytic effects (Van Cleemput and Samater, 1995; Klueglein and Kappler, 2013; Ottley et al., 1997). In addition, the presence of organic compounds can lead to the abiotic reduction of to NO (Van Cleemput and Samater, 1995; McKnight et al., 1997; Pereira et al., 2013).
Given the complex controls and potential interaction between Fe(II) and various nitrogenous compounds, including intermediates, it may be an oversimplification to state that Fe(II) oxidation observed in previous laboratory set-ups is solely caused by the abiotic reaction with and not, for example, stimulated by reactive surfaces (minerals, organic-detritus) or by nitric oxide (NO), which is a highly reactive intermediate that is not easily quantified in anoxic batch experiments. In order to better understand the factors that may control chemodenitrification of , this study focuses on the possible catalytic surface effects induced by an Fe(II) mineral phase or dead biomass (DB). Furthermore, microbial cells, DB, or detrital waste products might not only provide additional reactive surface area but may also directly react with to form NO.
Stable isotopes of both N and O (δ15N and δ18O) offer a promising approach to further elucidate the mechanism of NDFeO and also to more generally expand our understanding of chemodenitrification. The N and O isotopic composition of nitrogenous compounds (e.g. , , and N2O) has been used to gain deeper insights into various N turnover processes (Granger et al., 2008, 2009; Jones et al., 2015). The dual (or ) isotope approach is based on the fact that specific N-transformation processes – biotic or abiotic – are associated with specific N and O isotope fractionation (i.e. isotope effect). In general, enzymatic processes promote the more rapid reaction of lighter N and O isotopologues, leaving the remaining substrate pool enriched in the heavier isotopes, i.e. 15N and 18O (Granger et al., 2008; Kendall and Aravena, 2000; Martin and Casciotti, 2017). Only a few studies exist that have looked into the isotope effects of chemodenitrification, and reports on the associated isotope effects are variable. Consistent with what we know from biological denitrification, chemodenitrification experiments with 10 mM Fe(II) and as well as and very high reaction rates revealed a significant increase in the δ15N (up to 40 ‰) and δ18O (up to 30 ‰) values, corresponding to an overall N and O isotope effect of 15ε18.1±1.7 ‰ and 18ε9.8±1.8 ‰, as well as a Δ15N (i.e. the difference between and δ15N2O) of 27±4.5 ‰ (Jones et al., 2015). However, reaction kinetics can significantly affect isotope reaction dynamics, and chemodenitrification is possibly impacted by factors such as concentration effects and/or the presence of different catalysts (i.e. surfaces, organics). Hence, performing coupled N and O isotope measurements might help to gain deeper insights into the mechanistic details and fractionation systematics of reduction in the presence of Fe(II). Here, in order to expand the limited dataset on the isotope effects of abiotic Fe(II)-coupled denitrification and, in turn, to lay the groundwork for using N and O isotope measurements to unravel the mechanism behind NDFeO, we studied the N and O isotope dynamics of reduction and N2O production during the abiotic reaction of with Fe(II). As the extent of the formation of various Fe(III)(oxyhydr)oxides has previously been reported to enhance chemodenitrification dynamics (Chen et al., 2018; Sorensen and Thorling, 1991), we also followed mineral alteration during chemodenitrification in order to identify possible reaction patterns. A specific goal in this context was to assess the impact of Fe(II) precipitates and/or dead biomass as catalytic agents during Fe(II)-associated chemodenitrification as well as the potential mineral transformation processes associated with the abiotic oxidation of Fe(II) via reactive NOx species.
2.1 General experimental set-up
For all experiments, anoxic low phosphate medium – 1.03 mM KH2PO4, 3.42 mM NaCl, 5.61 mM NH4Cl, 2.03 mM MgSO4 ⋅ 7 H2O, and 0.68 mM CaCl2 ⋅ 2 H2O, with a seven-vitamin (Widdel and Pfennig, 1981) and a SL-10 trace element solution (Widdel et al., 1983); 22 mM bicarbonate buffered – was prepared. The medium was dispensed with a Widdel flask in 1 L Schott bottles, and the pH for each bottle was adjusted separately by the addition of anoxic, sterile 1 M HCl. For both set-ups, five different pH values were targeted: 5.8, 6.2, 6.5, 6.9, and 7.1. After pH adjustment, Fe(II)Cl2 was added to reach a concentration of ∼2 mM Fe(II), and, if necessary, the pH was readjusted. The medium was kept at 4 ∘C for 48 h, resulting in amorphous, greyish-green Fe(II) precipitates. In addition, ∼2 mM NaNO2 and ∼1 mM Na acetate were added to the main medium stocks shortly before 10 mL aliquots of the medium were distributed into 20 mL headspace vials (heat sterilized) in an anoxic glove box (MBRAUN, N2, 100 %). Acetate was added to mimic experiments in which bacteria are cultivated (although acetate concentrations did not change during incubations, underscoring that the organic acid was not involved in the observed reactions; data not shown). All headspace vials were closed with black butyl stoppers and were crimp sealed (headspace N2∕CO2; 90∕10, v∕v). All vials were then incubated at 28 ∘C in the dark.
Incubations with dead biomass
Shewanella oneidensis MR-1, a facultative aerobic Gram-negative bacterium, is seen as a model organism for bioremediation studies due to its various respiratory abilities (Heidelberg et al., 2002; Lies et al., 2005). It is known to perform dissimilatory metal reduction by utilizing alternative terminal electron acceptors such as elemental sulfur, Mn(IV), Fe(III), or . As S. oneidensis produces large amounts of EPS (Dai et al., 2016; Heidelberg et al., 2002) but is not capable of oxidizing Fe(II) (Lies et al., 2005; Piepenbrock et al., 2011), i.e. there is no interference with abiotic reactions involving Fe/chemodenitrification, we chose concentrated and sterilized S. oneidensis for our dead biomass experiments. In preparation for these experiments, S. oneidensis MR-1 was grown under oxic conditions on a LB (lysogeny broth) medium (10 g tryptone, 5 g yeast extract, and 10 g NaCl in 1 L deionized water) in six 250 mL Erlenmeyer flasks. After 12 h, cultures were transferred into 50 mL Falcon tubes and centrifuged for 25 min at 3956.6×g (4000 rpm; Eppendorf, 5430 R, Rotor F-35-6-30). Cell-containing pellets were washed twice with oxalic acid and centrifuged again, followed by three more washing steps with Tris buffer prior to final resuspension in 5 mL of Tris buffer. Pellet suspensions were pooled in a 100 mL serum bottle and autoclaved twice to ensure that all cells were killed. Before distribution of the medium into 20 mL vials (see above), cell suspension was added to yield a cell density of cell mL−1. Care was taken to ensure the homogenous distribution of mineral precipitates and the dead biomass.
2.2 Sampling and sample preparation
Incubations were run for approximately 30 d, and sampling was performed in an anoxic glove box (MBRAUN, N2, 100 %) at five time points. For each time point and for each pH treatment, nine replicates were prepared. Therefore, variations between the replicates and the different sampling time points are possible. For sampling, the headspace was quantitatively transferred into 12 mL He-purged Exetainer vials (Labco) for N2O concentration measurements. Then, 2 mL of the liquid sample was transferred into 2 mL Eppendorf Tubes and centrifuged for 5 min (12100×g, 13400 rpm; Eppendorf, MiniSpin); this was followed by a 1:10 dilution of the supernatant in 1 mL of anoxic Milli-Q water for quantification. A second 100 µL aliquot was diluted (1:10) in 40 mM sulfamic acid (SFA) for iron determination by ferrozine analysis (Granger and Sigman, 2009; Klueglein and Kappler, 2013). The remaining supernatant was used for high-performance liquid chromatography (HPLC) and isotope analysis. Finally, the spun-down pellet was resuspended in 1 M HCl for ferrozine analysis (Stookey, 1970). All liquid samples were stored at 4 ∘C in the dark until further processing. The remaining liquid samples were used for 57Fe Mössbauer spectroscopy.
2.3 Analytical techniques
2.3.1 NO concentrations
concentrations were quantified within 1 h after the sample was taken via a standard segmented continuous-flow analytical (CFA, SEAL Analytics) photometric technique (Snyder and Adler, 1976). reduction rates were calculated based on the observed net concentration decrease ( ± standard error) with time.
2.3.2 Fe concentrations
SFA- and/or HCl-fixed samples were stored in the dark and at 4 ∘C until Fe(II) concentrations were analysed using the ferrozine assay (Stookey, 1970), which was adapted for -containing samples by Klueglein and Kappler (2013). Total Fe(II) concentrations were calculated as the sum of the concentrations.
2.3.3 N2O concentrations
Prior to the quantification of the N2O, the sample gas was diluted (1:5) with 5.0 He. Triplicate samples were then analysed using a gas chromatograph with an electron capture detector (GC-ECD; Agilent 7890 with a micro-ECD and a flame ionization detector, FID; Porapak Q 80/100 column). GC-ECD measurements were calibrated using four standard gases containing different concentrations of N2O (Niklaus et al., 2016). N2O production rates were calculated based on the observed net N2O concentration increase ( ± standard error) with time.
2.3.4 57Fe Mössbauer spectroscopy
For Mössbauer spectroscopic analyses, the remaining liquid samples (ca. 8 mL) were processed inside an anoxic glove box. The entire liquid including the precipitates was passed through a 0.45 µm filter. The wet filter was then sealed between two layers of Kapton tape and kept inside sealed Schott bottles in a freezer (−20 ∘C) under anoxic conditions until analysis. From the treatments with DB, samples were collected at Day 0 at a pH of 6.8 and at the end of the experiment (∼30 d) at pH levels of 6.8 and 5.8. For the mineral-only experiment, only one sample (time point zero, pH 6.8) was analysed as a basis for comparison with the DB experiments (i.e. to verify whether DB has an immediate effect on the mineral phase). Taking care to minimize exposure to air, samples were transferred from the air-tight Schott bottles and loaded inside a closed-cycle exchange gas cryostat (Janis cryogenics). Measurements were performed at 77 K with a constant acceleration drive system (WissEl) in transmission mode with a 57Co∕Rh source and were calibrated against a 7 µm thick α-57Fe foil measured at room temperature. All spectra were analysed using Recoil (University of Ottawa) by applying a Voigt-based fitting (VBF) routine (Lagarec and Rancourt, 1997; Rancourt and Ping, 1991). The half width at half maximum (HWHM) was fixed to a value of 0.130 mm s−1 during fitting.
2.3.5 Nitrite N and O isotope measurements
The nitrogen (N) and oxygen (O) isotope composition of was determined using the azide method (McIlvin and Altabet, 2005). This method is based on the chemical conversion of to gaseous N2O at a low pH (4 to 4.5) (McIlvin and Altabet, 2005) and the subsequent analysis of the concentrated and purified N2O by gas chromatography–isotope ratio mass spectrometry (GC-IRMS). Addition of 0.6 M NaCl to the acetic acid–azide solution was conducted in order to minimize oxygen isotope exchange (McIlvin and Altabet, 2005). The acetic acid–azide solution was prepared freshly every day (McIlvin and Altabet, 2005) and kept in a crimp-sealed (grey butyl stopper) 50 mL serum bottle. A sample volume equivalent to 40 nmol was added to pre-combusted headspace vials, filled up to 3 mL with anoxic Milli-Q water, and crimp sealed. Then, 100 µL of the acetic acid–azide solution was added. After ∼7 h, 100 µL of 6 M NaOH was added to stop the reaction. Until isotope analysis by a modified purge and trap gas bench coupled to CF-IRMS (McIlvin and Casciotti, 2010), the samples were stored upside down at room temperature in the dark. Two nitrite isotope standards, namely N-7373 (δ15N: −79.6 ‰, δ18O: +4.5 ‰) and N-10219 (δ15N: +2.8 ‰; δ18O; +88.5 ‰) Casciotti and McIlvin, 2007), were prepared on the day of isotope analysis and processed in the same way as samples. N and O isotope data are expressed in the common δ notation and reported as per mille deviation (‰) relative to AIR-N2 and VSMOW respectively (δ15N = ([15N] ∕ [14N])sample ∕ [15N] ∕ [ 14N]air_N2 −1) × 1000 ‰ and δ18O = ([18O] ∕ [ 18O]sample∕ [18O] ∕ [16O]VSMOW−1) ×1000 ‰ respectively). Based on replicate measurements of laboratory standards and samples, the analytical precision for δ15N and δ18O analyses was ±0.4 ‰ and ±0.6 ‰ (1SD) respectively.
2.3.6 N2O N and O isotope measurements
Triplicate 12 nmol samples of N2O were injected into 20 mL headspace vials that had been previously flushed for 5 h with 5.0 He (injection volumes according to the N2O concentrations were determined beforehand). The N2O was then analysed directly using CF-IRMS (see above). Two standard gases with known δ15N and δ18O values were analysed along with the samples, namely FI.CA06261 (δ15N: −35.74 ‰; δ15Nα: −22.21 ‰; δ15N ‰; δ18O: 26.94 ‰) and FI.53504 (δ15N: 48.09 ‰; δ15Nα: 1.71 ‰; δ15Nβ=94.44 ‰; δ18O: 36.01 ‰), which were provided by Joachim Mohn from Empa (e.g. Mohn et al., 2014). The gases were calibrated on the Tokyo Institute of Technology scale for bulk and site-specific isotopic composition (Ostrom et al., 2018; Toyoda and Yoshida, 1999). Ratios of m∕z 45∕44, 46∕44 and the 31∕30 signals were used to calculate values of δ15Nbulk (referenced against AIR-N2), δ18O (referenced against VSMOW), and site-specific δ15Nα and δ15Nβ based on Frame and Casciotti (2010). Site preference (SP) was calculated as δ15Nα – δ15Nβ (Sutka et al., 2006; Toyoda and Yoshida, 1999).
2.4 Pourbaix diagram
In order to predict the stability and behaviour of the N- and Fe(II)-bearing chemical species in the same system, a Pourbaix (Eh–pH) diagram was constructed (Delahay et al., 1950) as a valuable tool to predict possible reactions and speciation of end products under different experimental conditions. To calculate the electrochemical potentials for the stepwise reduction of nitrite during denitrification, as well as Fe(II) oxidation reactions, standard electrode potentials were taken from different references (Table S1 in the Supplement). The Pourbaix diagram presented in Sect. 4 was devised using concentrations measured during the experiments performed for this study.
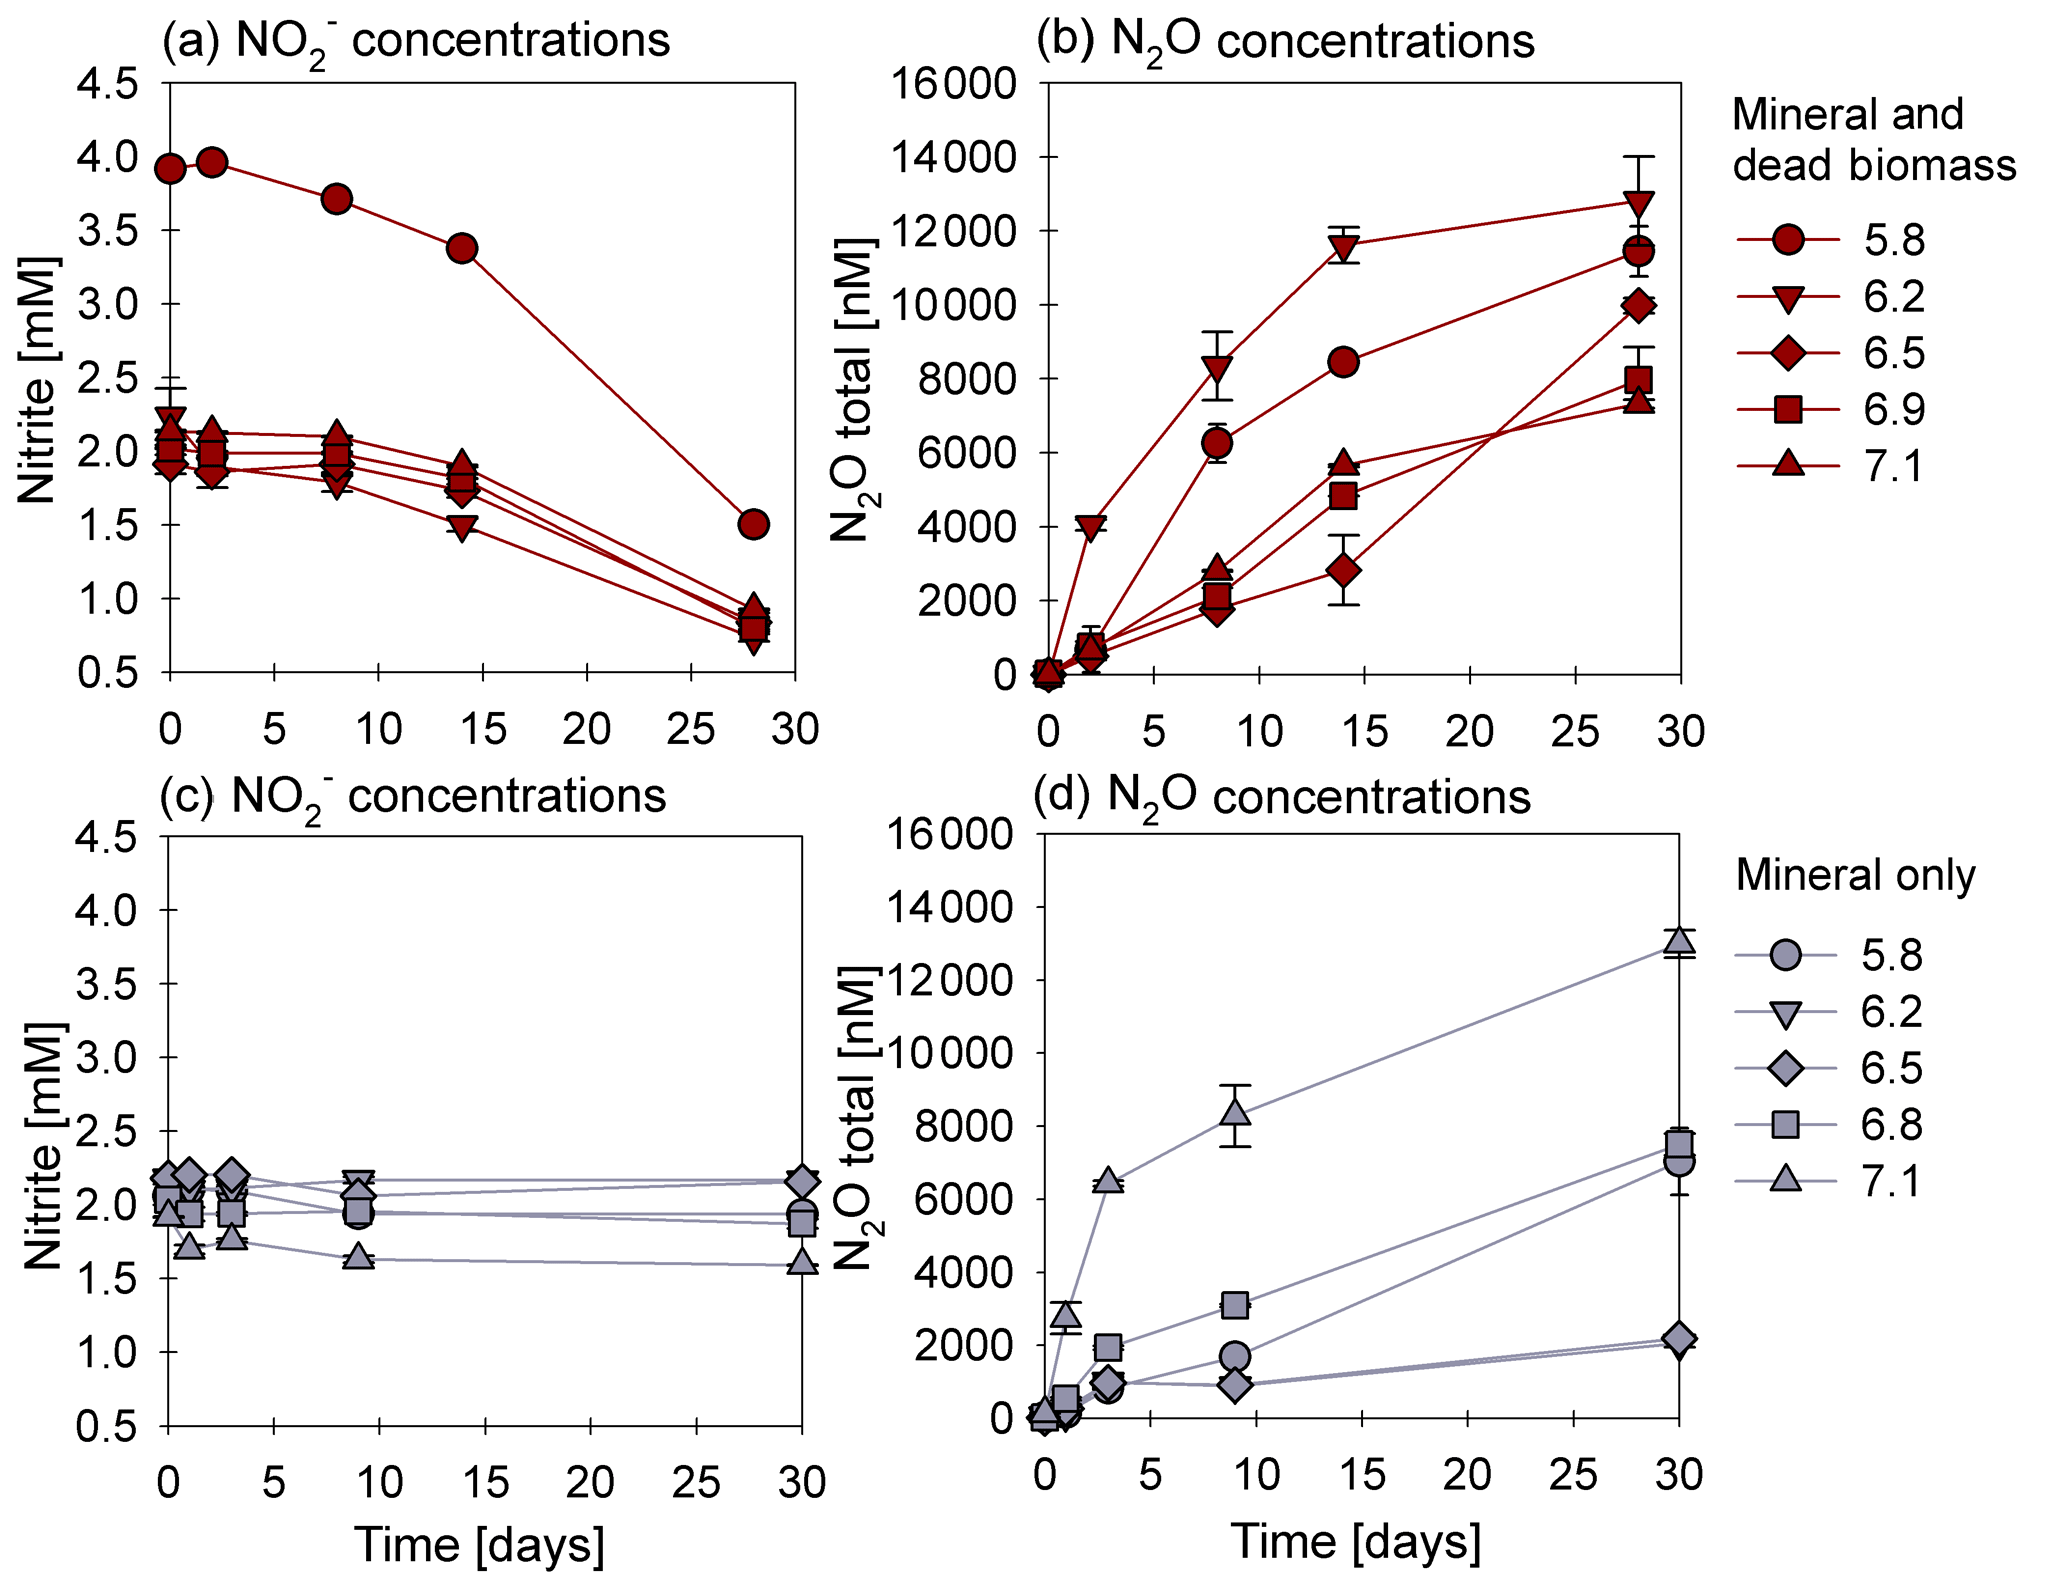
Figure 1Nitrite reduction (a, c) and N2O production (b, d) over time in the mineral and dead biomass (red) and mineral-only (grey) set-ups over time and at different pH levels. Please note that twice the amount of nitrite was accidently introduced at a pH of 5.8. The standard error calculated from biological replicates (n=9) is represented by the error bars.
3.1 Chemodenitrification kinetics
In the presence of DB, reduction rates were much higher than in the mineral-only set-up (Fig. 1a, c), with up to ∼60 % of the initially amended being transformed during the incubation period, independent of the pH. The addition of DB led to a decrease in concentrations from 2 mM to ∼0.7 mM (Fig. 1a). The pH 5.8 treatment (unintentionally amended with 2× ) also showed a similar fractional reduction. In the mineral-only set-ups, the decrease in concentration was rather moderate and ranged between 0.3 (pH 7) and 0.1 mM (at lower pH), as shown in Fig. 1c. In all treatments, N2O was produced but accounted for a maximum of only 0.7 % of the consumed. The final N2O yield per mole reduced tended to be lower in the mineral and DB vs. the mineral-only amended set-ups for most of the pH levels (Fig. 1b vs. d). The highest N2O production was observed at circumneutral pH (7.1) in the mineral-only set-up, whereas maximum final N2O concentrations were observed at a lower pH (6.2) in the incubations with DB (Figs. 1b; S4 in the Supplement). A systematic pH effect, however, could not be discerned. Fe(II)total concentrations rapidly decreased in both set-ups. In the presence of DB, Fe(II)total oxidation was almost complete (Fig. 2a), independent of the pH, whereas in the mineral-only experiment, Fe(II)total decreased during the first 5–10 d but then seemed to reach a steady state (Fig. 2b). At pH levels of 6.8 and 5.8, only 40 % of the Fe(II)total was oxidized, whereas at the other pH levels up to 80 % of the Fe(II)total initially amended was oxidized. Total Fe decreased over time (Fig. S2).
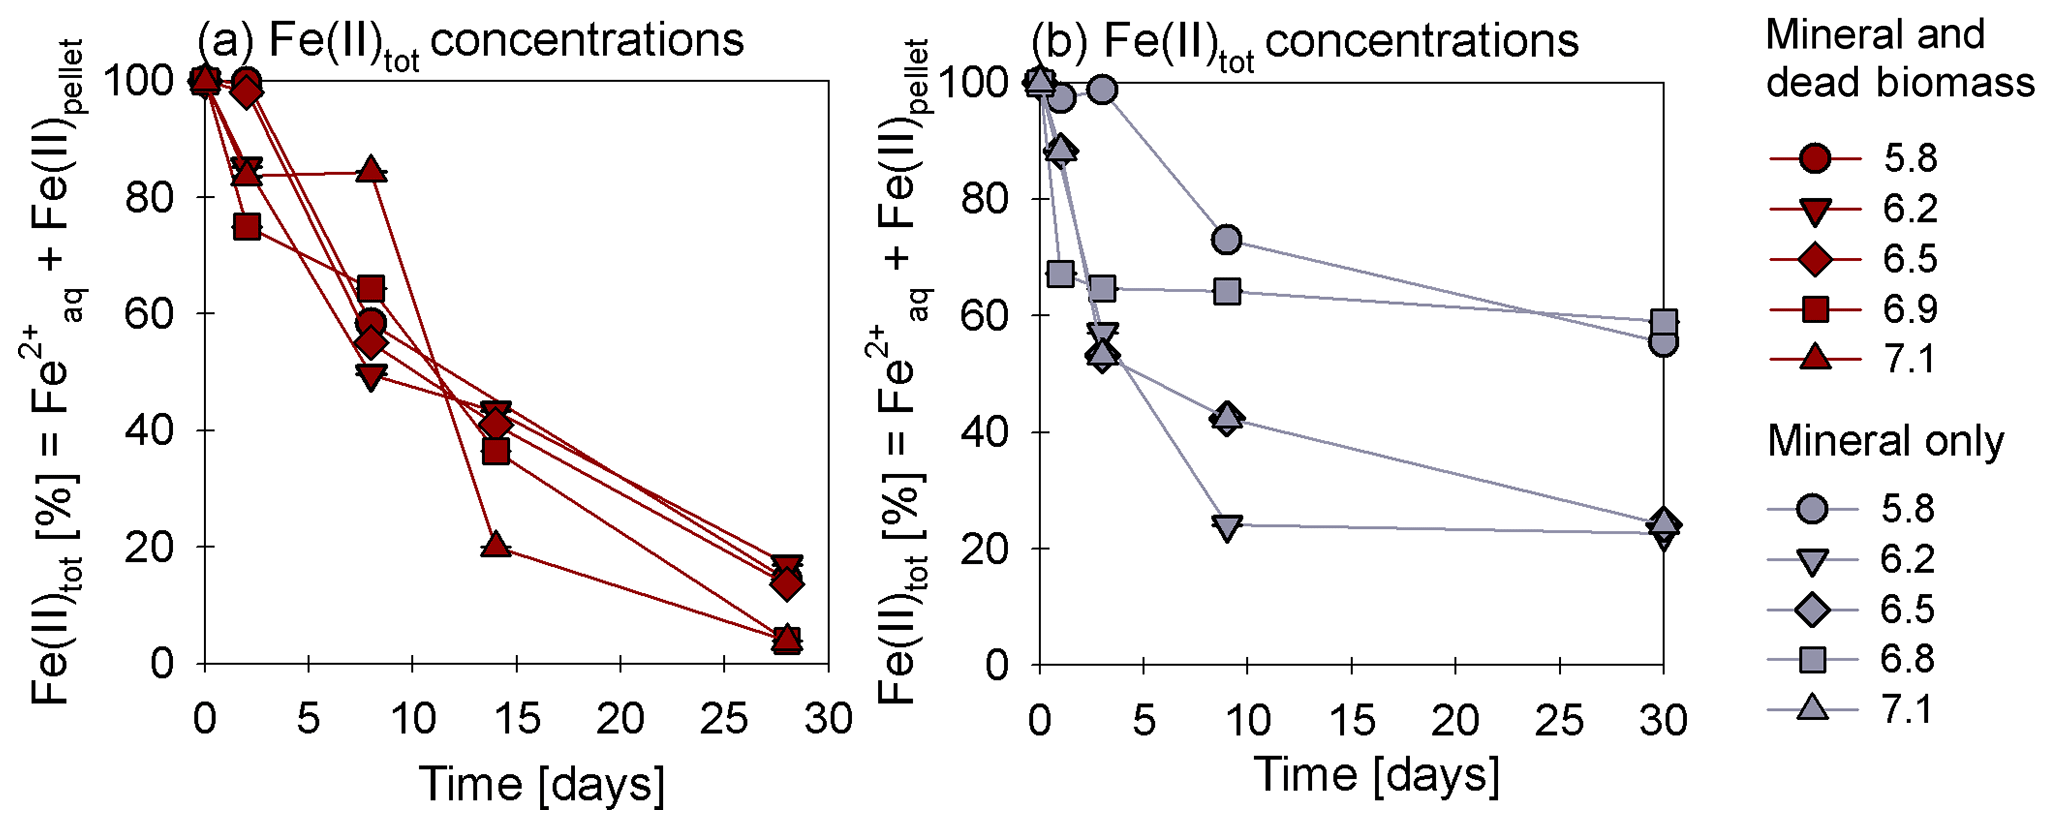
Figure 2Oxidation of total Fe(II) over time given (reported as a percentage of the initial concentration) in the mineral and dead biomass amended (red) and the mineral-only set-up (grey), tested at different pH levels. The standard error calculated from biological replicates (n=9) is represented by the error bars.
Average rates for reduction and N2O production at a pH of 6.8 were calculated (Table 1). Rates were calculated per day, and these results again emphasize that the amendment of dead biomass increased the rates by ∼92 %. Although not complete, Fe(II) oxidation in the presence of DB was also more pronounced, leading to only 10.5±2.8 % of Fe(II) remaining compared with the mineral-only set-up in which 37.1±8.2 % Fe(II) remained. To complement the colorimetric data, 57Fe Mössbauer spectroscopy was performed, and the data are presented in detail in the next section.
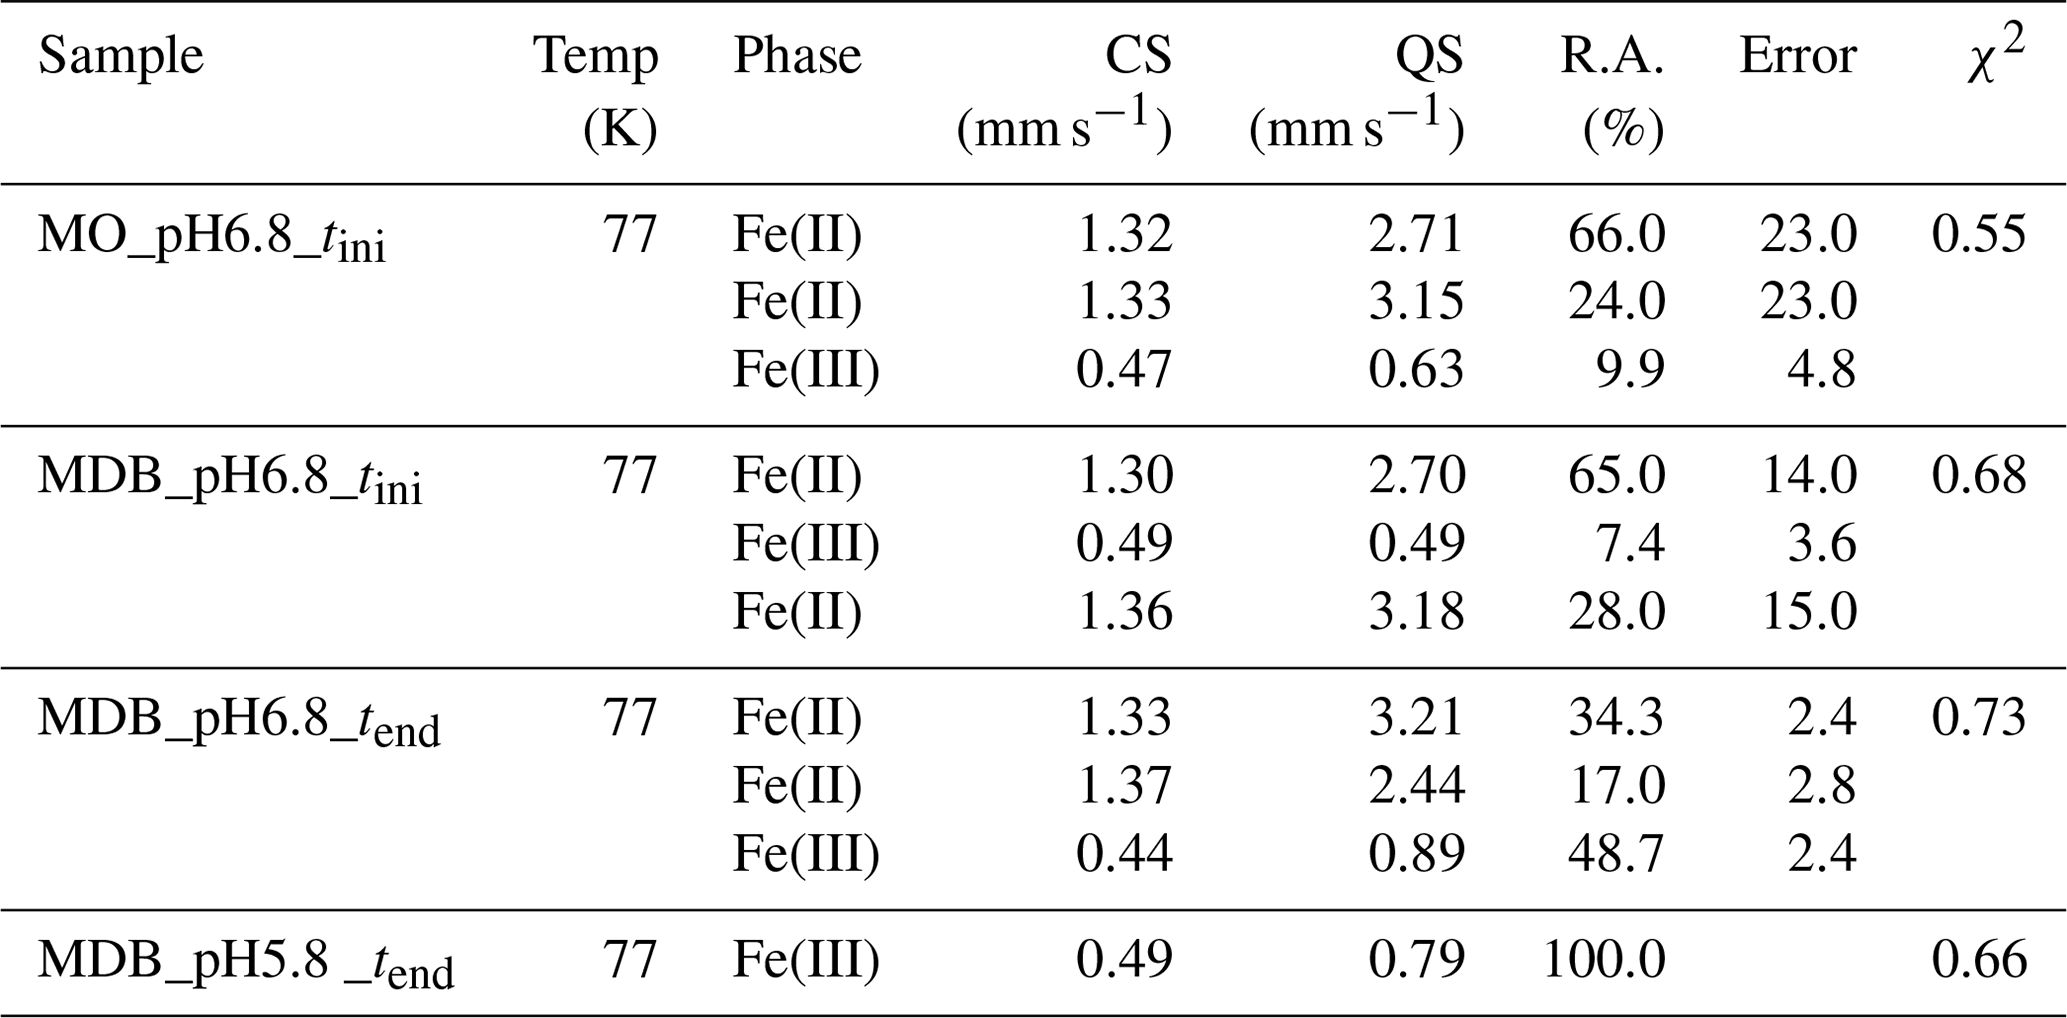
Table 1Chemodenitrification kinetics and mineral transformation during the mineral and dead biomass and the mineral-only experiments. Tini values represent means calculated by summarizing results across all pH levels ± standard error. The overall respective reduction and production rates, given per day, were calculated as follows: ± standard error and ± standard error. Fe(III) values were calculated using 57Fe Mössbauer spectroscopy data. Mineral phases were also identified using 57Fe Mössbauer spectroscopy with spectra collected at 77 K. The mineral-only sample taken after 28 d was inadvertently destroyed prior to Mössbauer measurement.
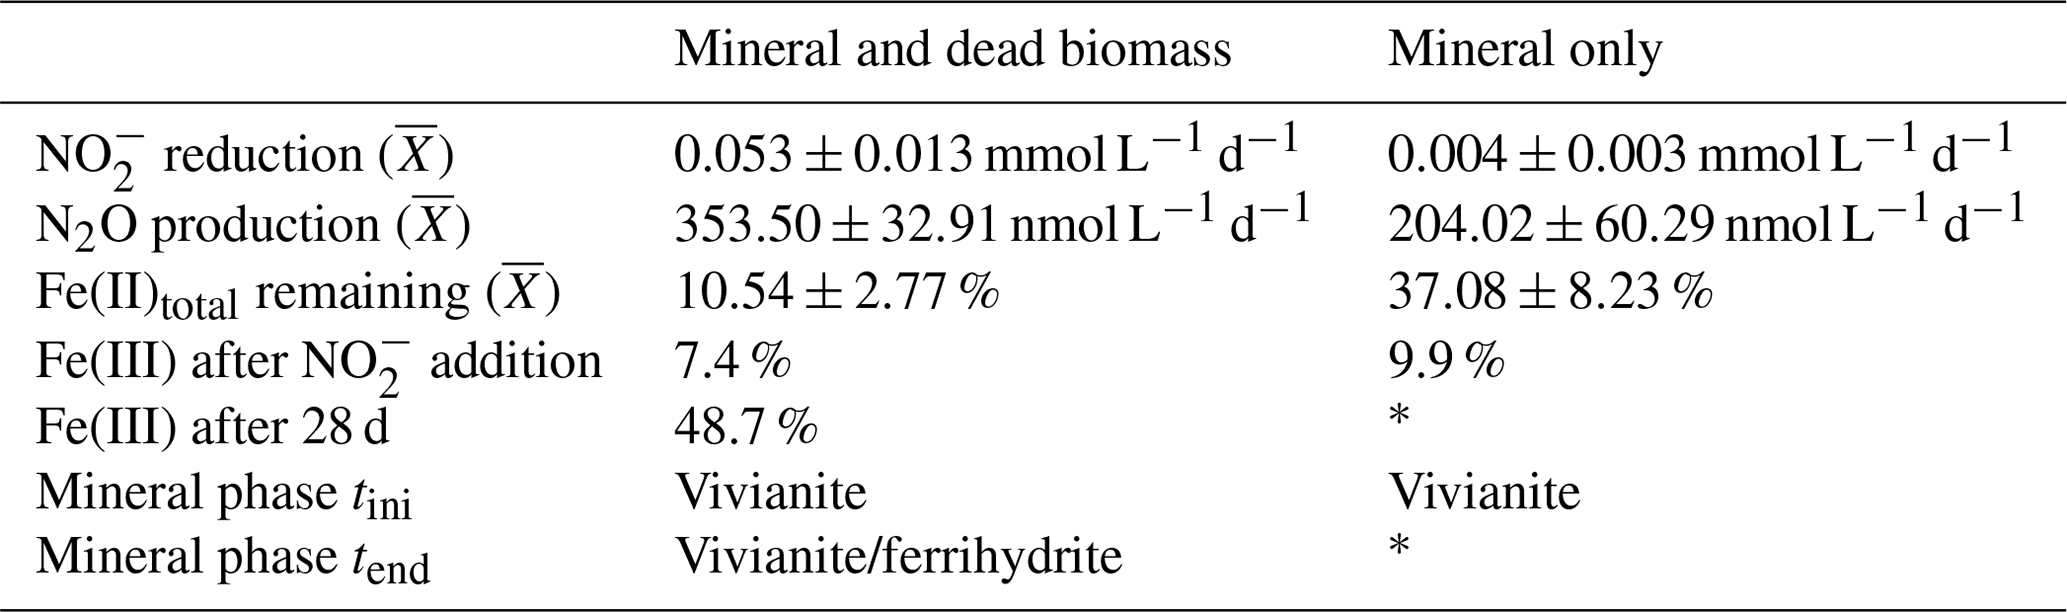
* Mössbauer sample processing failed.
3.2 Fe mineral analysis
57Fe Mössbauer spectroscopy was used to quantify structural Fe(II) and Fe(III) contents of the samples and identify differences in mineralogy under the different reaction conditions. The hyperfine parameters of the mineral phases in the mineral-only set-up at tinitial (pH 6.84) are dominated by Fe(II) doublets (Fig. 3a, QSD sites 1 and 2), which most closely match that of a vivianite spectrum (Muehe et al., 2013; Veeramani et al., 2011). There is a small component with low centre shift and quadrupole splitting, indicative of Fe(III), which accounts for ∼10 % of the spectral area (Fig. 3a, QSD Site 3). This suggests that some minor oxidation occurred, potentially during the transfer of sample into the spectrometer. The mineral phases in the DB-amended set-up at tinitial (pH 6.89) show very close approximation to the abiotic mineral-only set-up, although with slightly less Fe(III) (∼7.5 % of the spectral area; Fig. 3b, QSD Site 2). Precipitates analysed at the end of the DB-amended experiment (Day 28) show that the vivianite phase still dominates at a pH of 6.89 (Fig. 3c, QSD sites 1 and 2); however, the Fe(III) component is now much more prominent (Fig. 3c, QSD Site 3) and suggests the formation of a poorly crystalline/short-ranged ordered mineral such as ferrihydrite (Cornell and Schwertmann, 2003). At the lowest pH (5.78) and in the presence of DB, the pattern of the precipitates is completely dominated by one doublet (Fig. 3c, QSD Site 1), with hyperfine parameters corresponding to a poorly ordered Fe(III) mineral such as ferrihydrite (Cornell and Schwertmann, 2003). Unfortunately, the sample processing failed for the mineral-only sample taken after 28 d; therefore, it cannot be used for further elucidations. Detailed fitting results of the 57Fe Mössbauer spectroscopy are provided in Table 2.
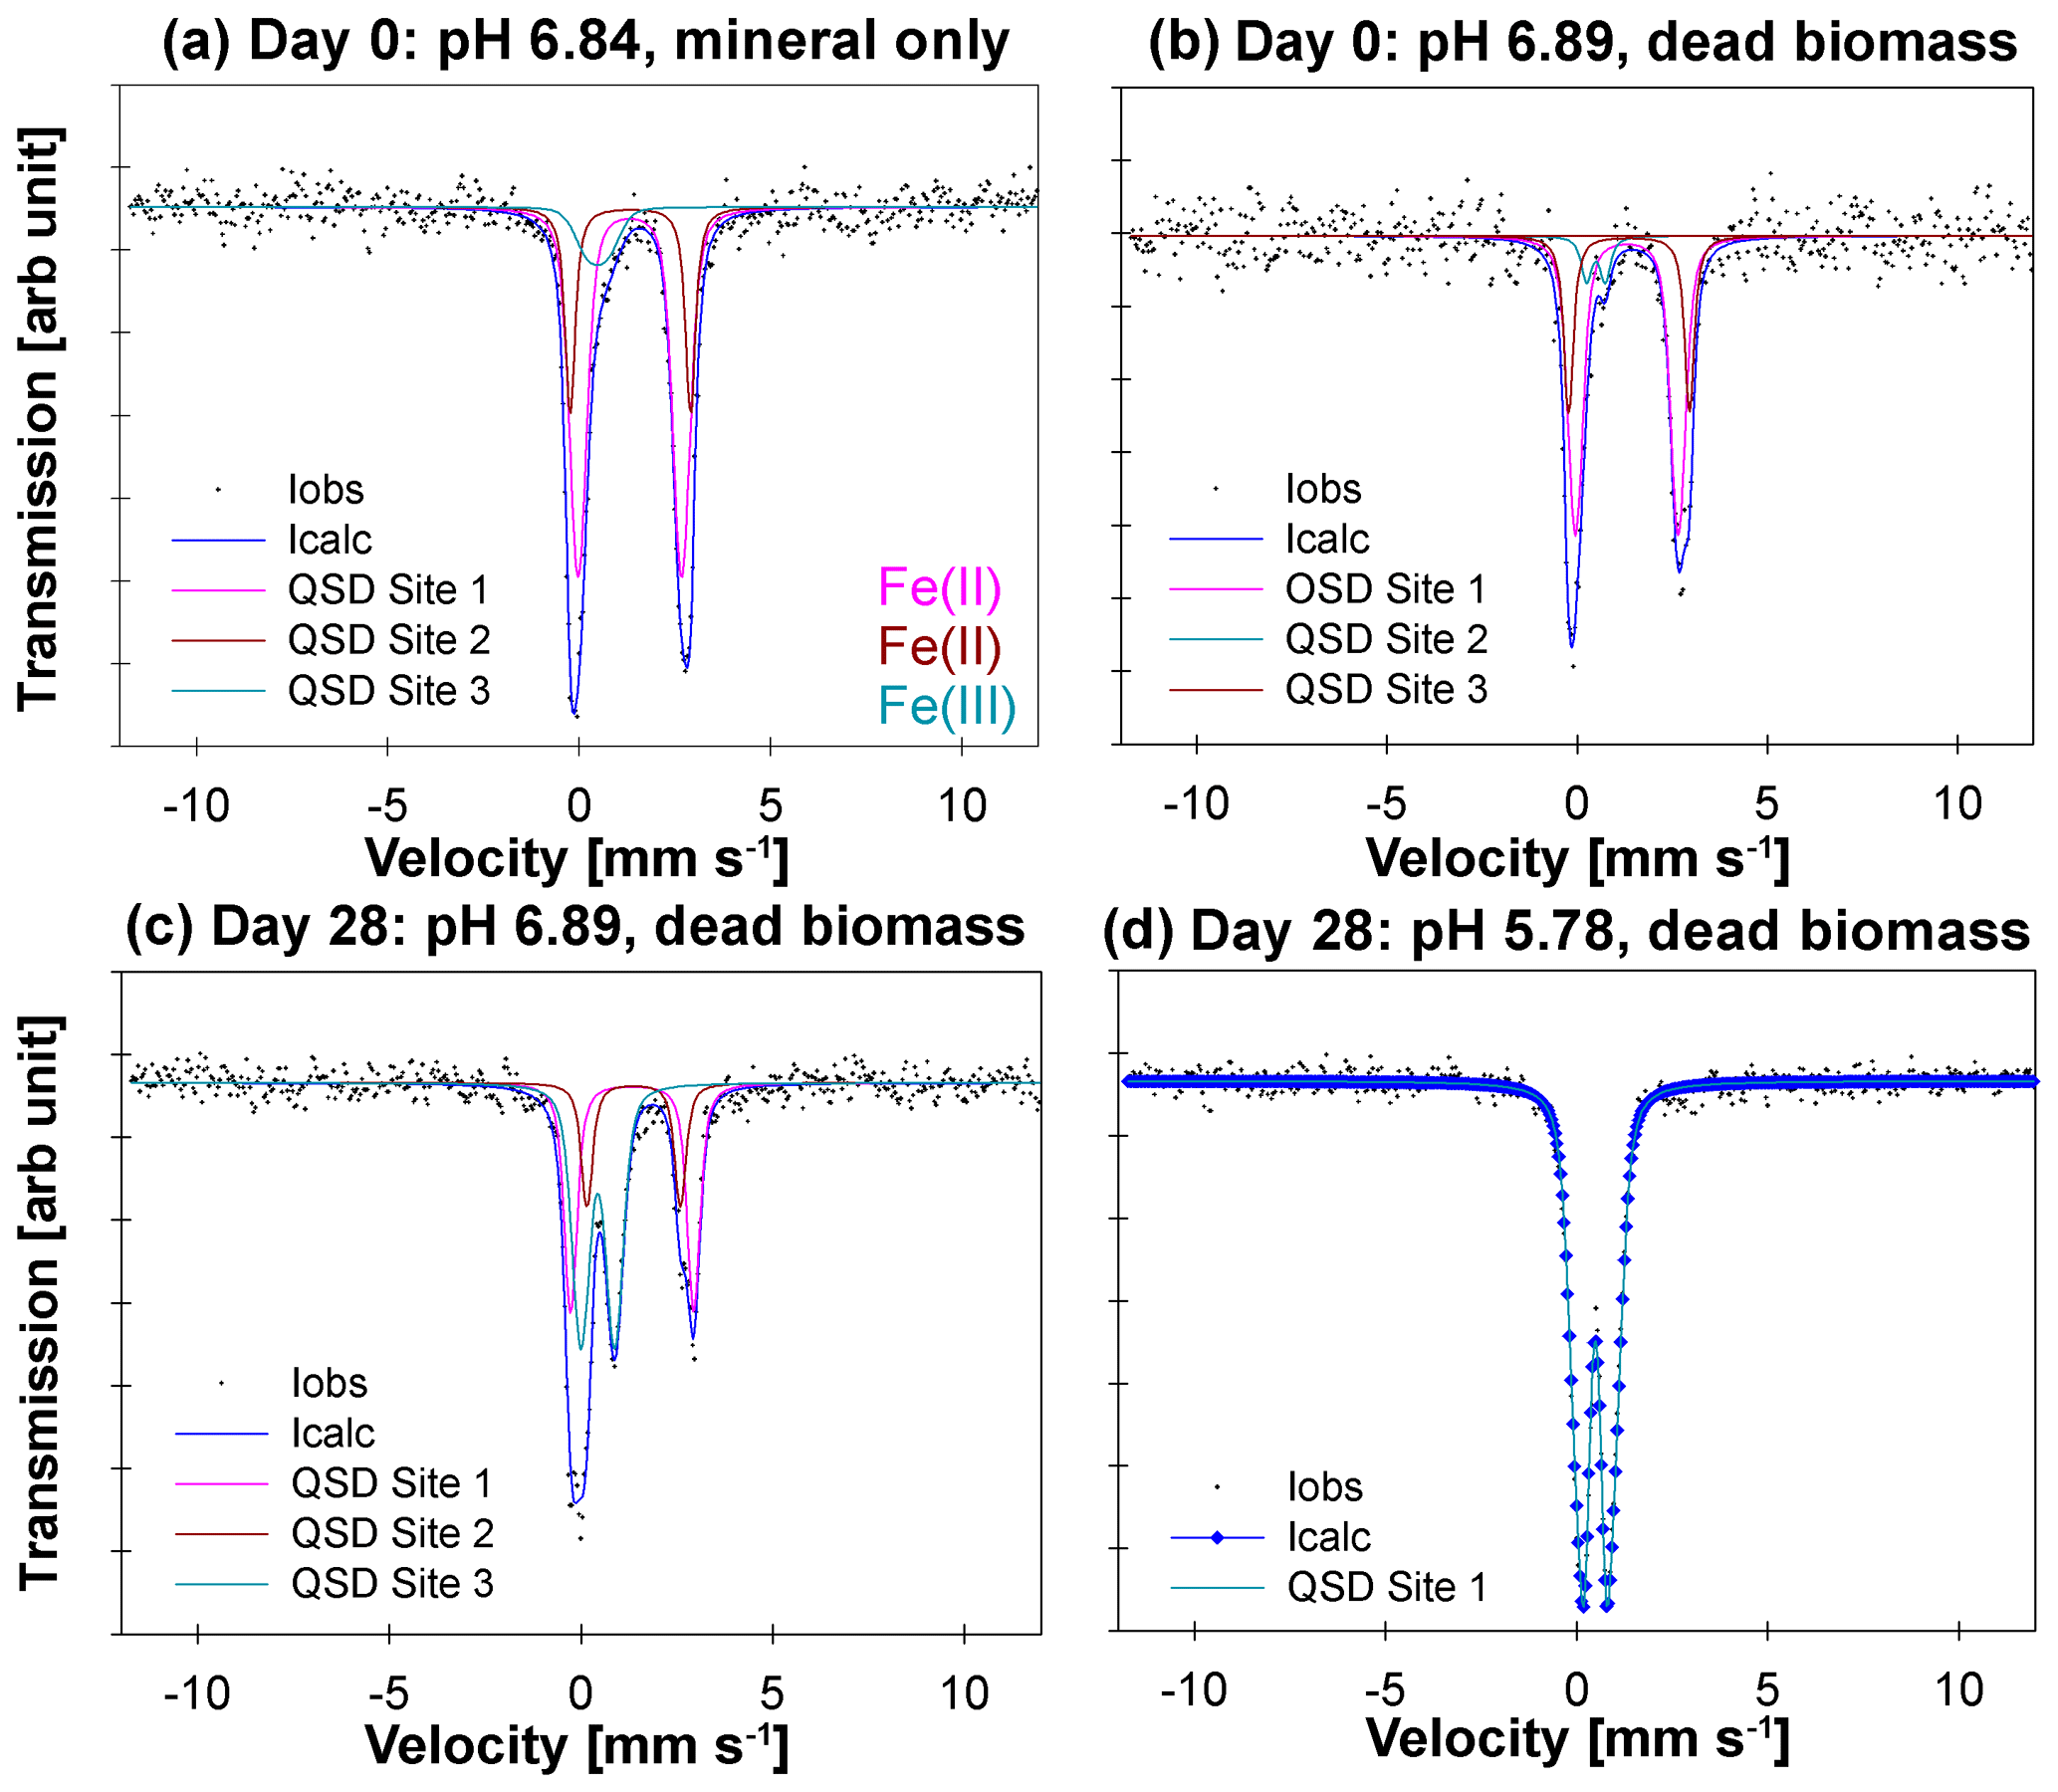
Figure 357Fe Mössbauer spectra collected at 77 K for (a) the mineral-only set-up precipitates at Day 0 at a pH of 6.84, (b) the mineral and dead biomass amended set-up precipitates at Day 0 at a pH of 6.89, (c) the mineral and dead biomass amended set-up precipitates at Day 28 at a pH of 6.89, and (d) the mineral and dead biomass amended set-up precipitates at Day 28 at a pH of 5.78. Full lines represent the calculated spectra and their sums. Colours of the fits represent the corresponding Fe phase and, thus, vary between the graphs: Fe(II) doublets, (a, c – QSD sites 1 and 2; b – QSD sites 1 and 3) closely match the spectra known for vivianite. Minor amounts of Fe(III) are present at Day 0 in both the mineral-only and DB-amended set-ups (a, b – QSD Site 3/2). Single doublets shown in panels (c) (QSD Site 3) and (d) (QSD Site 1) correspond to a poorly ordered Fe(III) mineral such as ferrihydrite.
Table 2Fitting results of Mössbauer spectroscopy. CS stands for centre shift, QS stands for quadrupole splitting, R.A. stands for relative abundance determined by integration under the curve, and χ2 represents the goodness of fit. Sample collection took place at tini (the initial time point) and tend (the end time point). MO denotes mineral only, and MDB denotes mineral and dead biomass.
3.3 Nitrite and N2O isotope dynamics
In experiments with DB, the δ15N- and δ18O- values showed a very consistent initial ∼3 ‰–4 ‰ decrease (from −26 ‰ to −30 ‰ for δ15N and from ‰ to 0 ‰ for δ18O; Fig. 4a, b). After 5 d, the δ15N values started to increase again with decreasing concentrations, reaching final values of ‰ (Fig. 4a), whereas the concomitant increase in the δ18O- was much smaller (<1 ‰; Fig. 4b). The same pattern was observed for all pH levels. In mineral-only experiments, isotope trends were quite different. In combination with far less consumption of , the δ15N- values decreased throughout the entire abiotic experiment (Fig. 4c). In contrast, the δ18O- first dropped by 2 ‰, reaching a clear minimum of ∼0.5 ‰ to −0.5 ‰, before rapidly increasing again. Over the remaining 25 d, the δ18O- slowly decreased, reaching final values of ∼1 ‰ (Fig. 4d) – similar to that of the mineral and DB treatment.
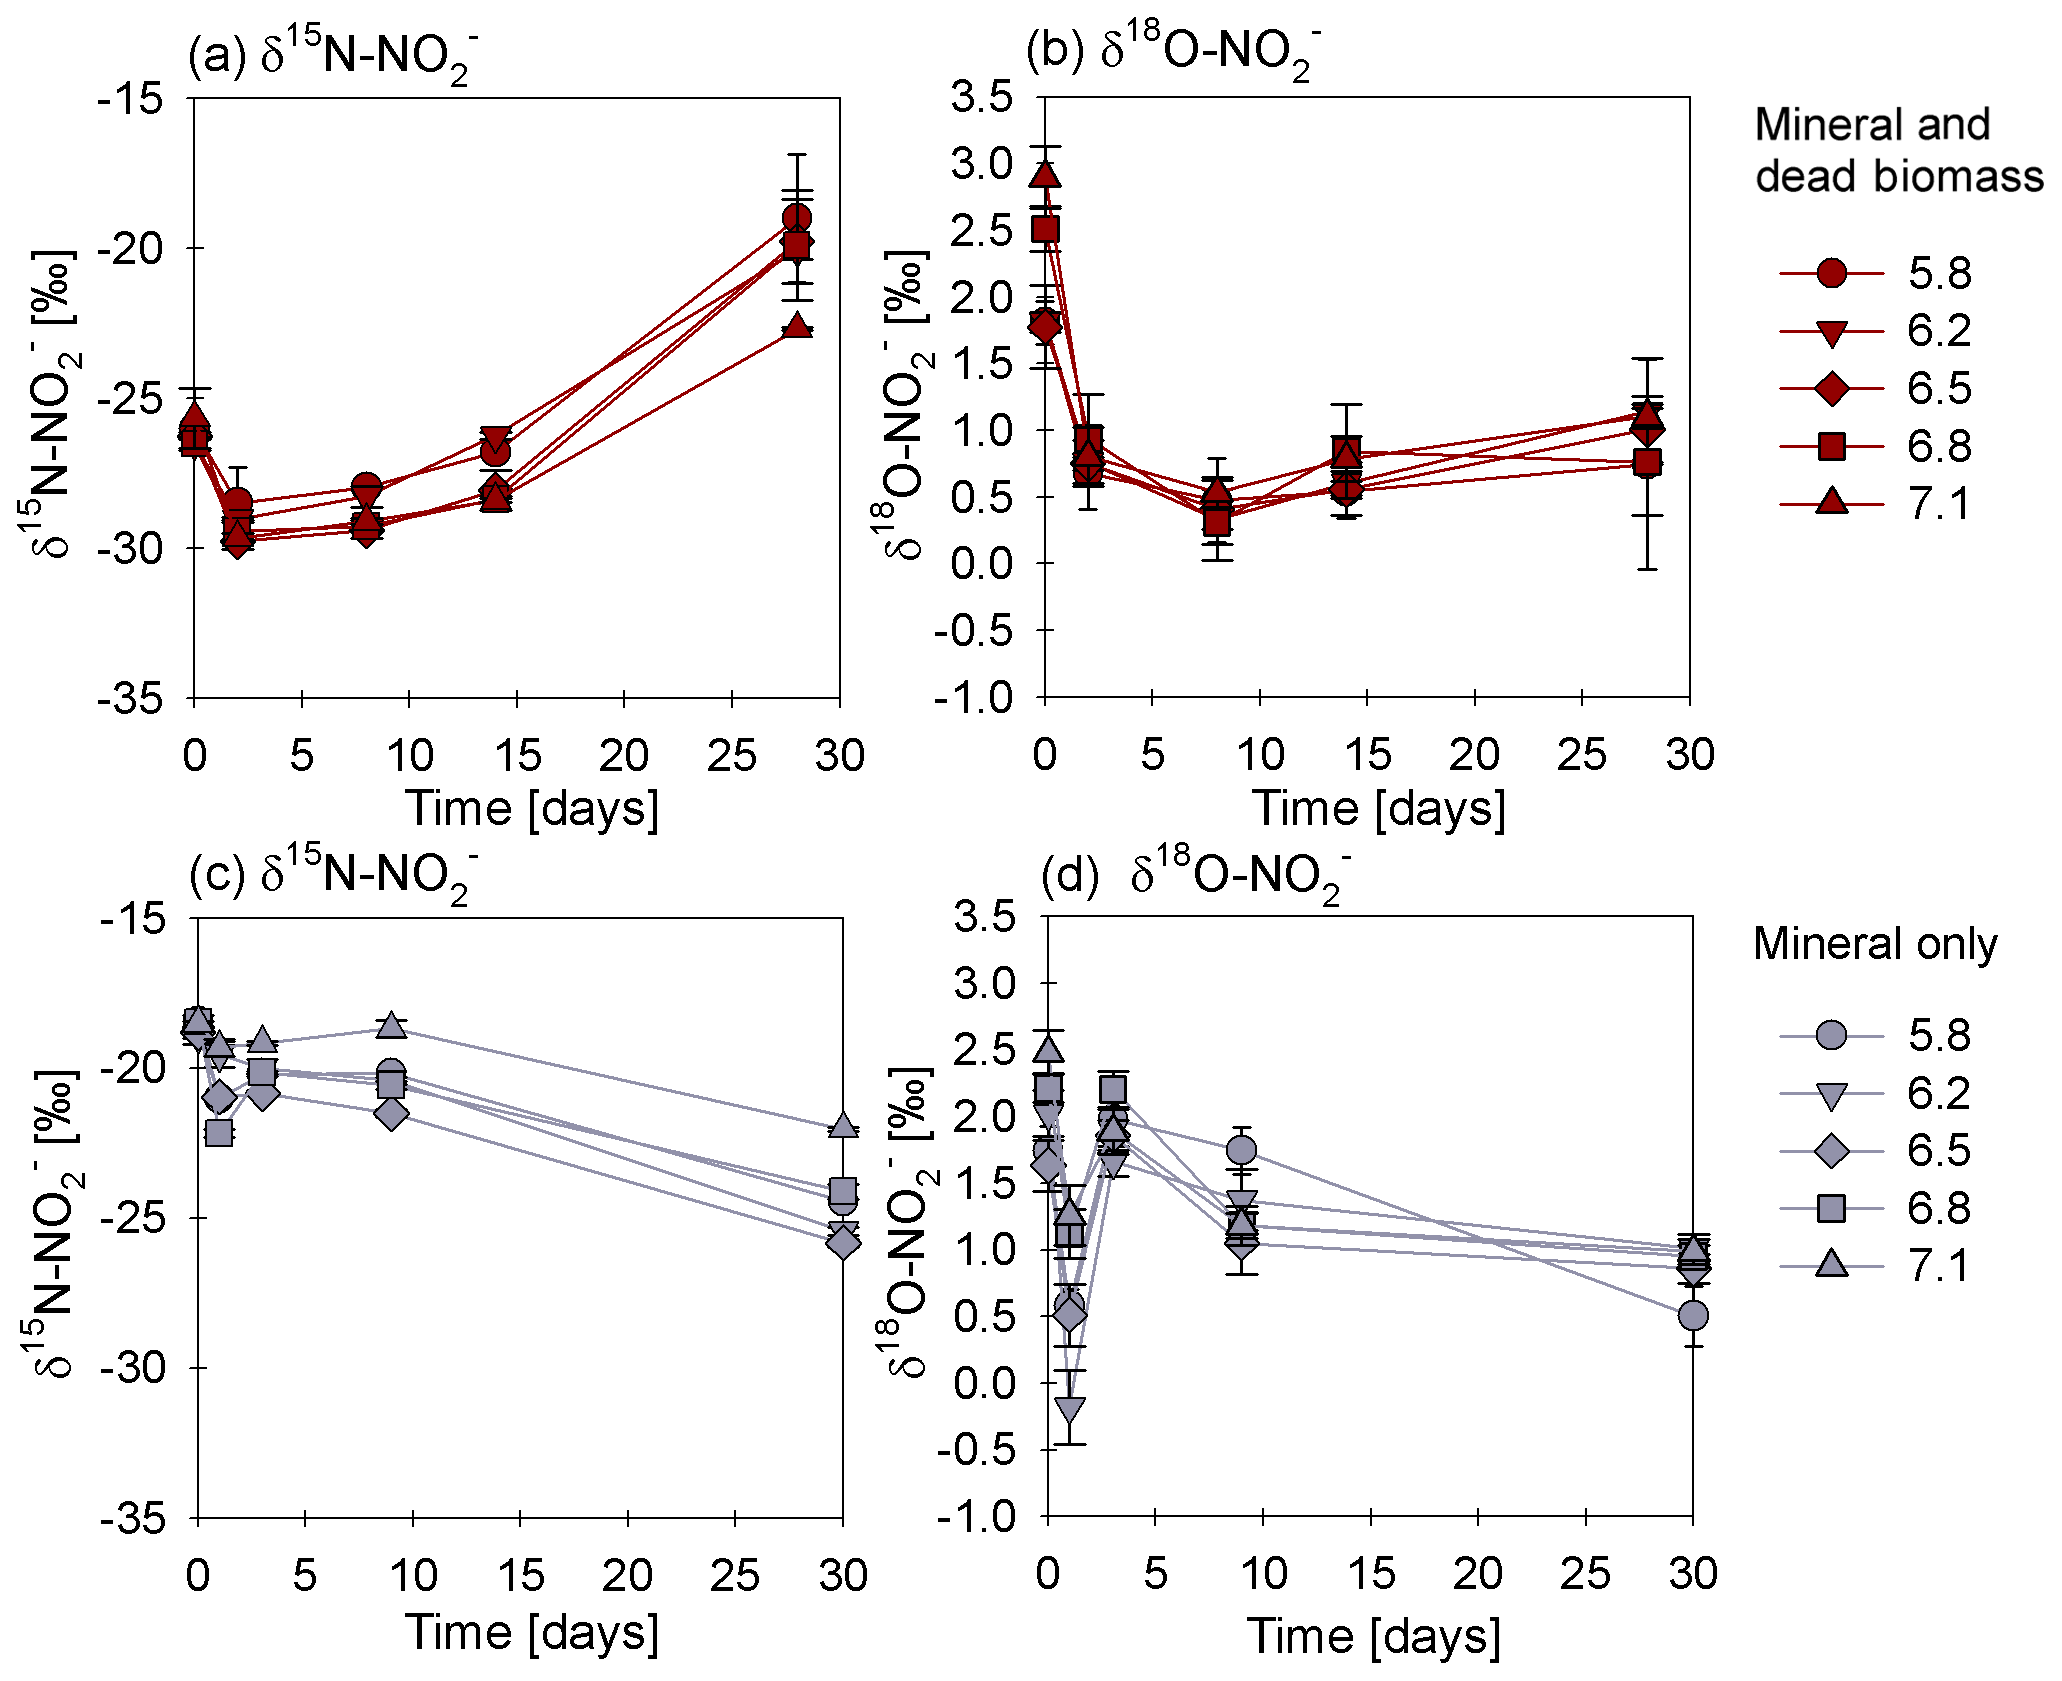
Figure 4δ15N (a, c) and δ18O (b, d) values for measured in the mineral and dead biomass amended (red) and the mineral-only (grey) set-ups over time and at different pH levels. The standard error calculated from biological replicates (n=3) is represented by the error bars.
In order to estimate the net N and O isotope fractionation for putative reduction (in the DB-amended experiments, where we observed a clear decrease in ), we plotted the and δ18O values against the natural logarithm of the concentration of the residual (Rayleigh plot), where the slope of the regression line approximates the N and O isotope effects respectively (Mariotti et al., 1981). At least after the initial period, when the δ15N markedly increased with decreasing concentrations, the N isotope data are more or less consistent with Rayleigh isotope fractionation kinetics. The slope of the regression line suggests an average N isotope effect of −10.4 ‰ (Fig. 5a). No N isotope effect could be calculated for the mineral-only set-up, but the observed δ15N trend suggest a small inverse N isotope fractionation (Fig. 4c). Similarly, trends in δ18O for the DB experiments are not as obviously governed by normal Rayleigh fractionation dynamics, at least not during the initial period, when the δ18O decreased despite decreasing concentrations. Considering the δ18O values only after 2 d of incubation, the Rayleigh plot revealed an average O isotope enrichment factor of −0.5 ‰ (Fig. 5b), which was much lower than for N. Similar to N, O isotope Rayleigh plots for the mineral-only experiments (Fig. S5) did not exhibit coherent trends, as the fractional depletion was minor and inconsistent (mostly less than 10 %). Again, the observed δ18O minimum at Day 2 of the abiotic incubations suggests that processes other than normal kinetic fractionation during reduction were at work, which cannot be described with the Rayleigh model. If at all, the decreasing δ18O values after Day 5 in the mineral-only experiments, accompanying the subtle decrease in concentration in at least some of the treatments, suggest a small apparent inverse O isotope effect associated with the net consumption of . Despite the different δ18O dynamics during the course of the experiment, the final δ18O of the residual nitrite was very similar in both experimental set-ups, and was independent of the pH.
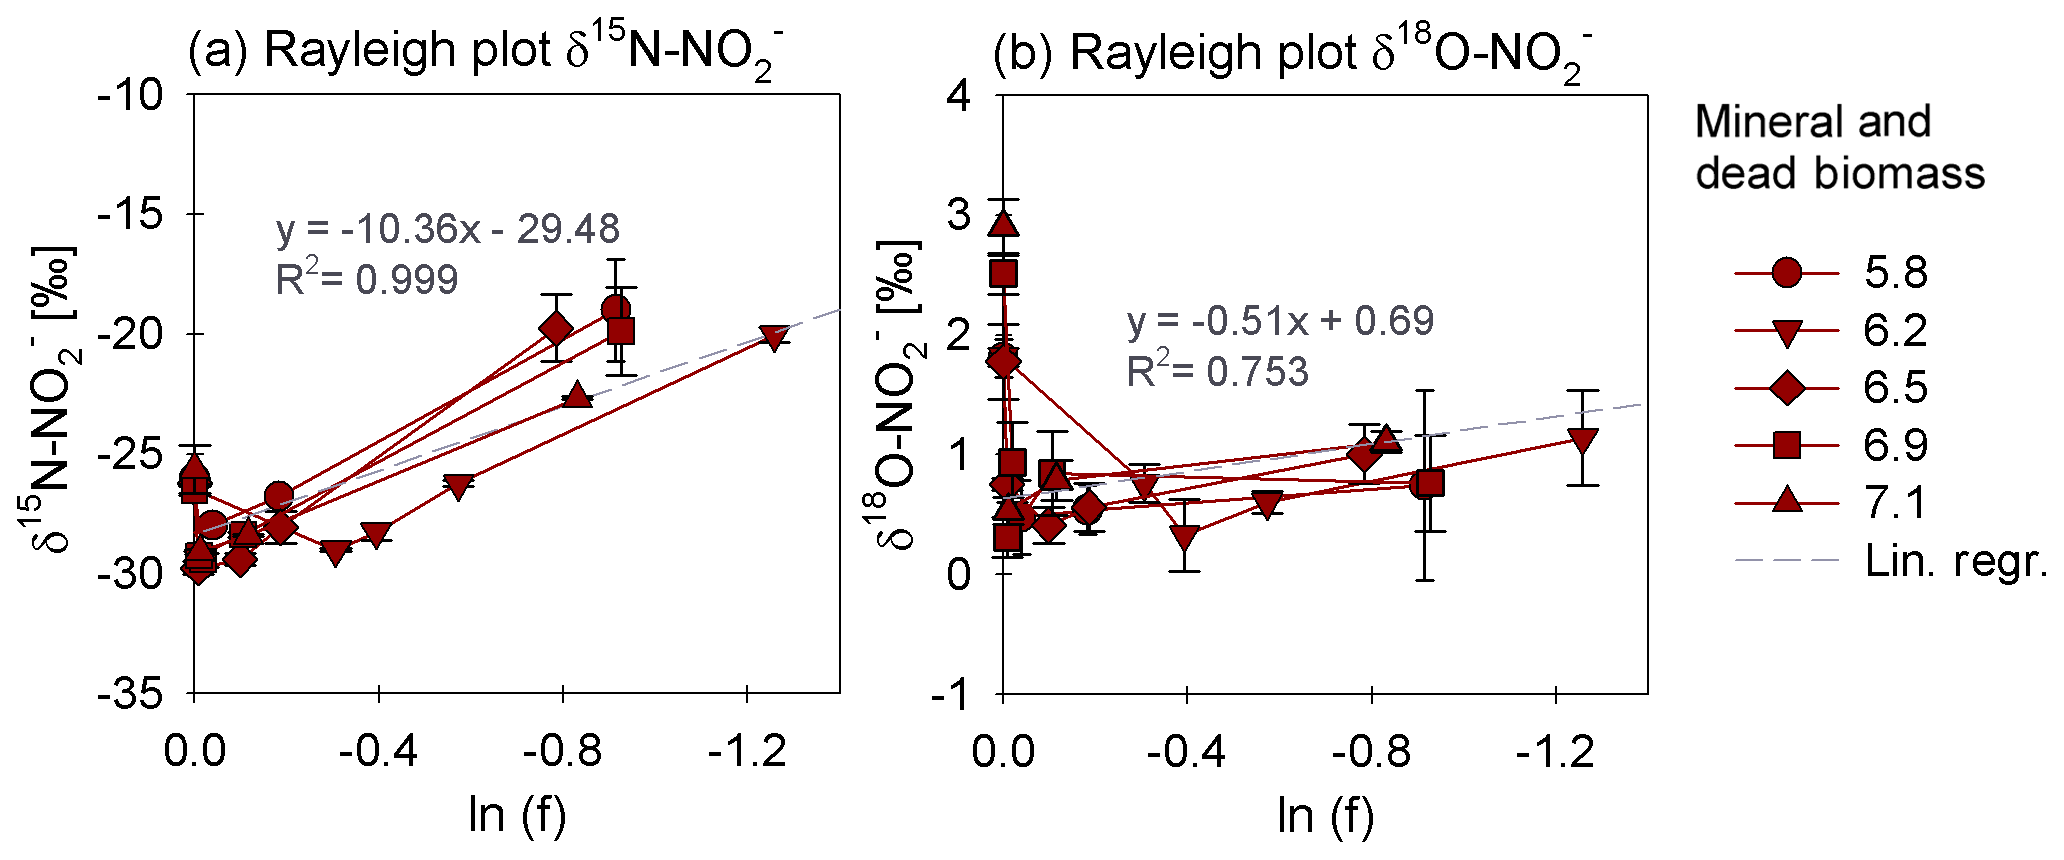
Figure 5Rayleigh plots for δ15N (a) and δ18O (b) values measured for the mineral and dead biomass amended set-ups over the natural logarithm (ln) of the substrate fraction remaining at different pH levels. The average linear regression line was calculated starting with the lowest delta values (after the initial decrease in both δ15N and δ18O during the initial experimental phase). The equations and R2 values are given in grey. The standard error calculated from biological replicates (n=3) is represented by the error bars.
We also investigated the N2O isotope dynamics during mineral-only and mineral and DB incubations. Site preference (SP) and δ15Nbulk of the N2O produced in both experimental set-ups were plotted over time (Fig. 6a, b) and show almost no variation during the period of the experiment. Moreover, the majority of values obtained in both set-ups indicate that neither pH nor the amendment of DB seems to have had any influence on the isotopic composition of the N2O produced (Fig. 6b vs. d). Over the course of the experiment, δ15Nbulk N2O values were around ‰. SP was relatively low, ranging roughly between −4 ‰ and a maximum of +14 ‰ (Fig. 6a, c), without any significant temporal change.

Figure 6Site preference (SP; a, c) and δ15Nbulk (b, d) values of N2O produced in mineral and dead biomass amended (red) and mineral-only (grey) experiments. For a pH of 6.5, the final SP value (a) is missing due to analytical problems (overly large sample peak areas). The standard error calculated from biological replicates (n=3 or 2) is represented by the error bars.
Rayleigh diagrams, in which δ15Nα, δ15Nbulk, and the SP of the N2O were plotted against the concentrations of the reactant () remaining (Fig. S6), confirm the similar N2O isotope dynamics in the DB vs. the mineral-only set-ups, despite the differential degree of reduction (only minor in the mineral-only experiment, with f always greater 0.9) and the different N and O isotope dynamics. Similarly, the dual N2O δ18O vs. δ15Nbulk signatures (with the exception of two data points; Fig. S7) were almost equivalent in both set-ups, implying that, although modes of reduction clearly differ, a similar mechanism of nitrite-reduction-associated N2O production exists in both set-ups. The N and O isotopic results are summarized in Table 3 (see Sect. 4.4).
4.1 General evaluation of the abiotic reaction systematics
Overall, the abiotic reaction between and Fe(II), heterogeneous or homogenous, has been considered thermodynamically favourable and a major contributor to the global N2O budget (e.g. Jones et al., 2015; Otte et al., 2019). Previous studies on abiotic reduction with Fe(II) have usually been performed in the presence of rather high concentrations (>2 mM) of and/or Fe(II), without taking into account that chemodenitrification is in fact considered to be highly concentration dependent (Van Cleemput and Samater, 1995). In addition, reaction dynamics have often been tested under variable conditions, including the presence of different Fe(II) ∕ Fe(III) minerals, sediments, organic materials, and/or bacterial cells (Chen et al., 2018; Grabb et al., 2017; Otte et al., 2019). Whether indeed acts as a direct oxidant of Fe(II) at circumneutral pH or whether the reaction requires catalysis is still a matter of debate (Kampschreur et al., 2011; Sorensen and Thorling, 1991).
Integrating concentrations that are pertinent to our experiments, we constructed a Pourbaix diagram (e.g. Delahay et al., 1950; Minguzzi et al., 2012), which is shown in Fig. 7. Based on these (simplified) thermodynamic calculations, the abiotic reaction solely driven by the reaction of and aqueous Fe2+ at a pH range from 5 to 7 is not supported. Under our experimental conditions, Fe2+ is predicted to be oxidized by NO rather than . Considering Fig. 7, an accumulation of NO at micromolar or even millimolar concentrations would result in a downward shift of the line. Therefore, an accumulation of NO would only lower the reactivity between and Fe2+, which implies that is not oxidizing Fe2+. Again, this also implies that the reactivity between and Fe2+ is only enhanced if NO concentrations are rather low (picomolar range). In order to avoid NO accumulation and, thus, enhance the abiotic reaction between and Fe2+, NO would need to react further (either with Fe2+ or with a plethora of other species, organic acids, gases, and on surfaces among others). This would induce a reaction cascade, resulting in the constant reduction of and NO and, in turn, in higher N2O concentrations. In contrast, if NO does accumulate as previously reported, the reaction between and Fe2+ would be suppressed and only NO could be reduced further to N2O, which is a reaction that, of course, also depends on the gas equilibration dynamics occurring with the headspace of the system. Nevertheless, considering all of these aspects, including the fact that the N2O produced only corresponds to a minor fraction of the initial reduced, NO acting as main oxidizing agent seems more likely. The reaction mechanisms in this system are, however, complex, and we note that this simplified thermodynamic analysis neglects catalytic effects that are possibly induced by reactive surfaces. The complexity of this system is further indicated by the fact that, according to the Pourbaix diagram, a pH response towards N2O accumulation would be expected; however, no such response has been reported to date. Furthermore, testing various pH levels did not reveal an obvious pH effect on the reaction dynamics. Changes in pH will most certainly affect interactions between species such as HNO, NO2, and N2O and, thus, could impact the reaction dynamics. For a more detailed understanding of this redox system, it appears that the reactants and intermediates involved and, thus, the specific reaction kinetics would need to be determined. Unfortunately, quantification of these intermediates is hampered by their high reactivity, transient nature, and lack of detection techniques that can be applied in batch culture experiments. As low amounts (e.g. picomoles) of NO suffice to impact reaction dynamics and, thus, stimulate the reaction between and Fe2+, NO quantification could be crucial to assess the environmental controls on Fe(II)-coupled chemodenitrification. In laboratory biological denitrification experiments, the accumulation of NO has been reported (Goretski and Hollocher, 1988; Zumft, 1997) and has been shown to even account for up to 40 % of the initial amended (Baumgärtner and Conrad, 1992; Choi et al., 2006; Kampschreur et al., 2011; Ye et al., 1994; Zumft, 1997). Hence, Kampschreur et al. (2011) concluded that chemodenitrification is not necessarily solely caused by a single-step reaction, and the study proposed that the oxidation of Fe2+ is rather caused by a two-step mechanism. They observed an immediate formation and accumulation of NO after was added to Fe2+, and N2O formation was detected as soon as a considerable fraction of the Fe2+ was oxidized. Although NO and other possible intermediate, e.g. NO2(g), concentrations might not play a major role with regard to mass balance considerations, their possible impact on the overall reaction systematics as well as the isotopic fractionation remains unclear.
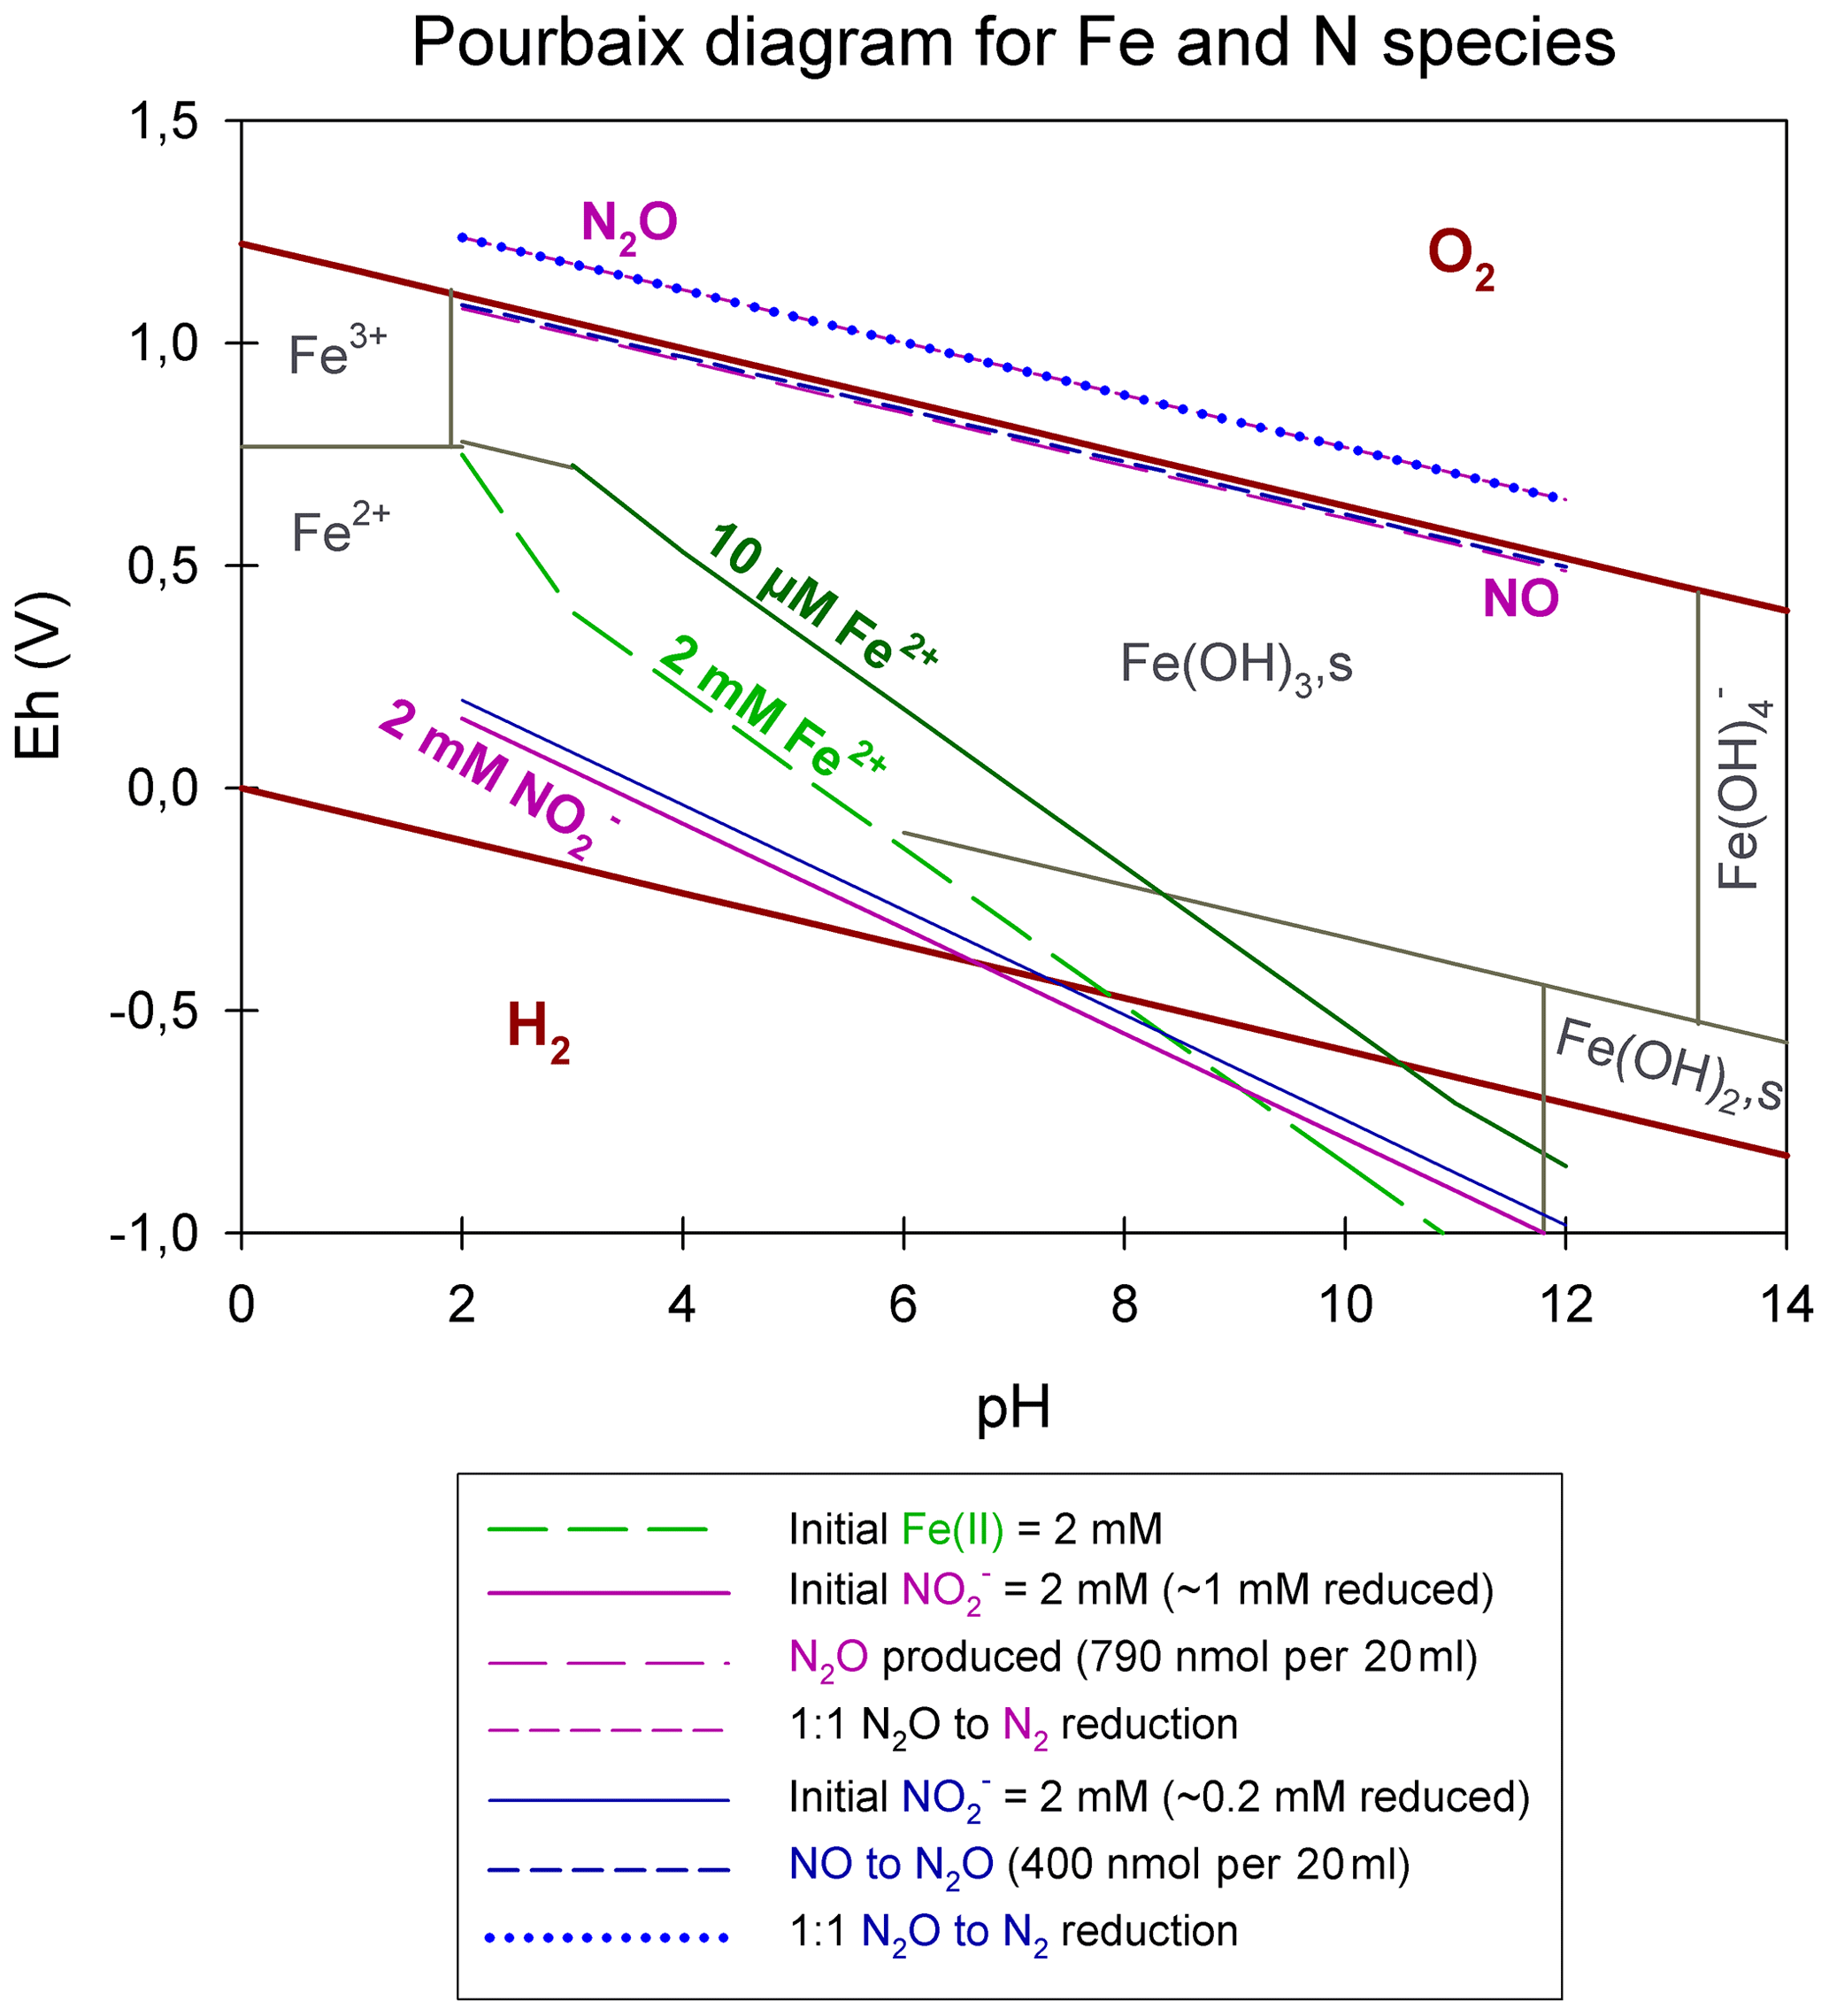
Figure 7Pourbaix diagram depicting an Fe- and N-species-based system. Overall calculations are based on the Nernst equation using values taken from the literature (for the equation and values see Table S1). Green lines represent Fe2+ concentrations; pink lines represent reduction experiments, starting with 2 mM , resulting in the reduction of 1 mM , the production of 790 nmol per 20 mL N2O, and a 1:1 transformation of N2O to N2; and blue lines represent reduction experiments, starting with 2 mM , resulting in the reduction of 0.2 mM , the production of 790 nmol per 20 mL N2O, and a 1:1 transformation of N2O to N2. Reduction and production values were taken from our results presented in Sect. 3.1.
4.2 Surface catalysis of chemodenitrification
Previous studies have shown that the initial presence of either Fe(III)(oxyhydr)oxides (Coby and Picardal, 2005; Klueglein and Kappler, 2013; Sorensen and Thorling, 1991) or amorphous Fe(II) minerals (Van Cleemput and Samater, 1995) can stimulate the abiotic reaction between and Fe2+. As summarized in Table 1, under mineral-only conditions reduction was significantly lower (0.004±0.003 mmol L−1 d−1) than in identical experiments containing DB, which substantially enhanced reduction (0.053±0.013 mmol L−1 d−1). The catalytic effect of Fe minerals on the abiotic reduction, which has been demonstrated previously, seems to be amplified in the presence of DB. Relative to reduction rates, overall final N2O yields per mole reduced tended to be higher in the mineral-only set-ups. However, considering the initial concentrations, only minor amounts of N2O were produced in both set-ups, raising questions about the contribution of chemodenitrification to global N2O emissions discussed by others (Grabb et al., 2017; Jones et al., 2015; Otte et al., 2019; Zhu-Barker et al., 2015). For example, in comparison to the N2O yields in experiments where chemodenitrification was catalysed by green rust (up to 31 %; Grabb et al., 2017), the amount of N2O produced in our set-ups is far lower (<5 % of the initial ).
Fe-bearing minerals are known for their high reactivity, their ability to complex ligands (metals, humics) and phosphates, and their surface protonation capacity via the sorption of OH− groups (Elsner et al., 2004; Stumm and Sulzberger, 1992). Surface catalytic effects may include direct and indirect sorption-induced catalysis. In the environment, pH has been shown to have a strong influence on these sorption capacities of Fe minerals in general (Fowle and Konhauser, 2011). Considering the point of zero charge (PZC) of vivianite, which, at 3.3, is below the lowest tested pH in our experiments, the mineral surface is positively charged under our experimental conditions (Luna-Zaragoza et al., 2009). Hence, the pH range tested here will not affect the surface charge, and sorption onto mineral surfaces and corresponding heterogeneous reactions are possible. In contrast, cell surfaces are considered to be negatively charged (Wilson et al., 2001) and might, therefore, induce different effects than mineral surfaces. The charge of the cell surface most likely remained negative even after autoclaving (see e.g. Halder et al., 2015). Our results imply that the systematics of chemodenitrification are strongly dependent on the surface provided and that, depending on the availability and quality of catalytic surfaces, Fe-coupled chemodenitrification may be a single-step reaction (between and Fe) or may occur in multiple steps (reaction between Fe and NO2 as well as between Fe and NO). As a consequence, the nature of surface catalysis would likely have a strong impact on the N2O yield per mole reduced to NO. As NO has been demonstrated to have a strong affinity towards Fe2+ and Fe3+ centres resulting in the formation of Fex+(NO)n nitrosyls and, thus, triggering an enhancement of the N2O decomposition rate (e.g. Rivallan et al., 2009), the extent to which, and why, the quality of the catalytic surfaces plays a role remains unclear. Particularly in the presence of organics and/or dead bacterial cells, which are known to have a high affinity to bind metal ions (e.g. Ni2+, Cu2+, or Zn2+), either directly or by forming surface complexes with hydroxyl groups (Fowle and Konhauser, 2011), a surface-catalysis-induced reaction can be expected. Besides acting as a catalyst via a reactive surface, the dead biomass might also have directly triggered the reaction. For example, non-enzymatic NO formation was studied and modelled by Zweier et al. (1999), suggesting that abiotic disproportionation and, thus, NO formation at circumneutral pH in organic tissue is still possible at concentrations between 100 and 1000 µM (Zweier et al., 1999). Furthermore, autoclaving might have ruptured cell walls and released organic compounds. In the presence of phenolic compounds, humic substances, and other organic compounds, has been shown to form NO via self-decomposition (Nelson and Bremner, 1969; Stevenson et al., 1970; Tiso and Schechter, 2015). Whether this may also have been the case in our experiments remains unclear, as we did not conduct experiments containing only DB and . Another possible consideration is the presence of extracellular polymeric substances (EPS), which should also be tested in future studies. Liu et al. (2018) investigated nitrate-dependent Fe(II) oxidation with Acidovorax sp. strain BoFeN1, showing that c-cytochromes were present in EPS secreted and could indeed act as electron shuttling agents involved in electron transfer, thereby supporting chemolithotrophic growth. As S. oneidensis (our model organisms used as DB supply) is known to produce large amounts of EPS, harbouring c-cytochromes (Dai et al., 2016; Liu et al., 2012; White et al., 2016), a potential impact of EPS on the reaction between and Fe(II) needs to be considered. However, possible cytochromes present in the EPS most likely lost their activity due to protein denaturation during autoclaving (Liu and Konermann, 2009; Tanford, 1970). Nevertheless, EPS is still present and can act as a catalysing agent to the abiotic reaction mechanism (Klueglein et al., 2014; Nordhoff et al., 2017).
Fe(II)total oxidation via has also been observed in the mineral-only set-ups but to a lower extent. Hence, the vivianite mineral surfaces themselves seem to catalyse the abiotic reaction between and (the stimulation of Fe-dependent nitrite reduction may also be attributed, in part, to vivianite dissolution providing ample Fe(II) substrate). Previous studies have reported on mineral-enhanced chemodenitrification (Dhakal et al., 2013; Grabb et al., 2017; Klueglein and Kappler, 2013; Rakshit et al., 2008), and the catalytic effect may be due to adsorption onto the minerals' surface possibly facilitating a direct electron transfer. Similar findings have previously been reported on Fe(II) oxidation promoted by electron transfer during adsorption onto an Fe(III) minerals' surface (Gorski and Scherer, 2011; Piasecki et al., 2019). OH− adsorption is probably enabled by the minerals' positive surface charge at pH levels >6, resulting in a limited reactive surface availability. Complexation of dissolved Fe2+, which is provided by mineral dissolution, by OH− groups would, thus, result in a lower overall reduction rate compared with the DB-amended set-ups. Nevertheless, the NO formed by the initial reduction could still proceed at elevated Fe2+ levels until both dissolved and adsorbed Fe(II) is quantitatively oxidized to surface-bound Fe(III) (Kampschreur et al., 2011). This would ultimately lead to similar Fe(II)total oxidation and N2O production (and, in turn, higher N2O yields) as in the DB-amended experiment and, therefore, explain the similar results.
4.3 Mineral alteration during Fe-coupled chemodenitrification
We used 57Fe Mössbauer spectroscopy in order to determine, whether the catalytic effects that enhanced chemodenitrification with Fe2+ also modulated mineral formation. In both set-ups, the addition of Fe(II)Cl2 to the 22 mM bicarbonate-buffered medium led to the formation of vivianite, an Fe(II)-phosphate. Shortly after the addition of , the mineral phase in both set-ups was dominated by Fe(II), but a small fraction of Fe(III) was also present. Initial fractions of Fe(III) were similar in both the mineral-only and DB-amended experiments (9.9 % and 7.4 % respectively) and, if not an artefact of Mössbauer sample handling, might have stimulated Fe(II) adsorption and oxidation (Gorski and Scherer, 2011; Piasecki et al., 2019). The reduction of was accompanied by a marked increase in Fe(III), likely in the form of short-range ordered ferrihydrite or lepidocrocite. Thus, the Fe(III) phase detected at Day 0 most likely formed immediately after addition. This is supported by prior studies that have demonstrated the initiation of Fe(II) oxidation with within a short period of time (Jamieson et al., 2018; Jones et al., 2015). At the end of the DB experiment at a pH of 6.89, oxidized Fe(III) (most likely in the form of poorly ordered ferrihydrite) contributed 48.7 % to the total Fe phases, with vivianite accounting for the remaining spectral area. Unfortunately, we are unable to compare the results of the DB-amended precipitates at the end of the experiment with the mineral-only set-up, as the sample processing failed. Minerals obtained from the enrichment culture KS were mostly vivianite and ferrihydrite, which is attributed to the fact that a high-phosphate medium is used for the cultivation of the KS culture (Nordhoff et al., 2017). In the abiotic experiments (10 mM Fe(II) and 10 mM ) presented by Jones et al. (2015), the formation of lepidocrocite, goethite, and two-line ferrihydrite were observed after 6 to 48 h. In the experiments presented here, besides a short-range ordered Fe(III) phase, which was likely ferrihydrite, no other mineral phases could be identified after 28 d.
Iron analysis also indicates that the oxidation of the Fe(II)total went to completion at a pH of 5.8, whereas 52.3 % of the Fe(II)total remained at the end of the incubation experiment at a pH of 6.8, resulting in the formation of a poorly ordered ferrihydrite. Unfortunately, we did not measure the ζ potential of the starting solutions, which would probably help to explain the differences detected. We note that, although 57Fe Mössbauer spectroscopy was used to measure the Fe(II)∕Fe(III) in the precipitates, the reported Fe(II)total concentrations reflect the total Fe(II), i.e. of both the dissolved pellet (structurally bound or adsorbed) and the aqueous Fe2+ in the supernatant measured by ferrozine. The results obtained by Mössbauer analysis (50 % Fe(II) remaining) seem to contradict the ferrozine assay (<10 % remaining); see Tables 1 and 2. The presence of ferrous Fe, either as structurally bound Fe(II) or adsorbed Fe2+, does indeed play a crucial role with regard to the reaction dynamics occurring at the mineral surfaces, particularly if we assume that N-reactive species are also still present (Rivallan et al., 2009). In addition, the initially formed Fe(III) phase might also induce another feedback to the N and even the Fe cycle, as Fe(III) minerals are also highly reactive (Grabb et al., 2017; Jones et al., 2015). Mineral structure and, thus, the Fe(II) location within the lattice can influence the overall Fe accessibility, the binding site at the mineral surface, and, in turn, the overall reactivity (Cornell and Schwertmann, 2003; Luan et al., 2015; Schaefer, 2010). If the initial formation of Fe(III), however, enhanced the reaction between and Fe(II), similar results should have been observed in both set-ups, which was not the case: reduction patterns in the mineral-only experiments were much lower. Again, this also indicates that the presence of DB indeed contributed greatly to the reaction in the DB experiments. Furthermore, results obtained from Mössbauer analysis are the only results supporting a pH-dependent effect: all vivianite was fully transformed into a short-range ordered Fe(III) phase at a pH of 5.78 and in the presence of DB, whereas vivianite remained a major component at a pH of 6.89. This presence of vivianite also indicates that no further Fe(II) oxidation occurred even though reduction was incomplete. The incomplete reduction of in turn suggests that further Fe(II) oxidation was limited due to blocked or deactivated reaction sites on mineral surfaces. Also, considering that the initial concentrations were higher but the overall reaction dynamics were quite similar to the other reaction conditions at a pH of 5.8 and in the presence of DB, the concentration dependency of the reaction between and Fe(II) is again supported.
4.4 Nitrite and N2O N and O isotope dynamics during chemodenitrification
In the presence of vivianite alone, a decrease in δ15N- of ∼3 ‰ occurred in parallel with initially decreasing concentrations. Initial δ18O- values also reflect this drop of 3 ‰ during the first 3 d but level off and stabilize at 1 ‰ after 9 d. The initial decrease in both δ15N and δ18O of suggest apparent inverse isotope effects, which to the best of our knowledge have never been observed during chemodenitrification and have only been reported for enzymatic oxidation (Casciotti, 2009). As biological oxidation can be ruled out (no produced and no microbes), the decrease in δ15N-, although subtle, could indicate that heavy isotopes are incorporated in the products formed (i.e. NO and N2O), at least at the beginning of the incubation period. Normally, the heavier isotopes build compounds with molecules of higher stability (Elsner, 2010; Fry, 2006; Ostrom and Ostrom, 2011). This is particularly true for the formation of some minerals or highly stable molecules that are formed under mineral-only conditions, where processes can reach an isotopic equilibrium (He et al., 2016a; Hunkeler and Elsner, 2009; Li et al., 2011; Ostrom and Ostrom, 2011). However, in the system presented here, N incorporation into mineral phases can be excluded; hence, another process must favour the heavy N atoms. As this initial drop in δ15N was also observed in the DB-amended experiments, a possible explanation might be that the isotope values here reflect the sorption or complexation mechanism of onto the reactive surfaces. In contrast δ18O- values did not change greatly, after the initial decrease, with decreasing concentrations. The stabilization of the δ18O- towards the end of the experiment most likely reflects the oxygen isotope equilibration between δ18O- and the δ18O of the water in the medium. Temporal δ18O- dynamics did not change greatly between the different pH treatments, and the final δ18O- ranged between 0.5 ‰ and 1 ‰ in all cases. The kinetics of abiotic O-atom exchange is a function of temperature and pH. At near-neutral pH, at room temperature, one can expect to be fully equilibrated after 2–3 d (Casciotti et al., 2007). At higher pH, the first-order rate constants for the equilibration with water are lower (Buchwald and Casciotti, 2013), but equilibrium conditions should have been reached well within the incubation period. Indeed, the final δ18O- value was consistent with an equilibrium O isotope effect between and H2O with a δ18O of ‰ (Buchwald and Casciotti, 2013). With regard to δ15N- values of the DB-amended experiments, a similar behaviour is found within the first 3 d (i.e. decrease in δ15N), followed by a clear increase in δ15N- of ∼10 ‰. While it is difficult to explain the initial decrease in δ15N-, which is a feature that was not observed in other chemodenitrification experiments (i.e. Grabb et al., 2017; Jones et al., 2015), the subsequent increase in δ15N can be attributed to normal isotopic fractionation associated with chemodenitrification and an N isotope effect (−9 ‰) that is consistent with those previously reported on Rayleigh-type N and O isotope kinetics during chemodenitrification with Fe(III)-bearing minerals such as nontronite and green rust (Grabb et al., 2017). In contrast, δ18O- values initially decrease, as in the abiotic experiment, but then level off faster reaching final values of ∼1 ‰, which is again most likely explained by O-atom isotope exchange pulling the δ18O- values towards the O isotope equilibrium value. This value is given by , whereas the latter is defined as the equilibrium isotope effect between and H2O and has been shown to yield values of roughly +13 ‰ (Casciotti et al., 2007). Overall, it seems that the non-linear behaviour of the in the O isotope Rayleigh plot is most likely due to the combined effects of kinetic O isotope fractionation during reduction, and O-atom exchange between and H2O.
N and O isotope trends observed under the DB-amended conditions (in which a large portion of the pool was consumed) somewhat contradict prior reports of chemodenitrification that found a clear increase in both δ15N and δ18O-, with N isotope enrichment factors for reduction of between −12.9 ‰ and −18.1 ‰ and an O isotope effect of −9.8 ‰ (Jones et al., 2015). Consistent with our data, however, they also observed that, at least in abiotic experiments where consumption is rather sluggish due to Fe2+ limitation (as a result of either oxidation or simply occlusion), O isotope exchange isotope effects mask the effects of kinetic O isotope fractionation. While we cannot say at this point what exactly governs the combined N vs. O isotope trends in the two different experimental conditions, we observed that the two processes, the water isotope equilibrium and the kinetic isotope effect (KIE), competing with each other leads to different net dual isotope effects. Our data cannot resolve whether these observations reflect fundamental differences or simply changes in the relative proportion of the competing processes. Nevertheless, our observations may still be diagnostic for chemodenitrification catalysed by a mineral surface and for Fe-coupled chemodenitrification that involves catalytic effects by dead bacterial cells. The mineral catalyst evidently plays an important role with regard to chemodenitrification kinetics, reaction conditions, surface complexation or contact time between the substrate and the mineral phase (Samarkin et al., 2010), and, in turn, the combined kinetic and equilibrium N and O isotope effects.
The Δ15N values (Δ15N = δ15Nnitrite−δ15N2Obulk) presented in Table 3 were obtained by subtracting the average δ15Nbulk value of N2O (abiotic ‰; dead biomass ‰) across all pH levels and throughout the experiment from the average of the initial δ15Nnitrite value. These values can provide insight into reaction kinetics between , NO, and N2O (Jones et al., 2015). In both set-ups there is an offset between the and N2O δ15N, which is clearly higher than what would be expected based on the reduction isotope effect of <10 ‰. Following the argumentation of Jones et al. (2015), who reported a similar N isotopic offset between and N2O of 27.0±4.5 ‰, this could be indicative of a heavy N accumulating in a forming NO pool, whereas 14N is preferentially reacting to N2O or N2 respectively. This might even be supported by the rather low δ15Nbulk values detected for N2O in both set-ups.
Table 3Comparison of the isotope values obtained during the dead biomass vs. the abiotic experiments. t0 values represent means calculated by summarizing the results across all pH levels ± standard error. δ15N and δ18O values were calculated using ; an overall increase from the initial value is marked with “↑”, and a decrease from the initial value is marked with “↓”. The calculated isotope fractionation factor (ε) is based on the slope between the lowest initial value (here at t1) and tend for all pH levels. Δ15N (=δ15Nnitrite−δ15N2Obulk) was calculated for the end of the experiment.
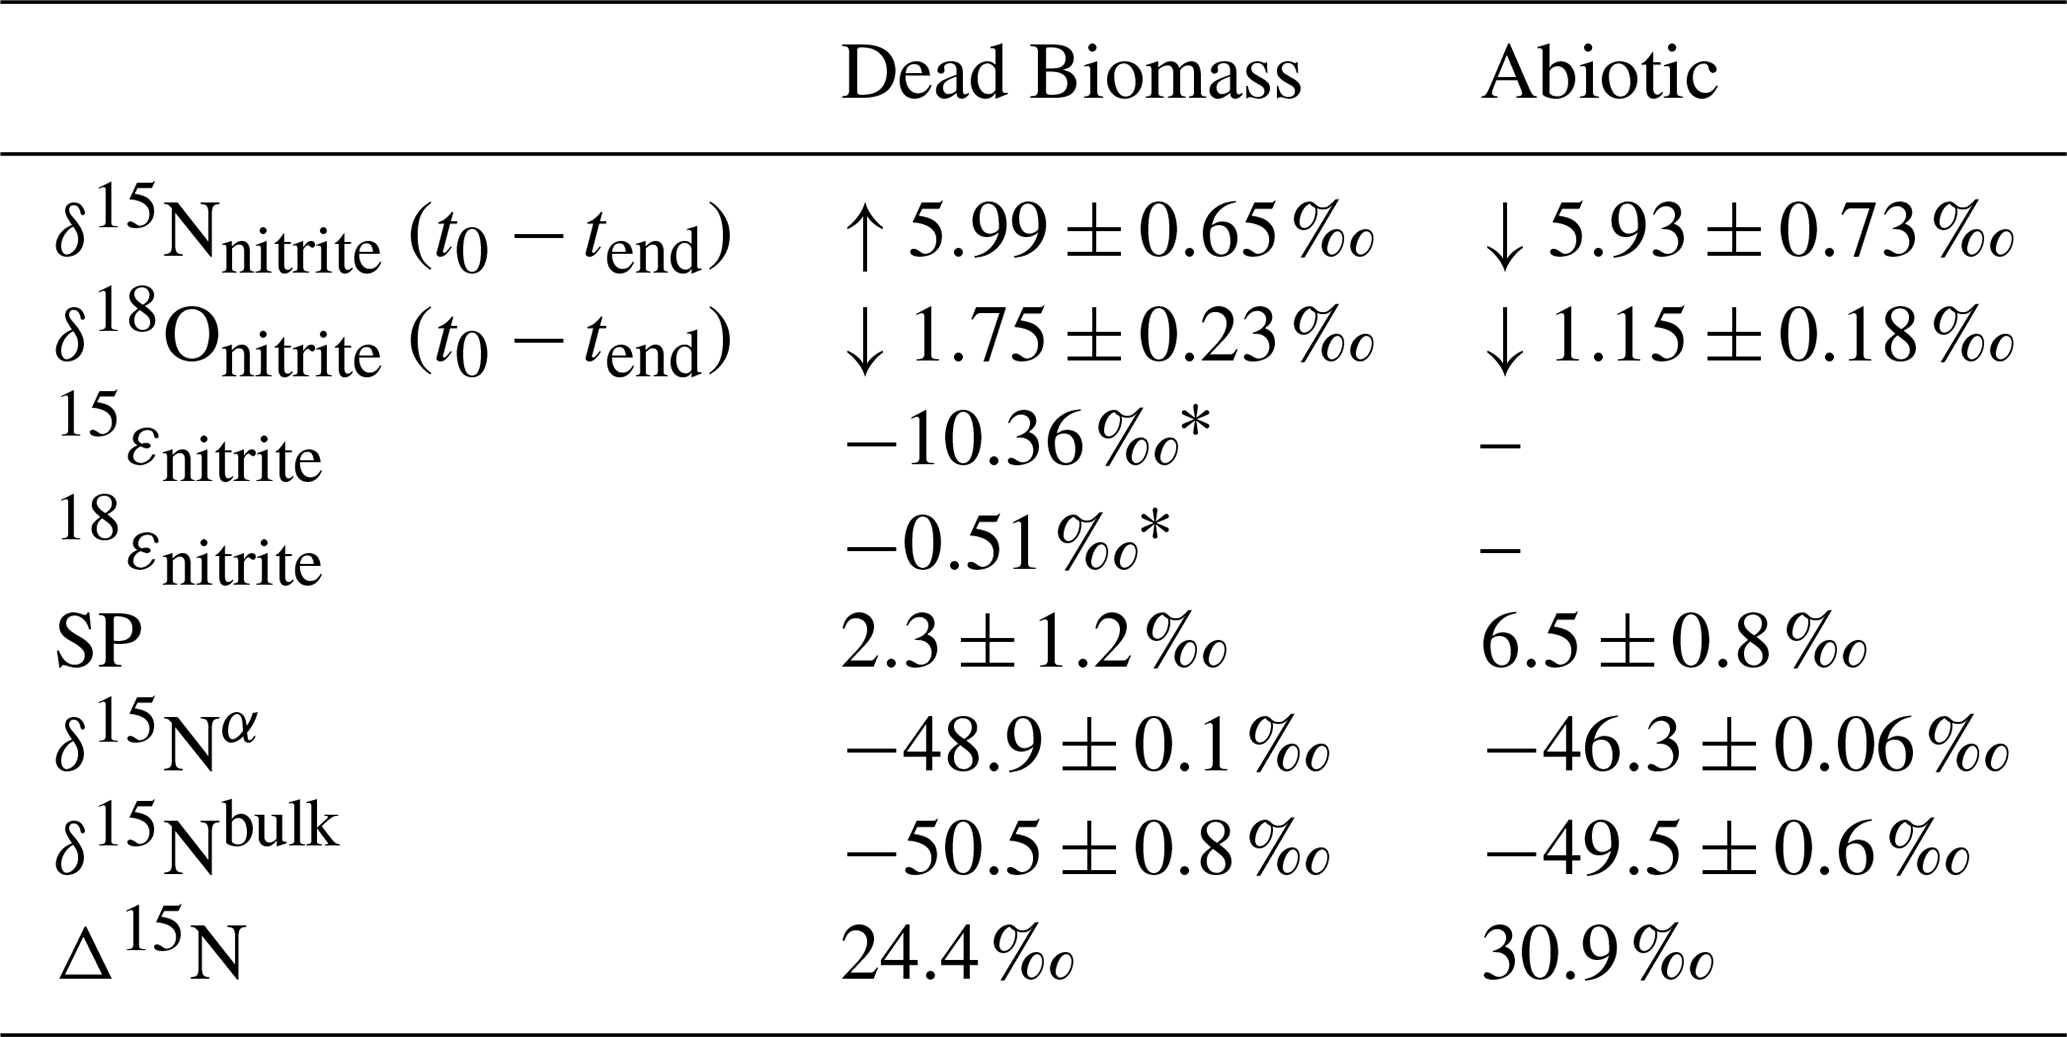
* n=4 (t1 to tend). Concentrations in the abiotic experiment fluctuate and show only a minor decrease; hence, 15ε and 18ε could not be calculated.
While our results clearly showed that N2O accumulates over the course of the reaction, the additional end products present at the final stage of the experiment remains unclear. If NO accumulates (instead of following the reaction cascade further), the substrate–product relationship between the δ15N- and δ15N-N2O values that would be expected in a closed system is perturbed, leading to significantly higher Δ15N than predicted by the δ15N- trend. Hence, the calculated Δ15N of the mineral-only treatment (30.9 ‰) is slightly higher than that of the DB experiment (24.4 ‰), and would, therefore, suggest that, despite the differences in chemodenitrification kinetics (i.e. different reduction rates and extent), the NO pool formed is enriched in heavy N in both of the respective treatments. Alternatively, fractional reduction of the produced N2O to N2 may also affect the Δ15N as it would presumably increase the δ15N-N2O and, therefore, raise the low δ15N-N2O values so that they were closer to the starting δ15N- values. Abiotic decomposition of N2O to N2 in the presence of Fe-bearing zeolites has previously been investigated (Rivallan et al., 2009); however, it remains unclear if this process could also occur here. Fractional N2O reduction is also not explicitly indicated by the SP values, which would reflect an increase with N2O reduction (Ostrom et al., 2007; Winther et al., 2018). The SP values in both mineral-only and DB-amended experiments were, with some exceptions, relatively low (6.5±0.8 ‰; 2.3±1.2 ‰; Fig. 6, Table 3). In fact, SP values observed during the course of our experiments are significantly lower than SP values reported in other studies on Fe-oxide mineral-associated chemodenitrification, e.g. ∼16 ‰ (Jones et al., 2015) and 26.5 ‰ (Grabb et al., 2017), or in abiotic N2O production during the reaction of Fe and a mixture (34 ‰; Heil et al. 2016). While the variety of different SP values for chemodenitrification-derived N2O suggests different reaction conditions and catalytic effects, our SP data seem to imply that the mineral catalyst plays only a minor role with regard to the isotopic composition of the N2O produced. However, as N2O concentrations, even if minor, are increasing towards the end of the experiments, production and possible decomposition as well as ongoing sorption mechanisms might also serve as a possible explanations for these rather low SP values. N2O SP values have been used as valuable tracer for microbial N2O production (Ostrom and Ostrom, 2012). Based on pure culture studies (Ostrom et al., 2007; Winther et al., 2018; Wunderlin et al., 2013) and investigations in natural environments (Wenk et al., 2016), an SP range from −10 ‰ to 0 ‰ is considered to be characteristic for denitrification or nitrifier denitrification (Sutka et al., 2006; Toyoda et al., 2005), whereas higher values are usually attributed to nitrification or fungal denitrification (Ostrom and Ostrom, 2012; Wankel et al., 2017; Well and Flessa, 2009). The SP values reported here (0 ‰ to 14 ‰) fall well within the range of biological N2O production, explicitly denitrification and soil-derived denitrification (2.3 ‰ to 16 ‰) (Ostrom and Ostrom, 2012), rendering the separation of chemodenitrification and microbial denitrification based on N2O isotope measurements difficult, if not impossible.
In summary, the N and O isotope systematics of chemodenitrification are multifaceted, depending on the environmental conditions, the reaction partners provided, and/or the speciation of precipitated mineral phases. The systematics observed here are clearly not entirely governed by normal kinetic isotope fractionation alone, as has also been observed in previous work. Grabb et al. (2017) demonstrated that there is a relationship between the reaction rate and kinetic N and O isotope effects, with faster reaction leading to lower 15ε and 18ε. Again, changes in the expression and even in the direction of the isotope effects in the pool suggest that multiple processes, including equilibrium isotope exchange (at least with regard to the δ18O-), contribute to the net N and O isotope fractionation regulated by the experimental conditions and reaction rates. As pointed out by Grabb et al. (2017) and as supported by our comparative study with pure abiotic mineral phases and with added dead biomass, the accessibility of Fe(II) to the reaction may be a key factor regarding the degree of N and O isotope fractionation expressed, particularly if complexation limits the reactive sites of the mineral. The conditions that, at least transiently, lead to the apparent inverse N and O isotope fractionation observed here for chemodenitrification require particular attention in future work. At this point, we can only speculate about potential mechanisms, which are indicated in the conceptual illustration (Fig. 8). As chemodenitrification seems to be catalysed by reactive surfaces of Fe(II)∕Fe(III) minerals and/or organics (including cells), sorption onto these surfaces might play a crucial role in the fractionation of N and O isotopes. For example, during the catalytic hydrogenation of CO2 on Fe and Co catalysts, a subtle depletion (ca. 4 ‰) in 13CO2 at progressed conversion to methane has been explained by the precipitation of a 13C-enriched carbon intermediate (e.g. CO–graphite) on the catalyst surface (Taran et al., 2010). We are fully aware that it is difficult to compare our system with Fischer–Tropsch synthesis of methane occurring at high temperature and pressure. However, given the indirect evidence for NO accumulation in our experiments, it may well be that preferential chemisorption and complexation of “heavy” intermediate NO occurs, which may lead to transient 15N depletion in the reactant pool. Considering that the N2O concentrations measured in our experiments were comparatively low and that δ15Nbulk-N2O values did not change noticeably throughout the experiments, it is unlikely that N2O is the final product, and the formation of N2 via abiotic interactions between and NO is probably also involved (Doane, 2017; Phillips et al., 2016). Indeed, if accumulated as the final product, the δ15Nbulk-N2O value at the end of the incubation should be ‰ (according to closed-system accumulated-product Rayleigh dynamics), which is significantly higher than what we measured ( ‰). Hence, whether N2O is an intermediate or parallel side product, its role in the overall reaction complicates N and O isotope mass balance dynamics in complex ways.
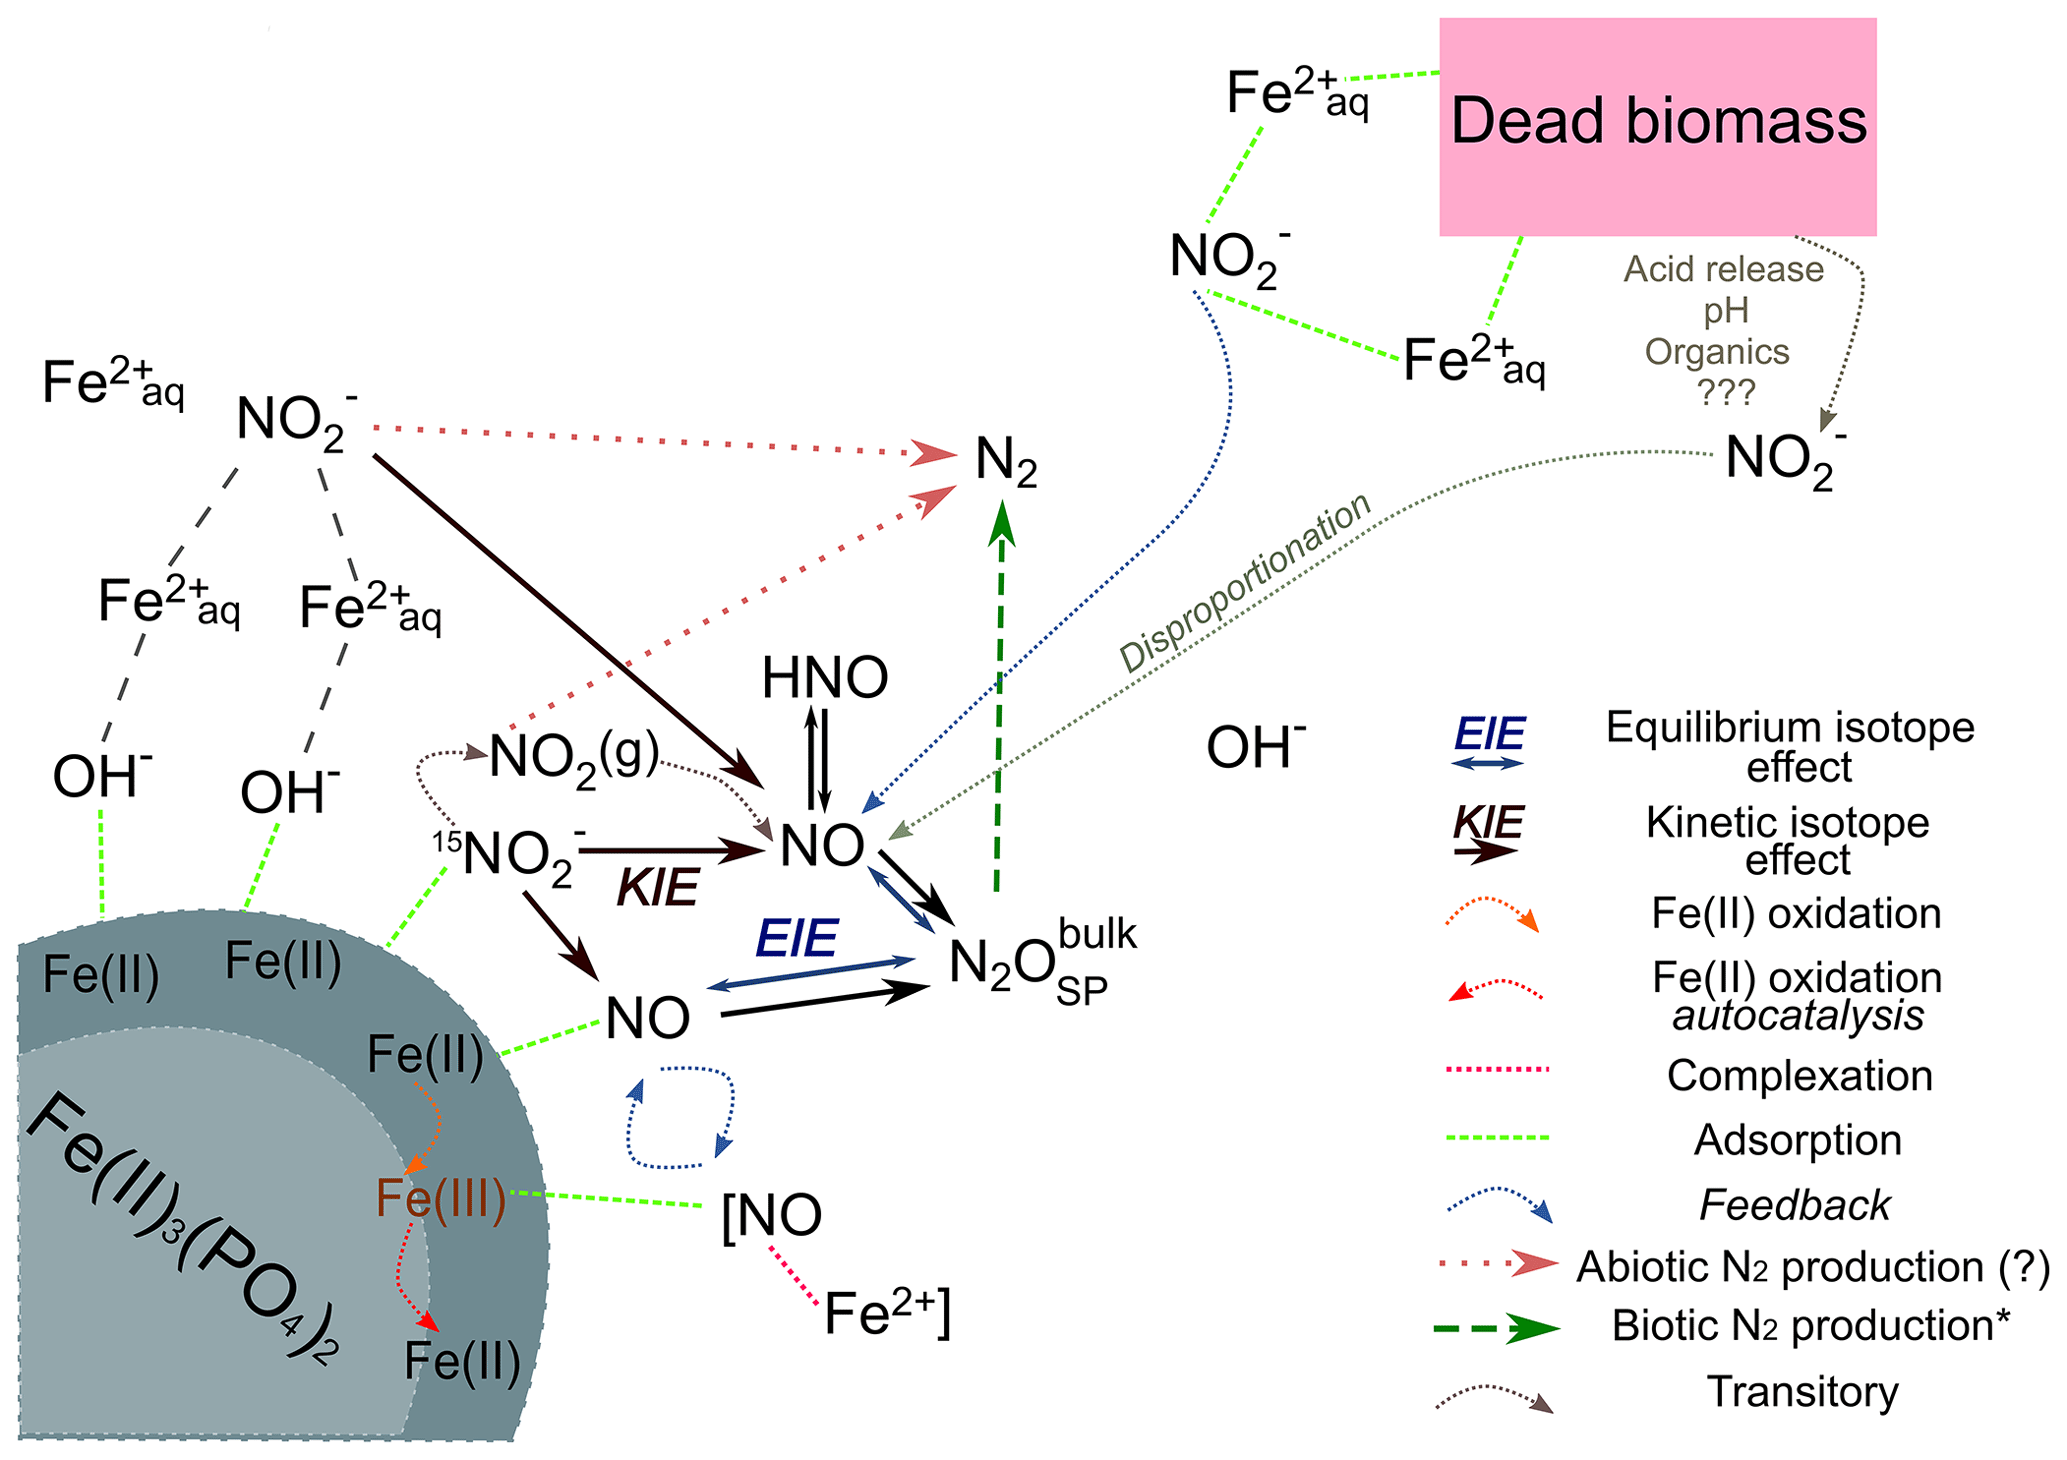
Figure 8Conceptual figure depicting the proposed reaction mechanisms and feedbacks between the different N species during chemodenitrification induced by the presence of a mineral surface (lower left corner) or (dead) biomass (upper right corner). Adsorption of Fe2+ (directly or via complexation by OH−) as well as could catalyse a direct reaction between both. In addition, adsorption onto the Fe(II) mineral might also induce disproportionation, leading to NOx formation. These formed intermediates, although transitory, may impact the overall reaction dynamics by processes such as complex formation (i.e. [NO–Fe2+]) or direct Fe(II) oxidation. The Fe(III) produced might induce another feedback loop (autocatalysis), resulting in further Fe(II) oxidation. Similar processes are possibly induced by the presence of (dead) biomass. The adsorption and complexation of either or Fe2+ would enhance the reaction between both. In addition, the presence of organic acids would decrease the pH locally, thereby promoting and accelerating disproportionation and, thus, additionally enhancing Fe(II) oxidation. Our results suggest that reduction results in a KIE, which should influence the isotopic composition of NO. Here, N2O is an intermediate, the isotopic composition of which is mainly influenced by an EIE between NO and N2O. The low N2O yields and the N2O isotopic results (bulk and SP) clearly suggests that N2 is produced abiotically.
In the absence of any clear (genetic) evidence for enzymatic NDFeO from cultures (e.g. Acidovorax sp. strain BoFeN1), heterotrophic denitrification/ reduction coupled with abiotic oxidation of Fe(II) with the has been presented as the most reasonable explanation for NDFeO. Here we investigated the second, abiotic step, clearly demonstrating that Fe-associated abiotic reduction can be catalysed by mineral and organic phases under environmentally relevant conditions, as found, for example, in soils and aquifers. Our results confirm that reactive surfaces play a major role with regard to the reaction between and Fe(II) and that surface-catalysed chemodenitrification appears to not only contribute to the production of the greenhouse gas N2O in environments hosting active cycling of Fe and N but also to an abiotic production of N2. In order to understand the mechanistic details of Fe-coupled chemodenitrification, natural-abundance measurements of reactive-N isotope ratios may help distinguish between abiotic and biotic reactions during NDFeO. Our results, however, indicate that the potential of coupled N and O isotope measurements to determine the relative importance of Fe-induced N-transformations in natural environments is somewhat limited. Considering, for example, the apparent inverse N isotope effect in the mineral-only experiments, our studies show that the N vs. O isotope systematics seem to contrast distinctly between biotic and abiotic reduction, potentially permitting the disentanglement of the biotic vs. abiotic processes. N2O SP values seem to be less diagnostic with regard to discriminating between chemodenitrification-derived N2O and N2O that is produced during microbial reduction. Our results suggest that both the reaction between Fe(II) and reactive N species and the resulting isotope effects are dependent on the reactive surfaces available. The presence of organic material seems to enhance reduction and, to a lesser extent, N2O production, leading to the enrichment in 15N in the residual , as predicted by Rayleigh-type kinetic N isotope fractionation. In the presence of Fe(II) minerals alone, reduction rates are significantly lower, and net N and O isotope effects are not governed by kinetic isotope fractionation only but also by isotope equilibrium fractionation during exchange with the ambient mineral phase and/or the ambient water (in the case of O isotopes). While N2O production was significant, the N2O yields were below 5 %, suggesting that a significant fraction of the reduced is at least transiently transformed to NO and possibly N2. This transient pool of NO possibly stands in quasi-equilibrium with other intermediates (i.e. HNO and NO2(g)) or complexes (i.e. Fe–NO) and may, therefore, impact the overall reaction kinetics as well.
We speculate that the transient accumulation of NO represents an important constraint on both the overall reaction kinetics and the N2O isotopic signature (or Δ15N), which is an aspect that should be verified in future work. Such work may include the quantification of N2 (and its N isotopic composition), which will help to assess the extent to which (i) Fe-mineral surface-induced chemodenitrification leads to the formation of a transient pool of NO and is driven by the catalytically induced abiotic reaction between Fe(II) and or if (ii) NO is actually the main oxidizing agent of Fe(II).
Our data revealed further complexity with regard to N and O isotope effects during Fe-coupled chemodenitrification than previously reported. We argue that its isotopic imprint depends on the substrate concentration, the presence of reactive surfaces or other catalysts, the mechanisms induced by these catalysts (e.g. surface complexation), and putatively on the intermediates as well as on the product present at the end of the experiments. The multifaceted control on coupled N and O isotope systematics in reactive N species may explain the discrepancies observed between our study and previous work (e.g. with regard to 15ε :18ε ratios; Grabb et al., 2017). Clearly, one has to be realistic with regard to using and/or N2O N and O isotope measurements to provide constraints on the relative importance of chemodenitrification under natural conditions. However, at this point, there is only a very limited number of studies on the isotope effects of chemodenitrification, and with the results presented here, we expand the body of work that aims at using stable isotope measurements to assess the occurrence of chemodenitrification in denitrifying environments. More work on the controls of stable isotope systematics of chemodenitrification, in particular on the role of reactive and potentially cryptic intermediate N species, and of O isotope exchange will improve our ability to more quantitatively trace Fe-coupled nitrite reduction and N2O production in natural Fe-rich soil or sedimentary environments.
Data can be accessed from the corresponding author upon request.
The supplement related to this article is available online at: https://doi.org/10.5194/bg-17-4355-2020-supplement.
AAK initiated the project. MFL and AAK supervised the project. ANV designed and conducted all experiments. Isotope measurements and data analysis were performed by ANV under the supervision of MFL. JMB conducted the Mössbauer measurements and data analysis. PAN supervised and performed all N2O concentration determination measurements. ANV, SDW, and MFL interpreted the data and prepared the paper with inputs from all co-authors.
The authors declare that they have no conflict of interest.
Special thanks go to Karen L. Casciotti (Stanford University) for helping with the correction of the N2O isotope data. The authors are grateful to Cindy-Louise Lockwood and Toby Samuels for corrections and comments on earlier versions of the paper and to Viola Warter and Elizabeth Tomaszewski for fruitful discussions on abiotic chemistry and mineral reactions. Markus Maisch is acknowledged for his help with the preparation of the Mössbauer samples and Louis Rees is thanked for his help with cultivating S. oneidensis MR-1.
This research has been supported by the Deutsche Forschungsgemeinschaft (DFG; grant no. GRK 1708, “Molecular principles of bacterial survival strategies”) and the University of Basel, Switzerland.
This paper was edited by Jack Middelburg and reviewed by two anonymous referees.
Anderson, I. C. and Levine, J. S.: Relative Rates of Nitric Oxide and Nitrous Oxide Production by Nitrifiers, Denitrifiers, and Nitrate Respirers, Appl. Environ. Microbiol., 51, 938–945, 1986.
Andrews, S. C., Robinson, A. K., Rodriguez-Quinones, F., and Rodríguez-Quiñones, F.: Bacterial iron homeostasis, FEMS Microbiol. Rev., 27, 215–237, https://doi.org/10.1016/s0168-6445(03)00055-x, 2003.
Baumgärtner, M. and Conrad, R.: Role of nitrate and nitrite for production and consumption of nitric oxide during denitrification in soil, FEMS Microbiol. Lett., 101, 59–65, https://doi.org/10.1111/j.1574-6968.1992.tb05762.x, 1992.
Braun, V. and Hantke, K.: The Tricky Ways Bacteria Cope with Iron Limitation, Springer, Dordrecht, 31–66, 2013.
Buchwald, C. and Casciotti, K. L.: Isotopic ratios of nitrite as tracers of the sources and age of oceanic nitrite, Nat. Geosci., 6, 308–313, https://doi.org/10.1038/ngeo1745, 2013.
Buchwald, C., Grabb, K., Hansel, C. M., and Wankel, S. D.: Constraining the role of iron in environmental nitrogen transformations: Dual stable isotope systematics of abiotic reduction by Fe(II) and its production of N2O, Geochim. Cosmochim. Ac., 186, 1–12, https://doi.org/10.1016/j.gca.2016.04.041, 2016.
Casciotti, K. L.: Inverse kinetic isotope fractionation during bacterial nitrite oxidation, Geochim. Cosmochim. Ac., 73, 2061–2076, https://doi.org/10.1016/j.gca.2008.12.022, 2009.
Casciotti, K. L. and McIlvin, M. R.: Isotopic analyses of nitrate and nitrite from reference mixtures and application to Eastern Tropical North Pacific waters, Mar. Chem., 107, 184–201, https://doi.org/10.1016/j.marchem.2007.06.021, 2007.
Casciotti, K. L., Boehlke, J. K., McIlvin, M. R., Mroczkowski, S. J., and Hannon, J. E.: Oxygen isotopes in nitrite: Analysis, calibration, and equilibration, Anal. Chem., 79, 2427–2436, https://doi.org/10.1021/ac061598h, 2007.
Chakraborty, A., Roden, E. E., Schieber, J., and Picardal, F.: Enhanced growth of Acidovorax sp. strain 2AN during nitrate-dependent Fe(II) oxidation in batch and continuous-flow systems, Appl. Environ. Microbiol., 77, 8548–56, https://doi.org/10.1128/AEM.06214-11, 2011.
Charlet, L., Wersin, P., and Stumm, W.: Surface charge of MnCO3 and FeCO3, Geochim. Cosmochim. Ac., 54, 2329–2336, https://doi.org/10.1016/0016-7037(90)90059-T, 1990.
Chen, D., Liu, T., Li, X., Li, F., Luo, X., Wu, Y., and Wang, Y.: Biological and chemical processes of microbially mediated nitrate-reducing Fe(II) oxidation by Pseudogulbenkiania sp. strain 2002, Chem. Geol., 476, 59–69, https://doi.org/10.1016/j.chemgeo.2017.11.004, 2018.
Choi, P. S., Naal, Z., Moore, C., Casado-Rivera, E., Abruna, H. D., Helmann, J. D., and Shapleigh, J. P.: Assessing the Impact of Denitrifier-Produced NO on other bacteria, Appl. Environ. Microbiol., 72, 2200–2205, https://doi.org/10.1128/aem.72.3.2200-2205.2006, 2006.
Coby, A. J. and Picardal, F. W.: Inhibition of and reduction by microbial Fe(III) reduction: Evidence of a reaction between and cell surface-bound Fe2+, Appl. Environ. Microbiol., 71, 5267–5274, https://doi.org/10.1128/aem.71.9.5267-5274.2005, 2005.
Cornell, R. M. and Schwertmann, U.: The Iron Oxides: Structure, Properties, Reactions, Occurences and Uses, 2nd Edn., Wiley-VCH, 2003.
Dai, Y.-F., Xiao, Y., Zhang, E.-H., Liu, L.-D., Qiu, L., You, L.-X., Dummi Mahadevan, G., Chen, B.-L., and Zhao, F.: Effective methods for extracting extracellular polymeric substances from Shewanella oneidensis MR-1, Water Sci. Technol., 74, 2987–2996, https://doi.org/10.2166/wst.2016.473, 2016.
Delahay, P., Pourbaix, M., and Van Rysselberghe, P.: Potential-pH diagrams, J. Chem. Educ., available at: https://pubs.acs.org/doi/pdfplus/10.1021/ed027p683 (last access: 20 April 2018), 1950.
Dhakal, P.: Abiotic nitrate and nitrite reactivity with iron oxide minerals, University of Kentucky, available at: https://uknowledge.uky.edu/pss_etds/30 (last access: 23 August 2020), 2013.
Dhakal, P., Matocha, C. J., Huggins, F. E., and Vandiviere, M. M.: Nitrite Reactivity with Magnetite, Environ. Sci. Technol., 47, 6206–6213, https://doi.org/10.1021/es304011w, 2013.
Doane, T. A.: The Abiotic Nitrogen Cycle, ACS Earth Sp. Chem., 1, 411–421, https://doi.org/10.1021/acsearthspacechem.7b00059, 2017.
Elsner, M.: Stable isotope fractionation to investigate natural transformation mechanisms of organic contaminants: principles, prospects and limitations, J. Environ. Monit., 12, 2005–2031, 2010.
Elsner, M., Schwarzenbach, R. P., and Haderlein, S. B.: Reactivity of Fe(II)-Bearing Minerals toward Reductive Transformation of Organic Contaminants, Environ. Sci. Technol., 38, 799–807, https://doi.org/10.1021/es0345569, 2004.
Expert, D.: Iron, an Element Essential to Life, in Molecular Aspects of Iron Metabolism in Pathogenic and Symbiotic Plant-Microbe Associations, Springer, Dordrecht, 1–6, 2012.
Fowle, D. A. and Konhauser, K. O.: Microbial Surface Reactivity, Springer, Dordrecht, 614–616, 2011.
Frame, C. H. and Casciotti, K. L.: Biogeochemical controls and isotopic signatures of nitrous oxide production by a marine ammonia-oxidizing bacterium, Biogeosciences, 7, 2695–2709, https://doi.org/10.5194/bg-7-2695-2010, 2010.
Fry, B.: Stable Isotope Ecology, 3rd Edn., Springer Science+Business Media, LLC, New York, 2006.
Goretski, J. and Hollocher, T. C.: Trapping of nitric oxide produced during denitrification by extracellular hemoglobin, J. Biol. Chem., 263, 2316–2323, available at: http://www.jbc.org/content/263/5/2316.abstract (last access: 23 August 2020), 1988.
Gorski, C. A. and Scherer, M. M.: Fe2+ sorption at the Fe oxide-water interface: A revised conceptual framework, in: Aquatic Redox Chemistry, Vol. 1071, edited by: Tratnyek, P. G., Grundl, T. J., and Haderlein, S. B., ACS Publications, 315–343, 2011.
Grabb, K. C., Buchwald, C., Hansel, C. M., and Wankel, S. D.: A dual nitrite isotopic investigation of chemodenitrification by mineral-associated Fe(II) and its production of nitrous oxide, Geochim. Cosmochim. Ac., 196, 388–402, available at: https://www.sciencedirect.com/science/article/pii/S0016703716306044 (last access: 28 March 2019), 2017.
Granger, J. and Sigman, D. M.: Removal of nitrite with sulfamic acid for nitrate N and O isotope analysis with the denitrifier method, Rapid Commun. Mass Spectrom., 23, 3753–3762, https://doi.org/10.1002/rcm.4307, 2009.
Granger, J., Sigman, D. M., Lehmann, M. F., and Tortell, P. D.: Nitrogen and oxygen isotope fractionation during dissimilatory nitrate reduction by denitrifying bacteria, Limnol. Oceanogr., 53, 2533–2545, https://doi.org/10.4319/lo.2008.53.6.2533, 2008.
Granger, J., Karsh, K. L., Guo, W., Sigman, D. M., and Kritee, K.: The nitrogen and oxygen isotope composition of nitrate in the environment: The systematics of biological nitrate reduction, Geochim. Cosmochim. Ac., 73, A460–A460, 2009.
Halder, S., Yadav, K. K., Sarkar, R., Mukherjee, S., Saha, P., Haldar, S., Karmakar, S., and Sen, T.: Alteration of Zeta potential and membrane permeability in bacteria: a study with cationic agents, Springerplus, 4, 1–4, https://doi.org/10.1186/s40064-015-1476-7, 2015.
He, H., Zhang, S., Zhu, C., and Liu, Y.: Equilibrium and kinetic Si isotope fractionation factors and their implications for Si isotope distributions in the Earth's surface environments, Acta Geochim., 35, 15–24, https://doi.org/10.1007/s11631-015-0079-x, 2016a.
He, S., Tominski, C., Kappler, A. A., Behrens, S., and Roden, E. E.: Metagenomic analyses of the autotrophic Fe(II)-oxidizing, nitrate-reducing enrichment culture KS, Appl. Environ. Microbiol., 82, 2656–2668, https://doi.org/10.1128/AEM.03493-15, 2016b.
Heidelberg, J. F., Paulsen, I. T., Nelson, K. E., Gaidos, E. J., Nelson, W. C., Read, T. D., Eisen, J. A., Seshadri, R., Ward, N., Methe, B., Clayton, R. A., Meyer, T., Tsapin, A., Scott, J., Beanan, M., Brinkac, L., Daugherty, S., DeBoy, R. T., Dodson, R. J., Durkin, A. S., Haft, D. H., Kolonay, J. F., Madupu, R., Peterson, J. D., Umayam, L. A., White, O., Wolf, A. M., Vamathevan, J., Weidman, J., Impraim, M., Lee, K., Berry, K., Lee, C., Mueller, J., Khouri, H., Gill, J., Utterback, T. R., McDonald, L. A., Feldblyum, T. V., Smith, H. O., Venter, J. C., Nealson, K. H., and Fraser, C. M.: Genome sequence of the dissimilatory metal ion–reducing bacterium Shewanella oneidensis, Nat. Biotechnol., 20, 1118–1123, https://doi.org/10.1038/nbt749, 2002.
Heil, J., Vereecken, H., and Brüggemann, N.: A review of chemical reactions of nitrification intermediates and their role in nitrogen cycling and nitrogen trace gas formation in soil, Eur. J. Soil Sci., 67, 23–39, https://doi.org/10.1111/ejss.12306, 2016.
Hunkeler, D. and Elsner, M.: Principles and Mechanisms of Isotope Fractionation, in: Environmental Isotopes in Biodegradation and Bioremediation, edited by: Aelion, C. M., Höhener, P., Hunkeler, D., and Aravena, R., CRC Press, 43–76, 2009.
Ilbert, M. and Bonnefoy, V.: Insight into the evolution of the iron oxidation pathways, Biochim. Biophys. Ac.-Bioenerg., 1827, 161–175, https://doi.org/10.1016/j.bbabio.2012.10.001, 2013.
Jamieson, J., Prommer, H., Kaksonen, A. H., Sun, J., Siade, A. J., Yusov, A., and Bostick, B.: Identifying and Quantifying the Intermediate Processes during Nitrate-Dependent Iron(II) Oxidation, Environ. Sci. Technol., 52, 5771–5781, https://doi.org/10.1021/acs.est.8b01122, 2018.
Jones, L. C., Peters, B., Lezama Pacheco, J. S., Casciotti, K. L., and Fendorf, S.: Stable Isotopes and Iron Oxide Mineral Products as Markers of Chemodenitrification, Environ. Sci. Technol., 49, 3444–3452, https://doi.org/10.1021/es504862x, 2015.
Kampschreur, M. J., Kleerebezem, R., de Vet, W., and van Loosdrecht, M.: Reduced iron induced nitric oxide and nitrous oxide emission, Water Res., 45, 5945–5952, https://doi.org/10.1016/j.watres.2011.08.056, 2011.
Kendall C. and Aravena R.: Nitrate Isotopes in Groundwater Systems, in: Environmental Tracers in Subsurface Hydrology, edited by: Cook, P. G. and Herczeg, A. L., Springer, Boston, MA, https://doi.org/10.1007/978-1-4615-4557-6_9, 2000.
Klueglein, N. and Kappler, A. A.: Abiotic oxidation of Fe(II) by reactive nitrogen species in cultures of the nitrate-reducing Fe(II) oxidizer Acidovorax sp BoFeN1 – questioning the existence of enzymatic Fe(II) oxidation, Geobiology, 11, 180–190, https://doi.org/10.1111/gbi.12040, 2013.
Klueglein, N., Zeitvogel, F., Stierhof, Y.-D., Floetenmeyer, M., Konhauser, K. O., Kappler, A. A., and Obst, M.: Potential Role of Nitrite for Abiotic Fe(II) Oxidation and Cell Encrustation during Nitrate Reduction by Denitrifying Bacteria, Appl. Environ. Microbiol., 80, 1051–1061, https://doi.org/10.1128/aem.03277-13, 2014.
Lagarec, K. and Rancourt, D. G.: Extended Voigt-based analytic lineshape method for determining N-dimensional correlated hyperfine parameter distributions in Mössbauer spectroscopy, Nucl. Instruments Methods Phys. Res. Sect. B, 129, 266–280, https://doi.org/10.1016/S0168-583X(97)00284-X, 1997.
Laufer, K., Røy, H., Jørgensen, B. B., and Kappler, A. A.: Evidence for the existence of autotrophic nitrate-reducing Fe(II)-oxidizing bacteria in marine coastal sediment, Appl. Environ. Microbiol., 82, 6120–6131, https://doi.org/10.1128/AEM.01570-16, 2016.
Li, W., Beard, B. L., and Johnson, C. M.: Exchange and fractionation of Mg isotopes between epsomite and saturated MgSO4 solution, Geochim. Cosmochim. Ac., 75, 1814–1828, https://doi.org/10.1016/j.gca.2011.01.023, 2011.
Lies, D. P., Hernandez, M. E., Kappler, A. A., Mielke, R. E., Gralnick, J. A., and Newman, D. K.: Shewanella oneidensis MR-1 uses overlapping pathways for iron reduction at a distance and by direct contact under conditions relevant for biofilms, Appl. Environ. Microbiol., 71, 4414–4426, https://doi.org/10.1128/aem.71.8.4414-4426.2005, 2005.
Liu, J. and Konermann, L.: Irreversible Thermal Denaturation of cytochrome-c studied by Electrospray Mass Spectrometry, J. Am. Soc. Mass Spectrom., 20, 819–828, https://doi.org/10.1016/J.JASMS.2008.12.016, 2009.
Liu, J., Wang, Z., Belchik, S. M., Edwards, M. J., Liu, C., Kennedy, D. W., Merkley, E. D., Lipton, M. S., Butt, J. N., Richardson, D. J., Zachara, J. M., Fredrickson, J. K., Rosso, K. M., and Shi, L.: Identification and Characterization of MtoA: A Decaheme c-Type Cytochrome of the Neutrophilic Fe(II)-Oxidizing Bacterium Sideroxydans lithotrophicus ES-1, Front. Microbiol., 3, 1–11, https://doi.org/10.3389/fmicb.2012.00037, 2012.
Liu, T., Chen, D., Luo, X., Li, X., and Li, F.: Microbially mediated nitrate-reducing Fe(II) oxidation: Quantification of chemodenitrification and biological reactions, Geochim. Cosmochim. Ac., 256, 97–115, https://doi.org/10.1016/J.GCA.2018.06.040, 2018.
Lovley, D. R.: Microbial Fe(III) reduction in subsurface environments, FEMS Microbiol. Rev., 20, 305–313, https://doi.org/10.1111/j.1574-6976.1997.tb00316.x, 1997.
Lovley, D. R.: Electromicrobiology, Annu. Rev. Microbiol., 66, 391–409, https://doi.org/10.1146/annurev-micro-092611-150104, 2012.
Luan, F., Liu, Y., Griffin, A. M., Gorski, C. A., and Burgos, W. D.: Iron(III)-Bearing Clay Minerals Enhance Bioreduction of Nitrobenzene by Shewanella putrefaciens CN32, Env. Sci. Technol., 49, 1418–1476, https://doi.org/10.1021/es504149y, 2015.
Luna-Zaragoza, D., Romero-Guzmán, E. T., and Reyes-Gutiérrez, L. R.: Surface and Physicochemical Characterization of Phosphates Vivianite and Hydroxyapatite, J. Miner. Mater. Charact. Eng., 08, 591–609, https://doi.org/10.4236/jmmce.2009.88052, 2009.
Mariotti, A., Germon, J. C., Hubert, P., Kaiser, P., Letolle, R., Tardieux, A., and Tardieux, P.: Experimental determination of nitrogen kinetic isotope fractionation: Some principles; illustration for the denitrification and nitrification processes, Plant Soil, 62, 413–430, https://doi.org/10.1007/BF02374138, 1981.
Martin, T. S. and Casciotti, K. L.: Paired N and O isotopic analysis of nitrate and nitrite in the Arabian Sea oxygen deficient zone, Deep-Sea Res. Pt. I, 121, 121–131, https://doi.org/10.1016/j.dsr.2017.01.002, 2017.
McIlvin, M. R. and Altabet, M. A.: Chemical conversion of nitrate and nitrite to nitrous oxide for nitrogen and oxygen isotopic analysis in freshwater and seawater, Anal. Chem., 77, 5589–5595, https://doi.org/10.1021/ac050528s, 2005.
McIlvin, M. R. and Casciotti, K. L.: Fully automated system for stable isotopic analyses of dissolved nitrous oxide at natural abundance levels, Limnol. Oceanogr. Method., 8, 54–66, https://doi.org/10.4319/lom.2010.8.54, 2010.
McKnight, G. M., Smith, L. M., Drummond, R. S., Duncan, C. W., Golden, M., and Benjamin, N.: Chemical synthesis of nitric oxide in the stomach from dietary nitrate in humans, BMJ Journals: Gut, 40, 211–214, 1997.
Minguzzi, A., Fan, F.-R. F., Vertova, A., Rondinini, S., and Bard, A. J.: Dynamic potential – pH diagrams application to electrocatalysts for wateroxidation, Chem. Sci., 3, 217–229, https://doi.org/10.1039/C1SC00516B, 2012.
Mohn, J., Wolf, B., Toyoda, S., Lin, C.-T., Liang, M.-C., Brüggemann, N., Wissel, H., Steiker, A. E., Dyckmans, J., Szwec, L., Ostrom, N. E., Casciotti, K. L., Forbes, M., Giesemann, A., Well, R., Doucett, R. R., Yarnes, C. T., Ridley, A. R., Kaiser, J., and Yoshida, N.: Interlaboratory assessment of nitrous oxide isotopomer analysis by isotope ratio mass spectrometry and laser spectroscopy: current status and perspectives, Rapid Commun. Mass Spectrom., 28, 1995–2007, https://doi.org/10.1002/rcm.6982, 2014.
Muehe, E. M., Gerhardt, S., Schink, B., and Kappler, A.: Ecophysiology and the energetic benefit of mixotrophic Fe(II) oxidation by various strains of nitrate-reducing bacteria, FEMS Microbiol. Ecol., 70, 335–343, https://doi.org/10.1111/j.1574-6941.2009.00755.x, 2009.
Muehe, E. M., Obst, M., Hitchcock, A., Tyliszczak, T., Behrens, S., Schröder, C., Byrne, J. M., Michel, F. M., Krämer, U., and Kappler, A. A.: Fate of Cd during microbial Fe(III) mineral reduction by a novel and Cd-tolerant geobacter species, Environ. Sci. Technol., 47, 14099–14109, https://doi.org/10.1021/es403365w, 2013.
Nelson, D. W. and Bremner, J. M.: Factors affecting chemical transformations of nitrite in soils, Soil Biol. Biochem., 1, 229–239, https://doi.org/10.1016/0038-0717(69)90023-6, 1969.
Niklaus, P. A., Le Roux, X., Poly, F., Buchmann, N., Scherer-Lorenzen, M., Weigelt, A., and Barnard, R. L.: Plant species diversity affects soil–atmosphere fluxes of methane and nitrous oxide, Oecologia, 181, 919–930, https://doi.org/10.1007/s00442-016-3611-8, 2016.
Nordhoff, M., Tominski, C., Halama, M., Byrne, J. M., Obst, M., Kleindienst, S., Behrens, S., and Kappler, A. A.: Insights into nitrate-reducing Fe(II) oxidation mechanisms through analysis of cell-mineral associations, cell encrustation, and mineralogy in the chemolithoautotrophic enrichment culture KS, Appl. Environ. Microbiol., 83, e00752-17, https://doi.org/10.1128/AEM.00752-17, 2017.
Ostrom, N. E. and Ostrom, P.: Handbook of Environmental Isotope Geochemistry, 1st Edn., edited by: Baskaran, M., Springer Berlin Heidelberg, Berlin, Heidelberg, 2011.
Ostrom, N. E. and Ostrom, P. H.: The Isotopomers of Nitrous Oxide: Analytical Considerations and Application to Resolution of Microbial Production Pathways, in: Handbook of Environmental Isotope Geochemistry: Vol I, edited by: Baskaran, M., Springer Berlin Heidelberg, Berlin, Heidelberg, 453–476, 2012.
Ostrom, N. E., Pitt, A., Sutka, R., Ostrom, P. H., Grandy, A. S., Huizinga, K. M., and Robertson, G. P.: Isotopologue effects during N2O reduction in soils and in pure cultures of denitrifiers, J. Geophys. Res., 112, 1–12, https://doi.org/10.1029/2006jg000287, 2007.
Ostrom, N. E., Gandhi, H., Coplen, T. B., Toyoda, S., Böhlke, J. K., Brand, W. A., Casciotti, K. L., Dyckmans, J., Giesemann, A., Mohn, J., Well, R., Yu, L., and Yoshida, N.: Preliminary assessment of stable nitrogen and oxygen isotopic composition of USGS51 and USGS52 nitrous oxide reference gases and perspectives on calibration needs, Rapid Commun. Mass Spectrom., 32, 1207–1214, https://doi.org/10.1002/rcm.8157, 2018.
Otte, J. M., Blackwell, N., Ruser, R., Kappler, A. A., Kleindienst, S., and Schmidt, C.: N2O formation by nitrite-induced (chemo)denitrification in coastal marine sediment, Sci. Rep., 9, 10691, https://doi.org/10.1038/s41598-019-47172-x, 2019.
Ottley, C. J., Davison, W., and Edmunds, W. M.: Chemical catalysis of nitrate reduction by iron(II), Geochim. Cosmochim. Ac., 61, 1819–1828, https://doi.org/10.1016/S0016-7037(97)00058-6, 1997.
Pereira, C., Ferreira, N. R., Rocha, B. S., Barbosa, R. M., and Laranjinha, J.: The redox interplay between nitrite and nitric oxide: From the gut to the brain, Redox Biol., 1, 276–284, https://doi.org/10.1016/j.redox.2013.04.004, 2013.
Phillips, R. L., Song, B., McMillan, A. M. S., Grelet, G., Weir, B. S., Palmada, T., and Tobias, C.: Chemical formation of hybrid di-nitrogen calls fungal codenitrification into question, Sci. Rep., 6, 39077, https://doi.org/10.1038/srep39077, 2016.
Piasecki, W., Szymanek, K., and Charmas, R.: Fe2+ adsorption on iron oxide: the importance of the redox potential of the adsorption system, Adsorption, 25, 613–619, https://doi.org/10.1007/s10450-019-00054-0, 2019.
Piepenbrock, A., Dippon, U., Porsch, K., Appel, E., and Kappler, A. A.: Dependence of microbial magnetite formation on humic substance and ferrihydrite concentrations, Geochim. Cosmochim. Ac,, 75, 6844–6858, https://doi.org/10.1016/j.gca.2011.09.007, 2011.
Price, A., Macey, M. C., Miot, J., and Olsson-Francis, K.: Draft Genome Sequences of the Nitrate-Dependent Iron-Oxidizing Proteobacteria Acidovorax sp. Strain BoFeN1 and Paracoccus pantotrophus Strain KS1, edited by: J. C. Thrash, Microbiol. Resour. Announc., 7, e01050-18, https://doi.org/10.1128/mra.01050-18, 2018.
Rakshit, S., Matocha, C. J., and Coyne, M. S.: Nitrite reduction by siderite, Soil Sci. Soc. Am. J., 72, 1070–1077, https://doi.org/10.2136/sssaj2007.0296, 2008.
Rancourt, D. G. and Ping, J. Y.: Voigt-based methods for arbitrary-shape static hyperfine parameter distributions in Mössbauer spectroscopy, Nucl. Instruments Methods Phys. Res. Sect. B, 58, 85–97, https://doi.org/10.1016/0168-583X(91)95681-3, 1991.
Rivallan, M., Ricchiardi, G., Bordiga, S., and Zecchina, A.: Adsorption and reactivity of nitrogen oxides (NO2, NO, N2O) on Fe-zeolites, J. Catal., 264, 104–116, https://doi.org/10.1016/j.jcat.2009.03.012, 2009.
Samarkin, V. A., Madigan, M. T., Bowles, M. W., Casciotti, K. L., Priscu, J. C., McKay, C. P., and Joye, S. B.: Abiotic nitrous oxide emission from the hypersaline Don Juan Pond in Antarctica, Nat. Geosci., 3, 341–344, https://doi.org/10.1038/ngeo847, 2010.
Schaefer, M. V.: Spectroscopic evidence for interfacial Fe(II)-Fe(III) electron transfer in clay minerals, Iowa Research Online, available at: http://ir.uiowa.edu/etd/596 (last access:20 March 2018), 2010.
Snyder, L. R. and Adler, H. J.: Dispersion in Segmented Flow through Glass Tubing in Continuous-Flow Analysis: The Ideal Model, Anal. Chem., 48, 1017–1022, https://doi.org/10.1021/ac60371a013, 1976.
Sorensen, J. and Thorling, L.: Stimulation by Lepidocrocite (Gamma-Feooh) of Fe(II)-Dependent Nitrite Reduction, Geochim. Cosmochim. Ac., 55, 1289–1294, https://doi.org/10.1016/0016-7037(91)90307-Q, 1991.
Stevenson, F. J., Harrison, R. M., Wetselaar, R., and Leeper, R. A.: Nitrosation of Soil Organic Matter: III. Nature of Gases Produced by Reaction of Nitrite with Lignins, Humic Substances, and Phenolic Constituents Under Neutral and Slightly Acidic Conditions1, Soil Sci. Soc. Am. J., 34, 430–435, https://doi.org/10.2136/sssaj1970.03615995003400030024x, 1970.
Stookey, L. L.: Ferrozine – A new spectrophotometric reagent for iron, Anal. Chem., 42, 779–781, https://doi.org/10.1021/ac60289a016, 1970.
Straub, K. L., Benz, M., Schink, B., and Widdel, F.: Anaerobic, nitrate-dependent microbial oxidation of ferrous iron, Appl. Environ. Microbiol., 62, 1458–1460, 1996.
Stumm, W. and Sulzberger, B.: The cycling of iron in natural environments: Considerations based on laboratory studies of heterogeneous redox processes, Geochim. Cosmochim. Ac., 56, 3233–3257, https://doi.org/10.1016/0016-7037(92)90301-X, 1992.
Sutka, R. L., Ostrom, N. E., Ostrom, P. H., Breznak, J. A., Gandhi, H., Pitt, A. J., and Li, F.: Distinguishing nitrous oxide production from nitrification and denitrification on the basis of isotopomer abundances, Appl. Environ. Microbiol., 72, 638–644, https://doi.org/10.1128/Aem.72.1.638-644.2006, 2006.
Tanford, C.: Protein denaturation: Part C. theoretical models for the mechanism of denaturation, Adv. Protein Chem., 24, 1–95, https://doi.org/10.1016/S0065-3233(08)60241-7, 1970.
Taran, Y. A., Kliger, G. A., Cienfuegos, E., and Shuykin, A. N.: Carbon and hydrogen isotopic compositions of products of open-system catalytic hydrogenation of CO2: Implications for abiogenic hydrocarbons in Earth's crust, Geochim. Cosmochim. Ac., 74, 6112–6125, https://doi.org/10.1016/j.gca.2010.08.012, 2010.
Tian, T., Zhou, K., Xuan, L., Zhang, J.-X., Li, Y.-S., Liu, D.-F., and Yu, H.-Q.: Exclusive microbially driven autotrophic iron-dependent denitrification in a reactor inoculated with activated sludge, Water Res., 170, 115300, https://doi.org/10.1016/j.watres.2019.115300, 2020.
Tiso, M. and Schechter, A. N.: Nitrate reduction to nitrite, nitric oxide and ammonia by gut bacteria under physiological conditions, PLoS One, 10, e0119712, https://doi.org/10.1371/journal.pone.0119712, 2015.
Tominski, C., Heyer, H., Lösekann-Behrens, T., Behrens, S., and Kappler, A. A.: Growth and Population Dynamics of the Anaerobic Fe(II)-Oxidizing and Nitrate-Reducing Enrichment Culture KS, edited by F. E. Löffler, Appl. Environ. Microbiol., 84, e02173-17, https://doi.org/10.1128/AEM.02173-17, 2018.
Toyoda, S. and Yoshida, N.: Determination of Nitrogen Isotopomers of Nitrous Oxide on a Modified Isotope Ratio Mass Spectrometer, Anal. Chem., 71, 4711–4718, https://doi.org/10.1021/AC9904563, 1999.
Toyoda, S., Mutobe, H., Yamagishi, H., Yoshida, N., and Tanji, Y.: Fractionation of N2O isotopomers during production by denitrifier, Soil Biol. Biochem., 37, 1535–1545, https://doi.org/10.1016/j.soilbio.2005.01.009, 2005.
Van Cleemput, O. and Samater, A.: Nitrite in soils: accumulation and role in the formation of gaseous N compounds, Fertil. Res., 45, 81–89, https://doi.org/10.1007/BF00749884, 1995.
Veeramani, H., Alessi, D. S., Suvorova, E. I., Lezama-Pacheco, J. S., Stubbs, J. E., Sharp, J. O., Dippon, U., Kappler, A. A., Bargar, J. R., and Bernier-Latmani, R.: Products of abiotic U(VI) reduction by biogenic magnetite and vivianite, Geochim. Cosmochim. Ac., 75, 2512–2528, https://doi.org/10.1016/j.gca.2011.02.024, 2011.
Wankel, S. D., Ziebis, W., Buchwald, C., Charoenpong, C., De Beer, Di., Dentinger, J., Xu, Z., and Zengler, K.: Evidence for fungal and chemodenitrification based N2O flux from nitrogen impacted coastal sediments, Nat. Commun., 8, 15595, https://doi.org/10.1038/ncomms15595, 2017.
Weber, K. A., Hedrick, D. B., Peacock, A. D., Thrash, J. C., White, D. C., Achenbach, L. A., and Coates, J. D.: Physiological and taxonomic description of the novel autotrophic, metal oxidizing bacterium, Pseudogulbenkiania sp. strain 2002, Appl. Microbiol. Biotechnol., 83, 555–565, https://doi.org/10.1007/s00253-009-1934-7, 2009.
Well, R. and Flessa, H.: Isotopologue signatures of N2O produced by denitrification in soils, J. Geophys. Res., 114, https://doi.org/10.1029/2008jg000804, 2009.
Wenk, C. B., Frame, C. H., Koba, K., Casciotti, K. L., Veronesi, M., Niemann, H., Schubert, C. J., Yoshida, N., Toyoda, S., Makabe, A., Zopfi, J., and Lehmann, M. F.: Differential N2O dynamics in two oxygen-deficient lake basins revealed by stable isotope and isotopomer distributions, Limnol. Oceanogr., 61, 1735–1749, https://doi.org/10.1002/lno.10329, 2016.
White, G. F., Edwards, M. J., Gomez-Perez, L., Richardson, D. J., Butt, J. N., and Clarke, T. A.: Mechanisms of Bacterial Extracellular Electron Exchange, Adv. Microbial Physiol., 68, 87–138, 2016.
Widdel, F. and Pfennig, N.: Studies on dissimilatory Sulfate-reducing Bacteria that decompose Fatty-Acids – 1. Isotolation of New Sulfate-reducing Bacteria enriched with Acetate from saline Environments – Description of Desulfobacter postgatei gen. nov. sp. nov., Arch. Microbiol., 129-, 395–400, https://doi.org/10.1007/bf00406470, 1981.
Widdel, F., Kohring, G.-W., and Mayer, F.: Studies on Dissimilatory Sulfate-Reducing Bacteria that Decompose Fatty Acids, Arch. Microbiol., 134, 286–294, 1983.
Wilson, W. W., Wade, M. M., Holman, S. C., and Champlin, F. R.: Status of methods for assessing bacterial cell surface charge properties based on zeta potential measurements, J. Microbiol. Method., 43, 153–164, https://doi.org/10.1016/S0167-7012(00)00224-4, 2001.
Winther, M., Balslev-Harder, D., Christensen, S., Priemé, A., Elberling, B., Crosson, E., and Blunier, T.: Continuous measurements of nitrous oxide isotopomers during incubation experiments, Biogeosciences, 15, 767–780, https://doi.org/10.5194/bg-15-767-2018, 2018.
Wunderlin, P., Lehmann, M. F., Siegrist, H., Tuzson, B., Joss, A., Emmenegger, L., and Mohn, J.: Isotope Signatures of N2O in a Mixed Microbial Population System: Constraints on N2O Producing Pathways in Wastewater Treatment, Environ. Sci. Technol., 43, 1339–1348, https://doi.org/10.1021/es303174x, 2013.
Ye, R. W., Averill, B. A., and Tiedje, J. M.: Denitrification: production and consumption of nitric oxide, Appl. Environ. Microbiol., 60, 1053–1058, 1994.
Zeitvogel, F., Burkhardt, C. J., Schroeppel, B., Schmid, G., Ingino, P., and Obst, M.: Comparison of Preparation Methods of Bacterial Cell-Mineral Aggregates for SEM Imaging and Analysis Using the Model System of Acidovorax sp. BoFeN1, Geomicrobiol. J., 34, 317–327, https://doi.org/10.1080/01490451.2016.1189467, 2017.
Zhu-Barker, X., Cavazos, A. R., Ostrom, N. E., Horwath, W. R., and Glass, J. B.: The importance of abiotic reactions for nitrous oxide production, Biogeochemistry, 126, 251–267, https://doi.org/10.1007/s10533-015-0166-4, 2015.
Zumft, W. G.: Cell biology and molecular basis of denitrification, Microbiol. Mol. Biol. Rev., 61, 533–616, available at: http://www.ncbi.nlm.nih.gov/pubmed/9409151 (last access: 19 February 2018), 1997.
Zweier, J. L., Samouilov, A., and Kuppusamy, P.: Non-enzymatic nitric oxide synthesis in biological systems, Biochim. Biophys. Acta-Bioenerg., 1411, 250–262, https://doi.org/10.1016/S0005-2728(99)00018-3, 1999.