the Creative Commons Attribution 4.0 License.
the Creative Commons Attribution 4.0 License.
 | 16 Sep 2020
Modern calibration of Poa flabellata (tussac grass) as a new paleoclimate proxy in the South Atlantic
Dulcinea V. Groff
David G. Williams
Jacquelyn L. Gill
Terrestrial paleoclimate records are rare in the South Atlantic, limiting opportunities to provide a prehistoric context for current global changes. The tussock grass, Poa flabellata, grows abundantly along the coasts of the Falkland Islands and other subantarctic islands. It forms extensive peat records, providing a promising opportunity to reconstruct high-resolution regional climate records. The isotopic composition of leaf and root tissues deposited in these peats has the potential to record variation in precipitation, temperature, and relative humidity over time, but these relationships are unknown for P. flabellata. Here, we measured the isotopic composition of P. flabellata and precipitation and explore relationships with seasonal temperature and humidity variations across four study locations in the Falkland Islands. We reveal that inter-seasonal differences in carbon and oxygen stable isotopes of leaf α-cellulose of living P. flabellata correlated with monthly mean temperature and relative humidity. The carbon isotope composition of leaf α-cellulose (δ13Cleaf) records the balance of CO2 supply through stomata and the demand by photosynthesis. The positive correlation between δ13Cleaf and temperature and negative correlation between δ13Cleaf and relative humidity suggest that photosynthetic demand for CO2 relative to stomatal supply is enhanced when conditions are warm and dry. Further, the positive correlation between δ13Cleaf and δ18Oleaf (r=0.88; p<0.001; n=24) indicates that stomatal closure during warm dry periods explains seasonal variation in δ13Cleaf. We observed significant differences between winter and summer seasons for both δ18Oleaf and δ13Cleaf and among study locations for δ18Oleaf but not δ13Cleaf. δ18O values of monthly composite precipitation were similar between seasons and among study locations, yet characteristic of the latitudinal origin of storm tracks and seasonal winds. The weak correlation between δ18O in monthly composite precipitation and δ18Oleaf further suggests that relative humidity is the main driver of the δ18Oleaf. The oxygen isotopes in root α-cellulose did not reflect, or only partially reflected (at one study location), the δ18O in precipitation. Overall, this study supports the use of peat records formed by P. flabellata to fill a significant gap in our knowledge of the long-term trends in Southern Hemisphere climate dynamics.
- Article
(5222 KB) - Full-text XML
-
Supplement
(1497 KB) - BibTeX
- EndNote


The high-latitude environments of the South Atlantic are changing rapidly. Over the last century, mean annual temperature in the Falkland Islands (Fig. 1a) has increased by 0.5 ∘C (Lister and Jones, 2015). This warming has resulted in an intensification and poleward shift of the southern westerly winds and aridification (Gillett et al., 2008; Thompson and Solomon, 2002; Villalba et al., 2012). These changes are already altering the distribution of marine animals in the Southern Ocean (Weimerskirch et al., 2012), and warming of the western South Atlantic is projected to alter the distribution of island plants as well (Jones et al., 2013; Upson et al., 2016). Meteorological measurements from the Falkland Islands date back to 1874 and are not continuous (Lister and Jones, 2015). This means we lack critical information on the long-term patterns and whether these are novel conditions. Paleoecological archives, such as high-resolution lake sediments and tree rings, can provide useful long-term records documenting and quantifying changes (Dietl et al., 2015; Dietl and Flessa, 2011; Willis et al., 2010), but such records are lacking for the South Atlantic. The absence of trees and deep lakes across many subantarctic islands especially limits high-resolution, independent paleoclimate reconstructions, which are essential for detecting past abrupt climate change. However, many sub-Antarctic islands support widespread communities of peat-forming C3 tussock grasses (Poa flabellata), which provide important habitat and shelter for breeding marine animals such as seals and seabirds. Peat records formed by P. flabellata present a promising avenue for paleoclimate reconstructions similar to other peatland vegetation types in midlatitudes and high latitudes (Amesbury et al., 2015; Chambers et al., 2012; Pendall et al., 2001).
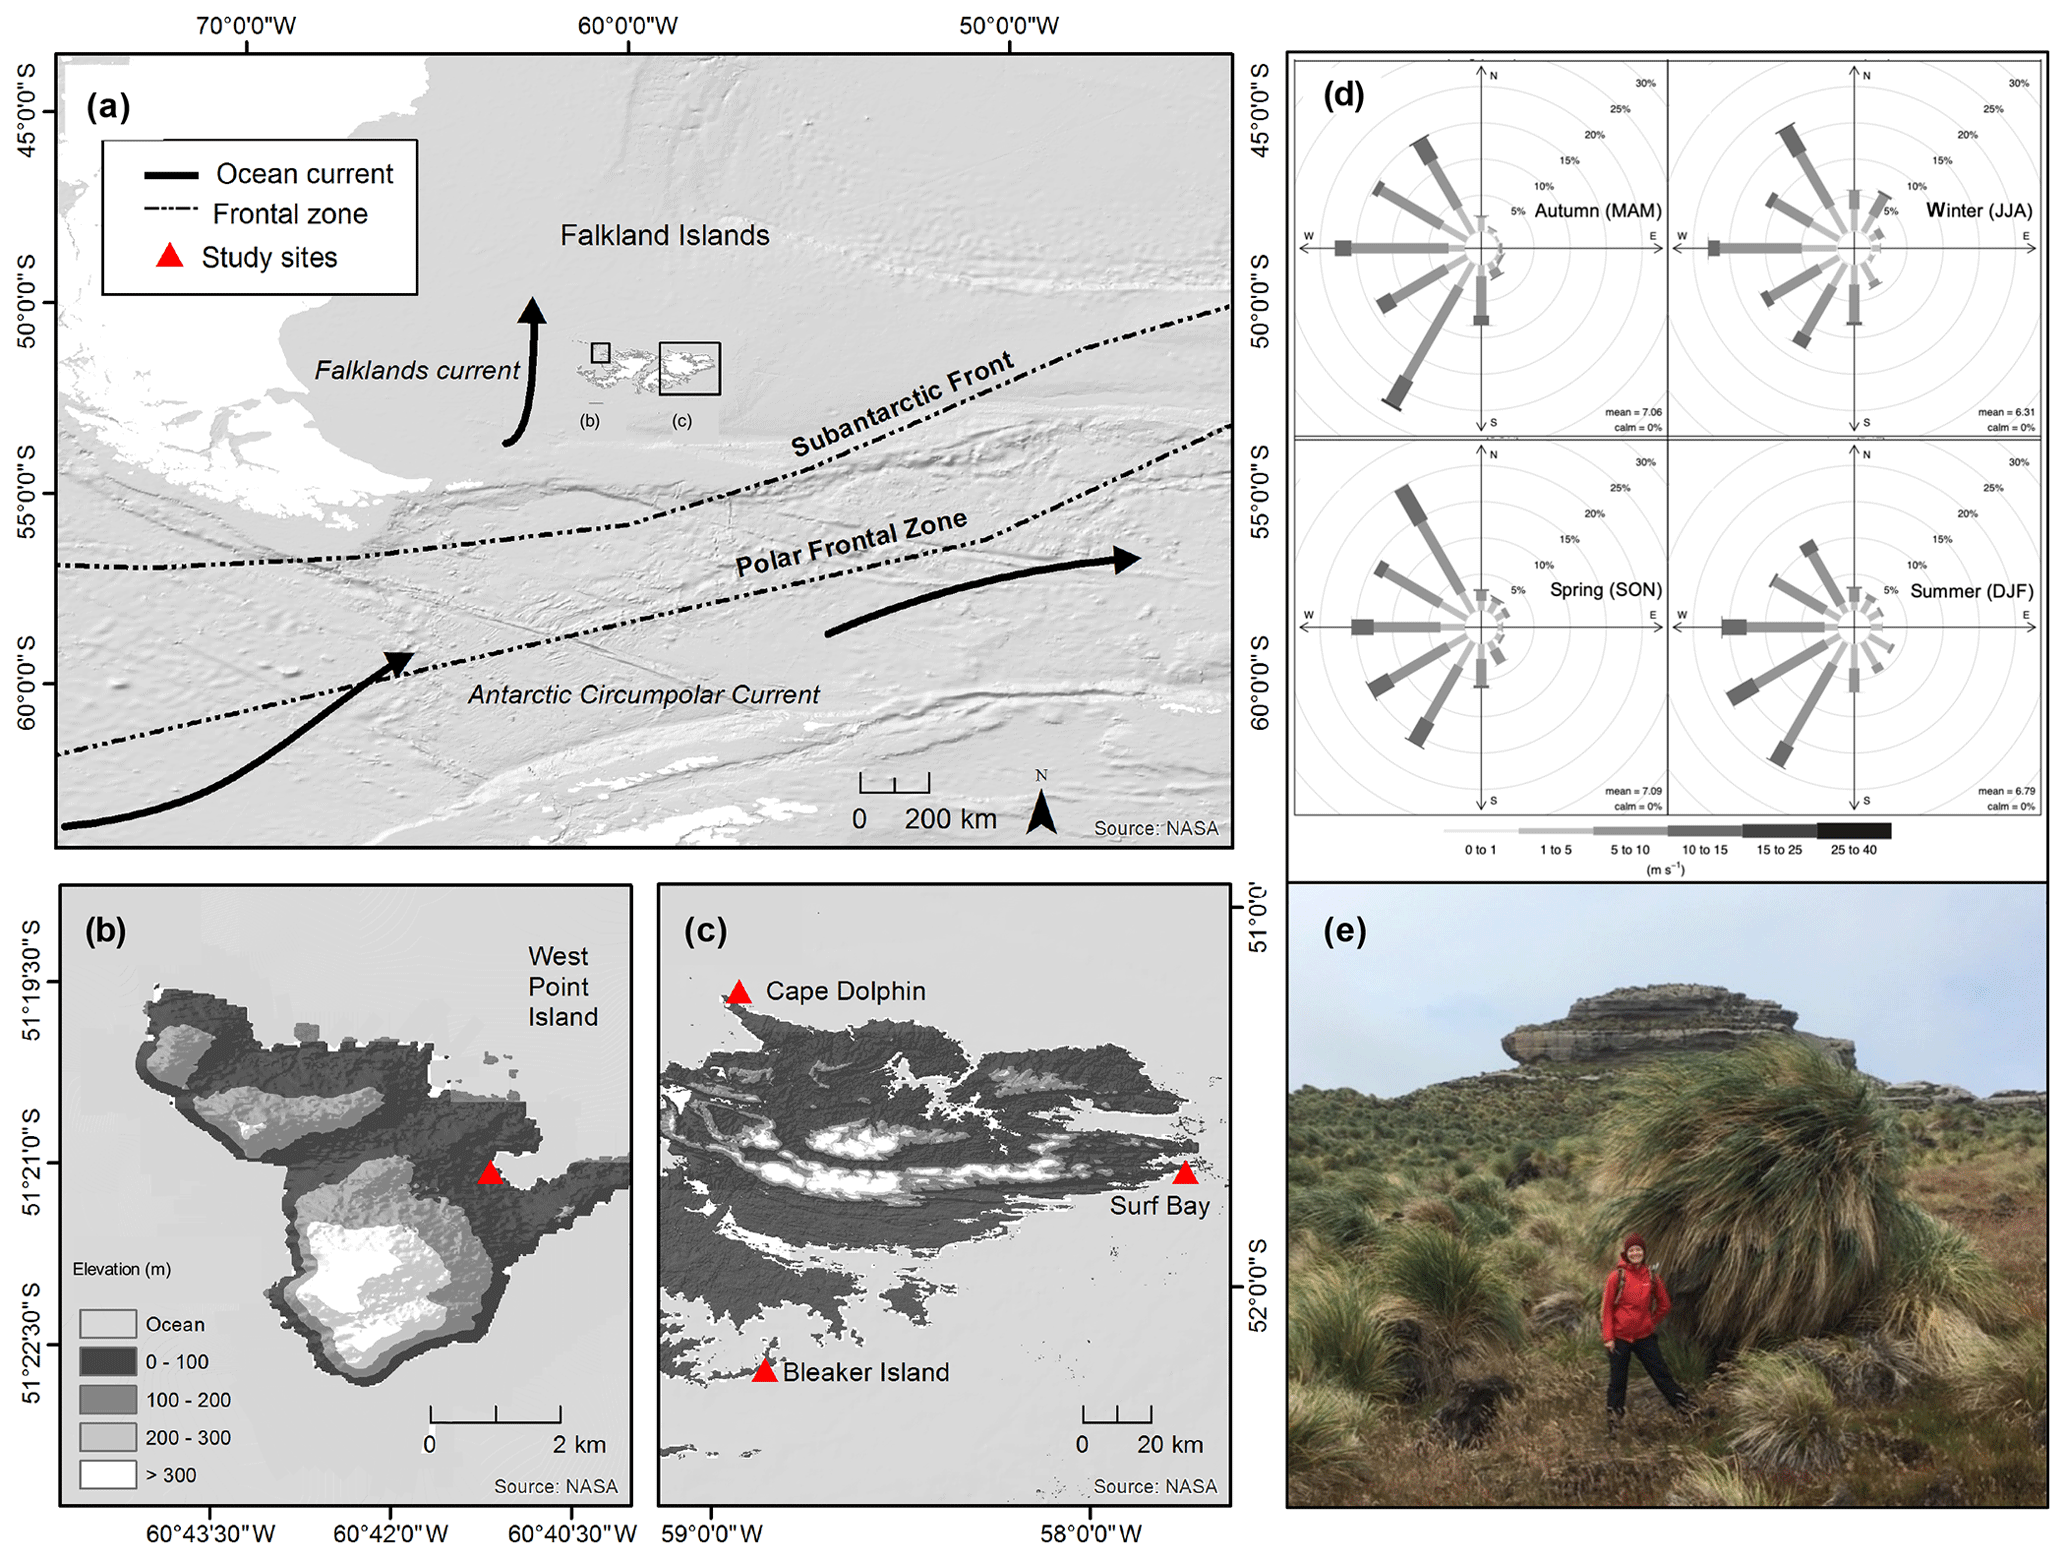
Figure 1Study region. (a) Map of the Falkland Islands and western South Atlantic Ocean with ocean currents (black arrows) and frontal zones (dashed lines). Study sites are shown for (b) West Point Island and (c) Bleaker Island, Cape Dolphin, and Surf Bay. (d) Distribution of wind speed (m s−1) and the frequency of counts by wind direction (%) at Bleaker Island across four seasons, autumn (MAM), winter (JJA), spring (SON), and summer (DJF), along with mean seasonal wind speed (m s−1) and % calm. Measurements logged at 15 min intervals using Bleaker Island weather station (MetPak II) from September 2015 to August 2016. The wind rose was constructed using the package openair in R version 3.1.0. (e) A single large Poa flabellata pedestal made up of dead and living grass tillers growing on top of a decomposing pedestal at Cape Meredith, West Falkland, Falkland Islands.
P. flabellata grasslands in the South Atlantic generate substantial amounts of peat (Smith and Clymo, 1984), and have the highest carbon accumulation rates of any peatland globally (Payne et al., 2019). Endemic to the South Atlantic, P. flabellata only occurs on Tierra del Fuego, the Falkland Islands, Gough Island, and South Georgia. P. flabellata grasslands were once widespread throughout the Falkland Islands, but are now greatly reduced because of land use change and introduced grazers (Strange et al., 1988; Wilson et al., 1993). The term “tussock” is used to describe the clumping growth form of P. flabellata, while the species itself is commonly known as “tussac.”
Several factors support the utility of P. flabellata peats as a paleoclimate proxy. P. flabellata peatlands are formed by a nearly single-species community of P. flabellata, which allows very little light or space for other plants to co-occur in the absence of disturbance. Tillers of P. flabellata grow on top of a pedestal of decaying roots and leaves that can reach 4 m high (Fig. 1e) (Smith and Clymo, 1984); mature plants thus likely primarily use water from precipitation, as they are not rooted in the soil directly, or from evaporatively enriched water in the decaying pedestal. Smith and Prince (1985) established radiocarbon (14C) dates for a P. flabellata pedestal and estimated an age of 250 to 330 years. P. flabellata grass forms extensive peat deposits of up to 13.3 m deep, with carbon accumulation rates of 139 g C m−2 yr−1 (Payne et al., 2019; Smith and Clymo, 1984), far greater than peatlands of similar latitude in the Northern Hemisphere (18.6 g C m−2 yr−1), the tropics (12.8 g C m−2 yr−1), or Patagonia (22 g C m−2 yr−1) (Yu et al., 2010). Subfossil P. flabellata leaves are abundant in these peats and can be readily separated from root subfossils. Having the highest accumulation rate of any peatland globally, P. flabellata peat is ideal for high-resolution climate reconstructions. Basal 14C radiocarbon dates indicate most P. flabellata peatlands initiated by ∼12 500 14C years (Groff, 2018; Payne et al., 2019; Smith and Clymo, 1984).
Grasses exhibiting the tussock growth form often have evergreen leaves and exhibit a profligate or opportunistic water use strategy, due to the high evaporative conditions and pulses of water availability in semiarid habitats (Moreno-Gutiérrez et al., 2012; Sala et al., 1989; Schwinning and Ehleringer, 2001). The growth phenology of P. flabellata is such that it mainly increases in height in summer (∼39 cm yr−1), while in winter an increase in basal area occurs with the production of new tillers at the base of the pedestal (Stanworth and Upson, 2013).
Stable isotopes of oxygen (δ18O), hydrogen (δD), and carbon (δ13C) in the cellulose of plant tissues (roots, shoots, and leaves) can reliably record the climate signal related to environmental growing conditions (Araguás-Araguás et al., 2000). δ13C and δ18O record species' water use strategies in water-limited environments because of physiological responses, such as changes in stomatal conductance and assimilation rates (Farquhar and Sharkey, 1982; Moreno-Gutiérrez et al., 2012). Tussock grasses typically occur in water-limited environments where conservative water use strategies are common functional traits that allow tussock grasses to take advantage of pulses of water (Moreno-Gutiérrez et al., 2012). Correlations between δ18O of plant cellulose and air temperature and humidity provide information on environmental conditions in the season the cellulose tissue was formed. The δ18O of leaf water is a primary driver of δ18O in leaf cellulose and is influenced by the δ18O value of plant source water, temperature, humidity, and plant physiology (Helliker and Ehleringer, 2002; Roden and Ehleringer, 1999). The δ18O of source water often correlates with temperature of the environment (Libby et al., 1976). Apart from water source, δ18O of cellulose can also be influenced by internal exchange among organic molecules and plant water pools (Sternberg et al., 1986). The δ13C value of leaf biomass in C3 plants records δ13C of source CO2 and the expression of fractionation effects associated with CO2 diffusion into and through leaf tissue and carboxylation (Farquhar et al., 1982). The net discrimination against 13C during photosynthesis is driven by changes in the supply of CO2 through stomatal pores and demand for CO2 by photosynthetic biochemistry (Cernusak et al., 2013; Farquhar et al., 1982; Ferrio and Voltas, 2005). The δ13C value of roots tends to be 1–3 ‰ higher than that of leaves due to a number of post-photosynthetic biochemical fractionations and C allocation pathways (Cernusak et al., 2009).
Plant species vary in the way they isotopically record precipitation and temperature; therefore, peat comprised of a single species is more desirable over a mixture of species (van Geel and Middeldorp, 1988). To test the potential of P. flabellata peatlands as a paleoclimate proxy, we conducted a modern calibration study. We measured δ18O and δ13C from living P. flabellata leaf tissues (α-cellulose) collected monthly at four sites across the Falkland Islands (51∘ S, 59∘W; Fig. 1b–c). We aim to improve our understanding of Southern Hemisphere climate dynamics with a new paleoclimate proxy that leverages the unique properties of P. flabellata.
2.1 Study location description
The Falkland Islands (Fig. 1a) are located approximately 500 km east of southern South America, between 51∘0.5′ to 52∘28.0′ S and 61∘22.0′ to 57∘40.5′ W. The cool-temperate (mean temperature for 1922–1988: January 9.4 ∘C and July 2.2 ∘C) climate of the Falkland Islands is driven by the cold Antarctic Circumpolar Current, the waters surrounding the Antarctic Peninsula, the Falklands Current, and the Andes of southern Patagonia to the west (Turner and Pendelbury, 2000). The persistent winds of the southwesterly wind belt average 8.5 m s−1 (30 km h−1), with gale force winds averaging 70 d yr−1, and annual precipitation generally ranges between 400 and 600 mm (Jones et al., 2013; Lister and Jones, 2015). Study sites were selected to reflect (1) climatic diversity and (2) the availability of volunteers to collect monthly samples for 1 year. We ultimately selected four sites (Fig. 1b–c): Bleaker Island, Cape Dolphin, Surf Bay, and West Point Island.
2.2 Precipitation, temperature and relative humidity
Precipitation was collected at each site using a Palmex monthly composite collection sampler (Palmex d.o.o., Zagreb, Croatia). The Palmex collector is designed to prevent evaporation and evaporative enrichment of 18O in precipitation samples without the use of paraffin oil (Gröning et al., 2012) and has been recommended by the Global Network of Isotopes in Precipitation (GNIP). δ18O and δD stable isotope ratios of water samples were measured at the University of Wyoming Stable Isotope Facility (UWSIF) using a high-temperature conversion elemental analyzer (TCEA) connected to a Thermo Scientific Delta V Plus that is run in continuous flow mode via a ConFlo IV. The technique used injections of 1 µL of water into the TCEA column filled with glassy carbon heated to 1420 ∘C. Precipitation samples were purified using cryogenic vacuum distillation (Ehleringer and Osmond, 1989) prior to TCEA analysis to remove aeolian debris, including marine salts. Internal quality assurance and quality control working standards working standards calibrated against IAEA international standards Vienna Standard Mean Ocean Water (VSMOW) and Standard Light Antarctic Precipitation (SLAP) and spanning the range of measured values in our study were analyzed with each batch of samples, with analytical precision typically better than 0.3 ‰ and 2.5 ‰ for δ18O and δD, respectively. Isotope values are reported with respect to VSMOW. Explanations of methods for daily average temperature and relative humidity measurements, as well as seasonal wind speed, wind direction, and back trajectory models to determine origins of air masses, are found in the Supplement Sect. 1.
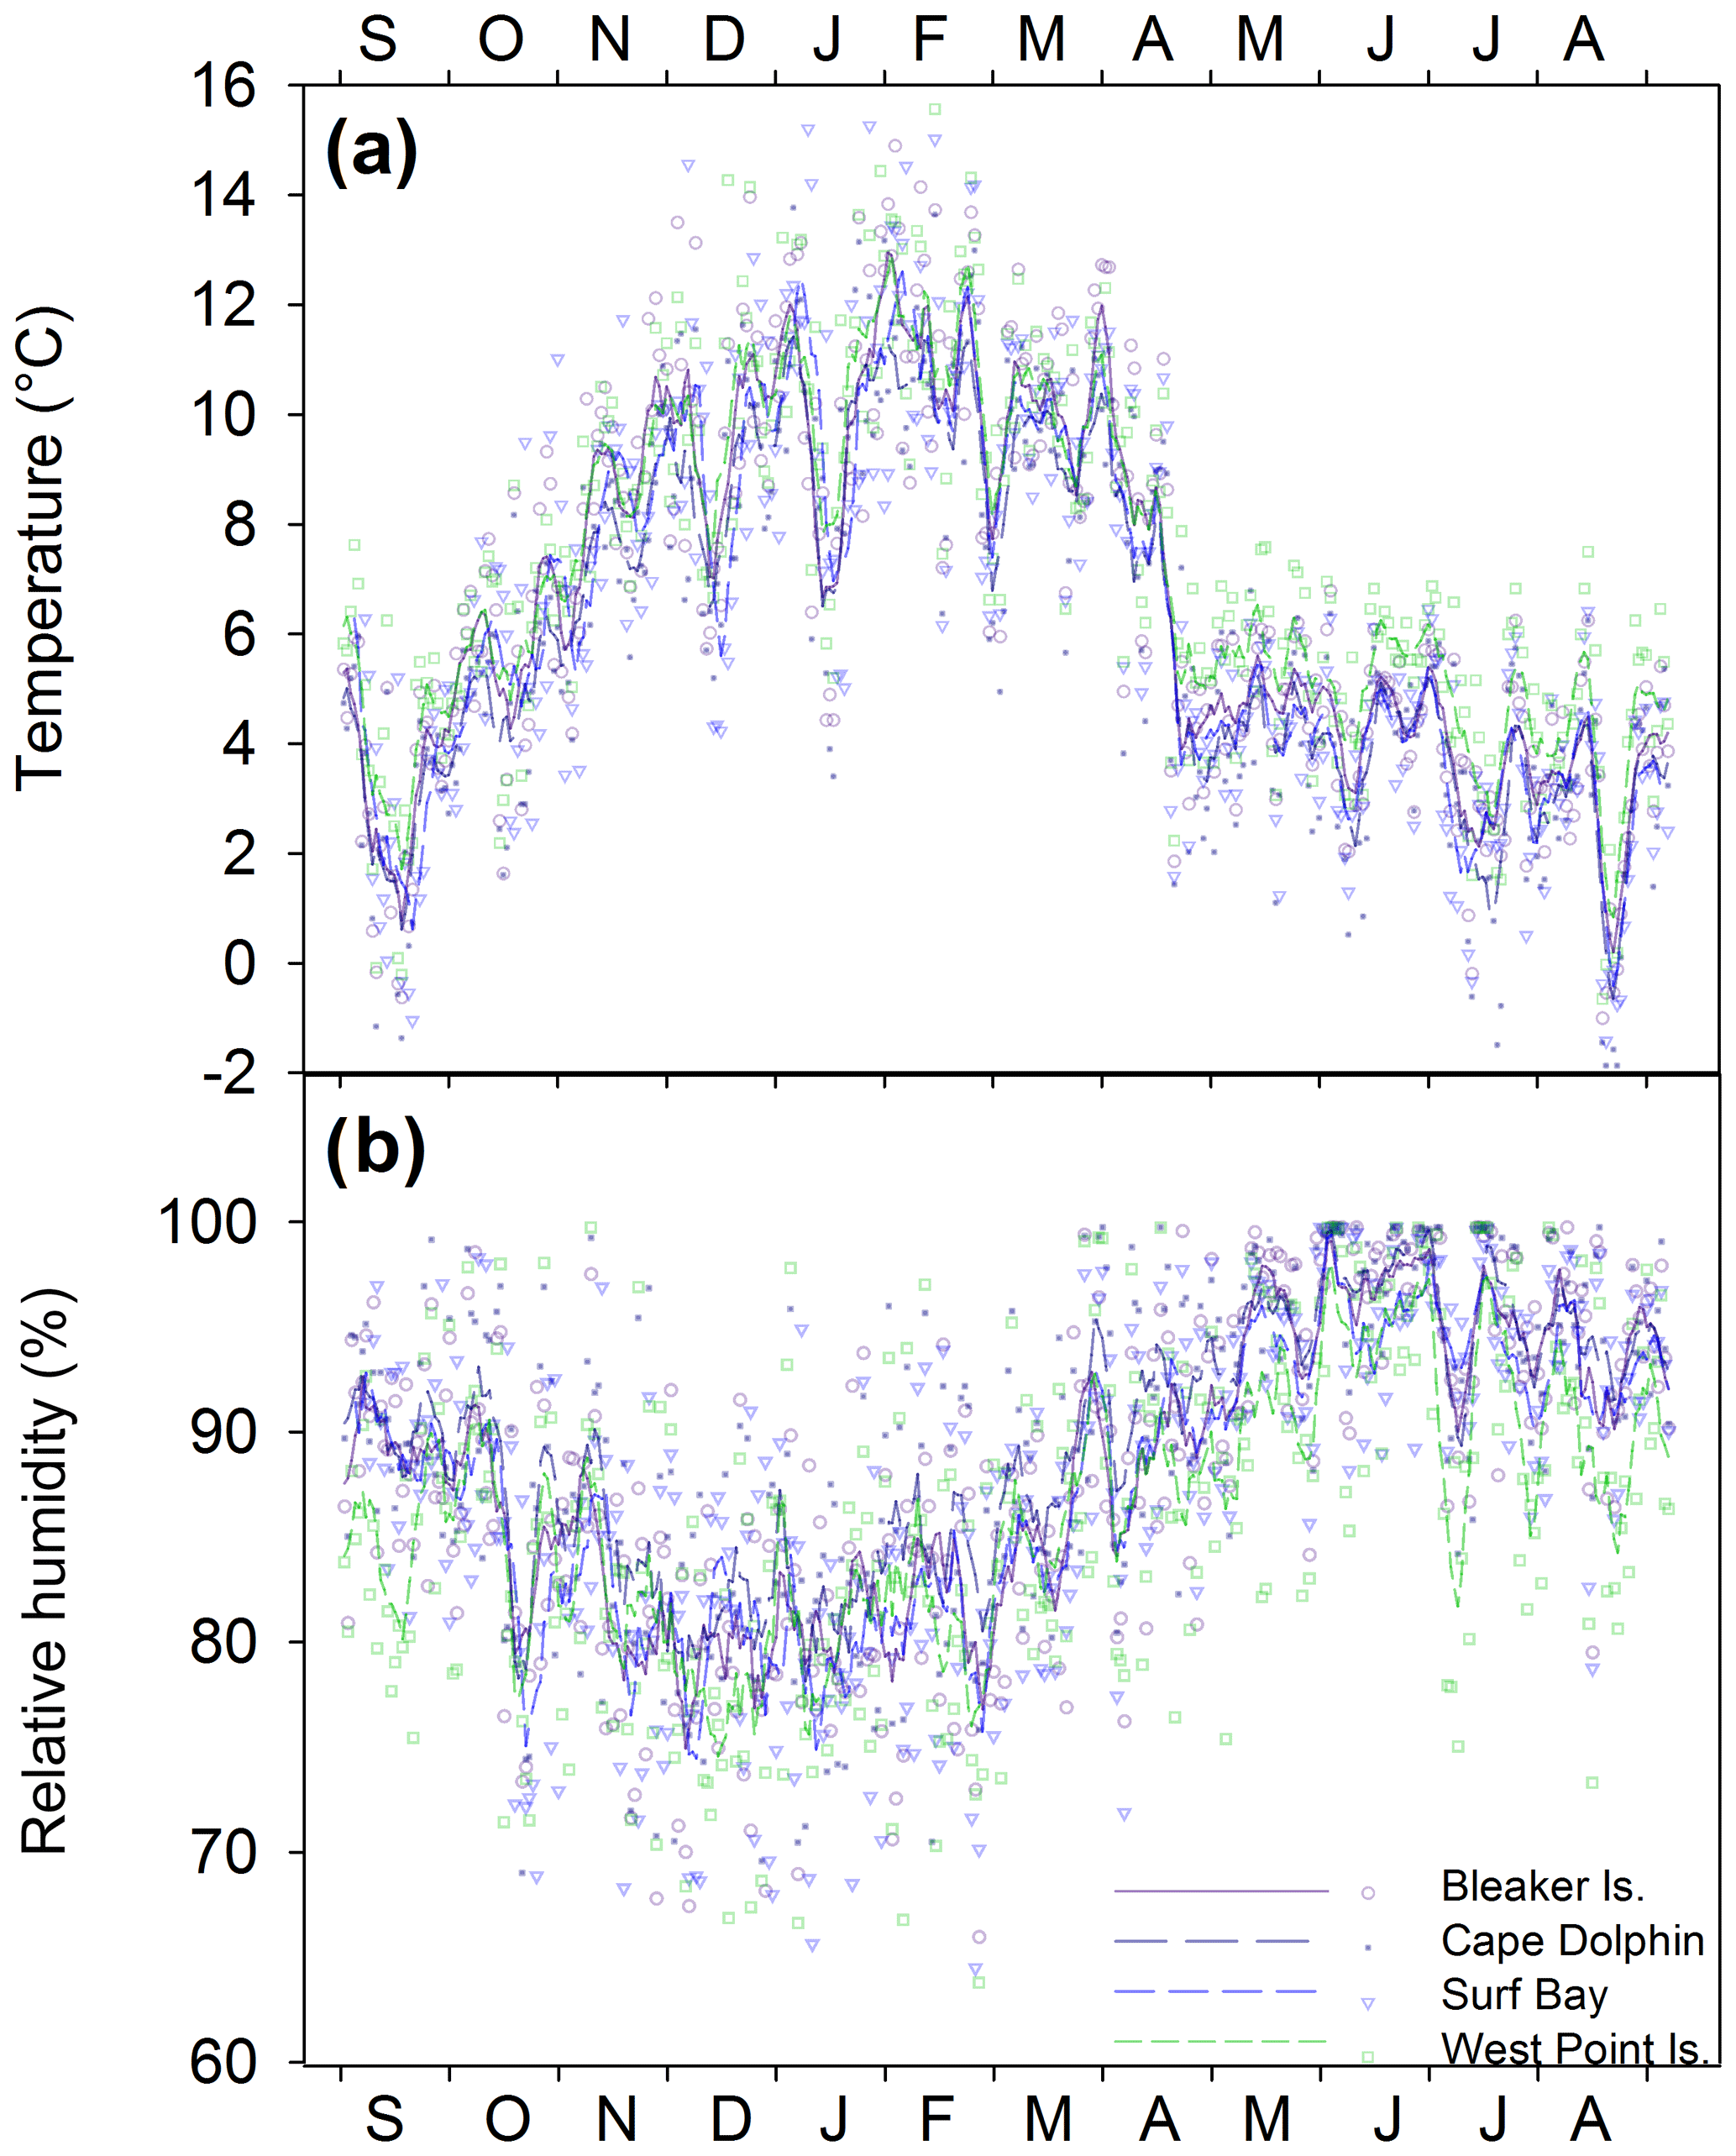
Figure 2(a) Daily average temperature (∘C) and (b) relative humidity (%) from September 2015–August 2016 at the four study locations calculated from 2 h measurements. The 7 d running averages of daily average temperature and relative humidity are indicated by the lines for each study location.
2.3 Poa flabellata field collection and cellulose extraction, and isotope analyses
Poa flabellata plants were collected at the start of each month at each site from October 2015 through September 2016, from relatively uniform habitats that were undisturbed by grazing or tilling. Up to six P. flabellata plant tillers (leaves, stem, and roots) were collected near each of the four stations each month. Whole plants were stored in paper envelopes stored in a cool, dark, dry location until frozen. Samples collected between September 2015 to February 2016 were frozen in February 2016 and samples collected in March 2016 to August–September 2016 were frozen in August–September 2016. Samples were frozen for 8 d at the Falkland Islands Department of Agriculture to comply with U.S. Department of Agriculture regulations for the prevention of the spread of pests. For leaf material, the inner developing (youngest) leaves were collected and assumed to represent the past month of growth. There was no indication that leaves were morphologically different between summer and winter. Only coarse roots were used; fine roots were excluded. Variation in environmental conditions during the growth of a leaf blade can lead to isotopic variations along the gradient of a single leaf as has been shown with δ18O of cellulose (Helliker and Ehleringer, 2000, 2002); therefore, whole-leaf plant samples were homogenized by drying at 50 ∘C and pulverizing using a Retsch ball mill at the University of Maine. For each sample, we used 20 mg of pulverized and homogenized leaf or root material for extraction and purification of α-cellulose, following an adapted procedure of Brendel et al. (2000). Samples were vortexed throughout extraction and purification for homogenization and were visually inspected for purity. Further indicators of purity include low amounts of nitrogen content (0.13 % to 0.16 % N) and analysis of carbon content (42.1 % to 42.8 % C) in cellulose. As an internal quality control, one leaf sample was selected for extraction and purification of α-cellulose throughout the sample processing in batches of 10 to 12 samples. The δ13C and δ18O of leaf cellulose for the internal quality control samples varied by <0.1 ‰ and 0.3 ‰, respectively.
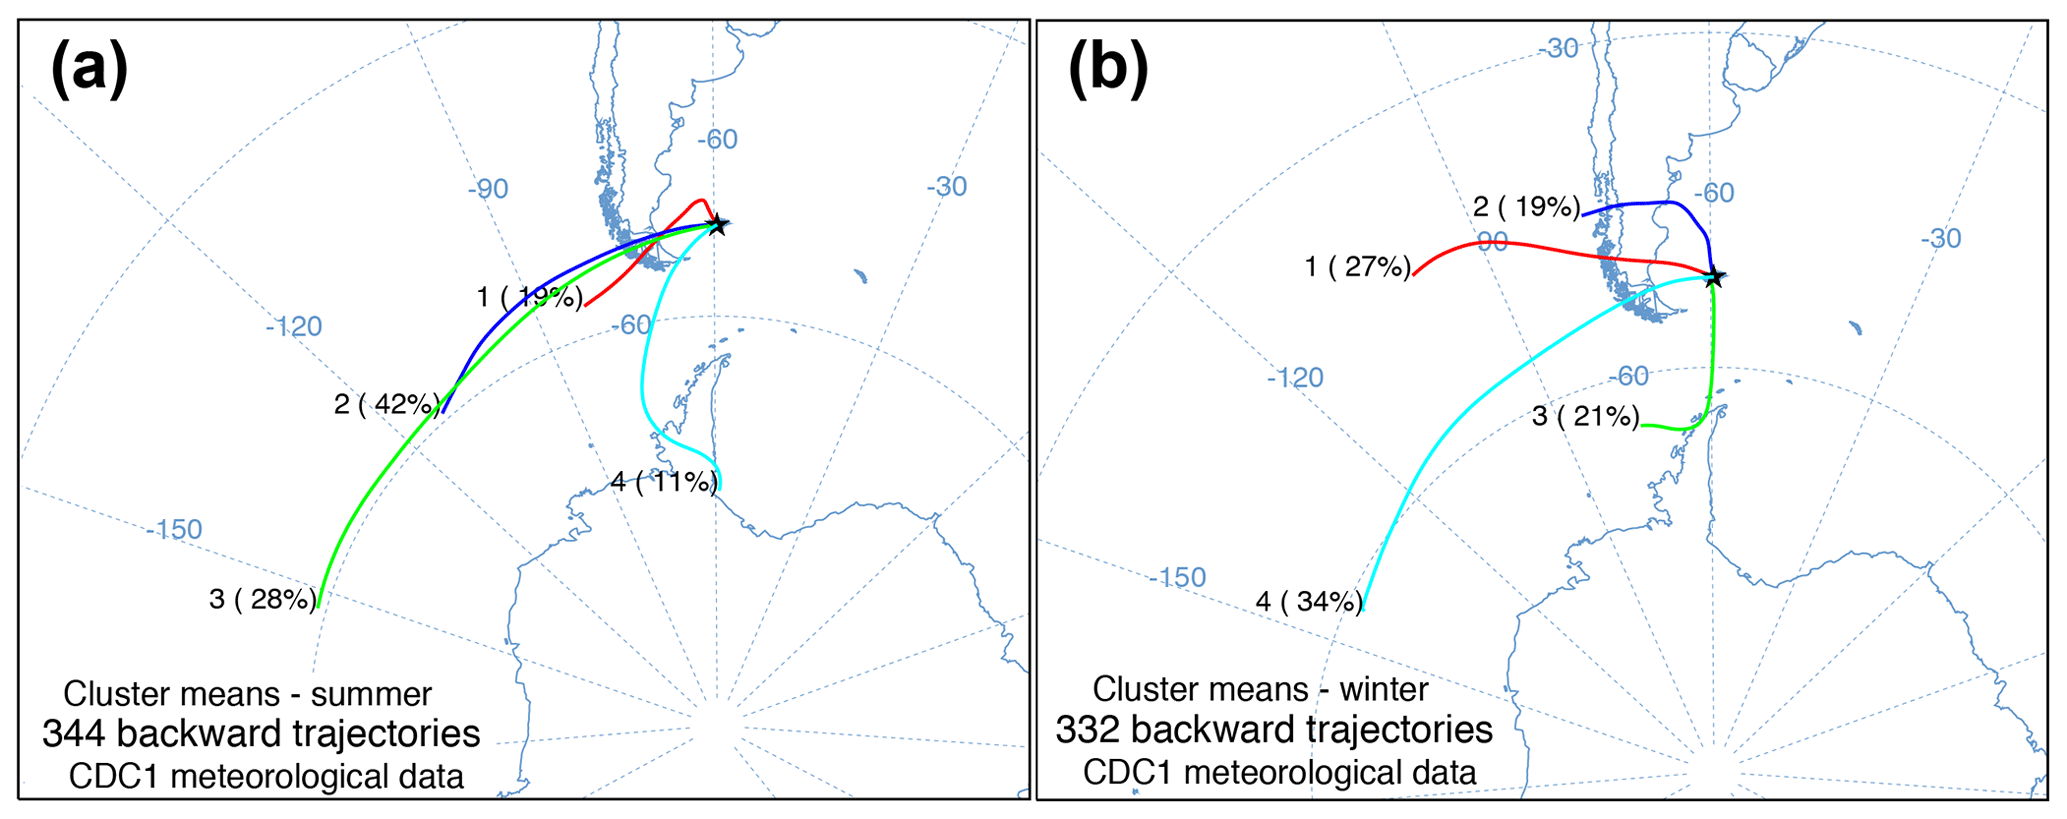
Figure 3HYSPLIT seasonal cluster means of daily 5 d back trajectories from (a) summer and (b) winter at 51.79∘ S, −59.52∘ W with the percentage of daily trajectories in each cluster and number of daily trajectories.
δ18O and δ13C stable isotope ratios of α-cellulose samples were measured at the UWSIF. Oxygen was analyzed using a TCEA coupled to a Thermo Delta V isotope ratio mass spectrometer (IRMS); δ18O values are expressed relative to VSMOW (Craig, 1961; Gonfiantini, 1978). Values were normalized to the VSMOW scale using USGS-42 (8.6 ‰ accepted value) and IAEA-601 cellulose (31.9 ‰ accepted value) quality control standard reference materials for oxygen isotopic composition. Analytical precision was ±0.3 ‰ for δ18O based on repeated analysis of internal standards, and samples loaded into silver capsules had weights ca. 0.25 mg. Carbon isotope composition of the cellulose samples were determined using a Costech 4010 Elemental Analyzer coupled to a Thermo Delta Plus XP-IRMS. Analytical precision was ±0.1 ‰ for δ13C based on repeated internal standards. Quality control standard reference material for carbon isotopic composition included USGS-40 glutamic acid (−28.3 ‰ accepted value), USGS-41 glutamic acid (24.4 ‰ accepted value), and internal UWSIF α-cellulose (−24.9 ‰ accepted value). Carbon samples weighed ca. 2 mg and were loaded into tin capsules.
2.4 Statistical analysis
For both δ18O and δ13C, we analyzed the average of three to four plant leaf samples per month for summer (DJF) and winter (JJA) at each of the four sites and the average of up to eight plant root samples. Because samples were collected at the start of each month, we define summer as the months of DJF and winter as the months JJA. We used Pearson's correlation coefficient (r) to detect associations between δ18O of cellulose and precipitation samples to test whether δ18O samples reflect the isotopic value of precipitation. Using Pearson's correlation coefficient, we tested for a relationship between δ13C and δ18O values of cellulose, temperature, and relative humidity. We tested for a significant difference between summer and winter δ18O and δD in precipitation using a t test (n=24). A separate one-way analysis of variance (ANOVA) to test for significant differences among sites included δ18O and δD in precipitation samples from the entire year (n=47).
A two-way ANOVA compared the main effects of season (summer vs. winter) and the four study locations on the δ18O and δ13C stable isotopes of α-cellulose of P. flabellata leaves and roots grown in the summer vs. winter, followed by a post hoc test (Tukey's multiple comparison of means). P values < 0.05 are considered significant. Descriptive and multivariate analyses were conducted with SigmaPlot 12.5.
3.1 Environmental measurements
Across all sites, summer daily average temperatures ranged from 3.5 ∘C to 15.6 ∘C (mean = 10.0 ∘C) and relative humidity ranged from 64.2 % to 98.1 % (mean = 81.1 %). Winter daily average temperatures ranged from −1.8 to 7.6 ∘C (mean = 3.7 ∘C), and relative humidity ranged from 73.6 % to 100 % (mean 94.3 %). Seasonal temperature (∘C) and relative humidity (%) minimum and maximum ranges for individual study locations are found in Table S1 in the Supplement. Between study locations, the daily average temperatures over the year (; p=0.813; Fig. 2a) and relative humidity were not significantly different (; p=0.573; Fig. 2b).
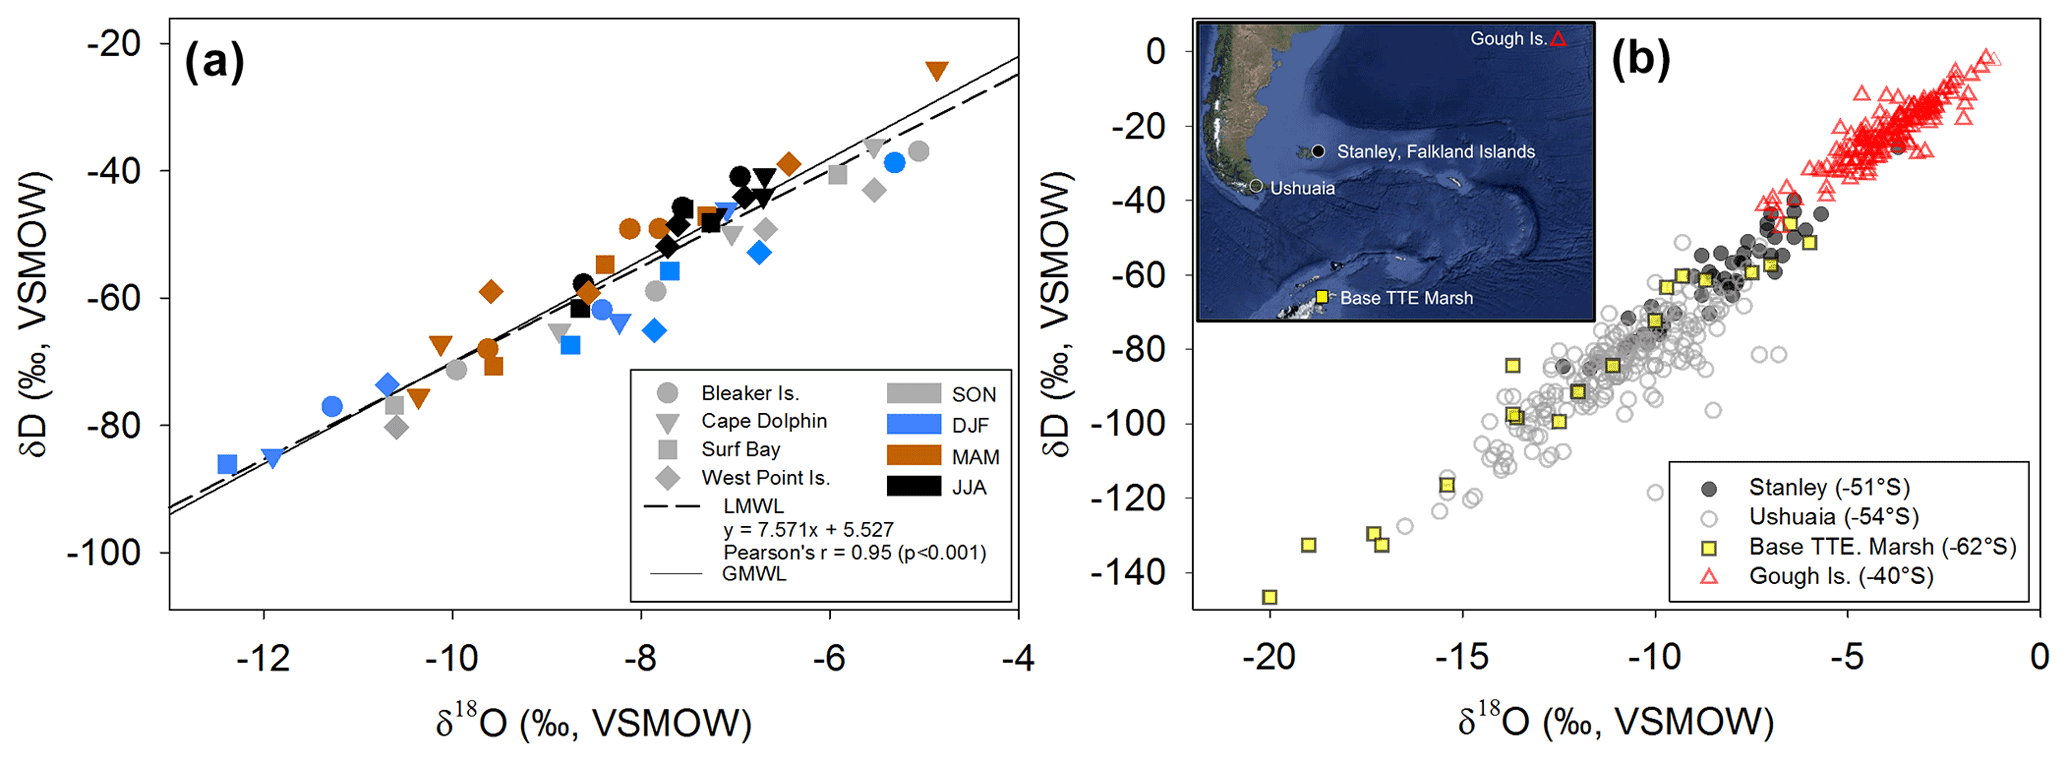
Figure 4(a) δ18O and δD (‰, VSMOW) isotopes in precipitation for each Falkland Islands location (symbol shape) during four seasons (symbol color). The constructed local meteoric water line (LMWL; ; r=0.95; p<0.001) is shown as a dashed line and global meteoric water line (GMWL: δD = 8.0 δ18O + 10) is a solid line. (b) Regional variation of δ18O and in δD in precipitation illustrating the variability in precipitation isotopes in the South Atlantic region. Corresponding locations of Global Network of Isotopes in Precipitation (GNIP) sites and potential sources of precipitation origin throughout the region over 30 years of data collection. Data from Stanley, Falkland Islands, spans from 1962 to 1979; Ushuaia, Argentina, from 1982 to 2002; Teniente Rodolfo Marsh Martin Base, Antarctica (Base TTE Marsh) from 1990 to 1991; and Gough Island from 1961 to 2009. Data were downloaded from GNIP at https://nucleus.iaea.org/wiser (last access: 3 September 2020). Map data: © 2018 Google, SIO, NOAA, U.S. Navy, NGA, and GEBCO.
3.2 Wind
The wind rose (Fig. 1d) shows that winter winds at Bleaker Island primarily blew from the west and northwest. In winter, two spokes in the west and north-northwest direction comprise >30 % of the total recorded 15 min wind directions. In summer, three spokes in the west, west-southwest, and southwest directions comprise >45 % of all 15 min wind directions. The wind rarely blew from the east, southeast, or north. Examining winds from the west in winter, >10 % of wind speeds recorded were between 5 and 10 m s−1 (18 and 36 km h−1), and the frequency of strongest winds came from the north-northeast. In summer, >20 % winds from the southwest were between 5 and 10 m s−1, and there was a higher frequency of 10 to 15 m s−1 (36 to 54 km h−1) wind speeds than in winter. Seasonal wind variation deviated from the long-term average (1979–2015). Reanalysis data (ERA-Interim; Fig. S2) indicated that the wind speeds during summer (DJF, 2015 to 2016) were stronger over the Falkland Islands (5 to 6 m s−1 or 18 to 21 km h−1) and weaker during winter (JJA, 2016).
3.3 Seasonal HYSPLIT air mass trajectory analyses
The daily back trajectory HYSPLIT analysis indicated that during the summer 89 % of the air masses originated (n=344 individual trajectories) west of the Falkland Islands. Approximately 11 % of summer air masses originated south of the Falkland Islands near the Antarctic Peninsula. In winter, 79 % of the air mass back trajectories (n=332 individual trajectories) were from the west, northwest, and southwest, while 21 % of air masses had backward trajectories south of the Falkland Islands near the Antarctic Peninsula (Fig. 3).
3.4 Monthly composite precipitation, δ18O and δD
Each study location had n=12 samples over the year, except for Surf Bay (n=11), which was not sampled in September 2015 (thus October 2015 represents September and October 2015). Monthly composite δ18O and δD isotopes in precipitation throughout the year ranged from −12.3 ‰ to −4.8 ‰ and from −86 ‰ to −23 ‰, respectively. Monthly composite precipitation at each location was used to construct a local meteoric water line using δ18O and δD isotopes (; n=47; Fig. 4a). The range for winter δ18O and δD was from −8.6 ‰ to −6.6 ‰ and −61 ‰ to −40 ‰, respectively. Summer values of δ18O and δD in precipitation ranged from −12.3 ‰ to −5.3 ‰ and −86 ‰ to −38 ‰, respectively, and fit within the range of historical isotopes in precipitation from the Falkland Islands (GNIP; Fig. 4b). Summer and winter δ18O and δD isotopes in precipitation (n=24) passed tests for normality (Shapiro–Wilk, p=0.297 and p=0.614, respectively) and failed tests for equal variance (Fisher's F test, p<0.05). A Mann–Whitney Rank Sum test indicated that the δ18O isotopes in precipitation were not different for summer (median = −8.3 ‰) and winter (median = −7.4 ‰; U=39; p=0.061). For δD, the summer had a significantly lower median value (median = −64.3 ‰) than winter (median = −46.5 ‰; U=22; p=0.004). A one-way ANOVA found no significant difference among sites in δ18O (; p=0.809) or δD isotopes (; p=0.785) in precipitation when samples from all months and sites were included (n=47).
3.5 δ13C and δ18O of α-cellulose – temperature, humidity, precipitation
Across all sites, measurements of monthly average leaf δ18O and δ13C values for α-cellulose extracted from leaf tissues (hereafter, δ18Oleaf and δ13Cleaf) had a strong positive correlation (Pearson's r=0.877; p<0.001; n=24; Fig. 5) and segregation between winter and summer values (p<0.001). The δ18Oleaf or δ18Oroot did not correlate with δ18O in precipitation across all sites (Table 1).
Table 1Correlation coefficients (Pearson's r) of δ18O and δ13C in leaf and root cellulose between δ18O in monthly composite precipitation, monthly average temperature, and humidity by site.
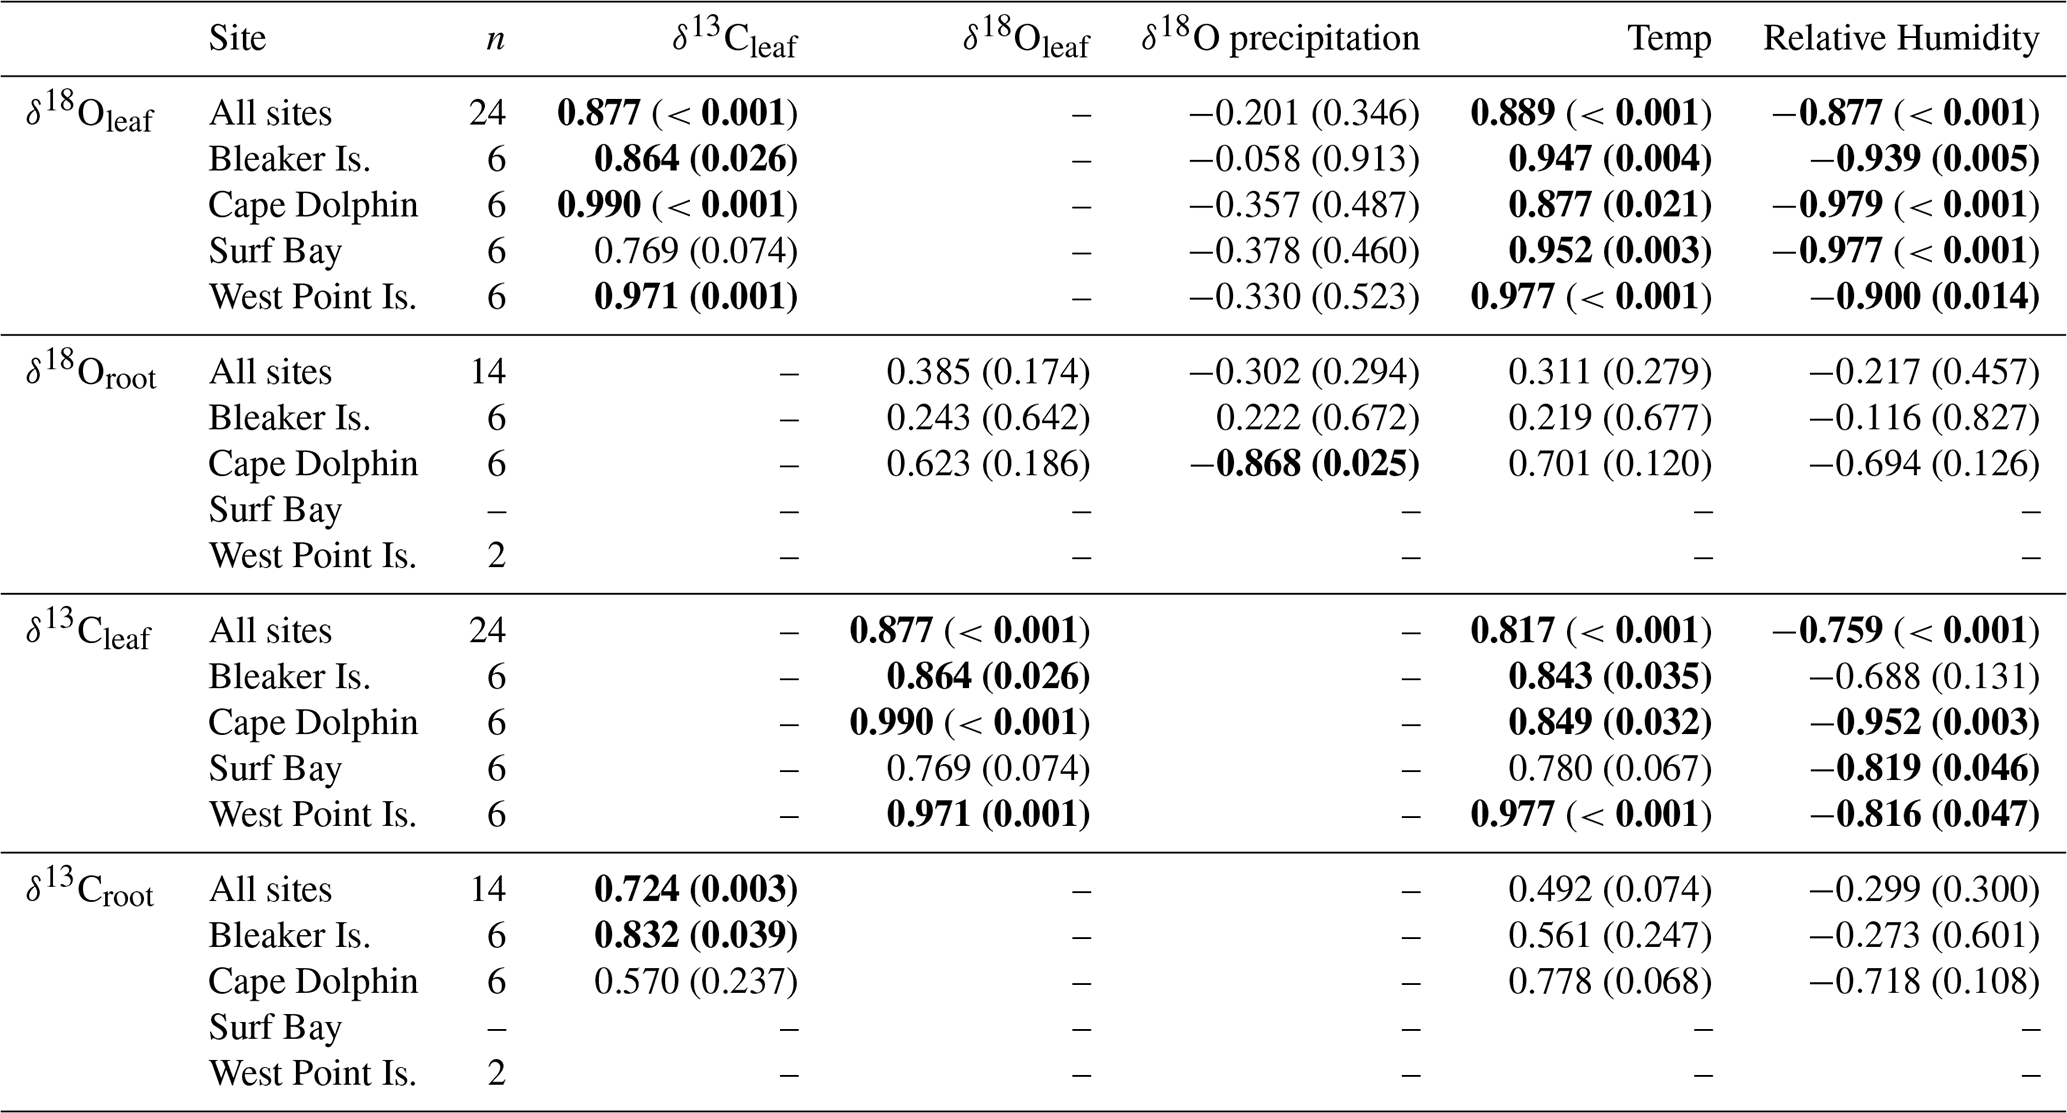
Bold values indicate significant correlations >0.600 Pearson's r. Significance level is p<0.05.
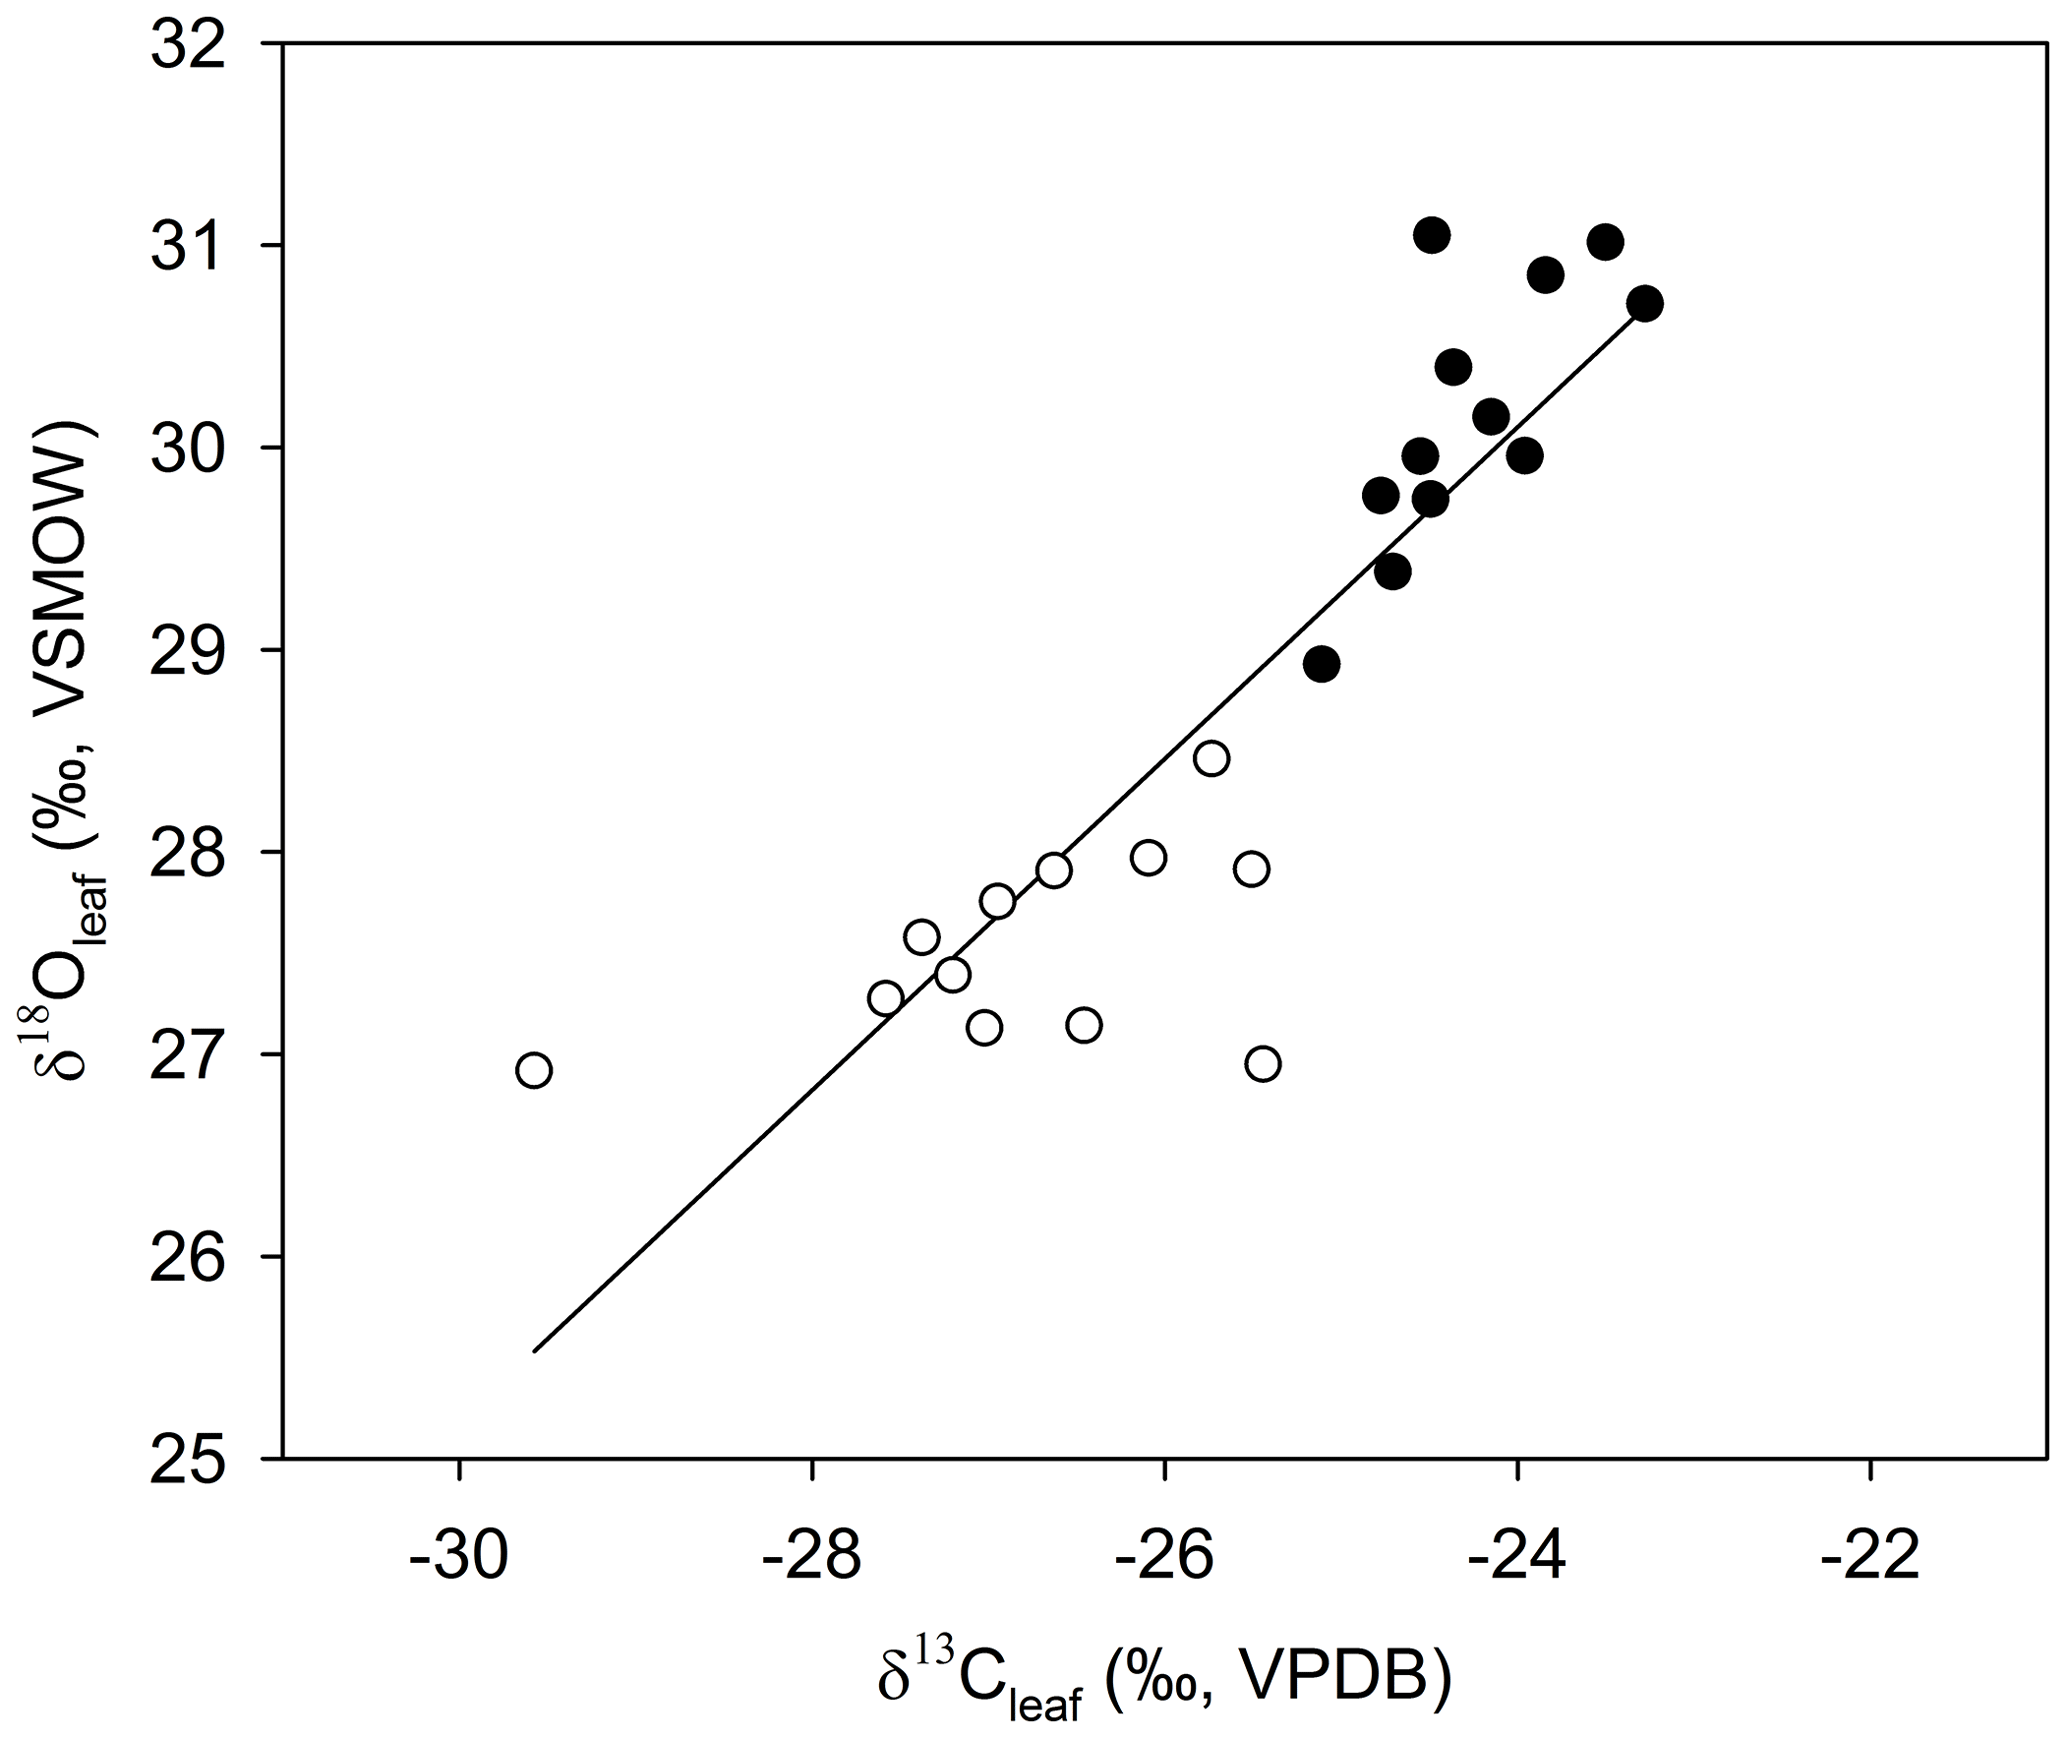
Figure 5The relationship between average δ13Cleaf and δ18Oleaf (Pearson's correlation coefficient; r=0.877; p<0.001; n=24). Open circles are average values for samples collected in winter, solid circles represent the average values in summer.
δ18Oleaf and δ13Cleaf values passed tests for normality (Shapiro–Wilk, p=0.173 and p=0.385, respectively) and equal variance (Fisher's F test, p=0.865 and p=0.196, respectively). Thus, a two-way analysis of variance was conducted to detect the influence of independent variables (season and study location) on both δ18Oleaf and δ13Cleaf. Season included two levels (summer and winter) and study location consisted of four levels (Bleaker Island, Cape Dolphin, Surf Bay, and West Point Island). Analysis of combined winter and summer δ18Oleaf had a mean of 28.9±1.3 ‰ (SD) and ranged from 26.3 ‰ to 31.8 ‰ (range of 5.4 ‰; Table S2). The effect of season was significant (, p<0.001) with a 2.6 ‰ difference between summer (mean = 30.1±0.8 ‰ SD) and winter (mean = 27.5±0.6 ‰ SD; Fig. 6; Table S2). The effect of study location was also significant (, p=0.014) in δ18Oleaf among study locations. Pairwise multiple comparison (Tukey's post hoc test) of study locations indicated that Surf Bay is significantly more depleted in 18Oleaf than Cape Dolphin (p=0.016) and Bleaker Island (p=0.029; Fig. 6). No significant interaction was observed (p=0.552). The mean of combined winter and summer δ13Cleaf value was ‰ (SD), ranging from −30.4 ‰ to −21.9 ‰ (range = 8.4 ‰; Table S2). For δ13Cleaf, there was a significant difference between seasonal values (F ratio of , p<0.001) in summer (mean = ‰ SD) and winter (mean = ‰ SD; Fig. 6; Table S2). Study location (p=0.861; Fig. 6b and d) and the interaction effect (p=0.638) were not significant. The mean δ13C in root α-cellulose (hereafter, δ13Croot; n=14) for summer was ‰ SD and ‰ SD in winter (Table S2). After δ13Croot data passed tests for normality (Shapiro–Wilk test; p=0.085) but not equal variance (p<0.05), the two-way ANOVA indicated that for δ13Croot, the effects for season (p=0.201) and study location (p=0.521) were not statistically significant. The interaction effect was not significant (p=0.886).
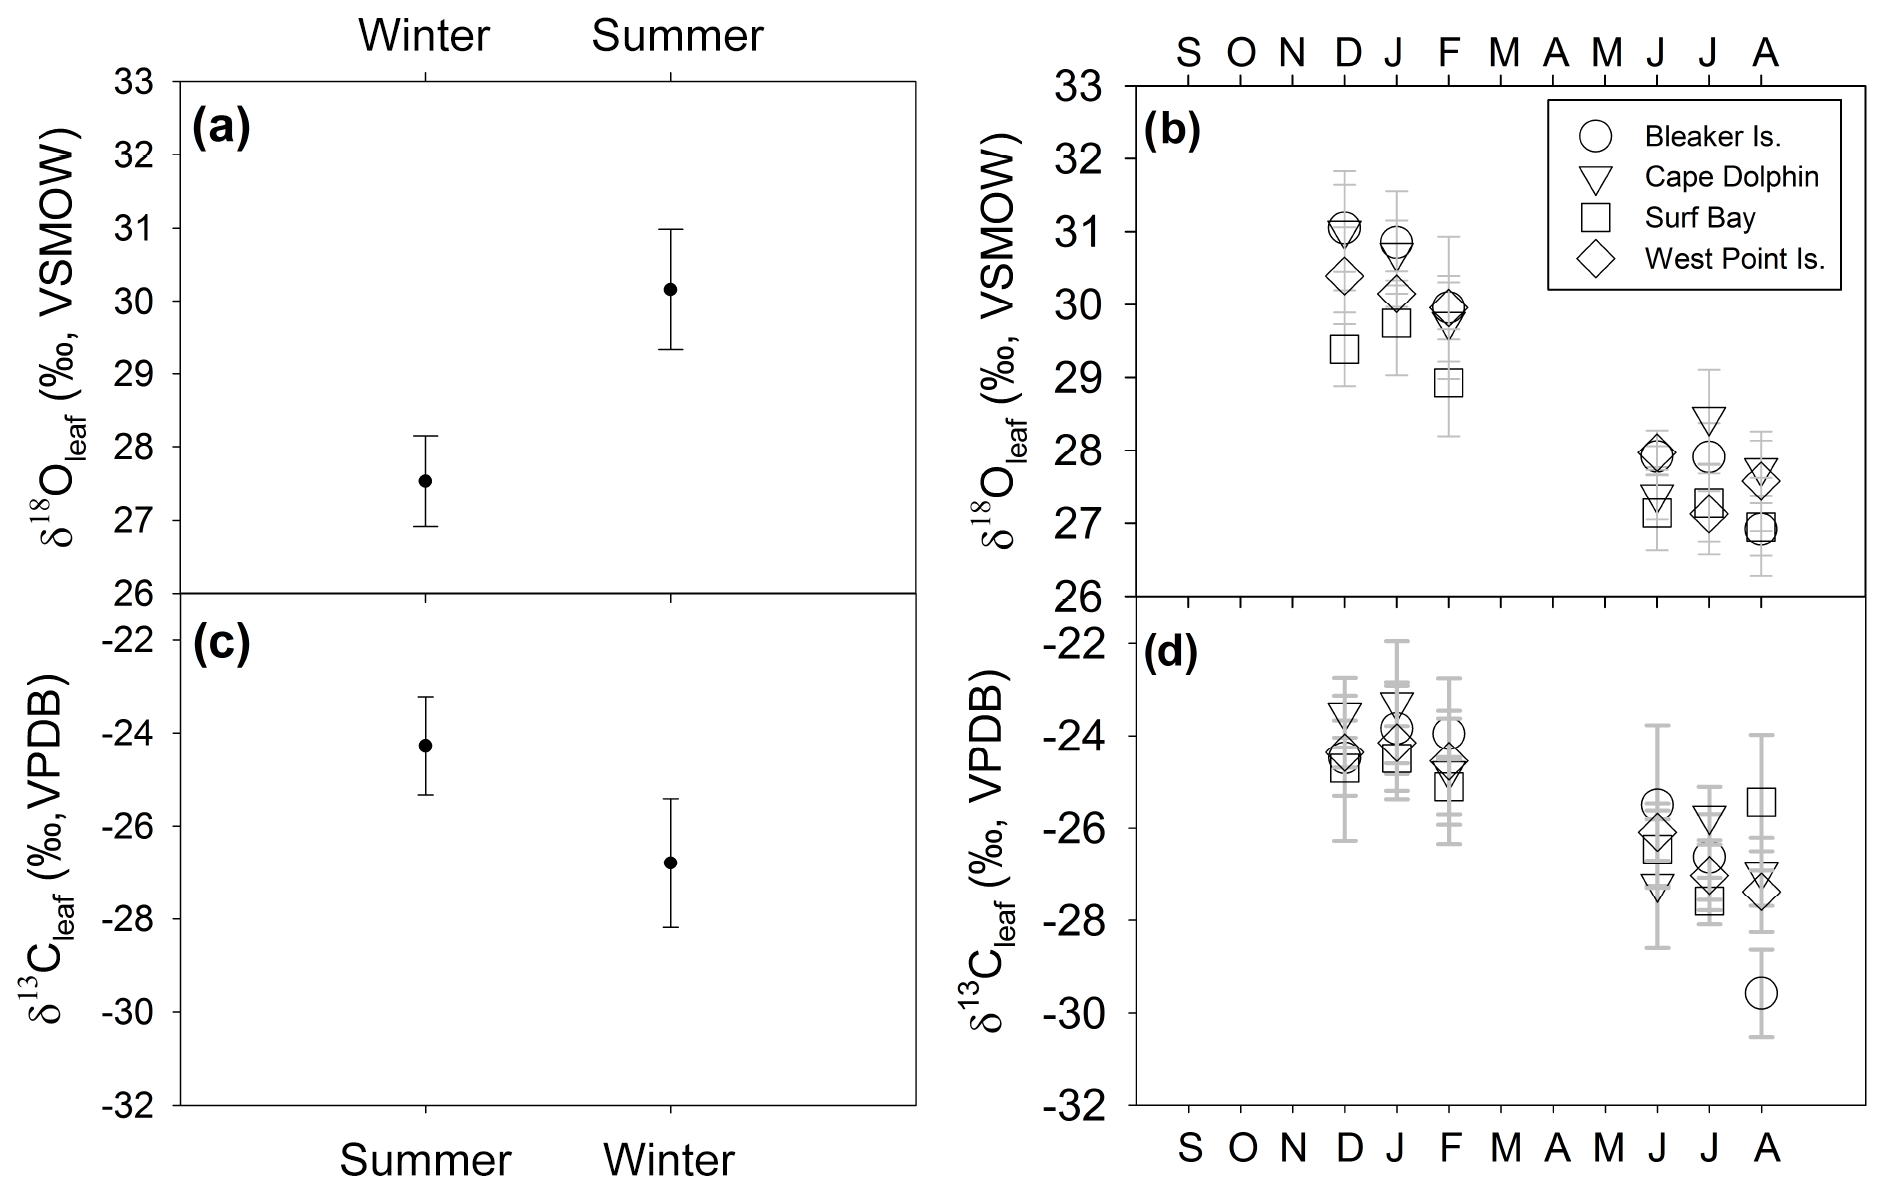
Figure 6δ13Cleaf and δ18Oleaf of Poa flabellata. (a) δ18Oleaf (‰) comparison (mean ± 1 SD) between summer (DJF) and winter (JJA) and (b) at four study sites over 1 year. (c) δ13Cleaf (‰) comparison (mean ± 1 SD) between summer and winter and (d) at four study locations over 1 year.
The mean δ18O in root α-cellulose (hereafter δ18Oroot; n=14) for summer was 28.8±1.04 ‰ (SD) and 28.3±0.5 ‰ (SD) for winter (Table S2). The δ18Oroot data passed tests for normality (Shapiro–Wilk test; p=0.483) and equal variance (Fisher's F test; p=0.897); the two-way ANOVA indicated that for δ18Oroot, the location effect was statistically significant while season was not. The difference in mean values among seasons (, p=0.049) and study location (, p=0.010) were statistically significant. Pairwise multiple comparison (Tukey's post hoc test) of study locations indicated that Cape Dolphin was significantly greater than Bleaker Island (p=0.012) and West Point Island (p=0.049). The interaction effect was not significant (p=0.397).
Significant inter-seasonal differences in δ13Cleaf and δ18Oleaf indicate that P. flabellata tissues record high-resolution patterns of environmental change, supporting the use of P. flabellata peat records as a paleoenvironmental proxy. Ferrio and Voltas (2005) established a positive correlation between δ13Cleaf and the vapor pressure deficit, suggesting stomatal conductance is sensitive to atmospheric moisture conditions. The observed positive correlation between δ13Cleaf and temperature suggests higher temperatures led to an increased assimilation rate and reduced discrimination against δ13C, as shown in other vascular plant studies (Ferrio and Voltas, 2005; Ménot and Burns, 2001). Variation in δ13Cleaf is driven by changes in the ratio of CO2 partial pressure in the leaf and that of the ambient air and can be explained by a greater influence of either stomatal conductance or increased photosynthetic capacity (Scheidegger et al., 2000). As plant stomata close in response to low humidity and/or high evaporative conditions like high wind speeds in the Falkland Islands, the internal partial pressure of CO2 decreases and the δ13Cleaf increases (Farquhar et al., 1982, p. 198).
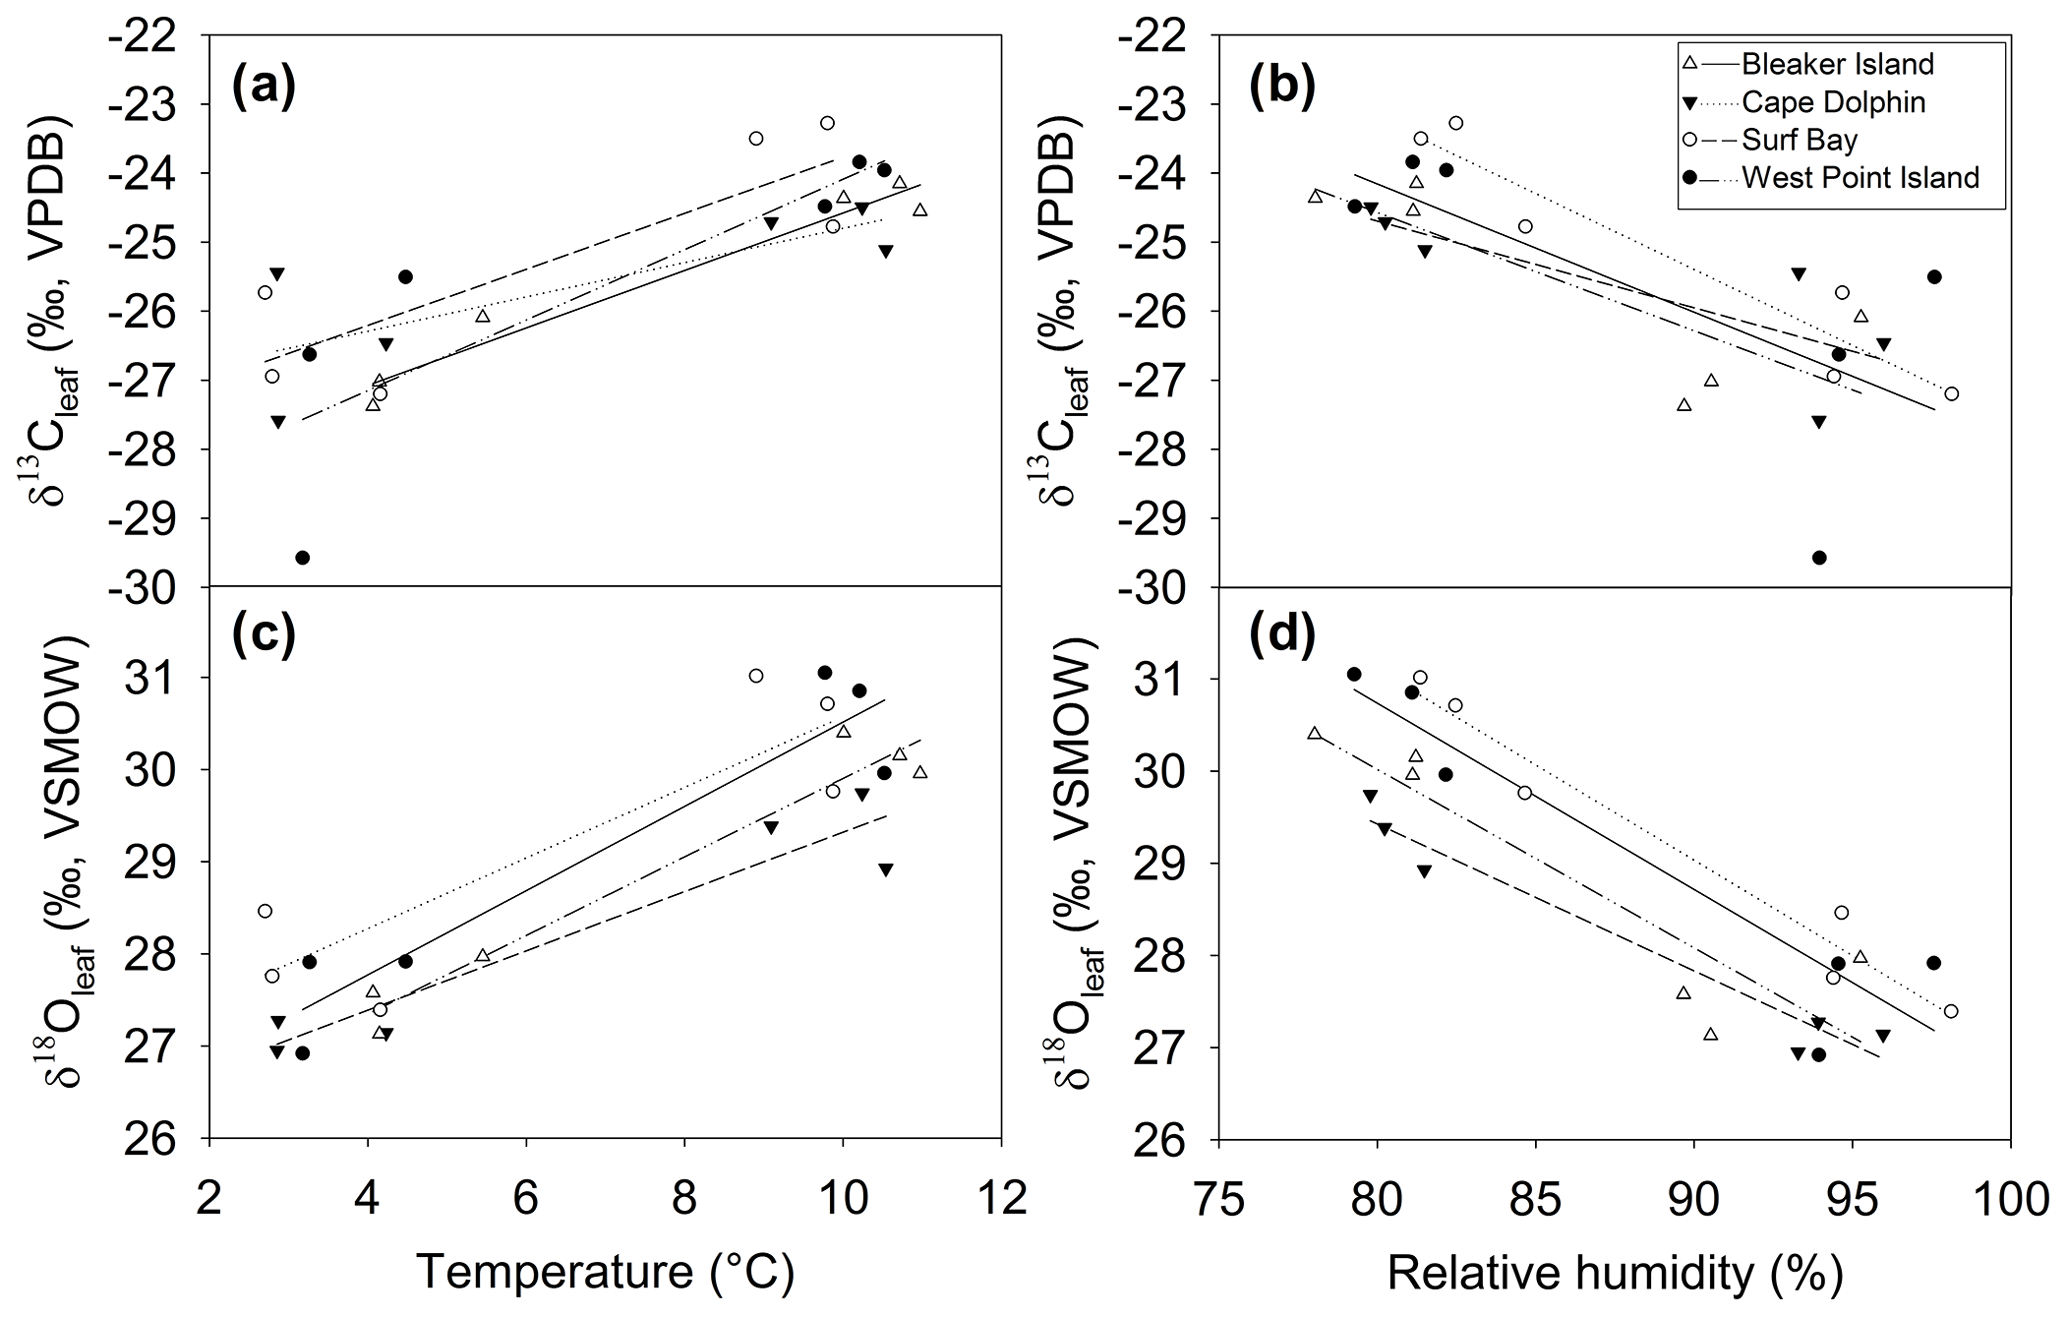
Figure 7Relationship between δ13Cleaf and δ18Oleaf and temperature and relative humidity during winter and summer at four sites. Relationship between δ13Cleaf, (a) temperature, and (b) humidity. Relationship between δ18Oleaf, (c) temperature, and (d) humidity. See Table 1 for Pearson's r and p values corresponding to correlations for each site.
The δ18Oleaf is influenced by soil water, leaf water enrichment of 18O from transpiration, and biochemical fractionations. Leaf water enrichment of 18O due to transpiration, which is reflected in δ18Oleaf (Deniro and Epstein, 1979; Roden and Ehleringer, 1999; Sternberg et al., 1986, p.198; Yakir, 1992), depends on relative humidity (Helliker and Ehleringer, 2002). However, the relationship between relative humidity and δ18Oleaf deteriorated at relative humidity > 90 % in one C3 species (Helliker and Ehleringer, 2002). Diffusion limitation by stomatal resistance is primarily driven by relative humidity (White et al., 1994). The δ18Oleaf and relative humidity (>60 %) were negatively correlated, which is consistent with other studies showing that δ18Oleaf increases as relative humidity decreases (Barbraud et al., 2012; Helliker and Ehleringer, 2002). At high relative humidity the leaf will more strongly record variation in the isotopic composition of atmospheric vapor, however we have no direct measurements of δ18O in water vapor.
Previous work on leaf water and cellulose in grasses demonstrated that the atmospheric leaf vapor conditions are a strong predictor of δ18Oleaf (Helliker and Ehleringer, 2002; Lehmann et al., 2018). The δ18O of the leaf water is captured in the cellulose isotopes and can reflect the effect of changing environmental conditions during the growth of the leaf (Helliker and Ehleringer, 2002; Lehmann et al., 2017). The δ18Oleaf can also depend on physiological effects, the type of plant anatomical feature used, and stage of development (Lehmann et al., 2017; Liu et al., 2017). Because cellulose records environmental variation along a gradient during leaf growth, we collected and homogenized whole leaves to avoid the complications of δ18O enrichment (Helliker and Ehleringer, 2002). Our work supports the finding that atmospheric leaf vapor conditions are reflected in δ18Oleaf and expands the use of such paleoclimate proxies to peat-forming tussock grasses, which opens up new possibilities for reconstructing paleoclimates across the South Atlantic and beyond. At the higher relative humidity range, the δ18Oleaf is more of a reflection of source water, while the δ18Oleaf at low humidity differed greatly from source waters because of evaporative enrichment of 18O.
The positive correlation between δ13Cleaf and δ18Oleaf (Pearson's r=0.88; p<0.001; n=24; Table 1; Fig. 5) suggests that stomatal conductance is the driving force acting on these two proxies, which is a likely scenario when water is not limiting (Saurer et al., 1997; Scheidegger et al., 2000). According to the Scheidegger et al. (2000) model, the decline in stomatal conductance was much more strongly expressed than photosynthetic capacity (maximum net photosynthesis). When air humidity increases, stomatal conductance is assumed to increase. In our study, stomatal conductance is likely driving both δ13Cleaf and δ18Oleaf due to relative humidity (Fig. 7). This pattern fits well with the Barbour and Farquhar (2000) model. Measurements of relative humidity allowed us to determine that stomatal conductance was more influential as a possible cause of change in partial pressure of CO2 within the leaf.
In the Falkland Islands, precipitation amount is not highly seasonal but tends to vary the most in the summer (Fig. S3; data from Jones et al., 2013). Over the year of our study, summer δ18O in precipitation varied more than winter δ18O and tended to be more depleted. This is supported by the wind rose from Bleaker Island, which indicated prevailing winds from the southwest (Fig. 1d). In winter, precipitation tended to be more enriched in 18O, and most prevailing winds came from the west and northwest, where 18O in equatorward precipitation would be more enriched than 18O in high-latitude meteoric sources (Fig. 4b). The significant negative correlation between δ18O in precipitation and δ18Oroot at Cape Dolphin (Pearson's r=0.868; p=0.025; n=6; Table 1) is consistent with the latitudinal origin of storm tracks (Fig. 3) and seasonal wind data (Fig. 1d). The pattern found at Bleaker Island is less clear and warrants further investigation.
The observed lack of correlations between δ18Oleaf and δ18O values of precipitation (Table 1) demonstrate the overriding influence of humidity on patterns of leaf water δ18O. An alternative explanation for a lack of correlation is that our precipitation sampling density was not sufficient to establish a relationship between δ18Oleaf and precipitation δ18O. Although P. flabellata produces new leaves throughout the year, the growth rate of leaves may not be in sync with shorter precipitation sampling intervals (less than monthly composite precipitation). Examination of leaf water post-precipitation events would improve our understanding of δ18Oleaf.
The observed relationship between δ18O in precipitation and δ18Oroot appeared to be less clear in part due to low sample number from only three study locations (Bleaker Island, Cape Dolphin, and West Point Island). At Bleaker Island, there was no correlation between δ18O in precipitation and δ18Oroot, while Cape Dolphin had a strong negative correlation (Table 1). At Cape Dolphin, the greatest enrichment of 18Oroot occurred in summer when δ18O precipitation was relatively low. In contrast, at Cape Dolphin δ18Oroot was lowest during the winter months when δ18O of precipitation was high. Despite the strong relationship between δ18O precipitation and δ18Oroot at Cape Dolphin, we propose that P. flabellata peatlands may not be ombrotrophic and may potentially source water from fog, sea-spray, groundwater, or a mix. However, the relationship found at Cape Dolphin warrants further analysis of δ18Oroot and source waters. We also consider that the δ18Oroot records a signal of leaf humidity and is influenced by source water and humidity effects on leaves; sugars produced in leaves are transported to roots to form cellulose, and about half of the oxygen atoms in root cellulose originate from the leaf water signal. Roots of P. flabellata may have represented greater temporal integration of δ18O from precipitation into cellulose due to difficulty in distinguishing new growth in roots, like Empodisma in New Zealand (Amesbury et al., 2015).
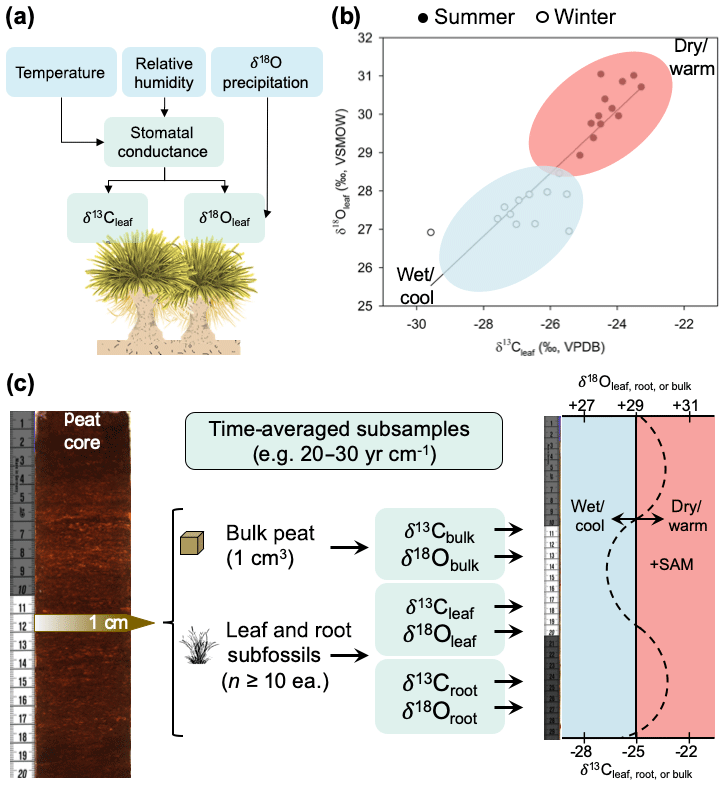
Figure 8(a) Conceptual model of how climate variation influences biomass δ13C and δ18O values in P. flabellata through effects on stomatal conductance and δ 18O of precipitation. (b) Seasonal shifts in leaf δ13C and δ18O, with open circles representing winter (cool and wet conditions) and closed circles representing summer (warm and dry conditions). (c) Diagram of a proposed paleoclimate reconstruction workflow and interpretation of time-averaged (interannual) measurements of δ13C and δ18O in peat macrofossils.
We did not find a relationship between δ18O in precipitation and the δ18Oleaf in our 1-year study. It may be that because the δ18O in leaf water is controlled by source water and humidity, any changes in humidity confound a direct relationship between source water δ18O values and δ18O of leaf water and δ18Oleaf. Still, the δ18O in plant water pools and δ18Oleaf are primarily influenced by δ18O in precipitation. It may also be possible that the variation in source area did not affect the δ18O enough for us to detect a significant impact on the δ18Oleaf. Based on this work, the source area could influence δ18Oleaf in peat records if source area changes were greater than what we observed. Without experimentation we can not disentangle temperature and humidity using δ13C and δ18O; further work is needed to understand the relationship between δ18Oroot, δ18O of precipitation, and that of root and leaf waters. Identifying sources of potential water would also add value, especially considering anecdotes of local differences in fog in the Falkland Islands, which may be an unappreciated source of water for P. flabellata. Across the geographic range in the South Atlantic, P. flabellata may record a larger latitudinal gradient of isotopes in precipitation, as well as temperature and humidity, than is recorded in the Falkland Islands.
Despite this limitation, establishing the seasonal patterns recorded by P. flabellata cellulose in the Falkland Islands does enable us to test paleoclimate hypotheses regarding the climate dynamics in the South Atlantic (e.g., Turney et al., 2016) and Southern Hemisphere westerly wind behavior within the regions where P. flabellata occurs. As with any paleoenvironmental reconstruction, inferences are constrained by the temporal grain and resolution (Jackson, 2012). While P. flabellata is sensitive to inter-seasonal differences and forms highly productive peat records, we stress that paleoclimate reconstructions from P. flabellata peats will represent an integrated signal of broader climate trends and not annual-scale or seasonal records. Our calibration study is based on a modern snapshot of environmental conditions influencing δ13Cleaf and δ18Oleaf values in P. flabellata, so investigators conducting downcore peat reconstructions using δ18Oleaf must consider that changes in δ18Oleaf are modified by precipitation source and changes in humidity through effects on stomatal conductance. We recommend measuring δ13Cleaf and δ18Oleaf of subsamples with comparable time-averaging (leaf, root, bulk subfossils; Fig. 8) by incorporating a large sampling of multiple leaf fragments (n≥10) from each horizon (e.g., 1 cm intervals) and to interpret this signal to integrate multiple years (as determined by the sediment accumulation rate; Fig. 8). Time-averaging within a given 1 cm horizon of even highly productive peat records with sedimentation rates ∼20 to 30 yr cm−1 would be greater than the age of an individual tussac leaf.
Peat-based reconstructions may be limited to identifying periods of warm and dry or cold and wet conditions that are similar to (or more extreme than) the observed seasonal variations we report here. Thus, we believe that δ13Cleaf and δ18Oleaf time-averaged values can reliably be used to identify the timing of transitions between warmer and drier conditions to colder and wetter conditions that correlate with major hemispheric drivers in climate. Resolving temperature and moisture signals independently would likely require growth chamber or warming experiments, which was beyond the scope of this study, but which could help develop this proxy further. For now, this proxy remains a qualitative indicator, though it has potential to become a quantitative reconstruction if evaluated via experimentation or in tandem with other plant or microbial biomarkers.
The scarcity of terrestrial paleoclimate records in the South Atlantic has limited our understanding of past and future climate change and its impacts on ecosystems and people. We found that δ13C and δ18O stable isotope values in P. flabellata tissues are correlated with seasonal differences in temperature and moisture, providing a promising new avenue for paleoclimate reconstructions in the South Atlantic. P. flabellata peats have high accumulation rates, contain abundant leaves, and date back at least 12 500 14C years, with the potential to provide decadal-scale records of temperature, precipitation, and moisture source. Future work is needed to determine whether δ18O and δ13C of cellulose from P. flabellata macrofossils complement other regional proxies for changes in atmospheric temperature and relative humidity during the Holocene. Troublingly, these coastal peatlands are currently threatened by sea level rise and overgrazing, and their reduction means we are losing vital information about past environments in a time when paleoclimate records are needed to provide context for modern climate change in the South Atlantic.
Datasets for monthly stable isotopes in precipitation, average temperature, and average relative humidity are publicly available through the Global Network of Isotopes in Precipitation and can be found at https://nucleus.iaea.org/wiser (last access: 4 September 2020). Datasets for leaf and root stable isotopes of cellulose (Groff et al., 2019) can be found at http://dx.doi.org/10.5281/zenodo.3104573, hosted at Zenodo (last access: 3 September 2020).
The supplement related to this article is available online at: https://doi.org/10.5194/bg-17-4545-2020-supplement.
DG, DW, and JG designed the experiments, and DG carried them out. DG performed laboratory analyses. DG prepared the manuscript with contributions from all co-authors.
The authors declare that they have no conflict of interest.
We gratefully thank the community scientists who collected samples: Ben Bernsten, Nikki and Mike Summers, Mike and Phyl Rendell, Robert and Elaine Short, Kicki Ericson, and Thies Matzen. Paul Mayewski at the University of Maine Climate Change Institute provided precipitation collectors. Logistical, field, and laboratory support was provided by Paul Brickle and Megan Tierney at the South Atlantic Environmental Research Institute, Craig Cook at the University of Wyoming Stable Isotope Facility, Kayla Greenawalt, and Jiemin Guo. This research was supported by the US National Science Foundation (grant nos. DGE-1144423 and EF-1137336).
This research has been supported by the U.S. National Science Foundation (grant nos. DGE-1144423 and EF-1137336).
This paper was edited by Steven Bouillon and reviewed by Aaron Diefendorf and Samuel Bodé.
Amesbury, M. J., Charman, D. J., Newnham, R. M., Loader, N. J., Goodrich, J. P., Royles, J., Campbell, D. I., Roland, T. P., and Gallego-Sala, A.: Carbon stable isotopes as a palaeoclimate proxy in vascular plant dominated peatlands, Geochim. Cosmochim. Ac., 164, 161–174, https://doi.org/10.1016/j.gca.2015.05.011, 2015.
Araguás-Araguás, L., Froehlich, K., and Rozanski, K.: Deuterium and oxygen-18 isotope composition of precipitation and atmospheric moisture, Hydrol. Process., 14, 1341–1355, https://doi.org/10.1002/1099-1085(20000615)14:8<1341::AID-HYP983>3.0.CO;2-Z, 2000.
Barbraud, C., Rolland, V., Jenouvrier, S., Nevoux, M., Delord, K., and Weimerskirch, H.: Effects of climate change and fisheries bycatch on Southern Ocean seabirds: a review, Mar. Ecol. Prog. Ser., 454, 285–307, https://doi.org/10.3354/meps09616, 2012.
Brendel, O., Iannetta, P. P. M., and Stewart, D.: A rapid and simple method to isolate pure alpha-cellulose, Phytochem. Anal., 11, 7–10, https://doi.org/10.1002/(SICI)1099-1565(200001/02)11:1<7::AID-PCA488>3.0.CO;2-U, 2000.
Cernusak, L. A., Tcherkez, G., Keitel, C., Cornwell, W. K., Santiago, L. S., Knohl, A., Barbour, M. M., Williams, D. G., Reich, P. B., Ellsworth, D. S., Dawson, T. E., Griffiths, H. G., Farquhar, G. D., and Wright, I. J.: Why are non-photosynthetic tissues generally 13C enriched compared with leaves in C3 plants?, Review and synthesis of current hypotheses, Funct. Plant Biol., 36, 199, https://doi.org/10.1071/FP08216, 2009.
Cernusak, L. A., Ubierna, N., Winter, K., Holtum, J. A. M., Marshall, J. D., and Farquhar, G. D.: Environmental and physiological determinants of carbon isotope discrimination in terrestrial plants, New Phytol., 200, 950–965, https://doi.org/10.1111/nph.12423, 2013.
Chambers, F. M., Booth, R. K., De Vleeschouwer, F., Lamentowicz, M., Le Roux, G., Mauquoy, D., Nichols, J. E., and van Geel, B.: Development and refinement of proxy-climate indicators from peats, Quat. Int., 268, 21–33, https://doi.org/10.1016/j.quaint.2011.04.039, 2012.
Craig, H.: Standard for Reporting Concentrations of Deuterium and Oxygen-18 in Natural Waters, Science, 133, 1833–1834, https://doi.org/10.1126/science.133.3467.1833, 1961.
Deniro, M. J. and Epstein, S.: Relationship Between the Oxygen Isotope Ratios of Terrestrial Plant Cellulose, Carbon Dioxide, and Water, Science, 204, 51–53, https://doi.org/10.1126/science.204.4388.51, 1979.
Dietl, G. P. and Flessa, K. W.: Conservation paleobiology: putting the dead to work, Trends Ecol. Evol., 26, 30–37, https://doi.org/10.1016/j.tree.2010.09.010, 2011.
Dietl, G. P., Kidwell, S. M., Brenner, M., Burney, D. A., Flessa, K. W., Jackson, S. T., and Koch, P. L.: Conservation Paleobiology: Leveraging Knowledge of the Past to Inform Conservation and Restoration, Annu. Rev. Earth Planet. Sci., 43, 79–103, https://doi.org/10.1146/annurev-earth-040610-133349, 2015.
Ehleringer, J. R. and Osmond, C. B.: Stable isotopes, in Plant Physiological Ecology: Field methods and instrumentation, edited by: Pearcy, R. W., Ehleringer, J. R., Mooney, H. A., and Rundel, P. W., Springer Netherlands, Dordrecht, 281–300, 1989.
Farquhar, G., O'Leary, M., and Berry, J.: On the Relationship Between Carbon Isotope Discrimination and the Intercellular Carbon Dioxide Concentration in Leaves, Funct. Plant Biol., 9, 121, https://doi.org/10.1071/PP9820121, 1982.
Farquhar, G. D. and Sharkey, T. D.: Stomatal Conductance and Photosynthesis, Annu. Rev. Plant Physiol., 33, 317–345, https://doi.org/10.1146/annurev.pp.33.060182.001533, 1982.
Ferrio, J. P. and Voltas, J.: Carbon and oxygen isotope ratios in wood constituents of Pinus halepensis as indicators of precipitation, temperature and vapour pressure deficit, Tellus B, 57, 164–173, https://doi.org/10.1111/j.1600-0889.2005.00137.x, 2005.
Gillett, N. P., Stone, D. A., Stott, P. A., Nozawa, T., Karpechko, A. Y., Hegerl, G. C., Wehner, M. F., and Jones, P. D.: Attribution of polar warming to human influence, Nat. Geosci., 1, 750–754, https://doi.org/10.1038/ngeo338, 2008.
Gonfiantini, R.: Standards for stable isotope measurements in natural compounds, Nature, 271, 534–536, https://doi.org/10.1038/271534a0, 1978.
Groff, D. V.: Modern and Paleoecological Perspectives on a Terrestrial-Marine Linkage in the Falkland Islands, PhD Thesis Univ. Maine, 178 pp., 2018.
Groff, D. V., Williams, D. G., and Gill, J. L.: Modern calibration of Poa flabellata (tussac grass) as a new paleoclimate proxy in the South Atlantic, Zenodo, doi:10.5281/ZENODO.3104573 (last access: 3 September 2020), 2019.
Gröning, M., Lutz, H. O., Roller-Lutz, Z., Kralik, M., Gourcy, L., and Pöltenstein, L.: A simple rain collector preventing water re-evaporation dedicated for δ18O and δ2H analysis of cumulative precipitation samples, J. Hydrol., 448, 195–200, https://doi.org/10.1016/j.jhydrol.2012.04.041, 2012.
Helliker, B. R. and Ehleringer, J. R.: Establishing a grassland signature in veins: 18O in the leaf water of C3 and C4 grasses, P. Natl. Acad. Sci. USA, 97, 7894–7898, https://doi.org/10.1073/pnas.97.14.7894, 2000.
Helliker, B. R. and Ehleringer, J. R.: Grass blades as tree rings: environmentally induced changes in the oxygen isotope ratio of cellulose along the length of grass blades, New Phytol., 155, 417–424, https://doi.org/10.1046/j.1469-8137.2002.00480.x, 2002.
Jackson, S. T.: Representation of flora and vegetation in Quaternary fossil assemblages: known and unknown knowns and unknowns, Quat. Sci. Rev., 49, 1–15, https://doi.org/10.1016/j.quascirev.2012.05.020, 2012.
Jones, P. D., Harpham, C., and Lister, D. H.: Construction of high spatial resolution climate scenarios for the Falkland Islands and southern Patagonia, U. K. Falkl. Isl. Trust, 39 pp., 2013.
Lehmann, M. M., Gamarra, B., Kahmen, A., Siegwolf, R. T. W., and Saurer, M.: Oxygen isotope fractionations across individual leaf carbohydrates in grass and tree species, Plant Cell Environ., 40, 1658–1670, https://doi.org/10.1111/pce.12974, 2017.
Lehmann, M. M., Goldsmith, G. R., Schmid, L., Gessler, A., Saurer, M., and Siegwolf, R. T. W.: The effect of 18 O-labelled water vapour on the oxygen isotope ratio of water and assimilates in plants at high humidity, New Phytol., 217, 105–116, https://doi.org/10.1111/nph.14788, 2018.
Libby, L. M., Pandolfi, L. J., Payton, P. H., Marshall, J., Becker, B., and Giertz-Sienbenlist, V.: Isotopic tree thermometers, Nature, 261, 284–288, https://doi.org/10.1038/261284a0, 1976.
Lister, D. H. and Jones, P. D.: Long-term temperature and precipitation records from the Falkland Islands, Int. J. Climatol., 35, 1224–1231, https://doi.org/10.1002/joc.4049, 2015.
Liu, H. T., Schäufele, R., Gong, X. Y., and Schnyder, H.: The δ18O and δ2H of water in the leaf growth-and-differentiation zone of grasses is close to source water in both humid and dry atmospheres, New Phytol., 214, 1423–1431, https://doi.org/10.1111/nph.14549, 2017.
Ménot, G. and Burns, S. J.: Carbon isotopes in ombrogenic peat bog plants as climatic indicators: calibration from an altitudinal transect in Switzerland, Org. Geochem., 32, 233–245, https://doi.org/10.1016/S0146-6380(00)00170-4, 2001.
Moreno-Gutiérrez, C., Dawson, T. E., Nicolás, E., and Querejeta, J. I.: Isotopes reveal contrasting water use strategies among coexisting plant species in a Mediterranean ecosystem, New Phytol., 196, 489–496, https://doi.org/10.1111/j.1469-8137.2012.04276.x, 2012.
Payne, R. J., Ring-Hrubesh, F., Rush, G., Sloan, T. J., Evans, C. D., and Mauquoy, D.: Peatland initiation and carbon accumulation in the Falkland Islands, Quat. Sci. Rev., 212, 213–218, https://doi.org/10.1016/j.quascirev.2019.03.022, 2019.
Pendall, E., Markgraf, V., White, J. W. C., Dreier, M., and Kenny, R.: Multiproxy Record of Late Pleistocene – Holocene Climate and Vegetation Changes from a Peat Bog in Patagonia, Quat. Res., 55, 168–178, https://doi.org/10.1006/qres.2000.2206, 2001.
Roden, J. S. and Ehleringer, J. R.: Observations of Hydrogen and Oxygen Isotopes in Leaf Water Confirm the Craig-Gordon Model under Wide-Ranging Environmental Conditions, Plant Physiol., 120, 1165–1174, https://doi.org/10.1104/pp.120.4.1165, 1999.
Sala, O. E., Golluscio, R. A., Lauenroth, W. K., and Soriano, A.: Resource partitioning between shrubs and grasses in the Patagonian steppe, Oecologia, 81, 501–505, https://doi.org/10.1007/BF00378959, 1989.
Saurer, M., Aellen, K., and Siegwolf, R.: Correlating δ13C and δ18O in cellulose of trees, Plant Cell Environ., 20, 1543–1550, https://doi.org/10.1046/j.1365-3040.1997.d01-53.x, 1997.
Scheidegger, Y., Saurer, M., Bahn, M., and Siegwolf, R.: Linking stable oxygen and carbon isotopes with stomatal conductance and photosynthetic capacity: a conceptual model, Oecologia, 125, 350–357, https://doi.org/10.1007/s004420000466, 2000.
Schwinning, S. and Ehleringer, J. R.: Water use trade-offs and optimal adaptations to pulse-driven arid ecosystems, J. Ecol., 89, 464–480, https://doi.org/10.1046/j.1365-2745.2001.00576.x, 2001.
Smith, R. I. L. and Clymo, R. S.: An extraordinary peat-forming community on the Falkland Islands, Nature, 309, 617–620, https://doi.org/10.1038/309617a0, 1984.
Smith, R. I. L. and Prince, P. A.: The natural history of Beauchêne Island, Biol. J. Linn. Soc., 24, 233–283, https://doi.org/10.1111/j.1095-8312.1985.tb00374.x, 1985.
Stanworth, A. and Upson, R.: Minefield Restoration Trials Final Report, 37 pp., 2013.
Sternberg, L. D. S. L., Deniro, M. J., and Savidge, R. A.: Oxygen Isotope Exchange between Metabolites and Water during Biochemical Reactions Leading to Cellulose Synthesis, Plant Physiol., 82, 423–427, https://doi.org/10.1104/pp.82.2.423, 1986.
Strange, I. J., Parry, C. J., Parry, M. C., and Woods, R. W.: Tussac grass in the Falkland Islands, 1988.
Thompson, D. W. J. and Solomon, S.: Interpretation of Recent Southern Hemisphere Climate Change, Science, 296, 895–899, https://doi.org/10.1126/science.1069270, 2002.
Turner, J. and Pendelbury, S. (Eds.): The International Antarctic Weather Forecasting Handbook, in Sixth Conference on Polar Meteorology and Oceanography, American Meteorological Society, Boston, MA, San Diego, CA, 663 pp., 2000.
Turney, C. S. M., Jones, R. T., Lister, D., Jones, P., Williams, A. N., Hogg, A., Thomas, Z. A., Compo, G. P., Yin, X., Fogwill, C. J., Palmer, J., Colwell, S., Allan, R., and Visbeck, M.: Anomalous mid-twentieth century atmospheric circulation change over the South Atlantic compared to the last 6000 years, Environ. Res. Lett., 11, 064009, https://doi.org/10.1088/1748-9326/11/6/064009, 2016.
Upson, R., Williams, J. J., Wilkinson, T. P., Clubbe, C. P., Maclean, I. M. D., McAdam, J. H., and Moat, J. F.: Potential Impacts of Climate Change on Native Plant Distributions in the Falkland Islands, PLOS ONE, 11, e0167026, https://doi.org/10.1371/journal.pone.0167026, 2016.
van Geel, B. and Middeldorp, A. A.: Vegetational history of Carbury Bog (Co. Kildare, Ireland) during the last 850 years and a test of the temperature indicator value of 2H/1H measurements of peat samples in relation to historical sources and meteorological data, New Phytol., 109, 377–392, https://doi.org/10.1111/j.1469-8137.1988.tb04208.x, 1988.
Villalba, R., Lara, A., Masiokas, M. H., Urrutia, R., Luckman, B. H., Marshall, G. J., Mundo, I. A., Christie, D. A., Cook, E. R., Neukom, R., Allen, K., Fenwick, P., Boninsegna, J. A., Srur, A. M., Morales, M. S., Araneo, D., Palmer, J. G., Cuq, E., Aravena, J. C., Holz, A., and LeQuesne, C.: Unusual Southern Hemisphere tree growth patterns induced by changes in the Southern Annular Mode, Nat. Geosci., 5, 793–798, https://doi.org/10.1038/ngeo1613, 2012.
Weimerskirch, H., Louzao, M., de Grissac, S., and Delord, K.: Changes in Wind Pattern Alter Albatross Distribution and Life-History Traits, Science, 335, 211–214, https://doi.org/10.1126/science.1210270, 2012.
White, J. W. C., Ciais, P., Figge, R. A., Kenny, R., and Markgraf, V.: A high-resolution record of atmospheric CO2 content from carbon isotopes in peat, Nature, 367, 153–156, https://doi.org/10.1038/367153a0, 1994.
Willis, K. J., Bailey, R. M., Bhagwat, S. A., and Birks, H. J. B.: Biodiversity baselines, thresholds and resilience: testing predictions and assumptions using palaeoecological data, Trends Ecol. Evol., 25, 583–591, https://doi.org/10.1016/j.tree.2010.07.006, 2010.
Wilson, P., Clark, R., McAdam, J. H., and Cooper, E. A.: Soil erosion in the Falkland Islands: an assessment, Appl. Geogr., 13, 329–352, https://doi.org/10.1016/0143-6228(93)90036-Z, 1993.
Yakir, D.: Variations in the natural abundance of oxygen-18 and deuterium in plant carbohydrates, Plant Cell Environ., 15, 1005–1020, https://doi.org/10.1111/j.1365-3040.1992.tb01652.x, 1992.
Yu, Z., Loisel, J., Brosseau, D. P., Beilman, D. W., and Hunt, S. J.: Global peatland dynamics since the Last Glacial Maximum, Geophys. Res. Lett., 37, doi:10.1029/2010GL043584, 2010.