the Creative Commons Attribution 4.0 License.
the Creative Commons Attribution 4.0 License.
 | 30 Jan 2020
Zooplankton diel vertical migration and downward C flux into the oxygen minimum zone in the highly productive upwelling region off northern Chile
Ruben Escribano
Diel vertical migration (DVM) can enhance the vertical flux of carbon (C), and so contributes to the functioning of the biological pump in the ocean. The magnitude and efficiency of this active transport of C may depend on the size and taxonomic structure of the migrant zooplankton. However, the impact that a variable community structure can have on zooplankton-mediated downward C flux has not been properly addressed. This taxonomic effect may become critically important in highly productive eastern boundary upwelling systems (EBUSs), where high levels of zooplankton biomass are found in the coastal zone and are composed by a diverse community with variable DVM behavior. In these systems, presence of a subsurface oxygen minimum zone (OMZ) can impose an additional constraint to vertical migration and so influence the downward C export. Here, we address these issues based on a vertically stratified zooplankton sampling at three stations off northern Chile (20–30∘ S) during November–December 2015. Automated analysis of zooplankton composition and taxa-structured biomass allowed us to estimate daily migrant biomass by taxa and their amplitude of migration. We found that a higher biomass aggregates above the oxycline, associated with more oxygenated surface waters and this was more evident upon a more intense OMZ. Some taxonomic groups, however, were found closely associated with the OMZ. Most taxa were able to perform DVM in the upwelling zone withstanding severe hypoxia. Also, strong migrants, such as eucalanid copepods and euphausiids, can exhibit a large migration amplitude (∼500 m), remaining either temporarily or permanently within the core of the OMZ and thus contributing to the release of C below the thermocline. Our estimates of DVM-mediated C flux suggested that a mean migrant biomass of ca. 958 mg C m−2 d−1 may contribute with about 71.3 mg C m−2 d−1 to the OMZ system through respiration, mortality and C excretion at depth, accounting for ca. 4 % of the net primary production, and so implies the existence of an efficient mechanism to incorporate freshly produced C into the OMZ. This downward C flux mediated by zooplankton is however spatially variable and mostly dependent on the taxonomic structure due to variable migration amplitude and DVM behavior.
- Article
(2287 KB) - Full-text XML
-
Supplement
(795 KB) - BibTeX
- EndNote


The oxygen minimum zone (OMZ) in the southeast Pacific, the fourth largest of the six permanent hypoxic regions in the world oceans (Paulmier et al., 2006), is a key component of the water column and a permanent feature intruding the coastal zone of Ecuador, Peru and Chile (Fuenzalida et al., 2009; Paulmier et al., 2006). In the highly productive upwelling region of northern Chile, the OMZ is closely linked to wind-driven upwelling in the coastal area and associated to the Equatorial Subsurface Water (ESSW), which is transported southward along the continental shelf by the Peru–Chile Undercurrent (PUC), as far south as 48∘ S (Fuenzalida et al., 2009; Morales et al., 1996a; Silva and Neshyba, 1979). Off Iquique (20∘ S) the OMZ is characterized by being thick (500 m), very intense (< 20 µmol kg−1) and with O2 concentrations in the core of OMZ among the lowest found in the global ocean reaching the current detection limit (< 1 µM) (Ulloa and Pantoja, 2009), although it becomes thinner at about 30∘ S (Paulmier et al., 2006).
During the last decades, the OMZ systems have attracted much scientific interest because of evidence showing that hypoxic and anoxic conditions in coastal areas are expanding and becoming more intense (Ekau et al., 2010; Stramma et al., 2008). At present, ongoing ocean deoxygenation is widely recognized as being linked to global warming, and it is raising much concern in modern oceanography (Breitburg et al., 2018).
The presence of oxygen-depleted water becomes a critical physiological constraint for pelagic and benthic organisms inhabiting the upwelling zone, impacting their biomass and productivity, species diversity, distribution, behavior and metabolic activity (Wishner et al., 2018; Ekau et al., 2010; Grantham et al., 2004). For instance, diel vertical migration (DVM), a common feature of the various size groups of zooplankton and also one of the most important movements of biomass in the ocean, can also be affected by changes in intensity and distribution of the OMZ (Wishner et al., 2018, 2013; Escribano et al., 2009; Fernández-Álamo and Färber-Lorda, 2006; Hidalgo et al., 2005; Morales et al., 1996; Judkins, 1980). The OMZ can act as an ecological barrier for vertical distribution of many organisms, constraining most zooplankton to a narrow (50 m) upper layer, as shown in the coastal upwelling zone off Chile according to the works of Escribano (2006) and Donoso and Escribano (2014). Zooplankton also become limited to the upper 150 or 300 m in the eastern tropical North Pacific (Wishner et al., 2013). However, the OMZ can also offer refuge for species adapted to live there, creating microhabitats of differing oxygen concentration that are characterized by layers of high zooplankton biomass and abundance, with distinct species zonation (Antezana, 2009; Wishner et al., 2008; Fernández-Álamo and Färber-Lorda, 2006), which, in turn, may have important consequences for carbon (C) cycling and its vertical flux. For example, it is known that zooplankton in the coastal upwelling region off northern Chile may play a significant biogeochemical role by promoting carbon flux into the subsurface OMZ (Escribano et al., 2009). Therefore a significant proportion of the vertical material flux from the euphotic zone to the deep sea (> 200 m) and within the food chain could be determined by DVM of zooplankton (Longhurst and Williams, 1992; Steinberg and Landry, 2017).
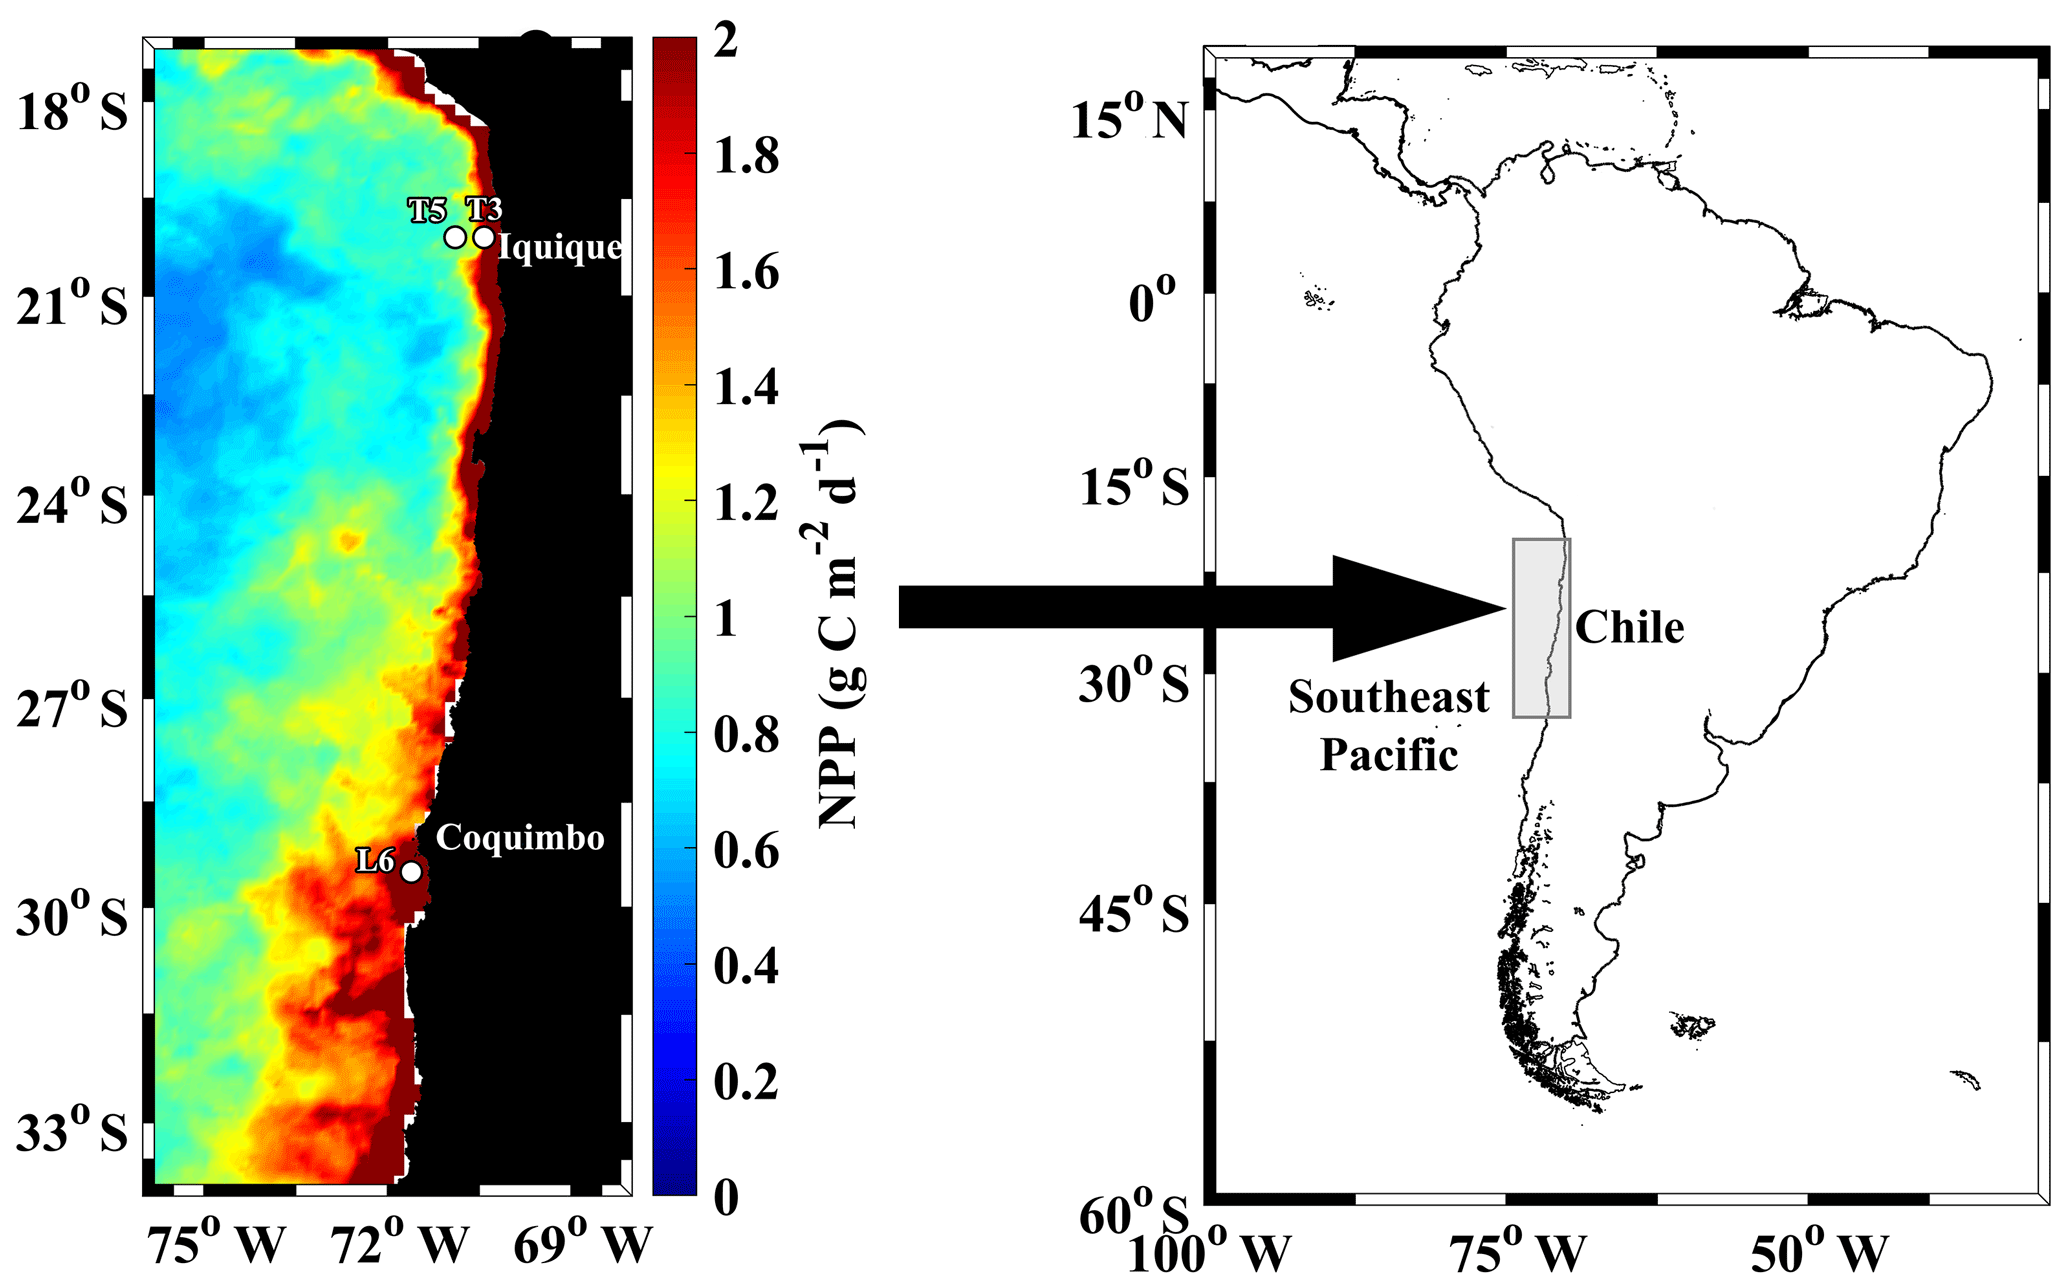
Figure 1Study area at the northern upwelling region of Chile, indicating sampling stations during the Lowphox cruise conducted in November–December 2015 onboard the R/V Cabo de Hornos. Satellite estimated net primary production (NPP), averaged for November–December 2015 is shown. NPP was obtained from http://www.science.oregonstate.edu/ocean.productivity/, last access: 17 December 2019.
As important contributors to the functioning of the biological pump, diel zooplankton migrants can actively increase the magnitude of C export by transporting surface-ingested material in their guts to deep waters where it can be metabolized (Steinberg and Landry, 2017). Zooplankton moults or mortality at depth can also contribute to the transportation of assimilated organic biomass into the deep waters (Ducklow et al., 2001). The biological pump process is also thought to be related to the size structure of dominant zooplankton. This because some groups with large body sizes may exhibit a greater range of vertical migration and sometimes higher levels of biomass, and so influences the biogeochemical fluxes (Dai et al., 2016; Ducklow et al., 2001). However, the effect of variable size structure on DVM performance and its consequence for active C transport has indeed not been assessed. Size structure is certainly related to zooplankton composition, which has hardly been properly addressed when examining the role of DVM on C flux. For instance, in areas with hypoxic subsurface layers some species are more active migrants and thus more efficient C transporters, because they have developed adaptations to low oxygen conditions and can even use the OMZ as their habitat, either temporarily or permanently (Escribano et al., 2009; Gonzalez and Quiñones, 2002; Seibel, 2011). Adaptation may include in some cases reduction of aerobic metabolism by more than 50 % during exposure to hypoxic conditions as a mechanism to facilitate low oxygen tolerance, reducing dramatically energy expenditure during daytime within low oxygen waters and therefore affecting the C flux in areas subjected to low concentrations of oxygen (Seibel et al., 2016).
C export to depth may also depend on the amount of biomass being produced in the photic zone. Primary production promotes zooplankton feeding and growth, and therefore determines C availability for both passive and active transport to depth. In this context, highly productive upwelling zones can be assumed as systems where the C flux mediated by zooplankton DVM can be enhanced, although it certainly depends on the size and taxonomic structure of zooplankton. In these regions, a shallow OMZ might exert a further impact on the C flux by affecting DVM or zooplankton metabolism at depth. In the present study, based on vertically resolved resolution sampling and automated analysis of mesozooplankton, we assessed zooplankton vertical migration and downward C to the OMZ in the highly productive upwelling region of northern Chile. We aimed at understanding the role that taxonomic structure and size structure can play in the magnitude and variability of the DVM behavior interacting with a shallow OMZ and the implications this interaction can have on the magnitude of the downward C flux in a highly productive coastal upwelling zone
2.1 Study area
The study area was located in the southeast Pacific Ocean and covered the coastal zone of the northern upwelling region of Chile (21–29∘ S) (Fig. 1), which is a region known to be subjected to wind-driven upwelling throughout the year and contains an intense and shallow OMZ (Ulloa et al., 2012). The sampling design comprised three stations: two stations (St. T3 and St. T5) across a zonal section off Iquique (20∘ S) and a coastal station (St. L6) off Coquimbo (29∘ S). The study was carried out during the Lowphox cruise conducted in November–December 2015 onboard the R/V Cabo de Hornos. At each station, temperature, salinity and dissolved oxygen (DO) were recorded from 1000 m (St. T5 and St. T3) and only 356 m (St. L6) using an oceanographic rosette with a CTD Sea-Bird 911 (SBE 911 plus) equipped with a Sea-Bird SBE-43 oxygen sensor and a Sea Tech fluorometer. Discrete water samples were also obtained for chemical measurements of oxygen.
2.2 Zooplankton sampling
Zooplankton samples were collected during daytime and nighttime conditions on 2 consecutive days at the three stations off northern Chile (T5–T3–L6) (Fig. 1), also as indicated in Table S1 (Supplement). Vertical hauls of zooplankton were performed from 600 to 0 m depth with a Multi Plankton Sampler Hydro-Bios MultiNet system with a 0.25 m2 opening area and equipped with 200 µm mesh-size nets. The MultiNet towing speed was 1 m s−1 and the flowmeter in the mouth of the MultiNet estimated the volume of filtered water. Once onboard the collected zooplankton samples were preserved immediately in 5 % buffered formalin–seawater solution. At T3 and T5, 4 replicate day and night hauls were conducted (resulting in a total of 8 hauls and 40 discrete samples at these stations). At L6, 2 replicate day and night hauls were conducted (4 hauls and 20 samples total) from 600 to 0 m depth. Each sample corresponded to a different depth strata (30–0, 90–30, 150–90, 400–150 and 600–400 m depth). These strata were defined in according to distribution of oxygen concentration and localization of the OMZ (Fig. 2). Then, from the vertical profiles of oxygen and coinciding with the sampled layers of the MultiNet, strata were defined as follows:
-
oxic mixed layer (OX-ML), a well-oxygenated stratum with oxygen approaching air saturation (> 250 µmol O2 kg−1);
-
upper O2 gradient (oxycline), the level at which O2 reaches 4 % of the surface O2 (Paulmier et al., 2006), of which the base is located in the upper boundary of the OMZ (45 µmol O2 isoline, OMZ-UB) (Escribano et al., 2009; Hidalgo et al., 2005; Morales et al., 1999);
-
OMZ core, an upper boundary (OMZ-UC) with the lowest concentration of O2 (< 20 µmol O2 kg−1);
-
lower boundary (OMZ-LC) (1 to < 20 µmol O2 kg−1);
-
lower O2 gradient (OMZ-LW).
Depth ranges and oxygen levels for these strata are detailed in Table S2.
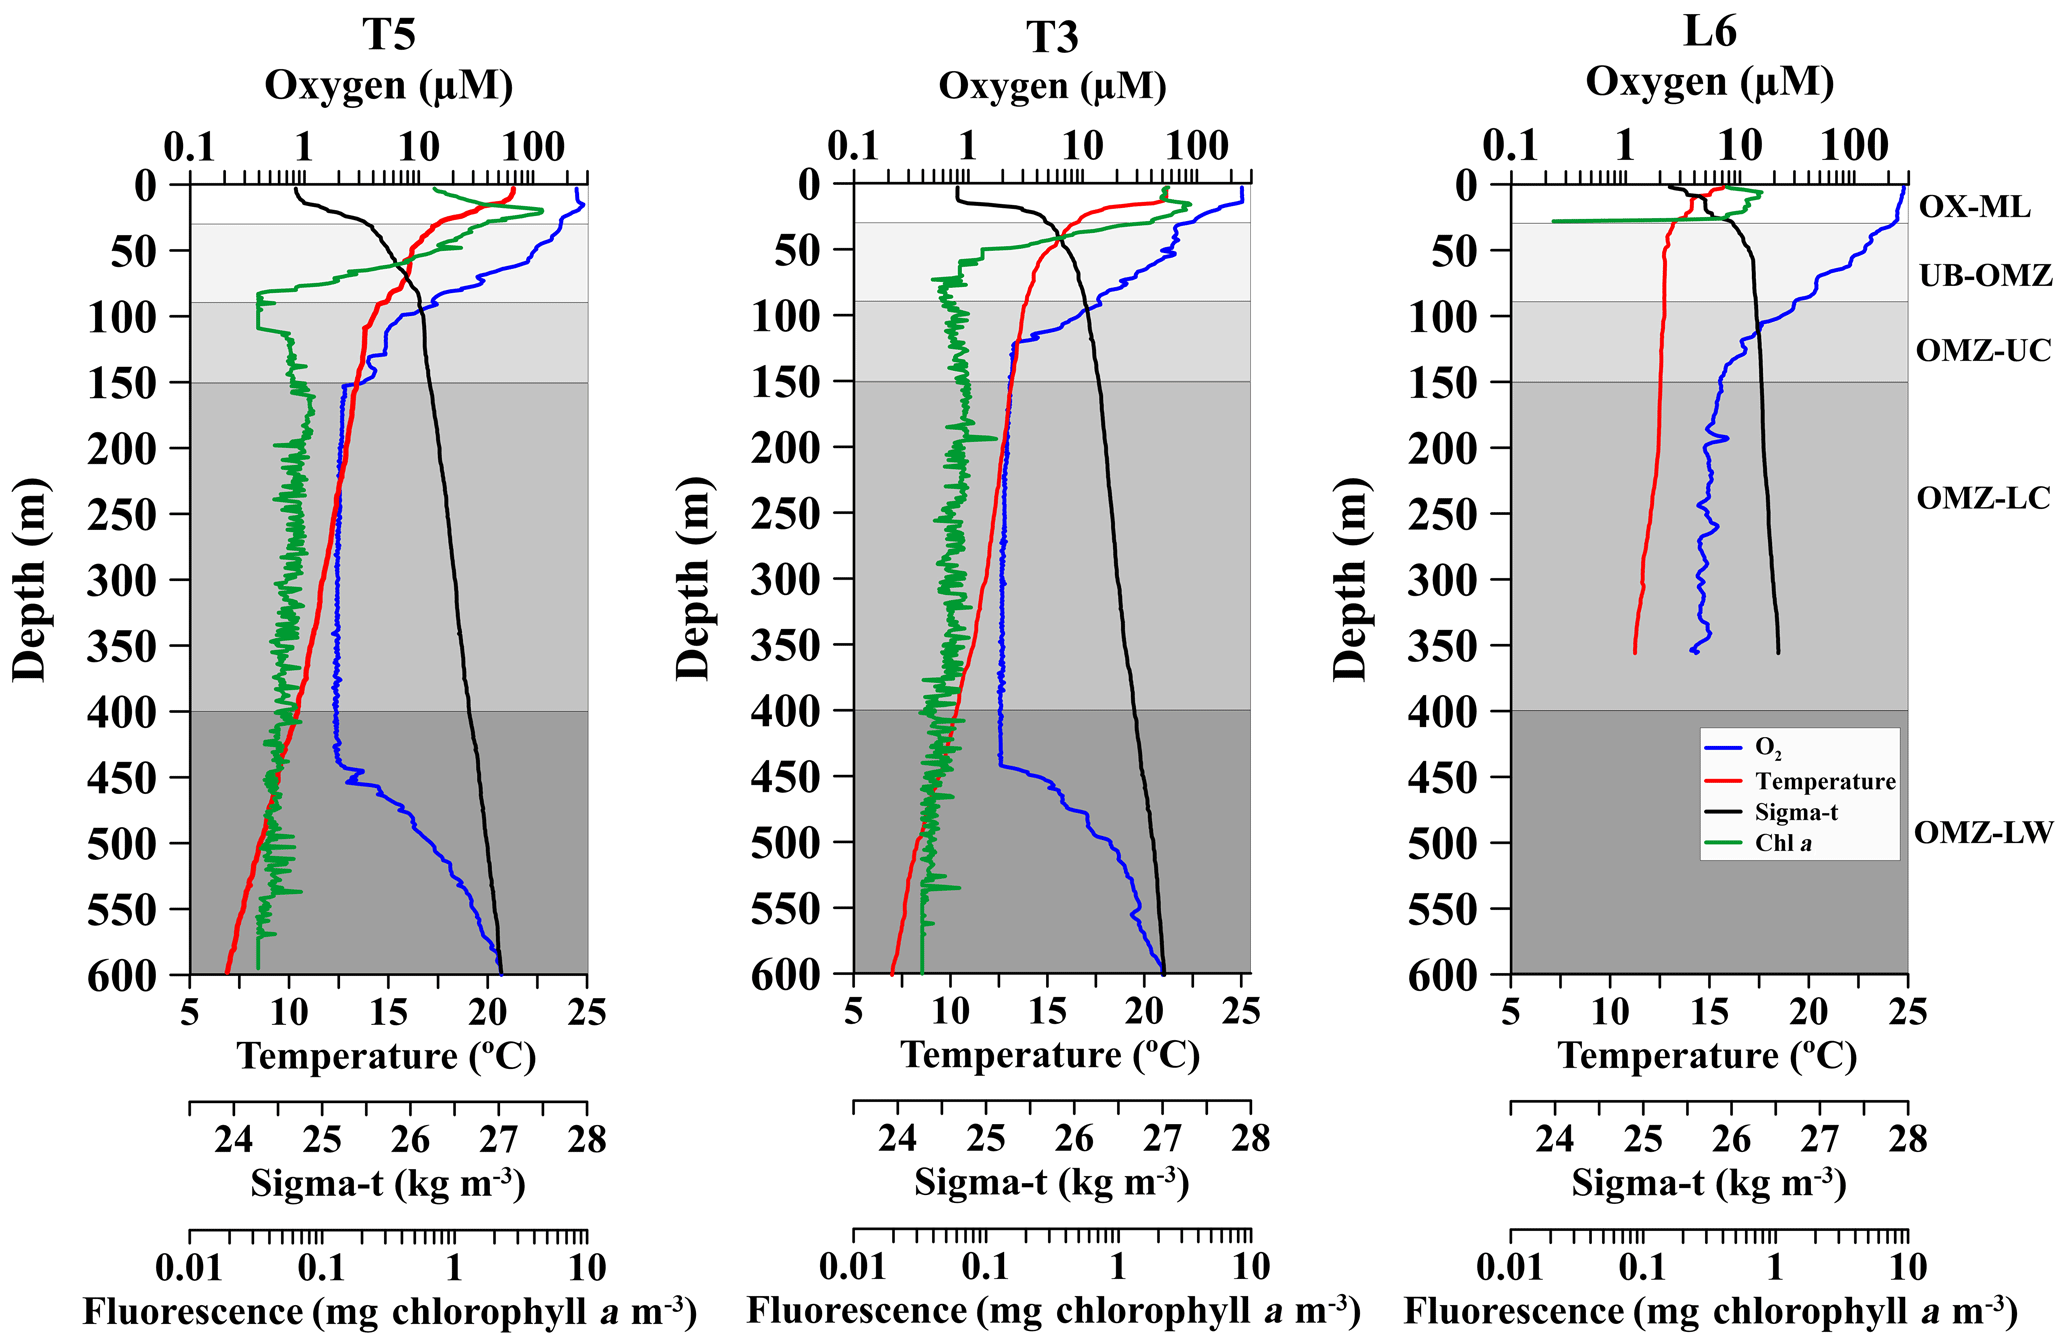
Figure 2Vertical profiles of dissolved oxygen (O2), temperature, chlorophyll a and water density (σt), at three stations off northern Chile (see Fig. 1) during the Lowphox Cruise in the austral spring 2015. Shaded areas represent different layers sampled with the MultiNet and defined according to oxygen concentration. OX-M is the oxic mixed layer, OMZ-UB is the upper boundary of the oxygen minimum zone, OMZ-UC is the upper core of the oxygen minimum zone, OMZ-LC is the lower core of the OMZ and OMZ-LW is the lower oxygen gradient.
2.3 Taxonomic and size measurements
Taxonomic identification and enumeration of taxa were carried out by analysis of digitized images obtained with the Hydroptic ZooScan digital imaging system (Gorsky et al., 2010). Each sample was wet sieved through a 1000µm mesh into two size fractions, although a few samples were not split into two fractions, because they contained too few animals. Then, each size fraction was fractionated again separately with a Motoda splitter until the zooplankton concentration was sufficiently diluted to avoid contact between organisms in the ZooScan scanning frame. Fractioning into small and large organisms, and consequent separate image acquisition of the two size classes prevented underestimates of large, rare objects which may need less fractioning (Gorsky et al., 2010). A total of 179 subsamples were scanned and digitized at a resolution of 2400 dpi after manual separation of objects on the scanning tray. After processing the samples with ZooProcess software, each of the objects was automatically sorted with the help of a learning set, and then the sorting was visually validated by an expert (for details, see Chang et al., 2012; Gorsky et al., 2010). Organisms making up the ZooScan datasets were enumerated, measured, biomass estimated and classified into 27 taxonomic groups, such as copepods, chaetognaths, euphausiids, gelatinous and other zooplankton. The volume-specific abundance (ind. m−3) of total zooplankton or of each taxonomic group was calculated following Eq. (1):
where N is the number of individuals with same identification (e.g. in last column written “copepod”), S (subpart) is the splitting ratio and Vol is net volume stratum-integrated abundance (ind. m−2) was obtained after multiplying by width (m) of a given stratum.
2.4 Patterns of vertical distribution of migrating zooplankton
For the analysis of vertical distribution of organisms, the density estimates of the organisms were standardized to number the of individuals per cubic meter (m3) (for each stratum) or per square meter (m2) (for integrated values). In order to quantify the presence and extent of DVM of various taxa at each station, we calculated weighted mean depth (WMD) for zooplankton abundance, as a measure of the center of gravity of a population's vertical distribution for each taxon and haul, according to Andersen et al. (2004) following Eq. (2):
where d is the mean depth of the strata (m), zi the width (m) of the strata and ni the abundance (ind. m−3) of a given i taxonomic group.
We calculated the amplitude of vertical migration (ΔDVM) as the difference between the WMD of the organisms during the day and the night, and therefore this ΔDVM was considered as the criterion to assess the DVM behavior for each taxonomic group. Positive values indicated normal DVM (pattern of nocturnal ascent by individuals that reside at depth by day) and negative values indicated reverse DVM (pattern of nocturnal descent by individuals that reside near the surface by day). The individuals that occupied the same depth stratum by day and by night, whether near the surface or at depth, were considered as non migrant according to Ohman (1990).
2.5 Biomass estimates and carbon fluxes
The ZooScan Integrated System also provided zooplankton body size in terms of area (mm2) or volume (mm3) for each organism. We used the organisms' area or volume to estimate dry weight of each individual of different taxonomic groups using published regression equations relating organism size, area or volume to individual weight as detailed in Table S3. Mass unit conversions between dry weight (DW) and carbon content (C) were performed using averaged conversion factors obtained for different zooplankton groups (Kiørboe, 2013) and ichthyoplankton (Childress and Nygaard, 1973) (Table S3). Added biomasses (µg C ind.−1) of individuals within taxonomic categories identified by ZooScan allowed us to estimate total biomass per taxon (mg C m−3) for each sample by station, daytime vs. nighttime condition, and depth strata. Integrated values of biomass per depth stratum (mg C m−2) and taxon were calculated multiplying by the stratum width (m).
To calculate the migrant biomass, we integrated biomass in the upper 90 m layer from our two sampled strata 0–30 m and 30–90 m. This 0–90 m stratum was considered the approximate above-oxycline layer after examining the vertical profiles of oxygen. Biomass at night was thus subtracted from the corresponding day biomass in this layer to assess daily changes involving migrants as in Putzeys et al. (2011). Thus, the negative values of the day–minus–night biomass corresponded to migrant biomass that reached the epipelagic layer at night, including organisms inhabiting above and below the oxycline.
The proportion of migrant biomass with respect to observed biomass in the upper 90 m of a given taxonomic group was defined at the rate of migration on a daily basis. This rate of migration could thus be used as an index of DMV behavior for a taxonomic group. We additionally estimated daily migrant biomass from the difference between day and night samples in the deeper 90–600 m layer (integrated data) and compared these estimates with those from upper 0–90 m layer.
To estimate the active C flux at each sampling station, we considered three processes contributing to C at depth mediated by migrant zooplankton: respiration (R), excretion (E) and mortality (M) at depth. Respiration at depth (> 90 m) was estimated using the equation provided by Ikeda (1985) that relates individual respiration rate with body mass and temperature (Table S2), independent of taxonomic category, which may have a minor effect on R, according to a more recent assessment (Ikeda, 2014). Mean body mass (µg C) for each taxonomic group from ZooScan estimates and mean in situ temperature were used to obtain integrated R at each depth stratum. Estimates of R for each taxonomic group are shown in Table S6. Integrated R per station for the 0–600 depth strata along with the corresponding integrated biomass was then used to estimate the fraction of C being respired at depth by zooplankton. The contribution of C by excretion (E) at depth was assumed to be 31 % of R, as suggested by Steinberg et al. (2000), and daily mortality at depth (M) was considered to be in the range of 0.03 and 0.05, as suggested by Edvardsen et al. (2002), so that a median value of 0.04 as a fraction of migrant biomass was assumed. Vertical C flux mediated by zooplankton was thus estimated as,
where MB is the migrant biomass (mg C m−2), R and M are daily respiration and mortality (expressed as a fraction of migrant biomass), and E is the C excretion expressed as 0.31 R. The three processes are divided by 2, assuming a 12 h incursion at depth. We did not include the contribution by egestion at depth because of the lack of reliable estimates of ingestion rates in the photic zone during our study.
2.6 Statistical analysis
For statistical analysis, as a criterion for determining if the DVM was significant, we tested for differences in the WMD mean between day and night using a two-tailed t test. We considered the occurrence of DVM when the difference in the WMD mean between day and night was significant (p<0.05). In order to evaluate the similarity or dissimilarity in the abundance and biomass among stations, strata and day–night conditions, multivariate grouping techniques were applied (“cluster analysis”), including ANOSIM (two-way crossed analysis) tests and multidimensional scaling (MDS) with the data transformed in PRIMER v 6.1.16 (2013) prior to the application of the Bray-Curtis similarity index (Bray and Curtis, 1957). In general, WMD for taxonomic groups did not exhibit a pronounced bimodal vertical distribution.
3.1 Hydrographic conditions
Across the zonal section off Iquique the offshore station (St. T5) and onshore station (St. T3) showed two contrasting hydrographic regimes regarding the OMZ. Station T5 had a less pronounced and thicker OMZ than station T3. At both stations the five strata were well defined in the water column (Fig. 2). The OX-ML (> 250 µmol O2 kg−1) was present at 18 m (St. T5) and 15 m (St. T3). The oxycline gradually decreased from oxic (∼250 µmol O2 kg−1) to suboxic (< 20 µmol O2 kg−1) conditions associated with a strong stratification in the upper 80 m depth. The 45 µmol O2 isoline (OMZ-UB) was at the base of the oxycline at 70 m (St. T5) and 59 m (St. T3). The OMZ core (< 20 µmol O2 kg−1) was below the thermocline and below the 26.5 kg m−3 isopycnal, following description of Paulmier et al. (2006). In the oceanic station (St. T5) the OMZ core was between 80 and 514 m, while in the coastal station (St. T3) it was between 80 and 507 m with 423 m thickness. The O2 concentration in the OMZ core was ca. 1 µmol O2 kg−1. The OMZ-LW at both stations was delimited above the core and below the depth where the O2 slope changed significantly (slope break > 20 µmol m−1) (Fig. 2).
The structure of the OMZ at the coastal station (St. L6) off Coquimbo (29∘ S) (Fig. 1) was similar to St. T3 (21∘ S), but in this area the OMZ was deeper and thinner. The OX-ML was shallower. The OMZ -UB (45 µmol O2) in the base of the oxycline was down to 80 m. The low O2 concentrations in the core were less intense than at 21∘ S (4 to 20 µmol O2 kg−1), and it was located below 100 m (Fig. 2). The OMZ-LW could not be assessed because of lack of CTD data below 350 m.
Additional oceanographic variables showed a surface warming (> 20 ∘C) and strongly stratified conditions at the three stations with a sharp thermocline in the upper 100 m, coinciding with the oxycline, whereas chlorophyll a maximum (> 5 mg chlorophyll a m−3was in the upper 20 m (Fig. 2).
3.2 Zooplankton composition and abundance
A total of 27 zooplankton taxa were identified by the ZooScan and ZooProcess (Table S4). The number of taxa varied among stations and strata. Across the zonal section off Iquique the number of taxonomic groups fluctuated between 23 (St. T3) and 26 (St. T5), whereas 25 taxa were off 29∘ S (St. L6). The most dominant taxa at both daytime and night conditions were copepods 87 % (in St. T5), 79 % (in St. T3) and 69 % (in St. L6). This group was constituted by small copepods, large copepods, the eucalanid copepods and the Acartia spp copepods; fish eggs constituting 2 % (in St. T5), 5 % (in St. T3) and 6 % (in St. L6); Nauplii being < 1 % (in St. T5), < 1 % (in St. T3) and 7 % (in St. L6); Appendicularia 5 % (in St. T5), 4 % (in St. T3) and 3 % (in St. L6) (Table S5). The remaining 19 pooled groups only constituted < 6 % (in St. T5), 11 % (in St. T3) and 15 % (in St. L6). The total integrated abundances of zooplankton (0–600 m) by sampling station are in Table S4. Based on a two-way crossed analysis ANOSIM test, this water column integrated abundance did not show significant differences between day and night samples (p>0.05). However, the abundance of these zooplankton groups regarding stations was significantly different (two-way crossed analysis ANOSIM, p<0.05), so that the stations were treated independently. Off Iquique the abundance was the lowest at the onshore station (St. T3 with 18 %), which was characterized by the strongest and most extensive OMZ in the study area. These values increased at the offshore station (St. T5 with 31 %), where the OMZ was less pronounced and thicker. Unlike stations T3 and T5, the onshore station off 29∘ S (St. L6) had a weaker and less extensive OMZ, showing the highest zooplankton abundance (51 % greater).
3.3 Diel vertical migration (DVM) and vertical distribution
Main migrant groups of zooplankton
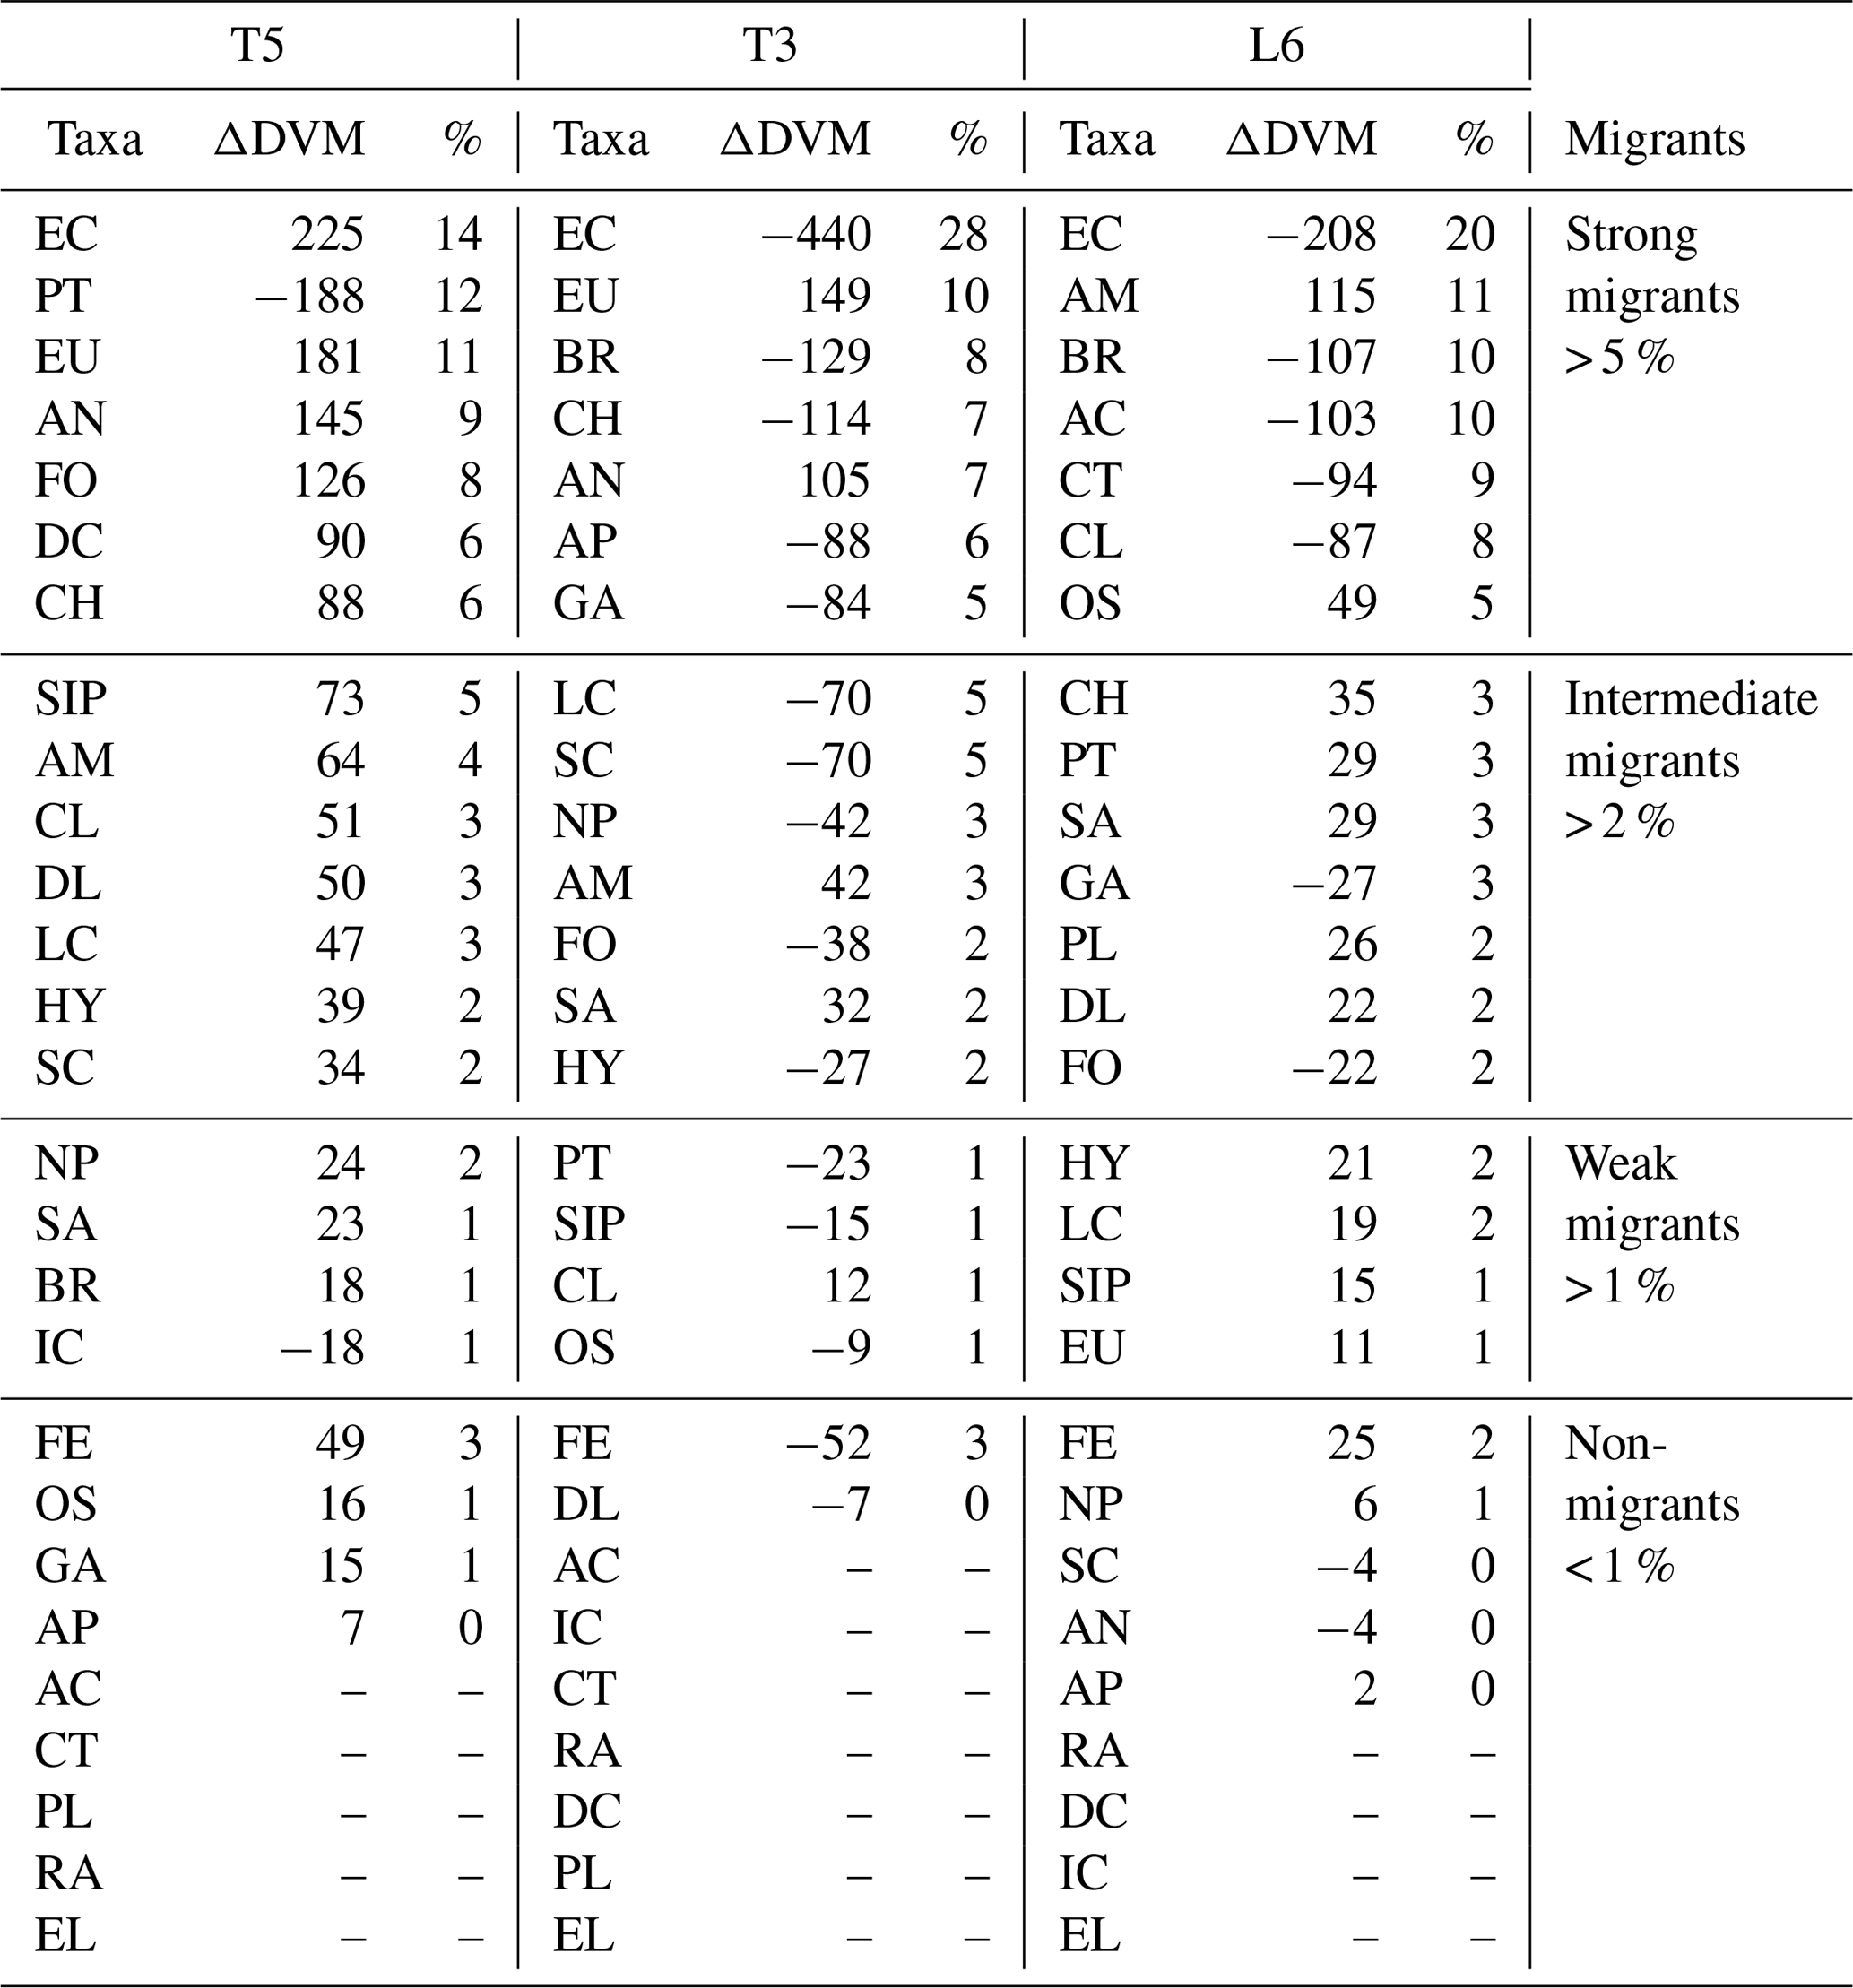
The diel vertical migration of 27 zooplankton taxa in the 0–600 m water column is in Fig. 3. These taxa were classified into four groups according to their amplitude of migration (ΔDVM) (Table 1).
-
Group 1. Strong migrants, represented by taxa with a strong DVM and a broad range of ΔDVM from 225 to 99 m (in St. T5), 440 to 84 m (in St. T3) and 208 to 87 m (in St. L6). This group constituted 70 % of taxa with higher ΔDVM. The composition of taxa in this group was variable at each station (Table 1), but in general this group was well represented by eucalanid copepods (EC), euphausiids (EU), Acartia copepods (AC), ctenophores (CT), decapods (DC), annelids (AN), Bryozoa L (BR), pteropods (PT) and chaetognaths (CH). These taxa were mostly concentrated in the oxic surface stratum (OX-ML) and the OMZ core, showing a strong interaction with both the OMZ-UC and the OMZ-LC, and so changing from normoxic to hypoxic conditions and vice versa between 0 and 550 m (Fig. 3).
-
Group 2. Intermediate migrants, represented by taxa with a moderate DVM and a range of ΔDVM from 73 to 34 m (in St. T5), 70 to 27 m (in St. T3) and 49 to 22 m (in St. L6). This group constituted 23 % of taxa with moderate ΔDVM. The composition of taxa in this group was also variable at each station (Table 1), but it was mostly represented by small (SC) and large copepods (LC), Amphipods (AM), Cirripedia larvae (CL), gastropods (GA), siphonophores (SIP) and Appendicularia (AP). These taxa were mostly concentrated in the oxic surface strata (OX-ML) and in the OMZ-UC, showing some interaction with the OMZ core and vertically changing from normoxic to hypoxic conditions, and vice versa between 0 and 200 m.
-
Group 3. Weak migrants, represented by taxa with a weak DVM and a range of ΔDVM of 24 to 18 m (in St. T5), 23 to 12 m (in St. T3) and 21 to 11 m (in St. L6). This group constituted 5 % of taxa with a of low range of ΔDVM. The composition of taxa in this group was also variable at each station (Table 1), but in general it was represented by Hydrozoa (HY), salps (SA), Platyhelminthes (PT), Decapoda larvae (DL), ostracods (OS), Nauplii (NL) and Ichthyoplankton (IC). These taxa were concentrated mainly in the oxic surface strata (OX-ML) and in the OMZ-UP, but also in the OMZ-UC at the onshore stations (Station T3 and Station L6), showing much less interaction with the OMZ core, while spatially moving from normoxic to hypoxic conditions and vice versa between 0 and 100 m.
-
Group 4. Non-migrants, represented by taxa which did not exhibit a significant DVM and had a range of ΔDVM from 16 to 0 m (in St. T5), 7 to 0 m (in St. T3) and 6 to 0 m (in St. L6). This group constituted 1 % of taxa with not significant ΔDVM. The composition of taxa in this group was also variable at each station (Table 1), but in general it was represented by fish eggs (FE), radiolarian (RA) and echinoderm larvae (EL).
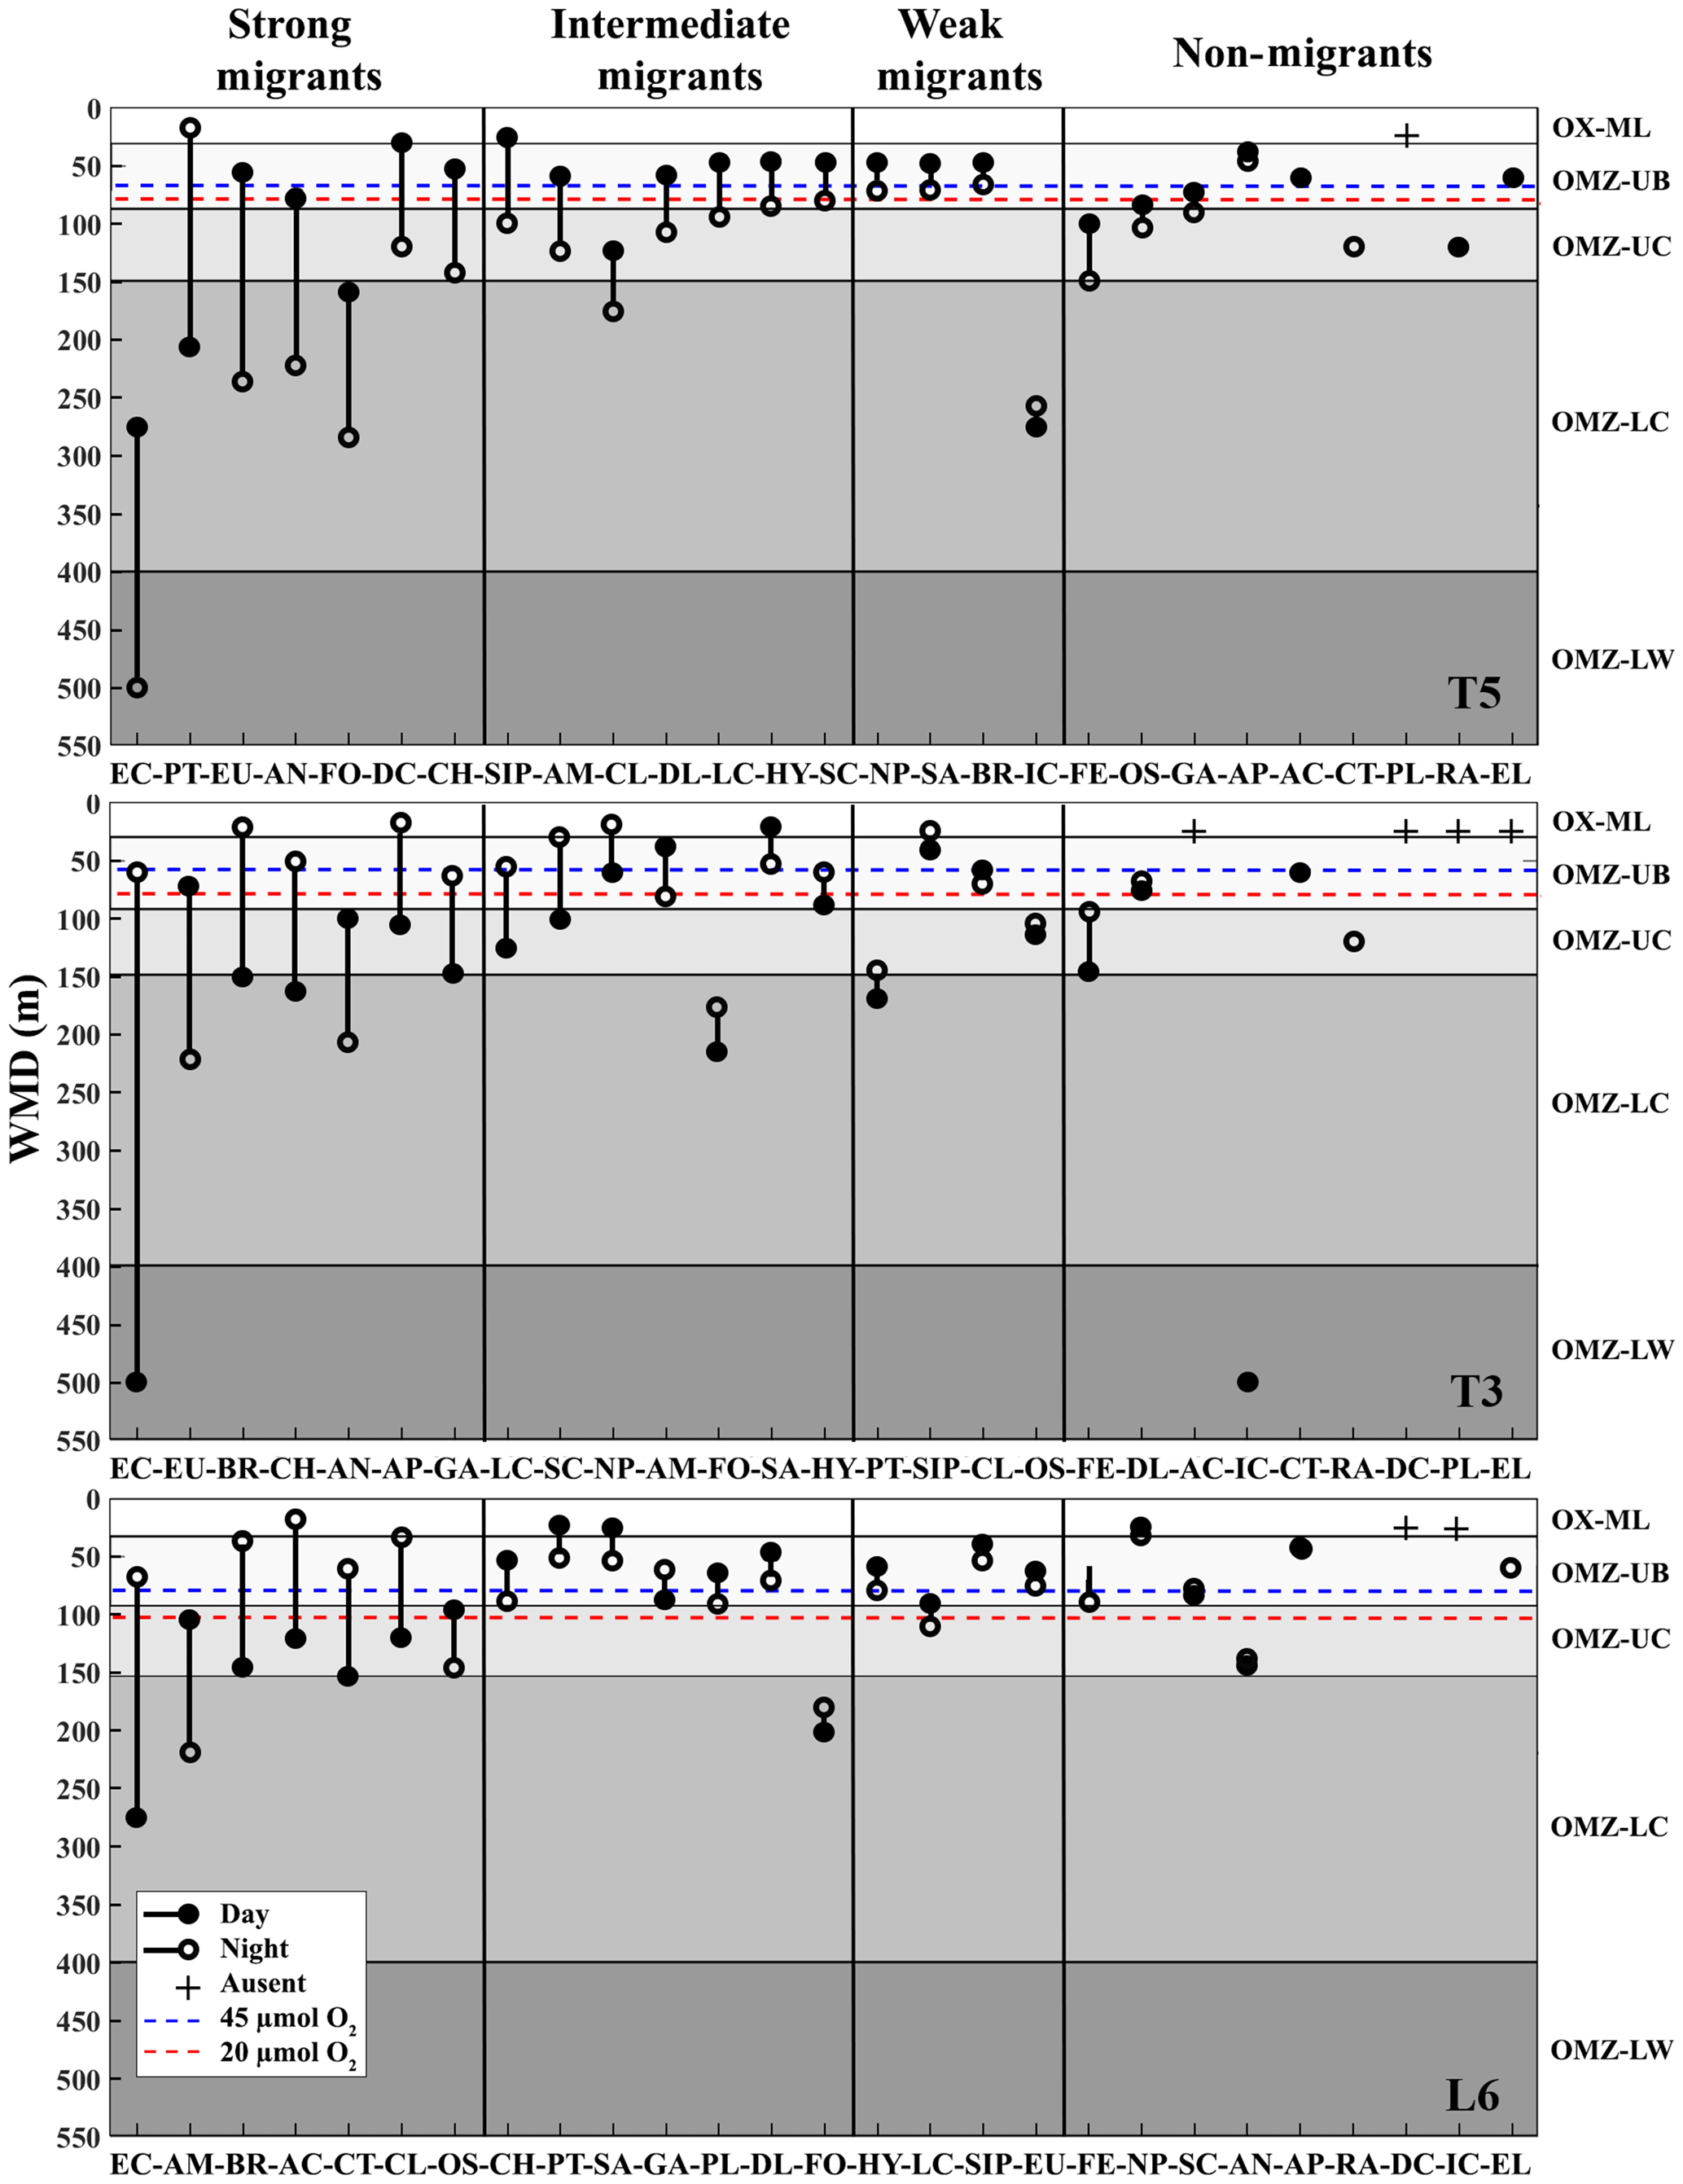
Figure 3Weighed mean depth distribution (WMD) of the zooplankton community interacting with the OMZ off Iquique (Stations T5 and T3) and off Coquimbo (Station L6) at the northern upwelling area of Chile during the austral spring 2015. Shaded gray areas represent different layers defined by their oxygen levels (defined in Methods). The taxonomic groups were classified by automated analysis (ZooScan): EC is eucalanid copepods, AM is amphipods, BR is Bryozoa larvae, AC is Acartia copepods, CT is ctenophores, CL is Cirripedia larvae, OS is ostracods, CH is chaetognaths, PT is pteropods, SA is salps, GA is gastropods, PL is Platyhelminthes, DL is Decapoda larvae, FO is Foraminifera, HY is Hydrozoa, LC is large copepods, SIP is siphonophores, EU is euphausiids, FE = fish eggs, NP is nauplii, SC is small copepods, AN is annelids, AP is Appendicularia, RA is radiolarian, DC is decapods, IC = ichthyoplankton, EL = echinoderm larvae.
Table 1Diel vertical migration indices for 27 taxonomic groups (Taxa) identified and sorted by ZooScan at three stations off northern Chile (see Fig. 3 for acronyms), during the austral spring 2015. Amplitude of migration (ΔDVM) is in meters. Positive values indicate normal DVM and negative values indicate reverse DVM (see Methods). Four groups are defined in according to DVM behavior. Relative abundances are shown in %.
3.4 Vertical distribution and DVM of dominant groups
Vertical distributions of zooplankton were assessed for 5 taxonomic groups, which represented 80 % of total abundance in average: copepods represented by small copepods, large copepods, eucalanid copepods and Acartia copepods; euphausiids; decapods larvae; chaetognaths and annelids, as well as their patterns of strata–station–abundance relationships are detailed in Table S4. The abundance of these zooplankton groups regarding depth strata was significantly different (ANOSIM, p<0.05) at each station and therefore represent distinctive microhabitats characterized by specific depth and oxygen concentration. In general, the higher abundance (> 80 %) was found in the shallower strata and well oxygenated layers (OX-ML and OMZ UB) (> 250 µmol O2 kg−1), and then it decreased rapidly in the strata associated with the OMZ core (OMZ-UC and OMZ-LC). Below this stratum a second slight peak in abundance was in the OMZ-LW in special at Sts. T5 and L6, occurring between 400 and 600 m, both daytime and night conditions.
As expected, copepods numerically dominated the zooplankton community both within and outside the OMZ. Small copepods (SC) were the most abundant (70 %) followed by large copepods (LC) (6 %), whereas the copepods Acartia (AC) and eucalanid copepods (EC) showed the lowest abundances among copepods. The largest aggregation of copepods (pooled data) altogether during the entire study period was at the offshore station St. T5 (87 %), where abundances reached 192 088 ind. m−2. At the onshore station (St. T3) the percentage of the contribution of copepods was 79 % and 69 % at the St. L6 (Table S5). Off Iquique, the highest abundances were in the shallower strata (OX-ML) at St. T5 (46 %) and at St. T3 (47 %), and they were reduced in the core of the OMZ at St. T5 (4 % to 1 %) and at T3 (8 % to 1 %) between 90 and 400 m, where oxygen was at the lowest concentrations (< 20 µM to 1 µM). At the St. T5, the second peak abundance was in the OMZ-LW stratum during daytime condition, where oxygen levels increased after the extremely low levels within the OMZ, while at the onshore station St. T3 it was much less and it was present during nighttime conditions. At the onshore station off 29∘ S (St. L6), which has a weaker and less extensive OMZ, the vertical distribution of abundance was similar. However, the abundance of copepods was lowest in this station (at about 69 %) in comparison with stations off Iquique, in the core of the OMZ the percentage was between 5 % and 3 %.
DVM of copepods was pronounced at onshore stations (Stations T3 and L6), but the strength of migration was higher overall at St. T3 off Iquique, as reflected by the migration indices (WMD and ΔDVM) (Table 1). The WMD of these taxa had a broad range (17–500 m), which varied significantly among copepods groups and stations, both in day and night samples (p<0.05) (Fig. 3). During the night, at the offshore station (St. T5) most copepods exhibited normal DVM, and they were concentrated mainly in the oxic surface strata (OX-M) and OMZ-UB (40–60 m) without interacting with the OMZ; an exception were the eucalanid copepods, which concentrated deeper in the OMZ-LC stratum associated with the lower core of the OMZ and showing a high ΔDVM (225 m). During the day these four groups of copepods tended to remain deeper in the stratum associated with the lower core of the OMZ (OMZ-UC) and lower O2 gradient (OMZ-LW), except for the small copepods that remained at the OMZ-UB stratum with a smaller ΔWMD (34 m). At the offshore stations (Stations T3 and L6) the DVM was reverse in most copepods, except for large copepods (LC) that showed slightly normal DVM at St. L6 off 29∘ S. At night copepods were concentrated deeper in the stratum associated with the lower core of the OMZ (OMZ-U) and lower O2 gradient (OMZ-LW), particularly Eucalanidae with a strong DVM and high ΔWMD of 440 m (St. T3) and 208 m (St. L6) and Acartia copepods with 103 m (St. L6) (Table 1). Whereas at St. L6 small copepods (SC) were caught in abundance at the OMZ-UB stratum down to 82–90 m depth, respectively (Fig. 3). During the day, copepods remained shallower than at night, although they concentrated at different depths. Small copepods were in the oxic surface strata OX-ML (St. T3) and remained in the upper boundary of the OMZ (St. L6) without detectable DVM, as judging by the small difference between their daytime and nighttime distributions (DVM ca. 4 m). Large copepods (LC), as expected, showed a normal migration and stayed inside the OMZ, concentrated in the OMZ-UC stratum (St. L6) and OMZ-UB (St. T3). Finally, Eucalanidae with a strong DVM tended to distribute in the OMZ-UC (St. T3) and the OMZ UB (St. L6) (Fig. 3).
Unlike copepods, the euphausiids were more abundant at the onshore Station L6 (< 1 %), where they reached up to 1683±473 ind. m−2 d−1. The OMZ-UB stratum was the most abundant in this station, with a peak of abundance during the daytime, however no DVM was detectable, judging by the small difference between their daytime and nighttime distributions (Fig. 3). Off Iquique, the highest abundance was also in OMZ-UB stratum at night, but with a second peak in OMZ-LC stratum during daytime in both stations (Sts. T3 and T5) (Table S4). The euphausiids appeared to perform a strong DVM in these stations (Fig. 3), with a vertical range between 236 and 56 m and a mean ΔDVM of 181 m at St. T5, and at St. T3 between 222 and 73 m with a mean ΔDVM of 149 m (Table 1).
Decapods larvae were more abundant at St. T5 (428±132 ind. m−2 d−1) and were associated with the OMZ-UB stratum, where they performed a strong normal DVM with a vertical range between 120 and 30 m, and a mean ΔDVM of 90 m (Table 1). At the offshore station (St. T3), the surface peak of abundance was in the OX-ML stratum during the day and in the OMZ-UB layer at night, where they reached up to 292±62 ind. m−2 d−1, with a weak reverse DVM (ΔDVM-7 m). Off Coquimbo (St. L6) they reached up to 400±88 ind. m−2 d−1, the OMZ-UB stratum was the most abundant, with a slight second peak in the OMZ-LW stratum during daytime, at this station the vertical range was between 70 and 48 m, with a mean ΔDVM of 22 m (Fig. 3).
The largest aggregation of chaetognaths was at the onshore station St. L6 (∼2 %), where their abundances reached up to 4755±1038 ind. m−2 d−1. The abundance and biomass of this group increased in the upper boundary of the OMZ (OMZ-UB) during day and night. No DVM was discernible for this group in this station, because of the slight difference between their daytime and nighttime distributions. By contrast, off Iquique they appeared to perform a strong DVM between the OMZ-UB and the OMZ-UC strata, as indicated by the migration indices (WMD-ΔDVM) (Table 1). However, at the onshore station (St. T3) they showed a reverse DVM.
The other main taxon, Annelida was more abundant at the onshore station St. L6, where their abundances reached up to 7395±847 ind. m−2 d−1 (Table S4). In the whole area, the highest of abundance was in the OMZ-UB, however a second peak of abundance was in the OMZ-LC during daytime at St. T5 and T3 and during the night at St. L6. The DVM of this group was high off Iquique with ΔDVM of 145 m (St. T5) and 105 m (St. T3), while at St. L6 off Coquimbo no DVM was discernible for this group.
Others groups with vertical distribution associated to OMZ UC
The remaining 19 groups constituted 11 % (in St. T5) 17 %, (in St. T3) and 27 % (in St. L6) in abundance. The DVM behavior was variable at each station, but in general it was normal at St. T5 and reverse at Sts. T3-L6 (Table 1). These groups clearly exhibited different daytime and night depths associated with the OMZ core (OMZ UC-LC). Overall, they tended to reside deeper by day and shallower by night in St. T5 than at the other sites (Fig. 3).
3.5 Vertical distribution of zooplankton biomass
Estimates (mean ± SD) of biomasses of the taxonomic groups integrated by depth strata are summarized in Table 2. These data, averaged from day and night measurements, contrast with the numerical abundances, which were dominated by copepods. In this case, the bulk of zooplankton biomass was dominated by different groups depending on stations. In terms of biomass, copepods, euphausiids, decapods L., chaetognaths and annelids accounted, more or less equally, for > 84 % in the whole area (Table 2). At the stations less affected by the effect of OMZ, the bulk of biomass was dominated by copepods ∼50 % at St. T5 and ∼40 % at St. L6, while decapods largely dominated the bulk of biomass at Station T3 (∼40 %), followed by copepods (19 %) and euphausiids (16 %) (Table 2).
Table 2Mean and standard deviation (±) of integrated biomass (mg C m−2) by taxonomic groups identified and sorted by ZooScan during daytime and nighttime conditions at three stations (T5, T3 and L6) sampled off northern Chile, during the austral spring 2015. Mean ± SD are from n=8 for Stations T5 and T3, and n=4 for Station L6.
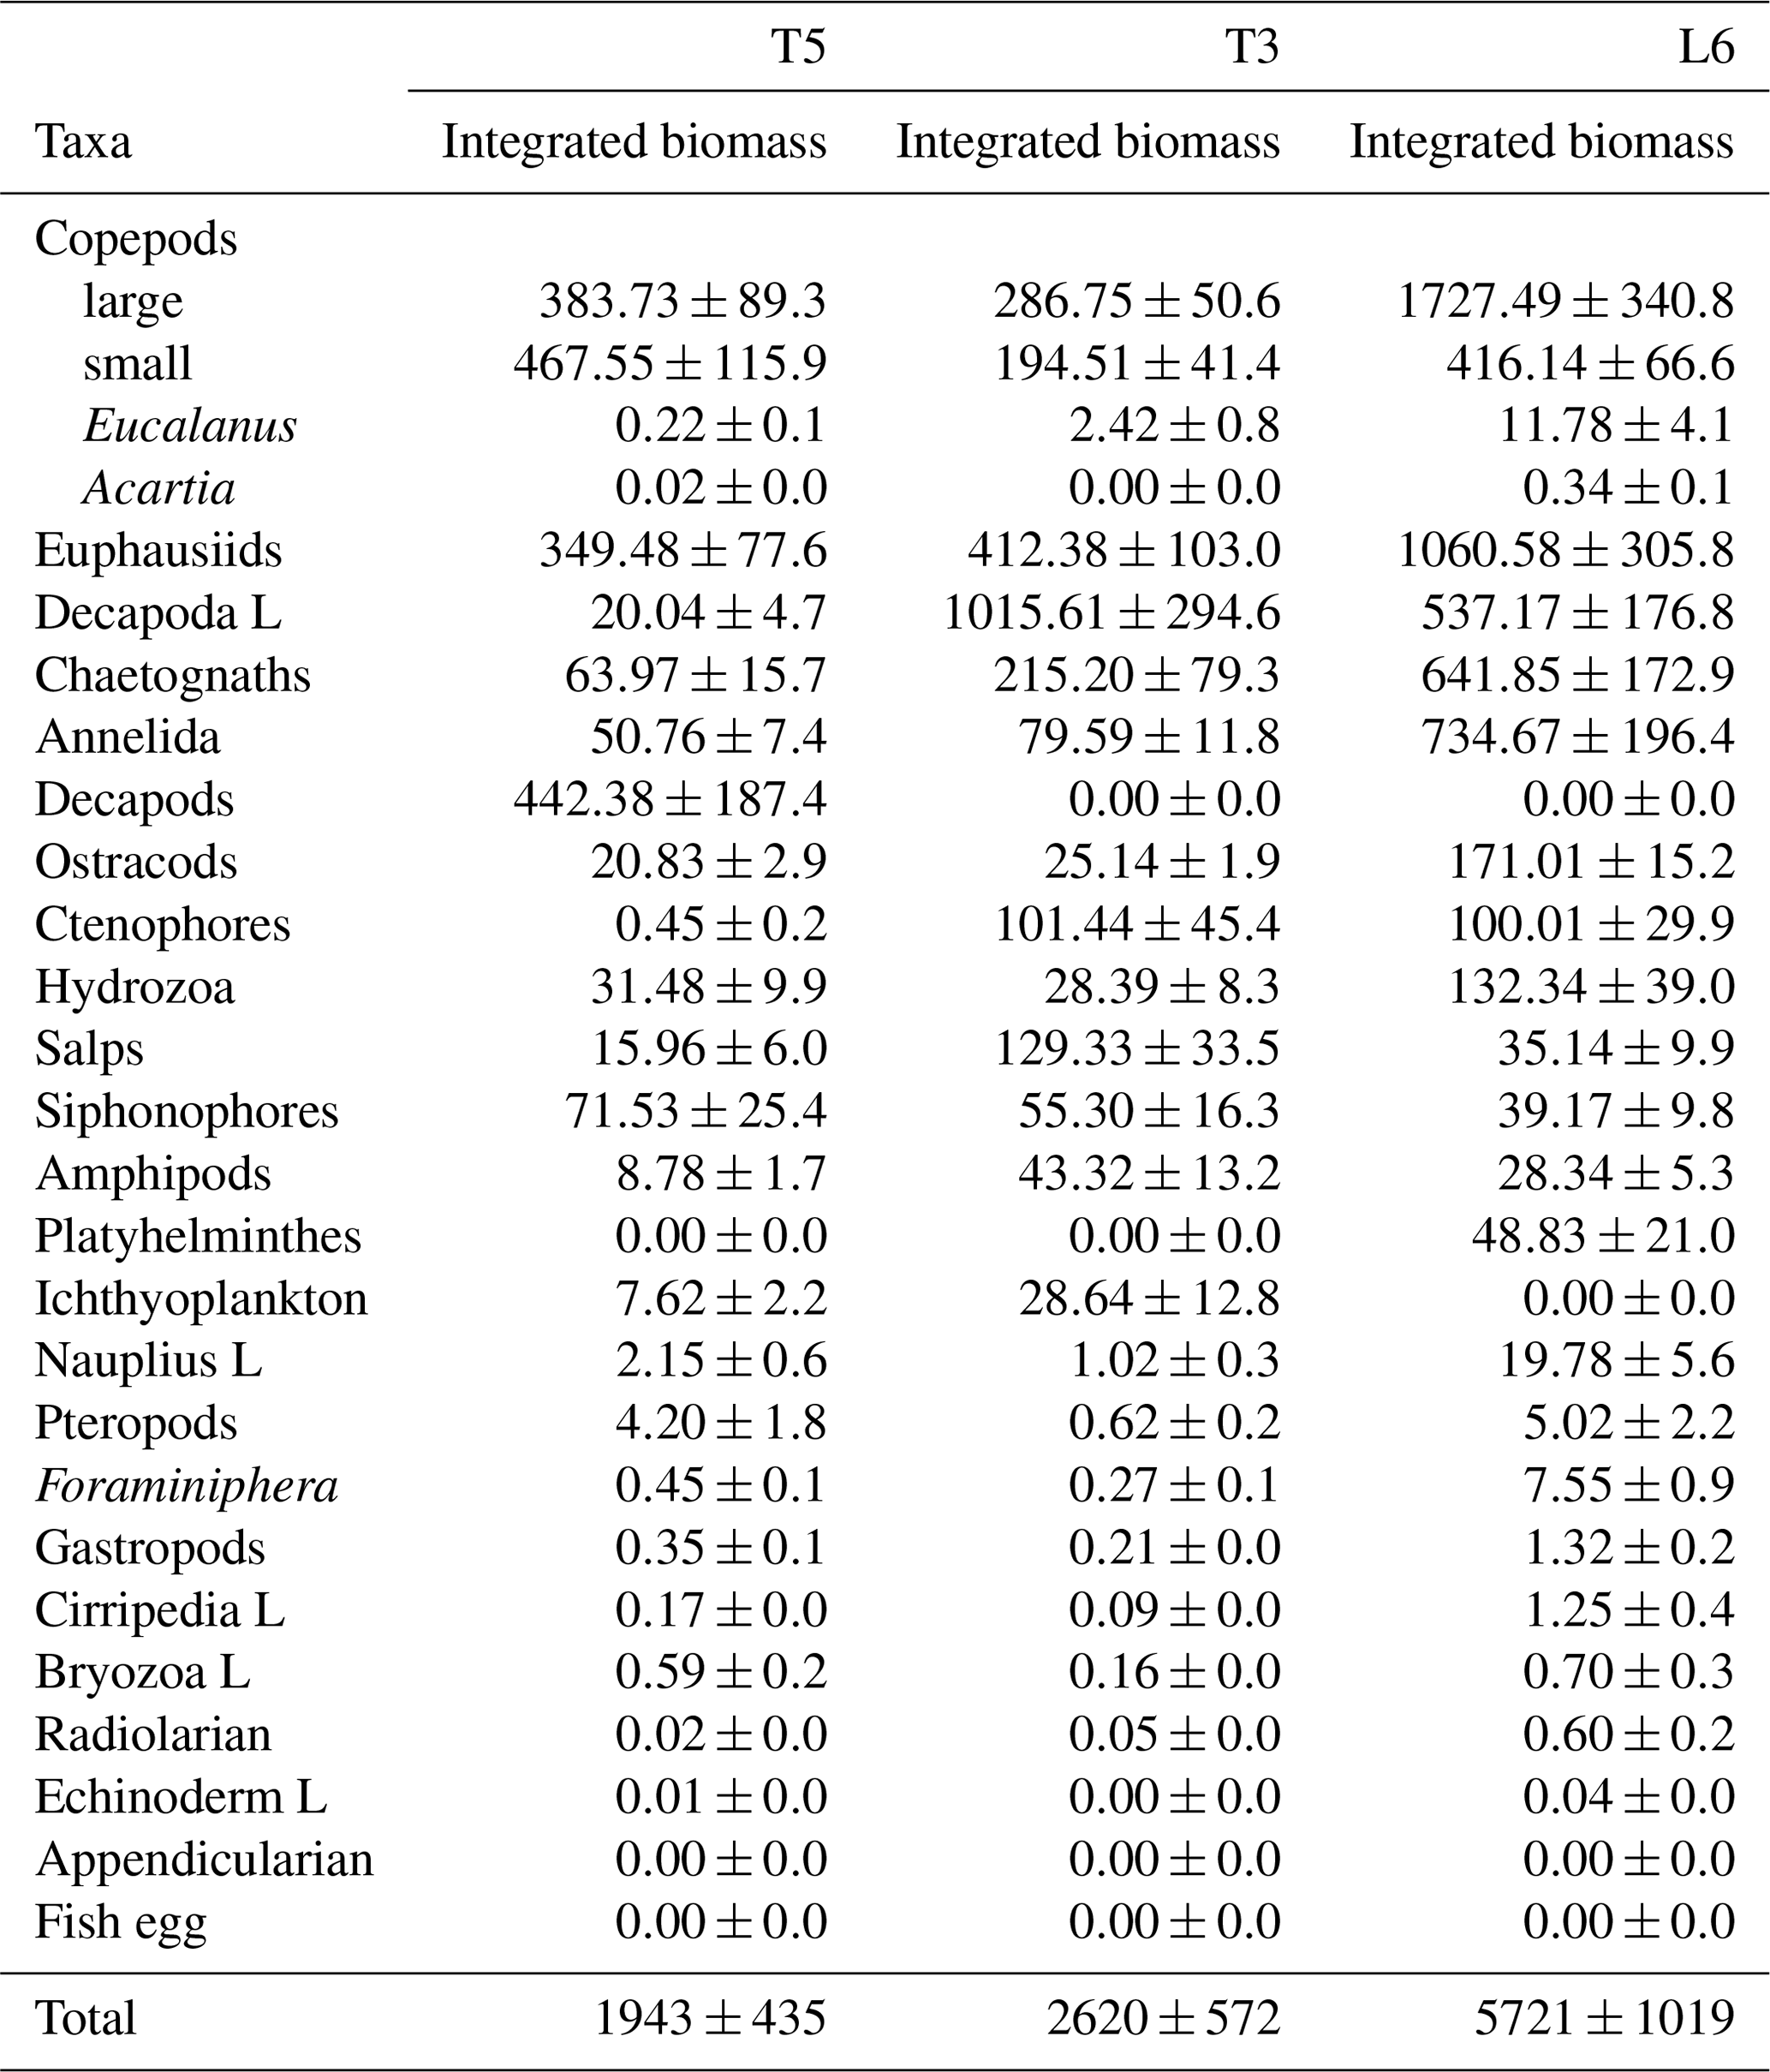
When assessing the day vs. night vertical distribution of taxonomic groups in terms of their contribution to biomass, different patterns arise compared to numerical abundance. In this case, we used nine taxonomic categories to examine vertical distribution and DVM in terms of biomass: small copepods (SC), large copepods (LC), Acartia copepods (AC), eucalanid copepods (EC), euphausiids (EU), decapod larvae (DL), chaetognaths (CH), annelids and all the other taxa (Fig. 4). Contrasting with numerical abundance, the vertical distribution of biomass was more heterogeneously divided among taxonomic groups, and DVM patterns vary strongly between stations. Small copepods continue to dominate at the St. T5 (24 %), with two peaks of biomass, a surface peak associated to the upper oxic layer (OX-ML) and OMZ-UB stratum during night condition, and a second peak associated to deeper stratum (OMZ-LW) during daytime. At the onshore Stations T3 and L6 the biomass had a similar vertical distribution but lower (∼7 %). At the Station T3 the peak of biomass was in the upper oxic layer (OX-ML) during daytime condition and then it decreased sharply within the OMZ-UB and within the OMZ core (OMZ-UC and OMZ-LC). This abrupt decrease in biomass coincides with the intense OMZ present at this station T3. The second peak of biomass during daytime was in deeper stratum (OMZ-LW), where oxygen conditions seem to be restored. Large copepods dominate at the onshore St. L6 (30 %), where their biomass reached up to 1727.49±340.8 mg C m−2 d−1 (Table 2). A surface peak of biomass was associated with OMZ-UB stratum during daytime condition, and a second peak was associated with deeper stratum (OMZ-LW) also during daytime. Off Iquique, they were the second dominant group with a surface peak in OX-ML stratum during night at St. T5 and during daytime at St. T3, and with a second peak in the deeper stratum (OMZ-LW) during daytime in both stations (Fig. 4). The biomass of Eucalanidae and Acartia copepods were lower than the other copepods in the whole area, but in general Eucalanidae were associated to the deeper stratum.
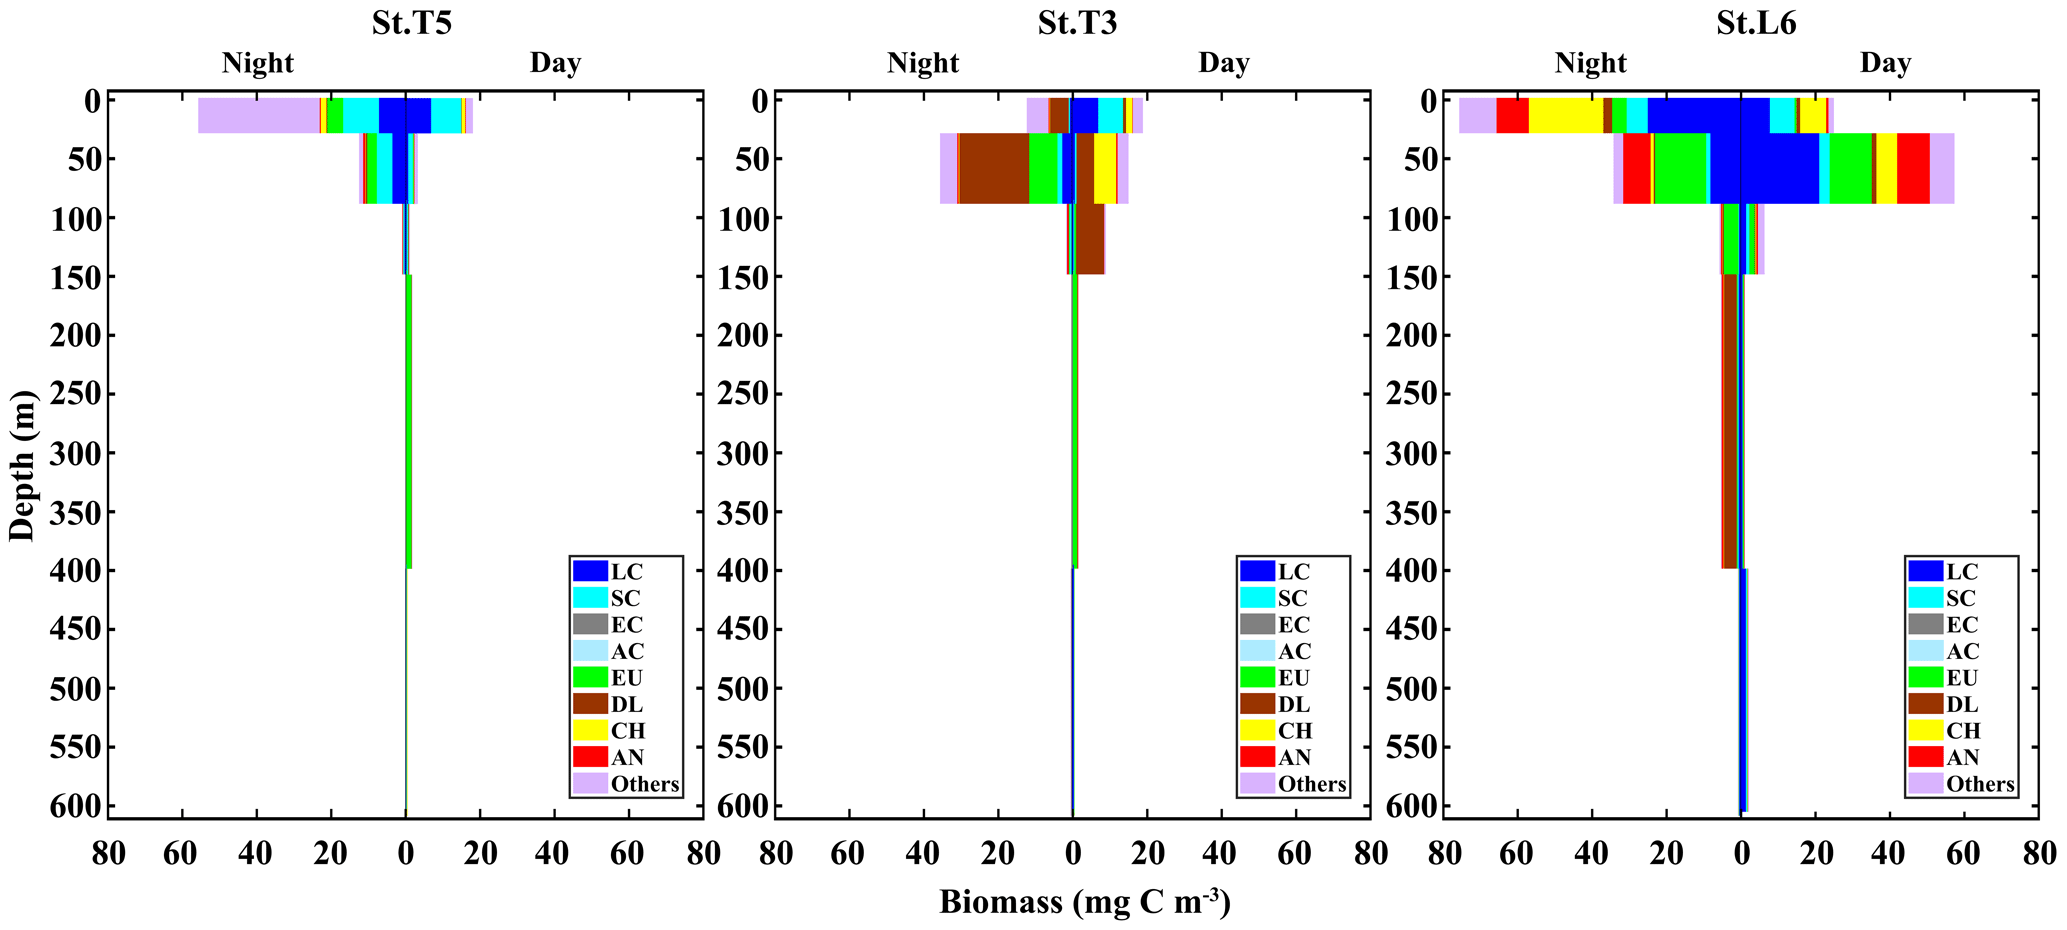
Figure 4Daytime vs. nighttime vertical distribution of biomass of dominant taxonomic groups at three stations off northern Chile: off Iquique (Stations T5 and T3) and off Coquimbo (Station L6). Data are from night and day replicated samples during 2 consecutive days in the austral spring 2015. Values represent means from sampling size n=4 for Sts. T5 and T3, and n=2 for St. L6.
Following copepods, euphausiids were the second dominant group in term of biomass in the whole area. In general, their ascent from deep layers to the upper ones at night was also evidenced by increasing proportions of this group in the OMZ-UB stratum at night. The highest biomass was in St. L6 (19 %), where it reached up to 1060.58±305.8 mg C m−2 d−1 (Table 2). A surface peak of biomass was associated to OMZ-UB stratum during night conditions, decreasing in the deep strata (Fig. 4). Across of the zonal section off Iquique, two peaks of biomass were in both stations. A surface peak was in OMZ-UB stratum during night condition followed by lower biomass within the OMZ core, then a second peak was in the OMZ-LC during daytime.
Decapod larvae clearly dominated over copepods in the St. T3 (39 %). The high biomass was in OMZ-UB stratum during night conditions followed by lower biomass within the OMZ core. During night condition at the St. L6, a second peak of biomass was observed. Chaetognaths and annelids were other groups with an important vertical movement of biomass between day and night across strata, and like other groups they had two peaks of biomass. The high biomass was at St. L6 in both groups (Fig. 4).
Total added biomass of zooplankton revealed more clearly DVM behavior of the whole zooplankton community (Fig. 5). The vertical distribution and daytime vs. nighttime variability of zooplankton biomass showed distinctive features associated with the OMZ structure, with significant differences (p<0.05) between strata for both daytime and nighttime samplings, as based on the ANOSIM test (p<0.05). In the whole area most of the biomass was concentrated in a narrow band within the OX-ML and OMZ UB strata associated with more oxygenated surface waters, with reduced values in deeper waters associated with the OMZ core, especially at the onshore station off Iquique (St. T3) (Fig. 5). Overall, we observed that highest values of biomass were during the night at the shallower sampling stratum (Ox-ML) and in the subsurface during the day. There was also an important increase in biomass at the deepest stratum (OMZ-LW) during daytime and night conditions.
Figure 5Vertical distribution of total zooplankton biomass during daytime and nighttime conditions at three stations off northern Chile: off Iquique (Stations T5 and T3) and off Coquimbo (Station L6) during 2 consecutive days in the austral spring 2015.).
Migrant biomass of the zooplankton taxa
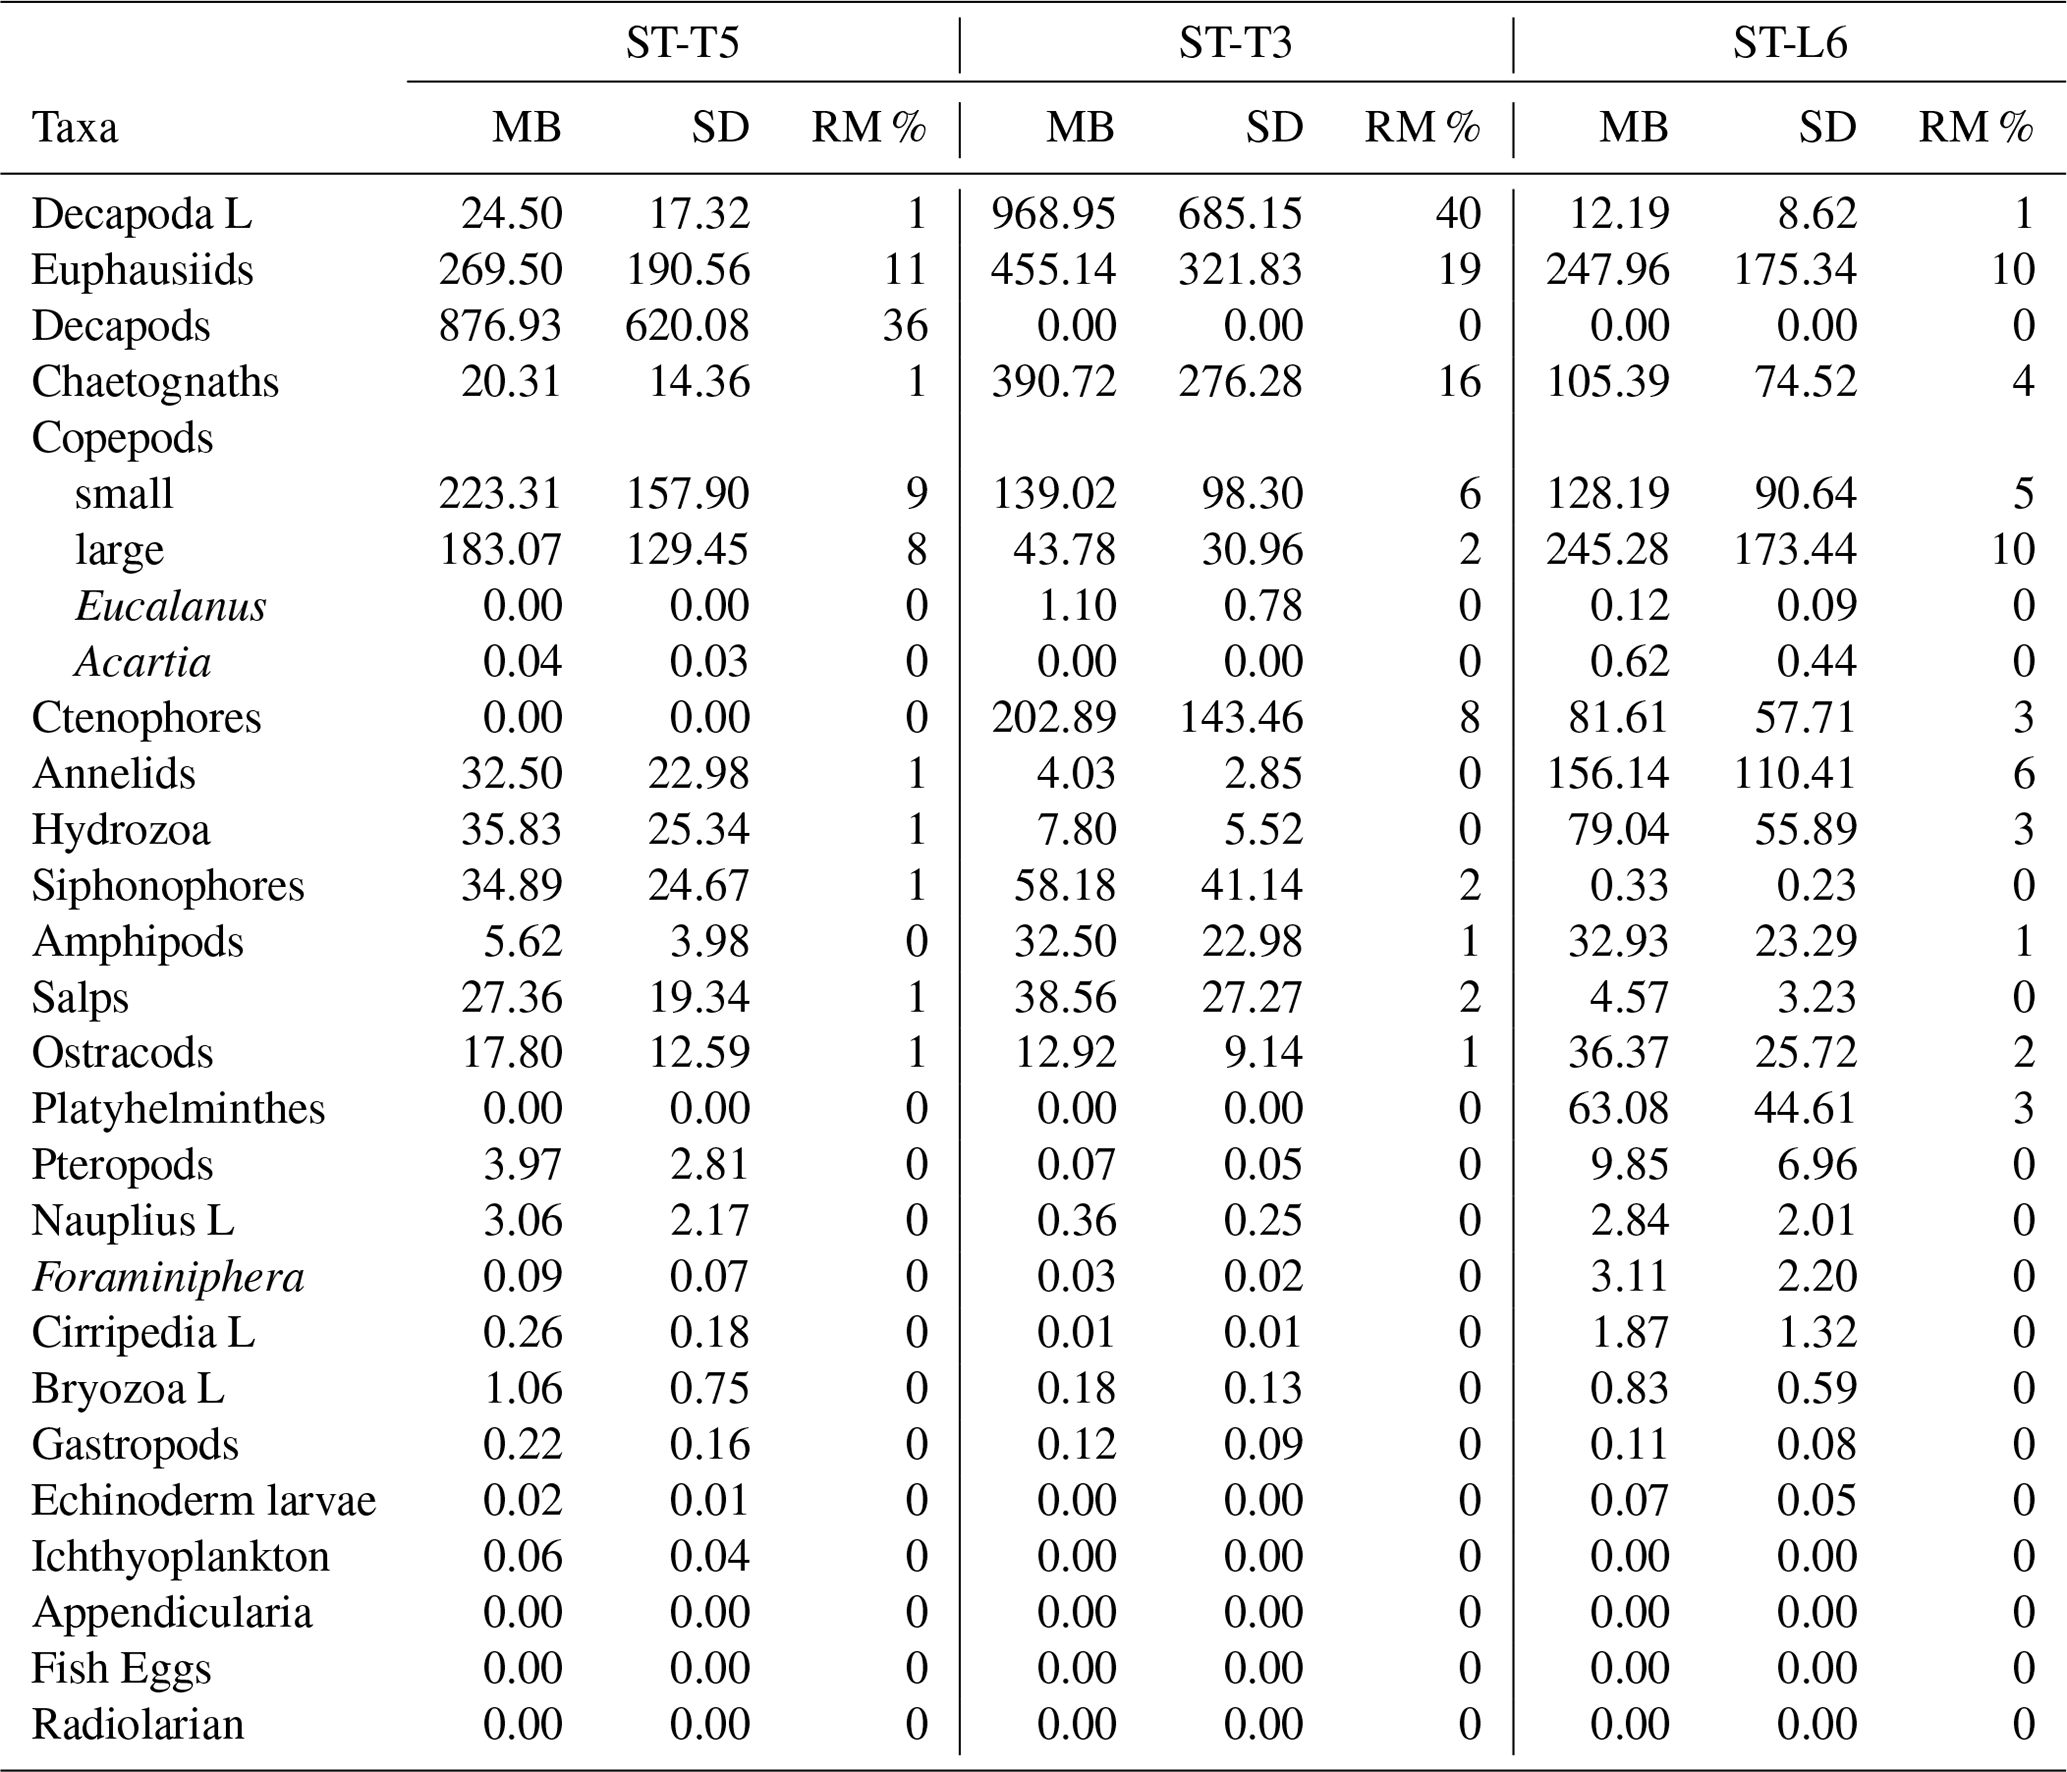
The migrant biomass of the zooplankton taxa and the rate of migration (RM), represented by the proportion of biomass (%) being vertically moved daily from the upper 90 m, are shown in Table 3. Most dominant groups showed a high rate of migration as reflected in the RM. In terms of migrant biomass, Decapod larvae, euphausiids, decapods, copepods and chaetognaths accounted for a large proportion of total migrant biomass (81 %), although high estimates of migrant biomasses were also associated with high standard deviations, indicating a strong variation among replicated samples (Table 3). Presence of zero values in Table 3 represents absence of a given taxonomic group in the upper 90 m layer or extremely low values of biomass under both daytime and nighttime conditions (such groups did not contribute or had a non-significant contribution to total migrant biomass).
Table 3Migrant biomass (mg C m−2) and rate of migration (RM) (%) for taxonomic groups of zooplankton sampled off northern Chile at three stations: off Iquique (Stations T5 and T3) and off Coquimbo (Station L6) during the austral spring 2015. RM represents the proportion (%) of migrant biomass with respect to total biomass found at night in the 0–90 m for a given taxonomic group. SD is standard deviation of the migrant biomass estimated from n=4 (Sts. T5 and T3) and n=2 (St. L6).
Studies on zooplankton DVM and the active transport of C mediated by zooplankton have been documented previously for the Pacific Ocean and for other areas of the world's oceans, as summarized in Table 4. However, downward C flux due to DVM in highly productive upwelling regions, such as northern Chile, which is also characterized by severe subsurface hypoxic conditions upon presence of a shallow OMZ, is still poorly understood. Some studies have shown that hypoxic conditions can interfere with DMV of many meso- and macrozooplankton species (Wishner et al., 2013; Ekau et al., 2010; Escribano et al., 2009; Apablaza and Palma, 2006; Antezana, 2002; Escribano, 1998). These studies have shown that small differences in oxygen concentration can make a large difference for zooplankton behavior, physiology and adaptation (Wishner et al., 2018; Kiko et al., 2016; Seibel, 2011; Gonzalez and Quiñones, 2002; Escribano and McLaren, 1999). Therefore, it seems that the OMZ can play a very significant role influencing vertical distribution, DVM and ultimately the downward C flux mediated by zooplankton.
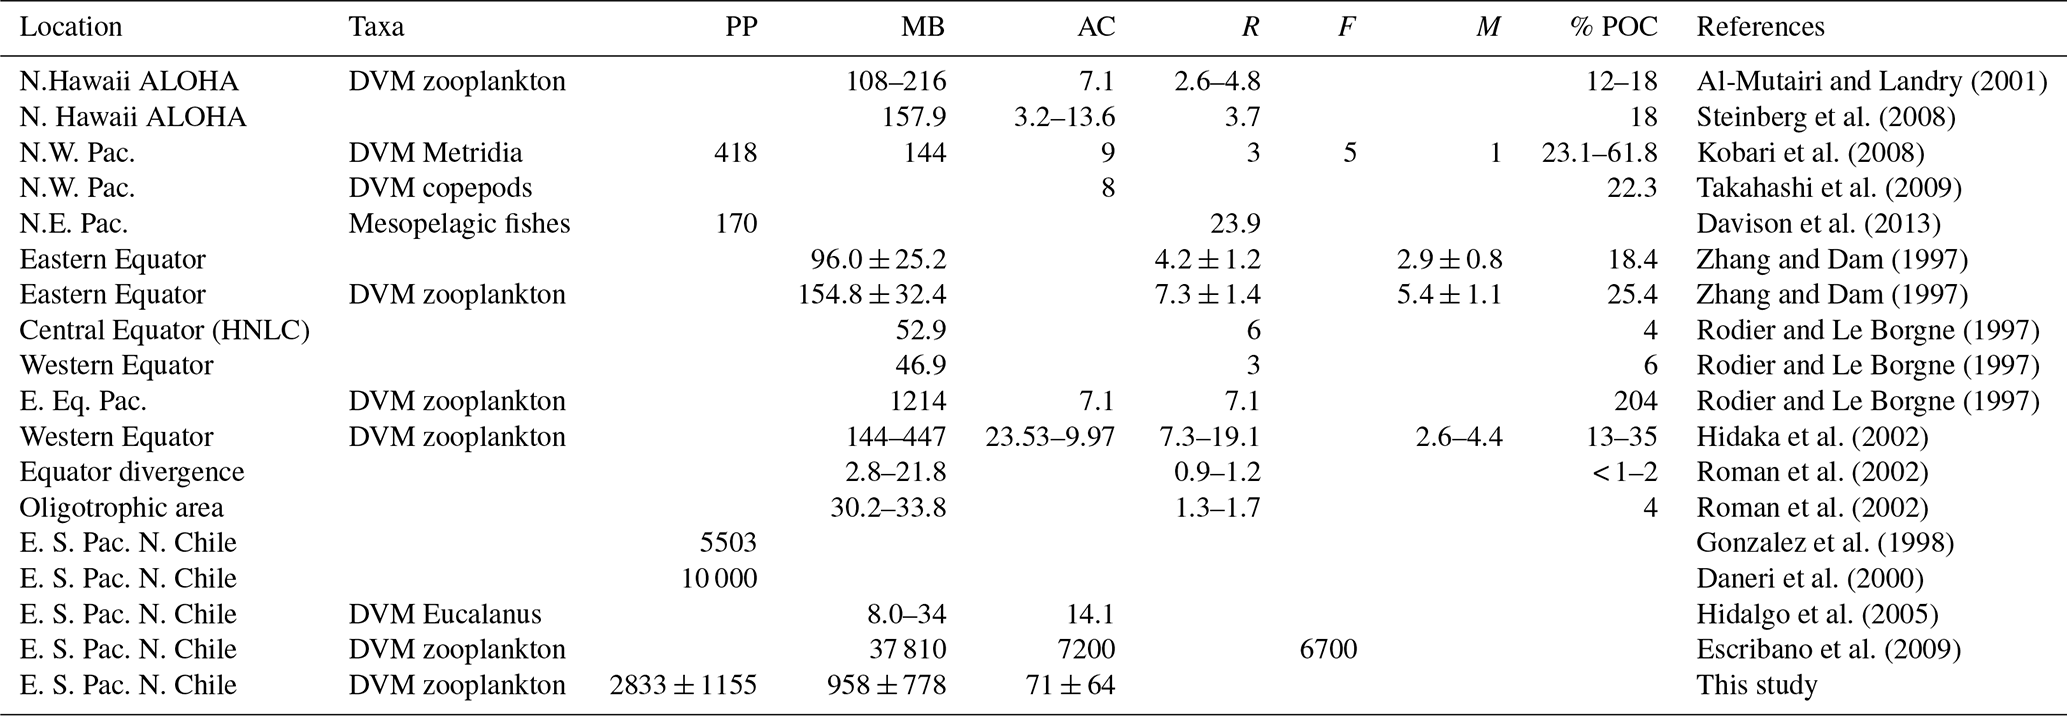
Table 4Comparison of active transport of carbon (AC) (mg C m−2 d−1) by vertically migratory taxa in Pacific Ocean. Diel vertically migratory taxa (DVM), productivity primary (PP) (mg C m−2 d−1), migrant biomass (MB) (mg C m−2), respiratory loss (R) (mg C m−2 d−1), faecal pellets production (F) (mg C m−2 d−1) and mortality (M) (mg C m−2 d−1). Where provided by authors, estimated passive export (POC) is listed. Fluxes refer to carbon export beneath the epipelagic zone (150–200 m depth, depending on the study) in mg C m−2 d−1.
Our approach to assess downward C flux into the oxygen minimum zone, based on estimates of the migrant biomass and our proposed migration indices, allowed us on one hand to examine the contribution that different zooplankton can have to the vertical flux of C and hence export production. On the other hand, it allowed us to assess zooplankton responses (e.g. vertical distribution and DVM performance) to changes in environmental conditions over the vertical gradient, such as temperature, water density and the abrupt changes in oxygenation levels. In this subtropical upwelling region, vertical gradients are much stronger than in temperate upwelling zones. For example, the coastal zone in this region is more stratified and has a very shallow OMZ (< 50 m) with a weak seasonal signal and moderate upwelling throughout the year (Paulmier and Ruiz-Pino, 2009; Fuenzalida et al., 2009; Escribano et al., 2004). This means that zooplankton must cope with hypoxic conditions during their entire life cycle, except for some species that may reside in near surface water (< 30 m), such as C. chilensis and C. brachiatus which have been reported as mostly restricted to the upper layer without performing any substantial DVM (Escribano et al., 2012, 2009; Escribano and Hidalgo, 2000; Escribano, 1998).
The vertical distribution and diurnal variability of zooplankton biomass seem to be disturbed by the OMZ, such that high biomass aggregates above the oxycline in a narrow band within the OX-ML and OMZ-UB layers, associated with more oxygenated surface waters, whereas extremely low biomass reside in deeper waters, in particular within the OMZ core. This condition was more evident in the coastal station off Iquique (St. T3), characterized by the most intense OMZ in the whole study area. In the eastern tropical North Pacific, biomass distribution seemed different, exhibiting a secondary peak at depth during the daytime within the upper oxycline or OMZ core (Wishner et al., 2013).
Regarding the estimates of biomass for each of the taxonomic groups, our approaches can certainly introduce variation, depending on selected regressions and conversion factors from highly diverse body shapes and body densities of the zooplankton taxa affecting the estimates of body area and volume, dry weight and C content. Various approaches have been adopted for converting sizes to body masses. For example, Lehette and Hernández-León (2009) provided some general regression equations for subtropical and Antarctic zooplankton describing the relationship between scanned area and body mass (C content). These authors also proposed two separate regressions for crustacean and gelatinous zooplankton, because of different body densities. In our study, we adopted more direct estimates of body masses by converting individual areas or volumes (from ZooScan) using published regressions for separate taxonomic groups. Also, in our samples there was a high diversity of taxonomic groups as identified by ZooScan, such that unique regressions for crustacean and gelatinous organisms may lead to strong biases in body mass estimates, because of high variability in C content, which is the key component of body mass needed to estimate C flux. Therefore, the use of taxa-specific conversion factors, as those detailed in our Table S3 is strongly recommended.
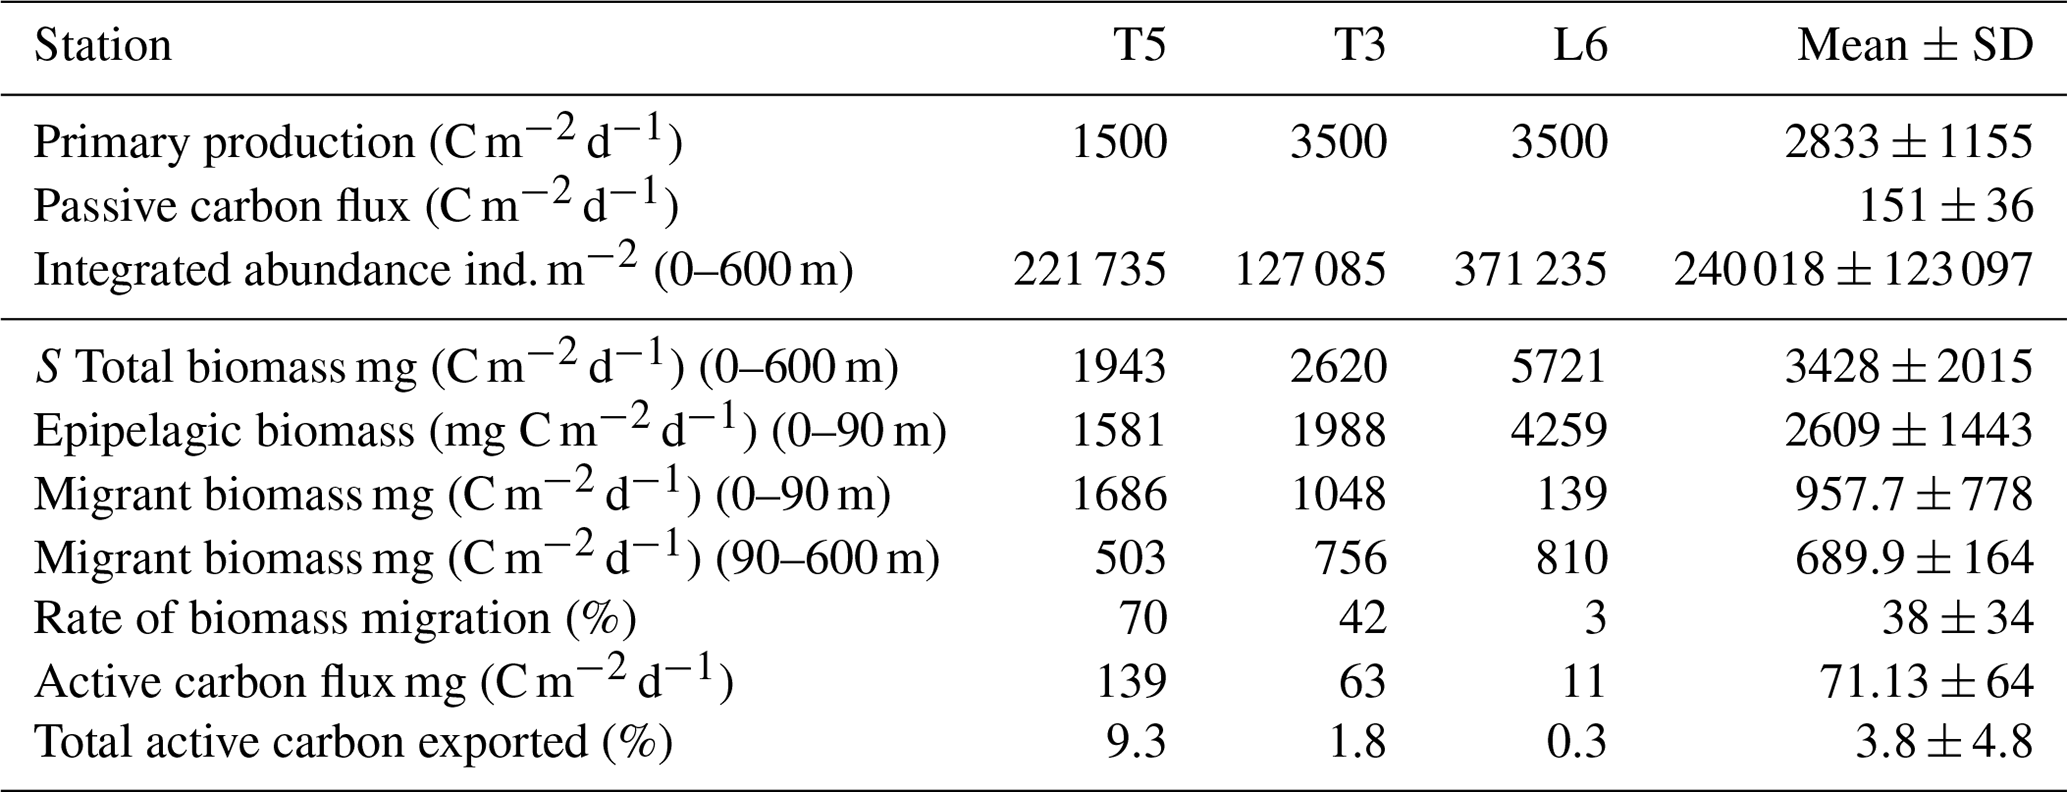
Table 5Mean net primary production rate and estimates of daily downward C flux due to passive sinking and mediated by diel vertical migration (DVM) of mesozooplankton at three stations (T5, T3 and L6) in the coastal upwelling region off northern Chile during the austral spring 2015. Primary production represents satellite-based estimates of monthly mean (November–December 2015) at the three sampling stations. Passive C flux is a mean value estimated from sediment traps by González et al. (2000) off Antofagasta (northern Chile, 23∘ S) for January 1997. Total biomass and epipelagic biomass are mean observed values from day–night conditions after 2 consecutive days of sampling.
Despite the apparently hostile oxygen-deficient habitat, associated with the OMZ, we found that most taxa were able to perform DVM in the upwelling zone withstanding severe hypoxia. Even, several zooplankton groups are strong migrants, exhibiting large DVM amplitude (∼500 m). Among them, an important migrant group is comprised by the eucalanid copepods, which have been described as even being able to enter the core of the OMZ and then migrate downward to the lower limit of the OMZ, which is slightly more oxygenated (Hidalgo et al., 2005). In our study however, their contribution to total migrant biomass was too small (ca. 0.4 mg C m−2 d−1), as compared to the estimate made by Hidalgo et al. (2005). In fact, the migrant biomass and rate of migration of this group was non-significant when considering DVM between the upper 90 m and below, suggesting a little or no contribution to downward flux of C for this group of copepods. However it seems that eucalanid copepods remain below the oxycline or nearby the base of the oxycline day and night, as shown by their weighted mean depth (WMD) and therefore suggesting that they may still contribute to vertical flux by feeding at the base of the oxycline at night and then migrating into the OMZ during the day.
Other taxa, such as euphausiids, Acartia spp., other copepods, ctenophores, decapods, Annelidae, Bryozoa L, pteropods and chaetognaths tended to concentrate their populations inside the OMZ core showing a strong link to the OMZ with important movement throughout the water column. Antezana (2010) showed that E. mucronata, an endemic and abundant euphausiid in the coastal upwelling zone off Chile, is a well-adapted species to vertically migrate into the core of the OMZ. In fact, the euphausiids studied here showed a large DVM amplitude (∼250 m), descending into the core of the OMZ and below 250 m each day. In general, all strong migrants' taxa showed a strong interaction with the core of OMZ, remaining there either temporarily or permanently during day or night conditions, contributing in this way to the release of C below the thermocline, despite presence of hypoxic conditions.
Our estimates of DVM-mediated C flux showed that migrant biomass (958±778 mg C m−2 d−1) and C flux estimates (71±64 mg C m−2 d−1) of the major taxa performing DVM were greater than those reported for the Pacific Ocean, both in oligotrophic, such as Hawaii, and mesotrophic waters such as the subarctic North Pacific (Steinberg et al., 2008), and even greater than that informed by Yebra et al. (2005) within eddies with enhanced biological production. Most of these previous estimates however have not been done in regions with severe hypoxia or anoxia at mid water depths (e.g. Kiko et al., 2016), such as the highly productive upwelling region of the coastal zone off northern of Chile, where the oxygen concentrations may fall below < 1 µmol in the core of OMZ (Paulmier and Ruiz-Pino, 2009). Moreover, only few works have considered the whole zooplankton community (Table 4). High productivity and strong aggregation of zooplankton in coastal areas of this region (Escribano et al., 2000; Escribano and Hidalgo, 2000) may promote greater amounts of migrant biomass. This requires however that DVM should not be majorly constrained by presence of the OMZ and that most migrant taxa are tolerant to low oxygen. On the other hand, our estimates of downward C flux were substantially lower than previous ones reported off northern Chile by Hidalgo et al. (2005) for Eucalanus inermis alone (14.1 mg C m−2 d−1). Although, such previous estimates may be too high, considering the level of primary production in the upwelling zone of Chile (∼10 000 mg C m−2 d−1, the maximum estimated value) (Daneri et al., 2000). It should be noted that potential contribution to C at depth by faecal pellet production (egestion) was not considered in our estimate of active transport. The lack of an estimate of ingestion rates at the upper layer (nominally 0–90 m) precludes us to make reliable calculations of egestion at depth. We also consider that in situ production of faecal pellets at depth (below the thermocline) and its actual contribution to active transport of C need further study, and it should be estimated for particular feeding conditions.
Differences in our estimates with previous works may also be accounted for by strong variability of zooplankton abundance in the upwelling zone. In fact, our estimates of migrant biomasses of the different taxonomic groups based on 2 d of sampling and two replicates for each condition (day and night) are strongly variable, as shown by the standard errors in Table 3, which can be as much as 100 % from the mean value. Therefore, comparisons must take caution upon strong time–space variation when assessing zooplankton abundance. Nevertheless, a strong spatial variation in migrant biomass was also evident when comparing the three sampling stations. For instance, St. L6 had more biomass than the other stations, but much less migrant biomass in the upper layer (Table 5), and thus a very low contribution to vertical flux of C by DVM. At station L6, large copepods, euphausiids, annelids and chaetognaths largely contributed to biomass, although they did not show significant DVM. Therefore, species composition and their DVM behavior appear as a key factor to determine the downward flux of C mediated by active transport. Even although the OMZ did not greatly prevent DVM migration, zooplankton behavior appeared disrupted or exhibited reversed patterns, depending on vertical distribution of OMZ and on the taxonomic group being considered. This behavior was more evident at the onshore stations (Stations T3 and L6), but in particular at the station off Iquique (St. T3) that also showed a higher migration rate (60 %). According to Ekau et al. (2010), other indirect effects could also be caused by the hypoxic conditions, such as changes in prey availability, prey size or predation risk, as well as changes in species composition, the strength of which depends on the duration and intensity of the hypoxic events. This could explain why individuals with in a single population can perform reverse, normal, or non DVM, apparently depending on the more important sources of mortality: predation by nocturnal feeding, normally migrating carnivorous zooplankton or visually hunting planktivorous fish (Ohman, 1990). These kind of DVM behaviors can only be better assessed and understood when looking at the population level, although again time–space variation in zooplankton abundance in a highly heterogeneous upwelling zone should be kept in mind. It is important to consider that our automated analysis of the zooplankton community may not account for differences in species composition between stations or between strata, and therefore changing DVM behavior within assigned groups between stations, such as strong migrants, or non-migrants may obey to variable species compositions. Although the possibility that same populations change their DVM performance depending on changing environmental conditions cannot be discarded, in particular referring to vertical distribution of oxygen. Such effects may provide explanations for observed variation in migrant biomass between stations, but also between strata. In fact, we noted strong differences in estimates of migrant biomass when comparing the upper 0–90 m stratum and the deeper 90–600 m stratum (Table 5, also by taxa in Table S7). Furthermore, sampling biases should also be considered, especially when using a vertically towed MultiNet which may not properly sample large-sized zooplankton at daytime conditions in the 0–90 m because of net avoidance, introducing a source of variation when comparing surface vs. deeper layers under daytime and nighttime conditions.
Concerning C fluxes, our estimates of active transport of carbon by zooplankton were about half the estimates of passive C sinking obtained off northern Chile at 60 m depth off Antofagasta (23∘ S) by Gonzalez et al. (1998) based on sediment traps (125 to 176 mg C m−2 d−1). Regarding the efficiency of active C transport mediated by DVM, we obtained satellite-based (http://www.science.oregonstate.edu/ocean.productivity/, last access: 17 December 2019) estimates of net primary production (monthly means for November–December 2015) for the coastal area (Stations T3 and L6) and for the coastal transition zone (Station T5), averaged for the months of November and December 2015. Our estimates of downward C flux represented a mean of ca. 4 % of export of carbon resulting from net primary production in the upwelling region, estimated in the range of 1500–3500 mg C m−2 d−1 (Table 5). If we consider this is accounted only by mesozooplankton, then an important fraction of freshly produced C might be taken downward by zooplankton, and this DVM-mediated C flux ought to be taken into account when analyzing and modeling the C budget in the upwelling zone.
In the coastal upwelling zone off northern Chile the presence of a subsurface oxygen minimum zone (OMZ) can impose an important constraint for diel vertical migration of zooplankton and so influences the downward C export mediated by zooplankton. We found that most of the zooplankton biomass aggregates above the oxycline associated with more oxygenated surface waters, and this was evident upon presence of a more intense OMZ. Some taxonomic groups, however, were found closely associated with the OMZ, and several taxa were able to perform DVM in the upwelling zone withstanding severe hypoxia. Also strong migrants, such as large sized copepods and copepods of the group Eucalanidae and euphausiids, can exhibit a large migration amplitude (∼500 m), remaining either temporarily or permanently during day or night conditions within the core of the OMZ, and so contributing to the release of C below the oxycline (and thermocline). Our estimates of DVM-mediated C flux suggested that a mean migrant biomass of 957.7 mg C m−2 d−1 may contribute about 71.1 mg C m−2 d−1 to the OMZ system through respiration, mortality and C excretion a at depth, accounting for ca. 4 % of the net primary production and thus implying the existence of a efficient mechanism to incorporate freshly produced C into the OMZ. This downward C flux mediated by zooplankton DVM is however strongly dependent on the taxonomic structure due to variable migration amplitude and DVM behavior. These estimates should also consider the strong temporal–spatial variation in zooplankton abundance in the upwelling zone for comparison purposes.
Data from this study have been deposited on the PANGEA server (https://doi.pangaea.de/10.1594/PANGAEA.911368, Tutasi and Escribano, 2020, last access: 28 January 2020) upon publication.
The supplement related to this article is available online at: https://doi.org/10.5194/bg-17-455-2020-supplement.
Both authors have equally contributed to the research and writing of the work.
The authors declare that they have no conflict of interest.
This article is part of the special issue “Ocean deoxygenation: drivers and consequences – past, present and future (BG/CP/OS inter-journal SI)”. It is a result of the International Conference on Ocean Deoxygenation, Kiel, Germany, 3–7 September 2018.
This work has been funded by the Millennium Institute of Oceanography (IMO) (grant no. IC 120019) and the CONICYT Project (grant no. AUB 150006/12806) through which the Lowphox I cruise was conducted. We are thankful to the two anonymous reviewers who greatly contributed to improving our work. We are also grateful to Daniel Toledo for assistance during field work. The work is a contribution to IMBeR Program and SCOR EBUS WG 155.
This research has been supported by the Millennium Institute of Oceanography (grant no. IC 120019) and the CONICYT (grant no. AUB 150006/12806).
This paper was edited by Hermann Bange and reviewed by two anonymous referees.
Al-Mutairi, H. and Landry, M. R.: Active export of carbon and nitrogen at station ALOHA by diel migrant zooplankton, Deep-Sea Res. Pt. II, 48, 2083–2103, https://doi.org/10.1016/S0967-0645(00)00174-0, 2001.
Andersen, V., Devey, C., Gubanova, A., Picheral, M., Melnikov, V., Tsarin, S., and Prieur, L.: Vertical distributions of zooplankton across the Almeria-Oran frontal zone (Mediterranean Sea), J. Plankton Res., 26, 275–293, https://doi.org/10.1093/plankt/fbh036, 2004.
Antezana, T.: Vertical distribution and diel migration of Euphausia mucronata in the oxygen minimum layer of the Humboldt Current, Oceanogr. East. Pacific II, 2, 13–28, 2002.
Antezana, T.: Species-specific patterns of diel migration into the Oxygen Minimum Zone by euphausiids in the Humboldt Current Ecosystem, Prog. Oceanogr., 83, 228–236, https://doi.org/10.1016/j.pocean.2009.07.039, 2009.
Antezana, T.: Euphausia mucronata: A keystone herbivore and prey of the Humboldt Current System, Deep-Sea Res. Pt. II, 57, 652–662, https://doi.org/10.1016/j.dsr2.2009.10.014, 2010.
Apablaza, P. and Palma, S.: Efecto de la zona de mínimo oxígeno sobre la migración vertical de zooplancton gelatinoso en la bahía de Mejillones, Investig. Mar., 34, 81–95, https://doi.org/10.4067/s0717-71782006000200009, 2006.
Bray, J. R. and Curtis, J. T.: An ordination of the upland forest communities of southern Wisconsin, Ecol. Monogr., 27, 325–349, 1957.
Breitburg, D., A Levin, L., Oschlies, A., Grégoire, M., P Chavez, F., J Conley, D., Garcon, V., Gilbert, D., Gutiérrez, D., Isensee, K., S Jacinto, G., Limburg, K., Montes, I., Naqvi, S. W. A., Pitcher, G., Rabalais, N., R Roman, M., Rose, K., Seibel, B., and Zhang, J.: Declining oxygen in the global ocean and coastal waters, Science, 359, 1–11, https://doi.org/10.1126/science.aam7240, 2018.
Chang, C. Y., Ho, P. C., Sastri, A. R., Lee, Y. C., Gong, G. C., and Hsieh, C. H.: Methods of training set construction: Towards improving performance for automated mesozooplankton image classification systems, Cont. Shelf Res., 36, 19–28, https://doi.org/10.1016/j.csr.2012.01.005, 2012.
Childress, J. J. and Nygaard, M. H.: The chemical composition of midwater fishes as a function of depth of occurrence off Southern California, Deep-Sea Res. Oceanogr. Abstracts, 20, 1091–1093, 1973.
Dai, L., Li, C., Yang, G., and Sun, X.: Zooplankton abundance, biovolume and size spectra at western boundary currents in the subtropical North Pacific during winter 2012, J. Mar. Syst., 155, 73–83, https://doi.org/10.1016/j.jmarsys.2015.11.004, 2016.
Daneri, G., Dellarossa, V., Quiñones, R., Jacob, B., Montero, P., and Ulloa, O.: Primary production and community respiration in the Humboldt Current System off Chile and associated oceanic areas, Mar. Ecol. Prog. Ser., 197, 41–49, https://doi.org/10.3354/meps197041, 2000.
Davison, P. C., Checkley, D. M., Koslow, J. A., and Barlow, J.: Carbon export mediated by mesopelagic fishes in the northeast Pacific Ocean, Prog. Oceanogr., 116, 14–30, https://doi.org/10.1016/j.pocean.2013.05.013, 2013.
Donoso, K. and Escribano, R.: Mass-specific respiration of mesozooplankton and its role in the maintenance of an oxygen-deficient ecological barrier (BEDOX) in the upwelling zone off Chile upon presence of a shallow oxygen minimum zone, J. Mar. Syst., 129, 166–177, 2014.
Ducklow, H. W., Eborah, D., Steinberg, K., and Buesseler, K. O.: Upper ocean carbon export and the biological pump, Oceanography, 14, 50–58, https://doi.org/10.5670/oceanog.2001.06, 2001.
Edvardsen, A., Zhou, M., Tande, K. S., and Zhu, Y.: Zooplankton population dynamics: measuring in situ growth and mortality rates using an Optical Plankton Counter, Mar. Ecol. Prog. Ser., 227, 205–219, 2002.
Ekau, W., Auel, H., Pörtner, H.-O., and Gilbert, D.: Impacts of hypoxia on the structure and processes in pelagic communities (zooplankton, macro-invertebrates and fish), Biogeosciences, 7, 1669–1699, https://doi.org/10.5194/bg-7-1669-2010, 2010.
Escribano, R.: Population dynamics of Calanus chilensis in the Chilean Eastern Boundary Humboldt Current, Fish. Oceanogr., 7, 245–251, https://doi.org/10.1046/j.1365-2419.1998.00078.x, 1998.
Escribano, R.: Zooplankton interactions with the oxygen minimum zone in the eastern South Pacific, Supplement Gayana, 70, 19–21, 2006.
Escribano, R. and Hidalgo, P.: Spatial distribution of copepods in the north of the Humboldt Current region off Chile during coastal upwelling, J. Mar. Biol. Assoc. UK, 80, 283–290, 2000.
Escribano, R. and McLaren, I.: Production of Calanus chilensis in the upwelling area of Antofagasta, Northern Chile, Mar. Ecol. Prog. Ser., 177, 147–156, https://doi.org/10.3354/meps177147, 1999.
Escribano, R., Iribarren, C., and Marín, V.: Distribution of Euphausia mucronata; at the upwelling area of Peninsula Mejillones, northern Chile: the influence of the oxygen minimum layer, Sci. Mar., 64, 69–77, https://doi.org/10.3989/scimar.2000.64n169, 2000.
Escribano, R., Daneri, G., Farías, L., Gallardo, V. A., González, H. E., Gutiérrez, D., Lange, C. B., Morales, C. E., Pizarro, O., Ulloa, O., and Braun, M.: Biological and chemical consequences of the 1997–1998 El Niño in the Chilean coastal upwelling system: A synthesis, Deep-Sea Res. Pt. II, 51, 2389–2411, https://doi.org/10.1016/j.dsr2.2004.08.011, 2004.
Escribano, R., Hidalgo, P., and Krautz, C.: Zooplankton associated with the oxygen minimum zone system in the northern upwelling region of Chile during March 2000, Deep-Sea Res. Pt. II, 56, 1083–1094, 2009.
Escribano, R., Hidalgo, P., Fuentes, M., and Donoso, K.: Zooplankton time series in the coastal zone off Chile: Variation in upwelling and responses of the copepod community, Prog. Oceanogr., 2, 97–100, 174–186, https://doi.org/10.1016/j.pocean.2011.11.006, 2012.
Fernández-Álamo, M. A. and Färber-Lorda, J.: Zooplankton and the oceanography of the eastern tropical Pacific: a review, Prog. Oceanogr., 69, 318–359, 2006.
Fuenzalida, R., Schneider, W., Garcés-Vargas, J., Bravo, L., and Lange, C. B.: Vertical and horizontal extension of the oxygen minimum zone in the eastern South Pacific Ocean, Deep-Sea Res. Pt. II, 56, 992–1003, https://doi.org/10.1016/j.dsr2.2008.11.001, 2009.
Gonzalez, H. E., Daneri, G., Figueroa, D., Iriarte, J. L., Lefevre, N., Pizarro, G. A., Quiñones, R., Sobarzo, M., and Troncoso, A.: Producción primaria y su destino en la trama trófica pelágica y océano-atmósfera de CO2 en la zona norte de la Corriente de Humboldt (23∘ S): Posibles efectos del evento El Niño, 1997–1998 en Chile, Rev. Chil. Hist. Nat., 71, 429–458, 1998.
Gonzalez, R. R. and Quiñones, R. A.: Ldh activity in Euphausia mucronata and Calanus chilensis: Implications for vertical migration behaviour, J. Plankton Res., 24, 1349–1356, https://doi.org/10.1093/plankt/24.12.1349, 2002.
Gorsky, G., Ohman, M. D., Picheral, M., Gasparini, Stephane Stemmann, L., Romagnan, Jean-Baptiste Cawood, A., Pesant, S., García-Comas, C., and Prejger, F.: Digital zooplankton image analysis using the ZooScan integrated system, J. Plankton Res., 32, 285–303, https://doi.org/10.1093/plankt/fbp124, 2010.
Grantham, B. A., Chan, F., Nielsen, K. J., Fox, D. S., Barth, J. A., Huyer, A., Lubchenco, J., and Menge, B. A.: Upwelling-driven nearshore hypoxia signals ecosystem and oceanographic changes in the northeast Pacific, Nature, 429, 749–754, https://doi.org/10.1038/nature02605, 2004.
Hidaka, K., Kawaguchi, K., Murakami, M., and Takahashi, M.: Downward transport of organic carbon by diel migratory micronekton in the western equatorial Pacific: its quantitative and qualitative importance, Deep-Sea Res. Pt. I, 48, 1923–1939, https://doi.org/10.1016/s0967-0637(01)00003-6, 2002.
Hidalgo, P., Escribano, R., and Morales, C. E.: Ontogenetic vertical distribution and diel migration of the copepod Eucalanus inermis in the oxygen minimum zone off northern Chile (20–21∘ S), J. Plankton Res., 27, 519–529, https://doi.org/10.1093/plankt/fbi025, 2005.
Ikeda, T.: Metabolic rates of epipelagic marine zooplankton as a function of body mass and temperature, Mar. Biol., 85, 1–11, https://doi.org/10.1007/BF00396409, 1985.
Ikeda, T.: Respiration and ammonia excretion by marine metazooplankton taxa: synthesis toward a global-bathymetric model, Mar. Biol., 161, 2753–2766, 2014.
Judkins, D. C.: Vertical distribution of zooplankton in relation to the oxygen minimum off Peru, Deep-Sea Res. Pt. A, 27, 475–487, https://doi.org/10.1016/0198-0149(80)90057-6, 1980.
Kiko, R., Hauss, H., Buchholz, F., and Melzner, F.: Ammonium excretion and oxygen respiration of tropical copepods and euphausiids exposed to oxygen minimum zone conditions, Biogeosciences, 13, 2241–2255, https://doi.org/10.5194/bg-13-2241-2016, 2016.
Kiørboe, T.: Zooplankton body composition, Limnol. Oceanogr., 58, 1843–1850, 2013.
Kobari, T., Steinberg, D., Ueda, A., Tsuda, A., Silver, M. W., and Kitamura, M.: Impacts of ontogenetically migrating copepods on downward carbon flux in the western subarctic Pacific Ocean, Deep-Sea Res. Pt. II, 55, 1648–1660, https://doi.org/10.1016/j.dsr2.2008.04.016, 2008.
Lehette, P. and Hernández-León, S.: Zooplankton biomass estimation from digitized images: a comparison between subtropical and Antarctic organisms, Limnol. Oceanogr. Methods, 7, 304–308, https://doi.org/10.4319/lom.2009.7.304, 2009.
Longhurst, A. and Williams, R.: Carbon flux by seasonally migrating coepods is a small number, J. Plankton Res., 14, 1495–1509, 1992.
Morales, C. E., Braun, M., Reyes, H., Blanco, J. L., and Davies, A. G.: Anchovy larval distribution in the coastal zone off northern Chile: the effect of low dissolved oxygen concentrations and of a cold-warm sequence (1990–1995), Invest. Mar., Valparaíso, 24, 77–96, https://doi.org/10.4067/s0717-71781996002400007, 1996.
Morales, C. E., Davies, A. G., Braun, M., Reyes, H., and Blanco, J. L.: Anchovy larval distribution in the coastal zone off northern Chile: the effect of low dissolved oxygen concentrations and of a cold-warm sequence (1990–1995), Investig. Mar., 24, 77–96, https://doi.org/10.4067/s0717-71781996002400007, 1996b.
Ohman, M. D.: The demographic benefits of diel vertical migration by zooplankton, Ecol. Monogr., 60, 257–281, 1990.
Paulmier, A. and Ruiz-Pino, D.: Oxygen minimum zones (OMZs) in the modern ocean, Prog. Oceanogr., 80, 113–128, https://doi.org/10.1016/j.pocean.2008.08.001, 2009.
Paulmier, A., Ruiz-Pino, D., Garçon, V., and Farías, L.: Maintaining of the Eastern South Pacific Oxygen Minimum Zone (OMZ) off Chile, Geophys. Res. Lett., 33, 2–7, https://doi.org/10.1029/2006GL026801, 2006.
Putzeys, S., Yebra, L., Almeida, C., Bécognée, P., and Hernández-León, S.: Influence of the late winter bloom on migrant zooplankton metabolism and its implications on export fluxes, J. Mar. Syst., 88, 553–562, https://doi.org/10.1016/j.jmarsys.2011.07.005, 2011.
Rodier, M. and Le Borgne, R.: Export flux of particles at the equator in the western and central Pacific ocean, Deep-Sea Res. Pt. II, 44, 2085–2113, https://doi.org/10.1016/S0967-0645(97)00092-1, 1997.
Roman, M. R., Adolf, H. A., Landry, M. R., Madin, L. P., Steinberg, D. K., and Zhang, X.: Estimates of oceanic mesozooplankton production: A comparison using the Bermuda and Hawaii time-series data, Deep-Sea Res. Pt. II, 49, 175–192, https://doi.org/10.1016/S0967-0645(01)00099-6, 2002.
Seibel, B. A.: Critical oxygen levels and metabolic suppression in oceanic oxygen minimum zones, J. Exp. Biol., 214, 326–336, https://doi.org/10.1242/jeb.049171, 2011.
Seibel, B. A., Schneider, J. L., Kaartvedt, S., Wishner, K. F., and Daly, K. L.: Hypoxia Tolerance and Metabolic Suppression in Oxygen Minimum Zone Euphausiids: Implications for Ocean Deoxygenation and Biogeochemical Cycles, Integr. Comp. Biol., 56, 510–523, https://doi.org/10.1093/icb/icw091, 2016.
Silva, N. and Neshyba, S.: On the southernmost extension of the Peru-Chile undercurrent, Deep-Sea Res. Pt. A, 26, 1387–1393, https://doi.org/10.1016/0198-0149(79)90006-2, 1979.
Steinberg, D. K. and Landry, M. R.: Zooplankton and the Ocean Carbon Cycle, Annu. Rev. Mar. Sci., 9, 413–444, https://doi.org/10.1146/annurev-marine-010814-015924, 2017.
Steinberg, D. K., Carlson, C. A., Bates, N. R., Goldthwait, S. A., Madin, L. P., and Michaels, A. F.: Zooplankton vertical migration and the active transport of dissolved organic and inorganic carbon in the Sargasso Sea, Deep-Sea Res. Pt. I, 47, 137–158, https://doi.org/10.1016/S0967-0637(99)00052-7, 2000.
Steinberg, D. K., Cope, J. S., Wilson, S. E., and Kobari, T.: A comparison of mesopelagic mesozooplankton community structure in the subtropical and subarctic North Pacific Ocean, Deep-Sea Res. Pt. II, 55, 1615–1635, https://doi.org/10.1016/j.dsr2.2008.04.025, 2008.
Stramma, L., Johnson, G., Sprintall, J., and Mohrholz, V.: Expanding Oxygen-Minimum in the Tropical Oceans, Science, 320, 655–658, 2008.
Takahashi, K., Kuwata, A., Sugisaki, H., Uchikawa, K., and Saito, H.: Downward carbon transport by diel vertical migration of the copepods Metridia pacifica and Metridia okhotensis in the Oyashio region of the western subarctic Pacific Ocean, Deep-Sea Res. Pt. I, 56, 1777–1791, https://doi.org/10.1016/j.dsr.2009.05.006, 2009.
Tutasi, P. and Escribano, R.: Faunal abundance and CTD measurements of stations T3, T5 and L6 from cruise Lowphox-I during December 2015, Chile, PANGAEA, https://doi.org/10.1594/PANGAEA.911368 (https://doi.org/10.1594/PANGAEA.911389), 2020.
Ulloa, O. and Pantoja, S.: The oxygen minimum zone of the eastern South Pacific, Deep-Sea Res. Pt. II, 56, 987–991, https://doi.org/10.1016/j.dsr2.2008.12.004, 2009.
Ulloa, O., Canfield, D. E., DeLong, E. F., Letelier, R. M., and Stewart, F. J.: Microbial oceanography of anoxic oxygen minimum zones, P. Natl. Acad. Sci. USA, 109, 15996–16003, https://doi.org/10.1073/pnas.1205009109, 2012.
Wishner, K. F., Gelfman, C., Gowing, M. M., Outram, D. M., Rapien, M., and Williams, R. L.: Vertical zonation and distributions of calanoid copepods through the lower oxycline of the Arabian Sea oxygen minimum zone, Prog. Oceanogr., 78, 163–191, https://doi.org/10.1016/j.pocean.2008.03.001, 2008.
Wishner, K. F., Outram, D. M., Seibel, B. A., Daly, K. L., and Williams, R. L.: Zooplankton in the eastern tropical north Pacific: Boundary effects of oxygen minimum zone expansion, Deep-Sea Res. Pt. I, 79, 122–140, https://doi.org/10.1016/j.dsr.2013.05.012, 2013.
Wishner, K. F., Seibel, B. A., Roman, C., Deutsch, C., Outram, D., Shaw, C. T., Birk, M. A., Mislan, K. A. S., Adams, T. J., Moore, D., and Riley, S.: Ocean deoxygenation and zooplankton: Very small oxygen differences matter, Sci. Adv., 4, eaau5180, https://doi.org/10.1126/sciadv.aau5180, 2018.
Yebra, L., Almeida, C., and Hernández-León, S.: Vertical distribution of zooplankton and active flux across an anticyclonic eddy in the Canary Island waters, Deep-Sea Res. Pt. I, 52, 69–83, https://doi.org/10.1016/j.dsr.2004.08.010, 2005.
Zhang, X. and Dam, H. G.: Downward export of carbon by diel migrant mesozooplankton in the central equatorial Pacific, Deep-Sea Res. Pt. II, 44, 2191–2202, 1997.