the Creative Commons Attribution 4.0 License.
the Creative Commons Attribution 4.0 License.
 | 18 Sep 2020
Chemical destaining and the delta correction for blue intensity measurements of stained lake subfossil trees
Dominique Arseneault
Étienne Boucher
Shulong Yu
Steeven Ouellet
Gwenaëlle Chaillou
Ann Delwaide
Lily Wang
The stain of wood samples from lake subfossil trees (LSTs) is challenging the wide application of the blue intensity (BI) technique for millennial dendroclimatic reconstructions. In this study, we used seven chemical destaining reagents to treat samples of subfossil black spruce (Picea mariana (Mill.) B.S.P.) trees from two lakes in the eastern Canadian boreal forest. We subsequently compared latewood BI (LBI) and delta BI (DBI) time series along with conventional maximum latewood density (MXD) measured from the stained and destained samples. Results showed that the stain of our samples is most likely caused by postsampling oxidation of dissolved ferrous iron in lake sediments that penetrated into wood. Three reagents (ascorbic acid, sodium ascorbate, and sodium dithionite all mixed with ethylenediaminetetraacetic acid) could remove >90 % of Fe. However, even for the best chemical protocol, a discrepancy of about +2 ∘C compared to MXD data remained in the LBI-based temperature reconstruction due to incomplete destaining. On the contrary, the simple mathematical delta correction, DBI, was unaffected by the Fe stain and showed very similar results compared to MXD data (r>0.82) from annual to centennial timescales over the past ∼360 years. This study underlines the difficulty of completely destaining lake subfossil samples while confirming the robustness of the DBI approach. DBI data measured from stained LSTs can be used to perform robust millennial temperature reconstructions.
- Article
(4279 KB) - Full-text XML
-
Supplement
(8970 KB) - BibTeX
- EndNote


The blue intensity (BI) technique is an alternative to the more expensive X-ray densitometric methodology in producing proxy parameters such as maximum latewood density (MXD) for dendroclimatology (Björklund et al., 2019; McCarroll et al., 2002). MXD is the most suitable tree-ring parameter for summer temperature reconstructions in northern and high-altitude regions (Esper et al., 2014; Frank and Esper, 2005). However, compared to the less-climate-sensitive ring-width data, millennial MXD series have been much less frequently developed worldwide, mainly due to the high cost of densitometric equipment (Anchukaitis et al., 2017; St. George and Esper, 2019; Wilson et al., 2016). In contrast, BI is more affordable because it uses commercial flatbed scanners and image analysis software to measure the blue light reflectance of tree rings (Rydval et al., 2014). Excellent coherence was reported between the latewood BI (LBI) and MXD data measured from living-tree materials of a number of coniferous tree species across the Northern Hemisphere (Campbell et al., 2007; Kaczka et al., 2018; Österreicher et al., 2015; Rydval et al., 2014; Wilson et al., 2014), suggesting the potential to use BI method in dendroclimatic reconstructions (McCarroll et al., 2013; Rydval et al., 2017; Wilson et al., 2019).
However, the BI technique is also facing challenges due to heterogeneous colors of various wood materials. The best-known issue is the sapwood–heartwood color difference of several tree species such as pine and larch, which does not covary with density (Björklund et al., 2014; Rydval et al., 2014; Wilson et al., 2019). Some wood types, such as dead trees and historical materials, may also be discolored by decay or weathering (Wilson et al., 2014). Another less documented color issue occurs with lake subfossil trees (LSTs), which often have darker wood than living trees (Wilson et al., 2019). LSTs are a very interesting source of material to extend tree-ring chronologies from centuries to several millennia and can greatly improve the replication of reconstructions, especially in regions where only short-lived tree species occur (Arseneault et al., 2013; Grudd et al., 2002). All the above color issues may potentially alter the accuracy of BI data (e.g., LBI) and introduce biases in BI-based climate reconstructions, particularly for the low-frequency domain (Björklund et al., 2014; Wilson et al., 2019). Therefore, it is critical to develop unbiased BI data from a variety of wood materials, in particular from LSTs, to make the promising BI technique widely applicable in future dendroclimatic reconstructions.
Some solutions have been proposed to overcome the sapwood–heartwood color issue. Sheppard and Wiedenhoeft (2007) used hydrogen peroxide to bleach wood colors and attenuate the sapwood–heartwood difference, although an earlier study claimed that chemical bleaching likely degraded the climate signal (Sheppard, 1999). A later and seemingly more promising approach consists of a simple mathematical correction computed as the BI difference between the earlywood and latewood (i.e., the delta BI; hereafter DBI) of each tree ring. DBI corrects for the low-frequency (decadal–centennial) variations distorted by the sapwood–heartwood color issues (Björklund et al., 2014, 2015). Only a few studies attempted to use BI data measured from LSTs to develop long-term temperature reconstructions, but the staining issue was not addressed and these BI series were not directly compared to MXD data. For example, Rydval et al. (2017) combined the high-frequency temperature signals extracted from LBI with the low frequency from ring-width data of LSTs in order to reconstruct temperatures, without using the low-frequency information of the more-temperature-sensitive BI data.
In this study, we explore the potential of generating unbiased BI series from stained black spruce LSTs from two eastern Canadian lakes (Fig. 1a). More specifically, we compared chemical destaining with the DBI approach as well as with conventional MXD data. The following hypotheses were formulated: (1) the stain of LSTs is mainly caused by oxidation of Fe (Hyacinthe et al., 2006; Kostka and Luther, 1994; Pelé et al., 2015; Zhang and Xi, 2003), which can be removed using some antioxidant reagents; (2) chemical destaining and DBI can greatly improve BI-based temperature reconstructions that are comparable to MXD-based reconstructions. We first treated thin wood laths of stained LSTs using seven potential chemical reagents and quantified the proportion of Fe extracted by chemicals. Subsequently, we performed dendroclimatic assessments by comparing LBI and DBI chronologies of the destained and stained LST samples with MXD data over the past ∼360 years.
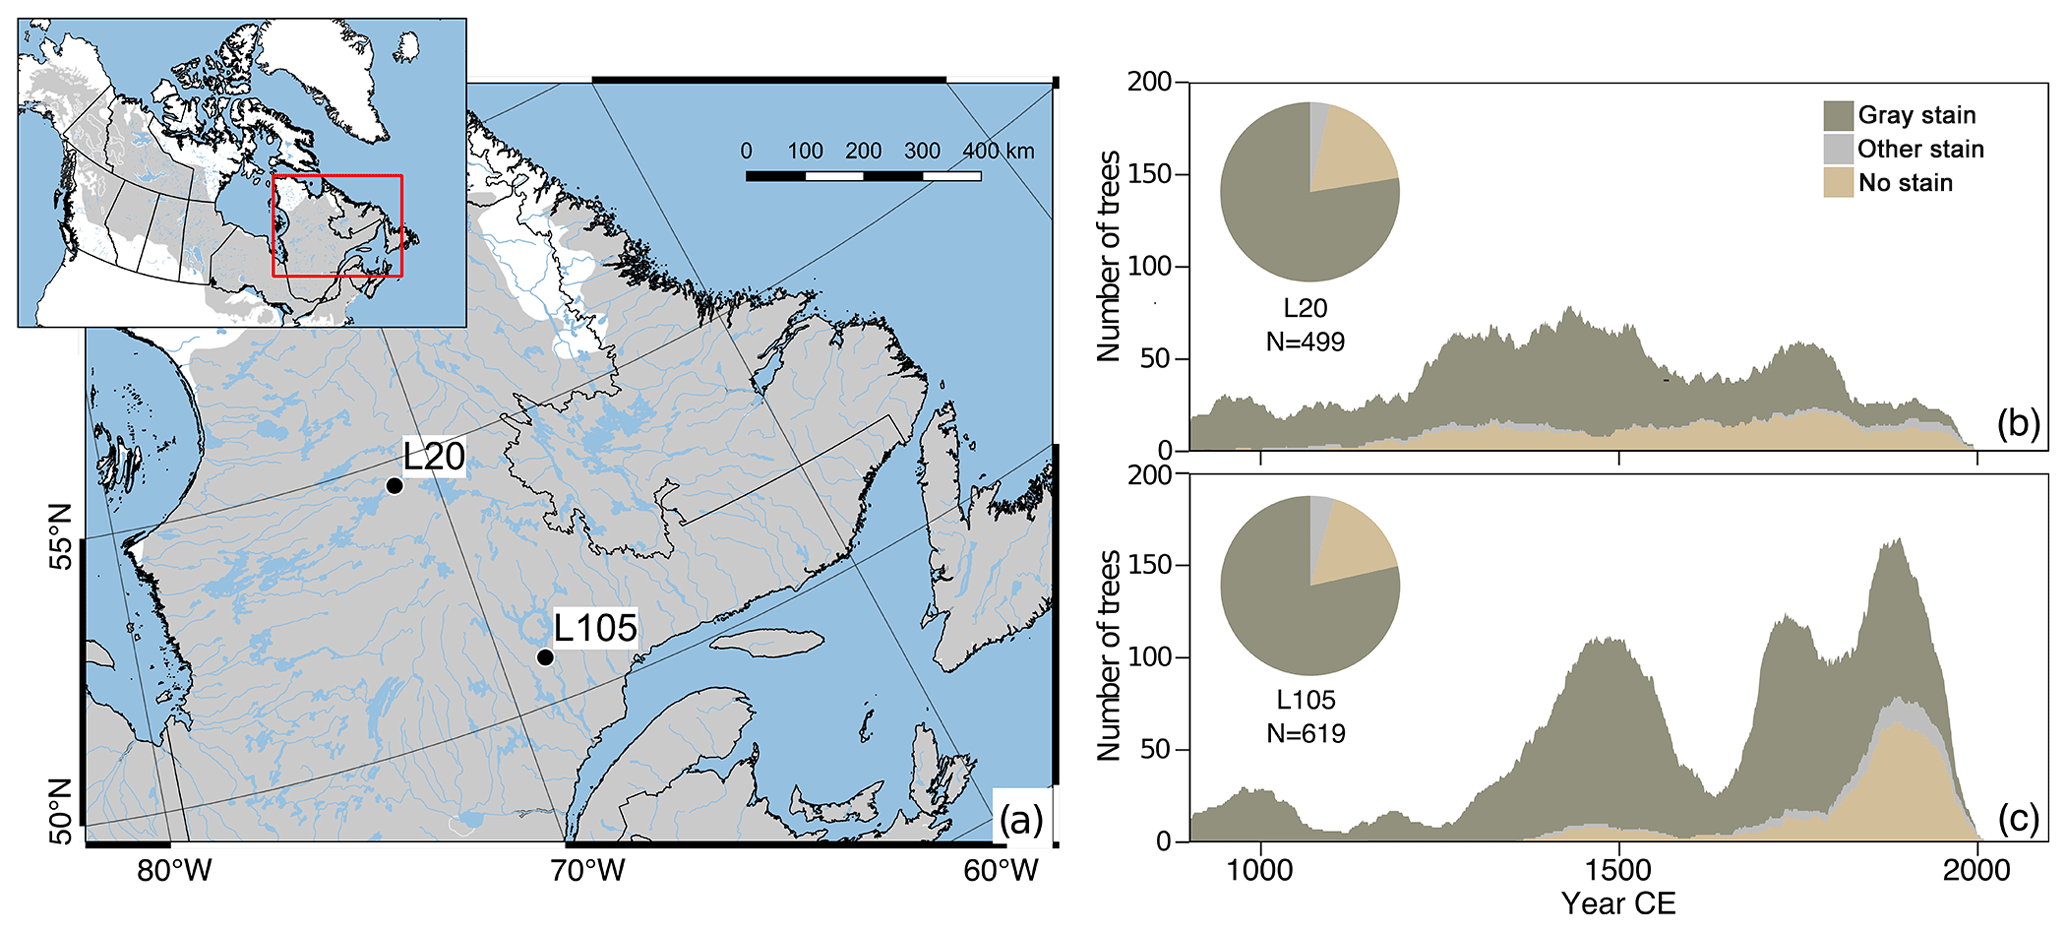
Figure 1Location of the two studied lakes (a), and frequency of cross-dated LSTs according to staining at L20 (b) and L105 (c). The gray shading in (a) corresponds to the distribution range of black spruce (map source available at https://www.fs.fed.us/database/feis/pdfs/Little/aa_SupportingFiles/LittleMaps.html, last access: 15 September 2020). The “other stain” category includes a variety of additional colors such as red or dark brown.
2.1 Study sites and staining issue
The two studied lakes (L20 and L105) are located approximately 450 km apart in the eastern Canadian boreal forest of the Quebec-Labrador Peninsula (Fig. 1a). The climate of this region is characterized by short, mild summers and long, cold winters (Environment Canada, 2020). Regional forests are strongly dominated by black spruce mixed with balsam fir (Abies balsamea L.) and eastern larch (Larix laricina (Du Roi) K. Koch) (Payette, 1993). Lakes are extremely abundant and cover up to about 25 % of the landscape. Numerous black spruce trees in the lakeshore forests thus become LSTs after falling in water and eventually becoming buried in lake sediments (Arseneault et al., 2013; Gennaretti et al., 2014a, b). Black spruce LSTs from L20 (54.56∘ N, 71.24∘ W) were previously included in a millennial temperature reconstruction (Gennaretti et al., 2014c). L105 (50.81∘ N, 67.80∘ W) is a newly sampled lake where more than a thousand black spruce LSTs were extracted, and many of them were successfully cross dated to develop a millennial ring-width chronology (unpublished data).
LSTs in the eastern Canadian boreal forest are frequently stained to various blue-gray intensities (Fig. S1 in the Supplement). When dry, these stains correspond well to the Munsell Soil Color Chart 2009-5Y-Chroma I. In total, 78 % and 79 % of the cross-dated LSTs at L20 and L105 were stained to some degrees of gray, respectively (Fig. 1b, c). Very few LSTs displayed additional colors, for example due to fungal discoloration. Stained LSTs are distributed throughout the time span of the two millennial chronologies with increasing proportions back in time, particularly before the year 1800 CE (Fig. 1b, c), suggesting that staining issues are unavoidable when using BI measurements from this material.
2.2 Destaining experiment
We selected stem cross sections from five (evenly and heavily) stained LSTs and five unstained lakeshore living trees from each of the two studied lakes. Using a twin-blade saw (Dendrocut, Walesch Electronic), we transversally cut sixteen 1 mm thick laths along the radius of each subfossil tree (total of 160 laths) and 2 laths from each living tree (total of 20 laths). All laths were pretreated using 95 % ethanol in Soxhlet extractors for 48 h to remove resins and then air-dried and weighed. Sixteen pretreated laths from each LST were divided into eight pairs. Seven pairs were immersed in 50 mL of one of the seven chemical solutions (Table 1) in Falcon® 50 mL tubes (see an example in Fig. 2) and then placed on an electronic shaker (SK-600, Montreal Biotech Inc.) with a speed of 133 rpm at room temperature (ca. 20 ∘C) for 24 h (MixC) and 48 h (other reagents). Treated laths were rinsed 4–5 times, immersed in deionized water for 2 h to remove dissolved elements absorbed by wood tissues, and then air-dried for subsequent analysis. The eighth pair of subfossil laths and all the living-tree laths were not treated with destaining reagents and were not considered as control samples. Design of the experiments is illustrated in Fig. S2.
Table 1Basic chemical properties of the seven chemical solutions. All solutions were diluted using deionized water with no trace of Fe concentration. Concentrations are in v∕v for HAc and in w∕v for other solutions. EDTA: ethylenediaminetetraacetic acid. Values of pH were estimated using pH test papers.

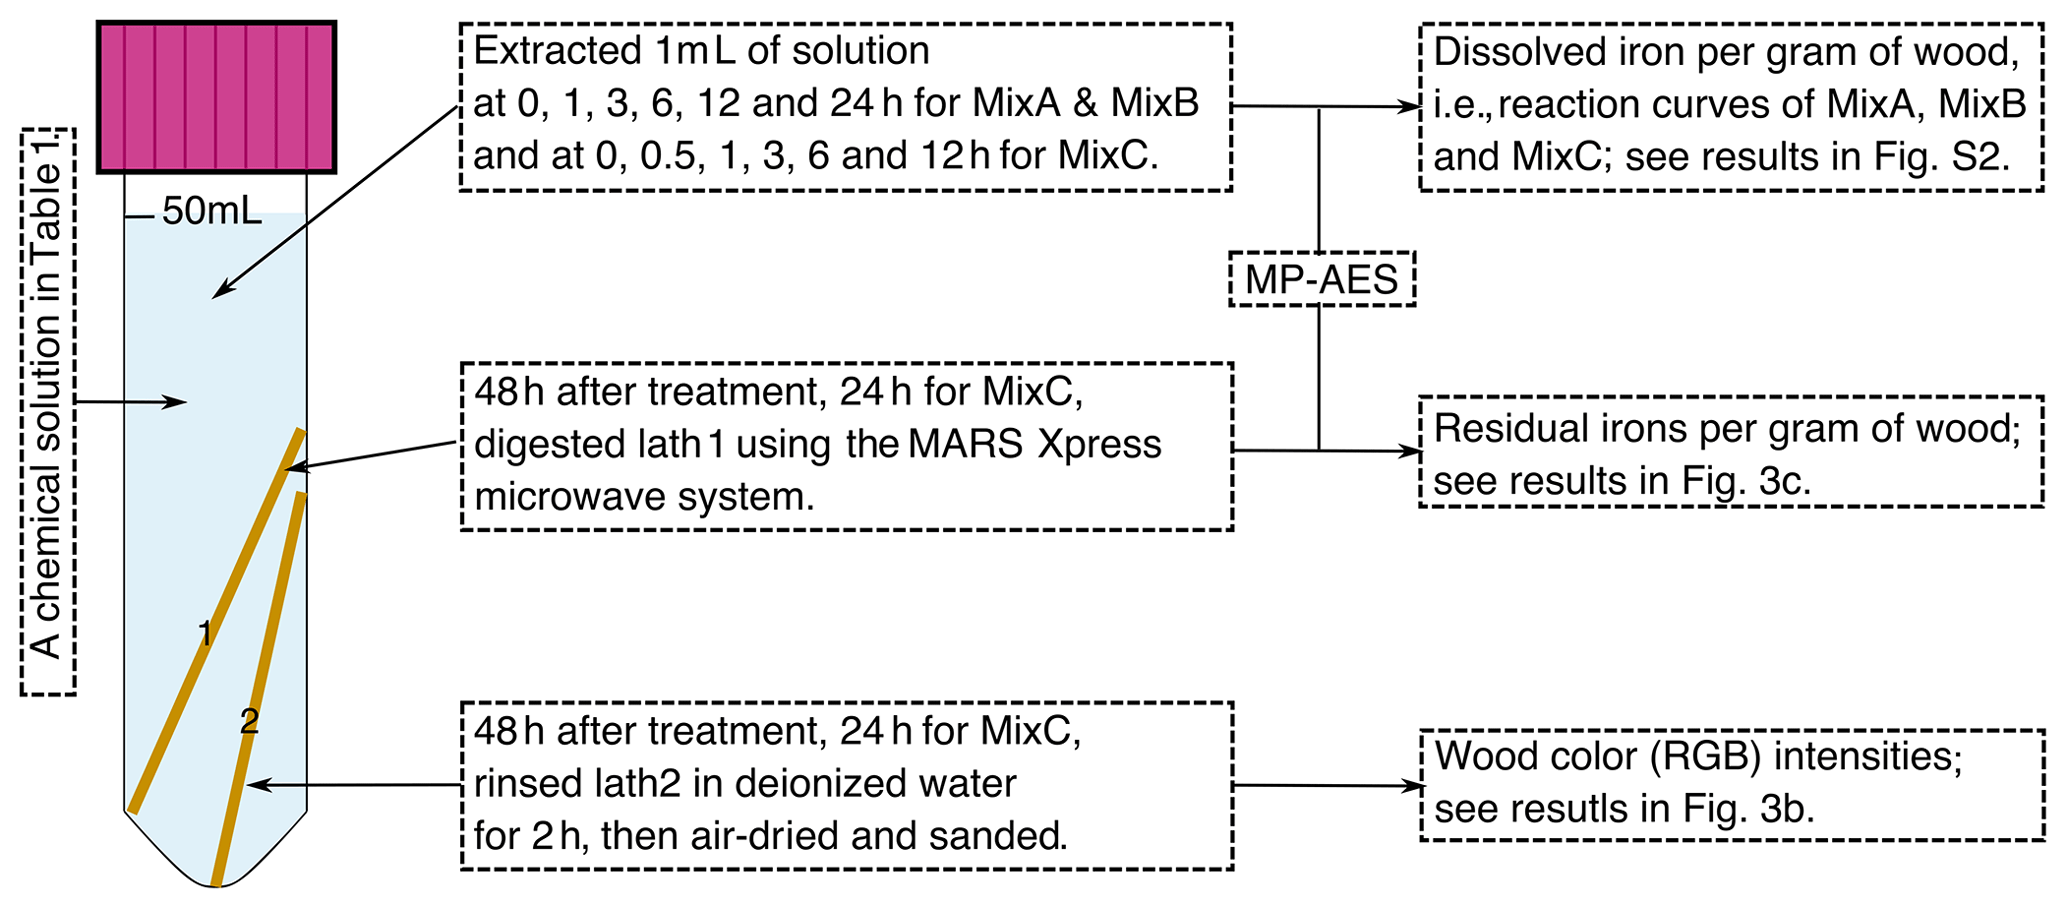
Figure 2Diagram of one chemical destaining experiment for one pair of wood laths from the same subfossil tree in a Falcon® 50 mL tube. MP-AES: microwave plasma atomic emission spectrometer, Agilent 4200.
During the destaining treatments, we sequentially sampled reaction solutions to construct temporal Fe dissolution curves (the most abundant metal element detected in preliminary tests) for MixA, MixB, and MixC, which were the most effective destaining reagents. A total of 1 mL of solution was sampled at 0, 1, 3, 6, 12, and 24 h for MixA and MixB, as well as at 0, 0.5, 1, 3, 6, and 12 h for MixC (Fig. 2). Treatment and sampling times were set shorter for MixC since it was the most active reagent. The 1 mL extracted solutions were then diluted in 5 mL of 5 % (v∕v) hydrochloric acid in Falcon® 15 mL tubes in order to avoid Fe(II) precipitation prior to the chemical analysis of Fe concentrations. After destaining, one lath from each pair of laths was used to quantify the amount of residual Fe and was digested using 5 mL nitric acid and 1 mL hydrogen peroxide in a MARS Xpress microwave digestion system (CEM Corporation) at 150 ∘C for 30 min (Fig. 2). Digested solutions were diluted to 25 mL in volumetric flasks using deionized water. Fe concentrations were measured using the microwave plasma atomic emission spectrometer (MP-AES, Agilent 4200; the limit of detection is ∼4.6 ppb for dissolved Fe), and data were adjusted to milligrams of Fe per gram of wood according to the dilution and weight of the corresponding wood lath. Fe concentrations in this study represent the total amount of ferrous and ferric Fe, because MP-AES does not distinguish the type of Fe ions.
The second lath of each pair was air-dried, finely sanded (to 1000 grit), and scanned using the SilverFast 8.0 software (LaserSoft Imaging) and an Epson V800 flatbed scanner. In order to obtain optimal calibration results, the sanded laths were scanned to RGB images of 3200 dpi along with a color IT8.7/2 calibration target (LaserSoft Imaging). The scanner was covered by a black plastic box to avoid interference of external light (Rydval et al., 2014). It should be noted that the actual image resolution is approximately 2580 dpi (horizontal) by 1825 dpi (vertical) according to the USAF-1951 resolution target. Wood RGB intensities (definition 1–3 in Table 2) were then measured using the CooRecorder 8.1 software (Cybis Dendrochronology). Because high RGB values represent light colors (i.e., high brightness), they were subtracted from a value of 256 such that smaller RGB values are associated with lighter colors. RGB intensities were compared among treatments (seven treatments plus two controls) to assess the efficiency of the destaining reagents.
Table 2Definitions of wood color intensities and tree-ring parameters used in this study. The RGB intensities refer to the color intensities measured separately for the red (R), green (G), and blue (B) channels. The parameters 1–3 are used to quantify wood colors, while the parameters 4–6 are conventional dendrochronological parameters.
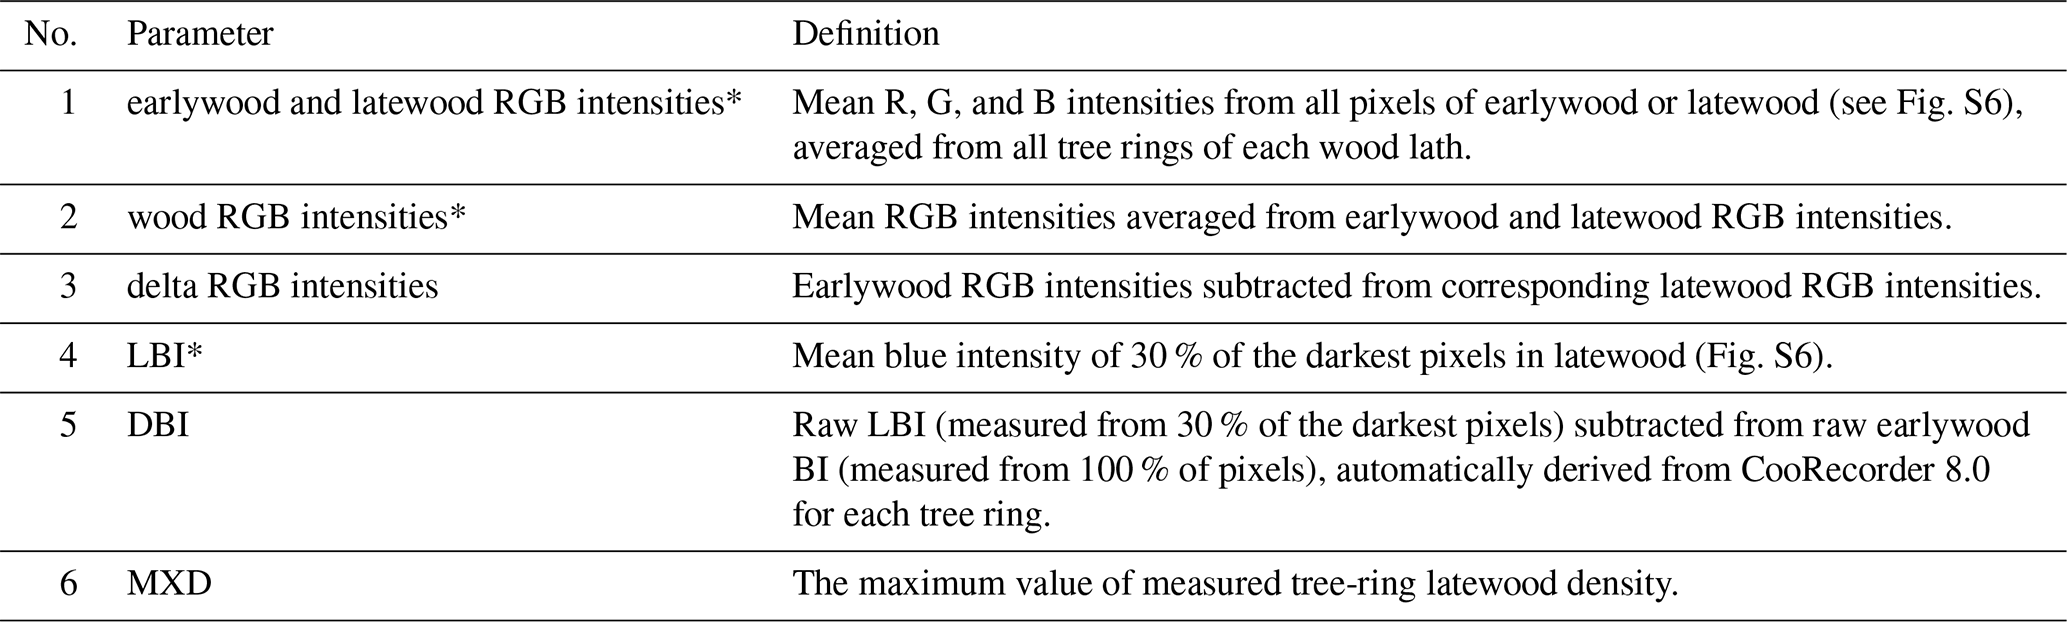
* Data were inverted by subtracting the raw data from a value of 256.
2.3 Dendroclimatic assessment
In order to perform dendroclimatic assessments of the most effective destaining treatments, in a separate experiment we selected 57 trees of different types (stained and unstained LSTs as well as living trees), which were cross dated after the year 1600 CE from L20 and L105 (28 and 29 trees, respectively; Fig. S3). We cut eight 1 mm thick laths from two radii of each tree to acquire four pairs of laths (Fig. S4). Laths were pretreated using 95 % ethanol in Soxhlet extractors for 48 h. We then treated three pairs of laths per tree using the MixA, MixB, and MixC, respectively, while keeping the fourth lath as an untreated control. The conditions of destaining treatments were the same as explained above, except that the treatments lasted for 6 h, which is the time required for optimal destaining according to the Fe dissolution curves (Fig. S5). Treated laths were then air-dried for LBI, DBI, and MXD measurements.
Measured tree-ring parameters are explained in Table 2. The wood laths for dendrochronological assessments were firstly X-rayed to generate MXD data prior to being sanded and scanned for BI measurements. X-ray densitometry experiments were conducted in a controlled environment with a relative humidity of 50 % and room temperature of 20 ∘C. X-ray films were developed using the DendroXray2 system (Walesch Electronic), and MXD series were measured using the Dendro 2003 system (Walesch Electronic) with a resolution of 10 µm along the measured density profile. LBI and DBI were measured using the same procedure as the measurement of wood RGB intensities. We subtracted the raw LBI values from a value of 256 in order to make the LBI positively correlated with MXD data, according to Rydval et al. (2014) and Wilson et al. (2019). Before data analysis, LBI, DBI, and MXD data were averaged by tree (i.e., each lath pair) for each treatment (MixA, MixB, MixC, and Control).
We used regional curve standardization (RCS) to remove the biological trends from tree-ring series in order to retain low-frequency (decadal–centennial) climatic variations (Briffa and Melvin, 2011; Helama et al., 2017). An age-dependent spline with an initial stiffness of 2 years was used to estimate the regional curve. Standardized tree-ring series were computed as ratios between the raw data and the smoothed regional curve. In total, we standardized 24 groups of tree-ring data by site (L105 and L20), parameter (LBI, DBI, and MXD), and treatment (MixA, MixB, MixC, and Control). We excluded data from chemically treated, unstained trees (unstained LSTs plus living trees) because BI data of unstained trees tended to be altered by reagents, mostly the MixC (Fig. S7). Consequently, we pooled the data of stained LSTs that were chemically treated, plus the data of the untreated, unstained trees for each standardization. In addition, living-tree data of L20 after the year 1950 CE were excluded as BI diverged from the MXD data (Figs. S3 and S8), which was likely due to the sapwood–heartwood color issue and narrow rings caused by poor tree health (see discussions below).
Regional chronologies for each tree-ring parameter (LBI, DBI, and MXD) and treatment (MixA, MixB, MixC, and Control) were generated by pooling standardized series from both sites using the Tukey's biweight robust mean. This approach was used because of the limited tree replication per site (Fig. S3). Regional MXD chronologies from the four treatments were similar (Fig. S9) and thus averaged into one reference chronology. All regional chronologies were truncated at the year 1655 CE to ensure a minimum replication of five trees (Fig. S3c).
We performed temperature reconstructions using the regional LBI, DBI, and MXD chronologies to further quantify the influence of the destaining protocols. Instrumental summer (May to August) temperature data were obtained from the CRU TS 4.03 0.5 ∘C gridded monthly mean temperature dataset (Harris et al., 2014) and averaged from the four grid cells closest to each lake in order to generate a regional temperature target. The reconstructions were based on the scaling method (Esper et al., 2005; Rydval et al., 2017) by adjusting means and standard deviations of the chronologies to those of the temperature target over the 1901–2015 time interval.
2.4 Data analysis
Data were analyzed using the R program (R Core Team, 2018). We conducted linear regressions between wood RGB intensities and logarithmic residual Fe of both treated and untreated LSTs in order to assess the roles of Fe in the staining issue. For chronology assessments, we generated several high-pass and low-pass LBI, DBI, and MXD series using the Butterworth filter available in the “dplR” R package (Bunn, 2008). Pearson correlation coefficients were used to assess the degrees of agreement among all the time series. Performance of reconstructions was assessed following a regression-based calibration–verification procedure using the “treeclim” R package (Zang and Biondi, 2015). Since our chronologies showed higher replication during 1901–1960 (Fig. S3), this time interval was used for calibration, while the 1961–2015 period was used for verification. We also calculated a 1-year-lagged 31-year moving expressed population signal (EPS; Wigley et al., 1984) to assess the temporal robustness of chronologies used for reconstruction.
3.1 Effects of chemical destaining
LSTs displayed a variety of color changes after the seven destaining treatments (Fig. 3a). NaAsc resulted in very similar colors to that of the untreated stained samples, representing the weakest destaining effect. Conversely, MixA, MixB, and MixC showed dramatic effects and almost completely removed the gray stain. MixC was the most effective destaining solution based on wood RGB intensities, although the resultant colors still slightly differed from the living-tree standards (Fig. 3a, b). BI was less variable with varying degrees of posttreatment stains in comparison to red and green intensities (Fig. 3b), suggesting a potentially weaker influence of wood stain on the BI data. MixC, the only reagent with bleaching function (Table 1), could have an additional bleaching effect on the wood, resulting in smaller LBI and DBI values in living and unstained trees compared to untreated control (Fig. S7). However, DBI of the stained LSTs was only slightly modified by the MixC treatment (Fig. S7), indicating that the bleaching effect of MixC is weak for the stained samples.

Figure 3Residual iron (Fe) and wood RGB intensities (see definitions in Table 2) of LST laths treated with seven chemical reagents. Panel (a) shows examples of treated laths from one LST sample and one living-tree sample (last row). The gray outer part of the example LST is discolored due to decay. Panel (b) shows the mean wood RGB intensities according to treatment. Panel (c) shows the mean concentrations of residual Fe according to treatment. Error bars in (b) and (c) refer to standard deviations of corresponding group. Percentages in (c) refer to the Fe removed by destaining treatments relative to the Fe concentrations of untreated stained LSTs. Panels (d)–(f) show the linear regressions of earlywood, latewood, and delta RGB intensities against the log of residual Fe. Regressions are based only on the LST data (circles). Living-tree data are plotted as triangles but are excluded from the regressions.
3.2 Stains versus iron
Chemical analyses showed strong links between Fe concentrations and color intensities of wood, especially for green and red intensities (Fig. 3a, c). Total Fe concentration was the highest for untreated stained LSTs and near zero for living trees (Fig. 3c). MixA, MixB, and MixC could remove 94.1 %, 92.5 %, and 96.2 % of Fe relative to the amount measured in the untreated stained LSTs, respectively. Although Fe dissolution curves stabilized after 6–12 h (Fig. S5), minor quantities of residual Fe after the treatments (24–48 h) indicated that all destaining reactions are incomplete. Significant (p<0.001) linear relationships existed between the log of residual Fe and posttreatment color (RGB) intensities of treated earlywood and latewood (Fig. 3d, e). However, such linearity markedly weakened for the delta RGB intensities, especially for the delta BI (p=0.087, Fig. 3f), indicating that DBI of LSTs is insignificantly affected by the staining issue. Note that wood delta BI and DBI were not calculated exactly in the same way (see Table 2; delta BI is the averaged difference between BI of the entire latewood and earlywood from all tree rings in a sample, while DBI is a tree-ring parameter which presents the difference between LBI and BI of the entire earlywood for each tree ring).
3.3 Comparison of LBI and DBI against MXD chronology
LBI chronologies of the four retained treatments (MixA, MixB, MixC, and Control) diverged relative to the reference MXD chronology (Fig. 4a) prior to the year 1900 CE when the stained LSTs dominated the chronologies (Fig. S3c). Correlation analyses showed that coherence between LBI and MXD chronologies was only robust for the 10-year high-pass-filtered data (r>0.89) and decreased at longer timescales (Fig. 4c). In contrast, DBI chronologies were very similar to the reference MXD chronology for all the four treatments (Fig. 4b). Correlations with MXD data were strong and stable among all frequencies tested (r>0.82) (Fig. 4d). In addition, few differences were found between the control DBI series and the chemically treated DBI data, although the colors of wood samples were visually distinct (Fig. 3a).
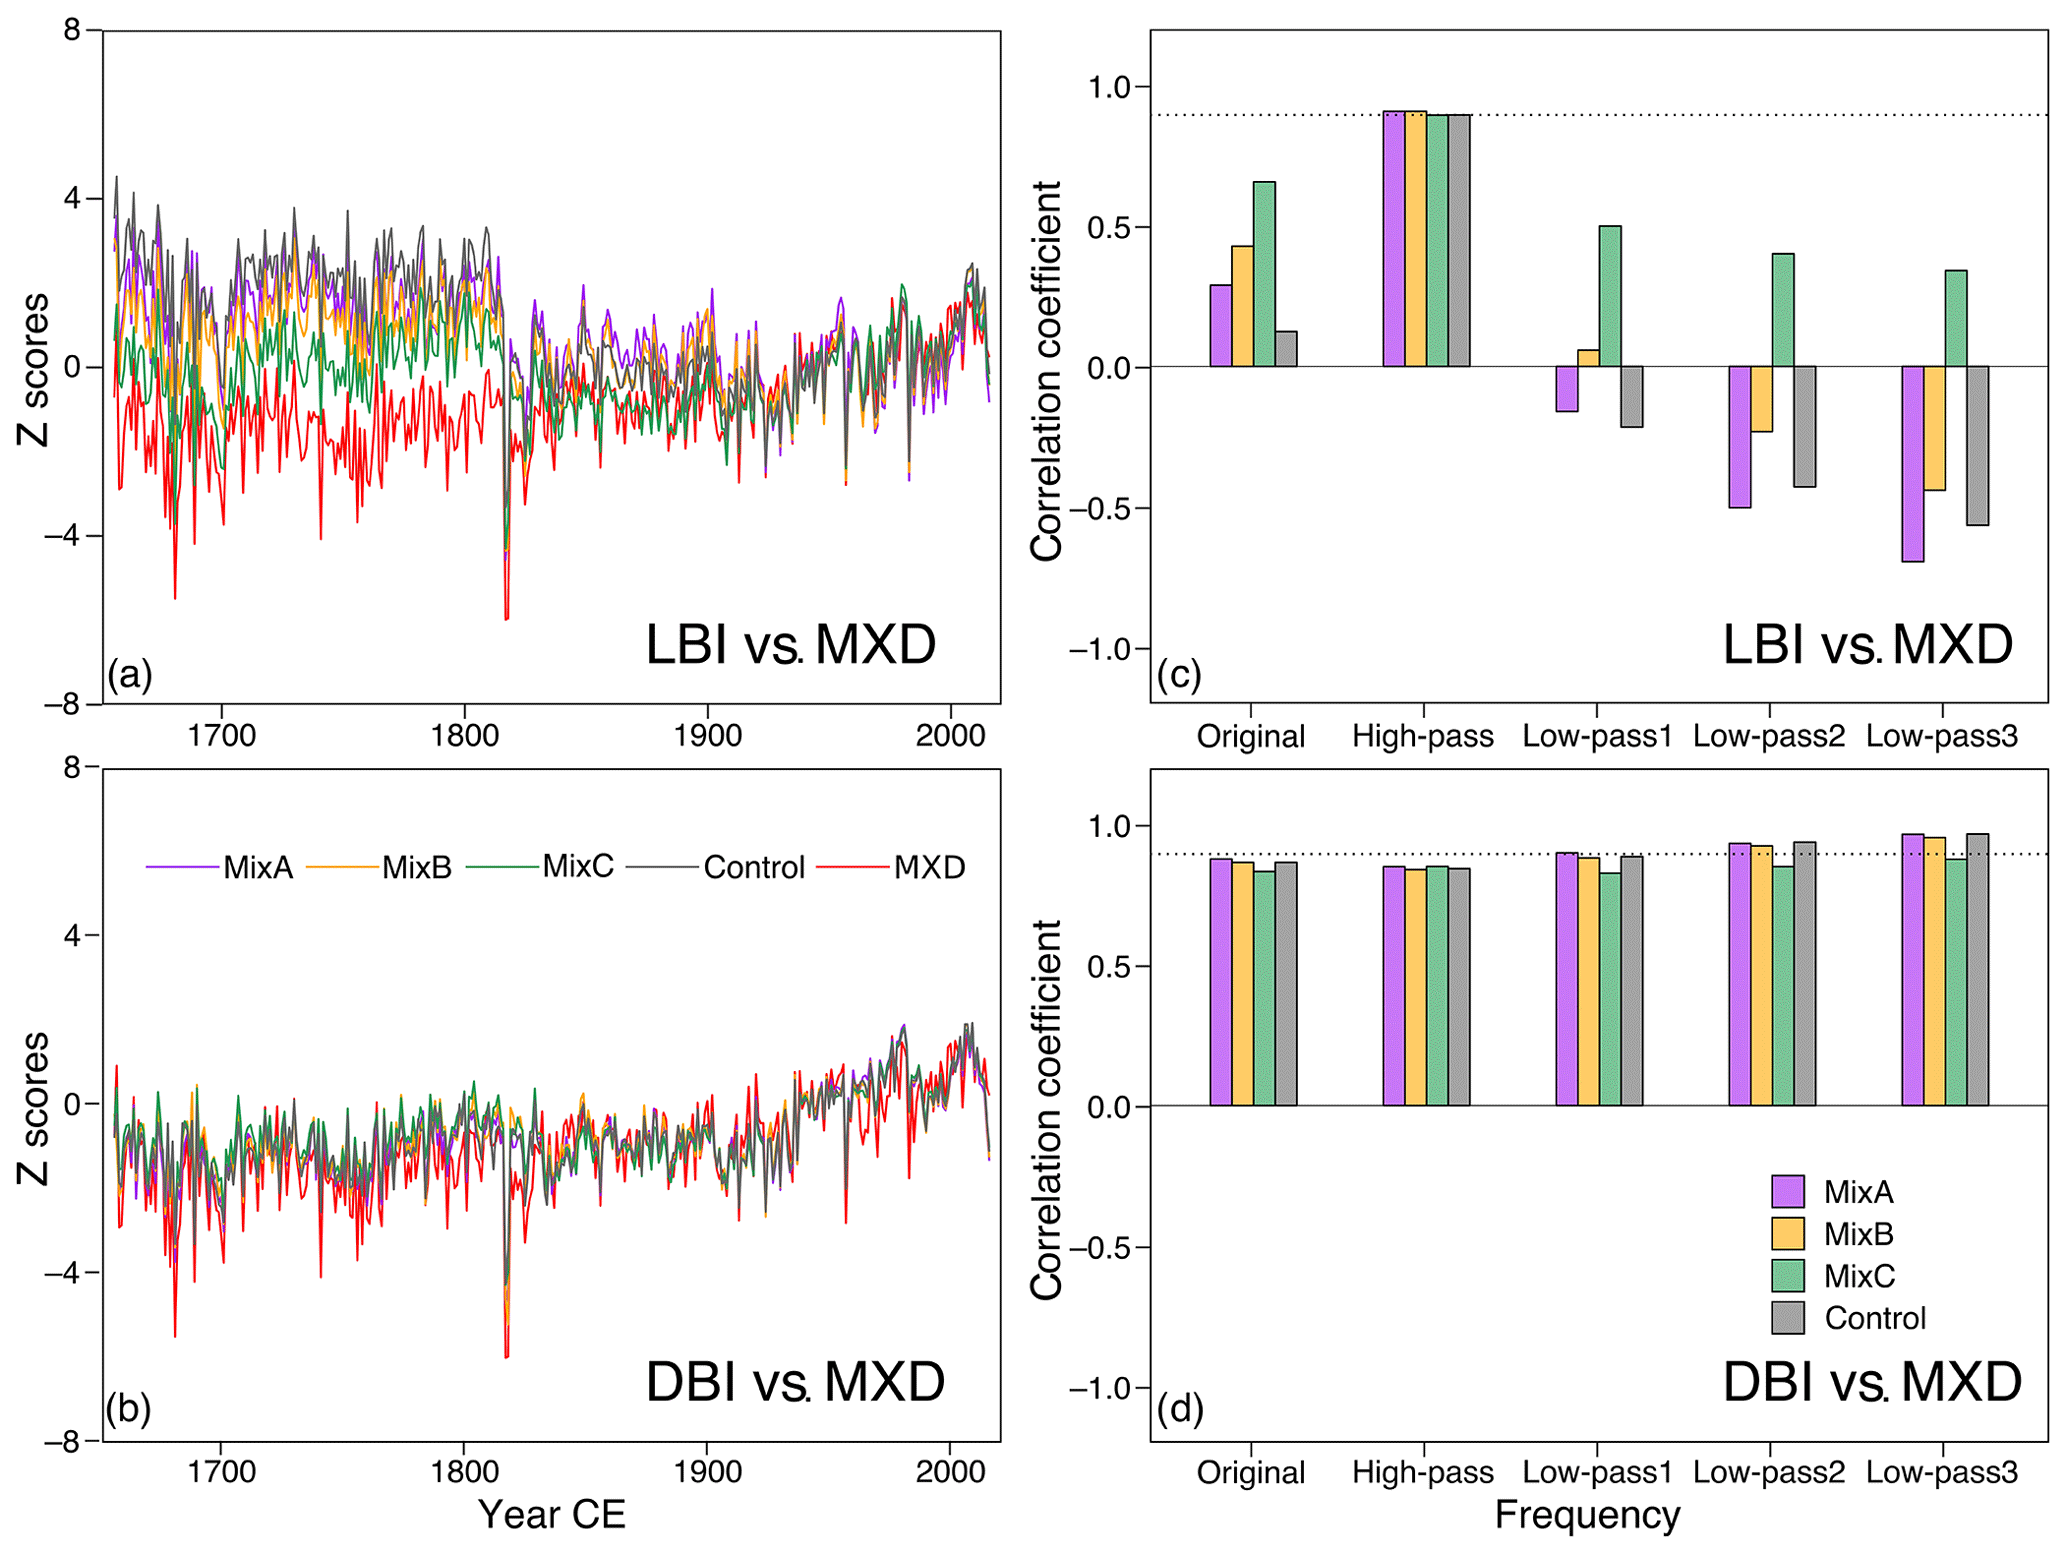
Figure 4Comparisons of LBI (a, c) and DBI chronologies (b, d) for the MixA, MixB, MixC, and Control treatments against the reference MXD chronology. In (a) and (b), chronologies are transformed to z scores relative to the 1901–2015 time interval. Panels (c) and (d) show correlations of LBI and DBI chronologies against MXD chronology at different timescales. Original: the original RCS standardized chronologies; high-pass: 10-year high-pass filtered series; low-pass 1, 2 and 3: 10-year, 50-year, and 100-year low-pass series filtered using the Butterworth filter. Dotted horizontal lines in the right panel show the correlation (r=0.89) between the high-pass-filtered LBI and MXD chronology.
4.1 Causes of stain
The significant relationships between posttreatment wood RGB intensities and residual Fe (Fig. 3), along with the rapid postsampling staining (Fig. 5b), support our hypothesis that oxidation of Fe is a major cause of stain in our lake subfossil material. Fe is abundant in natural aquatic systems as dissolved and particulate fractions (Bortleson and Lee, 1974; Davison, 1993; Nürnberg and Dillon, 1993). Briefly, dissolved Fe, mainly in Fe(II) state, is reduced and mobilized in porewater in the anoxic sediments. Dissolved Fe can migrate upward to oxic bottom water to form particulate Fe(III) oxides (Davison, 1993; Davison et al., 1982). This cycle results in much higher concentrations of dissolved Fe in the anoxic sediments compared to the oxygenated freshwaters (Zaw and Chiswell, 1999). Soluble forms of Fe in the anoxic sediments can readily penetrate into the buried wood tissues. When buried LSTs are extracted from lakes, cut, and exposed to air, dissolved Fe is rapidly oxidized to colored Fe oxides (oxyhydroxides, hydroxides, and more crystalline Fe(III) oxides) which may bind to wood (Pelé et al., 2015). This process is also supported by the fact that fresh cuts from buried portions were heavily stained while exposed (but submerged) portions of the same LST were not (Fig. 5a). Photooxidation is assumed to be less likely, yet not improbable, because the stain contaminated both surface and inner portions of LSTs.
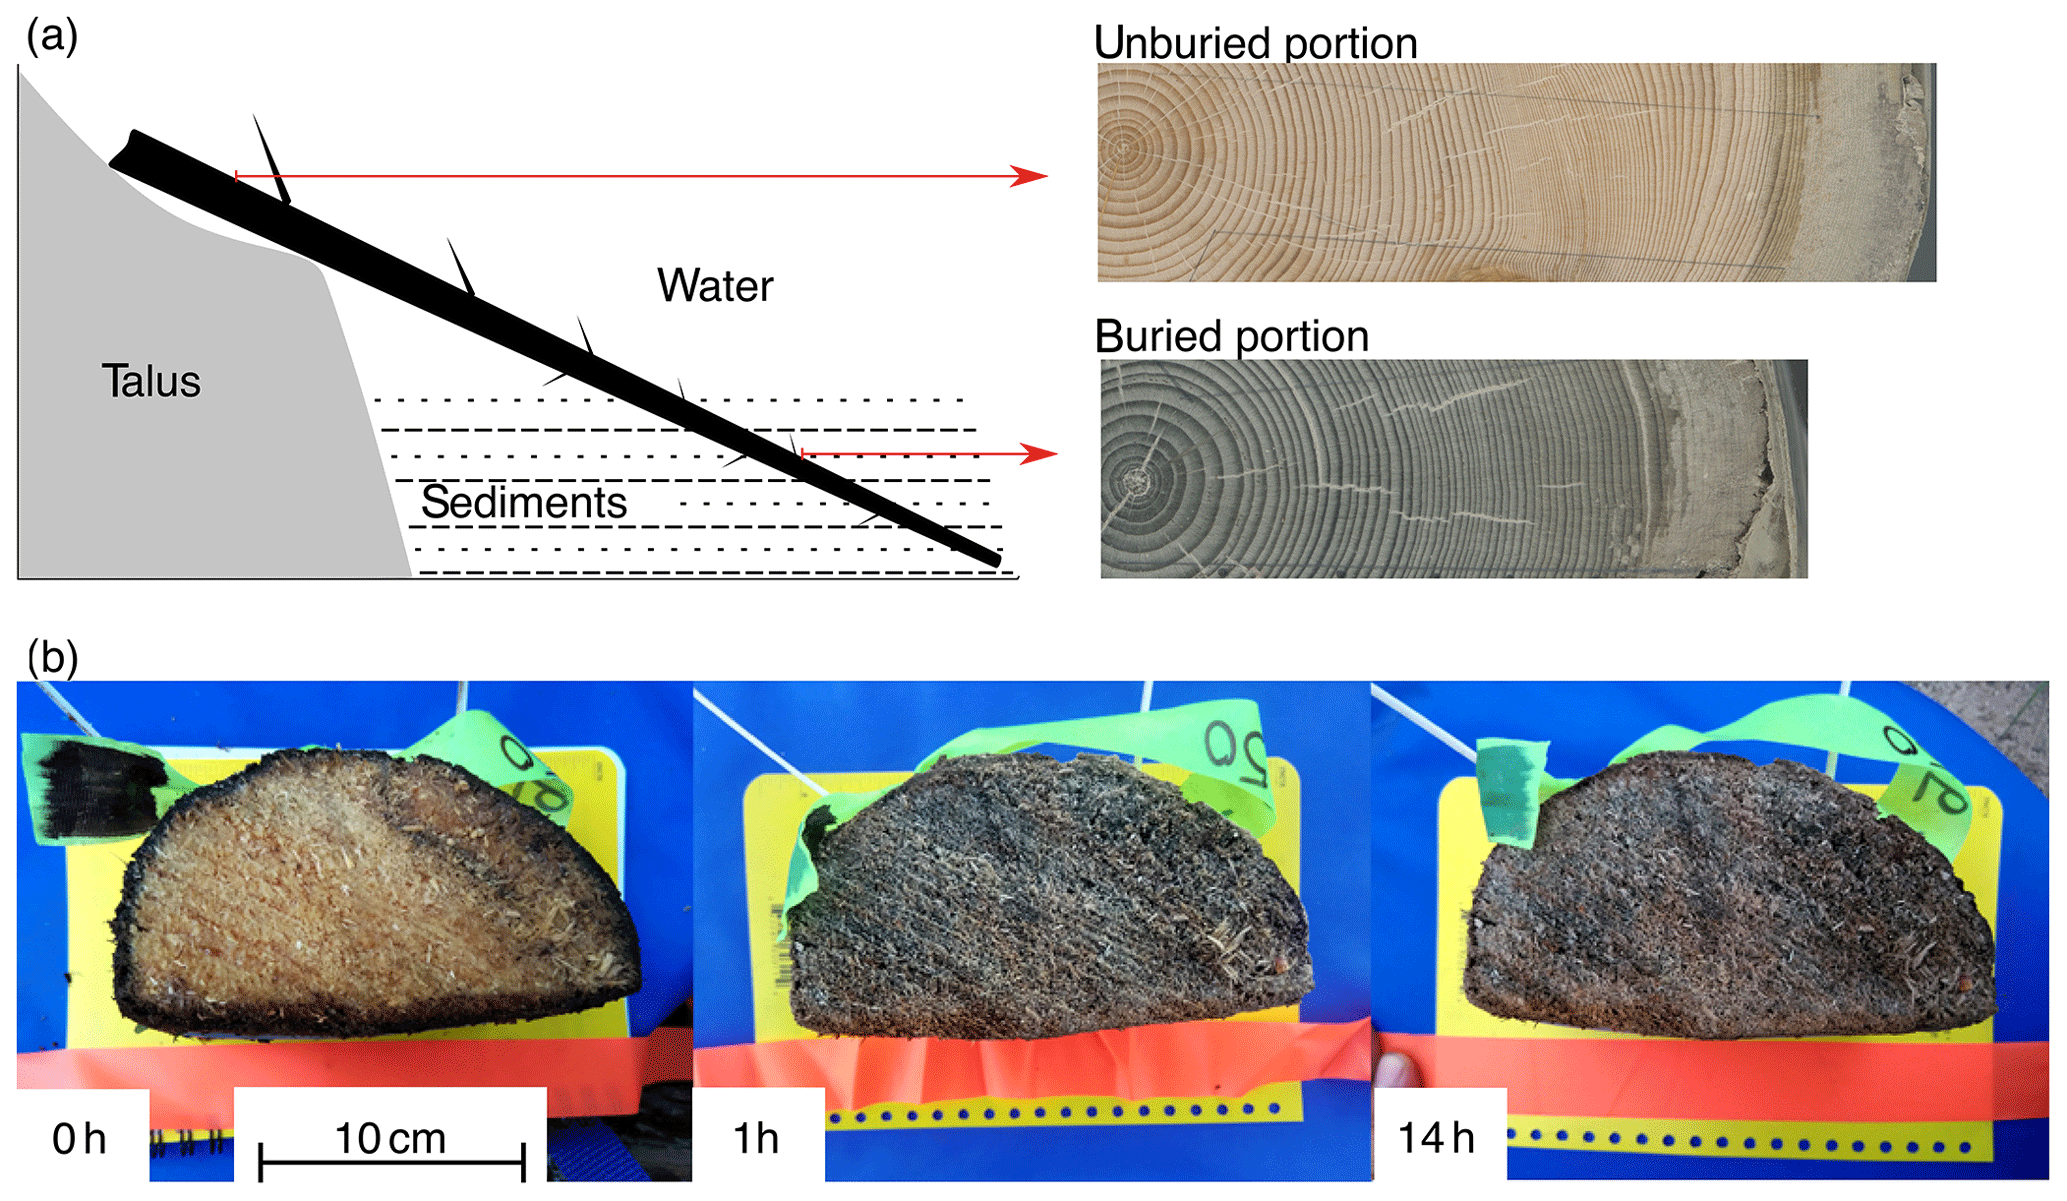
Figure 5Schema of different cross-sectional colors from the buried and exposed cross sections of the same partially buried tree (a), and field observations of cross-sectional color changes after a fresh disc was cut from a buried tree and exposed to air (b).
Furthermore, we found that amorphous and crystalline Fe oxides are likely produced during the oxidation of dissolved Fe. About 63.4 % of Fe was removed by the NaAsc reagent, although posttreatment colors of LSTs only slightly lightened (Fig. 3a, c). The neutral NaAsc, similar to buffered ascorbates, only extracts the most-reactive amorphous Fe oxides (Anschutz et al., 2005; Hyacinthe et al., 2006; Kostka and Luther, 1994). The less-reactive crystalline phases can be removed by EDTA, HAsc, MixA, MixB, and MixC, each of which removed at least 25 % more Fe than NaAsc. In fact, EDTA, ascorbic acid, and sodium dithionite, which are the active chemicals in these solutions, are known as useful extractants of both crystalline and amorphous Fe oxides (Borggaard, 1982; Hyacinthe et al., 2006; Kostka and Luther, 1994; Tessier et al., 1979). The notable destaining effect of these solutions (Fig. 4a) also implies that crystalline Fe oxides are more color reflective than amorphous ones. In our experiment, HAc extracted less Fe than NaAsc but with a better destaining effect (Fig. 3). A probable explanation is that acid-soluble Fe oxides extracted by HAc (Chester and Hughes, 1969; Gupta and Chen, 1975; Tessier et al., 1979) are in amorphous and crystalline phases which have stronger color reflectivity, whereas NaAsc only extracted less-color-reflective amorphous Fe oxides.
Other metal elements most likely have a negligible staining effect on LSTs compared to Fe. Our preliminary analyses demonstrated that, among 15 potential metal elements (including iron, manganese, chromium, cobalt, copper, lead, etc.), Fe was the only element present at high concentrations. Although manganese was relatively abundant in the samples (several times higher than other metals), its concentration was still approximately 20 times lower than Fe. In addition, we did not detect any copper and lead in our samples. On the other hand, Fe complexes bound to sulfur and phosphorus might also be responsible for the staining of LSTs in addition to the Fe oxides. However, the MP-AES instrument is not sufficiently sensitive to verify our hypothesis regarding those Fe complexes (detection limits are ∼6500 and 125 ppb for dissolved sulfur and phosphorus, respectively, compared to ∼4.6 ppb for dissolved Fe).
4.2 Chemical destaining versus delta correction
The divergent trends of the three chemically treated LBI chronologies (MixA, MixB, and MixC) compared to the reference MXD chronology demonstrate that none of the destaining treatments can generate satisfactory and robust LBI data (Fig. 4a). Although MixC is the most effective protocol resulting in very little residual Fe (<5 % relative to the stained LSTs), the corresponding LBI chronology still displayed a significant long-term bias before the year 1830 CE (Fig. 4a), leading to a discrepancy of about +2 ∘C compared to the MXD-based reconstruction (Fig. 6a). If no chemical treatment had been applied, the temperature discrepancy would be amplified to about +4 ∘C (not shown). These errors are caused by the extreme color sensitivity of LBI values as direct measures of blue light reflectance. Therefore, any stain contributing to the wood color will strongly contaminate the LBI data, especially in the low-frequency domain (Björklund et al., 2014). These results discourage the use of LBI when staining is present in subfossil woods. By contrast, the high-frequency variability of LBI data seems unaffected by the Fe stain (Fig. 4b).
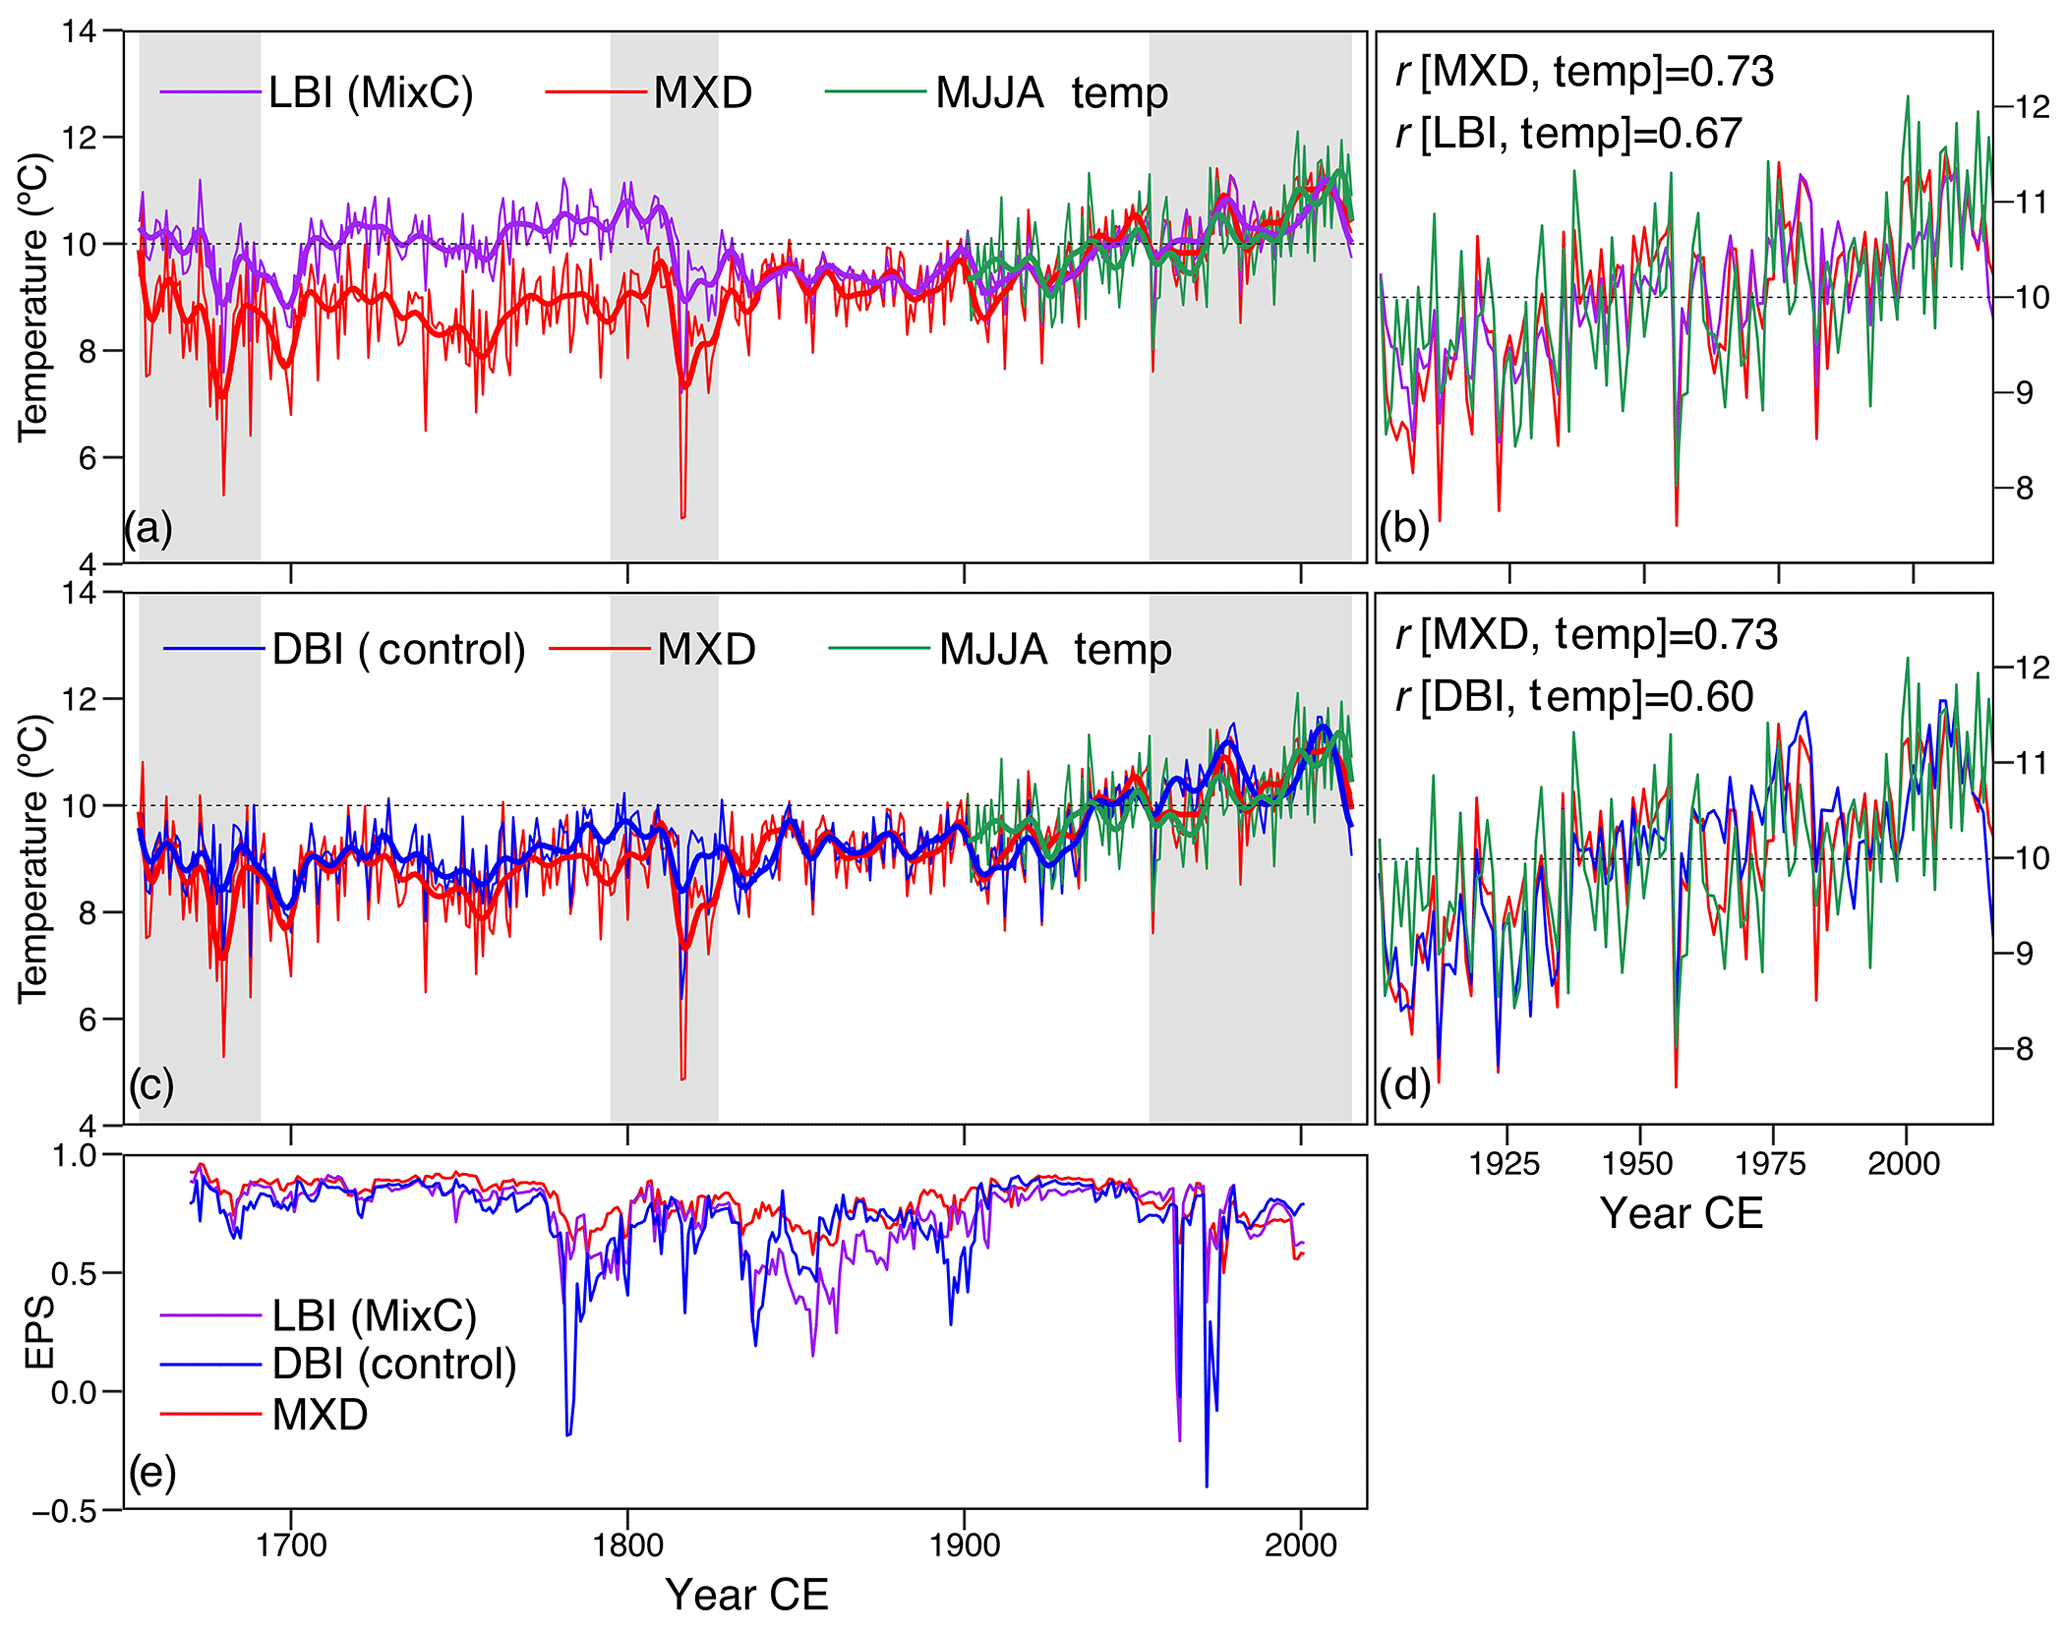
Figure 6Temperature reconstructions using the LBI chronology for the MixC protocol (purple), the Control DBI chronology (blue), and the reference MXD chronology (red) for the 1655–2015 (a, c) and 1901–2015 (b, d) time intervals. Panel (e) shows the 1-year-lag moving EPS computed in 31-year windows. The EPS of the reference MXD was averaged from MXD chronologies of four different treatments (Fig. S9). Thick smooth lines denote the 10-year low-pass series filtered using the Butterworth filter. Vertical gray bars show the periods where tree replication is less than 10 (Fig. S3c).
Unlike LBI data, DBI is unaffected by the Fe stain from annual to centennial timescales, which is shown by the high and stable coherence between DBI and MXD chronologies (Fig. 4b, d) and the nonsignificant linear relationships between the log of residual Fe concentrations and delta BI data (Fig. 3f). The linearity between DBI and MXD remained almost unaffected by destaining treatments, for example as with the most efficient MixC protocol (Fig. S10). Furthermore, compared to the Control DBI chronology, no chemical treatments substantially improved the correlation of DBI with MXD data (Fig. 4d), resulting in nearly identical trends in the corresponding temperature reconstructions in comparison with MXD, except for some periods where tree replication is less than 10 (Fig. 6c, d). This evidence suggests that DBI is not only excellent to resolve the sapwood–heartwood color biases, but also efficiently resolves the low-frequency biases caused by the Fe stain in black spruce LSTs from the eastern Canadian boreal forest.
We observed that LBI as well as DBI diverged from the MXD data after the year 1950 CE at L20 (Fig. S8). The divergence of LBI is due to slight color differences between heartwood and sapwood of selected living trees, although this issue is generally not serious for black spruce compared to pine or larch species (Rydval et al., 2014; Sheppard, 1999; Yang, 2007). Although DBI is theoretically sufficient to solve the sapwood–heartwood color issue (Björklund et al., 2014), in our case it could only partially correct this problem (Fig. S8). Old living trees were collected from lakeshore forests at the L20 site, and they often displayed declining ring widths compared to healthy trees sampled later at the same site (not shown). DBI of L20 is likely influenced by these narrow tree rings (Björklund et al., 2019) because DBI of black spruce is not only correlated to MXD but also to the ring-width data (Wang et al., 2020a). We thus speculate the divergence of DBI reflects mostly a specific issue related to the declining growth of unhealthy trees.
This study confirms the robustness of DBI data from stained black spruce LSTs. Yet, two points need to be considered for future DBI-based climate reconstructions. Firstly, a higher tree replication is often needed for DBI than MXD data in order to obtain a robust chronology (Rydval et al., 2014; Wilson et al., 2019). Thus, it is not surprising that the control DBI-based reconstruction showed weaker verification statistics against instrumental temperature (Table S1 in the Supplement) and some slight instability during poorly replicated periods with more variable EPS values (Fig. 6e). When replication was above 15 trees during 1901–1960 (Fig. S3c), the calibration r2 was similar for DBI and MXD data against temperature (Table S1). Secondly, Björklund et al. (2014, 2015) suggested some multi-centennial biases in DBI data due to the heterogeneous wood color. Although this phenomenon is not obvious in our case regardless of the Fe stain, our reconstruction only spanned the last three centuries, and further attention is needed to verify this potential bias.
Our study indicates that the simple delta correction of differentiating latewood and earlywood BI values is more effective to resolve the staining biases of BI data from LSTs than the much more complex and time-consuming chemical destaining protocols tested here. DBI of black spruce LSTs is unaffected by the Fe stain from annual to centennial timescales and allows robust temperature reconstructions similar to MXD data. Consequently, DBI from stained black spruce LSTs is a promising proxy for developing millennial temperature reconstructions in the eastern Canadian boreal forests, a region with very few long MXD series (Wang et al., 2001). On the contrary, LBI is very color sensitive and appears problematic in retaining the low-frequency climatic signal.
The chemical destaining experiments, though not satisfactory regarding the robustness of LBI data, suggest that postsampling chemical Fe oxidation most likely results in the staining issue. Since Fe is so abundant in the Earth's systems, our results may be representative of much wider regions. On the other hand, the excellent Fe extraction abilities (removal of >90 % Fe) of three chemical mixtures also suggest that they, in particular the MixC, can be further used as part of Fe extraction protocols for waterlogged archeological artifacts, which also face Fe-staining issues (Fors et al., 2014, 2012; Pelé et al., 2015; Zhang and Xi, 2003).
Instrumental temperature data are available from Climate Explorer at https://climexp.knmi.nl/start.cgi (KNMI Climate Explorer, 2020). Other data used for analysis are available at https://doi.org/10.5281/zenodo.3930493 (Wang et al., 2020b).
The wood samples are stored at the University of Quebec in Rimouski.
The supplement related to this article is available online at: https://doi.org/10.5194/bg-17-4559-2020-supplement.
FW, DA, ÉB, SO, and GC designed the experiments. SY, GC, AD, and LW supported facilities and guided the experiments. FW, SY, SO, and GC performed the experiments. FW and DA analyzed the data. FW and DA prepared the original manuscript with inputs from ÉB, GC, SO, and AD.
The authors declare that they have no conflict of interest.
This work was supported by the PERSISTENCE project funded by the Natural Sciences and Engineering Research Council of Canada (the NSERC-DRC program), Hydro-Québec, Manitoba Hydro, and the Ouranos consortium. Feng Wang was also funded by the China Scholarship Council. Shulong Yu was supported by the Key Laboratory Opening Subject of the Xinjiang Uyghur Autonomous Region (2016D03005) and Basic Research Operating Expenses of the Central-level Non-profit Research Institutes (IDM201202). Lily Wang was supported by National Natural Science Foundation of China (41571094). We greatly thank Florent Vignola for his assistance in cutting wood blocks. Leila Jolicoeur, Nadège Trou-Kechout, and Pauline Balducci helped during laboratory work and fieldwork. We also thank Feng Chen and Tongwen Zhang for their permission to perform tree-ring density measurements at the Institute of Desert and Meteorology, China Meteorological Administration.
This research has been supported by the Natural Sciences and Engineering Research Council of Canada (PERSISTENCE grant), the Hydro-Québec (PERSISTENCE grant), the Manitoba Hydro (PERSISTENCE grant), the Ouranos consortium (PERSISTENCE grant), the China Scholarship Council, the Science and Technology Department of the Xinjiang Autonomous Region (grant no. 2016D03005), the Institute of Desert Meteorology, China Meteorological Administration (grant no. IDM201202), and the National Natural Science Foundation of China (grant no. 41571094).
This paper was edited by Helge Niemann and reviewed by Milos Rydval and Jesper Björklund.
Anchukaitis, K. J., Wilson, R., Briffa, K. R., Büntgen, U., Cook, E. R., D'Arrigo, R., Davi, N., Esper, J., Frank, D., Gunnarson, B. E., Hegerl, G., Helama, S., Klesse, S., Krusic, P. J., Linderholm, H. W., Myglan, V., Osborn, T. J., Zhang, P., Rydval, M., Schneider, L., Schurer, A., Wiles, G., and Zorita, E.: Last millennium Northern Hemisphere summer temperatures from tree rings: Part II, spatially resolved reconstructions, Quat. Sci. Rev., 163, 1–22, https://doi.org/10.1016/j.quascirev.2017.02.020, 2017.
Anschutz, P., Dedieu, K., Desmazes, F., and Chaillou, G.: Speciation, oxidation state, and reactivity of particulate manganese in marine sediments, Chem. Geol., 218, 265–279, https://doi.org/10.1016/j.chemgeo.2005.01.008, 2005.
Arseneault, D., Dy, B., Gennaretti, F., Autin, J., and Bégin, Y.: Developing millennial tree ring chronologies in the fire-prone North American boreal forest, J. Quat. Sci., 28, 283–292, https://doi.org/10.1002/jqs.2612, 2013.
Björklund, J., Gunnarson, B. E., Seftigen, K., Zhang, P., and Linderholm, H. W.: Using adjusted Blue Intensity data to attain high-quality summer temperature information: A case study from Central Scandinavia, The Holocene, 25, 547–556, https://doi.org/10.1177/0959683614562434, 2015.
Björklund, J., von Arx, G., Nievergelt, D., Wilson, R., Van den Bulcke, J., Günther, B., Loader, N. J., Rydval, M., Fonti, P., Scharnweber, T., Andreu-Hayles, L., Büntgen, U., D'Arrigo, R., Davi, N., De Mil, T., Esper, J., Gärtner, H., Geary, J., Gunnarson, B. E., Hartl, C., Hevia, A., Song, H., Janecka, K., Kaczka, R. J., Kirdyanov, A. V., Kochbeck, M., Liu, Y., Meko, M., Mundo, I., Nicolussi, K., Oelkers, R., Pichler, T., Sánchez-Salguero, R., Schneider, L., Schweingruber, F., Timonen, M., Trouet, V., Van Acker, J., Verstege, A., Villalba, R., Wilmking, M., and Frank, D.: Scientific Merits and Analytical Challenges of Tree-Ring Densitometry, Rev. Geophys., 57, 1224–1264, https://doi.org/10.1029/2019RG000642, 2019.
Björklund, J. A., Gunnarson, B. E., Seftigen, K., Esper, J., and Linderholm, H. W.: Blue intensity and density from northern Fennoscandian tree rings, exploring the potential to improve summer temperature reconstructions with earlywood information, Clim. Past, 10, 877–885, https://doi.org/10.5194/cp-10-877-2014, 2014.
Borggaard, O. K.: Selective extraction of amorphous iron oxides by EDTA from selected silicates and mixtures of amorphous and crystallline iron oxides, Clay Miner., 17, 365–368, https://doi.org/10.1180/claymin.1982.017.3.09, 1982.
Bortleson, G. C. and Lee, G. F.: Phosphorus, iron, and manganese distribution in sediment cores of six Wisconsin lakes, Limnol. Oceanogr., 19, 794–801, https://doi.org/10.4319/lo.1974.19.5.0794, 1974.
Briffa, K. R. and Melvin, T. M.: A Closer Look at Regional Curve Standardization of Tree-Ring Records: Justification of the Need, a Warning of Some Pitfalls, and Suggested Improvements in Its Application, in: Dendroclimatology: Progress and Prospects, edited by: Hughes, M. K., Swetnam, T. W., and Diaz, H. F., pp. 113–145, Springer Netherlands, Dordrecht, 2011.
Bunn, A. G.: A dendrochronology program library in R (dplR), Dendrochronologia, 26, 115–124, https://doi.org/10.1016/j.dendro.2008.01.002, 2008.
Campbell, R., McCarroll, D., Loader, N. J., Grudd, H., Robertson, I., and Jalkanen, R.: Blue intensity in Pinus sylvestris tree-rings: developing a new palaeoclimate proxy, The Holocene, 17, 821–828, https://doi.org/10.1177/0959683607080523, 2007.
Chester, R. and Hughes, M. J.: The trace element geochemistry of a North Pacific pelagic clay core, Deep Sea Res. Oceanogr. Abstr., 16, 639–654, https://doi.org/10.1016/0011-7471(69)90064-3, 1969.
Davison, W.: Iron and manganese in lakes, Earth-Sci. Rev., 34, 119–163, https://doi.org/10.1016/0012-8252(93)90029-7, 1993.
Davison, W., Woof, C., and Rigg, E.: The dynamics of iron and manganese in a seasonally anoxic lake; direct measurement of fluxes using sediment traps, Limnol. Oceanogr., 27, 987–1003, https://doi.org/10.4319/lo.1982.27.6.0987, 1982.
Environment Canada: Canadian climate normals or averages 1981–2010, available at: https://climate.weather.gc.ca/climate_normals/index_e.html, last access: 14 March 2020.
Esper, J., Frank, D. C., Wilson, R. J. S., and Briffa, K. R.: Effect of scaling and regression on reconstructed temperature amplitude for the past millennium, Geophys. Res. Lett., 32, L07711, https://doi.org/10.1029/2004GL021236, 2005.
Esper, J., Düthorn, E., Krusic, P. J., Timonen, M., and Büntgen, U.: Northern European summer temperature variations over the Common Era from integrated tree-ring density records, J. Quat. Sci., 29, 487–494, https://doi.org/10.1002/jqs.2726, 2014.
Fors, Y., Jalilehvand, F., Damian Risberg, E., Björdal, C., Phillips, E., and Sandström, M.: Sulfur and iron analyses of marine archaeological wood in shipwrecks from the Baltic Sea and Scandinavian waters, J. Archaeol. Sci., 39, 2521–2532, https://doi.org/10.1016/j.jas.2012.03.006, 2012.
Fors, Y., Grudd, H., Rindby, A., Jalilehvand, F., Sandström, M., Cato, I., and Bornmalm, L.: Sulfur and iron accumulation in three marine-archaeological shipwrecks in the Baltic Sea: The Ghost, the Crown and the Sword, Sci. Rep., 4, 4222, https://doi.org/10.1038/srep04222, 2014.
Frank, D. and Esper, J.: Characterization and climate response patterns of a high-elevation, multi-species tree-ring network in the European Alps, Dendrochronologia, 22, 107–121, https://doi.org/10.1016/j.dendro.2005.02.004, 2005.
Gennaretti, F., Arseneault, D., and Bégin, Y.: Millennial disturbance-driven forest stand dynamics in the Eastern Canadian taiga reconstructed from subfossil logs, J. Ecol., 102, 1612–1622, https://doi.org/10.1111/1365-2745.12315, 2014a.
Gennaretti, F., Arseneault, D., and Bégin, Y.: Millennial stocks and fluxes of large woody debris in lakes of the North American taiga, J. Ecol., 102, 367–380, https://doi.org/10.1111/1365-2745.12198, 2014b.
Gennaretti, F., Arseneault, D., Nicault, A., Perreault, L., and Bégin, Y.: Volcano-induced regime shifts in millennial tree-ring chronologies from northeastern North America, P. Natl. Acad. Sci., 111, 10077, https://doi.org/10.1073/pnas.1324220111, 2014c.
Grudd, H., Briffa, K. R., Karlén, W., Bartholin, T. S., Jones, P. D., and Kromer, B.: A 7400-year tree-ring chronology in northern Swedish Lapland: natural climatic variability expressed on annual to millennial timescales, The Holocene, 12, 657–665, https://doi.org/10.1191/0959683602hl578rp, 2002.
Gupta, S. K. and Chen, K. Y.: Partitioning of Trace Metals in Selective Chemical Fractions of Nearshore Sediments, Environ. Lett., 10, 129–158, https://doi.org/10.1080/00139307509435816, 1975.
Harris, I., Jones, P. D., Osborn, T. J., and Lister, D. H.: Updated high-resolution grids of monthly climatic observations – the CRU TS3.10 Dataset, Int. J. Climatol., 34, 623–642, https://doi.org/10.1002/joc.3711, 2014.
Helama, S., Melvin, T. M., and Briffa, K. R.: Regional curve standardization: State of the art, The Holocene, 27, 172–177, https://doi.org/10.1177/0959683616652709, 2017.
Hyacinthe, C., Bonneville, S., and Van Cappellen, P.: Reactive iron(III) in sediments: Chemical versus microbial extractions, Geochim. Cosmochim. Ac., 70, 4166–4180, https://doi.org/10.1016/j.gca.2006.05.018, 2006.
Kaczka, R. J., Spyt, B., Janecka, K., Beil, I., Büntgen, U., Scharnweber, T., Nievergelt, D., and Wilmking, M.: Different maximum latewood density and blue intensity measurements techniques reveal similar results, Dendrochronologia, 49, 94–101, https://doi.org/10.1016/j.dendro.2018.03.005, 2018.
KNMI Climate Explorer: Instrumental temperature data, available at: https://climexp.knmi.nl/start.cgi, last access: 15 September 2020.
Kostka, J. E. and Luther, G. W.: Partitioning and speciation of solid phase iron in saltmarsh sediments, Geochim. Cosmochim. Ac., 58, 1701–1710, https://doi.org/10.1016/0016-7037(94)90531-2, 1994.
McCarroll, D., Pettigrew, E., Luckman, A., Guibal, F., and Edouard, J.-L.: Blue Reflectance Provides a Surrogate for Latewood Density of High-latitude Pine Tree Rings, Arct. Antarct. Alp. Res., 34, 450–453, https://doi.org/10.1080/15230430.2002.12003516, 2002.
McCarroll, D., Loader, N. J., Jalkanen, R., Gagen, M. H., Grudd, H., Gunnarson, B. E., Kirchhefer, A. J., Friedrich, M., Linderholm, H. W., Lindholm, M., Boettger, T., Los, S. O., Remmele, S., Kononov, Y. M., Yamazaki, Y. H., Young, G. H., and Zorita, E.: A 1200-year multiproxy record of tree growth and summer temperature at the northern pine forest limit of Europe, The Holocene, 23, 471–484, https://doi.org/10.1177/0959683612467483, 2013.
Nürnberg, G. K. and Dillon, P. J.: Iron budgets in temperate lakes, Can. J. Fish. Aquat. Sci., 50, 1728–1737, https://doi.org/10.1139/f93-194, 1993.
Österreicher, A., Weber, G., Leuenberger, M., and Nicolussi, K.: Exploring blue intensity-comparison of blue intensity and MXD data from Alpine spruce trees, TRACE–Tree Rings, Archaeol. Climatol. Ecol., 13, 56–61, https://doi.org/10.2312/GFZ.b103-15069, 2015.
Payette, S.: The range limit of boreal tree species in Québec-Labrador: an ecological and palaeoecological interpretation, Palaeoecol. Perspect. Veg. Can.-Festschr. Honour JC Ritchie, 79, 7–30, https://doi.org/10.1016/0034-6667(93)90036-T, 1993.
Pelé, C., Guilminot, E., Labroche, S., Lemoine, G., and Baron, G.: Iron removal from waterlogged wood: Extraction by electrophoresis and chemical treatments, Stud. Conserv., 60, 155–171, https://doi.org/10.1179/2047058413Y.0000000110, 2015.
R Core Team: R: A language and environment for statistical computing, R Foundation for Statistical Computing, Vienna, Austria, available at: https://www.R-project.org/, last access: 15 September 2020.
Rydval, M., Larsson, L.-Å., McGlynn, L., Gunnarson, B. E., Loader, N. J., Young, G. H. F., and Wilson, R.: Blue intensity for dendroclimatology: Should we have the blues? Experiments from Scotland, Dendrochronologia, 32, 191–204, https://doi.org/10.1016/j.dendro.2014.04.003, 2014.
Rydval, M., Loader, N. J., Gunnarson, B. E., Druckenbrod, D. L., Linderholm, H. W., Moreton, S. G., Wood, C. V., and Wilson, R.: Reconstructing 800 years of summer temperatures in Scotland from tree rings, Clim. Dynam., 49, 2951–2974, https://doi.org/10.1007/s00382-016-3478-8, 2017.
Sheppard, P. R.: Overcoming extraneous wood color variation during low-magnification reflected-light image analysis of conifer tree rings, Wood Fiber Sci., 31, 106–115, 1999.
Sheppard, P. R. and Wiedenhoeft, A.: An advancement in removing extraneous color from wood for low-magnification reflected-light image analysis of conifer tree rings, Wood Fiber Sci., 39, 173–183, 2007.
St. George, S. and Esper, J.: Concord and discord among Northern Hemisphere paleotemperature reconstructions from tree rings, Quat. Sci. Rev., 203, 278–281, https://doi.org/10.1016/j.quascirev.2018.11.013, 2019.
Tessier, A., Campbell, P. G. C., and Bisson, M.: Sequential extraction procedure for the speciation of particulate trace metals, Anal. Chem., 51, 844–851, https://doi.org/10.1021/ac50043a017, 1979.
Wang, F., Arseneault, D., Boucher, É., Galipaud Gloaguen, G., Deharte, A., Yu, S., and Trou-kechout, N.: Temperature sensitivity of blue intensity, maximum latewood density, and ring width data of black spruce tree rings in the eastern Canadian taiga, Dendrochronologia, submitted, 2020a.
Wang, F., Arseneault, D., Boucher, É., Yu, S., Ouellet, S., Chaillou, G., Delwaide, A., and Wang, L.: Data for Chemical de-staining and the delta correction for blue intensity measurements of stained lake subfossil trees (Version 1), Zenodo, https://doi.org/10.5281/zenodo.3930493, 2020b.
Wang, L., Payette, S., and Bégin, Y.: 1300-year tree-ring width and density series based on living, dead and subfossil black spruce at tree-line in Subarctic Quebec, Canada, The Holocene, 11, 333–341, https://doi.org/10.1191/095968301674769686, 2001.
Wigley, T. M. L., Briffa, K. R., and Jones, P. D.: On the Average Value of Correlated Time Series, with Applications in Dendroclimatology and Hydrometeorology, J. Clim. Appl. Meteorol., 23, 201–213, https://doi.org/10.1175/1520-0450(1984)023<0201:OTAVOC>2.0.CO;2, 1984.
Wilson, R., Rao, R., Rydval, M., Wood, C., Larsson, L.-Å., and Luckman, B. H.: Blue Intensity for dendroclimatology: The BC blues: A case study from British Columbia, Canada, The Holocene, 24, 1428–1438, https://doi.org/10.1177/0959683614544051, 2014.
Wilson, R., Anchukaitis, K., Briffa, K., Büntgen, U., Cook, E., D'Arrigo, R., Davi, N., Esper, J., Frank, D., Gunnarson, B., Hegerl, G., Klesse, S., Krusic, P., Linderholm, H., Myglan, V., Peng, Z., Rydval, M., Schneider, L., Schurer, A., Wiles, G., and Zorita, E.: Last millennium northern hemisphere summer temperatures from tree rings: Part I: The long term context, Quat. Sci. Rev. 134, 1–18, https://doi.org/10.1016/j.quascirev.2015.12.005, 2016.
Wilson, R., Anchukaitis, K., Andreu-Hayles, L., Cook, E., D'Arrigo, R., Davi, N., Haberbauer, L., Krusic, P., Luckman, B., Morimoto, D., Oelkers, R., Wiles, G., and Wood, C.: Improved dendroclimatic calibration using blue intensity in the southern Yukon, The Holocene, 29, 1817–1830, https://doi.org/10.1177/0959683619862037, 2019.
Yang, K. C.: Growth ring contrast enhancement and the differentiation of sapwood and heartwood zones, Wood Fiber Sci., 19, 339–342, 2007.
Zang, C. and Biondi, F.: treeclim: an R package for the numerical calibration of proxy-climate relationships, Ecography, 38, 431–436, https://doi.org/10.1111/ecog.01335, 2015.
Zaw, M. and Chiswell, B.: Iron and manganese dynamics in lake water, Water Res., 33, 1900–1910, https://doi.org/10.1016/S0043-1354(98)00360-1, 1999.
Zhang, J. and Xi, S.: Research on the decoloration of waterlogged bamboo slips, Sci. Conserv. Archaeol., 15, 37–42, 2003 (in Chinese with English abstract).
delta bluemathematical correction of blue intensity data. Although no chemical treatment was completely efficient, the delta blue method is unaffected by the staining problem and thus is promising for climate reconstructions based on lake subfossil material.