the Creative Commons Attribution 4.0 License.
the Creative Commons Attribution 4.0 License.
 | 18 Sep 2020
Mineralization of organic matter in boreal lake sediments: rates, pathways, and nature of the fermenting substrates
Yves Gélinas
André Tessier
Charles Gobeil
The complexity of organic matter (OM) degradation mechanisms represents a significant challenge for developing biogeochemical models to quantify the role of aquatic sediments in the climate system. The common representation of OM by carbohydrates formulated as CH2O in models comes with the assumption that its degradation by fermentation produces equimolar amounts of methane (CH4) and dissolved inorganic carbon (DIC). To test the validity of this assumption, we modelled using reaction-transport equation vertical profiles of the concentration and isotopic composition (δ13C) of CH4 and DIC in the top 25 cm of the sediment column from two lake basins, one whose hypolimnion is perennially oxygenated and one with seasonal anoxia. Furthermore, we modelled solute porewater profiles reported in the literature for four other seasonally anoxic lake basins. A total of 17 independent porewater datasets are analyzed. CH4 and DIC production rates associated with methanogenesis at the five seasonally anoxic sites collectively show that the fermenting OM has a mean (± SD) carbon oxidation state (COS) value of . This value is much lower than the value of zero expected from carbohydrate fermentation. We conclude that carbohydrates do not adequately represent the fermenting OM in hypolimnetic sediments and propose to include the COS in the formulation of OM fermentation in models applied to lake sediments to better quantify sediment CH4 outflux. This study highlights the potential of mass balancing the products of OM mineralization to characterize labile substrates undergoing fermentation in sediments.
- Article
(2435 KB) - Full-text XML
-
Supplement
(960 KB) - BibTeX
- EndNote


Significant proportions of atmospheric methane (CH4) and carbon dioxide (CO2), two powerful greenhouse gases, are thought to originate from freshwater lake sediments (Bastviken et al., 2004; Turner et al., 2015; Wuebbles and Hayhoe, 2002), but large uncertainties remain concerning their contribution to the global CO2 and CH4 budgets (Saunois et al., 2016). The role of these waterbodies in the global carbon (C) budget has been acknowledged for more than a decade (Cole et al., 2007). Especially in the lake-rich boreal region, lakes are hotspots of CO2 and CH4 release (Hastie et al., 2018; Wallin et al., 2018) and intensive sites of terrestrial C processing (Holgerson and Raymond, 2016; Staehr et al., 2012). Using high-resolution satellite imagery, Verpoorter et al. (2014) estimated the number of lakes on earth larger than 0.01 km2 to about 27 million and reported that the highest lake concentration and surface area are found in boreal regions. Boreal lakes, which are typically small and shallow, are known to store large amounts of organic C, to warm up quickly, and to develop anoxic hypolimnia in the warm season (Sabrekov et al., 2017; Schindler et al., 1996). Owing to the great abundance of boreal lakes, their sensitivity to climate change, and their foreseen important role in the global C cycle, there is a need to further develop process-based models to better quantify C processing reactions in these lakes and their alteration under warming (Saunois et al., 2016).
In aquatic environments, CH4 is mainly produced (methanogenesis) in the sediment along with CO2 at depths where most electron acceptors (EAs) are depleted (Conrad, 1999; Corbett et al., 2013). During its upward migration to the atmosphere, CH4 is partly aerobically or anaerobically oxidized to CO2 (methanotrophy) in the upper strata of the sediments and in the water column (Bastviken et al., 2008; Beal et al., 2009; Egger et al., 2015; Ettwig et al., 2010; Raghoebarsing et al., 2006). The oxidation of organic matter (OM) by EAs such as O2, , Fe(III), Mn(IV), , and humic substances as well as the partial fermentation of high-molecular-weight organic matter (HMW OM) into lower-molecular-weight organic matter (LMW OM) are also potential sources of CO2 in the sedimentary environment (Corbett et al., 2015). Predicting fluxes of CH4 and CO2 from the aquatic sediments and water column to the atmosphere is challenging considering the various transport processes and chemical and microbially mediated reactions implicated and the complexity of natural OM, which serves as substrate (Natchimuthu et al., 2017).
Process-based geochemical models taking into account both the numerous biogeochemical reactions involving C and transport processes are powerful tools that are able to interpret present-day sediment, porewater, and water-column profiles of C species and offer great potential to forecast changes in cycling of this element under variable environmental scenarios (Arndt et al., 2013; Paraska et al., 2014; Saunois et al., 2016; Wang and Van Cappellen, 1996). Nonetheless, the performance of these models depends on the correct formulation of the complete OM mineralization reactions, e.g., OM decomposition to DIC, phosphate, ammonium, and CH4 through oxidation and fermentation reactions (Burdige, 1991), particularly in terms of the metabolizable organic compounds involved. Up to now, carbohydrates, represented as the simple chemical formula CH2O (or C6H12O6), whose average carbon oxidation state (COS) is zero, are commonly assumed to be representative of the bulk of metabolizable OM, including the substrates involved in fermentation reactions (e.g., Arndt et al., 2013; Arning et al., 2016; Paraska et al., 2014, and references therein). The capacity of CH2O to represent adequately the ensemble of labile organic compounds is, nevertheless, becoming increasingly questioned in the literature given the variety and complexity of organic molecules present in the environment (Alperin et al., 1994; Burdige and Komada, 2011; Clayer et al., 2016; Jørgensen and Parkes, 2010). Based on the observation that methanogenesis produced CH4 3 times faster than CO2 in the sediments of a boreal, sporadically anoxic lake basin, Clayer et al. (2018) concluded that the fermenting OM had a markedly negative COS value of −1.9. This COS value corresponds more closely to a mixture of fatty acids and fatty alcohols than to carbohydrates (e.g., CH2O), which would have yielded equivalent CH4 and CO2 production rates. The low COS value of metabolizable OM in the sediment layer where methanogenesis occurred in this lake has been attributed to the nearly complete consumption of the most labile organic components (e.g., carbohydrates, proteins) during its downward transport through the water column and the upper sediment layers, thus leaving only material of lower lability such as fatty acids and fatty alcohols available for methanogenesis. Such interpretation, however, must be validated by investigating other lakes before revising the formulation of the fermenting OM used in diagenetic models in order to improve model predictions of C cycling, including greenhouse gas production and emission from these environments.
In this study, the approach described in Clayer et al. (2018), combining concentration and δ13C inverse modelling, is applied to the two newly acquired datasets. These datasets include centimetre-scale vertical porewater profiles of the concentrations and of the stable carbon isotope ratios (δ13C) of CH4 and dissolved inorganic carbon (DIC) as well as those of the concentrations of EAs from hypolimnetic sediments of two boreal lake basins showing contrasted O2 dynamics: one whose hypolimnion remains perennially oxygenated and the other whose hypolimnion becomes anoxic for several months annually. This procedure enables us to constrain the effective rates of OM mineralization reactions and calculate, using a mass balance equation, the COS of the substrates fermenting in the sediments in these two lake basins. In addition, we modelled solute porewater profiles gathered from the scientific literature or from our data repository for four other seasonally anoxic lake basins to estimate, using the mass balance equation, the COS of the substrates fermenting in these sediments. A total of 17 independent datasets are analyzed to provide additional insight into the COS of the fermenting OM in boreal lakes and the associated mineralization pathways.
2.1 Study sites
This study was carried out in two small, dimictic oligotrophic and headwater lakes located within 50 km from Québec City, eastern Canada, with fully forested and uninhabited watersheds (Fig. 1). Lake Tantaré (47∘04′ N, 71∘32′ W) is part of the Tantaré Ecological Reserve and has four basins connected by shallow channels and a total surface area of 1.1 km2. Lake Bédard (47∘16′ N, 71∘07′ W), lying in the protected Montmorency Forest, comprises only one small (0.05 km2) basin. The samples for this study were collected at the deepest sites of Lake Bédard (10 m) and of the westernmost basin of Lake Tantaré (15 m), hereafter referred to as Basin A of Lake Tantaré to remain consistent with our previous studies (e.g., Clayer et al., 2016; Couture et al., 2008). These two sampling sites were selected based on their contrasting O2 regimes (Fig. 1): Lake Bédard develops an anoxic hypolimnion early in the summer (D'Arcy, 1993), whereas the hypolimnion of Lake Tantaré Basin A is perennially oxygenated (Couture et al., 2008). The O2 diffusion depth in the sediments of Lake Tantaré Basin A, as measured with a microelectrode, does not exceed 4 mm (Couture et al., 2016).
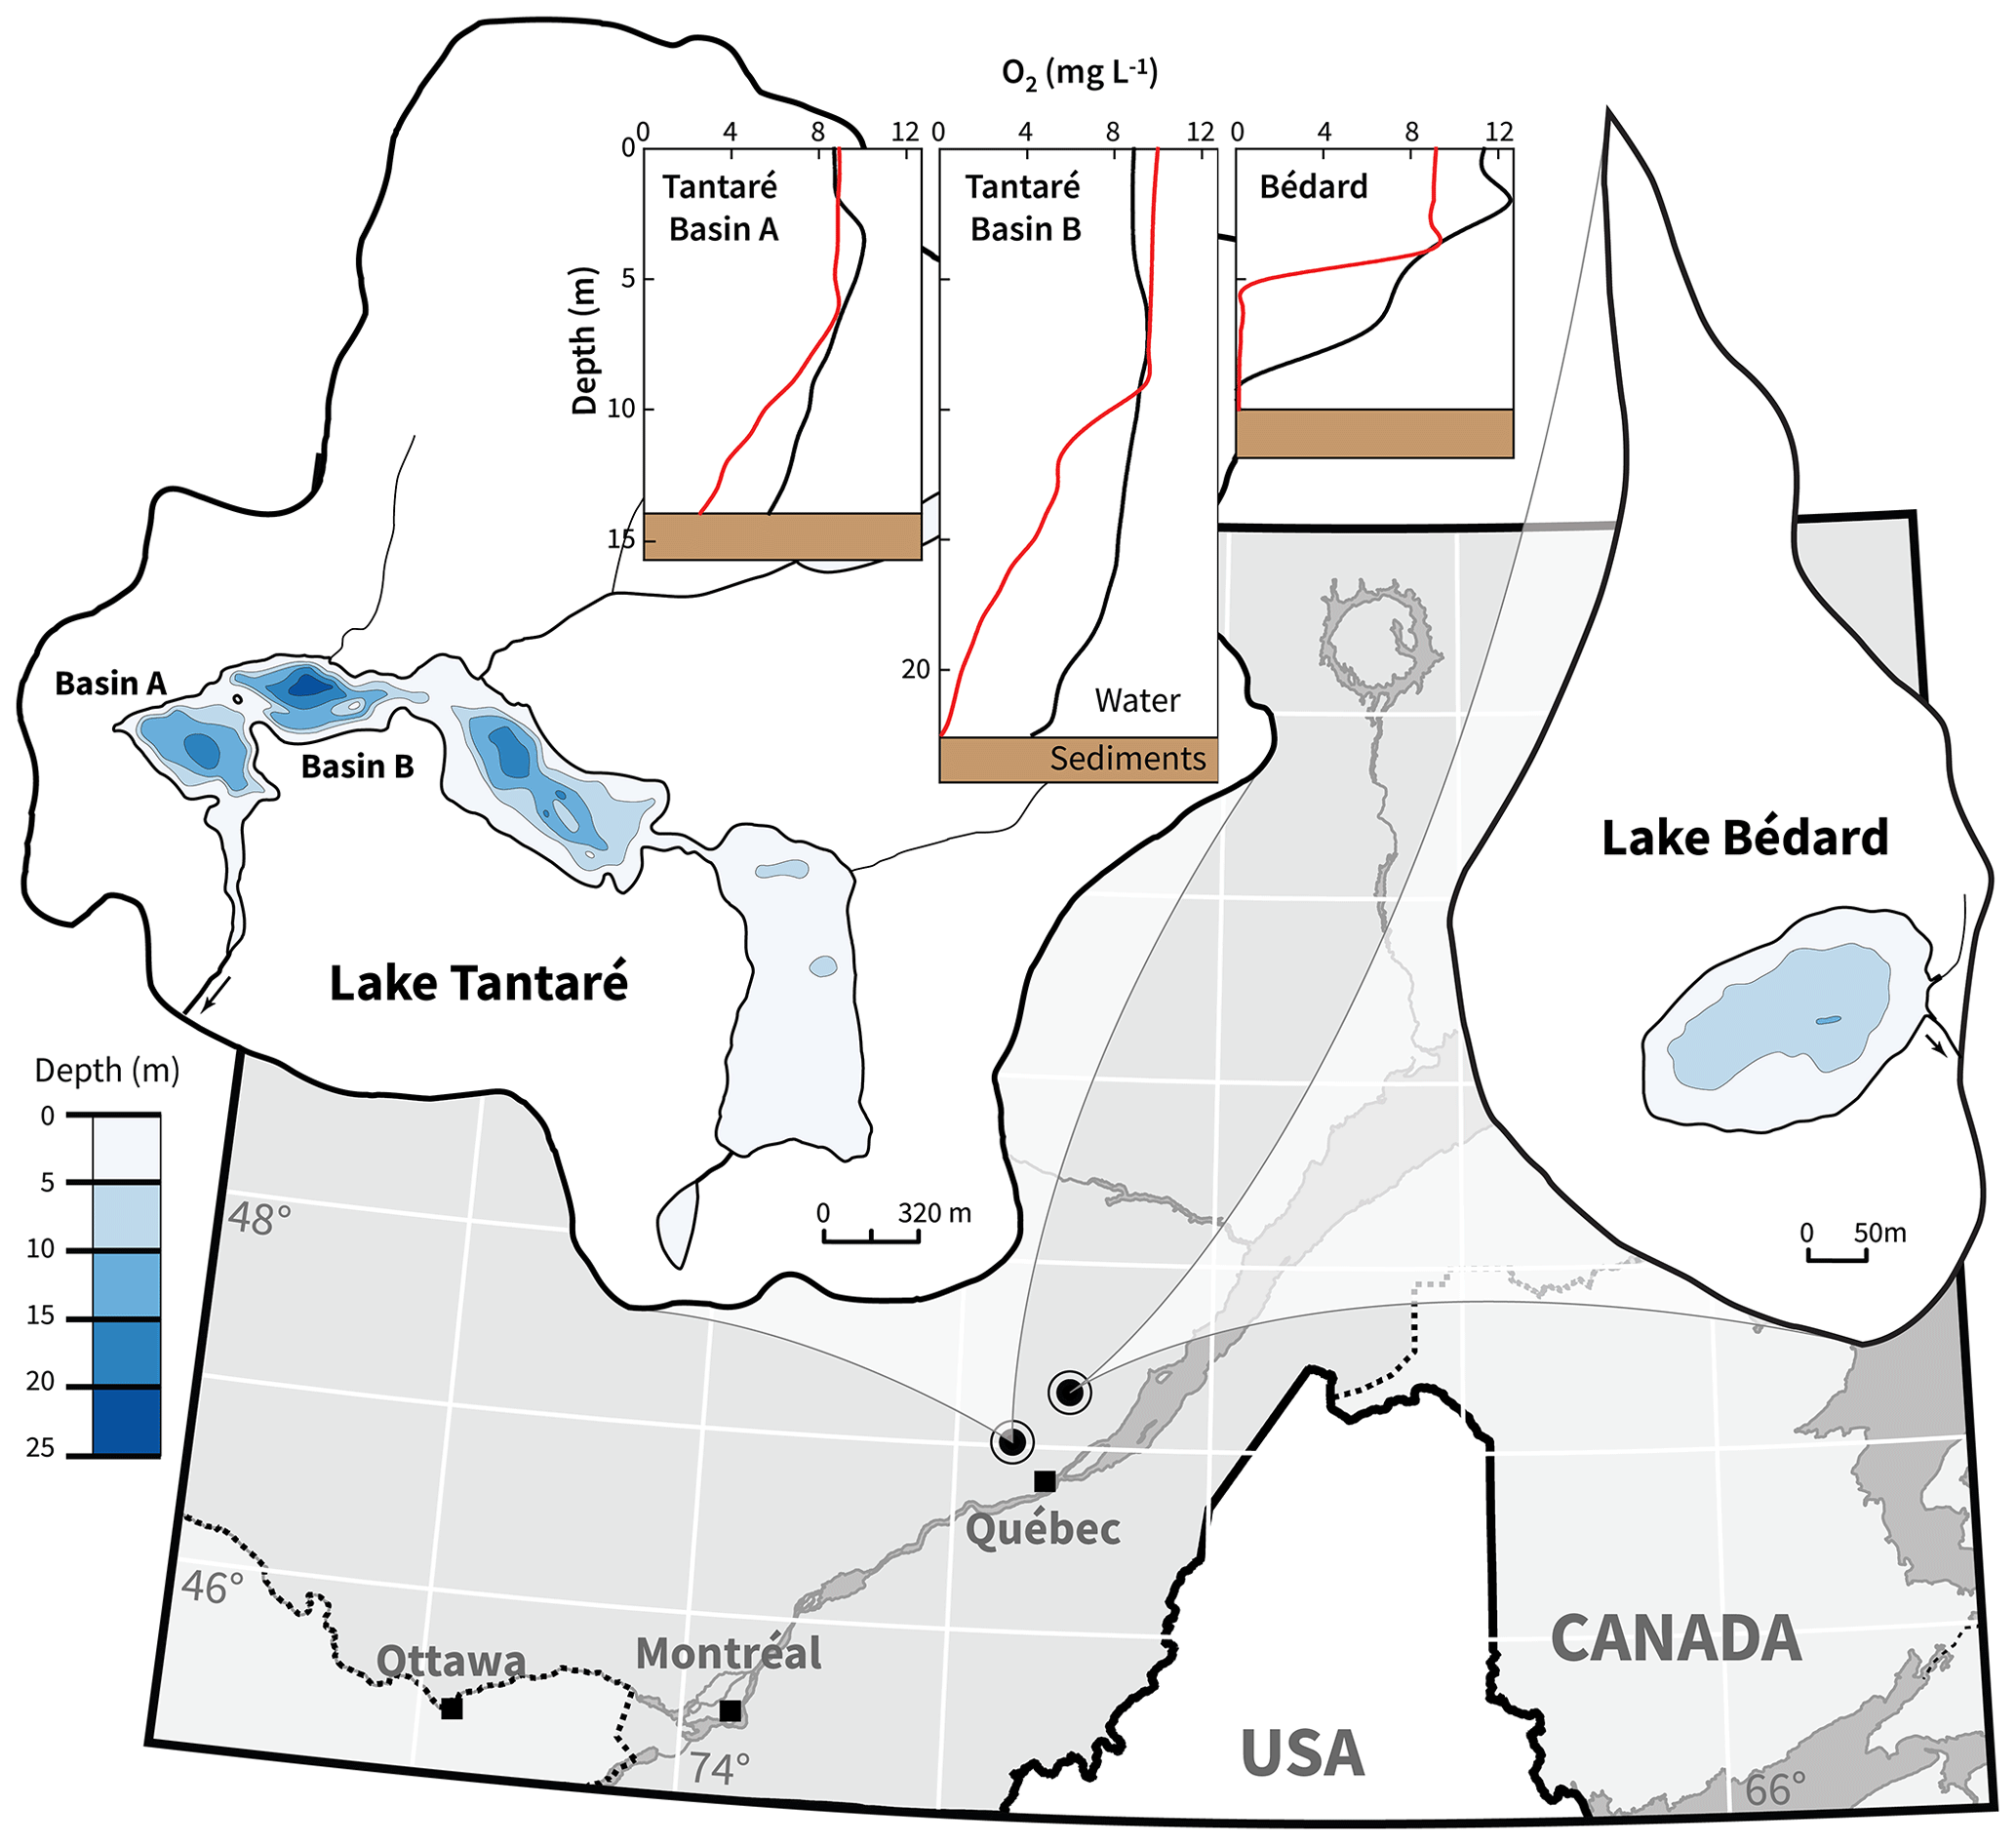
Figure 1Location map and bathymetry of lakes Tantaré and Bédard. The bathymetric map of Lake Tantaré was reproduced from the map C-9287 of the Service des eaux de surface of the Québec Ministry of Environment. The map of Lake Bédard was reproduced from D'Arcy (1993). Dioxygen concentrations in the water column of Lake Tantaré Basins A and B and of Lake Bédard are given for June (black lines) and October (red lines).
The sediment accumulation rates are 4.0–7.3 and 2.4–46.8 mg cm−2 yr−1 at the deepest sites of Lake Tantaré Basin A and Lake Bédard, respectively (Couture et al., 2010). The relatively constant organic C (Corg) content (20±2 %; Fig. 2b), the elevated {Corg}:{N} molar ratio (17±2; Fig. 2b), and the δ13C (−29 ‰; Joshani, 2015) and δ15N (+0.5 ‰ to −2.5 ‰; Joshani, 2015) values reported for the sediment OM over the top 30 cm in Lake Tantaré Basin A are typical of terrestrial humic substances (Botrel et al., 2014; Francioso et al., 2005). The Corg content (21±2.7 %; Fig. 2a) and {Corg}:{N} molar ratio (14±1.9; Fig. 2a) reported over the top 30 cm of Lake Bédard sediments show slightly more variation with depth but are also typical of terrestrial OM. In addition, the {Corg}:{S} ratios of both lake basin sediments (50–200) are typical of those reported for soil OM (∼125; Buffle, 1988).
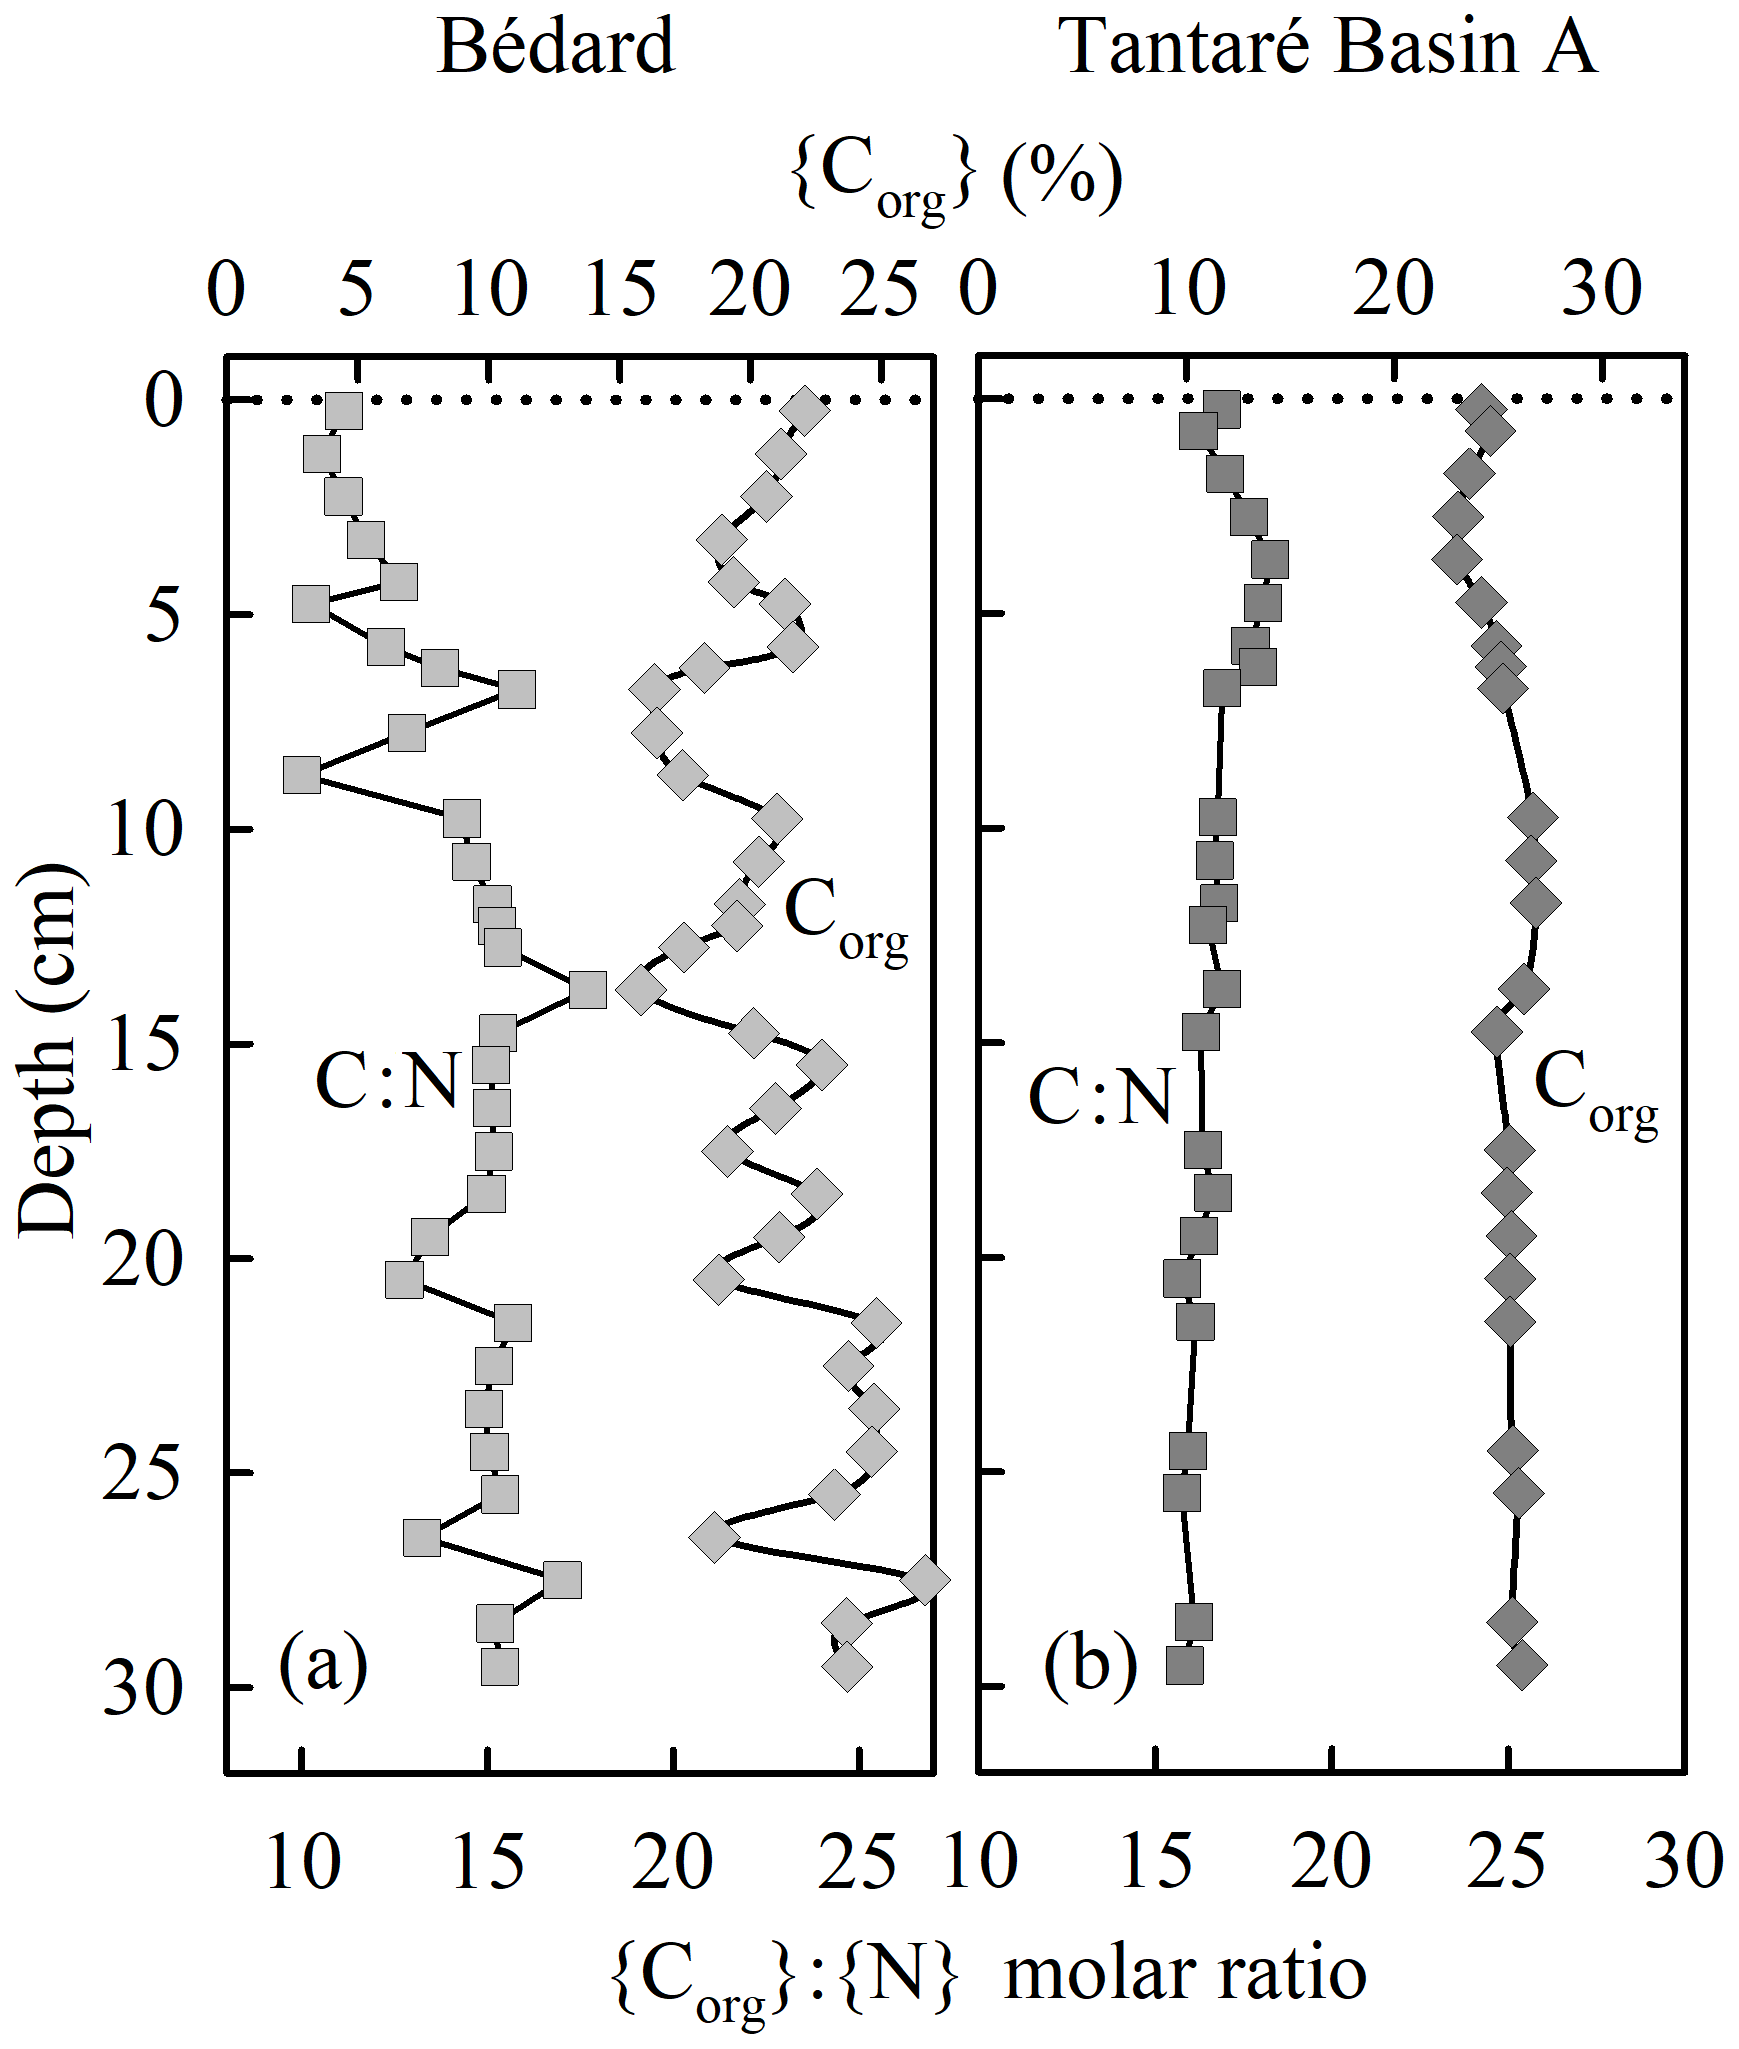
Figure 2Depth profiles of the organic C concentrations and of the C:N molar ratio in sediment cores collected at the deepest sites of Lake Bédard (a) and Lake Tantaré Basin A (b).
2.2 Sample collection
Sediment porewater samples were acquired by in situ dialysis in October 2015 with peepers (Carignan et al., 1985; Hesslein, 1976) deployed by divers within a 25 m2 area at the deepest site of each lake basin. Bottom water O2 concentrations were ∼2.5 and <0.1 mg L−1 in Lake Tantaré Basin A and in Lake Bédard, respectively. The acrylic peepers comprised two columns of 4 mL cells, filled with ultrapure water and covered by a 0.2 µm Gelman HT-200 polysulfone membrane, which allowed porewater sampling from about 23–25 cm below the sediment–water interface (SWI) to 5 cm above this interface (hereafter referred to as overlying water) at a 1 cm depth resolution. Oxygen was removed from the peepers prior to their deployment, as described by Laforte et al. (2005). Four peepers were left in the sediments of each lake basin for at least 15 d, i.e., a longer time period than that required for solute concentrations in the peeper cells to reach equilibrium with those in the porewater (5–10 d; Carignan et al., 1985; Hesslein, 1976). At least three independent porewater profiles of pH; of the concentrations of CH4, DIC, acetate, , , Fe, and Mn; and of the δ13C of CH4 and DIC were generated for the two sampling sites. In Lake Bédard, samples were also collected to determine three porewater profiles of sulfide concentrations (ΣS(-II)). After peeper retrieval, samples (0.9–1.9 mL) for CH4 and DIC concentrations and δ13C measurements were collected within 5 min from the peeper cells with He-purged polypropylene syringes. They were injected through rubber septa into He-purged 3.85 mL Exetainers (Labco Limited) after removal of a volume equivalent to that of the collected porewater. The Exetainers were preacidified with 40–80 µL of HCl 1N to reach a final pH ≤2. The protocols used to collect and preserve water samples for the other solutes are given by Laforte et al. (2005).
2.3 Analyses
Concentrations and carbon isotopic composition of CH4 and DIC were measured as described by Clayer et al. (2018). Briefly, the concentrations were analyzed within 24 h of peeper retrieval by gas chromatography with a precision better than 4 % and detection limits (DLs) of 2 and 10 µM for CH4 and DIC, respectively. The 13C∕12C abundance ratios of CH4 and CO2 were determined by mass spectrometry with a precision of ±0.2 ‰ when 25 µmol of an equimolar mixture of CH4 and CO2 was injected, and results are reported as
where the subscript solute stands for CH4 or DIC, and the reference standard is Vienna Pee Dee Belemnite (VPDB). Acetate concentration was determined by ion chromatography (DL of 1.4 µM) and those of Fe, Mn, , , and ΣS(−II), as given by Laforte et al. (2005).
2.4 Inverse modelling of porewater solutes
The one-dimensional mass-conservation equation (Boudreau, 1997)
was used to separately model the porewater profile of each relevant solute, i.e., CH4, DIC, O2, Fe, and , considering steady-state and negligible solute transport by bioturbation and advection. The validity of these assumptions has been previously demonstrated for the study sites (Couture et al., 2008, 2010; Clayer et al., 2016). In this equation, [solute] and [solute]tube denote a solute concentration in the porewater and in the animal tubes (assumed to be identical to that in the overlying water), respectively; x is depth (positive downward); φ is porosity; Ds is the solute effective diffusion coefficient in sediments; αIrrigation is the bioirrigation coefficient; and (in moles per cubic centimetre of wet sediment per second) is the solute net production rate (or consumption rate if is negative). Ds was assumed to be φ2Dw (Ullman and Aller, 1982), where Dw is the solute tracer diffusion coefficient in water. The values of Dw, corrected for in situ temperature (Clayer et al., 2018), were 9.5 , 6.01 , 1.12 , 5.81 , 3.19 , 1.17 cm2 s−1 for CH4, , CO2, , Fe, and O2, respectively. The values of αIrrigation in Lake Tantaré Basin A were calculated as in Clayer et al. (2016), considering that αIrrigation varies linearly from α0_Irrigation at the SWI (calculated according to Boudreau, 1984, based on an inventory of benthic animals; Hare et al., 1994) to 0 at 10 cm depth (the maximum depth at which chironomids are found in lake sediments; Matisoff and Wang, 1998) and were assumed to be 0 in Lake Bédard since its bottom water was anoxic (Fig. 1).
The values were determined from the average (n=3 or 4) solute concentration profiles by numerically solving Eq. (2) with the computer code PROFILE (Berg et al., 1998). The boundary conditions were the solute concentrations at the top and at the base of the porewater profiles. In situ porewater O2 profiles were not measured in Lake Tantaré Basin A. For modelling this solute with PROFILE, we assumed that the [O2] in the overlying water was identical to that measured in the lake bottom water and equal to 0 below 0.5 cm (based on O2 penetration depth; Couture et al., 2016). This procedure provides a rough estimate of at the same vertical resolution as for the other solutes. The code PROFILE yields a discontinuous profile of discrete values over depth intervals (zones), which are objectively selected by using the least square criterion and statistical F testing (Berg et al., 1998). In order to estimate the variability in related to heterogeneity within the 25 m2 sampling area, additional values were obtained by modelling the average profiles whose values were increased or decreased by 1 standard deviation. This variability generally ranges between 2 and 10 fmol cm−3 s−1.
In addition, the computer program WHAM 6 (Tipping, 2002) was used, as described by Clayer et al. (2016), to calculate the speciation of porewater cations and anions. The solute activities thus obtained, together with solubility products (Ks), were used to calculate saturation index values (, where IAP is the ion activity product).
2.5 Reaction network
The main reactions retained in this study to describe carbon cycling in the sediments of the two lake basins are shown in Table 1. Ri and αi denote, respectively, the effective (or gross) reaction rate and the carbon isotopic fractionation factor associated with each Reaction (Ri; Table 1). Once oxidants are depleted, fermentation of metabolizable OM of general formula CxHyOz can yield acetate, CO2, and H2 (Reaction 1). The coefficient ν1 in Reaction (R1) constrains the relative contribution of acetoclasty and hydrogenotrophy. The partial degradation of high-molecular-weight OM (HMW OM) into lower-molecular-weight OM (LMW OM) can also produce CO2 (Reaction R2; Corbett et al., 2013, 2015). Acetoclasty (Reaction R3) and hydrogenotrophy (Reaction R4) yield CH4. Moreover, CH4 (Reaction R5) and OM (Reaction R6) can be oxidized to CO2 when electron acceptors such as O2, Fe(III), and are present. Note that the electron acceptors (EAs) and Mn oxyhydroxides were shown to be negligible in these two lake basins (Clayer et al., 2016; Feyte et al., 2012) as well as the precipitation of carbonates whose saturation index values are negative (SI ), except for siderite (Reaction R7) in Lake Bédard (SI =0.0 to 0.7 below 10 cm depth).
Table 1Reactions considered (R1–R7), their reaction rates (R1–R7), and carbon isotopic fractionation factors (α1–α7).
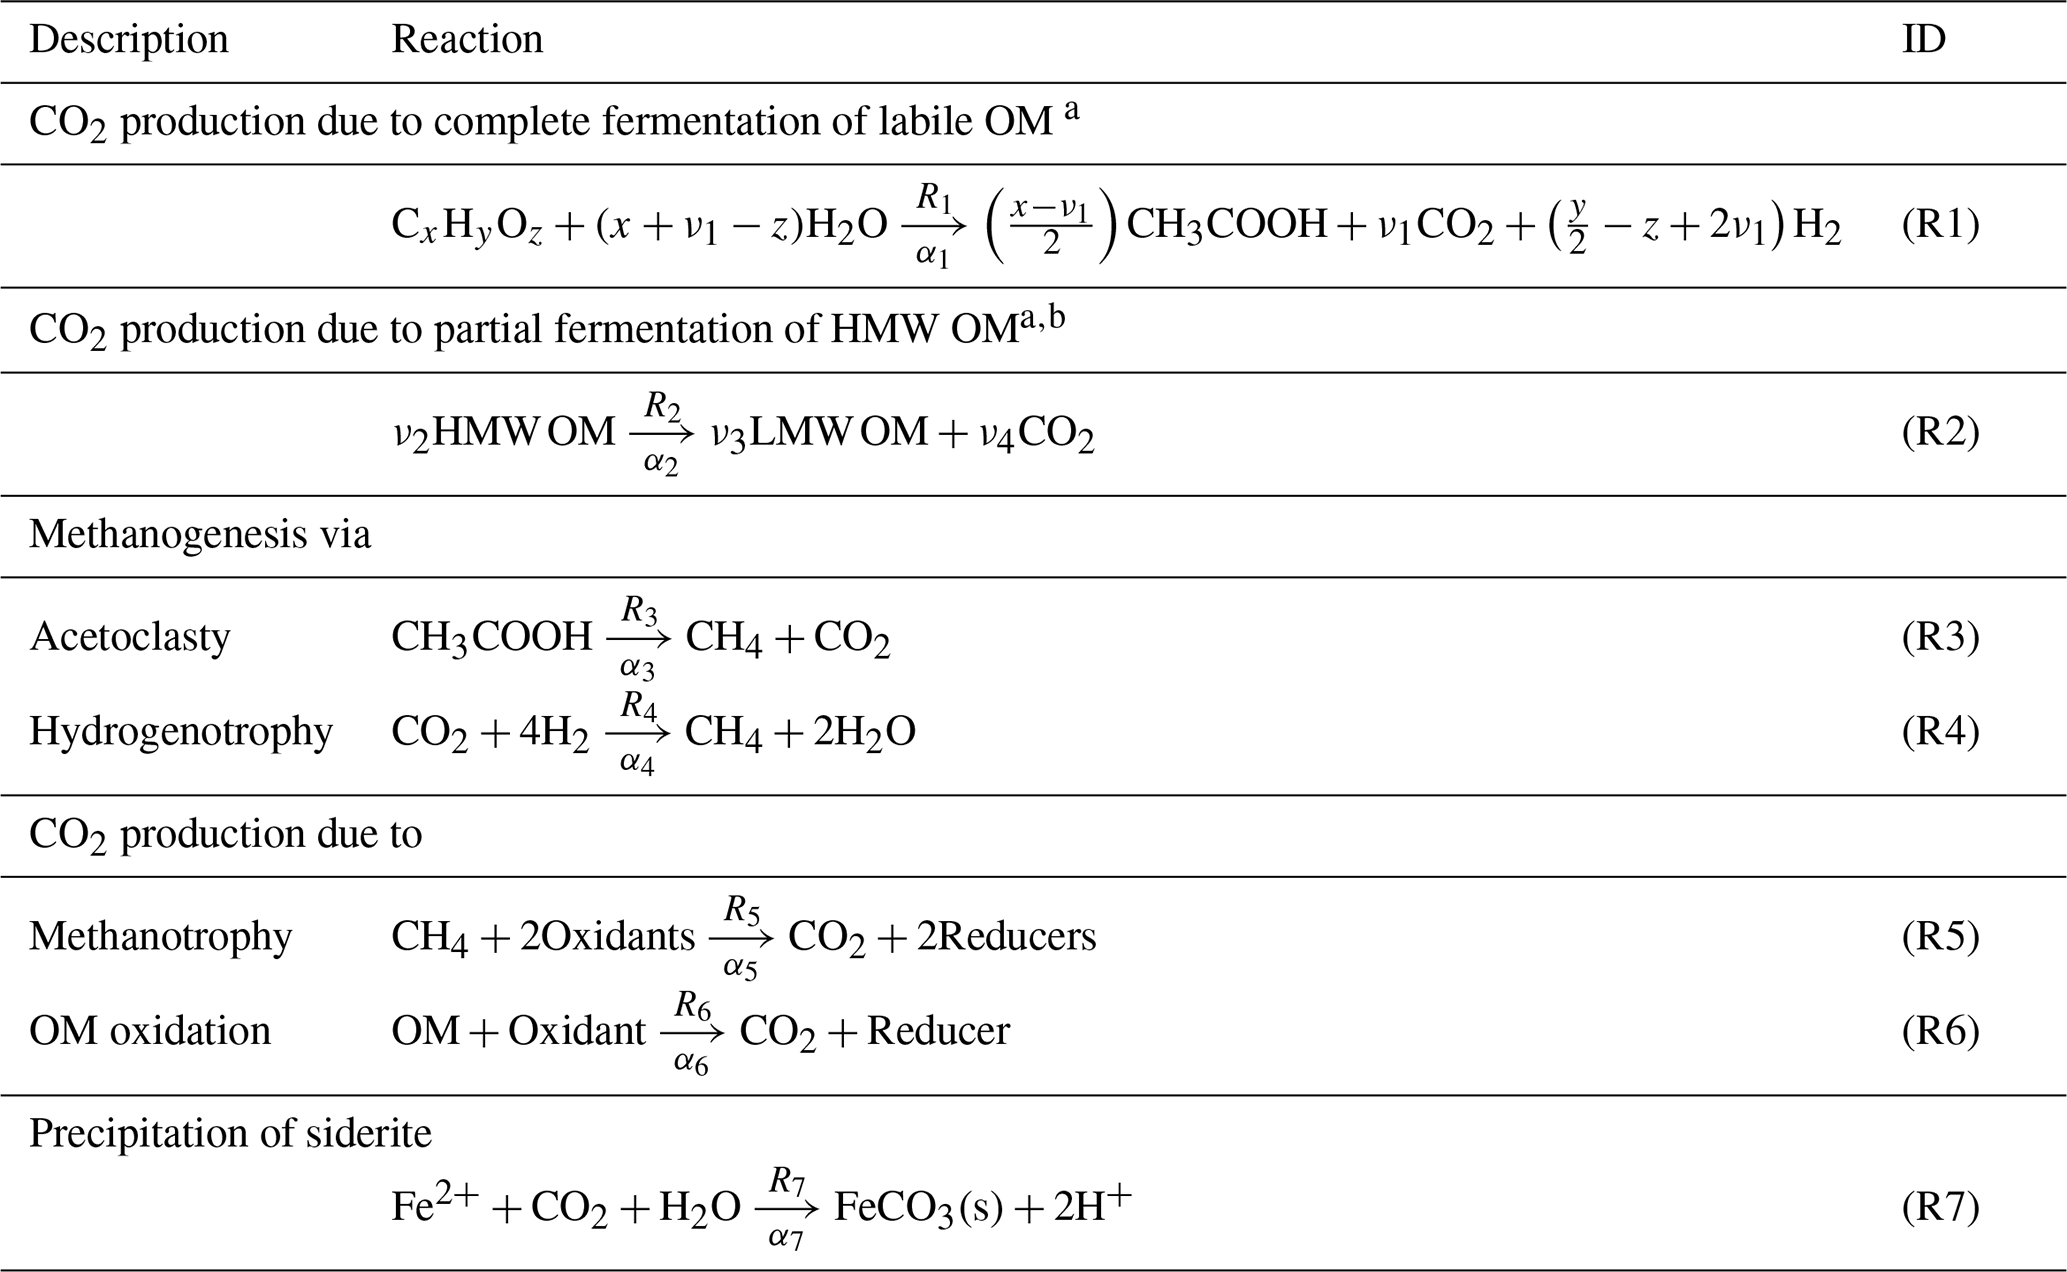
a Where ν1 can have any value between 0 and x, and values for ν2–ν4 are unknown. b HMW OM and LMW OM designate high- and lower-molecular-weight organic matter, respectively.
2.6 Determining realistic ranges for effective reaction rates
Considering the net reaction rates obtained by inverse modelling, a realistic range of values can be given for each of the effective reaction rates Ri in each depth interval using the general equations described below. The detailed calculations for each Ri at both study sites are described in Sect. S2.
From Table 1, the net rate of CH4 production, , in the sediments is
where R3 and R4 are the rates of acetoclastic (Reaction R3) and hydrogenotrophic (Reaction R4) production of CH4, respectively, and R5 is the rate of DIC production due to CH4 oxidation (Reaction R5). The net rate of DIC production, , can be expressed as
where R1, R2, and R6 are the rates of DIC production due to complete fermentation of labile OM (Reaction R1), partial fermentation of HMW OM (Reaction R2), and OM oxidation (Reaction R6), respectively, and R7 is the rate of DIC removal by siderite precipitation (Reaction R7). It can also be written that
where is the net reaction rate of all relevant oxidant consumption, i.e., O2, Fe(III), and only because and Mn(IV) are negligible (see above). For simplicity, is expressed in equivalent moles of O2 consumption rate, taking into account that and Fe(III) have twice and one quarter the oxidizing capacity of O2, respectively. In practice, the value of was calculated by adding those of , , and , where , , and were estimated with PROFILE. In this calculation, we assumed that all dissolved Fe is in the form of Fe(II), and that the rate of Fe(II) consumption through Reaction (R7) is negligible compared to those associated with Reactions (R5) and (R6). Under these conditions, equals . It should be noted that using , , and to calculate , we indirectly take into account the reoxidation of reduced S and Fe(II), respectively, to and Fe(III) by O2. Indeed, with this procedure, we underestimate the terms and because reoxidation reactions are ignored, but we overestimate by the same amount the term . In other words, omission of these reoxidation reactions affects only the relative consumption rates of individual oxidants and not the value of , which is of interest here.
2.7 Constraining effective reaction rates with δ13C modelling
Once the range of values has been determined for each of the effective rates Ri (see Table S2), they can be used in another reaction-transport equation to model the δ13C profiles of CH4 and DIC. Only sets of Ri values that yield acceptable modelled δ13C profiles, i.e., which fall within 1 standard deviation of the measured δ13C profiles (grey area fills in Fig. 4), were kept for COS calculation below (Sect. 2.8). The δ13C modelling procedure is summarized below and described in detail in Section S2. This procedure takes into account the effect of diffusion and bioirrigation (in Lake Tantaré Basin A) and the isotopic fractionation effect of each Reaction (Ri).
Briefly, the δ13C profiles of CH4 (δ13C–CH4) and DIC (δ13C–DIC) were simulated with a modified version of Eq. (1) (Clayer et al., 2018):
where [C] is the total CH4 or DIC concentration ([12C] can be replaced by [C] since ∼99 % of C is 12C), and [13C] is the isotopically heavy CH4 or DIC concentration. Equation (6) allows for calculating a δ13C profile once the depth distributions of [13C] and [C] are known. This information is obtained by solving the mass-conservation equations of C and 13C for CH4 and DIC. The one-dimensional mass conservation of [C] is given by Eq. (2), where [solute] is replaced by [C], whereas that for [13C] is the following modified version of Eq. (2) (Clayer et al., 2018):
where f, the molecular diffusivity ratio, is the diffusion coefficient of the regular solute divided by that of the isotopically heavy solute; αi is the isotope fractionation factor in Reaction (Ri); and is the δ13C of the reactant leading to the formation of the solute (CH4 or DIC) in Reaction (Ri). Input and boundary conditions used to numerically solve Eqs. (2) and (7) for [C] and [13C], respectively, via the bvp5c function of MATLAB® are described in Sects. 3.4 and S2 of the Supplement.
The goodness of fit of the model was assessed with the norm of residuals (Nres):
where and are the measured and simulated δ13C values, respectively. The norm of residuals (Nres) varies between 0 and infinity, with smaller numbers indicating better fits.
2.8 COS calculation
Considering the complete fermentation of metabolizable OM of general formula CxHyOz and making two assumptions, described below for clarity, the COS of the fermenting molecule is given by combining Eqs. S8 and S15 (see Sect. S2 for details):
where χM is the fraction of oxidants consumed by methanotrophy. Equation (9) is only valid if (i) Reaction (R1) is the only source of substrates for hydrogenotrophy and acetoclasty (this assumption is discussed in Sect. 4.2 below) and if (ii) siderite precipitation (Reaction R7) is negligible (saturation index for siderite is negative except below 10 cm depth in the sediment of Lake Bédard; this case is considered in Sect. S2.1.2.2). With values of and obtained from PROFILE (Sect. 2.4) and values of R2 and χM constrained by δ13C modelling (Sect. 2.7), Eq. (9) can be used to calculate the COS of the fermenting molecule.
2.9 Data treatment of other datasets
To better assess the COS of the fermenting OM in lakes, relevant sets of porewater concentration profiles (CH4, DIC, EAs, Ca) available from the literature or from our data repository have been modelled with the code PROFILE, as described in Sect. 2.3, to extract their , , and profiles. These porewater datasets, described in Sect. S3 of the Supplement, had been generated by sampling porewater in the hypolimnetic sediments of (i) Lake Bédard and Basin A of Lake Tantaré on other dates than for this study (Clayer et al., 2016); (ii) Basin B of Lake Tantaré (adjacent to Basin A; Fig. 1) on four occasions (Clayer et al., 2016; 2018); (iii) Williams Bay of Jacks Lake (44∘41′ N, 78∘02′ W), located in Ontario, Canada, on the edge of the Canadian Shield (Carignan and Lean, 1991); and (iv) the southern basin of the subalpine Lake Lugano (46∘00′ N, 3∘30′ E), located in Switzerland, on two occasions (Lazzaretti-Ulmer and Hanselmann, 1999). All lake basins except Basin A of Lake Tantaré develop an anoxic hypolimnion.
3.1 Solute concentration profiles
Differences among the replicate profiles of CH4, DIC, , ΣS(-II), and Fe (Fig. 3) at the two sampling sites are generally small (except perhaps those of in Lake Bédard) and should be mainly ascribed to spatial variability within the 25 m2 sampling area. Indeed, the main vertical variations in the profiles are defined by several data points without the sharp discontinuities expected from sampling and handling artifacts. Note that the acetate concentrations, which were consistently low (<2 µM), are not shown.
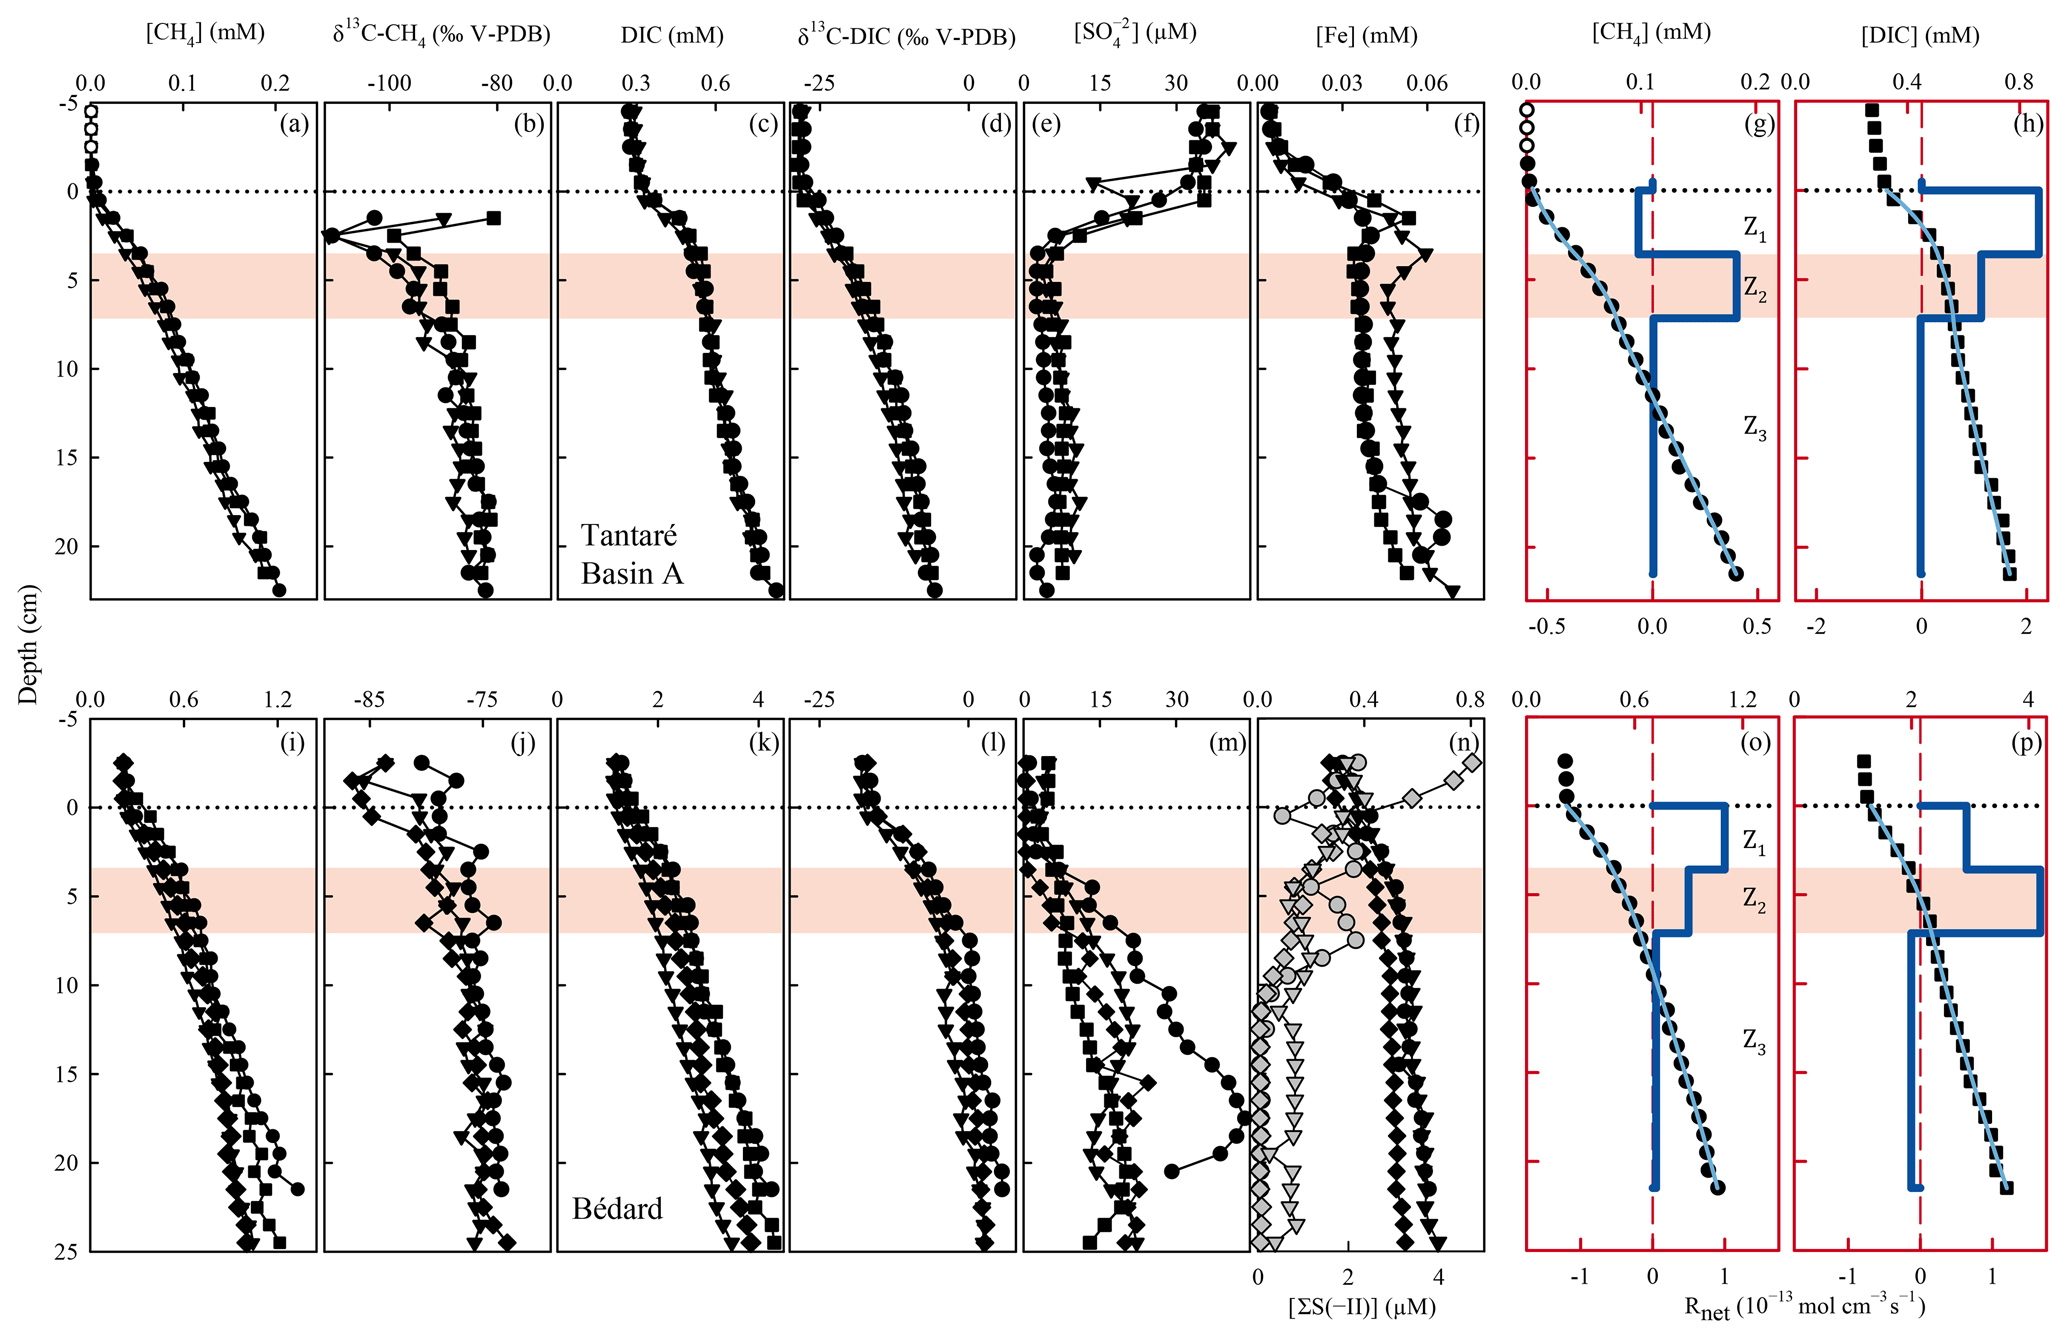
Figure 3Replicate porewater profiles of CH4 (a, i), δ13C–CH4 (b, j), DIC (c, k), δ13C–DIC (d, l), (e, m), Fe, and ΣS(-II) (f, n), and comparison of the modelled (blue lines) and average (n=3) measured (symbols) concentration profiles of CH4 (g, o) and DIC (h, p) in Lakes Tantaré Basin A (a–h) and Bédard (i–p). Different symbols indicate data from different peepers and empty symbols are for concentrations below detection limit. The horizontal dotted line indicates the sediment–water interface. The thick and thin blue lines represent the net solute reaction rate () and the modelled concentration profiles, respectively. The red area fills correspond to the sediment zones Z2.
The low Fe (<5 µM; Fig. 3f) and CH4 (<2 µM; Fig. 3a) concentrations as well as the relatively high concentrations (36 ± 2.1 µM; Fig. 3e) in the sediment-overlying water of Lake Tantaré Basin A are all consistent with the [O2] (∼2.5 mg L−1) measured in the bottom water and are indicative of oxic conditions at the sediment surface. The sharp Fe gradients near the SWI indicate an intense recycling of Fe oxyhydroxides (Fig. 3f; Clayer et al., 2016), and the concave-down curvatures in the profiles (Fig. 3e) reveal reduction near the SWI. In contrast to Lake Tantaré Basin A, high Fe (>200 µM), measurable CH4 (>200 µM), low (2.7 ± 1.4 µM), and detectable ΣS(-II) concentrations in the overlying waters of Lake Bédard (Fig. 3i, m and n) are consistent with anoxic conditions at the sediment surface. The absence of a sharp Fe gradient at the SWI in Lake Bédard suggests that Fe oxyhydroxides were not recycled in these sediments when porewater sampling occurred.
In the two lake basins, concentrations reach a minimum between the SWI and 5 cm depth (Fig. 3e and m) and increase below these depths. While increasing concentrations with sediment depth are unusual in lake sediments, the mineralization of sulfur-containing OM in the sediment can be a source of in low- environments (Fakhraee et al., 2017). Although unravelling the sediment sulfur cycling is beyond the scope of this study, we note that generation through OM mineralization would be consistent with the fact that the dominant sulfur pool in Lake Tantaré Basin A is bound to sediment OM (Couture et al., 2016).
The concentrations of CH4 (<1.5 mM; Fig. 3a and i) are well below saturation at 4 ∘C and in situ pressure (4.4–5.5 mM; Duan and Mao, 2006), implying that CH4 ebullition is a negligible CH4 transport process. The CH4 values increase from <2 µM in the overlying water to 0.18–0.20 mM at the base of the Lake Tantaré Basin A profiles (Fig. 3a) and from 0.2–0.5 to 1.0–1.4 mM in those of Lake Bédard (Fig. 3i). The three CH4 profiles from Lake Tantaré Basin A (Fig. 3a) show a modest concave-up curvature in their upper part, close to the SWI, indicative of a net CH4 consumption, and a convex-up curvature in their lower part, typical of a net CH4 production. Such trends, however, are not observed in Lake Bédard sediments. The CH4 profiles from this lake exhibit a convex-up curvature over the whole sediment column, although it is more pronounced in its upper part (Fig. 3i).
The DIC concentrations consistently increase from 0.27–0.32 and 1.2–1.5 mM in the sediment-overlying water to 0.76–0.83 and 3.5–4.3 mM at the bottom of the profiles in Lake Tantaré Basin A and Lake Bédard, respectively (Fig. 3c and k). All DIC profiles show a similar shape with a slight concave-up curvature in their lower segment and a convex-up curvature in their upper portions.
3.2 Modelled CH4 and DIC concentration profiles
The modelled [CH4] and DIC profiles accurately fit the average (n=3 or 4) data points (r2>0.996 and r2>0.998 for CH4 and DIC, respectively; Fig. 3g, h, o, and p). The profiles reveal three zones in each lake basin, numbered Z1, Z2, and Z3, from the sediment surface whose boundaries match those defined by the profiles. For Lake Tantaré Basin A, Z1 corresponds to a net CH4 consumption and Z2 and Z3 to net CH4 production, with the highest rate in Z2 (Fig. 3g). In contrast, the three zones in Lake Bédard show net CH4 production, with the highest rate in Z1 and the lowest in Z3 (Fig. 3o). The profiles in both lake basins show a zone of net DIC consumption below two zones of net DIC production, with the highest rate values in the Z1 and Z2 for Lake Tantaré Basin A and Lake Bédard, respectively.
The and profiles displayed in Fig. 3 are, among all the possible solutions, the ones that give the simplest rate profile while providing a satisfying explanation of the averaged solute concentration profile as determined by statistical F testing implemented in the code PROFILE (P value ≤0.001 except for the profile in Lake Bédard, whose P value is ≤0.005). As an additional check of the robustness of the depth distribution of and provided by PROFILE, we used another inverse model, i.e., Rate Estimation from Concentrations (REC; Lettmann et al., 2012), to model the average CH4 and DIC profiles. Note that the statistical method, implemented in REC to objectively select the depth distribution of the net reaction rates, i.e., the Tikhonov regularization technique, differs from that of PROFILE. Figure S1 (Supplement) shows that the two codes predicted mutually consistent and profiles, with rate values of similar magnitude. PROFILE was also used to estimate , , and in order to calculate the value of in each zone at both sampling sites (see Sect. 2.3 for details). The modelled [] and [Fe] profiles accurately fit the data points (r2>0.983; Fig. S3). As expected from the contrasting O2 regimes of the two lake basins, values for Lake Tantaré Basin A were 1 to 2 orders of magnitude higher than those for Lake Bédard. The values of , , and estimated in each zone of each lake basin are reported in Table 2.
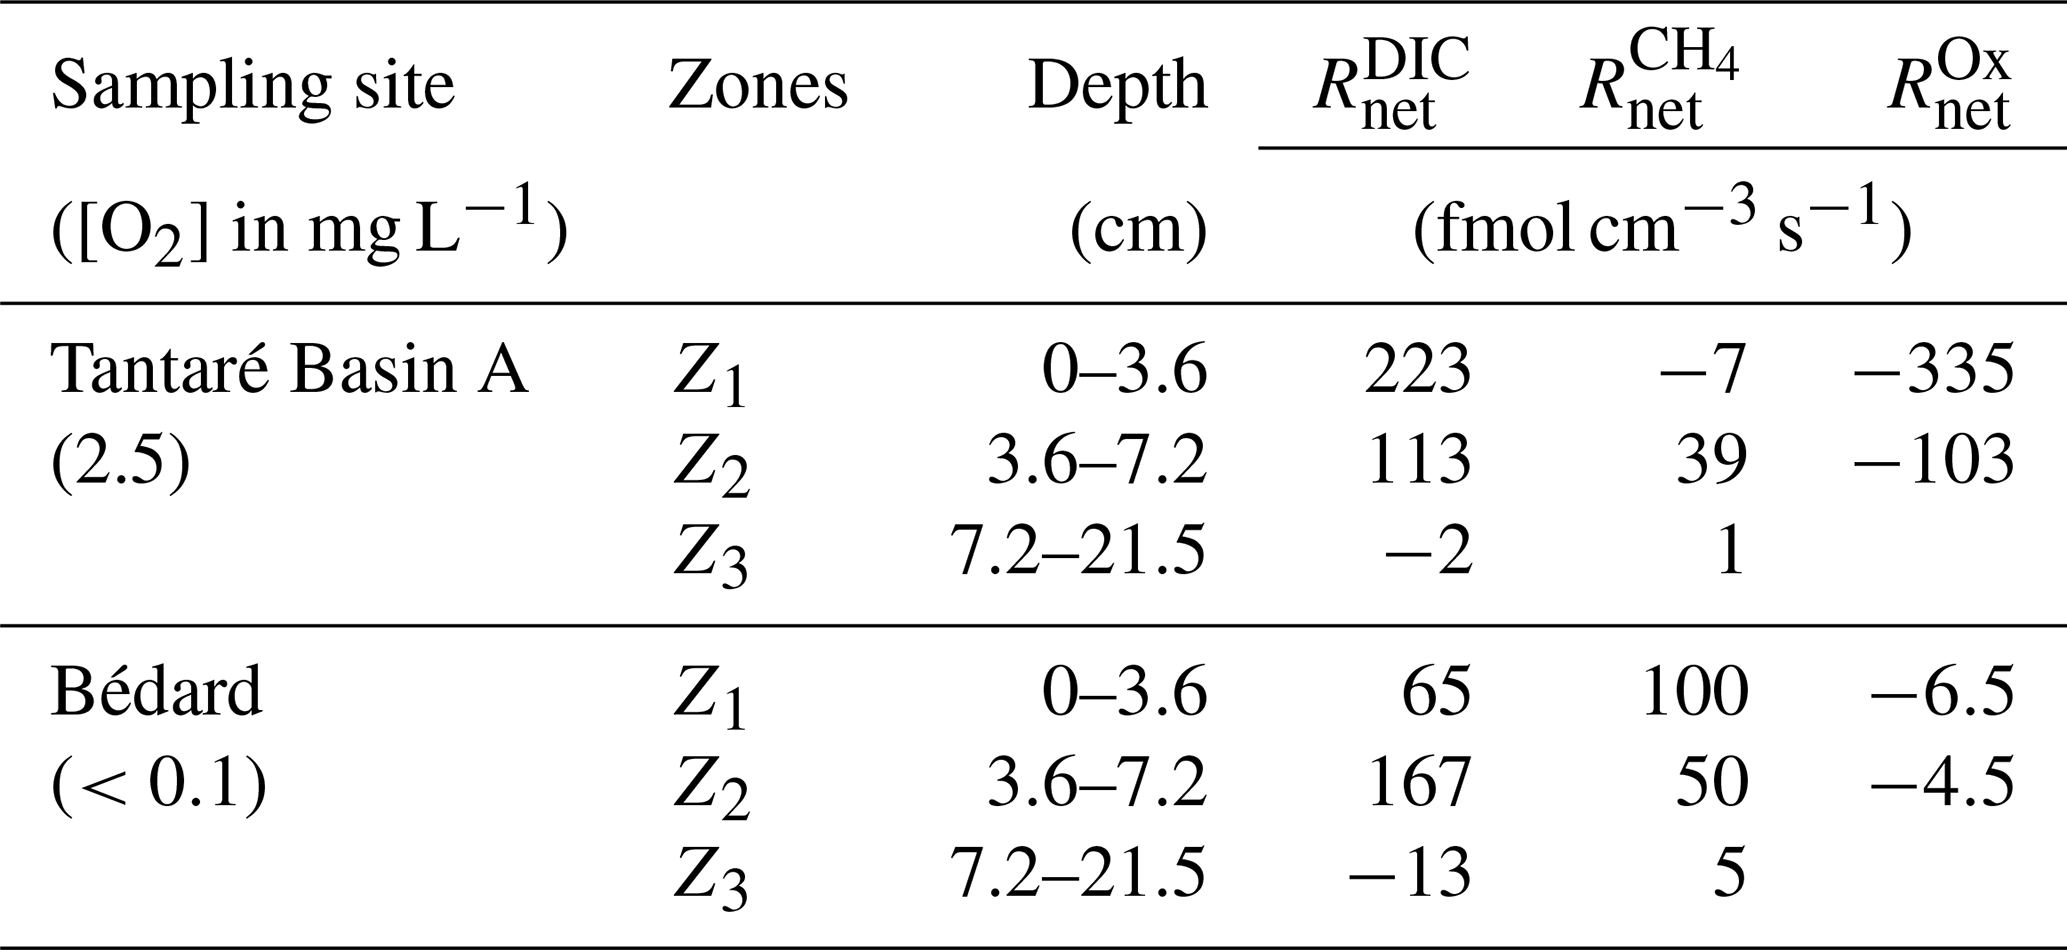
Table 2Net production rates () of CH4, DIC, and oxidants obtained with the code PROFILE in the three CH4 consumption and production zones (Z1, Z2, and Z3) for both sampling sites.
3.3 Measured δ13C profiles
The δ13C–DIC values increase from ‰ and ‰ in the overlying water to ‰ and 3.6 ± 1.7 ‰ at the base of the profiles in Lake Tantaré Basin A and Lake Bédard, respectively (Figs. 3d and l). Similarly, the δ13C–CH4 values in Lake Bédard increase steadily from ‰ in the overlying water to ‰ at 24.5 cm depth (Fig. 3j). Regarding Lake Tantaré Basin A, the CH4 concentrations above 1.5 cm depth were too low for their 13C∕12C ratio to be determined. Starting at 1.5 cm depth, the δ13C–CH4 values first decrease from ‰ to ‰ at 2.5 cm depth and then increase progressively to ‰ at the base of the profiles (Fig. 3b). Note that a shift toward more positive δ13C–CH4 values upward, generally attributed to the oxidation of CH4 (Chanton et al., 1997; Norði et al., 2013), is only observed in the profiles of Lake Tantaré Basin A (Fig. 3b).
As shown in Fig. S2 (Supplement), the isotopic signatures of nearly all samples from the two lake basins fall within the ranges reported for hydrogenotrophic methanogenesis, i.e., CO2 reduction, in a δ13C–CO2 vs. δ13C–CH4 graph similar to that proposed by Whiticar (1999). Indeed, the values of δ13C–CH4, all of which are lower than −70 ‰ over the whole profiles in the two lake basins, and the large difference (67 ‰ to 92 ‰) between the δ13C of gaseous CO2 (δ13C–CO2) and δ13C–CH4 strongly contrast with the typical δ13C–CH4 values (−68 ‰ to −50 ‰) and with the difference between δ13C–CO2 and δ13C–CH4 (39 ‰ to 58 ‰) reported for acetoclasty (Whiticar, 1999). The δ13C results reported previously for another basin of Lake Tantaré (Basin B; Clayer et al., 2018) also show in the hydrogenotrophy domain in Fig. S2.
3.4 Modelled δ13C profiles
In order to model the δ13C profiles with Eq. (6), accurate profiles of [C] and [13C] first need to be determined by numerically solving Eqs. (2) and (7), respectively. The modelled profiles of [CH4] and DIC obtained with Eq. (2) perfectly replicated the measured profiles of these two solutes. Getting a truthful profile of [13C] with Eq. (7) requires accurate values of , αi, and Ri for each of the reactions given in Table 1 and of f for both CH4 (f−CH4) and DIC (f−DIC). The multistep procedure to obtain the best [13C] profiles for CH4 and DIC is described in Sect. S2 (Supplement) and allowed us to constrain the f, χMαi, and Ri values.
Table 3Molecular diffusivity ratio of CH4 (f−CH4) as well as the isotopic fractionation factors (α1, α2, α4–α7), the fraction of oxidant used by methanotrophy (χM), and rates (R1, R2, R4–R7; fmol cm−3 s−1) of each reaction involved in OM mineralization in each zone and for the whole sediment column (ΣRi; fmol cm−2 s−1) corresponding to the lowest values of Nres. At both study sites, R3 was shown to be negligible. See Sect. S2 of the Supplement for details.
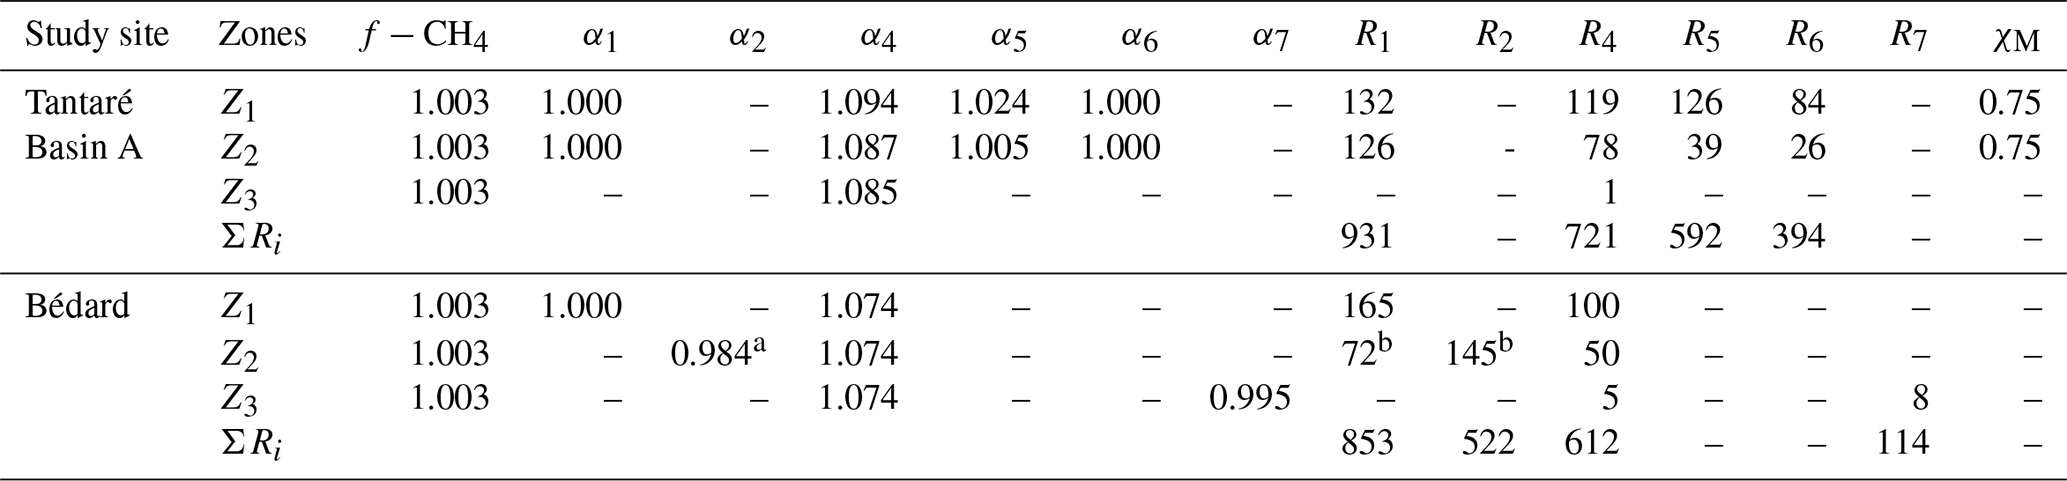
a The optimal value of α2, given here for a COS value of −1.5, varies slightly with the COS value (see Sect. S2.2.2.3 of the Supplement).
b The values of R1 and R2, given here
for a COS value of −1.5, vary with the COS value (see Sect. S2.2.2.3 of the Supplement).
The best fits between the simulated and measured δ13C profiles of CH4 and DIC for Lake Tantaré Basin A and Lake Bédard (red lines in Fig. 4) were obtained with the f, αi, and Ri values displayed in Table 3. The optimal αi and f values were within the ranges reported in the literature for both lake basins and similar to those reported in our previous study on Lake Tantaré Basin B (Clayer et al., 2018), except for the lower-than-expected value of α2 (0.984) in the Z2 of Lake Bédard. Modelled δ13C profiles were considered acceptable only when they fell within 1 standard deviation of the measured δ13C profiles (grey area fills in Fig. 4). Acceptable modelled δ13C profiles were obtained only when methanogenesis was 100 % hydrogenotrophic, i.e., when R3=0 (see Sect. S2.2.2.1).
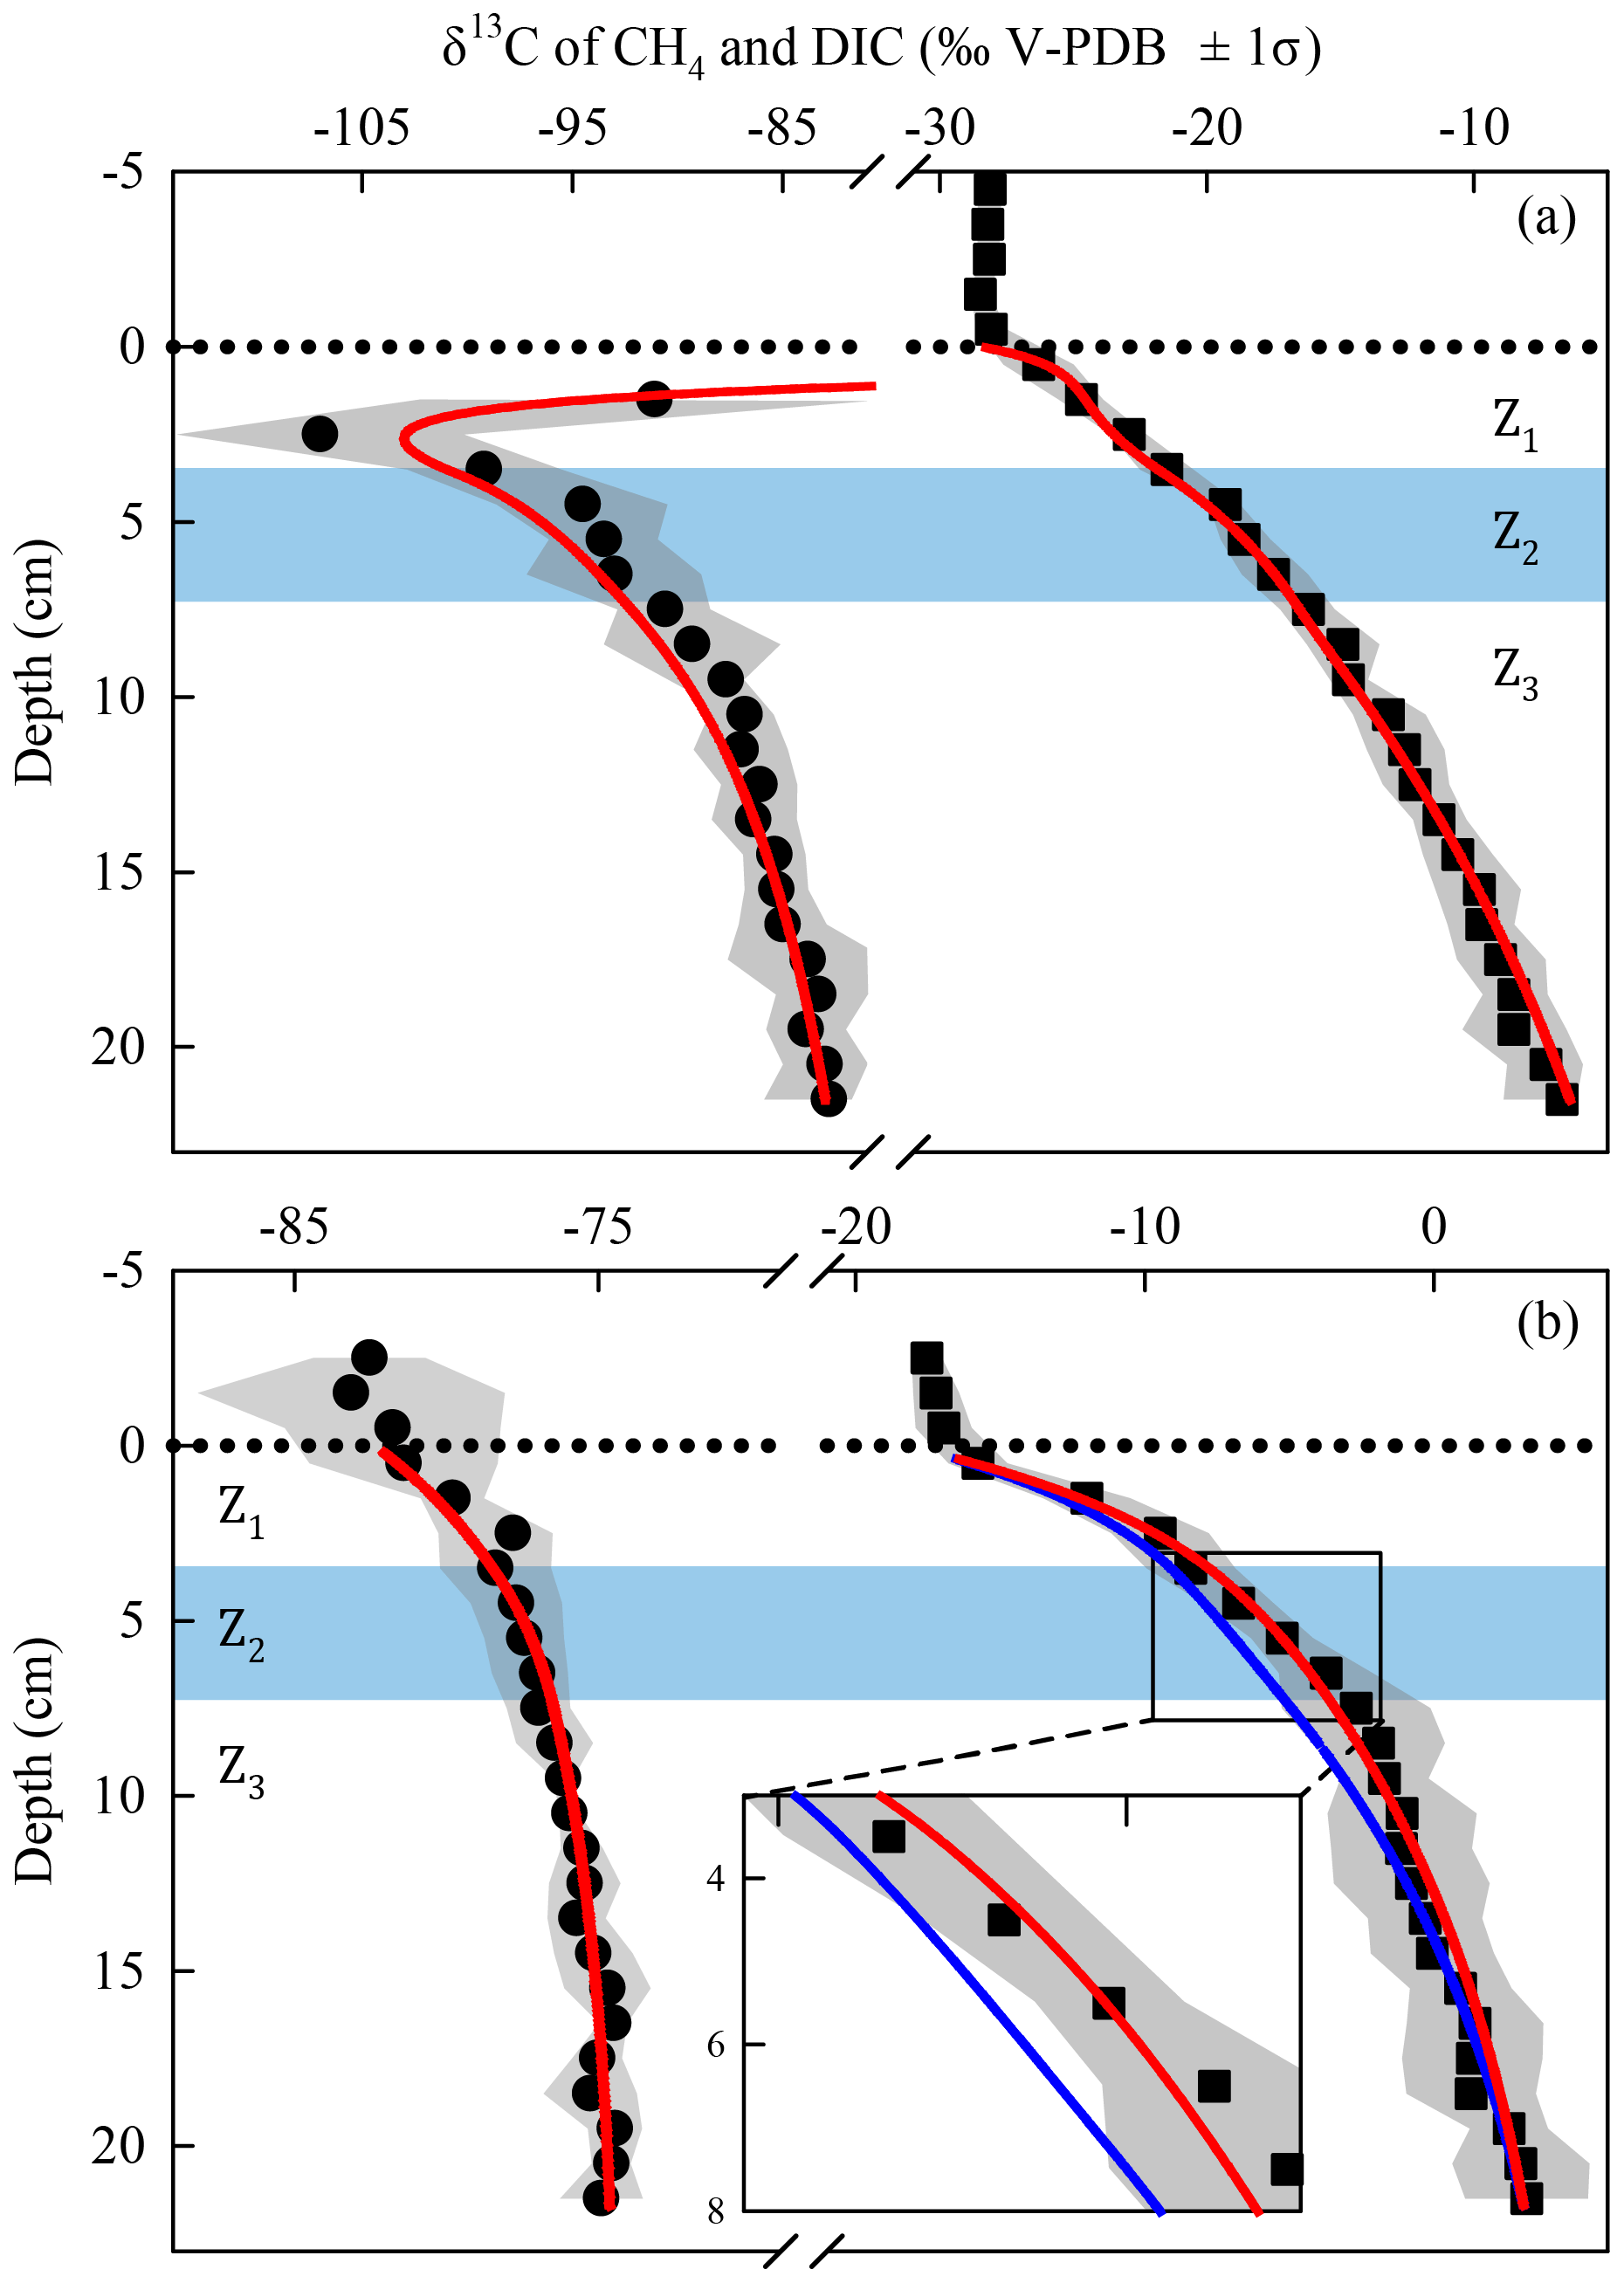
Figure 4Comparison of the simulated (lines) and measured average (n=3) δ13C profiles of CH4 (circles) and DIC (squares) in the porewater of Lake Tantaré Basin A (a) and Lake Bédard (b). The dotted horizontal line indicates the sediment–water interface. The variability in δ13C values (±1 standard deviation – σ) related to the spatial heterogeneity within the sampling area is shown by the grey area fills. The zone Z2 is delimited by the blue area fill. In panel (b), the blue lines are the profiles simulated with the default rate values and optimal αi and f values as described in Sect. S2.2.1. The red lines in panel (b) are the profiles simulated with α2 values of 0.980–0.984 (see Sect. 4.1 for details).
The sharp upward depletion in 13C–CH4 leading to a minimum δ13C–CH4 value at 2.5 cm depth in Lake Tantaré Basin A sediments (Fig. 4a) was unanticipated since it occurs in the methanotrophic zone, i.e., where the remaining CH4 is expected to be 13C-enriched as a result of CH4 oxidation. Marked 13C–CH4 depletions at the base of the sulfate–methane transition zone, where CH4 is consumed via reduction, have often been observed in marine sediments (Burdige et al., 2017, and references therein). Such features are generally attributed to the production of CH4 by hydrogenotrophy from the 13C-depleted DIC resulting from the anaerobic CH4 oxidation, a process referred to as intertwined methanotrophy and hydrogenotrophy (e.g., Borowski et al., 1997; Burdige et al., 2017; Pohlman et al., 2008). Here the modelled δ13C–CH4 profile captured the minimum in δ13C–CH4 in the Z1 by simply assuming concomitant hydrogenotrophy and methanotrophy in this zone and an upward-increasing α4 value from 1.085 in the Z3 to 1.094 in the Z1 (Sect. S2.2.1 of the Supplement). A small variation with sediment depth in the fractionation factor α4 is arguably possible since its value depends on the types of microorganisms producing CH4 (Conrad, 2005).
4.1 Organic matter mineralization pathways at the sampling sites
The porewater data as well as the combined modelling of carbon isotopes and concentration profiles allow us to highlight key OM mineralization mechanisms and to quantify the relative contribution of methanogenesis and fermentation to OM degradation at both sampling sites. The 13C isotopic signatures, i.e., highly negative values of δ13C–CH4 and large differences between δ13C–CO2 and δ13C–CH4 (Sect. 3.3 and Fig. S2 in the Supplement), as well as the modelling of the δ13C–CO2 and δ13C–CH4 profiles (Sect. S2.2.2.1 and Fig. S4a and b in the Supplement) all point to hydrogenotrophy as being the only pathway for methanogenesis in the two lake basins. The dominance of hydrogenotrophy is also consistent with the finding that acetate concentrations were close to or below DL in the porewater samples. Under the condition that acetoclasty is negligible (i.e., x=ν1), Reaction (R1) from Table 1 becomes
Methanogenesis was also reported to be essentially hydrogenotrophic in the sediments of Basin B of Lake Tantaré (Clayer et al., 2018). The absence of acetoclasty in the sediments of the oligotrophic lakes Bédard and Tantaré is consistent with the consensus that hydrogenotrophy becomes an increasingly important CH4 production pathway (i) when labile OM is depleted (Chasar et al., 2000; Hornibrook et al., 2000; Whiticar et al., 1986), (ii) with increasing sediment or soil depth (Conrad et al., 2009; Hornibrook et al., 1997), or (iii) with decreasing rates of primary production in aquatic environments (Galand et al., 2010; Wand et al., 2006).
The modelling of concentrations and δ13C profiles revealed that oxidative processes occurred essentially in the upper 7 cm of the sediments of the perennially oxygenated Lake Tantaré Basin A, i.e., mainly in the Z1 and, to a lesser extent, in the Z2 (Table 3 and Sects. S2.1.2.1 and S2.1.2.2 of the Supplement). Moreover, it showed that methanotrophy was the dominant oxidative reaction in these sediment layers since 75 % of the oxidants were consumed through Reaction (R5) (Sect. S2.2.2.2 of the Supplement). This outcome is consistent with several studies showing that methanotrophy occurs at higher rates than OM oxidation at low EA concentrations (Kankaala et al., 2013; Pohlman et al., 2013; Sivan et al., 2007; Thottathil et al., 2019). Methanotrophy is also evidenced in the Z1 of this lake basin by the negative value and by a shift of the δ13C–CH4 profiles to more positive values in their upper part (Fig. 3b and g). Use of Eq. (2) to model the EA profiles with the code PROFILE predicts that O2 was by far the main EA involved either directly or indirectly via the coupling with the Fe or S cycles in the oxidative processes. Indeed, comparing the values of and (see Sect. 3.2 and Table 2) shows that O2 accounts for 87 % and 70 % of the oxidants consumed in the Z1 and Z2 of Lake Tantaré Basin A, respectively. Since O2 penetration in the sediment by molecular diffusion is limited to ∼4 mm, a significant amount of O2 is predicted by Eq. (2) to be transported deeper in the sediment through bioirrigation. The predominance of O2 among the EAs consumed in the sediments is consistent with our previous study in this basin of Lake Tantaré (Clayer et al., 2016). Given that methanotrophy is the dominant oxidative process and that O2 is the main oxidant consumed, it is probable that aerobic oxidation of methane prevails over its anaerobic counterpart in this lake basin. This is in line with the common thinking that CH4 oxidation in freshwater lake sediments is carried out by methanotrophs essentially in the uppermost oxic sediment layer (Bastviken et al., 2008, and references therein).
In the Z2 of Lake Bédard, the net rate of DIC production (i.e., 167 fmol cm−3 s−1) was more than 3 times that of CH4 production (50 fmol cm−3 s−1; Table 2). Given that the was negligible in this zone (i.e., ), we obtain from Eqs. (3) and (4) and Table 2 fmol cm−3 s−1 and fmol cm−3 s−1 (see Sect. S2.1.2.2 of the Supplement). Should we assume that DIC production by Reaction (R2) is negligible, i.e., R2=0, an R1∕R4 ratio of 4.3 would be obtained. This high ratio indicates that DIC was not produced by fermentation (Reaction R1) alone in the Z2 of this lake. Indeed, methanogenesis through the coupling of Reactions (R1) and (R4) yields an R1∕R4 ratio of 2 if the fermenting substrate is carbohydrates (COS of 0) and lower than 2 if the fermenting substrate has a negative COS value. We thus attributed the production of the additional DIC to the partial fermentation of HMW OM, an assumed nonfractionating process reported to occur in wetlands (Corbett et al., 2015). The better fitting of the δ13C–DIC profile when α2 is set to 0.980–0.984 rather than to 1.000 in the Z2 (compare the blue and red lines in Fig. 4b) suggests that C fractionates during this partial fermentation process.
Table 3 displays the depth-integrated reaction rates (ΣRi) over the top 21 cm of the sediment column, which are given by
where Δxj (cm) is the thickness of the zone Zj. In this calculation, we assume that other zones of CH4 or DIC production are absent below 21 cm. Values of ΣRi clearly show that anaerobic carbon mineralization reactions (fermentation and methanogenesis) are important contributors to the overall OM mineralization in the two studied lake basins. Indeed, the sum of the rates of CH4 production (ΣR4) and DIC production due to fermentation associated with CH4 formation (ΣR1−ΣR4) and HMW OM partial fermentation (ΣR2) represents 54 % and 100 % of the total OM degradation rate () in the sediment of lakes Tantaré (Basin A) and Bédard, respectively. Considering the sediment accumulation rate and sediment Corg content given in Sect. 2.1, we calculate an average accumulation rate of Corg of to and to mol C cm−2 s −1 for lakes Tantaré (Basin A) and Bédard, respectively. Hence, the total sediment OM degradation rate () of and reported in this study for lakes Tantaré Basin A and Bédard, respectively, would involve only 1.2 %–2.8 % and 0.2 %–4.8 % of the total Corg deposited. Given that the remaining 95.2 %–99.8 % of the deposited Corg is preserved in the sediment, it is not surprising that the sediment Corg concentration is constant with depth (Fig. 2).
The contribution of anaerobic mineralization for Lake Tantaré Basin A is about 1.8 times higher than the average of 30 % reported for this lake basin in a previous study (Clayer et al., 2016). This significant discrepancy arises because these authors, in the absence of isotopic data to adequately constrain the Ri values, assumed that R4=0 in the net methanotrophic zone Z1. Should we make the same assumption in the present study, we would also estimate that fermentation and methanogenesis represent only 30 % of the total rate of OM degradation in the oxygenated Lake Tantaré Basin A, and we would thus underestimate the importance of methanogenesis. The inclusion of δ13C data in the present modelling study thus allowed us to better constrain the effective rates of CH4 production (R4). Indeed, a value of R4=119 fmol cm−3 s−1 was required in Eq. (7) to produce an acceptable δ13C–CH4 profile (Table 3 and Fig. S3).
4.2 Organic substrates for methanogenesis at the sampling sites
Table 3 indicates that hydrogenotrophy (Reaction R4) coupled to the complete fermentation of OM (Reaction R1) produces CH4 at higher rates (R4) than DIC (R1−R4) in the Z1 and Z2 of both lake basins. This outcome is inconsistent with the equimolar production of CH4 and DIC expected from the fermentation of glucose (C6H12O6), the model molecule used to represent labile OM in diagenetic models (Paraska et al., 2014), thus suggesting that the fermentation of this compound is not the exclusive source of the H2 required for hydrogenotrophy. Had OM been represented by C6H12O6 in Reaction (R1), the rate of H2 production by this reaction would have been twice that of CO2, i.e., 2R1. For its part, the rate of H2 consumption through hydrogenotrophy is 4 times that of the CH4 production, i.e., 4R4. Hence, an additional H2 production at rates of up to 212 and 70 fmol cm−3 s−1, i.e., 4R4−2R1, is needed to balance the H2 production rate expected from the fermentation of C6H12O6 and the H2 consumption rate by hydrogenotrophy observed in the sediments of Lake Tantaré Basin A and Lake Bédard, respectively. As discussed by Clayer et al. (2018), this additional production rate of H2 is likely provided by the fermentation of organic substrates that are more reduced than glucose.
Introducing the values of , , , χM, and R2 (Tables 2 and 3) into Eq. (9), we calculate COS values of −3.2 and −0.9 for the Z1 and Z2 of Lake Tantaré Basin A, respectively, and of −1.0 to −1.1 for the Z1 of Lake Bédard, respectively. Note that we were unable to constrain with Eq. (9) the COS for the Z2 of Lake Bédard since we had to assume a COS value to estimate the Ri, and the COS has no influence on the modelled δ13C profiles (Sect. S2.2.2.3 of the Supplement). Negative COS values between −0.9 and −1.1 suggest that fermenting OM in the sediments of the two lake basins would be better represented by a mixture of fatty acids and fatty alcohols than by carbohydrates, as suggested by Clayer et al. (2018) for the sporadically anoxic Lake Tantaré Basin B. For its part, the highly negative COS value of −3.2 calculated for the Z1 of Lake Tantaré Basin A is unreasonable, and the inaccuracy of the COS determination in this lake basin is discussed in Sect. 4.3.
4.3 Reduced organic compounds as methanogenic substrates in lake sediments
In order to better appraise the COS of the fermenting OM in lakes, relevant datasets of porewater solute concentration profiles were gathered from our data repository and from a thorough literature search. To be able to obtain by reactive-transport modelling the required to calculate the COS with Eq. (9), the datasets had to (i) comprise porewater concentration profiles of CH4 and DIC and, ideally, those of the EAs; (ii) reveal a net methanogenesis zone; and (iii) enable the estimation of the carbonate precipitation and dissolution contribution to . Detailed information on the origin and processing of the 17 selected datasets, acquired in six different lake basins from one subalpine and three boreal lakes sampled at various dates and/or depths, is given in Sect. S3 of the Supplement. The CH4 and DIC porewater profiles determined at hypolimnetic sites of these lake basins and their modelling with the code PROFILE are shown in Fig. 5, whereas the , , and values determined from this modelling are regrouped in Table 4. The COS values displayed in Table 4 for all lake basins and dates were calculated by substituting the appropriate , , , and R2 values in Eq. 9 and varying χM between 0 and 1, except for Lake Tantaré Basin A, for which χM equals 0.75 (Table 3). When the value for R2 was not available, we assumed R2=0. Equation (9) indicates that R2>0 would yield lower COS values than those reported in Table 4.
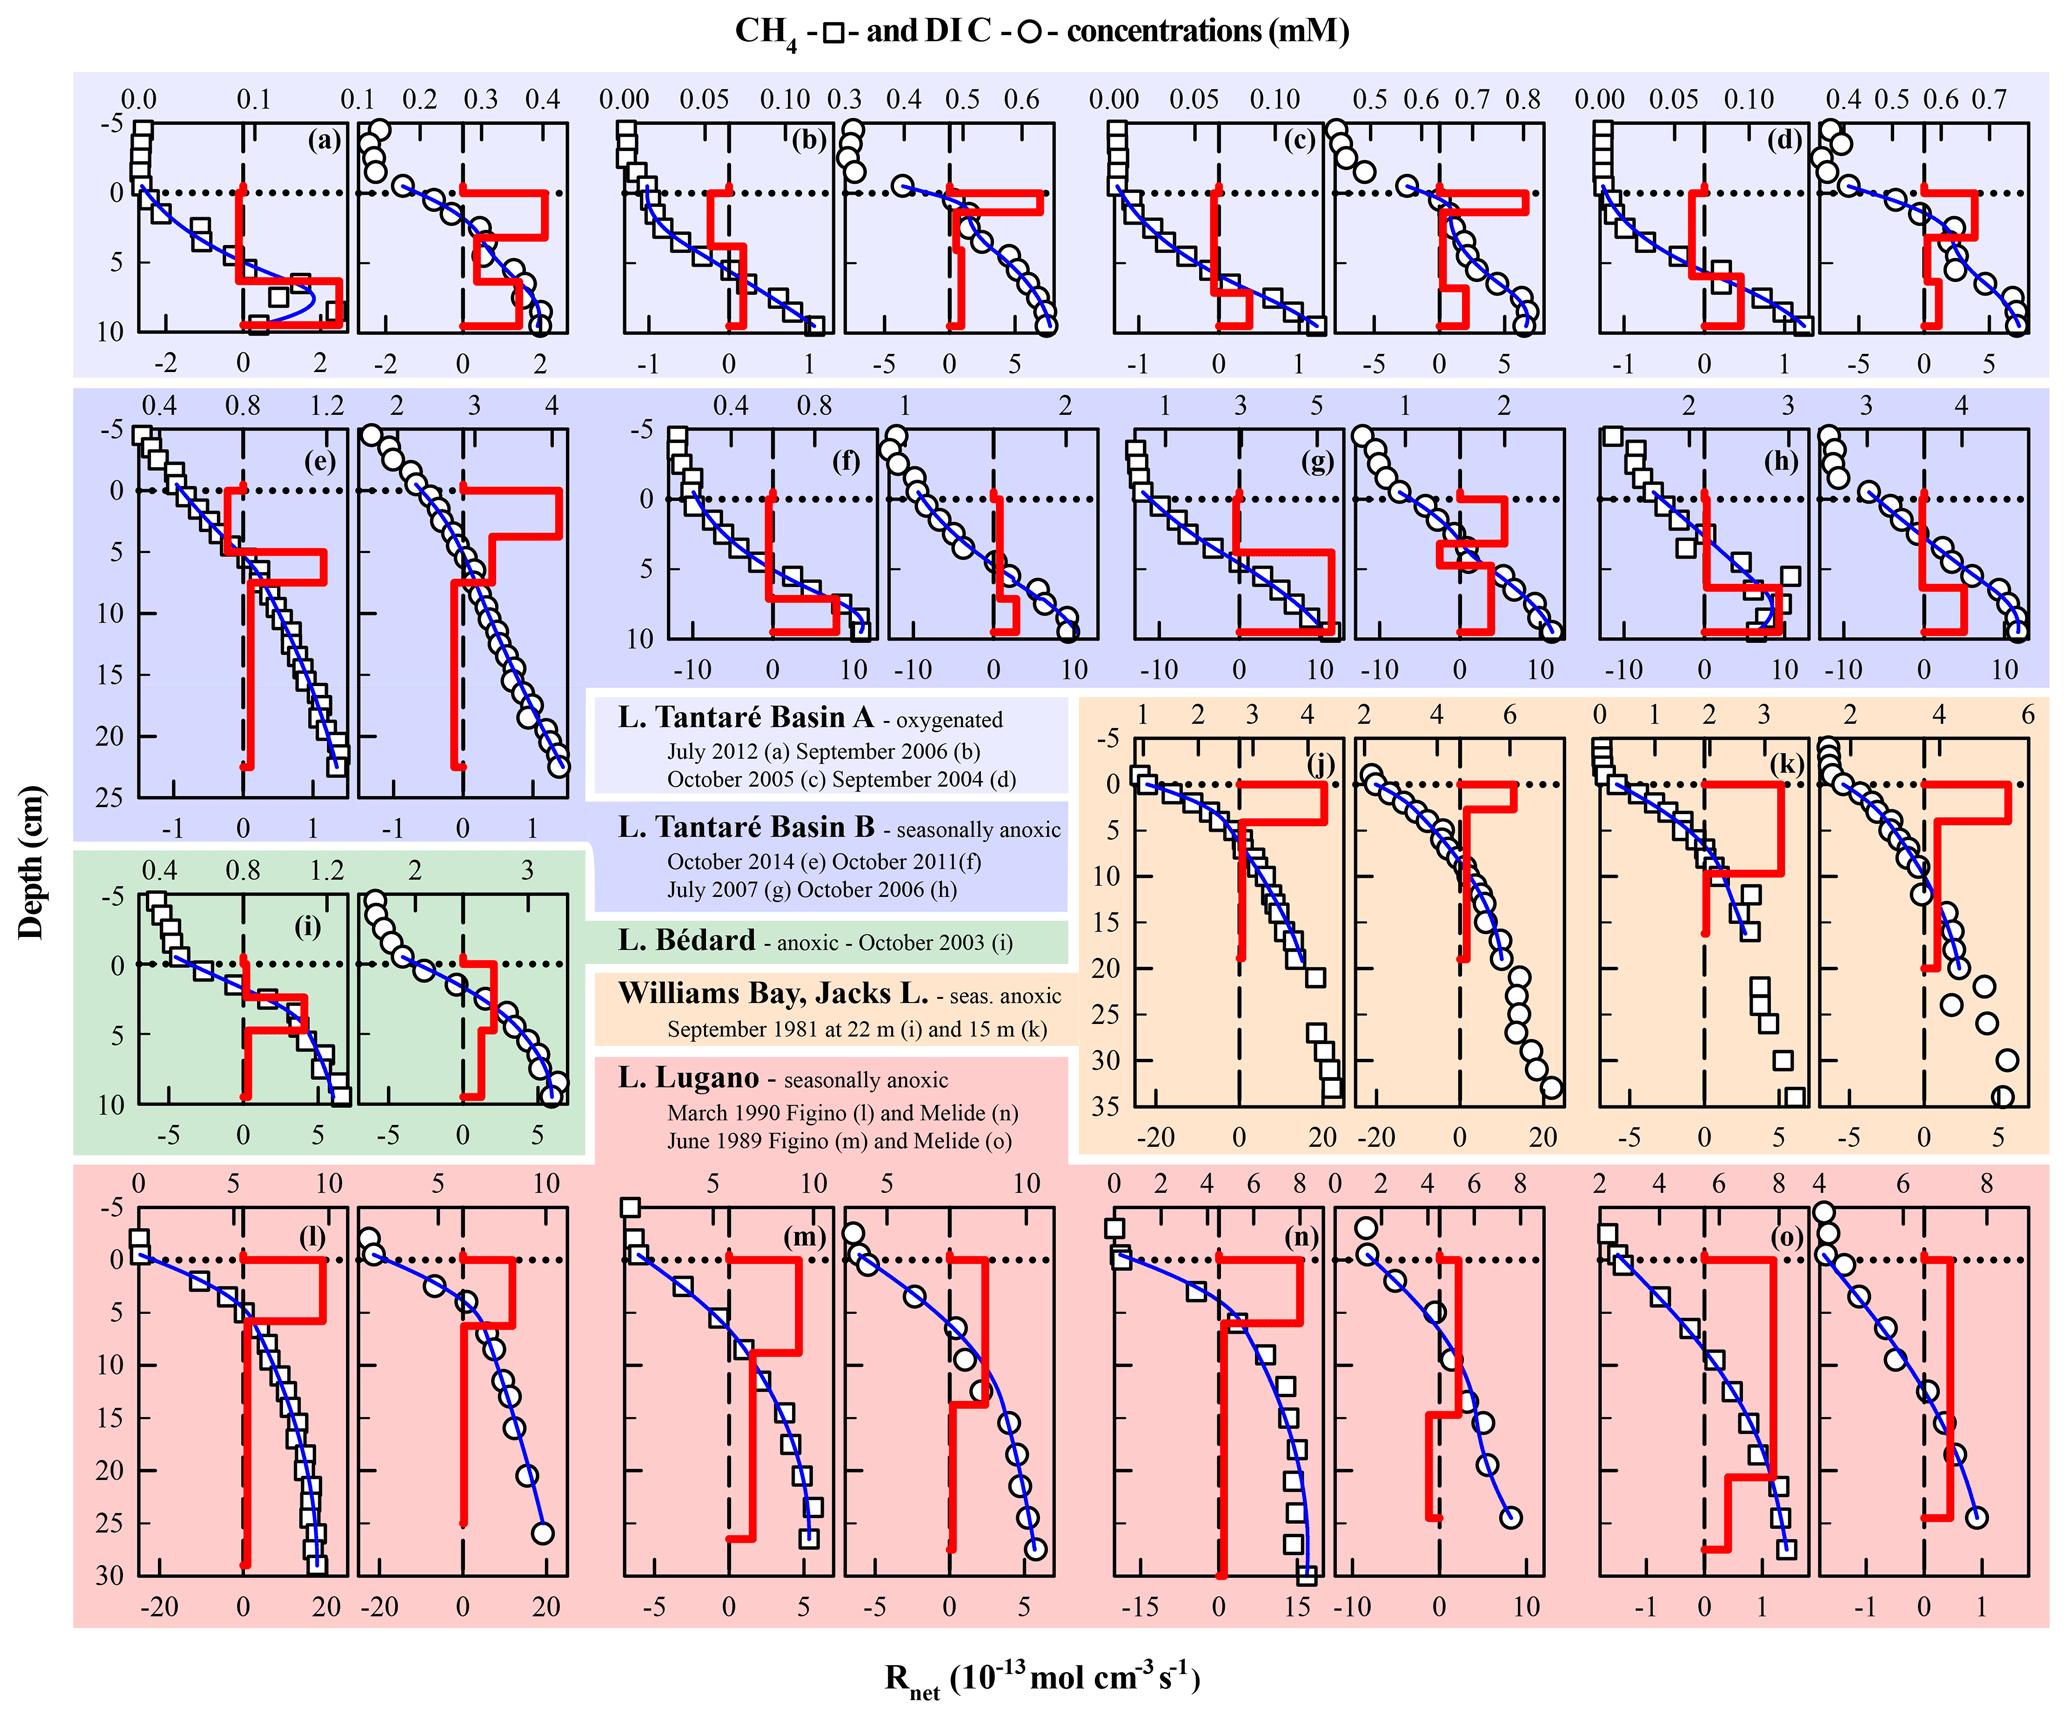
Figure 5Comparison of the modelled (blue lines) and average (n=3) measured concentration profiles of CH4 (squares) and DIC (circles) in Lake Tantaré Basin A (a–d) and Basin B (e–h), Lake Bédard (i), Jacks Lake (j–k), and Lake Lugano (l–o) on various sampling dates. The thick red lines represent the net solute reaction rate ().
Table 4Net reaction rates (; fmol cm−3 s−1) of CH4, DIC, and oxidants in the zone with the highest production rate of CH4 as well as the O2 concentration in the bottom water ([O2] in mg L−1), the R2 rates (fmol cm−3 s−1), and the average carbon oxidation state (COS) of the fermenting OM at the origin of CH4 calculated with Eq. (9) at both study sites, Lake Tantaré Basin B (Fig. 1), Jacks Lake (Carignan and Lean, 1991), and Lake Lugano (Lazzaretti-Ulmer and Hanselmann, 1999) for various sampling dates.
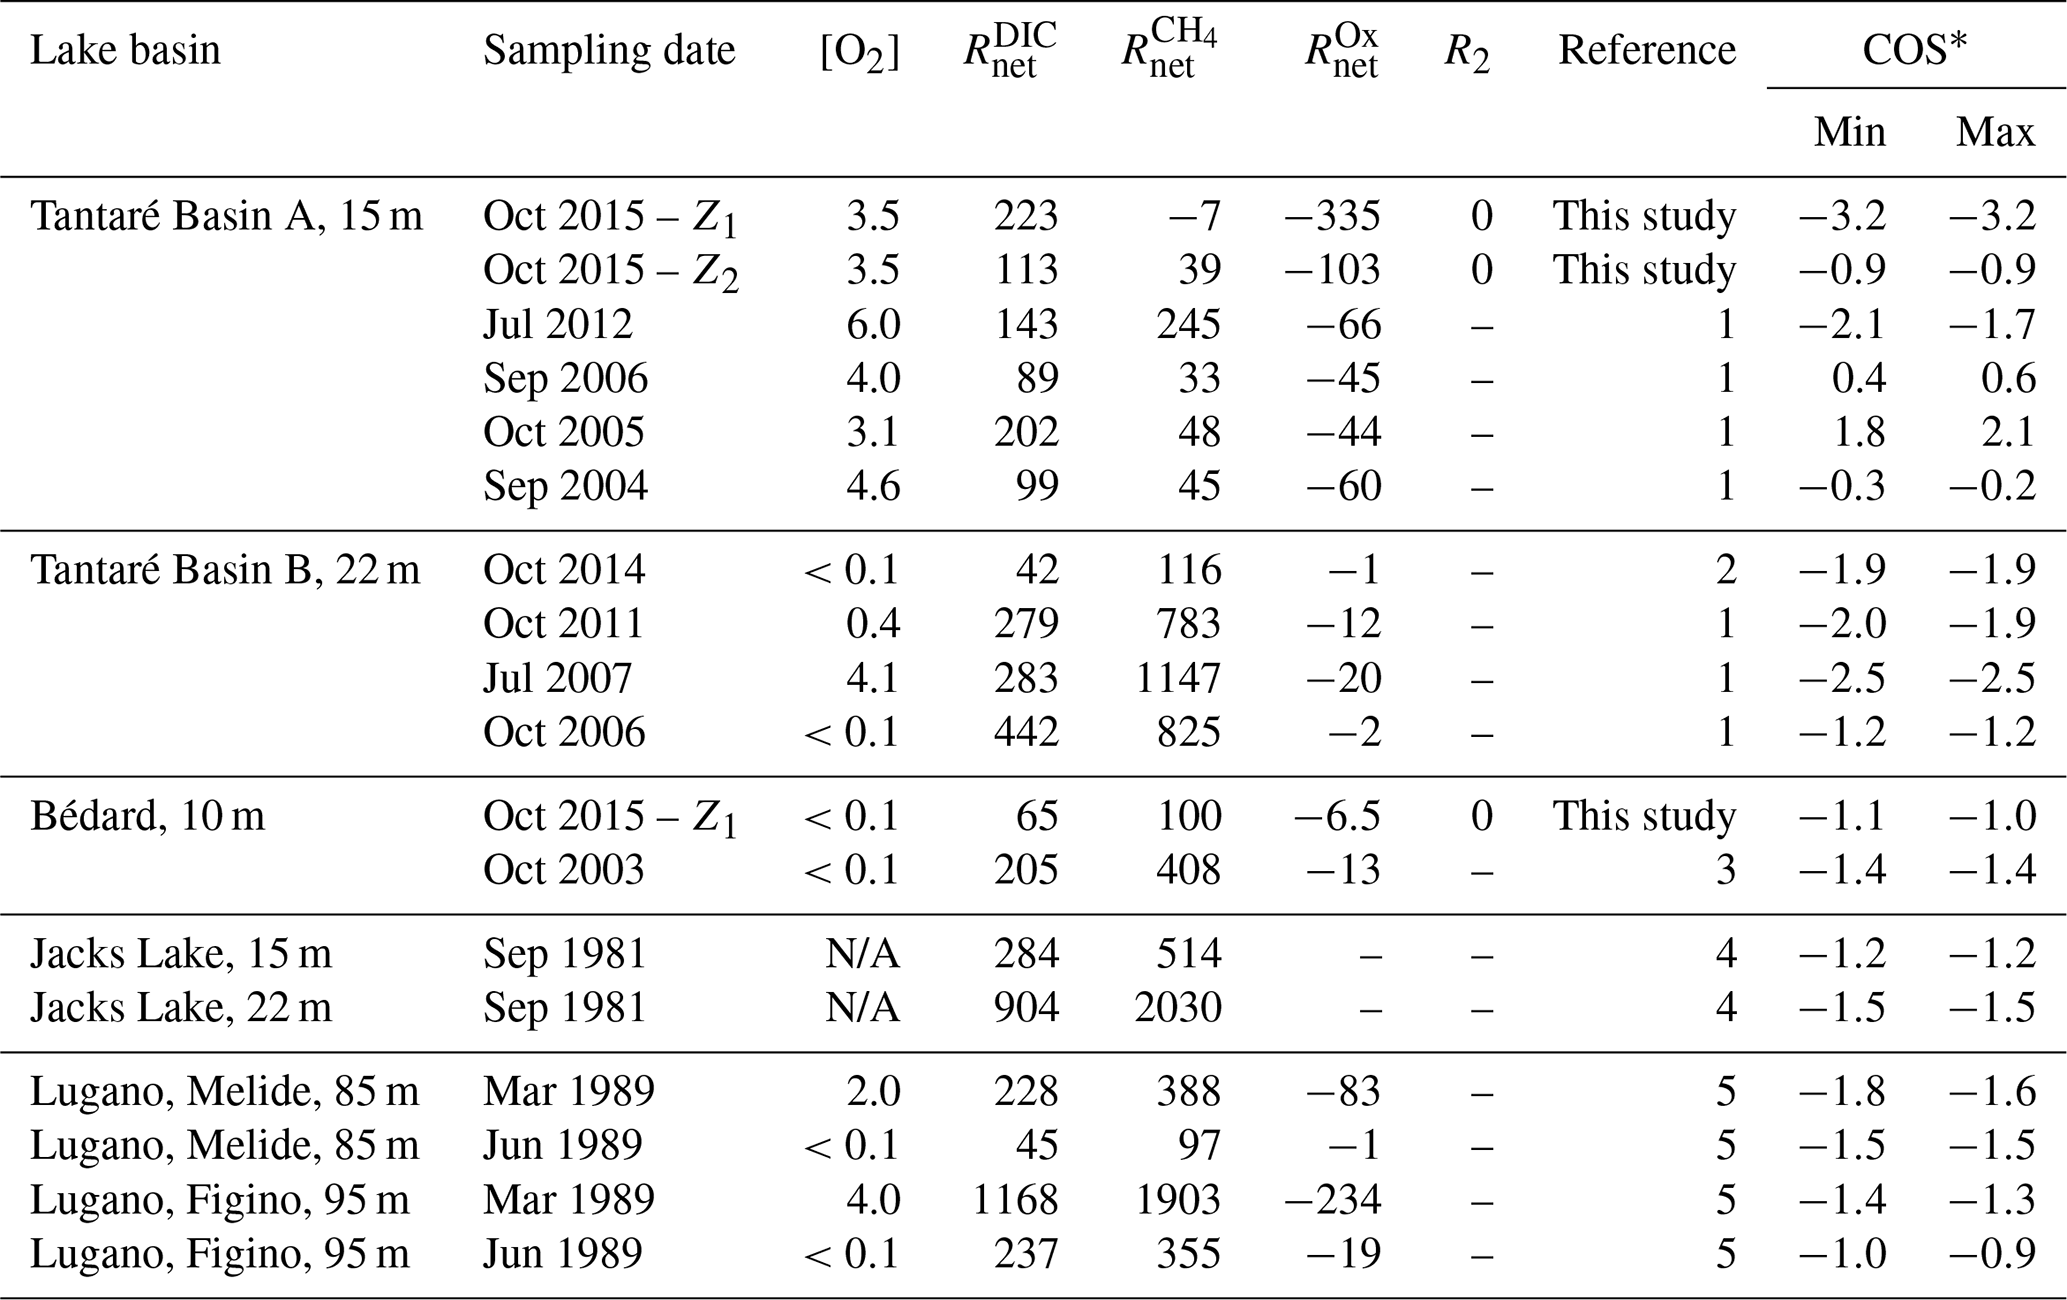
∗ Minimum and maximum COS values were obtained by setting χM to 0 and 1 in Eq. (9), except for Tantaré Basin A in October 2015, for which χM is known to be 0.75. References: (1) Clayer et al. (2016), (2) Clayer et al. (2018), (3) see Supplement, (4) Carignan and Lean (1991), (5) Lazzaretti-Ulmer and Hanselmann (1999). N/A: not available.
According to Table 4 the COS values are systematically negative at all dates for Lake Tantaré Basin B, Lake Bédard, Jacks Lake, and the two sites of Lake Lugano, and they vary generally between −0.9 and −1.9, with the exception of a value of −2.5 obtained for Lake Tantaré Basin B in July 2007. This latter value is likely too low to be representative of fermenting material and should be rejected. The mean (± SD) COS values are for Lake Tantaré Basin B, for Lake Bédard, for Jacks Lake, and for Lake Lugano. These COS values, representative of a mixture of fatty acids (COS of −1.0 for C4 fatty acids to about −1.87 for C32 fatty acids) and of fatty alcohols (COS ), strongly support the idea that methanogenesis in oligotrophic boreal lake sediments and possibly other lake types is fuelled by more reduced organic compounds than glucose. Lipids such as fatty acids and fatty alcohols with similar COS are naturally abundant in sediments to sustain the estimated rates of CH4 and DIC production during fermentation (Burdige, 2007; Cranwell, 1981; Hedges and Oades, 1997; Matsumoto, 1989). As discussed by Clayer et al. (2018) the most labile organic compounds (i.e., proteins and carbohydrates) can be rapidly degraded during their transport through the water column and in the uppermost sediment layer, leaving mainly lipids as metabolizable substrates at depths where fermentation and methanogenesis occur. This interpretation is consistent with thermodynamic and kinetic evidence that proteins and carbohydrates are more labile and are degraded faster than lipids (LaRowe and Van Cappellen, 2011).
The COS values determined for the perennially oxygenated Basin A of Lake Tantaré (mean of ; range of −3.2 to 2.1; Table 4) are much more variable than for the five other seasonally anoxic lake basins, including unrealistic values for October 2015 in the Z1 (−3.2), September 2016 (0.4–0.6), and October 2005 (1.8–2.1). Indeed, the very negative value of −3.2 does not correspond to any degradable compound under anoxic conditions, whereas the positive values of 0.4–0.6 and 1.8–2.1 would involve either amino acids and nucleotides, which are very labile (LaRowe and Van Cappellen, 2011) and tend to be degraded in the water column (Burdige, 2007), or oxidized compounds, such as ketones, aldehydes, and esters, known to be quickly reduced to alcohols. Possible sources of uncertainty in the COS estimation include misquantification of bioirrigation and DIC production through HMW OM fermentation (Reaction R2; Corbett et al., 2013). Clayer et al. (2016) provided evidence that sediment irrigation by benthic animals is effective in Lake Tantaré Basin A and that reaction rates are sensitive to the bioirrigation coefficient. Nevertheless, additional simulations show that changing the bioirrigation coefficient by a factor of 2 (increased and decreased) did not result in significant changes in COS values (<0.2). Bioirrigation might also be misrepresented. Indeed, the term used in Eq. (2) to calculate this contribution, i.e., φαirrigation([solute]tube−[solute]), is indeed an approximation of intricate 3-D processes variable in space and time (Meile et al., 2005; Boudreau and Marinelli, 1994; Forster and Graf, 1995; Gallon et al., 2008; Riisgård and Larsen, 2005). On the other hand, DIC production through HMW OM fermentation (Reaction R2; Corbett et al., 2013) was constrained by default in Lake Tantaré Basin A (Table 4). Indeed, fitting with Eq. (7) the experimental δ13C data do not allow partitioning of the production of DIC between Reactions (R1) and (R2) given that both processes share the same fractionation factor (). Equation 9 indicates that, to obtain negative COS values for Lake Tantaré Basin A in September 2006 and October 2005, R2 should be >11 and >110 fmol cm−2 s−1, respectively. These R2 values correspond to transferring >9 % and >44 % of the rate of DIC production from R1 to R2 for September 2006 and October 2005, respectively. Hence, owing to the imperfection in the COS estimations for Lake Tantaré Basin A, COS values estimated for this site should be treated with caution. Note that the sediment surface was also oxic at the sites Melide and Figino of Lake Lugano in March 1989 (Table 4), as revealed by detectable bottom water [O2] (Table 4) and by low [Fe], undetectable ΣS(-II) and [CH4], and relatively high [] in overlying water (Lazzaretti et al., 1992; Lazzaretti-Ulmer and Hanselmann, 1999). Despite this, the COS values determined for the two sites of Lake Lugano appear realistic and consistent with those calculated for Lake Tantaré Basin B, Lake Bédard, and Jacks Lake. This disparity between Lake Tantaré Basin A and Lake Lugano could be explained by the presence of benthic organisms in the former (Hare et al., 1994), but their absence in the latter, as shown by the presence of varves (Lazzaretti et al., 1992) and the absence of benthos, remains in the recent sediments of Lake Lugano (Niessen et al., 1992).
Our results show that fermentation and methanogenesis represent about 50 % and 100 % of OM mineralization in the top 25 cm of the sediments at the hypolimnetic sites in Lake Tantaré Basin A and Lake Bédard, respectively; that methane is produced only by hydrogenotrophy; and that fermentation substrates have a negative COS at these two sites. The association of hydrogenotrophy with the fermentation of reduced OM (COS ; implying that labile compounds are depleted) in the studied lake sediments is consistent with the fact that hydrogenotrophy becomes increasingly important when labile OM is depleted (Chasar et al., 2000; Hornibrook et al., 2000; Whiticar et al., 1986).
Reactive-transport modelling of 12 datasets of porewater profiles from three boreal lakes – i.e., Lake Bédard, Lake Tantaré (Basin B), and Jacks Lake – as well as of the subalpine Lake Lugano (Melide and Figino sites) consistently showed that the main substrates for sediment methanogenesis at deep seasonally anoxic hypolimnetic sites have a mean COS value of . The OM in the sediment of the three boreal lakes, as well as their O2 seasonal dynamics, is typical of boreal forest lakes. While Lake Bédard experiences prolonged episodes of extended hypolimnetic anoxia, Lake Tantaré Basin B and Jacks Lake show more moderate seasonal anoxia, where some years the hypolimnion of Lake Tantaré Basin B is only hypoxic (Clayer et al., 2016; Carignan et al., 1991). Hence, the selective mineralization of OM described by Clayer et al. (2018), involving the mineralization of the most labile compounds during OM downward migration in the water column and at the sediment surface, leaving mainly reduced organic compounds to fuel methanogenesis in the sediments, likely applies to a large portion of boreal lakes.
Hence, the current representation of the fermenting OM, i.e., CH2O, in process-based biogeochemical models entails a significant risk of underestimating sedimentary CH4 production and release to the bottom water and, to a certain extent, of its evasion to the atmosphere under transient environmental scenarios. To better constrain CH4 and CO2 production within sediments, we suggest taking specifically into account the COS of the fermenting OM in formulating the reactions of methanogenesis associated with fermentation in these models. For example, the rates of CH4 () and DIC (RDIC) production during fermentation coupled to hydrogenotrophy can be expressed as
Given these rate expressions, the stoichiometric formulation of a typical fermentation reaction producing CH4 becomes
where a equals and b equals . Introducing the average COS values reported in this study () into Eq. (14), the coefficients a and b would take values of 2.7±0.15 and 0.65±0.125, respectively, and the CH4 and CO2 stoichiometric coefficients would be 0.68±0.04 and 0.32±0.04, respectively. Note that the same stoichiometric formulation would be obtained with any possible combination of acetoclasty and hydrogenotrophy. Under these conditions, fermentation (Reaction R1) coupled to methanogenesis (Reaction R4) yields 2.2±0.4 times more CH4 than DIC for the studied lake sediments. Ignoring the implications of the present study regarding the COS of the fermenting OM could lead to the underestimation of CH4 sediment outflux or of the rate of oxidant consumption required to mitigate this efflux by a factor of up to 2.6.
The approach used to estimate the COS of the fermenting OM, although successful for the seasonally anoxic basins, failed to produce reliable COS values when applied to the perennially oxygenated Basin A of Lake Tantaré. We attribute this peculiarity to a misestimation and/or misrepresentation of the benthic irrigation and to the impossibility of partitioning the DIC production between Reactions (R1) and (R2), which share the same fractionation factor value. Similar problems would likely also be encountered in other lake ecosystems such as epilimnetic sediments and wetlands where solute transport processes remain ill-known. Indeed, these shallow aquatic environments are subject to enhanced benthic activity (Hare, 1995), to plant-mediated transport of CH4 and O2 (Chanton et al., 1989; Wand et al., 2006), and to turbulence (Poindexter et al., 2016), which complicates the estimation of CH4 and CO2 production and consumption rates. Hence, the remaining challenge resides in the robust estimations of the COS of the fermenting OM in epilimnetic sediments and shallow freshwater environments (e.g., ponds, wetlands) since these environments were shown to be the main contributors to freshwater CH4 release to the atmosphere (Bastviken et al., 2008; DelSontro et al., 2016). One potential solution is to investigate trends in the oxygen isotope signatures in the sedimentary DIC in addition to δ13C values since it is also influenced by the source of the OM undergoing degradation (e.g., Sauer et al., 2001).
Data generated during this study are available at https://doi.org/10.4211/hs.38e069761d7b4cf4abe3cbcaaac06016 (Clayer et al., 2020).
The supplement related to this article is available online at: https://doi.org/10.5194/bg-17-4571-2020-supplement.
FC, AT, and CG designed the study. FC and YG performed laboratory analyses. FC developed the model and performed the data analysis. CG, AT, and YG supervised and financed the study. FC prepared the manuscript with contributions from all coauthors.
The authors declare that they have no conflict of interest.
We thank Paul Boissinot, Lise Rancourt, Philippe Girard, Jean-François Dutil, Sébastien Duval, Alexandre Royer-Lavallée, Anthony Laberge, and Andrew Barber for research and field work assistance. We are also thankful to Jean-François Hélie, from the Laboratoire de géochimie des isotopes stables légers (UQÀM), who graciously calibrated our δ13C internal standard. Permission from the Québec Ministère du Développement durable, de l'Environnement et de la Lutte contre les changements climatiques to work in the Tantaré Ecological Reserve is gratefully acknowledged.
This research has been supported by the Natural Sciences and Engineering Research Council of Canada and the Fonds de Recherche Québécois – Nature et Technologies.
This paper was edited by Perran Cook and reviewed by three anonymous referees.
Alperin, M. J., Albert, D. B., and Martens, C. S.: Seasonal variations in production and consumption rates of dissolved organic carbon in an organic-rich coastal sediment, Geochim. Cosmochim. Ac., 58, 4909–4930, https://doi.org/10.1016/0016-7037(94)90221-6, 1994.
Arndt, S., Jørgensen, B. B., LaRowe, D. E., Middelburg, J. J., Pancost, R. D., and Regnier, P.: Quantifying the degradation of organic matter in marine sediments: A review and synthesis, Earth-Sci. Rev., 123, 53–86, https://doi.org/10.1016/j.earscirev.2013.02.008, 2013.
Arning, E. T., van Berk, W., and Schulz, H.-M.: Fate and behaviour of marine organic matter during burial of anoxic sediments: Testing CH2O as generalized input parameter in reaction transport models, Mar. Chem., 178, 8–21, https://doi.org/10.1016/j.marchem.2015.12.002, 2016.
Bastviken, D., Cole, J., Pace, M., and Tranvik, L.: Methane emissions from lakes: Dependence of lake characteristics, two regional assessments, and a global estimate: LAKE METHANE EMISSIONS, Global Biogeochem. Cy., 18, GB4009, https://doi.org/10.1029/2004GB002238, 2004.
Bastviken, D., Cole, J. J., Pace, M. L., and Van de Bogert, M. C.: Fates of methane from different lake habitats: Connecting whole-lake budgets and CH4 emissions: FATES OF LAKE METHANE, J. Geophys. Res.-Biogeo., 113, G02024, https://doi.org/10.1029/2007JG000608, 2008.
Beal, E. J., House, C. H., and Orphan, V. J.: Manganese- and iron-dependent marine methane oxidation, Science, 325, 184–187, https://doi.org/10.1126/science.1169984, 2009.
Berg, P., Risgaard-Petersen, N., and Rysgaard, S.: Interpretation of measured concentration profiles in sediment pore water, Limnol. Oceanogr., 43, 1500–1510, https://doi.org/10.4319/lo.1998.43.7.1500, 1998.
Borowski, W. S., Paull, C. K., and Ussler, W.: Carbon cycling within the upper methanogenic zone of continental rise sediments; An example from the methane-rich sediments overlying the Blake Ridge gas hydrate deposits, Mar. Chem., 57, 299–311, https://doi.org/10.1016/S0304-4203(97)00019-4, 1997.
Botrel, M., Gregory-Eaves, I., and Maranger, R.: Defining drivers of nitrogen stable isotopes (δ15N) of surface sediments in temperate lakes, J. Paleolimnol., 52, 419–433, https://doi.org/10.1007/s10933-014-9802-6, 2014.
Boudreau, B. P.: On the equivalence of nonlocal and radial-diffusion models for porewater irrigation, J. Mar. Res., 42, 731–735, https://doi.org/10.1357/002224084788505924, 1984.
Boudreau, B. P.: Diagenetic models and their implementation: modelling transport and reactions in aquatic sediments, Springer, Berlin, Germany, 1997.
Boudreau, B. P. and Marinelli, R. L.: A modelling study of discontinuous biological irrigation, J. Mar. Res., 52, 947–968, https://doi.org/10.1357/0022240943076902, 1994.
Buffle, J.: Complexation reactions in aquatic systems: An analytical approach, Ellis Horwood Limited, Cambridge, UK, 1988.
Burdige, D. J.: Microbial processes affecting alanine and glutamic acid in anoxic marine sediments, FEMS Microbiol. Ecol., 85, 211–232, 1991.
Burdige, D. J.: Preservation of Organic Matter in Marine Sediments: Controls, Mechanisms, and an Imbalance in Sediment Organic Carbon Budgets?, Chem. Rev., 107, 467–485, https://doi.org/10.1021/cr050347q, 2007.
Burdige, D. J. and Komada, T.: Anaerobic oxidation of methane and the stoichiometry of remineralization processes in continental margin sediments, Limnol. Oceanogr., 56, 1781–1796, https://doi.org/10.4319/lo.2011.56.5.1781, 2011.
Burdige, D. J., Komada, T., Magen, C., and Chanton, J. P.: Methane dynamics in Santa Barbara Basin (USA) sediments as examined with a reaction-transport model, J. Mar. Res., 74, 277–313, 2017.
Carignan, R. and Lean, D. R. S.: Regeneration of dissolved substances in a seasonally anoxic lake: The relative importance of processes occurring in the water column and in the sediments, Limnol. Oceanogr., 36, 683–707, https://doi.org/10.4319/lo.1991.36.4.0683, 1991.
Carignan, R., Rapin, F., and Tessier, A.: Sediment porewater sampling for metal analysis: A comparison of techniques, Geochim. Cosmochim. Ac., 49, 2493–2497, https://doi.org/10.1016/0016-7037(85)90248-0, 1985.
Chanton, J. P., Martens, C. S., and Kelley, C. A.: Gas transport from methane-saturated, tidal freshwater and wetland sediments, Limnol. Oceanogr., 34, 807–819, https://doi.org/10.4319/lo.1989.34.5.0807, 1989.
Chanton, J. P., Whiting, G. J., Blair, N. E., Lindau, C. W., and Bollich, P. K.: Methane emission from rice: Stable isotopes, diurnal variations, and CO2 exchange, Global Biogeochem. Cy., 11, 15–27, https://doi.org/10.1029/96GB03761, 1997.
Chasar, L. S., Chanton, J. P., Glaser, P. H., Siegel, D. I., and Rivers, J. S.: Radiocarbon and stable carbon isotopic evidence for transport and transformation of dissolved organic carbon, dissolved inorganic carbon, and CH4 in a northern Minnesota peatland, Global Biogeochem. Cy., 14, 1095–1108, https://doi.org/10.1029/1999GB001221, 2000.
Clayer, F., Gobeil, C., and Tessier, A.: Rates and pathways of sedimentary organic matter mineralization in two basins of a boreal lake: Emphasis on methanogenesis and methanotrophy: Methane cycling in boreal lake sediments, Limnol. Oceanogr., 61, S131–S149, https://doi.org/10.1002/lno.10323, 2016.
Clayer, F., Moritz, A., Gélinas, Y., Tessier, A., and Gobeil, C.: Modeling the carbon isotope signatures of methane and dissolved inorganic carbon to unravel mineralization pathways in boreal lake sediments, Geochim. Cosmochim. Ac., 229, 36–52, https://doi.org/10.1016/j.gca.2018.02.012, 2018.
Clayer, F., Tessier, A., Gobeil, C., and Gélinas, Y.: Dataset for “Mineralization of organic matter in boreal lake sediments: Rates, pathways and nature of the fermenting substrates”, HydroShare, https://doi.org/10.4211/hs.38e069761d7b4cf4abe3cbcaaac06016, 2020.
Cole, J. J., Prairie, Y. T., Caraco, N. F., McDowell, W. H., Tranvik, L. J., Striegl, R. G., Duarte, C. M., Kortelainen, P., Downing, J. A., Middelburg, J. J., and Melack, J.: Plumbing the Global Carbon Cycle: Integrating Inland Waters into the Terrestrial Carbon Budget, Ecosystems, 10, 172–185, https://doi.org/10.1007/s10021-006-9013-8, 2007.
Conrad, R.: Contribution of hydrogen to methane production and control of hydrogen concentrations in methanogenic soils and sediments, FEMS Microbiol. Ecol., 28, 193–202, https://doi.org/10.1111/j.1574-6941.1999.tb00575.x, 1999.
Conrad, R.: Quantification of methanogenic pathways using stable carbon isotopic signatures: a review and a proposal, Org. Geochem., 36, 739–752, https://doi.org/10.1016/j.orggeochem.2004.09.006, 2005.
Conrad, R., Claus, P., and Casper, P.: Characterization of stable isotope fractionation during methane production in the sediment of a eutrophic lake, Lake Dagow, Germany, Limnol. Oceanogr., 54, 457–471, https://doi.org/10.4319/lo.2009.54.2.0457, 2009.
Corbett, J. E., Tfaily, M. M., Burdige, D. J., Cooper, W. T., Glaser, P. H., and Chanton, J. P.: Partitioning pathways of CO2 production in peatlands with stable carbon isotopes, Biogeochemistry, 114, 327–340, 2013.
Corbett, J. E., Tfaily, M. M., Burdige, D. J., Glaser, P. H., and Chanton, J. P.: The relative importance of methanogenesis in the decomposition of organic matter in northern peatlands, J. Geophys. Res.-Biogeo., 120, 280–293, https://doi.org/10.1002/2014JG002797, 2015.
Couture, R.-M., Gobeil, C., and Tessier, A.: Chronology of Atmospheric Deposition of Arsenic Inferred from Reconstructed Sedimentary Records, Environ. Sci. Technol., 42, 6508–6513, https://doi.org/10.1021/es800818j, 2008.
Couture, R.-M., Gobeil, C., and Tessier, A.: Arsenic, iron and sulfur co-diagenesis in lake sediments, Geochim. Cosmochim. Ac., 74, 1238–1255, https://doi.org/10.1016/j.gca.2009.11.028, 2010.
Couture, R.-M., Fischer, R., Van Cappellen, P., and Gobeil, C.: Non-steady state diagenesis of organic and inorganic sulfur in lake sediments, Geochim. Cosmochim. Ac., 194, 15–33, https://doi.org/10.1016/j.gca.2016.08.029, 2016.
Cranwell, P. A.: Diagenesis of free and bound lipids in terrestrial detritus deposited in a lacustrine sediment, Org. Geochem., 3, 79–89, https://doi.org/10.1016/0146-6380(81)90002-4, 1981.
D'Arcy, P.: Relations entre les propriétés du bassin versant, la morphométrie du lac et la qualité des eaux, INRS-ETE, Université du Québec, Québec City, Québec, Canada, 1993.
DelSontro, T., Boutet, L., St-Pierre, A., del Giorgio, P. A., and Prairie, Y. T.: Methane ebullition and diffusion from northern ponds and lakes regulated by the interaction between temperature and system productivity: Productivity regulates methane lake flux, Limnol. Oceanogr., 61, S62–S77, https://doi.org/10.1002/lno.10335, 2016.
Egger, M., Rasigraf, O., Sapart, C. J., Jilbert, T., Jetten, M. S. M., Röckmann, T., van der Veen, C., Bândă, N., Kartal, B., Ettwig, K. F., and Slomp, C. P.: Iron-Mediated Anaerobic Oxidation of Methane in Brackish Coastal Sediments, Environ. Sci. Technol., 49, 277–283, https://doi.org/10.1021/es503663z, 2015.
Ettwig, K. F., Butler, M. K., Le Paslier, D., Pelletier, E., Mangenot, S., Kuypers, M. M. M., Schreiber, F., Dutilh, B. E., Zedelius, J., de Beer, D., Gloerich, J., Wessels, H. J. C. T., van Alen, T., Luesken, F., Wu, M. L., van de Pas-Schoonen, K. T., Op den Camp, H. J. M., Janssen-Megens, E. M., Francoijs, K.-J., Stunnenberg, H., Weissenbach, J., Jetten, M. S. M., and Strous, M.: Nitrite-driven anaerobic methane oxidation by oxygenic bacteria, Nature, 464, 543–548, https://doi.org/10.1038/nature08883, 2010.
Fakhraee, M., Li, J., and Katsev, S.: Significant role of organic sulfur in supporting sedimentary sulfate reduction in low-sulfate environments, Geochim. Cosmochim. Ac., 213, 502–516, https://doi.org/10.1016/j.gca.2017.07.021, 2017.
Feyte, S., Gobeil, C., Tessier, A., and Cossa, D.: Mercury dynamics in lake sediments, Geochim. Cosmochim. Ac., 82, 92–112, https://doi.org/10.1016/j.gca.2011.02.007, 2012.
Forster, S. and Graf, G.: Impact of irrigation on oxygen flux into the sediment: Intermittent pumping by Callianassa subterranea and “piston-pumping” by Lanice conchilega, Mar. Biol., 123, 335–346, https://doi.org/10.1007/BF00353625, 1995.
Francioso, O., Montecchio, D., Gioacchini, P., and Ciavatta, C.: Thermal analysis (TG–DTA) and isotopic characterization (13C–15N) of humic acids from different origins, Appl. Geochem., 20, 537–544, https://doi.org/10.1016/j.apgeochem.2004.10.003, 2005.
Galand, P. E., Yrjälä, K., and Conrad, R.: Stable carbon isotope fractionation during methanogenesis in three boreal peatland ecosystems, Biogeosciences, 7, 3893–3900, https://doi.org/10.5194/bg-7-3893-2010, 2010.
Gallon, C., Hare, L., and Tessier, A.: Surviving in anoxic surroundings: How burrowing aquatic insects create an oxic microhabitat, J. N. Am. Benthol. Soc., 27, 570–580, https://doi.org/10.1899/07-132.1, 2008.
Hare, L.: Sediment Colonization by Littoral and Profundal Insects, J. N. Am. Benthol. Soc., 14, 315–323, https://doi.org/10.2307/1467783, 1995.
Hare, L., Carignan, R., and Huerta-Diaz, M. A.: A field study of metal toxicity and accumulation by benthic invertebrates; implications for the acid-volatile sulfide (AVS) model, Limnol. Oceanogr., 39, 1653–1668, https://doi.org/10.4319/lo.1994.39.7.1653, 1994.
Hastie, A., Lauerwald, R., Weyhenmeyer, G., Sobek, S., Verpoorter, C., and Regnier, P.: CO2 evasion from boreal lakes: Revised estimate, drivers of spatial variability, and future projections, Glob. Change Biol., 24, 711–728, https://doi.org/10.1111/gcb.13902, 2018.
Hedges, J. I. and Oades, J. M.: Comparative organic geochemistries of soils and marine sediments, Org. Geochem., 27, 319–361, https://doi.org/10.1016/S0146-6380(97)00056-9, 1997.
Hesslein, R. H.: An in situ sampler for close interval pore water studies1, Limnol. Oceanogr., 21, 912–914, https://doi.org/10.4319/lo.1976.21.6.0912, 1976.
Holgerson, M. A. and Raymond, P. A.: Large contribution to inland water CO2 and CH4 emissions from very small ponds, Nat. Geosci., 9, 222–226, https://doi.org/10.1038/ngeo2654, 2016.
Hornibrook, E. R. C., Longstaffe, F. J., and Fyfe, W. S.: Spatial distribution of microbial methane production pathways in temperate zone wetland soils: Stable carbon and hydrogen isotope evidence, Geochim. Cosmochim. Ac., 61, 745–753, https://doi.org/10.1016/S0016-7037(96)00368-7, 1997.
Hornibrook, E. R. C., Longstaffe, F. J., and Fyfe, W. S.: Evolution of stable carbon isotope compositions for methane and carbon dioxide in freshwater wetlands and other anaerobic environments, Geochim. Cosmochim. Ac., 64, 1013–1027, https://doi.org/10.1016/S0016-7037(99)00321-X, 2000.
Jørgensen, B. B. and Parkes, R. J.: Role of sulfate reduction and methane production by organic carbon degradation in eutrophic fjord sediments (Limfjorden, Denmark), Limnol. Oceanogr., 55, 1338–1352, https://doi.org/10.4319/lo.2010.55.3.1338, 2010.
Joshani, A.: Investigating organic matter preservation through complexation with iron oxides in Lake Tantaré, masters, Concordia University, 1 September, available at: https://spectrum.library.concordia.ca/980434/ (last access: 12 December 2019), 2015.
Kankaala, P., Huotari, J., Tulonen, T., and Ojala, A.: Lake-size dependent physical forcing drives carbon dioxide and methane effluxes from lakes in a boreal landscape, Limnol. Oceanogr., 58, 1915–1930, https://doi.org/10.4319/lo.2013.58.6.1915, 2013.
Laforte, L., Tessier, A., Gobeil, C., and Carignan, R.: Thallium diagenesis in lacustrine sediments, Geochim. Cosmochim. Ac., 69, 5295–5306, https://doi.org/10.1016/j.gca.2005.06.006, 2005.
LaRowe, D. E. and Van Cappellen, P.: Degradation of natural organic matter: A thermodynamic analysis, Geochim. Cosmochim. Ac., 75, 2030–2042, https://doi.org/10.1016/j.gca.2011.01.020, 2011.
Lazzaretti, M. A., Hanselmann, K. W., Brandl, H., Span, D., and Bachofen, R.: The role of sediments in the phosphorus cycle in Lake Lugano. II. Seasonal and spatial variability of microbiological processes at the sediment-water interface, Aquat. Sci., 54, 285–299, https://doi.org/10.1007/BF00878142, 1992.
Lazzaretti-Ulmer, M. A. and Hanselmann, K. W.: Seasonal variation of the microbially regulated buffering capacity at sediment-water interfaces in a freshwater lake, Aquat. Sci., 61, 59–74, https://doi.org/10.1007/s000270050052, 1999.
Matisoff, G. and Wang, X.: Solute transport in sediments by freshwater infaunal bioirrigators, Limnol. Oceanogr., 43, 1487–1499, https://doi.org/10.4319/lo.1998.43.7.1487, 1998.
Matsumoto, G. I.: Biogeochemical study of organic substances in Antarctic lakes, Hydrobiologia, 172, 265–299, https://doi.org/10.1007/BF00031627, 1989.
Meile, C. D., Berg, P., Cappellen, P. S. J., and Tuncay, K.: Solute-specific pore water irrigation: Implications for chemical cycling in early diagenesis, J. Mar. Res., 63, 601–621, https://doi.org/10.1357/0022240054307885, 2005.
Natchimuthu, S., Wallin, M. B., Klemedtsson, L., and Bastviken, D.: Spatio-temporal patterns of stream methane and carbon dioxide emissions in a hemiboreal catchment in Southwest Sweden, Sci. Rep., 7, 39729, https://doi.org/10.1038/srep39729, 2017.
Niessen, F., Wick, L., Bonani, G., Chondrogianni, C., and Siegenthaler, C.: Aquatic system response to climatic and human changes: Productivity, bottom water oxygen status, and sapropel formation in Lake Lugano over the last 10 000 years, Aquat. Sci., 54, 257–276, https://doi.org/10.1007/BF00878140, 1992.
Norði, K. À, Thamdrup, B., and Schubert, C. J.: Anaerobic oxidation of methane in an iron-rich Danish freshwater lake sediment, Limnol. Oceanogr., 58, 546–554, https://doi.org/10.4319/lo.2013.58.2.0546, 2013.
Paraska, D. W., Hipsey, M. R., and Salmon, S. U.: Sediment diagenesis models: Review of approaches, challenges and opportunities, Environ. Model. Softw., 61, 297–325, https://doi.org/10.1016/j.envsoft.2014.05.011, 2014.
Pohlman, J. W., Ruppel, C., Hutchinson, D. R., Downer, R., and Coffin, R. B.: Assessing sulfate reduction and methane cycling in a high salinity pore water system in the northern Gulf of Mexico, Mar. Petrol. Geol., 25, 942–951, https://doi.org/10.1016/j.marpetgeo.2008.01.016, 2008.
Pohlman, J. W., Riedel, M., Bauer, J. E., Canuel, E. A., Paull, C. K., Lapham, L., Grabowski, K. S., Coffin, R. B., and Spence, G. D.: Anaerobic methane oxidation in low-organic content methane seep sediments, Geochim. Cosmochim. Ac., 108, 184–201, https://doi.org/10.1016/j.gca.2013.01.022, 2013.
Poindexter, C. M., Baldocchi, D. D., Matthes, J. H., Knox, S. H., and Variano, E. A.: The contribution of an overlooked transport process to a wetland's methane emissions, Geophys. Res. Lett., 43, 6276–6284, https://doi.org/10.1002/2016GL068782, 2016.
Raghoebarsing, A. A., Pol, A., van de Pas-Schoonen, K. T., Smolders, A. J. P., Ettwig, K. F., Rijpstra, W. I. C., Schouten, S., Damsté, J. S. S., Op den Camp, H. J. M., Jetten, M. S. M., and Strous, M.: A microbial consortium couples anaerobic methane oxidation to denitrification, Nature, 440, 918–921, https://doi.org/10.1038/nature04617, 2006.
Riisgård, H. U. and Larsen, P. S.: Water pumping and analysis of flow in burrowing zoobenthos: An overview, Aquat. Ecol., 39, 237–258, https://doi.org/10.1007/s10452-004-1916-x, 2005.
Sabrekov, A. F., Runkle, B. R. K., Glagolev, M. V., Terentieva, I. E., Stepanenko, V. M., Kotsyurbenko, O. R., Maksyutov, S. S., and Pokrovsky, O. S.: Variability in methane emissions from West Siberia's shallow boreal lakes on a regional scale and its environmental controls, Biogeosciences, 14, 3715–3742, https://doi.org/10.5194/bg-14-3715-2017, 2017.
Sauer, P. E., Miller, G. H., and Overpeck, J. T.: Oxygen isotope ratios of organic matter in arctic lakes as a paleoclimate proxy: field and laboratory investigations, J. Paleolimnol., 25, 43–64, https://doi.org/10.1023/A:1008133523139, 2001.
Saunois, M., Bousquet, P., Poulter, B., Peregon, A., Ciais, P., Canadell, J. G., Dlugokencky, E. J., Etiope, G., Bastviken, D., Houweling, S., Janssens-Maenhout, G., Tubiello, F. N., Castaldi, S., Jackson, R. B., Alexe, M., Arora, V. K., Beerling, D. J., Bergamaschi, P., Blake, D. R., Brailsford, G., Brovkin, V., Bruhwiler, L., Crevoisier, C., Crill, P., Covey, K., Curry, C., Frankenberg, C., Gedney, N., Höglund-Isaksson, L., Ishizawa, M., Ito, A., Joos, F., Kim, H.-S., Kleinen, T., Krummel, P., Lamarque, J.-F., Langenfelds, R., Locatelli, R., Machida, T., Maksyutov, S., McDonald, K. C., Marshall, J., Melton, J. R., Morino, I., Naik, V., O'Doherty, S., Parmentier, F.-J. W., Patra, P. K., Peng, C., Peng, S., Peters, G. P., Pison, I., Prigent, C., Prinn, R., Ramonet, M., Riley, W. J., Saito, M., Santini, M., Schroeder, R., Simpson, I. J., Spahni, R., Steele, P., Takizawa, A., Thornton, B. F., Tian, H., Tohjima, Y., Viovy, N., Voulgarakis, A., van Weele, M., van der Werf, G. R., Weiss, R., Wiedinmyer, C., Wilton, D. J., Wiltshire, A., Worthy, D., Wunch, D., Xu, X., Yoshida, Y., Zhang, B., Zhang, Z., and Zhu, Q.: The global methane budget 2000–2012, Earth Syst. Sci. Data, 8, 697–751, https://doi.org/10.5194/essd-8-697-2016, 2016.
Schindler, D. W., Curtis, P. J., Parker, B. R., and Stainton, M. P.: Consequences of climate warming and lake acidification for UV-B penetration in North American boreal lakes, Nature, 379, 705–708, https://doi.org/10.1038/379705a0, 1996.
Sivan, O., Schrag, D. P., and Murray, R. W.: Rates of methanogenesis and methanotrophy in deep-sea sediments, Geobiology, 5, 141–151, https://doi.org/10.1111/j.1472-4669.2007.00098.x, 2007.
Staehr, P. A., Testa, J. M., Kemp, W. M., Cole, J. J., Sand-Jensen, K., and Smith, S. V.: The metabolism of aquatic ecosystems: history, applications, and future challenges, Aquat. Sci., 74, 15–29, https://doi.org/10.1007/s00027-011-0199-2, 2012.
Thottathil, S. D., Reis, P. C. J., and Prairie, Y. T.: Methane oxidation kinetics in northern freshwater lakes, Biogeochemistry, 143, 105–116, https://doi.org/10.1007/s10533-019-00552-x, 2019.
Tipping, E.: Cation binding by humic substances, Cambridge University Press, Cambridge, UK, 2002.
Turner, A. J., Jacob, D. J., Wecht, K. J., Maasakkers, J. D., Lundgren, E., Andrews, A. E., Biraud, S. C., Boesch, H., Bowman, K. W., Deutscher, N. M., Dubey, M. K., Griffith, D. W. T., Hase, F., Kuze, A., Notholt, J., Ohyama, H., Parker, R., Payne, V. H., Sussmann, R., Sweeney, C., Velazco, V. A., Warneke, T., Wennberg, P. O., and Wunch, D.: Estimating global and North American methane emissions with high spatial resolution using GOSAT satellite data, Atmos. Chem. Phys., 15, 7049–7069, https://doi.org/10.5194/acp-15-7049-2015, 2015.
Ullman, W. J. and Aller, R. C.: Diffusion coefficients in nearshore marine sediments1, Limnol. Oceanogr., 27, 552–556, https://doi.org/10.4319/lo.1982.27.3.0552, 1982.
Verpoorter, C., Kutser, T., Seekell, D. A., and Tranvik, L. J.: A global inventory of lakes based on high-resolution satellite imagery, Geophys. Res. Lett., 41, 6396–6402, https://doi.org/10.1002/2014GL060641, 2014.
Wallin, M. B., Campeau, A., Audet, J., Bastviken, D., Bishop, K., Kokic, J., Laudon, H., Lundin, E., Löfgren, S., Natchimuthu, S., Sobek, S., Teutschbein, C., Weyhenmeyer, G. A., and Grabs, T.: Carbon dioxide and methane emissions of Swedish low-order streams – a national estimate and lessons learnt from more than a decade of observations, Limnol. Oceanogr. Lett., 3, 156–167, https://doi.org/10.1002/lol2.10061, 2018.
Wand, U., Samarkin, V. A., Nitzsche, H.-M., and Hubberten, H.-W.: Biogeochemistry of methane in the permanently ice-covered Lake Untersee, central Dronning Maud Land, East Antarctica, Limnol. Oceanogr., 51, 1180–1194, https://doi.org/10.4319/lo.2006.51.2.1180, 2006.
Wang, Y. and Van Cappellen, P.: A multicomponent reactive transport model of early diagenesis: Application to redox cycling in coastal marine sediments, Geochim. Cosmochim. Ac., 60, 2993–3014, https://doi.org/10.1016/0016-7037(96)00140-8, 1996.
Whiticar, M. J.: Carbon and hydrogen isotope systematics of bacterial formation and oxidation of methane, Chem. Geol., 161, 291–314, https://doi.org/10.1016/S0009-2541(99)00092-3, 1999.
Whiticar, M. J., Faber, E., and Schoell, M.: Biogenic methane formation in marine and freshwater environments: CO2 reduction vs. acetate fermentation—Isotope evidence, Geochim. Cosmochim. Ac., 50, 693–709, https://doi.org/10.1016/0016-7037(86)90346-7, 1986.
Wuebbles, D. J. and Hayhoe, K.: Atmospheric methane and global change, Earth-Sci. Rev., 57, 177–210, https://doi.org/10.1016/S0012-8252(01)00062-9, 2002.