the Creative Commons Attribution 4.0 License.
the Creative Commons Attribution 4.0 License.
 | 25 Sep 2020
Sediment release of dissolved organic matter to the oxygen minimum zone off Peru
Alexandra N. Loginova
Andrew W. Dale
Frédéric A. C. Le Moigne
Sören Thomsen
Stefan Sommer
David Clemens
Klaus Wallmann
The eastern tropical South Pacific (ETSP) represents one of the most productive areas in the ocean that is characterised by a pronounced oxygen minimum zone (OMZ). Particulate organic matter (POM) that sinks out of the euphotic zone is supplied to the anoxic sediments and utilised by microbial communities, and the degradation of POM is associated with the production and reworking of dissolved organic matter (DOM). The release of DOM to the overlying waters may, therefore, represent an important organic matter escape mechanism from remineralisation within sediments but has received little attention in OMZ regions so far. Here, we combine measurements of dissolved organic carbon (DOC) and dissolved organic nitrogen (DON) with DOM optical properties in the form of chromophoric (CDOM) and fluorescent (FDOM) DOM from pore waters and near-bottom waters of the ETSP off Peru. We evaluate diffusion-driven fluxes and net in situ fluxes of DOC and DON to investigate processes affecting DOM cycling at the sediment–water interface along a transect at 12∘ S. To our knowledge, these are the first data for sediment release of DON and pore water CDOM and FDOM for the ETSP off Peru. Pore water DOC accumulated with increasing sediment depth, suggesting an imbalance between DOM production and remineralisation within sediments. High DON accumulation resulted in very low pore water DOC ∕ DON ratios (≤1) which could be caused by an “uncoupling” in DOC and DON remineralisation. Diffusion-driven fluxes of DOC and DON exhibited high spatial variability and ranged from 0.2±0.1 to 2.5±1.3 and from to 3.3±1.7 , respectively. Generally low net in situ DOC and DON fluxes, as well as a steepening of spectral inclination (S) of CDOM and an increase in humic-like DOM at the sediment–water interface over time, indicated active microbial DOM utilisation. The latter may potentially be stimulated by the presence of nitrate () and nitrite () in the water column. The microbial DOC utilisation rates, estimated in our study, are potentially sufficient to support denitrification rates of 0.2–1.4 , suggesting that the sediment release of DOM may on occasion contribute to nitrogen loss processes in the ETSP off Peru.
- Article
(3240 KB) - Full-text XML
-
Supplement
(1267 KB) - BibTeX
- EndNote


The eastern tropical South Pacific (ETSP) is one of the most productive areas of the world ocean (Pennington et al., 2006). High productivity followed by intensive organic matter remineralisation (e.g. Loginova et al., 2019; Maßmig et al., 2020) in combination with sluggish ventilation (Stramma et al., 2005; Keeling et al., 2010) leads to the formation of a pronounced oxygen minimum zone (OMZ) (e.g. Stramma et al., 2008). Remineralisation of organic matter under anoxia induces nitrogen (N) loss by denitrification, anammox and dissimilatory nitrate reduction to ammonium (DNRA) in the water column and sediments off the coast of Peru (Kalvelage et al., 2013; Arévalo-Martínez et al., 2015; Dale et al., 2016; Sommer et al., 2016; Glock et al., 2019). Although organic matter remineralisation is classically assumed to be limited by the absence of oxygen (Demaison and Moore, 1980), recent studies report similar abilities of marine microbes to degrade organic matter in oxygenated surface waters and within OMZs (Pantoja et al., 2009; Maßmig et al., 2019, 2020), suggesting that other factors such as the quality of organic matter may regulate microbial activity within OMZs (Pantoja et al., 2009; Le Moigne et al., 2017). Similar to water column studies, extensive fieldwork campaigns conducted on sediments off Peru suggested intensive particulate organic matter (POM) remineralisation under full anoxia (Dale et al., 2015).
While POM degradation in sediments is mostly associated with its full remineralisation to dissolved inorganic carbon (DIC) and inorganic nutrients, the mechanism of POM remineralisation implies important intermediate stages of DOM production, reworking and mineralisation (Smith et al., 1992; Komada et al., 2013). Thus, around 10 % of remineralised particulate organic carbon (POC) may accumulate as dissolved organic carbon (DOC) in the pore waters (Alperin et al., 1999). In turn, dissolved organic matter (DOM) efflux may represent an important escape mechanism for carbon from sediments (e.g. Ludwig et al., 1996; Burdige et al., 1999) and a source of organic matter to the water column (e.g. Burdige et al., 2016). Despite the importance of sediment DOM for organic matter cycling, the measurements of benthic DOM fluxes remain scarce, and the reactivity of the pore water DOM is not well constrained.
The release of dissolved substances from anoxic sediments is regulated mainly by diffusion through the sediment–water interface (e.g. Lavery et al., 2001, and references therein). Diffusion-driven DOM fluxes (hereafter named “diffusive fluxes”) and net DOM fluxes (hereafter termed “in situ net fluxes”) are commonly evaluated from pore water gradients using Fick's first law and by enclosing and incubating a small area of the sediment surface over time, respectively. Diffusive DOM fluxes are, generally, consistent with net DOM fluxes in non-bioturbated anoxic sediments (Burdige et al., 1992). In some sediments, however, the diffusive flux may overestimate the net flux (Burdige et al., 1992; Lavery et al., 2001). This overestimation may be attributed to bioturbation, ”unfavourable” redox conditions (Lavery et al., 2001), irreversible adsorption onto particles, and biological DOM consumption at the sediment–water interface or in the bottom waters (Burdige et al., 1992). The determination of in situ net DOM fluxes using benthic incubation chambers is independent of such uncertainties. This approach is based on the assumption that solutes, released into the benthic chamber, behave conservatively throughout incubation and show linear trends over time.
It was previously suggested that pore water DOM consists in part of recalcitrant low-molecular-weight (LMW) compounds (Burdige and Gardner, 1998; Burdige and Komada, 2015). Therefore, the sediment outflux of DOM was hypothesised to serve as an important source of recalcitrant DOM to the water column (e.g. Burdige and Komada, 2015; Burdige et al., 2016). At the same time, elevated concentrations of dissolved organic nitrogen (DON) suggest the presence of labile proteinaceous organic matter in the pore waters (e.g. Faganeli and Herndl, 1991). Furthermore, measurements and modelling of isotopic carbon composition in the anoxic and suboxic sediments off California suggest that about 50 % of DOM within the upper sediment pore waters is represented by isotopically young and labile DOM components, which may be released to the water column, where they are actively utilised by heterotrophs (Bauer et al., 1995; Komada et al., 2013; Burdige et al., 2016).
Similarly to DOM in the water column, pore water DOM consists of a complex mixture of organic components, only a little fraction of which may be characterised by chemical analyses (e.g. Burdige and Komada, 2015). Therefore, examining the elemental composition of DOM or its optical properties may be useful for accessing the quality and reactivity of pore water DOM. The elemental ratio (DOC ∕ DON) that is commonly used for inferring organic matter bioavailability in the water column displays controversial patterns in sediment pore waters. Some studies suggest that low DOC ∕ DON ratios of 2 to 5 found in sediments with reduced O2 levels may indicate an accumulation of bioavailable DOM under low-O2 conditions (Faganeli and Herndl, 1991; Alkhatib et al., 2013). On the other hand, DOC ∕ DON ratios found in other studies were lower under oxygenated conditions compared to those of anoxic sediments (Burdige and Gardner, 1998).
Optical properties were also shown to provide important insights into DOM cycling not only in the water column (e.g. Coble, 1996; Zsolnay et al., 1999; Jørgensen et al., 2011; Catalá et al., 2016; Loginova et al., 2016) but also in pore waters of marine and freshwater sediments (e.g. Chen et al., 2016). The fraction of DOM that exhibits optical activity owing to the presence of chromophoric groups – a combination of conjugated double bonds and heteroatoms – in its molecular structure is referred to as chromophoric (CDOM) and fluorescent (FDOM) DOM. CDOM refers to DOM that absorbs light over a broad spectrum region, from UV to visible wavelengths. A typical CDOM absorbance spectrum is shaped as an exponential curve (Del Vecchio and Blough, 2004). The CDOM spectral slope (S) and absorption coefficients are used to learn bulk DOM properties. For instance, a decrease in module value of S may indicate an increase in relative molecular weight of DOM (e.g. Helms et al., 2008). Those changes in optical properties occur due to the ability of high-molecular-weight (HMW) DOM to absorb light at longer wavelengths, compared to LMW DOM. Some fraction of CDOM is fluorescent and is mainly associated with aromatic molecular structures. This part of DOM is referred to as FDOM and is used to infer DOM quality (Coble, 1996; Zsolnay et al., 1999; Jørgensen et al., 2011; Catalá et al., 2016; Loginova et al., 2016). Thus, 3D fluorescence spectroscopy, followed by parallel factor analysis (PARAFAC), has been recognised as a useful tool for distinguishing between different organic matter pools (Murphy et al., 2013). Fluorophores that are excited and emit at UV wavelengths are often referred to as amino-acid-like DOM. Components that are excited at UV but emit at visible wavelengths are mainly referred to as humic-like or fulvic-like DOM (e.g. Coble, 1996; Murphy et al., 2014, and references therein). CDOM distributions in sediment cores from the Chukchi Sea suggested that anoxic sediments serve as a production site of humic-like substances and a potential source of altered DOM for the water column (Chen et al., 2016). In turn, FDOM measurements made during incubations of sediment cores (Yang et al., 2014) indicated that DOM released into the overlying water might be further altered by microbial communities, serving as a source of bioavailable organic matter. In the ETSP off Peru, fine-scale spatial resolution FDOM measurements suggested DOM release from anoxic sediments into the water column (Loginova et al., 2016). The high FDOM fluorescence associated with the benthic release of DOM even reached the euphotic zone, likely influencing organic carbon turnover of the whole water column. The sediment release of DOM could potentially serve as an important carbon and N source (e.g. Moran and Zepp, 1997) and reduce the penetration depth of light in the water column (e.g. Belzile et al., 2002), potentially affecting phototrophic pelagic microbial communities and hence influencing biogeochemical processes of the water column. However, still little is known about the release of pore water DOM and its reactivity in particular in the ETSP off Peru. In this study, we combine measurements of diffusive and in situ net fluxes of DOC and DON, and we interpret those fluxes in relation to DOM optical properties. Our objectives are to provide a deeper understanding of DOM cycling in Peruvian sediments and across the sediment–water interface.
Dale et al. (2015)Table 1Stations and instruments deployed during our study on the Peruvian margin.
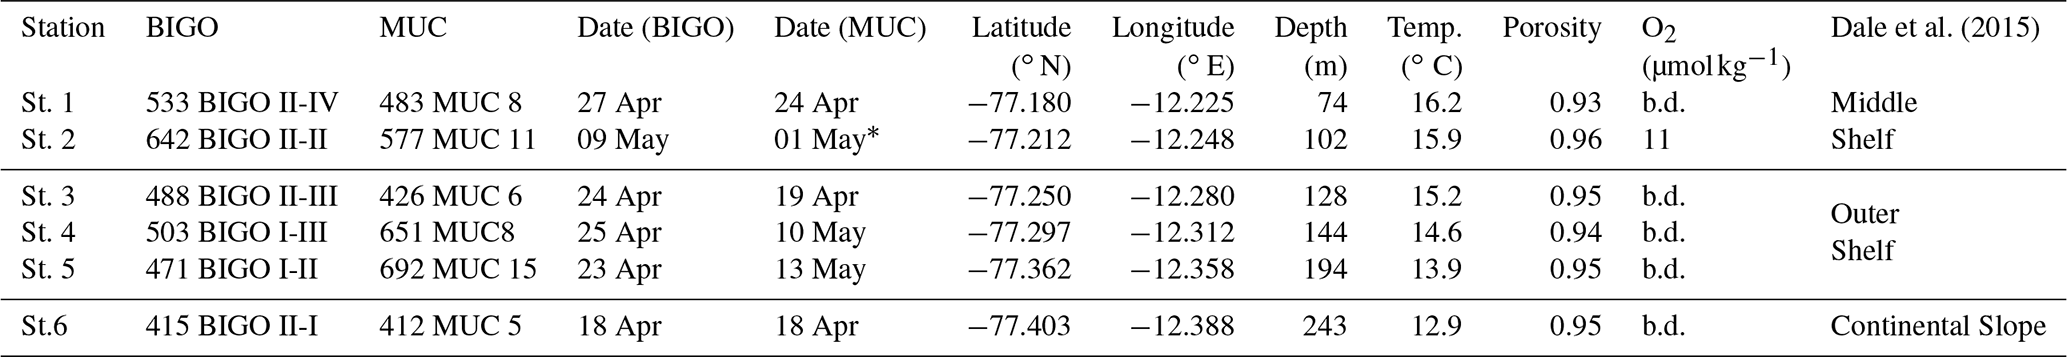
* concentrations were measured at 787MUC33 on 20 May at 12.247∘ S and 77.212∘ W. Station depth was recorded from the ship winch. Bottom water temperature and O2 are recorded by conductivity, temperature and depth profiler (CTD; Sea-Bird (SBE) 9-plus, Sea-Bird Electronics Inc., USA). “b.d.” stands for “below detection”. Detection limit of O2 is 5 µmol kg−1 (Dale et al., 2015). Porosity is given for the upper 0.5 cm.
2.1 Study area
Sediment sampling was carried out in April–May 2017 during the research cruises M136 and M137 to the Peruvian OMZ on board RV Meteor. The sampling area was located between 12–12.2∘ S and 77.1–77.3∘ W (Fig. 1). In total, six stations were sampled along the transect at 12∘ S (see Table 1) on the middle shelf, outer shelf and continental slope (Dale et al., 2015, 2016; Sommer et al., 2016).
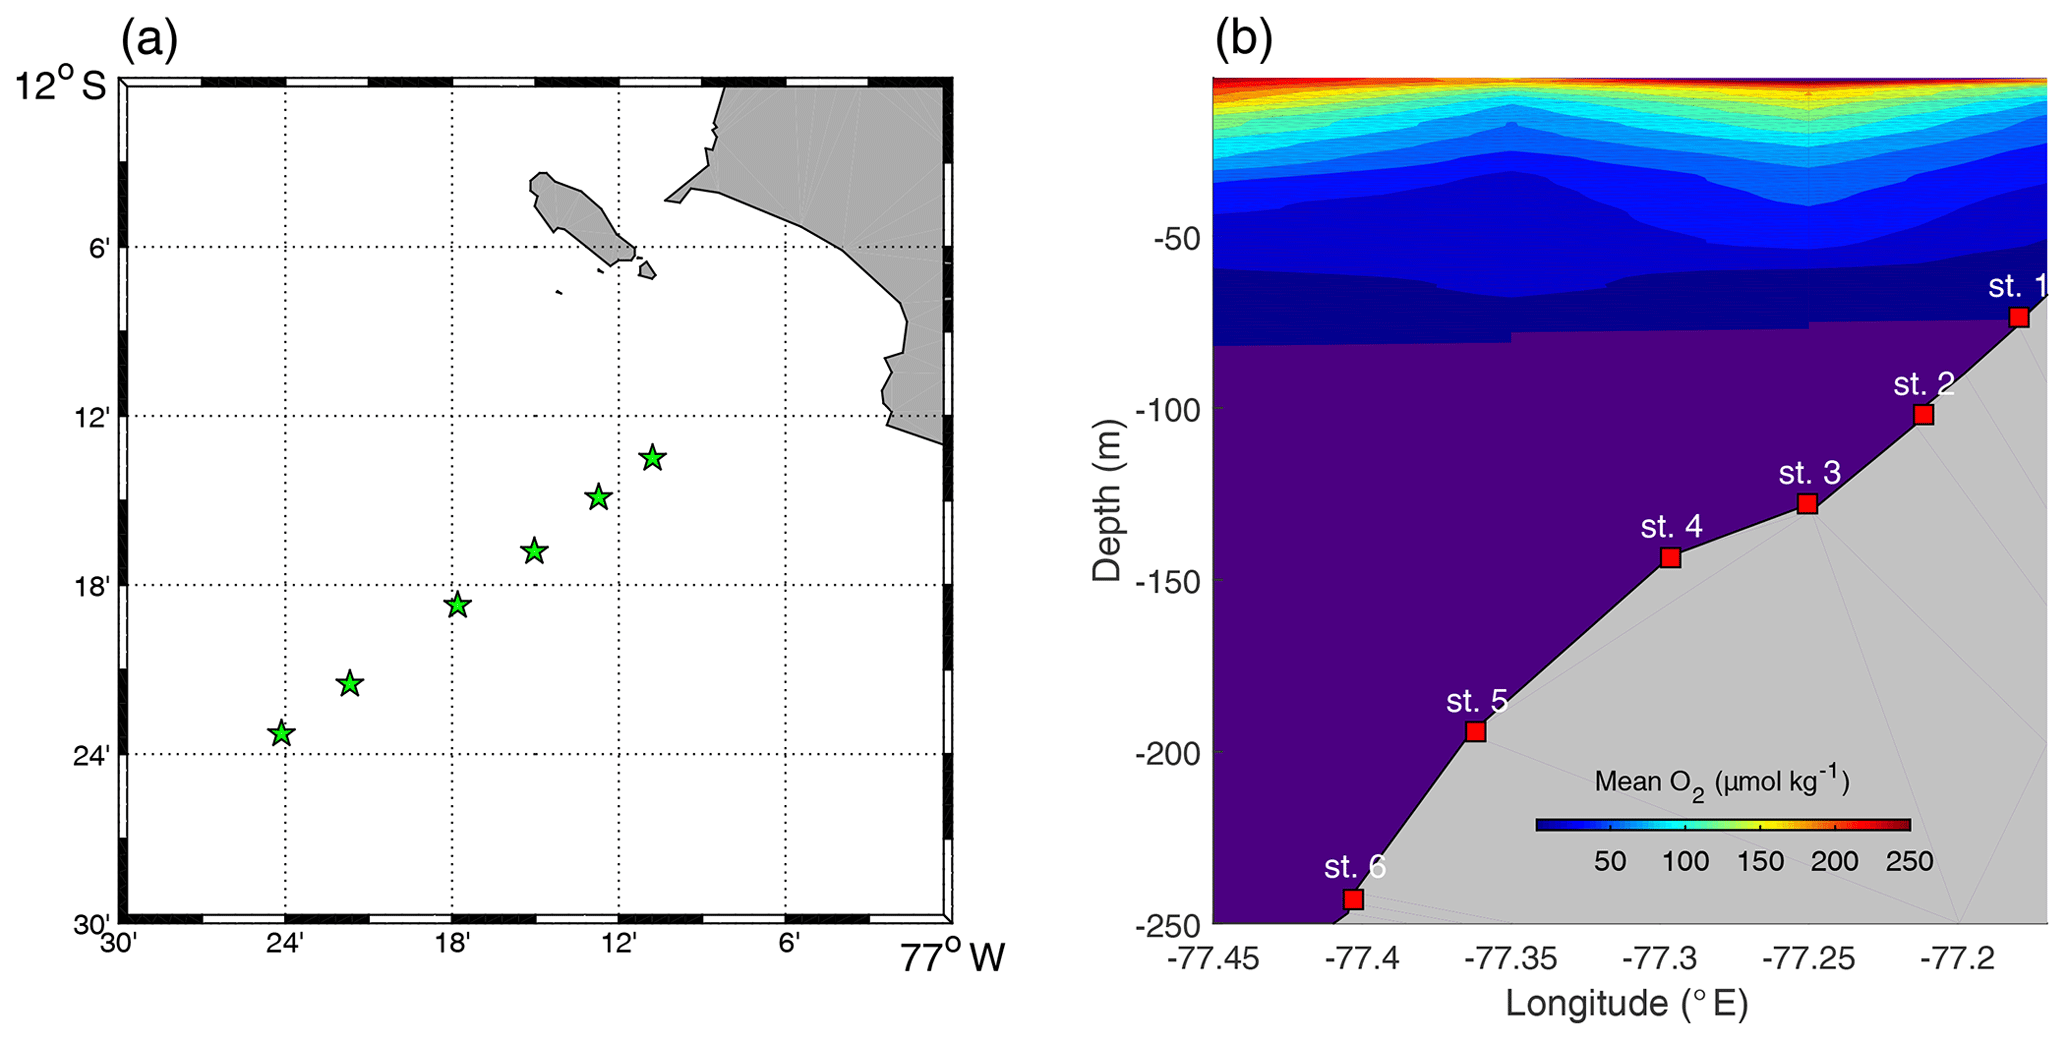
Figure 1(a) Distribution of sampling stations. (b) Mean oxygen plot (the O2 values were averaged over 1 m depth and 0.1∘ longitude intervals). The indigo colour represents values below 1 µmol kg−1.
During the study, the water column at the sampling stations was subjected to a consistent poleward flow ranging from 0.1 to 0.5 m s−1 (Lüdke et al., 2019). Low-oxygen (≪5 µmol kg−1) waters were observed above the sediment, with the exception for St. 2, where the O2 concentration was slightly above 10 µmol kg−1. This may have been a remnant of the coastal El Niño that occurred 3–4 months prior to our fieldwork (Rodríguez-Morata et al., 2019) or a result of intensification of poleward flow, observed in May 2017 (Lüdke et al., 2019). High concentrations of water column nitrate () and nitrite () were observed at stations deeper than 100 m water depth, while at shallower stations ammonium () was the dominant dissolved inorganic N component. Thus, concentrations up to 1.2–1.4 µmol L−1 were detected in the middle shelf stations (Lüdke et al., 2019).
Sediments at the sampling stations were fine-grained diatomaceous dark-olive anoxic muds (Gutiérrez et al., 2009; Mosch et al., 2012) with porosities ranging between 0.8 and 0.9 (Table 1). In previous studies, polychaetes and oligochaetes were found in the sampling area (Dale et al., 2015; Sommer et al., 2016). However, the sediment showed little evidence of strong mixing by bioturbation (Bohlen et al., 2011; Dale et al., 2015). Instead, the sediments were densely colonised by mats of large filamentous sulfur bacteria of the genera Thioploca spp. and Beggiatoa spp. (Gutiérrez et al., 2009; Mosch et al., 2012). Dale et al. (2015) reported that mats of these sulfide-oxidising bacteria cover up to 100 % of the sediment surface at the shallower stations extending their trichomes 2 cm into the water column to access bottom water . They could be observed from the sediment surface down to 20 cm sediment depth. At the offshore stations, bacterial mats of several decimetres in diameter were covering up to 40 % of the sediment surface. Their occurrence was related to high organic carbon rain rates, which ranged from 10 on the continental slope to 80 on the shallowest shelf station (Fig. S1 in the Supplement). Furthermore, the region was characterised by substantial organic matter utilisation (Dale et al., 2015). Thus, despite the high sediment accumulation rates and POC content of the sediments, the high organic matter respiration, as follows from large sediment DIC (Dale et al., 2015) and (Sommer et al., 2016) fluxes at middle shelf stations, led to a low percentage of carbon burial efficiency (∼17%), compared to the outer shelf and the continental slope (24 %–74 %) (Fig. S1). Sommer et al. (2016) and Dale et al. (2015) suggested spatial variability of biological N cycling in the area. Thus, outer shelf stations displayed the highest sediment uptake rate of and followed by high N2 outflux (Sommer et al., 2016). At shallower stations, and were entirely exhausted and excessively high fluxes of were observed (Sommer et al., 2016, Fig. S1). Those spatial variabilities in N fluxes were suggested to be a result of denitrification and anammox on the outer shelf and continental slope and DNRA in the middle shelf. A detailed description of the sediment and bottom waters at 12∘ S can be found in Dale et al. (2015, 2016) and Sommer et al. (2016).
2.2 Field sampling and sample preparation
Two benthic landers (Biogeochemical Observatory (BIGO) I and II) (Sommer et al., 2008) were deployed along the studied transect (see Table 1). Both were equipped with two circular flux chambers with an internal diameter of 28.8 cm. Volumes of the bottom water enclosed in the benthic chambers varied from ∼12 to ∼20 L during the study. Each BIGO chamber was equipped with a stirrer and eight glass syringes, which were filled sequentially to determine the net in situ flux of solutes across the sediment–water interface (Fig. S2). A detailed description of the BIGO lander can be found in Sommer et al. (2008) and Dale et al. (2014).
At each station, water from one BIGO chamber (chamber 2) was used for the DOM sampling. Samples for DOC, DON, and CDOM and FDOM were taken at ∼0.2, 4, 9, 12, 17, 21, 25 and 30 h after the beginning of the sediment enclosure.
All samples were passed through pre-washed (60 mL of ultrapure water) cellulose acetate (CA) membrane syringe filters (0.2 µm). The first 5 mL of the filtrate was discarded to waste before filling the sample into storage vials. Several types of filters (PES, nylon, CA and regenerated cellulose (RC)) were tested for potential DOC and total dissolved nitrogen (TDN) contamination before the cruise. CA and RC filters produced minimal background concentrations for both parameters after rinsing with 60 mL of ultrapure water (see Fig. S3). CA filters were chosen over RC due to their lower binding affinity to macromolecules and proteins.
Filtered samples were filled into pre-combusted (450 ∘C, 8 h) amber glass vials for CDOM and FDOM and into pre-combusted (450 ∘C, 8 h) clear glass ampoules for DOC and DON analyses. The latter samples were fixed with 20 µL of ultra-pure HCl (30 %: Merck Chemicals GmbH) and flame sealed before storage. All samples were stored (1–2 months) at +4 ∘C in the dark pending analysis in the home laboratory.
The pore water DOM distribution and properties, as well as diffusive fluxes, were quantified by analysing DOC, DON, CDOM and FDOM in sediment cores obtained using multicorers (MUCs). Retrieved sediments were immediately transferred to the cool onboard room (10–15 ∘C) and processed under anoxic conditions within a few hours using an argon-filled glove bag. One sediment core from each station was sectioned into 12 slices over intervals ranging from 1 to 3 cm (Fig. S2). Sediments were transferred into acid-cleaned (10 % HCl) dry polypropylene (50 mL) centrifugation tubes and spun in a refrigerated centrifuge for 20 min at 4500 rpm. The supernatant was then passed through cellulose acetate membrane syringe filters (0.2 µm) into pre-combusted (450 ∘C 8 h) clear glass ampoules for DOC and DON and amber glass vials for CDOM and FDOM. The samples were conserved and stored as described above.
Studies conducted in areas with abundant macrofauna suggested that pore waters isolated by centrifugation exhibit higher DOC concentrations compared to non-invasive methods, such as isolation by a sediment sipper sampler (sip-isolation) (Alperin et al., 1999). Macrofauna cell rupture during centrifugation was suggested to influence the extracted DOC, and the removal of macrofauna from sediments before centrifugation and whole-core squeezing was shown to reduce elevated DOC concentrations (Martin and McCorkle, 1993). Our study site did not exhibit signatures of significant bioturbation (Dale et al., 2015). Accordingly, DOC concentrations at sites similar to our study area (low oxygen – low bioturbation), which were extracted by centrifugation, showed agreement either with those obtained by the sip-isolation method (Komada et al., 2004) or with those obtained from in situ and ex situ incubations (Holcombe et al., 2001). Furthermore, Holcombe et al. (2001) suggested that sip-isolated pore water DOC gradients may lead to underestimation of diffusive DOC fluxes in low-bioturbation regions. Thus, varying strength of organic matter–mineral associations may create different solute reservoirs around the surface of a mineral. The sip-isolation method was suggested to extract only loosely bound DOM out of the marine sediments, while centrifugation would sufficiently perturb sediments and sample the majority of the pore water DOM that may efflux out of the sediment. In connection with the above, the centrifugation method was preferred as a pore water extraction method for DOM isolation in this study.
2.3 Discrete sample analyses
CDOM absorbance was measured with a Shimadzu® 1700 UV–vis double‐beam spectrophotometer using a 1 cm Quartz SUPRASIL® precision cell (Hellma® Analytics). Absorbance spectra were recorded at 1 nm wavelength intervals from 230 to 750 nm against Milli-Q water as a reference. CDOM absorbance spectra in the wavelength interval from 275 to 400 nm were corrected for particle scattering (e.g. Nelson and Siegel, 2013) and recalculated to absorption, according to Bricaud et al. (1981). This method has a detection limit of ∼0.001 absorption units (that may be referred to as ∼0.5 m−1) and a precision <5%, estimated as the maximal standard deviation of CDOM absorbance spectra in the wavelength interval from 275 to 400 nm divided by the mean value of three repeated measurements. We used the absorption coefficients at 325 nm (aCDOM(325)) to express CDOM “concentrations”, as this one is mainly used for open ocean areas (Nelson and Siegel, 2013). The spectral slope for the interval between 275 and 295 nm (S275−295) was used to infer relative changes in DOM bulk quality, i.e. DOM relative molecular weight (Helms et al., 2008). S275−295 were calculated following Helms et al. (2008) using log-transformed linear regression.
FDOM was analysed by excitation–emission matrix (EEM) spectroscopy on a Cary Eclipse fluorescence spectrophotometer (Agilent Technologies) equipped with a xenon flash lamp. The fluorescence measurements for samples were done in a four‐optical-window 1 cm Quartz SUPRASIL® precision cell (Hellma® Analytics). Blank and water Raman scans were performed daily using an ultra‐pure water standard sealed cell (3/Q/10/WATER; Starna Scientific Ltd). The experimental wavelength range for sample scans and ultra‐pure water scans was 230 to 455 nm in 5 nm intervals on excitation and 290 to 700 nm in 2 nm intervals on emission. Water Raman scans were recorded from 285 to 450 nm at 1 nm intervals for emission at the 275 nm excitation wavelength (Murphy et al., 2013). All fluorescence measurements were conducted at 20 ∘C, controlled by a Cary single-cell peltier accessory (Varian), PMT 900 V, with 0.2 s integration times and a 5 nm slit width on excitation and emission monochromators. The precision of this method does not exceed 3 % if estimated as a standard deviation of Raman peaks at 275 nm of each measurement day, divided by the mean value. The fluorescence EEMs were corrected for spectral bias, background signals and inner filter effects and normalised to the area of ultra-pure water Raman peaks. All samples were calibrated against a quinine sulfate monohydrate dilution series, performed once during sample analyses. EEMs were analysed by PARAFAC (Stedmon and Bro, 2008) and validated by split-half analysis using the drEEM toolbox for MATLAB after Murphy et al. (2013). Four FDOM components that were identified during the PARAFAC analyses are expressed in quinine sulfate equivalents (QSEs).
Samples for inorganic N compounds in the benthic lander samples (, and ) and the pore waters () were analysed following standard techniques after Hansen and Koroleff (2007) and will be published elsewhere (Clemens et al., 2020). and concentrations in the pore waters were assumed to be negligible (Dale et al., 2016) and not analysed. Detection limits for the determination of , and were 0.05, 0.01 and 0.5 µmol L−1, respectively.
DOC samples were analysed by the high-temperature catalytic oxidation (TOC-VCSH, Shimadzu) with a detection limit of 1 µmol L−1, as described in detail by Engel and Galgani (2016). Calibration of the instrument was performed every second week using six standard solutions of 0, 500, 1000, 1500, 2500 and 5000 µg C L−1, which were prepared using a potassium hydrogen phthalate standard (Merck 109017). Before each set of measurements, a baseline of the instrument was set using ultrapure water. The deep-sea standard (Dennis Hansell, RSMAS, University of Miami) with known DOC concentration was measured after setting the baseline to verify accuracy by the instrument. Typically, the precision of the method did not exceed 4 %. Furthermore, two control samples with known concentrations of DOC were prepared for each day of measurement using a potassium hydrogen phthalate standard (Merck 109017). The DOC concentrations of those control samples were typically within the range of samples' concentrations and were measured at the time of sample analyses to control baseline flow during measurements. The DOC concentration was determined in each sample out of five to eight replicate injections.
A TNM-1 N detector of the Shimadzu analyser was used to determine TDN in parallel to DOC with a detection limit of 2 µmol L−1 (Dickson et al., 2007). Calibration was performed simultaneously with the calibration of carbon detector using standard solutions of 0, 100, 250, 500 and 800 µg N L−1, which was prepared using potassium nitrate Suprapur (Merck 105065). The deep-sea standard (Dennis Hansell, RSMAS, University of Miami) with the known concentration of TDN was measured daily to verify the accuracy of the instrument. The precision of the method did not exceed 2 %, estimated as the standard deviation of five to eight injections divided by the mean value. Concentrations of DON were calculated as a difference of TDN and the sum of concentrations of inorganic N components. The differences of analytical methods for the determination of TDN and dissolved inorganic N species, particularly in systems dominated by dissolved inorganic N, may induce negative values during the quantification of DON (Westerhoff and Mash, 2002). In this case, DON concentrations were set to “0” and, therefore, were excluded from calculations of DOC ∕ DON ratios. In the text, those values were presented as “below detection limit (b.d.l.)”.
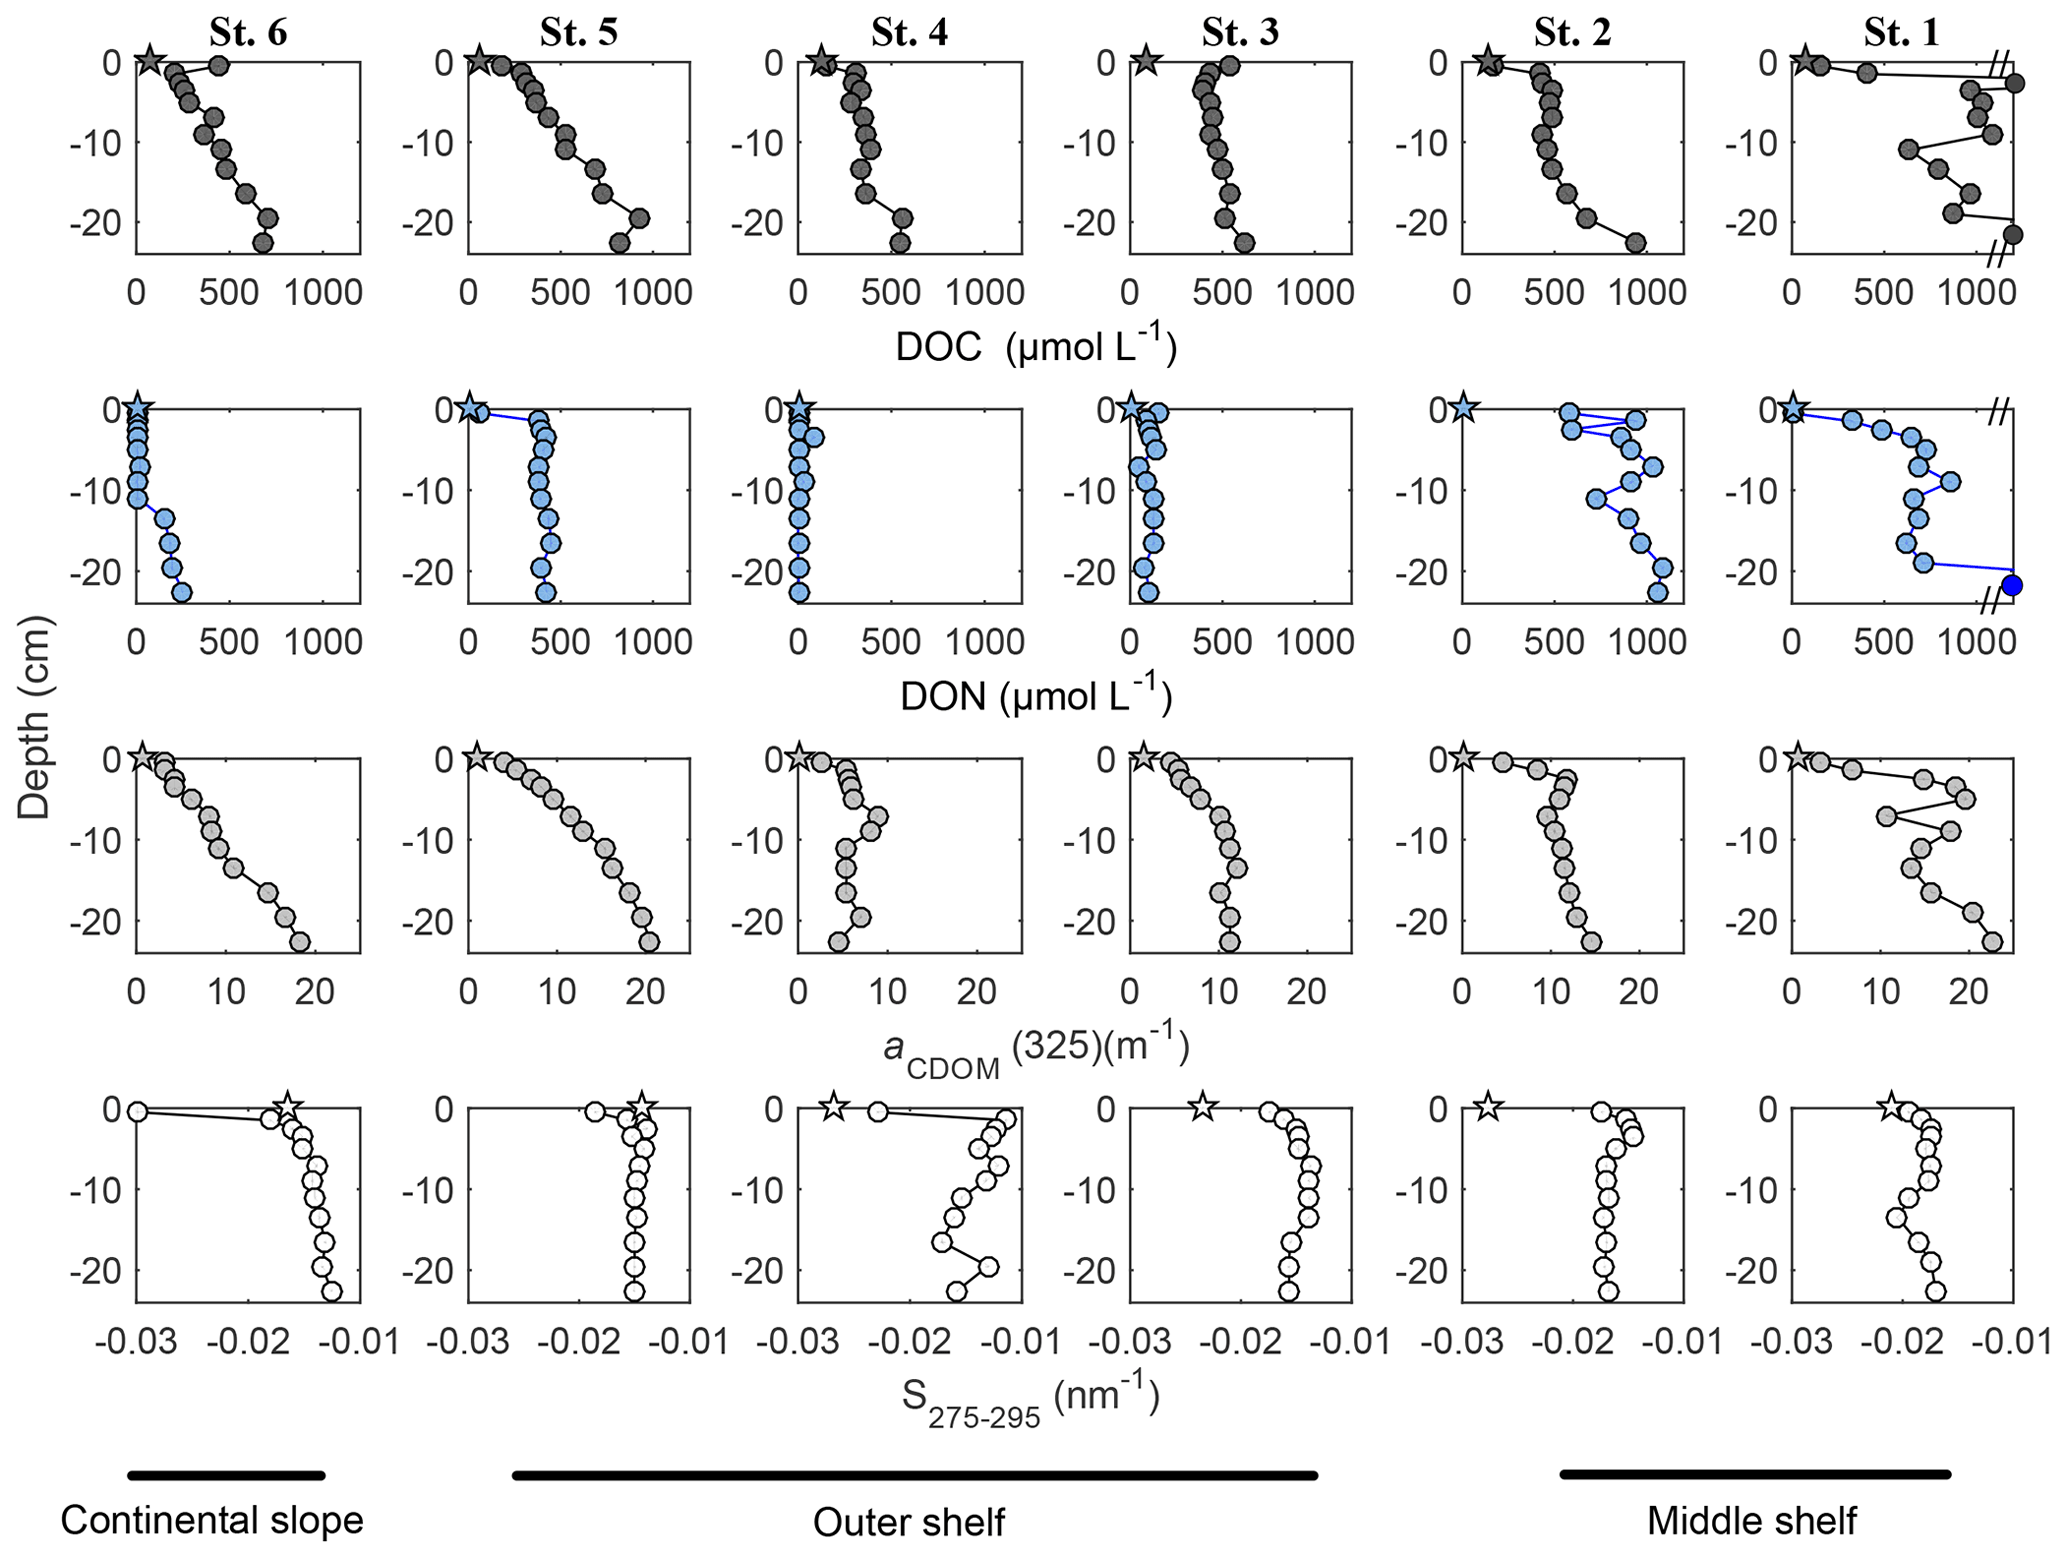
Figure 2Pore water DOC (dark grey symbols), DON (blue symbols), aCDOM(325) (light grey symbols) and S275−295 (white symbols) distribution within the sediment pore waters: depth profiles. Circles represent concentration/value, measured in the pore water sample; stars represent the initial concentration/value within BIGO chambers. DOC concentrations after axis break are 2010 and 2568 µmol L−1 at 3 and 22 cm sediment core depth, respectively. DON concentration after axis break is equal 2807 µmol L−1
2.4 Evaluation of DOC and DON fluxes
In this study, diffusive and in situ net DOC and DON fluxes were quantified. The initial concentrations in BIGO chambers and pore water solute concentrations from the uppermost slice of the sediment core (0 to 1 cm depth) were used for the flux calculations. Thus, the diffusive fluxes of DOC (JDOC(Diff.)) and DON (JDON(Diff.)) were estimated by applying Fick's first law:
where Js(Diff.) is a diffusive flux of a solute, ϕ is the sediment porosity, is the gradient of DOC (DON) concentration over the investigated depth interval (0 to 1 cm) and Ds is a bulk sediment diffusion coefficient. Ds was previously demonstrated to be dependent on the sediment formation resistivity factor (F) (Ullman and Aller, 1982), as well on the average molecular weight of DOM (Burdige et al., 1992; Balch and Guéguen, 2015). In this study, we calculate Ds using F that equals ϕ−3 (Ullman and Aller, 1982), as ϕ measured at 12∘ S exceeded 0.8–0.9 (Table 1). The molecular size fractionation was not addressed during this study; therefore, we assumed that DOM molecular weight varied in the range from 0.5 to 10 kDa. This assumption resulted in D0 varying from to (Balch and Guéguen, 2015). This variance represented one of the major drivers of the estimated diffusive DOC (DON) flux variability. Therefore, the calculation of Js(Diff.) was done for the whole range of D0 with an increment of . Thus, Js(Diff.) presented in this paper is a resulting mean value of all the calculated Js(Diff.), and its variability is expressed as a standard deviation.
Net in situ fluxes of DOC (JDOC(Net)) and DON (JDON(Net)), measured in BIGO chambers, were evaluated as
where Js(Net) is the net in situ flux of a solute, V is the chamber volume (m3), A is the chamber area (m2) and is the DOC (DON) concentration gradient over the time of the sediment enclosure (). The gradient was obtained by linear regression analyses (“polyfit” first-order, MATLAB, The MathWorks Inc.) of the DOC (DON) concentrations over time. The error of the linear regression was used as a representation of the standard deviation of the evaluated net fluxes.
In this study, fluxes directed out and into the sediment are reported as positive and negative values, respectively.
3.1 DOC and DON distribution and fluxes
Pore water DOC generally accumulated with depth in the sediment (Fig. 2). The highest concentrations of DOC were measured at the middle shelf at station 1 (St. 1), ranging from 152 µmol L−1 at 0.5 cm to a maximum of 2.6 mmol L−1 at 22.5 cm of sediment depth. Pore water DOC concentrations and gradients decreased gradually towards station 4 (St. 4), where DOC concentrations ranged from 122 µmol L−1 at 0.5 cm to 544 µmol L−1 at 22.5 cm of sediment depth. Further offshore, pore water DOC concentrations and gradients increased at station 5 (St. 5) and station 6 (St. 6), ranging from 177 µmol L−1 at 0.5 cm to 823 µmol L−1 at 22.5 cm and from 210 µmol L−1 at 1.5 cm to 702 µmol L−1 at 19.5 cm, respectively. The highest concentrations of DON were measured at the middle shelf St. 1 and station 2 (St. 2) (Figs. 2, S4, S5). The DON concentrations in pore waters at these stations were ranging from b.d.l. at 0.5 cm to a maximum of 2.6 mmol L−1 at 22.5 cm and from 580 µmol L−1 at 0.5 cm to 1.1 mmol L−1 at 19.5 cm of sediment depth, respectively. Similarly to DOC, pore water DON concentrations decreased towards St. 4, where they ranged from b.d.l. at surface sediment to 85 µmol L−1 at 3.5 cm sediment depth and then increased again at St. 5 (64–450 µmol L−1) and St. 6 (b.d.l.–248 µmol L−1).
In general, sediment pore waters at 12∘ S exhibited low DOC ∕ DON ratios. Generally, the median elemental ratio increased offshore from the minimum at St. 2 (DOC ∕ DON of <1) to the maximum at St. 4 (median DOC ∕ DON ∼12) and then decreased again at St. 5 (median DOC ∕ DON ∼1) and St. 6 (median DOC ∕ DON ∼3) (Fig. S6).
No apparent differences in DOC concentrations within benthic chambers were observed between stations (Fig. 3). The average concentrations for all the incubation chambers over time were 92±22 µmol L−1. Furthermore, DOC did not accumulate linearly over time at some stations (Fig. 3). Similarly, DON concentrations varied from b.d.l. to ∼15 µmol L−1 in the chambers (Fig. 3), resulting in much higher DOC ∕ DON ratios than measured in the pore waters. Median DOC ∕ DON ratios in all chambers calculated over time were >5, gradually decreasing from a maximum at St. 1 (median DOC ∕ DON ∼30) towards median DOC ∕ DON ∼8.5 offshore (Fig. S6).
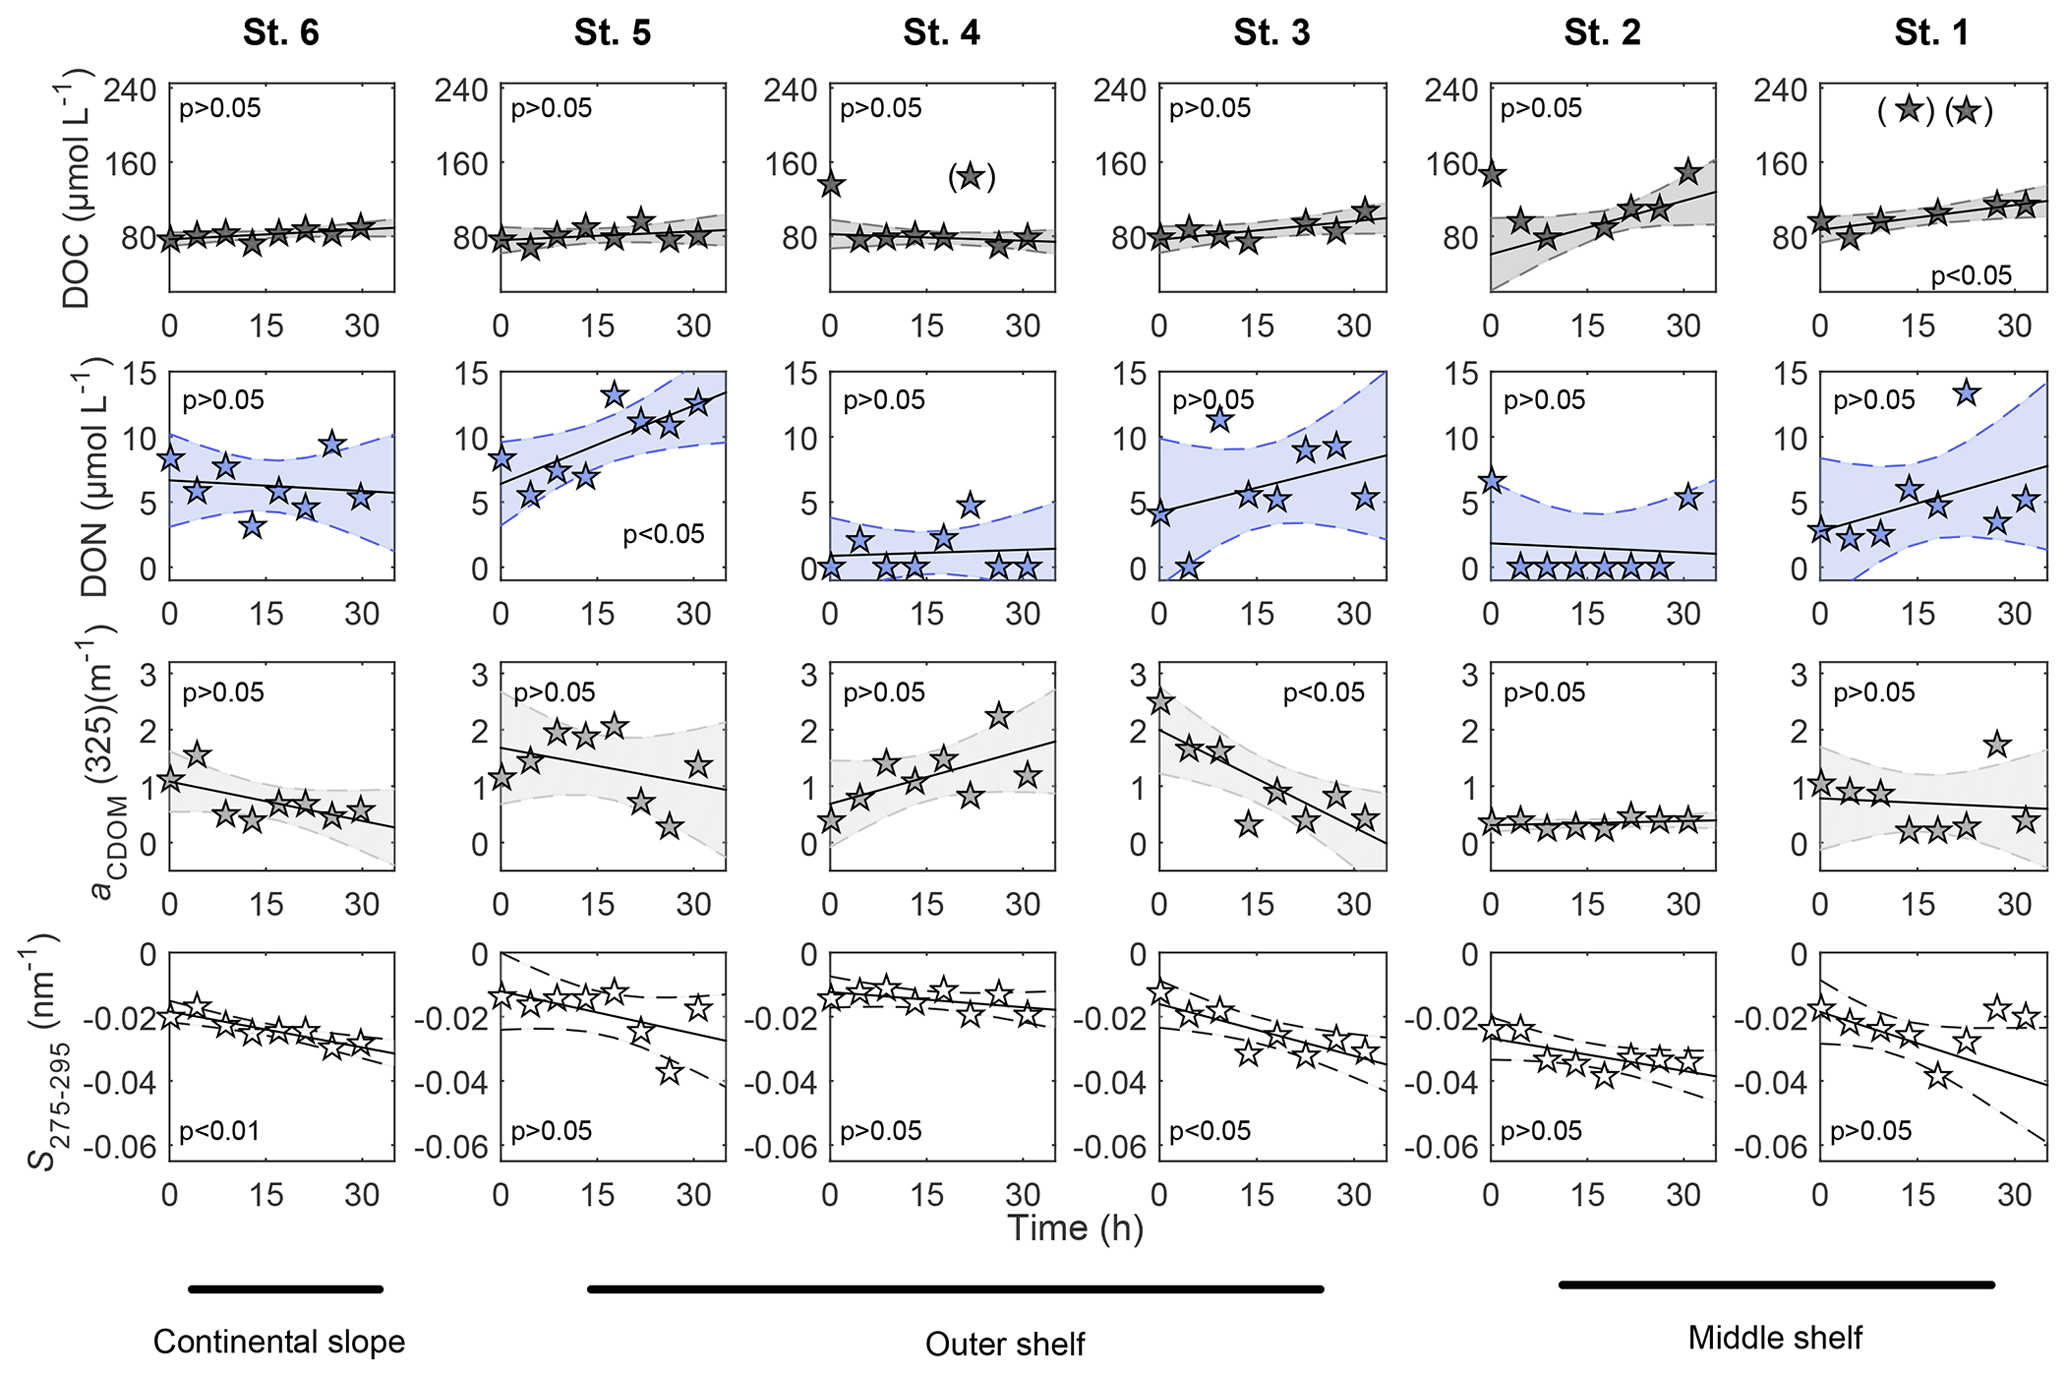
Figure 3Distribution of DOC and CDOM parameters, aCDOM(325) and S275−295, measured in BIGO chambers over time. Polynomial fit (first order) was used for linear regression analyses: t0 and data included in brackets were excluded from the analyses.
The diffusive DOC fluxes on the outer shelf and continental slope stations varied from a minimum of 0.2±0.1 at St. 4 to a maximum of 2.5±1.3 at station 3 (St. 3) (Fig. 4). Net in situ DOC fluxes determined with benthic chambers were lower than diffusive fluxes on those stations, varying from at St. 4 to 0.8±0.9 at St. 3. Net in situ DOC fluxes on the middle shelf stations were higher than fluxes estimated by Fick's law. Thus, the diffusive DOC fluxes were varying from 0.2±0.1 to 0.4±0.2 and net in situ DOC values were ranging between 1.1±0.9 and 2.3±2.3 . Diffusive DON fluxes ranged from at St. 1 and St. 6 to 3.3±1.7 at St. 2. Similar to DOC, net in situ DON fluxes were lower than diffusive DON fluxes on the outer shelf and continental slope stations, ranging from at St. 6 to 0.3±0.3 at St. 5. In contrast to DOC fluxes, the diffusive DON flux on one of the middle shelf stations (St. 2) was also higher than the net in situ DON flux, exhibiting 3.3±1.7 and , respectively. At St. 1 both diffusive and net in situ DON flux estimates were very low. They displayed and 0.08±1.4 , respectively. Despite the clear apparent distinction between the different flux estimates for both, DOC and DON, no statistical differences were found between them at each station (p>0.05, Mann–Whitney rank sum test, SigmaPlot, Systat Software).
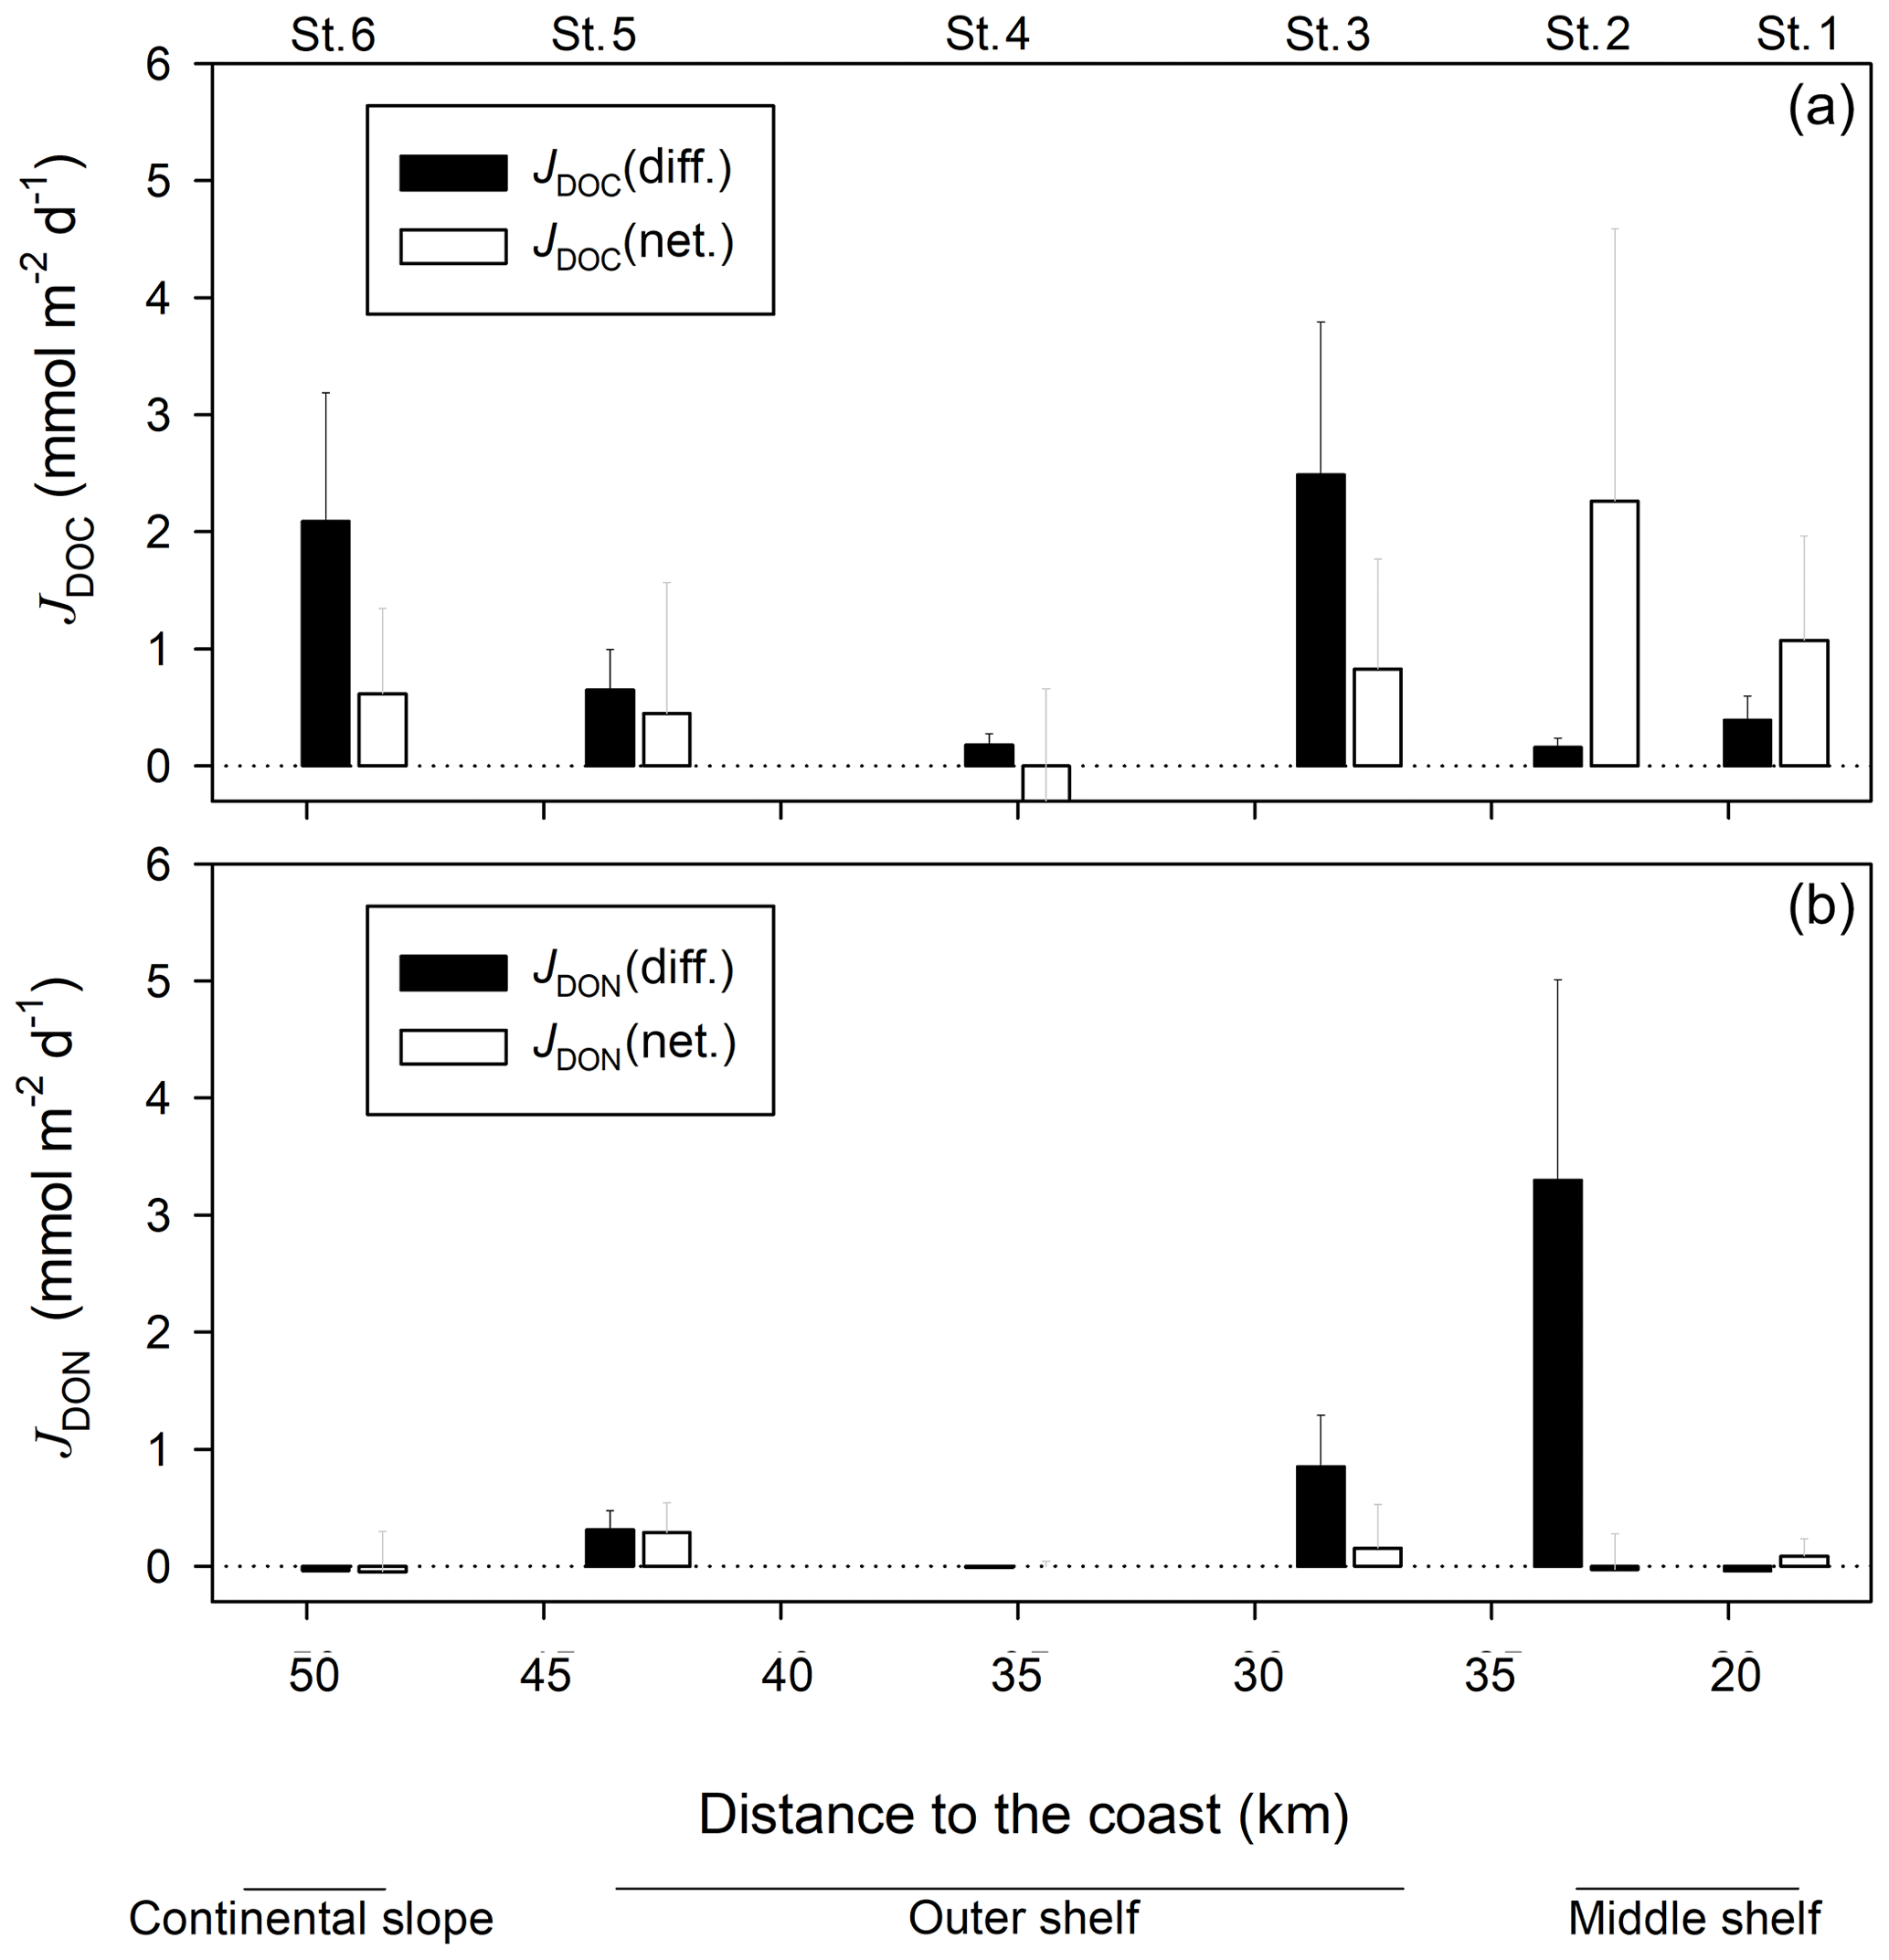
Figure 4Diffusive and in situ net DOC (a) and DON (b) fluxes, evaluated along the 12∘ S transect during this study.
3.2 Optical properties of DOM
To address DOM quality, CDOM and FDOM fluorescence intensities were analysed from the sediment pore waters and the BIGO chambers.
In the pore waters, CDOM absorption coefficients, aCDOM(325), exhibited a similar pattern to DOC distribution (Fig. 2). The highest values of aCDOM(325) were measured at St. 1. They ranged from 3.2 m−1 at 0.5 cm to 22.8 m−1 at 22.5 cm of sediment depth. The lowest values of aCDOM(325) were measured at St. 4, ranging from 2.7 m−1 at 0.5 cm to 8.9 m−1 at 7 cm of sediment depth. Further offshore, at St. 5 and St. 6 values of aCDOM(325) were higher than at St. 4.
In the benthic chambers, at the outer shelf and continental slope, aCDOM(325) generally ranged from 0.3 to 2.5 m−1 (Fig. 3), exhibiting different trends. Thus, an apparent decrease in aCDOM(325) over time occurred at St. 3, St. 5 and St. 6, while at St. 4 aCDOM(325) dynamics suggested an apparent accumulation of CDOM. The middle shelf stations, St. 1 and St. 2, displayed lower variance of aCDOM(325). It ranged from 0.1 to 1 m−1 over time and exhibited no visible trends (Fig. 3, Table S1).
The CDOM spectral slope, S275−295, in the pore waters, increased with depth in all sediment cores, displaying the highest values ( nm−1) at St. 4 and the lowest values at St. 1 ( nm−1). At St. 1, the pore water S275−295 values were comparable to the initial values of S275−295 in the BIGO benthic chambers ( nm−1) (see Figs. 2 and 3).
In the BIGO chambers, the highest S275−295 were observed at the beginning of the sediment enclosure, and an apparent S275−295 decrease occurred over time (Fig. 3). The decrease in S275−295 was steeper at stations with higher pore water DOC content. Thus, the fastest change in S275−295 occurred at St. 1 ( ), whereas the slowest change was found at St. 4 ( ) (Fig. 3, Table S1 in the Supplement).
FDOM spectroscopy and PARAFAC analyses allowed four independent fluorescent components to be distinguished (Fig. 5). FDOM components that are excited at UV and emit in the visible wavelength range were previously referred to as humic-like substances (e.g., Coble, 1996; Murphy et al., 2013, 2014; Loginova et al., 2016, and references therein). Here, two fluorescent components, FDOM component 1 (Comp. 1) and FDOM component 2 (Comp. 2), with excitation and emission (Ex/Em) of 370∕464 nm and 290–325∕400 nm, respectively, were identified and referred to as humic-like components (Fig. 5). Amino-acid-like substances are the second group of well-determined FDOM components (e.g., Coble, 1996; Murphy et al., 2013, 2014; Loginova et al., 2016, and references therein) corresponding to molecules that are excited and emit in the UV wavelength range. Thus, FDOM component 3 (Comp. 3) and FDOM component 4 (Comp. 4), with Ex/Em of 290∕340(684) nm and 275∕310(600) nm, respectively, were assumed to represent proteinaceous DOM (Fig. 5). During this study, humic-like components showed similar trends to DOC and aCDOM(325) in the pore waters. Their fluorescence intensified with sediment core depth and decreased offshore with a minimum fluorescence at St. 4 (Fig. 6). Amino acid-like Comp. 3 and Comp. 4 were also increasing in the pore waters with depth but were generally depleted throughout the sediment except for St. 1, where their fluorescence reached the max. 6 QSE and max. 1.7 QSE, respectively (Fig. 6).
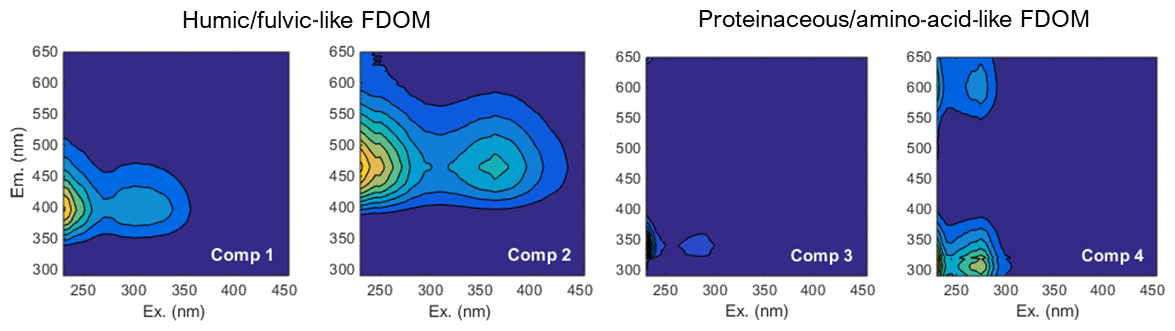
Figure 5Four components, which were found and validated by PARAFAC analyses after Murphy et al. (2013)
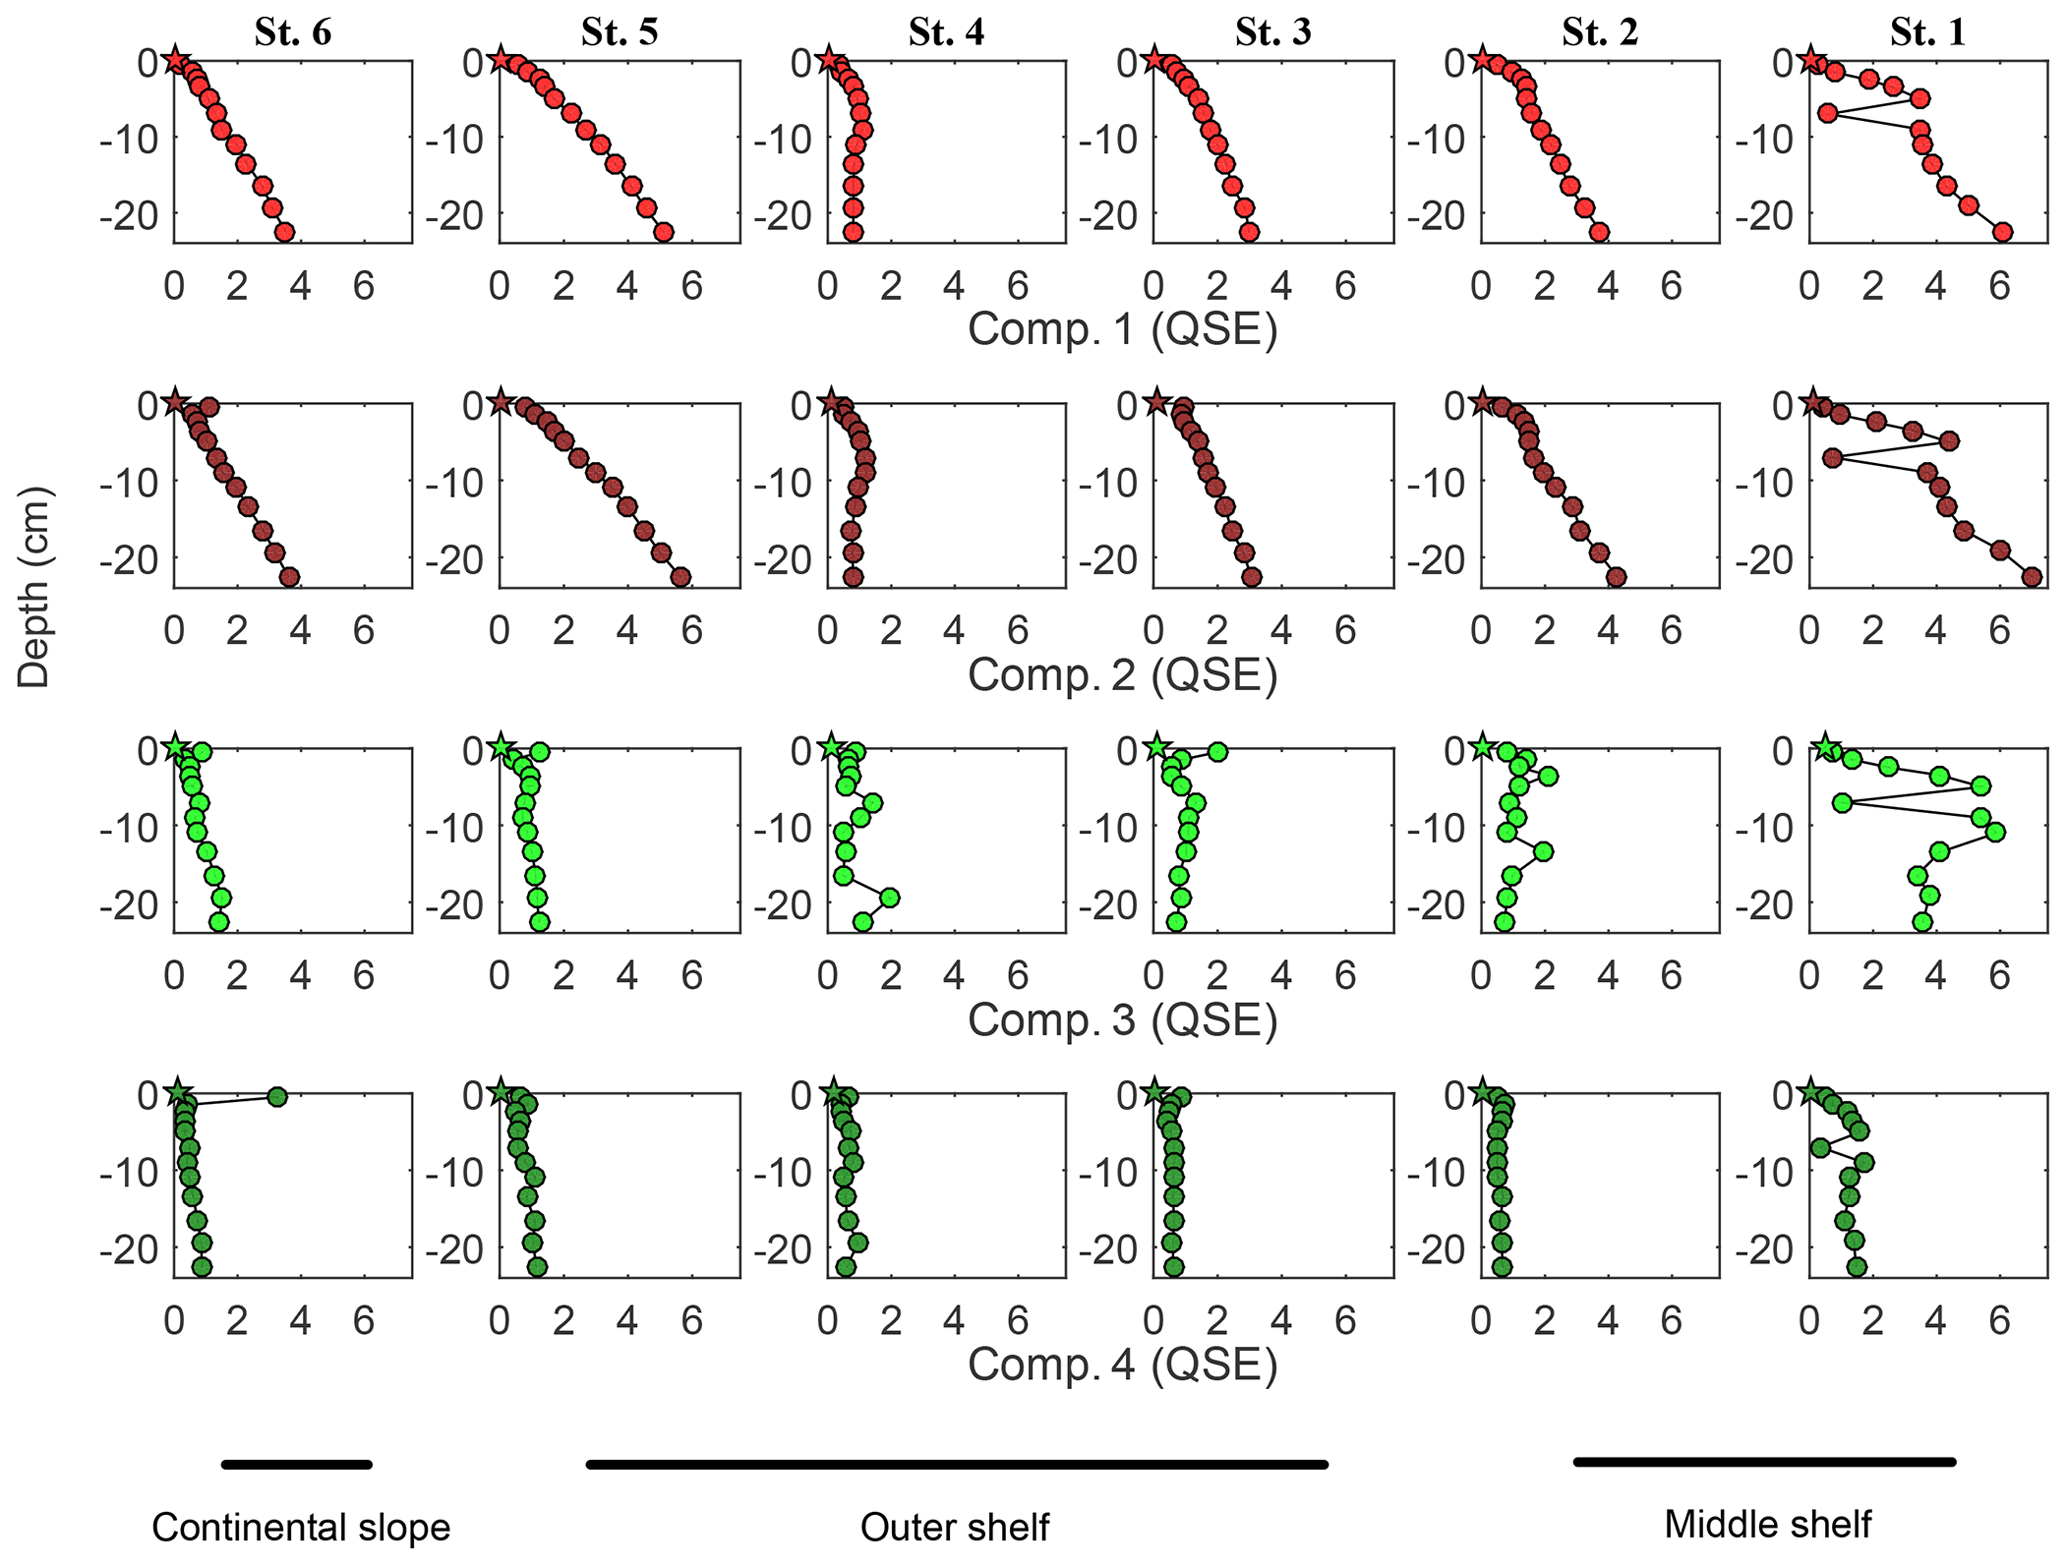
Figure 6Pore water FDOM component distribution within the sediments: depth profiles. Humic-like Comp. 1 and Comp. 2 represented by light and dark red symbols, respectively. Amino-acid-like Comp. 3 and Comp. 4 represented by light and dark green symbols, respectively. Circles represent concentration/value, measured in the pore water sample; stars represent the initial concentration/value of the bottom water.
In the benthic chambers, all fluorescent component QSEs were nearly an order of magnitude lower than those in the pore waters. An apparent increase within the chambers was observed in the humic-like Comp. 1 and Comp. 2 and the amino-acid-like Comp. 4 (Fig. 7).

Figure 7Distribution of FDOM components, measured in BIGO chambers over time. Polynomial fit (first order) was used for linear regression analyses: t0 values were excluded from the analyses.
At St. 1, St. 3, St. 4 and St. 6, the Comp. 3 was slightly enhanced at the beginning of the sediment incubation followed by an apparent removal at a later stage. Among nearly all stations, the humic-like Comp. 1 and Comp. 2 and amino-acid-like Comp. 4 displayed similar gradients of ∼0.03, 0.06–0.08 and 0.03–0.04 QSE d−1, respectively. Exceptions were observed at St. 4, which displayed Comp. 1, Comp. 2 and Comp. 4 gradients of 0.001, 0.04 and −0.005 QSE d−1, respectively, and St. 1, where the gradients of Comp. 2 and Comp. 4 were ∼0.04 and ∼0.09 QSE d−1, respectively (Table S1).
4.1 Spatial variability of the DOM fluxes along the 12∘ S transect
Spatial variability of organic matter decomposition in sediments is a common feature in the world ocean (see Arndt et al., 2013, for an overview). This variability is naturally attributed to the efficiency of vertical transfer of POM to the sediment (e.g. Seiter et al., 2004; Marsay et al., 2015; Engel et al., 2017). Along 12∘ S, the highest sedimentation rates, estimated via 210Pbxs activity, were reported for the middle shelf St. 1 and St. 2 (Fig. S1), while St. 4 displayed the lowest sedimentation rates possibly caused by an inhibition of particle settling by bottom currents (Dale et al., 2015). The highest accumulation of POM along 12∘ S was also observed at St. 1 and St. 2 (Fig. S1) even though the organic carbon burial efficiency exhibited lower values at the middle shelf stations than at the stations offshore (Dale et al., 2015). Lower carbon burial efficiency in combination with very high rates of organic matter remineralisation, as follows from extremely high DIC and benthic fluxes (Dale et al., 2015; Sommer et al., 2016) (Fig. S1), suggests higher bioavailability of POM supplied to the middle shelf. Accordingly, in our study pore water DOM optical properties reflected the “freshest” character of organic matter at St. 1 and St. 2, where S275−295 values were similar to those in the water column (Fig. 3), and protein-like DOM fluorescence (Fig. 6) and DON were highly enriched (Fig. 3). Therefore, and in line with the previous findings, our data suggest that the middle shelf stations are supplied with more labile POM compared to the outer shelf stations. This labile POM, likely of proteinaceous origin (e.g. Faganeli and Herndl, 1991), is, in turn, rapidly reworked. Thus, in the middle shelf St. 1, despite the highest accumulation of POC (Dale et al., 2015) and elevated pore water DOC and especially DON concentrations (Figs. 2, S4), the diffusive fluxes of DOC and DON here were not highest on the transect (Fig. 4). Since high values of aCDOM(325) and protein-like FDOM have previously been related to labile DOM (Loginova et al., 2016), one may expect DOM with such characteristics to be rapidly reworked by heterotrophic microbial communities. Therefore, proteinaceous FDOM and aCDOM(325) nonlinear distribution over time might be a result, as of the low fluxes from the sediment, but also the signature of its rapid microbial utilisation (Komada et al., 2016). The strong decrease in S275−295 and the accumulation of humic-like substances observed at St. 1 during the incubations point to both a high benthic outflux of fresh bioavailable DOM at St. 1 and its rapid consumption and reworking at the sediment–water interface and in upper sediment. These results support the idea that microbial utilisation is controlled by the quality of the supplied organic matter (Pantoja et al., 2009; Le Moigne et al., 2017). At the same time, spatial variability of benthic fluxes could also be attributed to the spatially variable DOM recycling efficiencies of different biogeochemical processes. For instance, denitrification and anammox were found to be the major processes of N cycling in the outer shelf and on the upper continental slope, whereas the middle shelf stations had elevated rates of DNRA (Dale et al., 2016; Sommer et al., 2016). While the linkages between microbial N turnover and DOM fluxes are still not well understood, it is noteworthy that the middle shelf sediments were covered with Marithioploca mats that greatly affect the N and sulfur biogeochemical cycles and, potentially, DOM cycling and reactivity.
At St. 2, DON accumulated to higher levels within the pore waters than DOC and (see e.g. Fig. S4), leading to higher diffusive DON fluxes than those of DOC and to extremely low DOC ∕ DON ratios (Fig. S6). In agreement with this S275−295 revealed the lowest changes over time, suggesting that at St. 2 DOM in the benthic chamber remained “fresher” during the incubation, compared to other stations. Similar to that, proteinaceous Comp. 3, despite its generally low variability, exhibited the highest increase at St. 2, suggesting a relative accumulation of proteinaceous DOM in the corresponding chamber. Herewith, pore water DON concentrations generally seemed to be more responsive to fresh organic matter input (Dale et al., 2015), while DOC accumulated more steadily during organic matter degradation, as indicated by concentrations (Fig. S4). Those results are in line with the “decoupling” between DOC and DON remineralisation as previously suggested by Alkhatib et al. (2013). These authors suggested that the enzymatic hydrolysis of N-containing labile POM occurs at a higher rate than that of carbon-rich compounds, leading to a higher accumulation of DON over DOC in the pore waters. Furthermore, the dissolved by-products of bacterial activity are often found to be enriched in N, and therefore sediments with pronounced microbial activity show relatively low DOC ∕ DON ratios (Burdige and Komada, 2015). For instance, glycine (DOC ∕ DON = 2) was suggested to preferentially accumulate as a result of microbial metabolism in mixed redox sediments (Burdige, 2002). Bioturbation by macro-biota in oxygenated sediments is also often associated with the accumulation of urea (DOC ∕ DON = 0.5) (Burdige and Gardner, 1998). However, given that retrieved sediment cores were not bioturbated, active remineralisation of bioavailable organic matter by microbial communities within the sediment is more likely. Besides, DOM itself may enter chemical reactions with hydrogen sulfide that is produced in large quantities at middle shelf stations (Schunck et al., 2013; Sommer et al., 2016). For instance, quinone structures can react with hydrogen sulfide, producing hydroquinones (Heitmann and Blodau, 2006), which may be further utilised by methanogenic degradation processes (Szewzyk et al., 1985). This could affect DOC and DON pore water concentrations and a decrease in the diffusive DOC flux over the diffusive DON flux. However, the extreme accumulation of DON over the DOC in pore waters at St. 2 and also St. 1 seems to be hardly explainable with the organic N sources alone. Herewith, the actual mechanisms behind the decoupling of DOC and DON fluxes remain obscure.
4.2 Pore water DOM utilisation at the sediment–water interface
In current understanding, production of DOM from POM degradation processes followed by microbial utilisation of DOM (e.g. Burdige and Komada, 2015) can cause an imbalance in DOM production and consumption, resulting in a net accumulation of DOM with sediment depth. This is in part explained by an accumulation of recalcitrant DOM, which is thought to be of LMW, produced in the sediments as a result of the “microbial carbon pump” (Burdige and Komada, 2015). Furthermore, physico-chemical processes, such as (1) irreversible sorption onto particles, (2) aggregation (Liu and Lee, 2007; Arndt et al., 2013), (3) reactions of chelation and (4) co-precipitation (Lalonde et al., 2012), or (5) inhibition of microbial activity (Emerson, 2013; Canfield, 1994; Aller and Aller, 1998), may affect the DOM accumulation in sediment pore waters. At the same time, measurements of Δ14C in the pore water DOM suggest that its substantial fraction is isotopically young and is readily utilised by heterotrophic communities, when released to the water column (Bauer et al., 1995; Komada et al., 2013; Burdige et al., 2016). The observed accumulation of pore water DOM with depth (Fig. 2) agrees well with previous observations (Burdige and Gardner, 1998; Komada et al., 2004; Chipman et al., 2010; Alkhatib et al., 2013) as well as with DOC concentrations reported for non-bioturbated anoxic sediments (∼1–3 mmol L−1) (Burdige and Komada, 2015). The increase in humic-like fluorescence and its correlation with DOC concentrations (Comp. 1, R=0.8, n=0.86, p<0.01), as observed during our study, has also been noted previously in marine sediments (e.g. Chen et al., 1993) and is commonly explained as a net production of LMW recalcitrant humic DOM (Komada et al., 2004). The increase in S275−295 over sediment depth indicated an increase in apparent molecular weight (Helms et al., 2008). This apparent increase in molecular weight in combination with the down-core intensification in humic-like fluorescence may, therefore, suggest polymeric LMW DOM (pLMW DOM) formation. This may occur via reactions of polymerisation (Hedges et al., 1988) or complexation (Finke et al., 2007), as well as due to the formation of supramolecular clusters via hydrogen bonding or hydrophobic interactions (e.g. Sutton and Sposito, 2005). The down-core accumulation of DON and of amino-acid-like FDOM and also the correlation of amino-acid-like FDOM to DOC (Comp. 4, R=0.6, n=0.86, p<0.01) suggest that proteinaceous DOM is also being produced during POM remineralisation in sediments. Given that the second emission peaks of Comp. 3 and Comp. 4 displayed spectral characteristics similar to chl a and its auxiliary carotenoids (e.g. Wolf and Stevens, 1967), the protein-like FDOM components are likely products of phytoplankton debris recycling.
Benthic DOM fluxes were previously shown to contribute an important fraction to the organic matter that escapes remineralisation in the sediments (e.g. Ludwig et al., 1996; Burdige et al., 1999). Net in situ benthic DOC fluxes found during our study (–2.3±2.3 ) (Fig. 4) were comparable to previous estimates for shelf and continental slope sediments off the coasts of Peru and California, ranging from 0.03 to 4.41 (see Burdige et al., 1992, 1999; Burdige and Komada, 2015, for full overview). However, a linear accumulation of DOC and DON in benthic chambers (Burdige et al., 1992, 1999; Burdige and Homstead, 1994) over time was generally not observed. We were able to trace the qualitative transformations of DOM in benthic chambers over the investigated period by the changes in DOM optical properties. The decrease in S275−295 and an intensification of humic-like fluorescence over time indicated an accumulation of LMW humic DOM components (Helms et al., 2008). At the same time, the complex development of the amino acid-like fluorescence of Comp. 3 and the drawdown of aCDOM(325) and DON, resulting in increased DOC ∕ DON ratios, suggested a reworking of proteinaceous labile DOM. Therefore, the production of humic-like LMW DOM along with the utilisation of proteinaceous DOM suggests an active microbial DOM utilisation occurring at the sediment–water interface. These results support the idea that DOM release to the water column may stimulate respiration by water column microbial communities (Alkhatib et al., 2013; Komada et al., 2013; Burdige et al., 2016).
As stated previously, the rate of organic matter decomposition in sediments may depend not only on organic matter bioavailability (Canfield, 1994), but also on the inhibition of microbial activity (Aller and Aller, 1998) and the availability of electron acceptors (Emerson, 2013; Canfield, 1994).
We suggest that the availability of electron acceptors, such as and in the water column above the sediments (Thomsen et al., 2016; Lüdke et al., 2019, and also Fig. S7) may stimulate microbial communities at the sediment–water interface to take up DOM.
Furthermore, the suggested formation of pLMW DOM in the sediment pore waters, due to geo-polymerisation, the formation of supra-molecules due to hydrogen bonding (Sutton and Sposito, 2005; Finke et al., 2007), or encapsulation by humic substances (e.g. Tomaszewski et al., 2011), might have reduced accessibility of bioavailable DOM compounds. Labile substances, such as amino acids and carbohydrates, may have become unavailable for heterotrophic communities within the pore waters, resulting in DON accumulation with sediment depth. Herewith, the subsequent release of DOM into the water column may have led to unfolding (solubilisation) of those supra-molecules due to the chaotropic effect of (e.g. Gibb and Gibb, 2011), and, consequently, an increase in the DOM bioavailability for the microbial communities. Therefore, a non-conservative behaviour of DOC and DON and proteinaceous FDOM in the BIGO chambers during sediment enclosure might be a result of sediment release/microbial DOM consumption and reworking at the sediment–water interface. Furthermore, DOM released by the sediment could potentially support an enhanced microbial abundance and carbon oxidation rates near the sediment along 12∘ S transect (Maßmig et al., 2020) and influence the activity of microbial mats that cover up to 100 % of the sediment surface at the middle shelf stations (Sommer et al., 2016).
In turn, POM respiration rates, which are commonly evaluated from DIC flux measured in benthic lander systems (Dale et al., 2015), may have been underestimated, as the diffusive DOC fluxes calculated in this study could represent up to ∼53 % of the estimated DIC flux (JDIC, Clements et al., in prep.), and the net in situ benthic DOC fluxes could describe up to ∼28 % of JDIC. At the same time, whether all the DOM utilisation that takes place within benthic chambers in our study is bound to the sediment–water interface is not clear. Thus, the enclosure of sediment for ∼30 h may block out near-bottom currents (e.g. Lüdke et al., 2019) and other mechanisms of lateral transport, e.g. eddies (Thomsen et al., 2016), that might influence the water column distribution of the DOM freshly released from sediments. For instance, Lüdke et al. (2019) reported near-bottom poleward flow ranging from 0.1 to 0.4 m s−1. That could imply that, at stable flow, DOM, which has been released by the sediment, could be distributed along a distance of 10 to 40 km during the time equivalent to the time of sediment enclosure by BIGO chambers. Furthermore, Loginova et al. (2016) reported an apparent transport of humic-like fluorescence to the surface waters. Therefore, DOM released to the bottom waters may not be limited only to the sediment–water interface, but instead may affect the whole water column biogeochemistry.
We suggest that the difference between the diffusive flux and net in situ flux could reflect the rate of microbial DOC utilisation at the sediment–water interface at each station. Thus, we estimated rates of microbial utilisation at St. 3–St. 6 ranging from 0.2 to 1.7 . We here propose linking these utilisation rates to rates of denitrification. Evidence from fieldwork suggests that at least part of the denitrification occurring at depth may be driven by the supply of POM via the biological carbon pump (Liu and Kaplan, 1984; Kalvelage et al., 2013). Others suggested that DOM supply could also stimulate denitrification in oxygen-deficient zones (e.g. Chang et al., 2014; Bonaglia et al., 2016). Given the importance of denitrification and N-loss rates for OMZ regions, it is crucial to evaluate all possible sources of organic matter potentially sustaining such rates. By conversion of the remineralisation rates of outfluxed DOM found in our study to denitrification rates using stoichiometry previously reported by Prokopenko et al. (2011), we estimated associated denitrification rates ranging from 0.2 to 1.4 . These are comparable to denitrification rates (∼0.6 ) and the total N2 efflux (∼1.2 ) reported in anoxic sediments in the eastern tropical North Pacific off California (Prokopenko et al., 2011), to denitrification rates (0.2–2 ) in the eastern tropical North Atlantic off Mauritania (Dale et al., 2014), and to modelled denitrification rates (0.5–1.1 ) and N2 fluxes (0.8–4.6 ), observed along the 12∘ S transect (Dale et al., 2015; Sommer et al., 2016). Our estimates could, in turn, explain between 5 % and 45 % of denitrification rates measured in the water column of the ETSP (∼3 ; Kalvelage et al., 2013). Therefore, we suggest that sediment release of DOC is not the dominant source of organic matter to the OMZ, but on occasion, this process may potentially serve as an important source of organic matter for the water column N loss.
Diffusive fluxes of DOC and DON displayed high spatial variability, which was likely caused by the quality of organic matter supplied to the sediment and by differences in mechanisms of microbial metabolism at different water depths, suggested in the previous studies (Dale et al., 2014; Sommer et al., 2016). Lower net in situ DOC and DON fluxes, compared to diffusive fluxes, as well as an apparent steepening of S275−295 and accumulation of humic-like material within benthic chambers during the time of the sediment enclosure at all stations, suggest that DOM released to the water column is actively reworked at the sediment–water interface. The remineralisation of DOM is, likely, stimulated by high availability of strong electron acceptors, such as and , in the water column at the outer shelf and continental slope stations. The utilisation of DOC released by the sediment, in turn, may account for denitrification rates, comparable to those previously reported for the water column and sediments off Peru and other OMZs (e.g. Kalvelage et al., 2013; Dale et al., 2014; Sommer et al., 2016), suggesting that sediment release may serve as an important source of bioavailable DOM for the microbial communities at the sediment–water interface.
All the measured DOC concentrations, aCDOM(325), S275−295 and QSE of fluorescent components are available at pangaea.de at https://doi.pangaea.de/10.1594/PANGAEA.913476 (Loginova and Engel, 2020a) and https://doi.pangaea.de/10.1594/PANGAEA.913477 (Loginova and Engel, 2020b).
The supplement related to this article is available online at: https://doi.org/10.5194/bg-17-4663-2020-supplement.
ANL designed the sampling strategy and analysed DOM samples. AWD collected samples at the MUC and BIGO stations and provided data for calculation of fluxes, ST helped with water sampling, DC provided inorganic N data, SS helped with the sampling strategy design and sampling and also provided all the facilities for sampling from BIGO landers, and KW provided the initial idea for the research. ANL wrote the manuscript with contributions from AWD, FACLM, ST, SS and AE.
The authors declare that they have no conflict of interest.
This article is part of the special issue “Ocean deoxygenation: drivers and consequences – past, present and future (BG/CP/OS inter-journal SI)”. It is not associated with a conference.
We are grateful to the chief scientist Marcus Dengler and the ship and scientific crews of RV Meteor (cruises M136 and M137). Jon Roa is acknowledged for DOC analyses. We are grateful to Bettina Domeyer, Anke Bleyer, Matthias Türk and Antje Beck for technical and logistical support and Ulrike Schroller-Lomnitz for advice. We thank Tomoko Komada, Piotr Kowalczuk and the anonymous reviewer for improving this paper.
This research has been supported by the Deutsche Forschungsgemeinschaft (DFG) grant no. SFB754 “Climate-Biogeochemical Interactions in the Tropical Ocean” (miniproposal, B9), the Helmholtz Association and funding provided by the Inge-Lehmann-Fonds through the GEOMAR Helmholtz Centre for Ocean Research awarded to ANL and by the funding provided by DFG Excellence cluster Future Ocean CP1403 “Transfer and remineralisation of biogenic elements in the tropical oxygen minimum zones” awarded to FACLM. ST was supported by the European Commission (Horizon 2020, MSCA-IF-2016, WACO 749699: Fine-scale Physics, Biogeochemistry and Climate Change in the West African Coastal Ocean).
This paper was edited by S. Wajih A. Naqvi and reviewed by Piotr Kowalczuk, Tomoko Komada and one anonymous referee.
Alkhatib, M., del Giorgio, P. A., Gelinas, Y., and Lehmann, M. F.: Benthic fluxes of dissolved organic nitrogen in the lower St. Lawrence estuary and implications for selective organic matter degradation, Biogeosciences, 10, 7609–7622, https://doi.org/10.5194/bg-10-7609-2013, 2013. a, b, c, d
Aller, R. C. and Aller, J. Y.: The effect of biogenic irrigation intensity and solute exchange on diagenetic reaction rates in marine sediments, J. Mar. Res., 56, 905–936, https://doi.org/10.1357/002224098321667413, 1998. a, b
Alperin, M. J., Martens, C. S., Albert, D. B., Suayah, I. B., Benninger, L. K., Blair, N. E., and Jahnke, R. A.: Benthic fluxes and porewater concentration profiles of dissolved organic carbon in sediments from the North Carolina continental slope, Geochim. Cosmochim. Ac., 63, 427–448, https://doi.org/10.1016/S0016-7037(99)00032-0, 1999. a, b
Arévalo-Martínez, D. L., Kock, A., Löscher, C. R., Schmitz, R. A., and Bange, H. W.: Massive nitrous oxide emissions from the tropical South Pacific Ocean, Nat. Geosci., 8, 530–533, https://doi.org/10.1038/ngeo2469, 2015. a
Arndt, S., Jørgensen, B., LaRowe, D., Middelburg, J., Pancost, R., and Regnier, P.: Quantifying the degradation of organic matter in marine sediments: A review and synthesis, Earth-Sci. Rev., 123, 53–86, https://doi.org/10.1016/j.earscirev.2013.02.008, 2013. a, b
Balch, J. and Guéguen, C.: Effects of molecular weight on the diffusion coefficient of aquatic dissolved organic matter and humic substances, Chemosphere, 119, 498–503, https://doi.org/10.1016/j.chemosphere.2014.07.013, 2015. a, b
Bauer, J. E., Reimers, C. E., Druffel, E. R. M., and Williams, P. M.: Isotopic constraints on carbon exchange between deep ocean sediments and sea water, Nature, 373, 686–689, https://doi.org/10.1038/373686a0, 1995. a, b
Belzile, C., Gibson, J. A. E., and Vincent, W. F.: Colored dissolved organic matter and dissolved organic carbon exclusion from lake ice: Implications for irradiance transmission and carbon cycling, Limnol. Oceanogr., 47, 1283–1293, https://doi.org/10.4319/lo.2002.47.5.1283, 2002. a
Bohlen, L., Dale, A., Sommer, S., Mosch, T., Hensen, C., Noffke, A., Scholz, F., and Wallmann, K.: Benthic nitrogen cycling traversing the Peruvian oxygen minimum zone, Geochim. Cosmochim. Ac., 75, 6094–6111, https://doi.org/10.1016/j.gca.2011.08.010, 2011. a
Bonaglia, S., Klawonn, I., De Brabandere, L., Deutsch, B., Thamdrup, B., and Brüchert, V.: Denitrification and DNRA at the Baltic Sea oxic–anoxic interface: Substrate spectrum and kinetics, Limnol. Oceanogr., 61, 1900–1915, https://doi.org/10.1002/lno.10343, 2016. a
Bricaud, A., Morel, A., and Prieur, L.: Absorption by dissolved organic matter of the sea (yellow substance) in the UV and visible domains1, Limnol. Oceanogr., 26, 43–53, https://doi.org/10.4319/lo.1981.26.1.0043, 1981. a
Burdige, D. J.: Sediment Pore Waters, chap. 13, in: Biogeochemistry of Marine Dissolved Organic Matter, edited by: Hansell, D. A. and Carlson, C. A., Academic Press, San Diego, 611–663, https://doi.org/10.1016/B978-012323841-2/50015-4, 2002. a
Burdige, D. J. and Gardner, K. G.: Molecular weight distribution of dissolved organic carbon in marine sediment pore waters, Mar. Chem., 62, 45–64, https://doi.org/10.1016/S0304-4203(98)00035-8, 1998. a, b, c, d
Burdige, D. J. and Homstead, J.: Fluxes of dissolved organic carbon from Chesapeake Bay sediments, Geochim. Cosmochim. Ac., 58, 3407–3424, https://doi.org/10.1016/0016-7037(94)90095-7, 1994. a
Burdige, D. J. and Komada, T.: Sediment Pore Waters, chap. 12, in: Biogeochemistry of Marine Dissolved Organic Matter (Second Edition), edited by: Hansell, D. A. and Carlson, C. A., Academic Press, Boston, 2nd Edn., 535–577, https://doi.org/10.1016/B978-0-12-405940-5.00012-1, 2015. a, b, c, d, e, f, g, h
Burdige, D. J., Alperin, M. J., Homstead, J., and Martens, C. S.: The Role of Benthic Fluxes of Dissolved Organic Carbon in Oceanic and Sedimentary Carbon Cycling, Geophys. Res. Lett., 19, 1851–1854, https://doi.org/10.1029/92GL02159, 1992. a, b, c, d, e, f
Burdige, D. J., Berelson, W. M., Coale, K. H., McManus, J., and Johnson, K. S.: Fluxes of dissolved organic carbon from California continental margin sediments, Geochim. Cosmochim. Ac., 63, 1507–1515, https://doi.org/10.1016/S0016-7037(99)00066-6, 1999. a, b, c, d
Burdige, D. J., Komada, T., Magen, C., and Chanton, J. P.: Modeling studies of dissolved organic matter cycling in Santa Barbara Basin (CA, USA) sediments, Geochim. Cosmochim. Ac., 195, 100–119, 2016. a, b, c, d, e
Canfield, D. E.: Factors influencing organic carbon preservation in marine sediments, Chem. Geol., 114, 315–329, https://doi.org/10.1016/0009-2541(94)90061-2, 1994. a, b, c
Catalá, T. S., Álvarez Salgado, X. A., Otero, J., Iuculano, F., Companys, B., Horstkotte, B., Romera-Castillo, C., Nieto-Cid, M., Latasa, M., Morán, X. A. G., Gasol, J. M., Marrasé, C., Stedmon, C. A., and Reche, I.: Drivers of fluorescent dissolved organic matter in the global epipelagic ocean, Limnol. Oceanogr., 61, 1101–1119, https://doi.org/10.1002/lno.10281, 2016. a, b
Chang, B. X., Rich, J. R., Jayakumar, A., Naik, H., Pratihary, A. K., Keil, R. G., Ward, B. B., and Devol, A. H.: The effect of organic carbon on fixed nitrogen loss in the eastern tropical South Pacific and Arabian Sea oxygen deficient zones, Limnol. Oceanogr., 59, 1267–1274, https://doi.org/10.4319/lo.2014.59.4.1267, 2014. a
Chen, M., Kim, J.-H., Nam, S.-I., Niessen, F., Hong, W.-L., Kang, M.-H., and Hur, J.: Production of fluorescent dissolved organic matter in Arctic Ocean sediments, Sci. Rep., 6, 39213, https://doi.org/10.1038/srep39213, 2016. a, b
Chen, R. F., Bada, J. L., and Suzuki, Y.: The relationship between dissolved organic carbon (DOC) and fluorescence in anoxic marine porewaters: Implications for estimating benthic DOC fluxes, Geochim. Cosmochim. Ac., 57, 2149–2153, https://doi.org/10.1016/0016-7037(93)90102-3, 1993. a
Chipman, L., Podgorski, D., Green, S., Kostka, J., Cooper, W., and Huettel, M.: Decomposition of plankton-derived dissolved organic matter in permeable coastal sediments, Limnol. Oceanogr., 55, 857–871, https://doi.org/10.4319/lo.2010.55.2.0857, 2010. a
Coble, P. G.: Characterization of marine and terrestrial DOM in seawater using excitation-emission matrix spectroscopy, Mar. Chem., 51, 325–346, https://doi.org/10.1016/0304-4203(95)00062-3, 1996. a, b, c, d, e
Dale, A., Sommer, S., Ryabenko, E., Noffke, A., Bohlen, L., Wallmann, K., Stolpovsky, K., Greinert, J., and Pfannkuche, O.: Benthic nitrogen fluxes and fractionation of nitrate in the Mauritanian oxygen minimum zone (Eastern Tropical North Atlantic), Geochim. Cosmochim. Ac., 134, 234–256, https://doi.org/10.1016/j.gca.2014.02.026, 2014. a, b, c, d
Dale, A., Sommer, S., Lomnitz, U., Bourbonnais, A., and Wallmann, K.: Biological nitrate transport in sediments on the Peruvian margin mitigates benthic sulfide emissions and drives pelagic N loss during stagnation events, Deep-Sea Res. Pt. I, 112, 123–136, https://doi.org/10.1016/j.dsr.2016.02.013, 2016. a, b, c, d, e
Dale, A. W., Sommer, S., Lomnitz, U., Montes, I., Treude, T., Liebetrau, V., Gier, J., Hensen, C., Dengler, M., Stolpovsky, K., Bryant, L. D., and Wallmann, K.: Organic carbon production, mineralisation and preservation on the Peruvian margin, Biogeosciences, 12, 1537–1559, https://doi.org/10.5194/bg-12-1537-2015, 2015. a, b, c, d, e, f, g, h, i, j, k, l, m, n, o, p, q, r, s
Del Vecchio, R. and Blough, N. V.: On the Origin of the Optical Properties of Humic Substances, Environ. Sci. Technol., 38, 3885–3891, https://doi.org/10.1021/es049912h, 2004. a
Demaison, G. and Moore, G.: Anoxic environments and oil source bed genesis, Org. Geochem., 2, 9–31, https://doi.org/10.1016/0146-6380(80)90017-0, 1980. a
Dickson, A. G., Sabine, C. L., and Christian, J. R.: Guide to best practices for ocean CO2 measurements, PICES Special Publication 3, 191 pp., 2007. a
Emerson, S.: Organic Carbon Preservation in Marine Sediments, American Geophysical Union (AGU), 78–87, https://doi.org/10.1029/GM032p0078, 2013. a, b
Engel, A. and Galgani, L.: The organic sea-surface microlayer in the upwelling region off the coast of Peru and potential implications for air–sea exchange processes, Biogeosciences, 13, 989–1007, https://doi.org/10.5194/bg-13-989-2016, 2016. a
Engel, A., Wagner, H., Le Moigne, F. A. C., and Wilson, S. T.: Particle export fluxes to the oxygen minimum zone of the eastern tropical North Atlantic, Biogeosciences, 14, 1825–1838, https://doi.org/10.5194/bg-14-1825-2017, 2017. a
Faganeli, J. and Herndl, G.: Behaviour of Dissolved Organic Matter in Pore Waters of Near-Shore Marine Sediments, in: Diversity of Environmental Biogeochemistry, edited by: Berthelin, J., Vol. 6 of Developments in Geochemistry, Elsevier, 157–170, https://doi.org/10.1016/B978-0-444-88900-3.50020-5, 1991. a, b, c
Finke, N., Hoehler, T. M., and Jørgensen, B. B.: Hydrogen “leakage” during methanogenesis from methanol and methylamine: implications for anaerobic carbon degradation pathways in aquatic sediments, Environ. Microbiol., 9, 1060–1071, https://doi.org/10.1111/j.1462-2920.2007.01248.x, 2007. a, b
Gibb, C. L. D. and Gibb, B. C.: Anion Binding to Hydrophobic Concavity Is Central to the Salting-in Effects of Hofmeister Chaotropes, J. Am. Chem. Soc., 133, 7344–7347, https://doi.org/10.1021/ja202308n, 2011. a
Glock, N., Roy, A.-S., Romero, D., Wein, T., Weissenbach, J., Revsbech, N. P., Høgslund, S., Clemens, D., Sommer, S., and Dagan, T.: Metabolic preference of nitrate over oxygen as an electron acceptor in foraminifera from the Peruvian oxygen minimum zone, P. Natl. Acad. Sci. USA, 116, 2860–2865, https://doi.org/10.1073/pnas.1813887116, 2019. a
Gutiérrez, D., Sifeddine, A., Field, D. B., Ortlieb, L., Vargas, G., Chávez, F. P., Velazco, F., Ferreira, V., Tapia, P., Salvatteci, R., Boucher, H., Morales, M. C., Valdés, J., Reyss, J.-L., Campusano, A., Boussafir, M., Mandeng-Yogo, M., García, M., and Baumgartner, T.: Rapid reorganization in ocean biogeochemistry off Peru towards the end of the Little Ice Age, Biogeosciences, 6, 835–848, https://doi.org/10.5194/bg-6-835-2009, 2009. a, b
Hansen, H. and Koroleff, F.: Determination of nutrientss, chap. 10, John Wiley and Sons, 3rd Edn., 159–228, https://doi.org/10.1002/9783527613984.ch10, 2007. a
Hedges, J. I., Clark, W. A., and Come, G. L.: Fluxes and reactivities of organic matter in a coastal marine bay, Limnol. Oceanogr., 33, 1137–1152, https://doi.org/10.4319/lo.1988.33.5.1137, 1988. a
Heitmann, T. and Blodau, C.: Oxidation and incorporation of hydrogen sulfide by dissolved organic matter, Chem. Geol., 235, 12–20, https://doi.org/10.1016/j.chemgeo.2006.05.011, 2006. a
Helms, J. R., Stubbins, A., Ritchie, J. D., Minor, E. C., Kieber, D. J., and Mopper, K.: Absorption spectral slopes and slope ratios as indicators of molecular weight, source, and photobleaching of chromophoric dissolved organic matter, Limnol. Oceanogr., 53, 955–969, https://doi.org/10.4319/lo.2008.53.3.0955, 2008. a, b, c, d, e
Holcombe, B. L., Keil, R. G., and Devol, A. H.: Determination of pore-water dissolved organic carbon fluxes from Mexican margin sediments, Limnol. Oceanogr., 46, 298–308, https://doi.org/10.4319/lo.2001.46.2.0298, 2001. a, b
Jørgensen, L., Stedmon, C. A., Kragh, T., Markager, S., Middelboe, M., and Søndergaard, M.: Global trends in the fluorescence characteristics and distribution of marine dissolved organic matter, Mar. Chem., 126, 139–148, https://doi.org/10.1016/j.marchem.2011.05.002, 2011. a, b
Kalvelage, T., Lavik, G., Lam, P., Contreras, S., Arteaga, L., Löscher, C. R., Oschlies, A., Paulmier, A., Stramma, L., and Kuypers, M. M. M.: Nitrogen cycling driven by organic matter export in the South Pacific oxygen minimum zone, Nat. Geosci., 6, 228, https://doi.org/10.1038/ngeo1739, 2013. a, b, c, d
Keeling, R. F., Körtzinger, A., and Gruber, N.: Ocean Deoxygenation in a Warming World, Annu. Rev. Mar. Sci., 2, 199–229, https://doi.org/10.1146/annurev.marine.010908.163855, 2010. a
Komada, T., Reimers, C. E., Luther, G. W., and Burdige, D. J.: Factors affecting dissolved organic matter dynamics in mixed-redox to anoxic coastal sediments, Geochim. Cosmochim. Ac., 68, 4099–4111, https://doi.org/10.1016/j.gca.2004.04.005, 2004. a, b, c
Komada, T., Burdige, D. J., Crispo, S. M., Druffel, E. R., Griffin, S., Johnson, L., and Le, D.: Dissolved organic carbon dynamics in anaerobic sediments of the Santa Monica Basin, Geochim. Cosmochim. Ac., 110, 253–273, https://doi.org/10.1016/j.gca.2013.02.017, 2013. a, b, c, d
Komada, T., Burdige, D. J., Li, H.-L., Magen, C., Chanton, J. P., and Cada, A. K.: Organic matter cycling across the sulfate-methane transition zone of the Santa Barbara Basin, California Borderland, Geochim. Cosmochim. Ac., 176, 259–278, https://doi.org/10.1016/j.gca.2015.12.022, 2016. a
Lalonde, K., Mucci, A., Ouellet, A., and Gélinas, Y.: Preservation of organic matter in sediments promoted by iron, Nature, 483, 198–200, https://doi.org/10.1038/nature10855, 2012. a
Lavery, P. S., Oldham, C. E., and Ghisalberti, M.: The use of Fick's First Law for predicting porewater nutrient fluxes under diffusive conditions, Hydrol. Proc., 15, 2435–2451, https://doi.org/10.1002/hyp.297, 2001. a, b, c
Le Moigne, F. A. C., Cisternas-Novoa, C., Piontek, J., Maßmig, M., and Engel, A.: On the effect of low oxygen concentrations on bacterial degradation of sinking particles, Sci. Rep., 7, 16722, https://doi.org/10.1038/s41598-017-16903-3, 2017. a, b
Liu, K.-K. and Kaplan, I. R.: Denitrification rates and availability of organic matter in marine environments, Earth Planet. Sc. Lett., 68, 88–100, https://doi.org/10.1016/0012-821X(84)90142-0, 1984. a
Liu, Z. and Lee, C.: The role of organic matter in the sorption capacity of marine sediments, Mar. Chem., 105, 240–257, https://doi.org/10.1016/j.marchem.2007.02.006, 2007. a
Loginova, A. N., Thomsen, S., and Engel, A.: Chromophoric and fluorescent dissolved organic matter in and above the oxygen minimum zone off Peru, J. Geophys. Res.-Ocean., 121, 7973–7990, https://doi.org/10.1002/2016JC011906, 2016. a, b, c, d, e, f, g
Loginova, A. N., Thomsen, S., Dengler, M., Lüdke, J., and Engel, A.: Diapycnal dissolved organic matter supply into the upper Peruvian oxycline, Biogeosciences, 16, 2033–2047, https://doi.org/10.5194/bg-16-2033-2019, 2019. a
Loginova, A. and Engel, A.: Organic matter sediment release during METOR cruise M136: BIGO data, PANGAEA, https://doi.pangaea.de/10.1594/PANGAEA.913476, 2020a. a
Loginova, A. and Engel, A.: Organic matter sediment release during METOR cruises M136 and M137: Multicorer data, PANGAEA, https://doi.pangaea.de/10.1594/PANGAEA.913477, 2020b. a
Lüdke, J., Dengler, M., Sommer, S., Clemens, D., Thomsen, S., Krahmann, G., Dale, A. W., Achterberg, E. P., and Visbeck, M.: Influence of intraseasonal eastern boundary circulation variability on hydrography and biogeochemistry off Peru, Ocean Sci. Discuss., https://doi.org/10.5194/os-2019-93, in review, 2019. a, b, c, d, e, f
Ludwig, W., Probst, J.-L., and Kempe, S.: Predicting the oceanic input of organic carbon by continental erosion, Global Biogeochem. Cy., 10, 23–41, https://doi.org/10.1029/95GB02925, 1996. a, b
Marsay, C. M., Sanders, R. J., Henson, S. A., Pabortsava, K., Achterberg, E. P., and Lampitt, R. S.: Attenuation of sinking particulate organic carbon flux through the mesopelagic ocean, P. Natl. Acad. Sci. USA, 112, 1089–1094, https://doi.org/10.1073/pnas.1415311112, 2015. a
Martin, W. R. and McCorkle, D. C.: Dissolved organic carbon concentrations in marine pore waters determined by high-temperature oxidation, Limnol. Oceanogr., 38, 1464–1479, https://doi.org/10.4319/lo.1993.38.7.1464, 1993. a
Maßmig, M., Piontek, J., Le Moigne, F., Cisternas-Novoa, C., and Engel, A.: Potential role of oxygen and inorganic nutrients on microbial carbon turnover in the Baltic Sea, Aquat. Microb. Ecol., 83, 95–108, https://doi.org/10.3354/ame01902, 2019. a
Maßmig, M., Lüdke, J., Krahmann, G., and Engel, A.: Bacterial degradation activity in the eastern tropical South Pacific oxygen minimum zone, Biogeosciences, 17, 215–230, https://doi.org/10.5194/bg-17-215-2020, 2020. a, b, c
Moran, M. A. and Zepp, R. G.: Role of photoreactions in the formation of biologically labile compounds from dissolved organic matter, Limnol. Oceanogr., 42, 1307–1316, https://doi.org/10.4319/lo.1997.42.6.1307, 1997. a
Mosch, T., Sommer, S., Dengler, M., Noffke, A., Bohlen, L., Pfannkuche, O., Liebetrau, V., and Wallmann, K.: Factors influencing the distribution of epibenthic megafauna across the Peruvian oxygen minimum zone, Deep-Sea Res. Pt. I, 68, 123–135, 2012. a, b
Murphy, K. R., Stedmon, C. A., Graeber, D., and Bro, R.: Fluorescence spectroscopy and multi-way techniques. PARAFAC, Anal. Methods, 5, 6557–6566, https://doi.org/10.1039/C3AY41160E, 2013. a, b, c, d, e
Murphy, K. R., Stedmon, C. A., Wenig, P., and Bro, R.: OpenFluor – an online spectral library of auto-fluorescence by organic compounds in the environment, Anal. Methods, 6, 658–661, https://doi.org/10.1039/C3AY41935E, 2014. a, b, c
Nelson, N. B. and Siegel, D. A.: The Global Distribution and Dynamics of Chromophoric Dissolved Organic Matter, Annu. Rev. Mar. Sci., 5, 447–476, https://doi.org/10.1146/annurev-marine-120710-100751, 2013. a, b
Pantoja, S., Rossel, P., Castro, R., Cuevas, L. A., Daneri, G., and Córdova, C.: Microbial degradation rates of small peptides and amino acids in the oxygen minimum zone of Chilean coastal waters, Deep-Sea Res. Pt. II, 56, 1055–1062, https://doi.org/10.1016/j.dsr2.2008.09.007, 2009. a, b, c
Pennington, J. T., Mahoney, K. L., Kuwahara, V. S., Kolber, D. D., Calienes, R., and Chavez, F. P.: Primary production in the eastern tropical Pacific: A review, Prog. Oceanogr., 69, 285–317, https://doi.org/10.1016/j.pocean.2006.03.012, 2006. a
Prokopenko, M., Sigman, D., Berelson, W., Hammond, D., Barnett, B., Chong, L., and Townsend-Small, A.: Denitrification in anoxic sediments supported by biological nitrate transport, Geochim. Cosmochim. Ac., 75, 7180–7199, https://doi.org/10.1016/j.gca.2011.09.023, 2011. a, b
Rodríguez-Morata, C., Díaz, H. F., Ballesteros-Canovas, J. A., Rohrer, M., and Stoffel, M.: The anomalous 2017 coastal El Niño event in Peru, Clim. Dynam., 52, 5605–5622, https://doi.org/10.1007/s00382-018-4466-y, 2019. a
Schunck, H., Lavik, G., Desai, D. K., Großkopf, T., Kalvelage, T., Löscher, C. R., Paulmier, A., Contreras, S., Siegel, H., Holtappels, M., Rosenstiel, P., Schilhabel, M. B., Graco, M., Schmitz, R. A., Kuypers, M. M. M., and LaRoche, J.: Giant Hydrogen Sulfide Plume in the Oxygen Minimum Zone off Peru Supports Chemolithoautotrophy, PLOS ONE, 8, 1–18, https://doi.org/10.1371/journal.pone.0068661, 2013. a
Seiter, K., Hensen, C., Schröter, J., and Zabel, M.: Organic carbon content in surface sediments–defining regional provinces, Deep–Sea Res. Pt. I, 51, 2001–2026, https://doi.org/10.1016/j.dsr.2004.06.014, 2004. a
Smith, D. C., Simon, M., Alldredge, A. L., and Azam, F.: Intense hydrolytic enzyme activity on marine aggregates and implications for rapid particle dissolution, Nature, 359, 139–142, https://doi.org/10.1038/359139a0, 1992. a
Sommer, S., Türk, M., Kriwanek, S., and Pfannkuche, O.: Gas exchange system for extended in situ benthic chamber flux measurements under controlled oxygen conditions: First application – Sea bed methane emission measurements at Captain Arutyunov mud volcano, Limnol. Oceanogr.-Method., 6, 23–33, https://doi.org/10.4319/lom.2008.6.23, 2008. a, b
Sommer, S., Gier, J., Treude, T., Lomnitz, U., Dengler, M., Cardich, J., and Dale, A.: Depletion of oxygen, nitrate and nitrite in the Peruvian oxygen minimum zone cause an imbalance of benthic nitrogen fluxes, Deep-Sea Res. Pt. I, 112, 113–122, https://doi.org/10.1016/j.dsr.2016.03.001, 2016. a, b, c, d, e, f, g, h, i, j, k, l, m, n, o
Stedmon, C. A. and Bro, R.: Characterizing dissolved organic matter fluorescence with parallel factor analysis: a tutorial, Limnol. Oceanogr.-Method., 6, 572–579, https://doi.org/10.4319/lom.2008.6.572, 2008. a
Stramma, L., Hüttl, S., and Schafstall, J.: Water masses and currents in the upper tropical northeast Atlantic off northwest Africa, J. Geophys. Res.-Ocean., 110, C12006, https://doi.org/10.1029/2005JC002939, 2005. a
Stramma, L., Johnson, G. C., Sprintall, J., and Mohrholz, V.: Expanding Oxygen-Minimum Zones in the Tropical Oceans, Science, 320, 655–658, https://doi.org/10.1126/science.1153847, 2008. a
Sutton, R. and Sposito, G.: Molecular Structure in Soil Humic Substances: The New View, Environ. Sci. Technol., 39, 9009–9015, https://doi.org/10.1021/es050778q, 2005. a, b
Szewzyk, U., Szewzyk, R., and Schink, B.: Methanogenic degradation of hydroquinone and catechol via reductive dehydroxylation to phenol, FEMS Microbiol. Lett., 31, 79–87, https://doi.org/10.1016/0378-1097(85)90003-5, 1985. a
Thomsen, S., Kanzow, T., Krahmann, G., Greatbatch, R. J., Dengler, M., and Lavik, G.: The formation of a subsurface anticyclonic eddy in the Peru-Chile Undercurrent and its impact on the near-coastal salinity, oxygen, and nutrient distributions, J. Geophys. Res.-Ocean., 121, 476–501, https://doi.org/10.1002/2015JC010878, 2016. a, b
Tomaszewski, J. E., Schwarzenbach, R. P., and Sander, M.: Protein Encapsulation by Humic Substances, Environ. Sci. Technol., 45, 6003–6010, https://doi.org/10.1021/es200663h, 2011. a
Ullman, W. J. and Aller, R. C.: Diffusion coefficients in nearshore marine sediments1, Limnol. Oceanogr., 27, 552–556, https://doi.org/10.4319/lo.1982.27.3.0552, 1982. a, b
Westerhoff, P. and Mash, H.: Dissolved organic nitrogen in drinking water supplies: a review, J. Water Suppl. Res. T., 51, 415–448, https://doi.org/10.2166/aqua.2002.0038, 2002. a
Wolf, F. T. and Stevens, M. V.: The Fluorescence of Carotenoids, Photochem. Photobiol., 6, 597–599, https://doi.org/10.1111/j.1751-1097.1967.tb08761.x, 1967. a
Yang, L., Choi, J. H., and Hur, J.: Benthic flux of dissolved organic matter from lake sediment at different redox conditions and the possible effects of biogeochemical processes, Water Res., 61, 97–107, 2014. a
Zsolnay, A., Baigar, E., Jimenez, M., Steinweg, B., and Saccomandi, F.: Differentiating with fluorescence spectroscopy the sources of dissolved organic matter in soils subjected to drying, Chemosphere, 38, 45–50, https://doi.org/10.1016/S0045-6535(98)00166-0, 1999. a, b