the Creative Commons Attribution 4.0 License.
the Creative Commons Attribution 4.0 License.
 | 14 Oct 2020
Do degree and rate of silicate weathering depend on plant productivity?
Ralf A. Oeser
Friedhelm von Blanckenburg
Plants and their associated below-ground microbiota possess the tools for rock weathering. Yet the quantitative evaluation of the impact of these biogenic weathering drivers relative to abiogenic parameters, such as the supply of primary minerals, water, and acids, is an open question in Critical Zone research. Here we present a novel strategy to decipher the relative impact of these drivers. We quantified the degree and rate of weathering and compared these to nutrient uptake along the “EarthShape” transect in the Chilean Coastal Cordillera. These sites define a major north–south gradient in precipitation and primary productivity but overlie granitoid rock throughout. We present a dataset of the chemistry of Critical Zone compartments (bedrock, regolith, soil, and vegetation) to quantify the relative loss of soluble elements (the “degree of weathering”) and the inventory of bioavailable elements. We use 87Sr∕86Sr isotope ratios to identify the sources of mineral nutrients to plants. With rates from cosmogenic nuclides and biomass growth we determined fluxes (“weathering rates”), meaning the rate of loss of elements out of the ecosystems, averaged over weathering timescales (millennia), and quantified mineral nutrient recycling between the bulk weathering zone and the bulk vegetation cover. We found that neither the degree of weathering nor the weathering rates increase systematically with precipitation from north to south along the climate and vegetation gradient. Instead, the increase in biomass nutrient demand is accommodated by faster nutrient recycling. In the absence of an increase in weathering rate despite a five-fold increase in precipitation and net primary productivity (NPP), we hypothesize that plant growth might in fact dampen weathering rates. Because plants are thought to be key players in the global silicate weathering–carbon feedback, this hypothesis merits further evaluation.
- Article
(5162 KB) - Full-text XML
- BibTeX
- EndNote


Ever since the emergence of land plants, their dependence on mineral-derived nutrients has impacted rock weathering (used here to mean the combined processes of primary mineral dissolution, secondary solid formation, and the loss of elements in aqueous solution). This impact results from three types of interaction. The first is mechanical processes, which weaken rock or change the depth of the weathering zone through roots and microbial symbionts (e.g., mycorrhizal fungi; Blum et al., 2002; Brantley et al., 2017; Hasenmueller et al., 2017; Minyard et al., 2012; Quirk et al., 2014; van Schöll et al., 2007). The second is a variety of biogeochemical processes that alter the susceptibility of minerals to weathering. These mechanisms include root respiration, which releases protons and CO2, lowering soil pH; the exudation of organic ligands through roots, which increases the solubility of nutrients through complexation; and the uptake, uplift, and recycling of pore fluids and nutrients from solution (e.g., Berner et al., 2003; Brantley et al., 2012; Drever, 1994; Kump et al., 2000; Lee and Boyce, 2010; Jobbágy, 2001; Giehl and von Wiren, 2014). The third interaction affects the water cycle, which is impacted by rooting depth and seasonal water storage in saprolite and evapotranspiration (Kleidon et al., 2000; Ibarra et al., 2019). All of these interactions impact weathering, either directly by aiding plant acquisition of mineral nutrients from rock or indirectly by modifying the water cycle (e.g., Brantley et al., 2011; Porder, 2019; Moulton et al., 2000). This means the presence and growth rate of land plants is commonly thought to have strongly impacted the evolution of Earth's atmosphere over geologic time by strengthening the negative feedback between silicate weathering rates and atmospheric CO2 concentrations (Beerling and Berner, 2005; Doughty et al., 2014; Lenton et al., 2012; Pagani et al., 2009; Porada et al., 2016).
While biota in general and plants in particular are undoubtedly key players in weathering and pedogenesis, a quantitative evaluation of their impact remains elusive. The reason is our inability to disentangle abiotic from biotic processes in field observations (Amundson et al., 2007). Almost all mass transfer in the weathering zone can have biotic and abiotic causes. An additional challenge is the difficulty in accounting for confounding effects. Environmental state variables shaping the Critical Zone (the zone of the Earth surface that extends from the top of unweathered bedrock to the top of the vegetation cover, i.e., the zone in which most biogeochemical reactions take place) can obscure or amplify the effects of biology, making the attribution of cause and effect challenging. Another reason for our inability to directly attribute weathering to plant growth arises from the ability of ecosystems to recycle nutrients through microbial mineralization from plant litter and organic matter, rather than acquiring fresh nutrients from rock (Chaudhuri et al., 2007; Lang et al., 2016; Lucas, 2001; Spohn and Sierra, 2018; Wilcke et al., 2002). Given the ability of ecosystems to buffer changes in nutrient fluxes (Spohn and Sierra, 2018) the dependence of weathering on plant growth and biomass distribution can be expected to be a highly nonlinear one.
A classical strategy in field studies that aim to decipher how ecosystem functioning and weathering shape the Critical Zone relies on exploring the interactions along natural environmental gradients. Studies along a Hawaiian chronosequence (soils of variable discrete initial formation age) have evaluated the role of soil age in weathering and the distribution and cycling of cations through plants. These studies revealed the dependency of nutrient cycling on the degree of weathering (e.g., Bullen and Chadwick, 2016; Chadwick et al., 1999; Laliberte et al., 2013; Porder and Chadwick, 2009; Vitousek, 2004). Studies along a climosequence (gradients in climate while minimizing other environmental differences) have evaluated the effect of climate on ecological and pedogenic processes (Bullen and Chadwick, 2016; Calmels et al., 2014; Dere et al., 2013; Egli et al., 2003; Ferrier et al., 2012). These studies generally show an increase in weathering rates with increasing mean annual temperature (MAT) and mean annual precipitation (MAP), while vegetation plays a significant role in pedogenesis. Studies across different rock substrates have evaluated the availability of nutrients and the dissolution kinetics of minerals for ecosystem nutrient budgets (Hahm et al., 2014; Uhlig and von Blanckenburg, 2019) and indicate a “bottom-up” lithological and mineralogical control on nutrient availability to ecosystems. Studies along gradients in erosion rates explored the supply of minerals to ecosystems and discovered an increase in nutrient supply through weathering with increasing erosion rates (Chadwick and Asner, 2016; Eger et al., 2018; Porder et al., 2007; Schuessler et al., 2018). Studies that have tried to isolate just the role of vegetation cover show that the weathering fluxes in adjacent areas in which only vegetation differs showed higher fluxes with more vegetation (Moulton et al., 2000). All these studies differ widely in their methodology, timescale, spatial scale, conceptual framework, and even discipline. We return to this topic below by comparing our conceptual perspective to other approaches.
In this study we explore weathering, nutrient uptake, and nutrient recycling along one of the Earth's most impressive climate and vegetation gradients, located in the Chilean Coastal Cordillera (Oeser et al., 2018) Along this gradient we quantify the degree of weathering, (using chemical analyses of rock and regolith, Oeser et al., 2018), rates of weathering (using cosmogenic 10Be, Schaller et al., 2018b), and nutrient uptake (using net primary productivity, NPP, and the chemical composition of the major plant species at each site). Sequential extraction protocols applied to bulk regolith were used to identify the stoichiometry of the main plant-available elements in the regolith. Radiogenic 87Sr∕86Sr isotope ratios in bulk rock, regolith, the bioavailable fraction in regolith (where regolith is used here to mean the sum of consolidated and unconsolidated material above the weathering front, including soil), and plant biomass were used to identify the sources of mineral nutrients. We were thus able to identify gains and losses of mineral nutrients in and out of these ecosystems and to quantify the efficiency of nutrient recycling. We applied the conceptual framework and parameterization of Uhlig and von Blanckenburg (2019) to place quantitative constraints on the “organic nutrient cycle” and the “geogenic nutrient pathway”, as detailed in the next section. In a companion paper we exploited 88Sr∕86Sr stable isotope fractionation in the materials studies here and established a stable isotope-based mass balance for Sr cycling in the critical zone including plants (Oeser and von Blanckenburg, 2020a).
Here, we specifically evaluated the following questions: (1) do weathering rates increase along the north–south precipitation gradient because runoff, the main driver of weathering flux, increases? (2) Do the variations in NPP along the climate and vegetation gradient correlate with nutrient supply rates from weathering?
Two fundamentally different concepts describe the relationship between regolith formation and time and their relationship to different geomorphic regimes (Lin, 2010; Smeck et al., 1983): the continuous evolution model and the steady-state model. The continuous evolution model describes regolith or soil evolution with time from an initial point and describes chronosequences, where soils evolve on stable (non-eroding) surfaces. These soils have a distinct age and undergo several phases of soil development (e.g., Chadwick et al., 1999; Vitousek and Chadwick, 2013). In contrast, the steady-state model assumes all regolith state variables are independent of an initial point. In this concept, regolith is constantly rejuvenated by production at depth and its removal through erosion from above (e.g., Heimsath et al., 1997). In other words, the regolith is continuously turned over and has no distinct age but rather a residence time. This concept applies to all sloping landscapes on Earth, on which typical regolith residence times (≤104 year) are often less than or equal to the timescales over which tectonics and climate vary (≥104 year). This suggests that much of the Earth surface operates in a manner that is consistent with the steady-state model of soil formation (Dixon et al., 2009; Ferrier et al., 2005; Riebe and Granger, 2013). The state variables do not necessarily vary linearly with age (in the continuous evolution model) or residence time (in the steady-state model). Thus, in the continuous evolution model, pedogenic thresholds have been deduced based on certain soil properties (Dixon et al., 2016; Vitousek and Chadwick, 2013). These have also been described to exist and strongly vary along the eroding surfaces in Chile explored in this study (Bernhard et al., 2018).
Although ecosystems respond over shorter timescales to environmental change, ranging from seasonal to decadal or longer climate cycles, their evolution can nevertheless be linked to the two regolith evolution models (Brantley et al., 2011). In the continuous evolution model, ecology and soil development are linked via progressive increases in soil stability and water retention capacity and a unidirectional decrease in mineral nutrient availability (Vitousek and Farrington, 1997). In contrast, in the steady-state model, regolith replenishment by uplift and erosion sets the upward advection of mineral nutrients (Buendía et al., 2010; Porder et al., 2007; Vitousek et al., 2003; Uhlig and von Blanckenburg, 2019) and availability of regolith moisture (Rempe and Dietrich, 2018). Thus, the combination of regolith residence time and mineral weathering rates determines whether supply by a specific mineral nutrient suffices to sustain an ecosystem over weathering timescales, which in turn is thought to impact plant diversity and nutrient acquisition strategies. For example, ecosystems on strongly mineral nutrient-depleted soils seem to be characterized by high plant diversity (Laliberte et al., 2013; Lambers et al., 2008). Note that nitrogen (N), the most limiting nutrient in many ecosystems, is not an element addressed here. Although rocks have recently received attention as source of geogenic N (Houlton et al., 2018), this source is most prominent in sedimentary rock. This study explores ecosystems developed on granitoid rock where N is derived from the inexhaustible atmospheric pool by nitrogen-fixing bacteria, and limitation mostly arises by the energy required for fixation (Chapin III et al., 2011).
The methods employed to explore these processes span a range of timescales that are discipline specific. Plant ecology typically works on (sub-)annual timescales for ecosystem fertilization or manipulation experiments (Tielbörger et al., 2014; Tipping et al., 1999), while instrumental monitoring of water, gas, and nutrient fluxes between Critical Zone compartments in hydrology, soil ecology, and biogeochemistry can reach decadal timescales (Joos et al., 2010; Kelly and Goulden, 2016; Lang et al., 2016; Sprenger et al., 2019; Sohrt et al., 2019; Wilcke et al., 2017). Geochemical estimates of rock weathering or evolution of plant-available nutrient inventories typically integrate over millennial timescales (Buendía et al., 2010; Porder et al., 2007; Riebe and Granger, 2013; Uhlig and von Blanckenburg, 2019; Vitousek et al., 2003).
To integrate these different timescales, some soil ecological models account for the coupled weathering–recycling uptake systems by linking the short-term, biological cycle with the long-term, largely geological and hydrologically driven cycle (Porder and Chadwick, 2009; Powers et al., 2015; Vitousek et al., 1998). Such models have recently been complemented by concepts and methods from geochemistry (Uhlig and von Blanckenburg, 2019) that we pursue in this study. In this conceptual framework, the so-called “organic nutrient cycle” comprises a set of strategies for efficient nutrient reutilization through microbial mineralization from plant litter and organic matter and entails rapid nutrient turnover. The “geogenic nutrient pathway” compensates the loss of nutrients by erosion and in solution through the slow but steady supply of nutrients from chemical weathering of rock (Buendía et al., 2010; Cleveland et al., 2013; Uhlig and von Blanckenburg, 2019). This concept is particularly relevant where atmospheric wet and dry deposition (e.g., Boy and Wilcke, 2008; Chadwick et al., 1999; Dosseto et al., 2012) do not suffice to balance the losses. These geogenic input fluxes are often minor compared to those in the organic nutrient cycle and may even be undetectable over the annual to decadal scales of ecosystem monitoring experiments. However, they sustain ecosystem nutrition over longer (decadal to millennial) timescales because they prevent mineral nutrient deficiency that may otherwise develop (Hahm et al., 2014; Schuessler et al., 2018; Uhlig et al., 2017; Uhlig and von Blanckenburg, 2019). Whether the geogenic nutrient pathway is sufficient to prevent development of mineral nutrient limitation over the millennial scale depends on the rate of supply of fresh rock into the weathering zone, the bioavailability of the nutrients released, and whether plant roots and the associated mycorrhizal fungi can access them. Thus, any exploration of these links must constrain where nutrients are released in regolith relative to where plants obtain them. The aim of this study is to illustrate how this approach from geochemistry can be employed to assess the flux balances between the top of bedrock and the top of the vegetation canopy as integrated over millennia, and how plant growth affects these in comparison to the geologic drivers like uplift and erosion or climatic drivers like precipitation and runoff.
Table 1Characteristics of the four EarthShape study sites and soil profile names in Pan de Azúcar, Santa Gracia, La Campana, and Nahuelbuta.
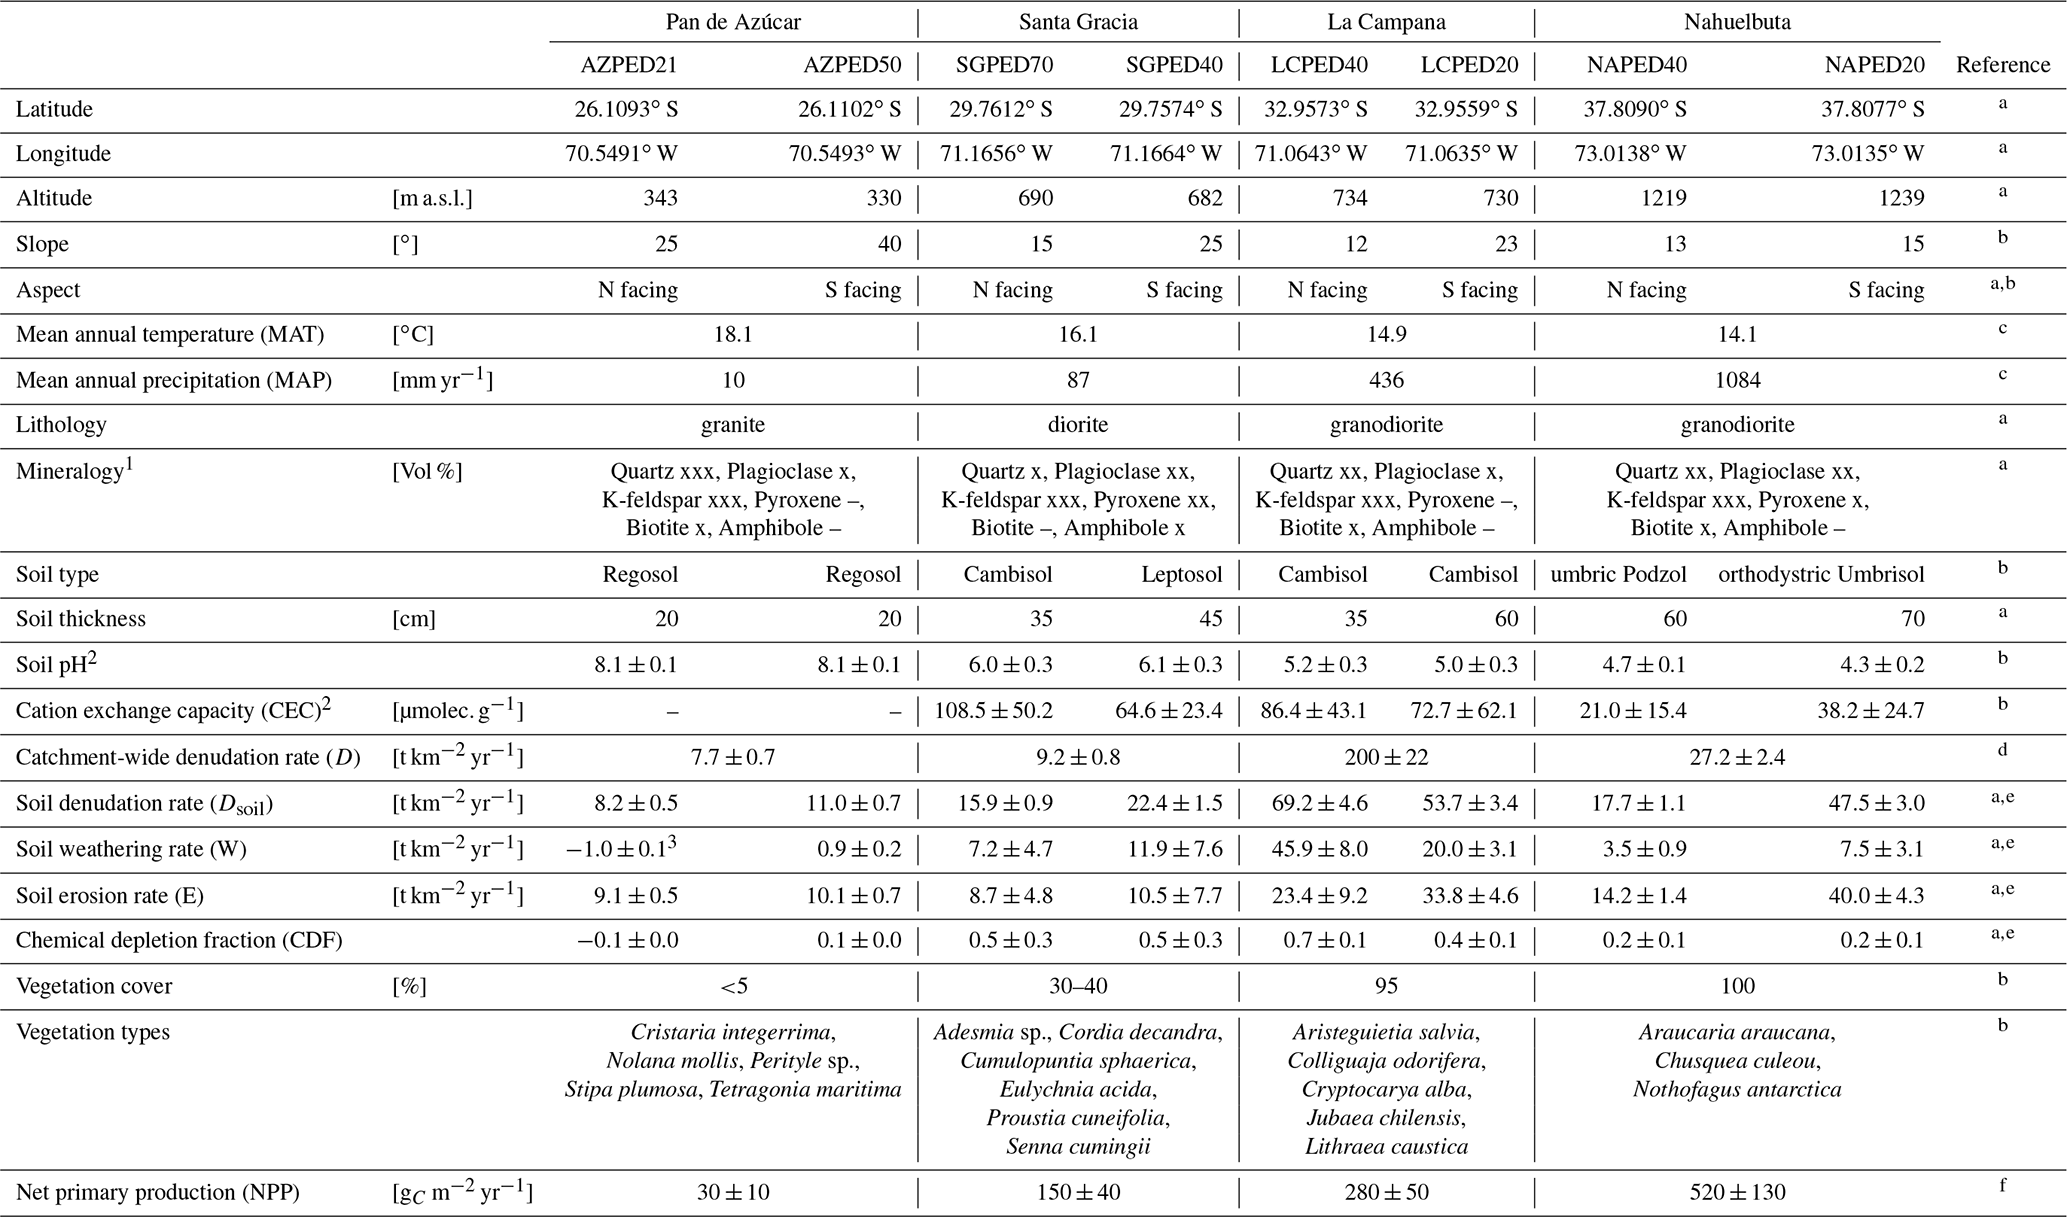
1 Estimation of mineral abundances based on thin-section microscopy: –: absence, x: presence (<10 Vol %), xx: abundant (10–35 Vol %), xxx: very abundant (>35 Vol %). 2 Denotes regolith profile averages. 3 The N-facing slope in Pan de Azúcar yields negative CDF and hence negative weathering rates due to the input of sea spray. a Oeser et al. (2018). b Bernhard et al. (2018). c Ministerio de Obras Puíblicas (2017); d van Dongen et al. (2019). e Schaller et al. (2018b). f Werner et al. (2018).
The study was conducted within the Critical Zone project “EarthShape: Earth Surface Shaping by Biota”. The four study sites are part of the EarthShape study area which is located along the Chilean Coastal Cordillera. Three sites are located in national parks and one in a nature reserve, so human impact is minimized. The sites are located on the plutonic rocks of the Chilean Coastal Cordillera and are close to the Pacific coast (less than 80 km; Oeser et al., 2018). Two previous studies introduced the field area, its pedogenic and weathering characteristics, and a set of new soil data and geochemical data (Oeser et al., 2018; Bernhard et al., 2018).
The sites define a vegetation gradient controlled by climate, ranging over 1300 km. From north to south, they cover arid (Pan de Azúcar National Park, ∼26∘ S), semiarid (Santa Gracia Nature Reserve, ∼30∘ S), mediterranean (La Campana National Park, ∼33∘ S), and humid-temperate (Nahuelbuta National Park, ∼38∘ S) climate conditions. The mean annual precipitation (MAP) increases from 10 mm yr−1 in Pan de Azúcar, to 89 mm yr−1 in Santa Gracia, 440 mm yr−1 in La Campana, and 1100 mm yr−1 in Nahuelbuta. The mean annual air temperature (MAT) ranges from 18.1 ∘C in the northernmost site in Pan de Azúcar to 14.1 ∘C in the southernmost site in Nahuelbuta (Fig. 1, Table 1; Ministerio de Obras Públicas, 2017).
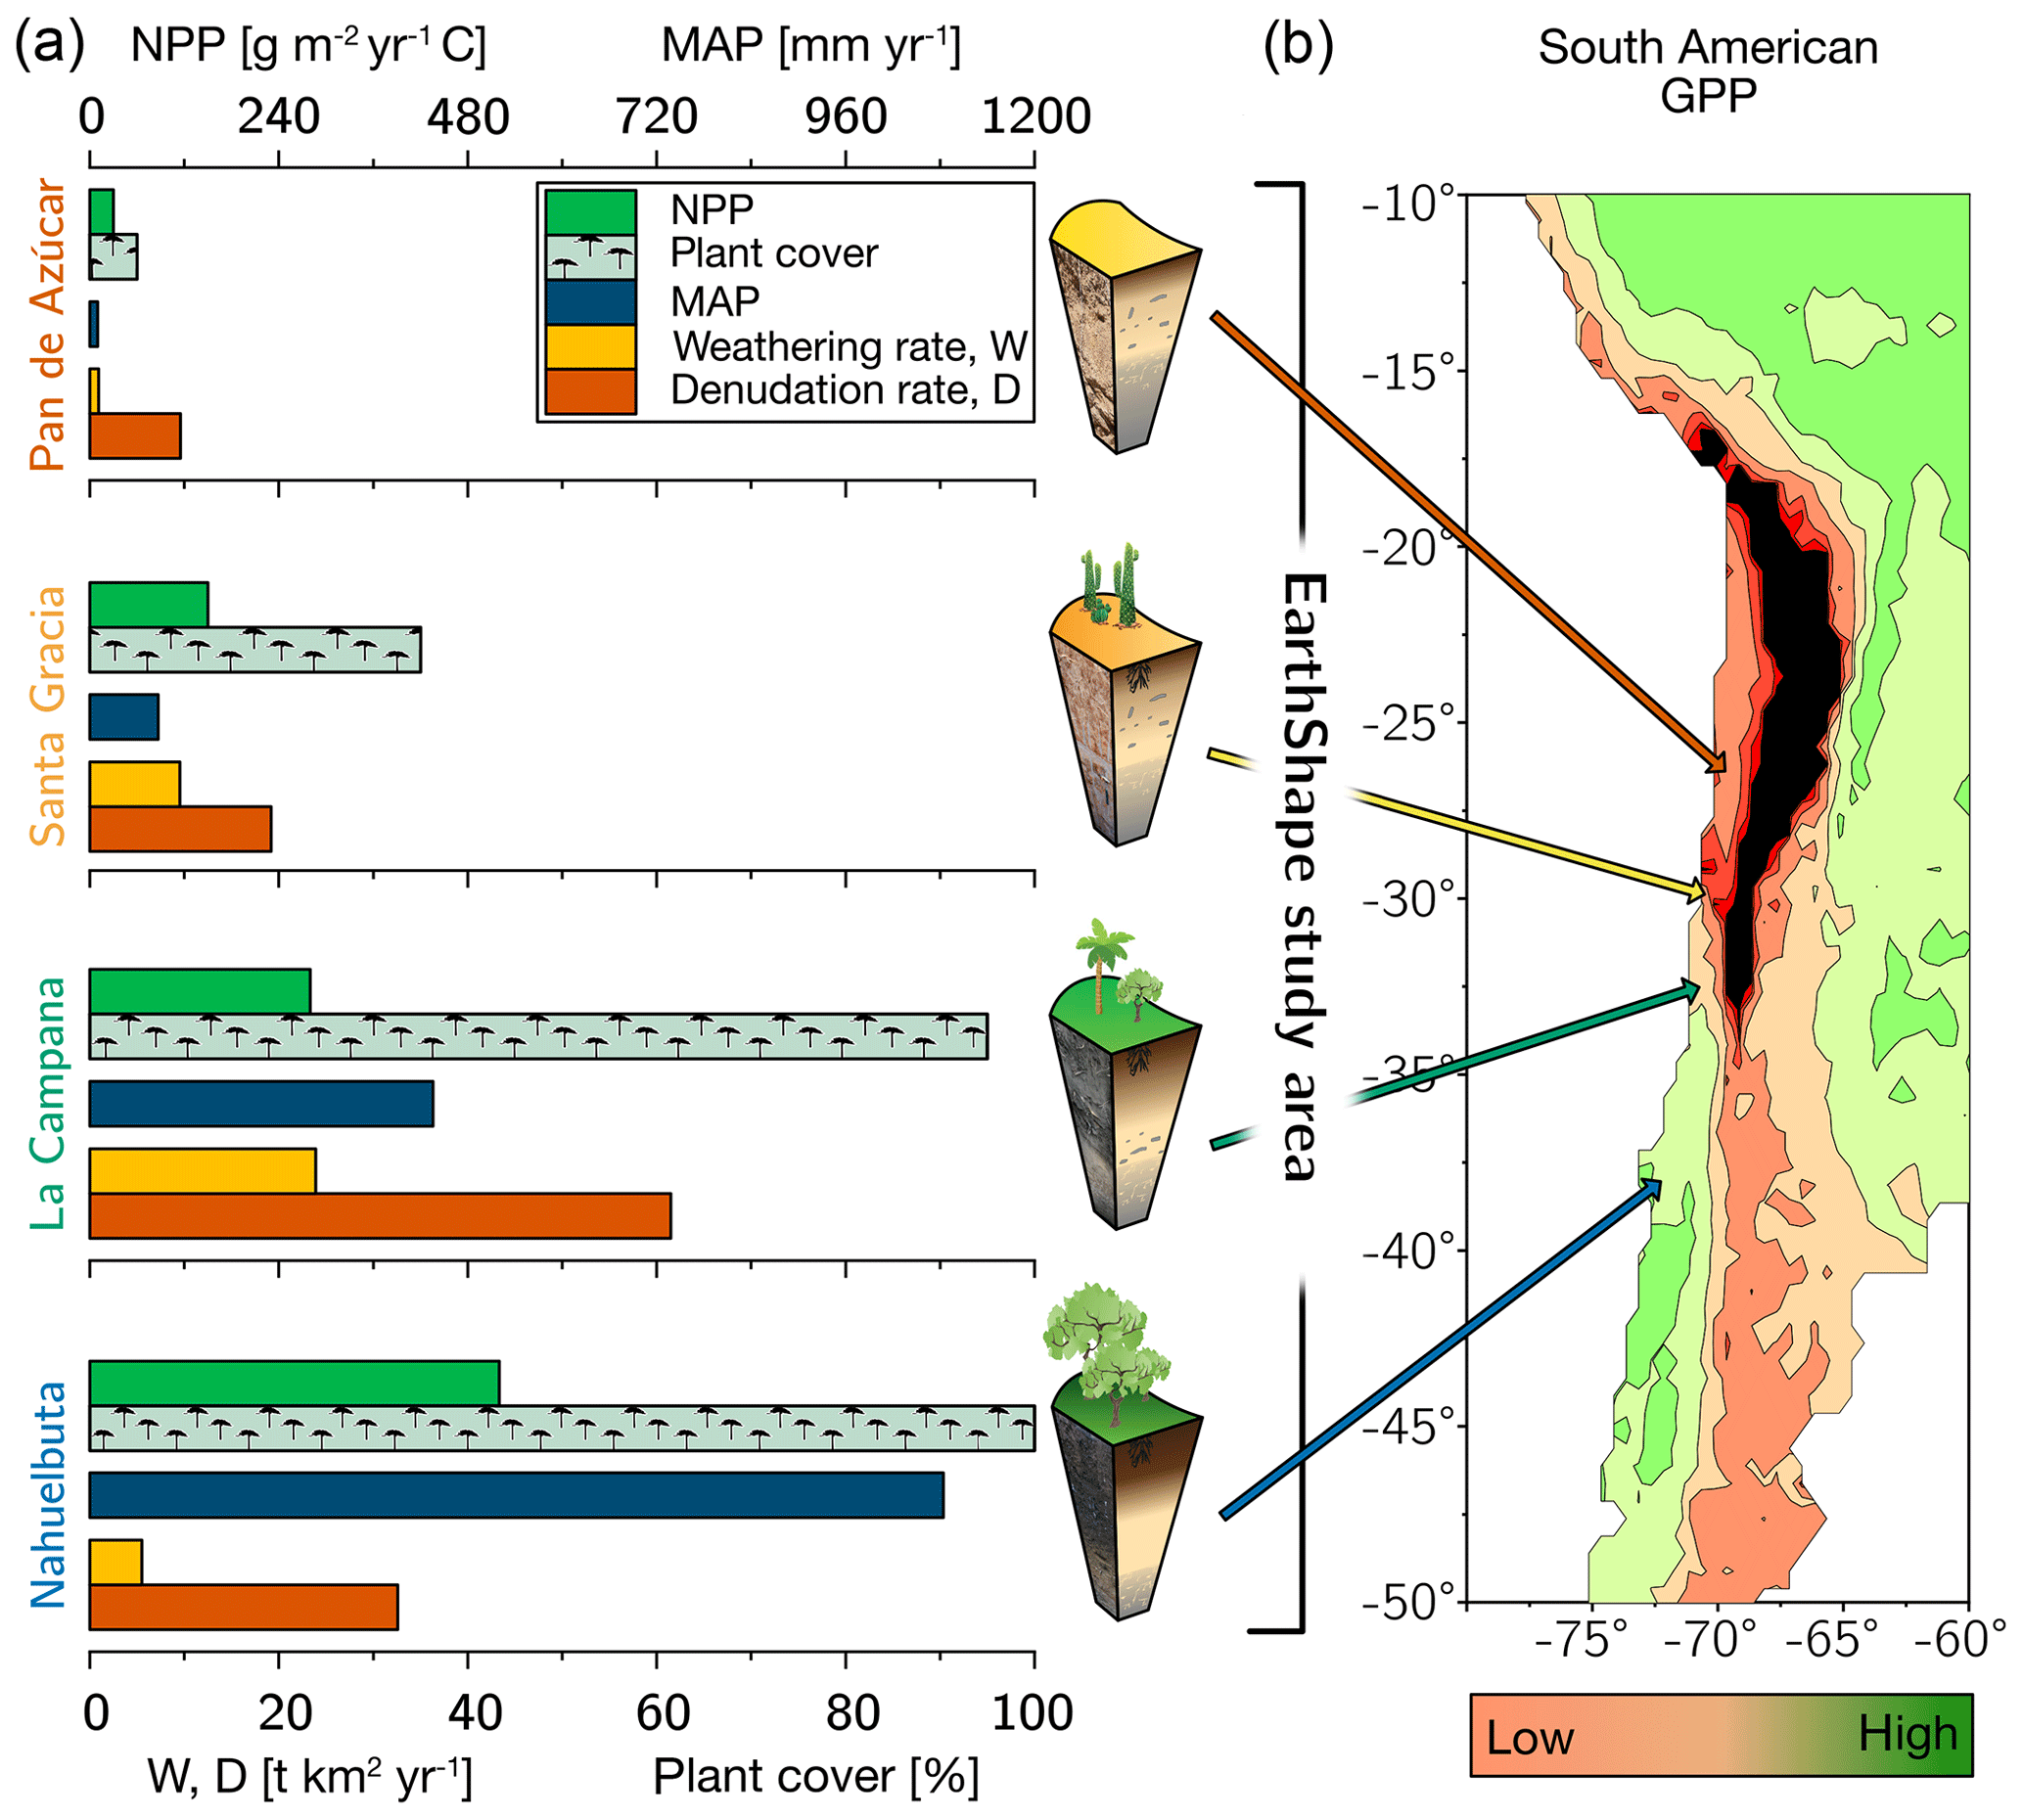
Figure 1The climate and vegetation gradient of the four EarthShape study sites (from arid to humid: Pan de Azúcar, Santa Gracia, La Campana, and Nahuelbuta). (a) Net primary productivity (NPP), plant cover, and annual precipitation (MAP). Denudation rate (D) and weathering rate (W) were determined with cosmogenic 10Be. (b) Position of the four study sites in South America and their respective gross primary productivity (GPP) derived from the FLUXNET database (Jung et al., 2011). Black is used to indicate very low GPP in the Atacama Desert. The uncertainties are not shown for clarity. They are provided in Table 1.
Net primary productivity (NPP), derived from a dynamic vegetation model (LPJ-GUESS) that simulates vegetation cover and composition during the Holocene (Werner et al., 2018), ranges from 30 and 150 g m−2 yr−1 C in the arid shrubland of Pan de Azúcar and Santa Gracia, respectively, to 280 g m−2 yr−1 C in the sclerophyllous woodland of La Campana, and is highest (520 g m−2 yr−1 C) in the humid-temperate forests of Nahuelbuta (Fig. 1, Table 1). The vegetation cover (<5 %) in Pan de Azúcar consists only of small shrubs, geophytes and annual plants (Armesto et al., 1993), which are mainly present in small ravines. The vegetation in Santa Gracia belongs to the “interior mediterranean desert scrub of Heliotropium stenophyllum and Flourensia thurifera” formation (Luebert and Pliscoff, 2006). Plants are affected by livestock grazing (mostly goats; Bahre, 1979), and vegetation cover is generally sparse. In La Campana the vegetation (almost 100 % ground cover) is part of the “coastal mediterranean sclerophyllous forest of Lithraea caustica and Cryptocarya alba” formation (Luebert and Pliscoff, 2006). The dominant vegetation in Nahuelbuta is associated with the “coastal temperate forest of Araucaria araucana” formation (Luebert and Pliscoff, 2006) and covers 100 % of ground area. Ecosystems at all sites are primarily nitrogen limited (Stock et al., 2019).
The basement at those sites is mainly composed of granitoid intrusions of late Carboniferous to Cretaceous age. The compositional variation ranges from monzogranites to syenogranites in Pan de Azúcar (199 Ma; Berg and Breitkreuz, 1983; Berg and Baumann, 1985; Parada et al., 2007), pyroxene- and hornblende-bearing diorites and monzodiorites in Santa Gracia (98–89 Ma; Moscoso et al., 1982), and tonalites and granodiorites in Nahuelbuta (Nahuelbuta complex, 294 Ma; Parada et al., 2007) and in the Caleu Pluton in La Campana with an intrusion age of 130 Myr (Molina et al., 2015; Parada and Larrondo, 1999; Parada et al., 2002).
For the soil pits studied here, denudation rates inferred from cosmogenic nuclides (in situ 10Be), interpreted as soil production rates, are 8–11 t km−2 yr−1 in Pan de Azúcar, 16–22 t km−2 yr−1 in Santa Gracia, 54–69 t km−2 yr−1 in La Campana, and 18–48 t km−2 yr−1 in Nahuelbuta (Schaller et al., 2018b). Catchment-wide denudation rates broadly agree with these soil-scale rates, except in La Campana. Here, they are higher, attributed to debris flows in valley tops due to the higher channel steepness than elsewhere (e.g., mean slope 23∘ in La Campana and 9∘ in Nahuelbuta; van Dongen et al., 2019). The relative consistency of these rates along the climate gradient is ascribed to consistent tectonic forces acting along the whole gradient (e.g., Blanco-Chao et al., 2014; Melnik, 2016), with the moderate increase in denudation rates at the two southern sites explainable with the combined effect of higher precipitation and increasing shielding by vegetation (Schaller et al., 2018b).
The architecture of the regolith profiles, their chemistry, mineralogy, and the physical properties of soils, saprolite, and the rocks beneath have been extensively described for four soil pits at each site by Bernhard et al. (2018), Dal Bo et al. (2019), Oeser et al. (2018) and Schaller et al. (2018b). The regolith profiles in Pan de Azúcar are located between 330 and 340 m above sea level (a.s.l.) on steep (25–40∘; Table 1) hill slopes. The soils on the north- and south-facing slopes were classified by Bernhard et al. (2018) as Regosols with only shallow A and B horizons of ∼20–30 cm thickness, lacking any kind of organic and litter layer. In this area, the processes disintegrating rock and developing regolith are mainly physical weathering, specifically a combination of insolation and salt weathering (Oeser et al., 2018). The regolith profiles in Santa Gracia are situated at almost 700 m a.s.l. on gently sloping hills (15–25∘; Table 1). The soils on the north-facing and south-facing slopes are a Leptosol and a Cambisol, respectively (Bernhard et al., 2018). Distinct O horizons and litter layers are not apparent. The Ah horizons in both profiles reach depths of 10 cm, and the transition from the mineral soil (Bw) into saprolite occurs at 25–30 cm depth. Oeser et al. (2018) attribute this sites' high degree of elemental depletion (50 % loss relative to bedrock as quantified by the chemical depletion fraction CDF; Fig. A1 in Appendix; Data Table S2) despite low precipitation to the low abundance of quartz and the high abundance of readily weatherable plagioclase and mafic minerals. The regolith profiles in La Campana, located at 730 m a.s.l. and on gently sloping hills (12–23∘), are classified as Cambisols. The O horizon is ∼5 cm thick and is followed by a Ah horizon, extending up to 40 cm depth (Bernhard et al., 2018). Here, the mineral-soil layer turns into saprolite at approximately 110 cm in both profiles (Table 1). The elemental depletion of Ca relative to bedrock increases from ∼45 % at the profiles' bottom towards ∼70 % at their top and can be classified as depletion (north-facing) or depletion and enrichment profiles (south-facing, Fig. A1; Data Table S2; Brantley and Lebedeva, 2011), respectively. The regolith profiles in Nahuelbuta are situated on gently sloping hills (∼15∘) at about 1200 m a.s.l. (Table 1). Bernhard et al. (2018) have classified the soils on the north-facing and south-facing slopes as Umbric Podzols and Orthodystric Umbrisols, respectively. Here, the Ah horizons measure up to 50 cm (with a greater thickness on the south-facing slope) and are overlain by an organic layer of 5.5 cm thickness. In the two regolith profiles, the soil–saprolite transition is at 100 and 120 cm depth, respectively. The coarse-grained saprolite disaggregates readily. These two profiles are characterized by highly heterogeneous weathering patterns caused by the incorporation of the metamorphic basement at various parts (e.g., Oeser et al., 2018; Hervé, 1977). Along the EarthShape north–south transect, many of the soil properties indicate crossing of several distinct pedogenic thresholds (Bernhard et al., 2018). We note that while the detailed geochemical work reported in this study is based on two profiles per site, the soil properties (Bernhard et al., 2018) and bulk geochemical data (Oeser et al., 2018) of these profiles are corroborated by two additional replicates per site, as reported in these previous studies. A comprehensive summary of the characteristics of the eight regolith profiles and major plant types is given in Table 1.
4.1 Sampling
Regolith samples were collected in a continuous sequence of depth increments from bottom to top. Increments amount to a thickness of 5 cm for the uppermost two samples, 10 cm for the third sample from top, and 20 cm thickness for the fourth sample onwards. To account for the dependence on solar radiation, two regolith profiles on adjacent hillslopes (north- and south-facing) were sampled at each study site (see Appendix B for further information on sample replication).
The underlying unweathered bedrock was not reached in any of the regolith profiles, and the depth to bedrock remains unknown. Thus, bedrock samples were collected from nearby outcrops. This sample set comprises the 20 bedrock samples already reported in Oeser et al. (2018) and 15 additional bedrock samples (in total 12 in Pan de Azúcar, 8 in Santa Gracia, 10 in La Campana, and 5 in Nahuelbuta).
Vegetation samples from representative shrubs and trees (grasses have been excluded) of each study site were sampled in the austral summer to autumn 2016. The sample set comprises material from mature plants of the prevailing species: Nolana mollis (Pan de Azúcar); Asterasia sp., Cordia decandra, Cumulopuntia sphaerica, and Proustia cuneifolia (Santa Gracia); Aristeguietia salvia, Colliguaja odorifera, Cryptocarya alba, and Lithraea caustica (La Campana); and Araucaria araucana, Nothofagus antarctica, and Chusquea coleu (Nahuelbuta). From each sampled plant (n=20), multiple samples of leaves, twigs, and stems were collected, pooled together, and homogenized prior to analysis. These samples were either taken using an increment borer (stem samples) or plant scissors (leaf and twig samples) equipped with a telescopic arm to reach the higher parts of trees. Roots could not be sampled in a representative manner, though we account for their influence on plant composition (see Appendix A). The litter layer, comprised of recently fallen leaves (from within the last 2 years) and small woody debris, was also sampled in La Campana and Nahuelbuta.
4.2 Analytical methods
4.2.1 Chemical composition of regolith and bedrock
The concentration of major and trace elements in bedrock and regolith samples was determined using a X-ray fluorescence spectrometer (PANalytical AXIOS Advanced) at the section for “Inorganic and Isotope Geochemistry”, GFZ German Research Centre for Geosciences. A detailed description of the analytical protocols and sample preparation is given in Oeser et al. (2018).
4.2.2 Chemical composition of vegetation
Major and trace element concentrations of vegetation samples were determined using a Varian 720-ES axial inductively coupled plasma optical emission spectrometry (ICP-OES) at the Helmholtz Laboratory for the Geochemistry of the Earth Surface (HELGES), GFZ German Research Centre for Geosciences (von Blanckenburg et al., 2016) with relative uncertainties smaller than 10 %. Prior to analysis, all samples were oven-dried at 120 ∘C for 12 h. Subsequently, leaves were crushed and homogenized. About 0.5 g of leaf and 1 g of woody samples were digested in PFA vials using a microwave (MLS start) and ultrapure concentrated acid mixtures comprising H2O2 and HNO3, HCl and HNO3, and HF. In some plant samples Si-bearing precipitates formed upon evaporation after digestion. These sample cakes were redissolved in a mixture of concentrated HF and HNO3 to ensure complete dissolution of Si prior to analysis. As some Si might have been lost by volatilization as SiF4 in this process, we do not include these samples (indicated by a * in Data Table S5) for the compilation of the plants' Si budget. With each sample batch, the international reference material NIST SRM 1515 Apple Leaves and a procedural blank were processed (Data Table S5).
4.2.3 Extraction of the bioavailable fraction and its chemical analyses
The bioavailable fraction of regolith samples was extracted using a sequential extraction procedure adapted from Arunachalam et al. (1996), He et al. (1995), and Tessier et al. (1979). The sequential extraction was performed in parallel on two regolith aliquots, and the supernatants were pooled together for analyses. About 2 g of dried and sieved (<2 mm) sample material were immersed in 14 mL 18 MΩ deionized H2O (water-soluble fraction) and then in 1 M NH4O Ac (exchangeable fraction; maintaining a sample:reactant ratio of ca. 1:7), and gently agitated. After each extraction, the mixture was centrifuged for 30 min at 4200 rpm (3392 g) and the supernatant was pipetted off. The remaining sample was then rinsed with 10 mL deionized H2O and centrifuged again (4200 rpm, 3392 g, 30 min) and the rinse solution added to the supernatant. Subsequently, the supernatants were purified using a vacuum-driven filtration system (Millipore®; 0.2 µm acetate filter), evaporated to dryness, and redissolved with ultrapure concentrated acid mixtures comprising H2O2, HNO3, and HCl. With each sample batch, international reference materials (NIST SRM 2709a San Joaquin soil, CCRMP TILL-1) were processed, along with a procedural blank.
The water-soluble fraction is comprised of elements contained in soil water in the form of free ions and ions that form complexes with soluble organic matter. It represents the most labile soil compartment and thus is most accessible to plants (e.g., He et al., 1995). This fraction was accessed by suspending the samples for 24 h in deionized H2O at room temperature. The exchangeable fraction comprises elements that form weak electrostatic bonds between the hydrated surfaces of phyllosilicates (i.e., clays and micas), oxyhydroxide minerals (e.g., boehmite, diaspore, goethite, lepidocrocite, ferrihydrite), and organic matter. This fraction was extracted by suspending the samples in a mechanical end-over-end shaker at room temperature in 1 M NH4O Ac for 2 h at 60 rpm (0 g). Note that none of the further extraction steps described in Tessier et al. (1979) have been applied to the regolith samples as they are believed to make a negligible contribution to the bioavailable fraction.
The element concentrations of the water-soluble and exchangeable fraction were determined using a Varian 720-ES axial ICP-OES at HELGES, following the analytical procedures described in Schuessler et al. (2016) with relative uncertainties estimated at smaller than 10 %. Soil P fractions were determined by Brucker and Spohn (2019). In this case, the bioavailable fraction refers to the inorganic products of the modified Hedley sequential P fractionation method of Tiessen and Moir (1993), specifically the water-extractable Pi and labile Pi, which was extracted by using 0.5 M NaHCO3.
4.2.4 87Sr∕86Sr isotope ratios
The radiogenic Sr isotope ratio was determined on bulk bedrock and regolith, the bioavailable fractions of saprolite and soil, and on the different plant organs at each study site.
After sample digestion (bulk samples) or sequential extraction (bioavailable fraction), Sr was separated from matrix elements using 200 µL Sr-spec resin. Matrix elements were removed by elution with 2.5 mL, 3 M and 2 mL, 7.5 M HNO3. Subsequently, Sr was eluted with 4 mL of 18Ω deionized H2O. Any organic crown ether that was released from the Sr-spec resin was removed after evaporation and subsequent redissolution of the Sr fraction in 1 mL of a 1:1 mixture of concentrated H2O2 and HNO3. This mixture was cooked in a tightly closed beaker at 150 ∘C for at least 12 h. Within each sample batch, a minimum of one standard reference material and one procedural blank were processed.
The samples of 87Sr∕86Sr were measured in a 50 ng g−1 pure Sr solution in 0.3 M HNO3 using a multi-collector inductively coupled plasma mass spectrometer (MC-ICP-MS, Thermo Neptune) in medium mass resolution. The MC-ICP-MS was equipped with an APEX-Q (ESI) desolvator, a nebulizer with an uptake rate of 70 µL min−1, and a nickel sampler cone. Radiogenic Sr isotope ratios were determined over one block of 20 cycles with an integration time of 16 s each. The sequence of a sample run was comprised of 10 to 12 blocks, where each block comprised a blank, 4 samples, and 5 SRM 987 that were not processed through chemistry. Blank correction of samples and reference material during the sequence was less than 0.4 % of the sample signal. The intensities of the ion beams on the masses 82Kr (L4), 83Kr (L3), 84Sr (L2), 85Rb (L1), 86Sr (central cup), 87Sr (H1), and 88Sr (H2) were monitored using Faraday collectors equipped with 1011Ω and one 1012Ω (connected to L4 cup) resistors. Isobaric interference on the masses 84, 86, and 87 were corrected for with the Kr and Rb isotope ratios measured prior to the sequence run. To correct for any natural and instrumental isotope fractionation, the measured 87Sr∕86Sr ratio was normalized to a 88Sr∕86Sr ratio of 8.375209 (value taken from Nier,1938) by using an exponential law. Finally, the 87Sr∕86Sr ratios were corrected for a session offset that accounts for the differences between the certified and measured 87Sr∕86Sr ratio of the SRM 987 reference material, which in any case were smaller than ±0.00006 (2 SD).
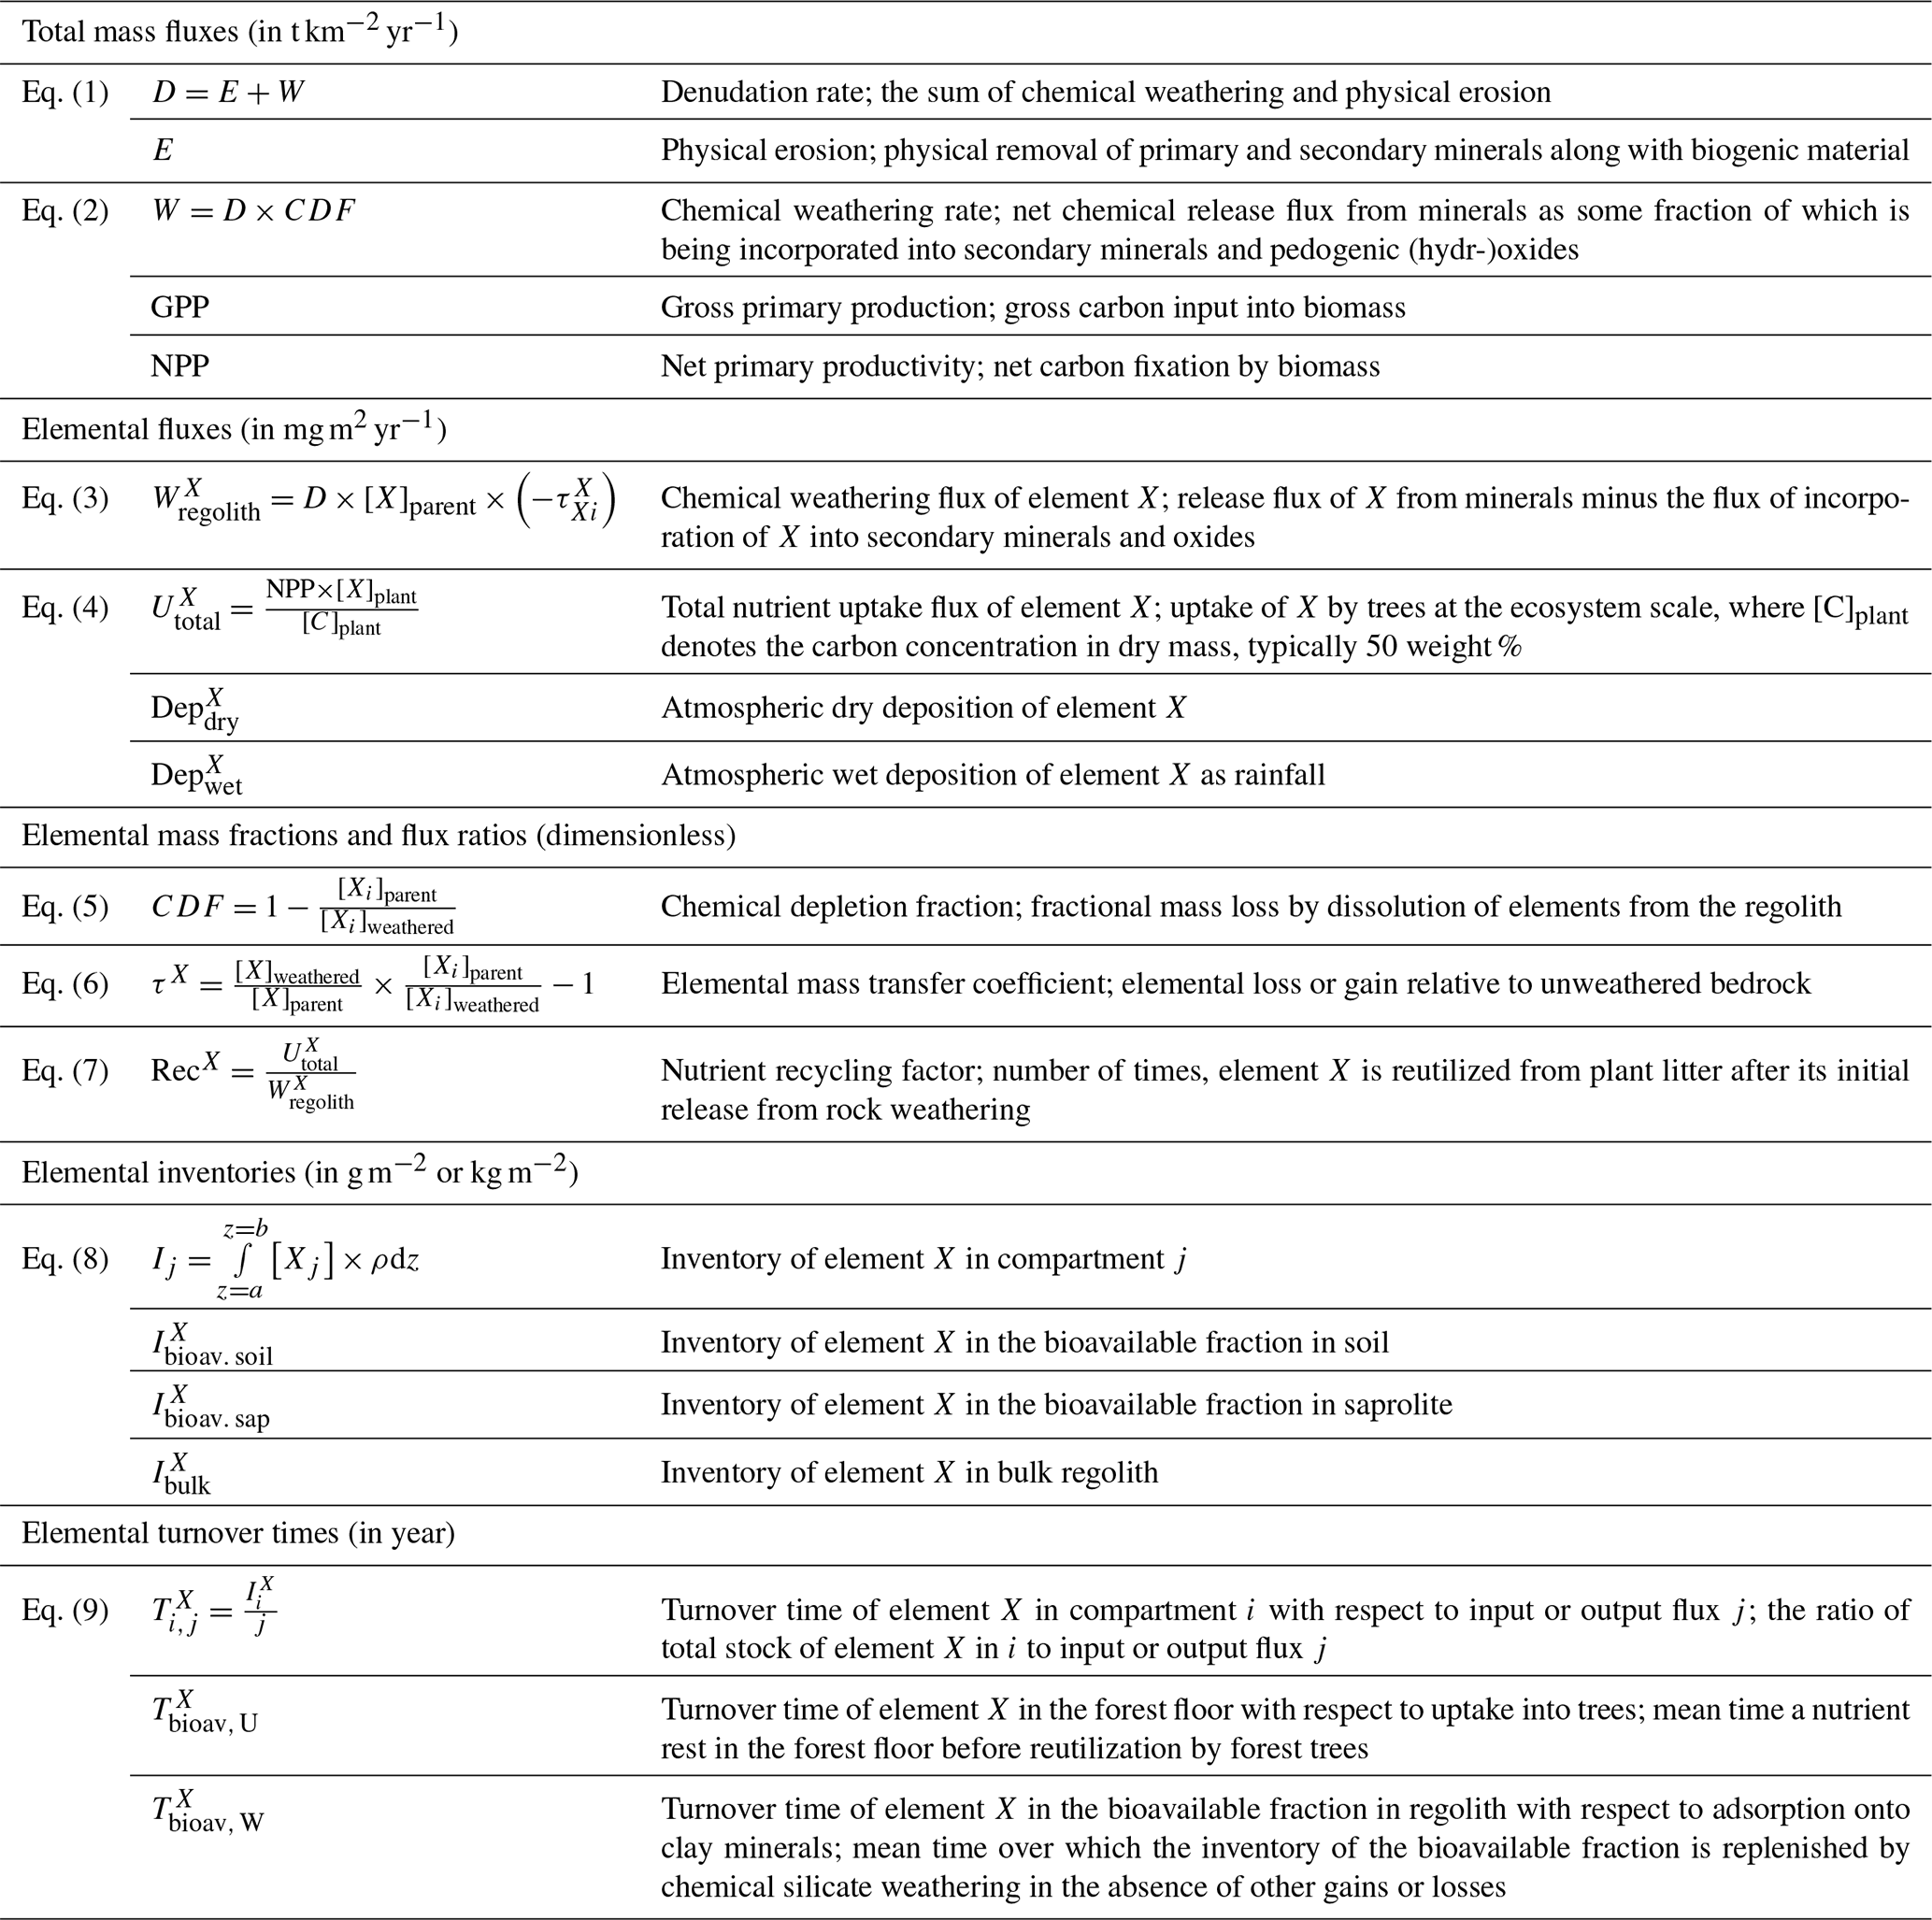
Table 2Glossary of metrics for the parameterization of the geogenic nutrient pathway and organic nutrient cycle in terrestrial ecosystems following Uhlig and von Blanckenburg (2019).
4.3 Parameterizing geogenic and biogenic element fluxes in a terrestrial ecosystem
The parameterization of the “geogenic nutrient pathway” and the “organic nutrient cycle” (Fig. 2) to characterize element fluxes into, within, and from the Critical Zone and its ecosystem components is thoroughly described in Uhlig and von Blanckenburg (2019). Here, we only briefly summarize the metrics, which are shown in Table 2. Calculations and parameters used for these metrics are presented in Appendix A, including the propagation of uncertainties. A statistical analysis (i.e., ANOVA, Pearson correlation coefficients) of the weathering parameters is presented in Appendix B.

Figure 2Conceptual framework of an ecosystem comprising the “geogenic nutrient pathway” and the “organic nutrient cycle” (modified from Uhlig and von Blanckenburg, 2019). Whereas the former is mainly set by mineral nutrient release by weathering () and to a minor extent by atmospheric wet () and dry deposition (), the organic nutrient cycle is mainly affected by nutrient reutilization (i.e., recycling; RecX) from organic matter. (a) The different compartments (i.e., rock, saprolite, soil, and plants) are shown as boxes. They include the metrics used to quantify their properties, such as the inventory and turnover time of element X in compartment j. (b) The compartments are linked by fluxes (arrows) with the thickness of them denoting their relative proportions. denotes erosion of soil.
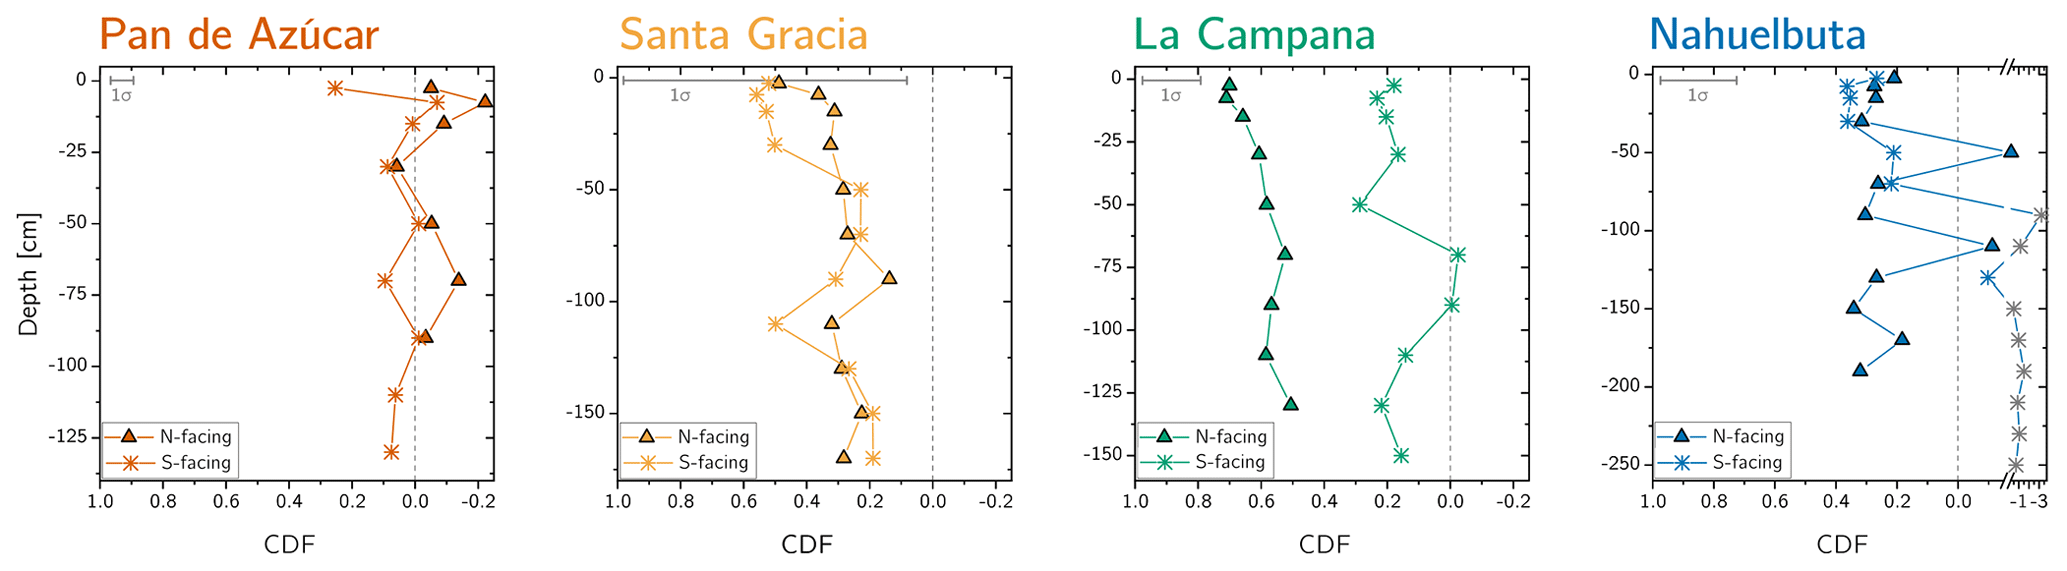
Figure 3Chemical depletion fraction (CDF) for each study sites' north- and south-facing profile. The accuracy of the absolute CDF values is limited by the variability in the bedrock's Zr concentration in the respective study sites and are indicated as a grey 1σ bar (Data Table S1). The grey symbols correspond mainly to saprolite samples in the south-facing regolith profile in Nahuelbuta and are excluded from further consideration. Note that in Nahuelbuta a different scaling compared to the other study sites applies after the axis break.
4.4 Data reporting
The original data and those pertaining to the companion paper (Oeser and von Blanckenburg, 2020a) can be found in a separate open-access data publication (Oeser and von Blanckenburg, 2020b). These tables are referred to as “Data Tables S1 to S5”.
We structure the presentation of our results in the following sequence: (1) the element fluxes of the geogenic nutrient pathway, (2) the availability of elements in regolith to plants, and (3) the plant chemical composition along with the element fluxes that couple the geogenic nutrient pathway to the organic nutrient cycle. The fluxes are presented as study-site averages, with the full dataset available in an associated open-access data publication (Oeser and von Blanckenburg, 2020b).
We focus the detailed presentation of these results on P and K, the two most important rock-derived mineral nutrients to plants. Further data are provided for Al, Ca, Fe, Mg, Mn, Na, Si, and Sr. All metrics are defined in Table 2.
5.1 Element fluxes contributing to the geogenic nutrient pathway
5.1.1 Degree of weathering and elemental gains and losses
The chemical depletion fraction (CDF; Table 2, Eq. 5 and Appendix A) and elemental mass transfer coefficient (τ; Table 2, Eq. 6 and Appendix A) disclose the total and the element-specific loss, respectively, of soluble elements relative to bedrock. Thus, both metrics quantify the degree of weathering. The average CDF of the shallowest subsoil (combined analysis of north- and south-facing profiles) in Pan de Azúcar, Santa Gracia, La Campana, and Nahuelbuta amounts to 0.03, 0.54, 0.50, and 0.25, respectively (Fig. 3; Data Table S2). At all four sites, the elemental losses (Fig. A1; Data Table S2) can be attributed to a “kinetically limited weathering regime” (Brantley and Lebedeva, 2011). This means that the erosion rate is at a sufficient level to continuously replenish the weatherable primary minerals that transit vertically through the weathering profile.
Systematic differences in chemical depletion (i.e., CDF and τ) are not discernible between north- and south-facing slopes. Anomalously high Zr concentrations throughout the entire north-facing profile at La Campana cause one exception to this rule. Moreover, we found that neither CDF nor τX differ significantly between Santa Gracia, La Campana, and Nahuelbuta, despite both increasing precipitation and increasing biomass growth.
A comprehensive presentation of these data can be found as Appendix in Fig. A1 and in Data Table S2.
5.1.2 Elemental chemical weathering fluxes
The soil weathering rate W quantifies the bulk weathering flux from rock and regolith. This flux is lowest in Pan de Azúcar (0–0.9 t km−2 yr−1) and highest in La Campana (53.7–69.2 t km−2 yr−1). In Santa Gracia (7.2–11.9 t km−2 yr−1) and Nahuelbuta (3.5–7.5 t km−2 yr−1, Table 1; Oeser et al., 2018; Schaller et al., 2018b), these fluxes are at a similarly intermediate level.
Table 3Elemental weathering fluxes () and ecosystem nutrient uptake fluxes () in Pan de Azúcar, Santa Gracia, La Campana, and Nahuelbuta along with the respective study site's average soil denudation rate (D) and net primary productivity (NPP).
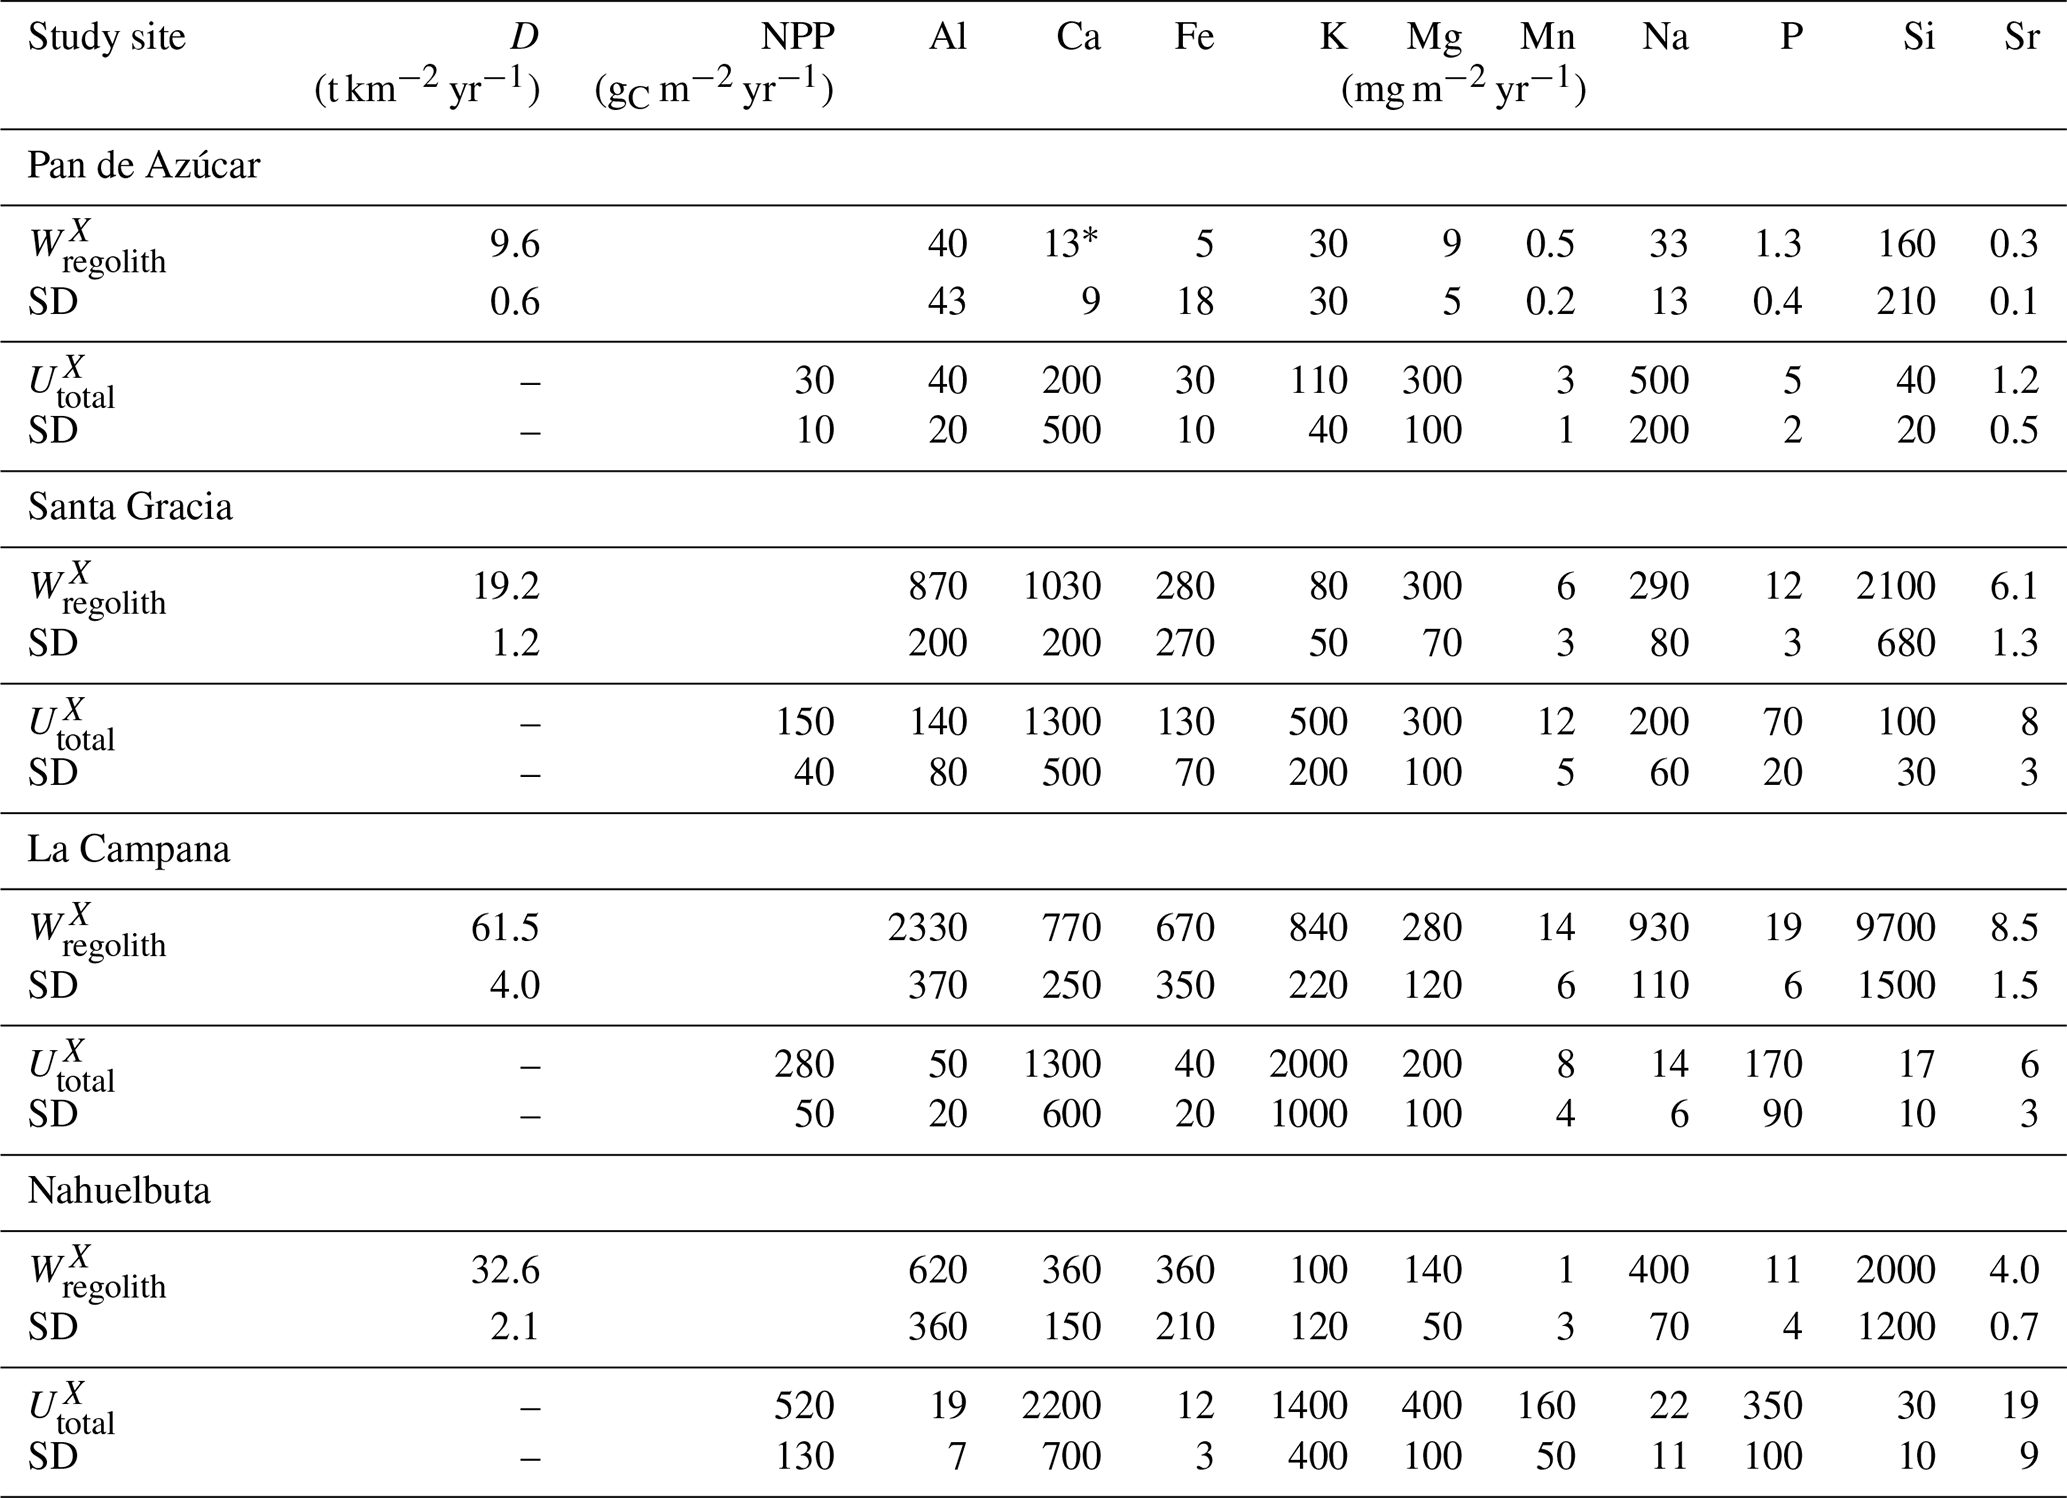
* only includes information from AZPED21 (N-facing slope regolith profile) as atmospheric deposition of Ca in the S-facing slope led to (theoretically) negative weathering fluxes. Uncertainties in weathering fluxes are estimated by Monte Carlo simulations, where the SD of the respective profile's denudation rate, the SD of the bedrocks' element concentration of interest, and 3 % relative uncertainty in the element concentration in regolith samples have been used. Uncertainties in nutrient uptake fluxes are estimated by Monte-Carlo simulations, where the SD of the respective study site's net primary productivity (NPP) and the SD of the chemical composition of the weighted above-ground living ecosystem have been used (Table 4).
(Table 2, Eq. 3, and Appendix A) quantifies element-specific release fluxes from rock and regolith by weathering. It thus assesses the maximum possible weathering supply of nutrients to plants by the “geogenic pathway”, as some of this flux is potentially lost into groundwater before being accessible to roots. The weathering–release fluxes for phosphorus () amount to 1.3±0.4, 12±3, 19±6, and 11±4 mg m−2 yr−1 and of potassium () to 30±30, 80±50, 840±220, and 100±120 mg m−2 yr−1 (Fig. 4, Table 3) in Pan de Azúcar, Santa Gracia, La Campana, and Nahuelbuta, respectively. Similar trends are seen for Al, Na, and Si, as well as Fe and Sr. The rates of supply of P, K, and the aforementioned elements are thus similar at both Santa Gracia and Nahuelbuta despite the differences in MAP, NPP, and vegetation cover. and deviate from this general pattern: the highest Ca and Mg weathering–release fluxes occur in Santa Gracia, followed by La Campana, Nahuelbuta, and Pan de Azúcar. These elevated fluxes in Santa Gracia are attributed to the initial bedrock mineralogy, with their high Ca and Mg concentration (Data Table S1).
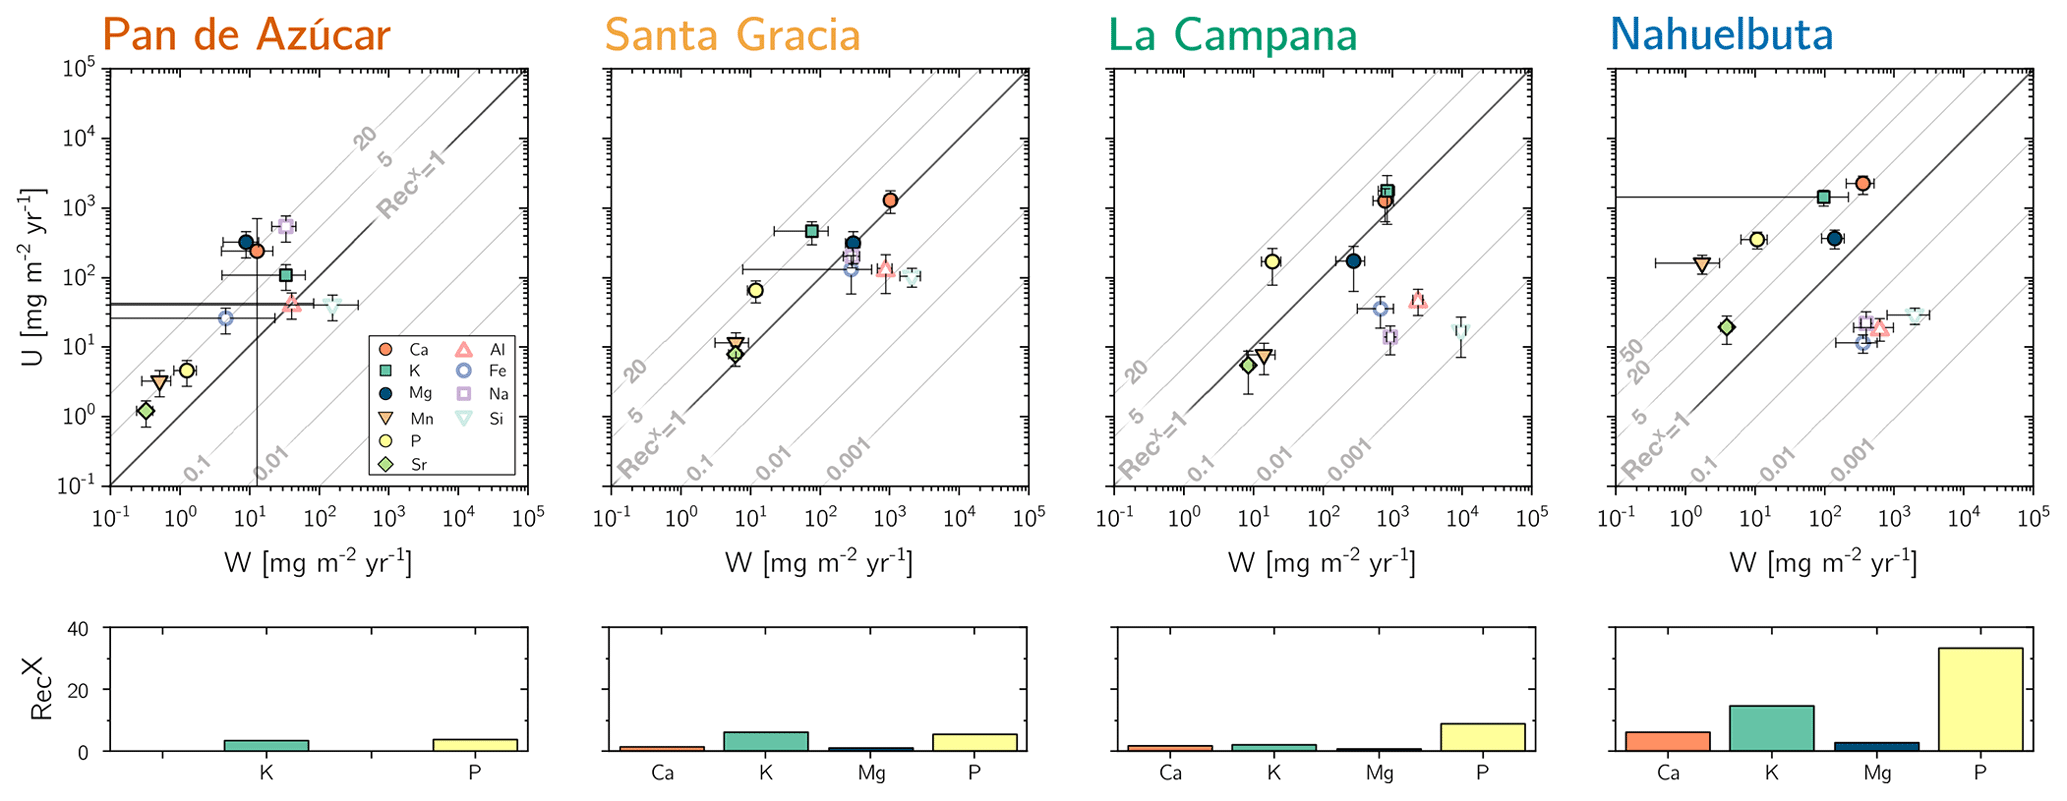
Figure 4Chemical weathering flux () and plant nutrient uptake fluxes () for Pan de Azúcar, Santa Gracia, La Campana, and Nahuelbuta (from left to right) for mineral nutrients. Grey contour lines emphasize the nutrient recycling factor (RecX), which is the ratio of to . Uncertainty bars show 1 SD. Differences in nutrient recycling factors for Ca, K, Mg, and P among the four study sites are highlighted in the lower panels. Note that here we use the RecX calculated for from silicate weathering only. In Table 5 and Fig. A4 we also show RecX including atmospheric inputs. Because Pan de Azúcar Ca and Mg inputs are exclusively atmospheric, their RecX is overestimated and thus not plotted on the lower-left panel.
5.2 Availability of mineral nutrients to plants
The maximum amount of mineral nutrients present can be assessed by determining their inventory in bulk regolith (; Table 2, Eq. 8 and Appendix A). For most elements is by far greatest in Santa Gracia (apart from K and Si; Table A1). at the other three study sites is at similar levels. Element concentrations in the bioavailable fraction are orders of magnitude lower than in the bulk regolith (Figs. A2 and A3, Data Table S3). Bioavailable P in saprolite () is virtually absent in Pan de Azúcar and amounts to 21, 39, and 23 g m−2 in Santa Gracia, La Campana, and Nahuelbuta, respectively (Table A1). equals 253 in the northernmost site and 23, 70, and 19 g m−2 at the sites moving progressively southwards. The inventory of the remaining mineral nutrients in saprolite generally decreases from north to south. Accordingly, the total inventory (i.e., the sum of all determined inventories) is highest in Pan de Azúcar (5100 g m−2), intermediate in Santa Gracia (2100 g m−2) and La Campana (1600 g m−2), and lowest in Nahuelbuta (140 g m−2; Table A1). Note that was calculated over the uppermost 1 m of saprolite, whereas in fact the zone of mineral nutrient extraction might extend deeper (Uhlig et al., 2020). Bioavailability in soil features a similar trend. The total inventory is highest in Pan de Azúcar (2100 g m−2), on par in Santa Gracia (960 g m−2) and La Campana (1000 g m−2), and despite featuring the thickest soils, lowest in Nahuelbuta (200 g m−2). P deviates from this general trend: amounts to 3.3 g m−2 in Pan de Azúcar, 22 g m−2 in Santa Gracia, 28 g m−2 in La Campana, and 31 g m−2 in Nahuelbuta (Table A1). behaves differently, and amounts to 53, 38, 90, and 38 g m−2 in Pan de Azúcar, Santa Gracia, La Campana, and Nahuelbuta, respectively. Thus, K is almost equally available to plants in all four study sites.
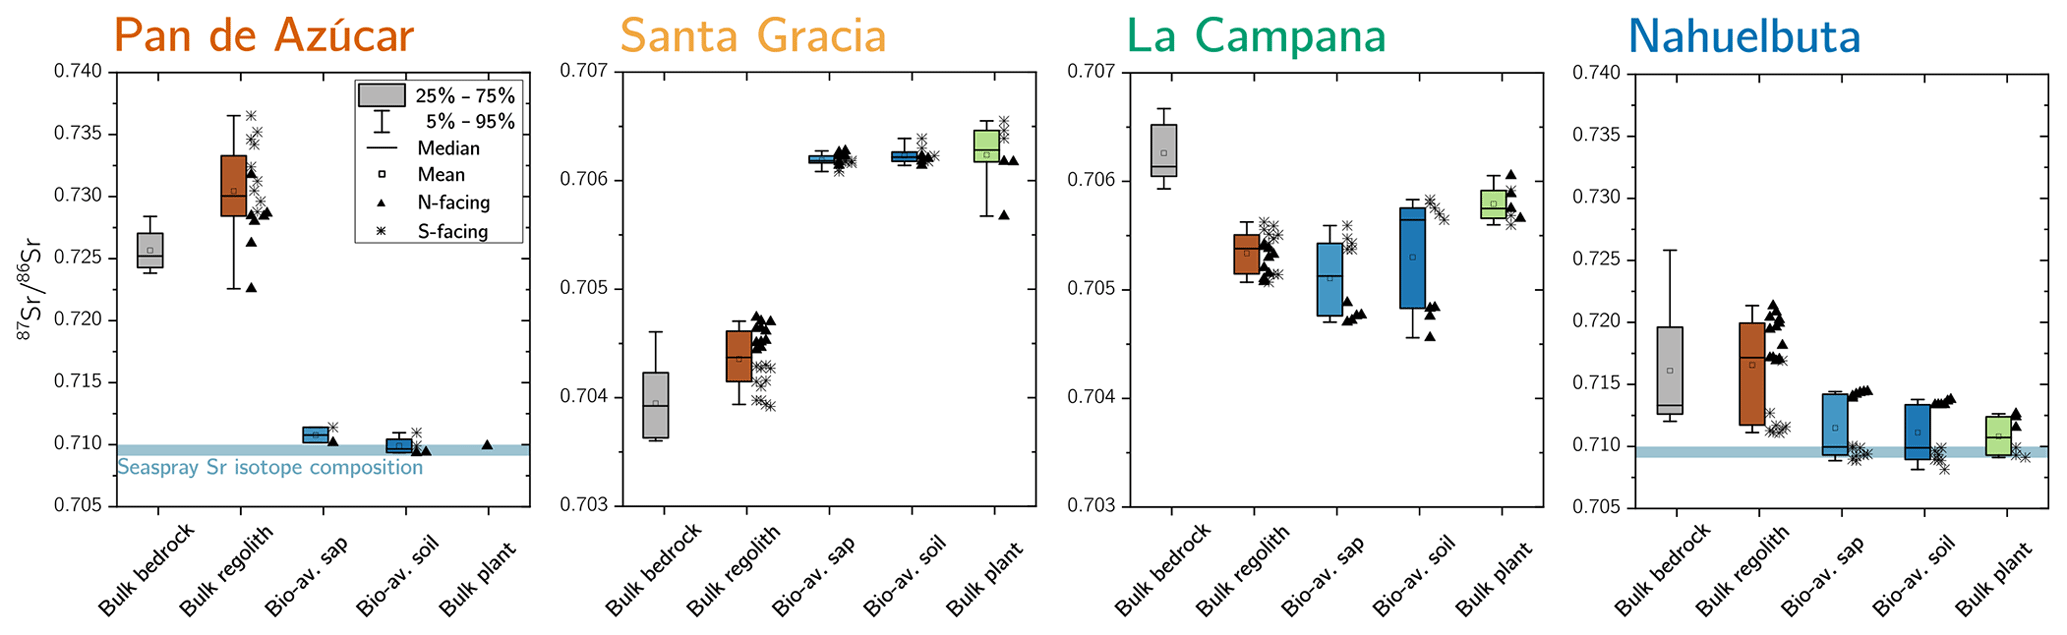
Figure 5Average 87Sr∕86Sr isotope composition of bedrock, bulk regolith, and the bioavailable fraction in saprolite, soil, and plants in Azúcar, Santa Gracia, La Campana, and Nahuelbuta. The 87Sr∕86Sr isotope ratios of bulk plant (green) are weighted according to the single species' organs relative growth rate (see Table 4 for weighting parameters). Whiskers span 90 % of the respective dataset. On the boxes' right-hand side, the differences between north- and south-facing regolith profiles are depicted. Note that bulk regolith samples in Nahuelbuta with anomalously low Zr concentrations have been excluded from this analysis as they are suspected to comprise a different parent rock. The y axis covers a broader range in Pan de Azúcar and Nahuelbuta than in Santa Gracia and La Campana.
5.3 Plant element composition and nutrient-uptake fluxes
Average elemental concentrations in bulk plants generally decrease from Pan de Azúcar towards Nahuelbuta. For example, the Al and Na concentrations in the plants of Pan de Azúcar reach 2700 and 34600 µg g−1, respectively, compared with minima of 70 and 80 µg g−1 in Nahuelbuta. However, element-specific deviations from this pattern exist (Table 4). The most prominent exceptions are those of P and K. Average P concentration increases from 290 µg g−1 in Pan de Azúcar to 1400 µg g−1 in Nahuelbuta. The average K concentration amounts to 6900, 6400, 12 000, and 5400 µg g−1 along the north–south gradient. Thus, in Pan de Azúcar, Santa Gracia, and Nahuelbuta, average K concentrations are in a similar range, whereas in La Campana, K concentration in plants is almost 2 times higher than in the other sites (Table 4). In Pan de Azúcar and Santa Gracia some elemental concentrations in plants are exceptionally high. This elevated mineral nutrient storage is typical for plants growing in infertile habitats (Chapin III et al., 2011). Accumulation of such an internal nutrient pool allows for plant growth when conditions improve, e.g., during rare rain events (e.g., Chapin III, 1980; Chapin III et al., 2011; Vitousek et al., 1998). For example, high amounts of Al and Na are incorporated into plants tissues, though they may hinder plant growth at high concentrations (e.g., Delhaize and Ryan, 1995; Kronzucker and Britto, 2011). However, Al toxicity is prevented in these plants by accumulation of correspondingly high amounts of Si that compensates for the effects of Al (Liang et al., 2007). The exceptionally high Na concentration in N. mollis in Pan de Azúcar is typical of the metabolism of N. mollis, which is known to be covered with salt glands on its leaves, aiding it to retrieve water by directly condensing moisture from unsaturated air (Rundel et al., 1980; Mooney et al., 1980).
Table 4Chemical composition of the above-ground living plants. Plant organs have been weighted according to Niklas and Enquist (2002), using the plant organs' relative growth rate (see Appendix A). Relative growth rates and relative abundance of the different plant species can be found below the table. The unweighted chemical composition of each plant organ is listed in Data Table S5.
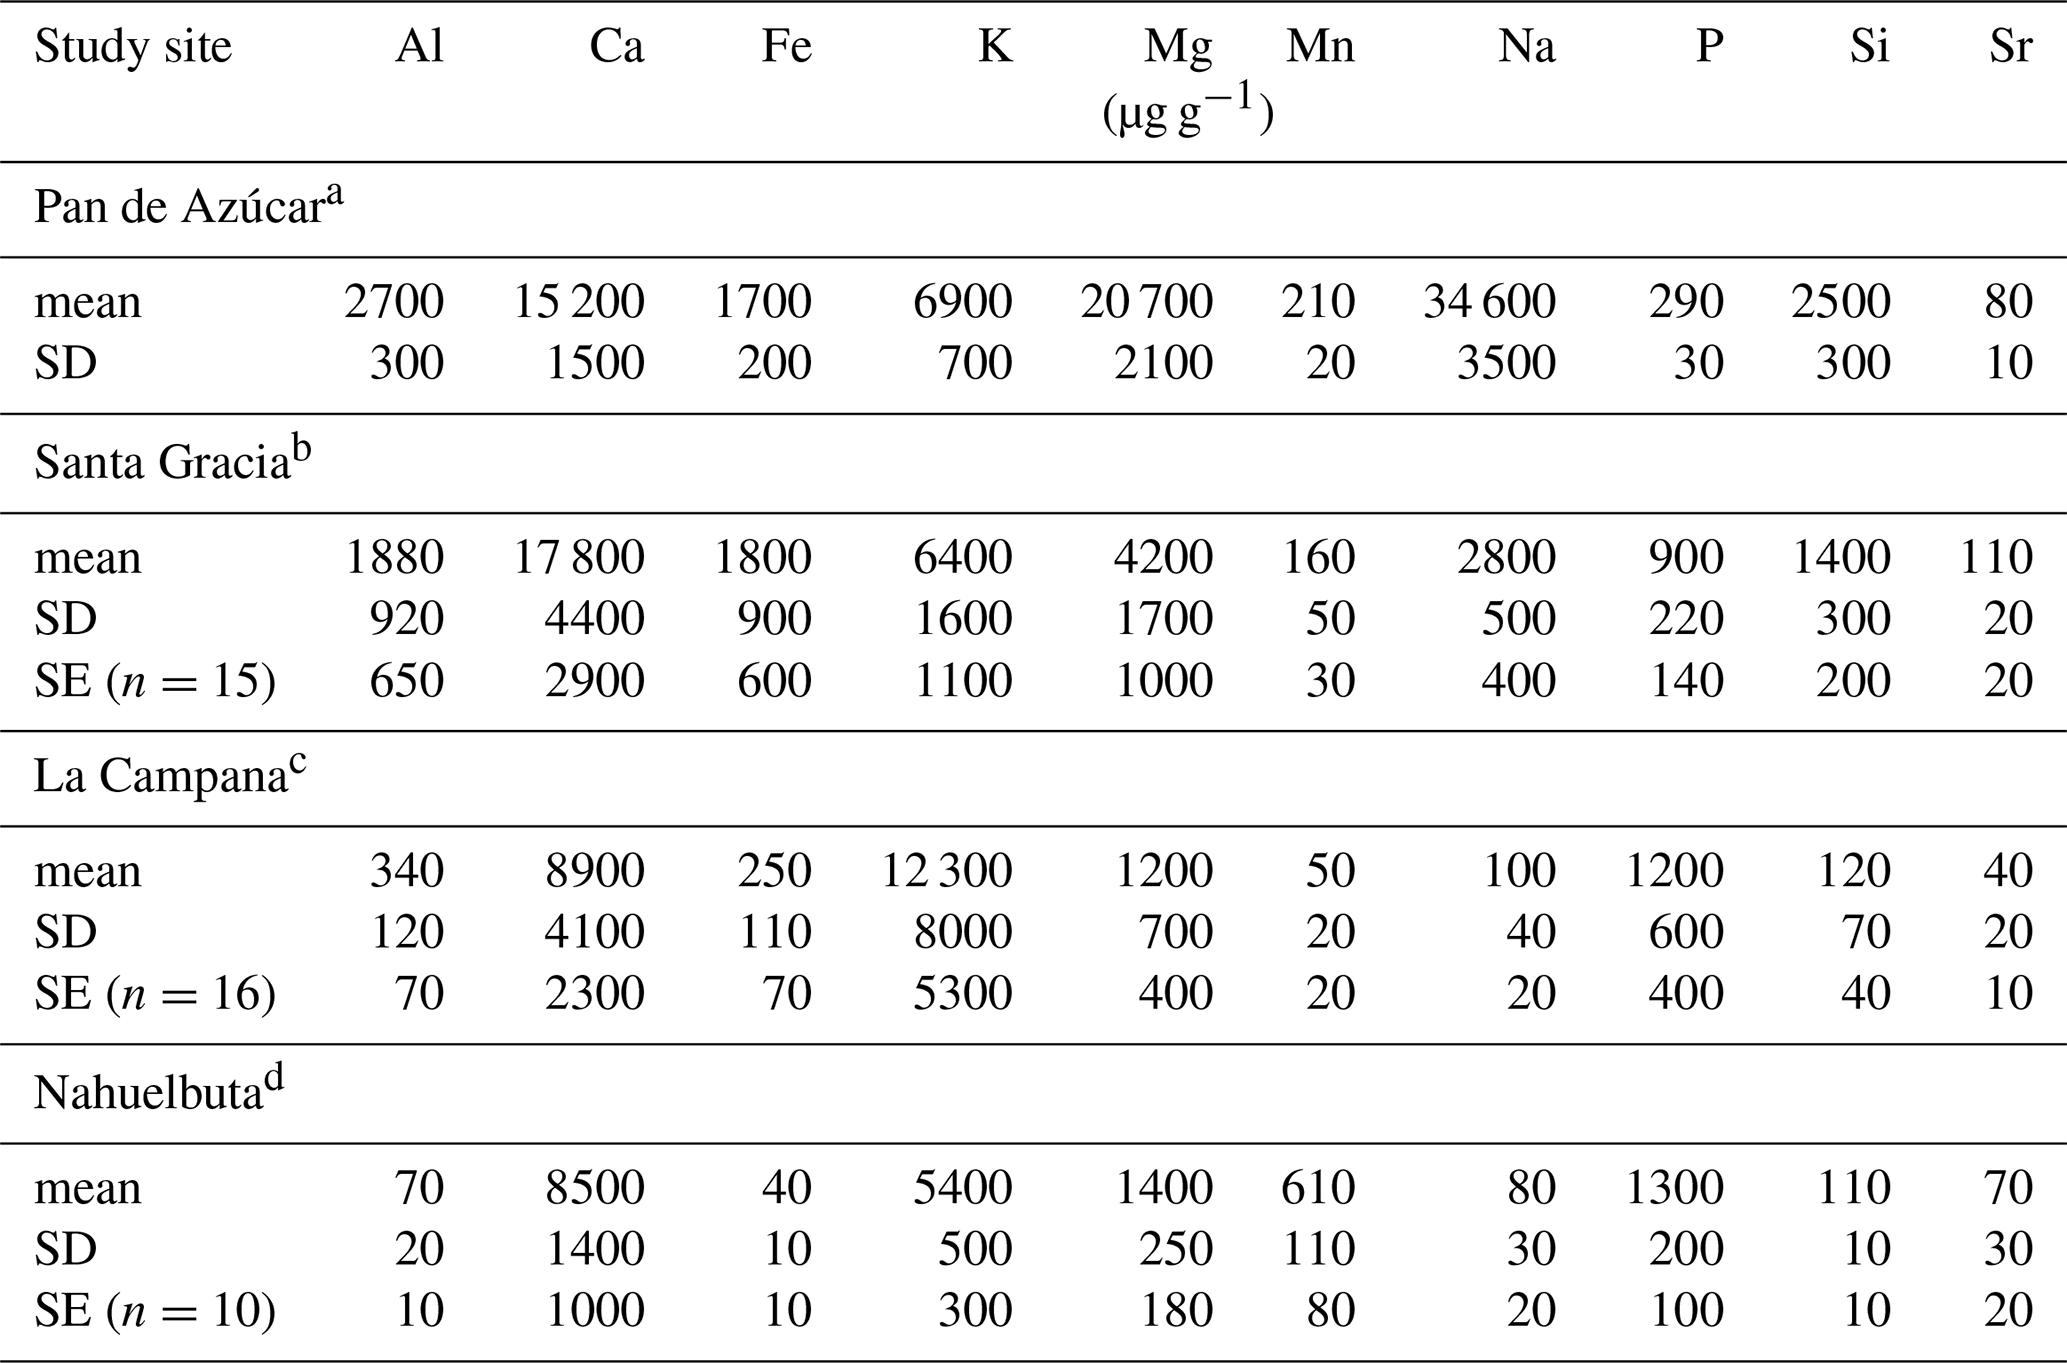
Standard deviation and standard error relate to the variability within the dataset of each ecosystem. Where natural replicates were not available (i.e., in Pan de Azúcar), 10 % relative uncertainty has been assumed. a Pan de Azúcar ecosystem composition: 100 % Nolona mollis; 32 % and 68 % relative leaf and stem growth, respectively, accounting for 5 % leaf and 95 % stem standing biomass. b Santa Gracia ecosystem composition: 25 % each of Asterasia sp., Cordia decandra, Cumulopuntia sphaerica, and Proustia cuneifolia; 32 % and 68 % relative leaf and stem growth assumed for all species, respectively, accounting for 5 % leaf and 95 % stem standing biomass. c La Campana ecosystem composition: 5 % each for Aristeguietia salvia and Colliguaja odorifera and 45 % each for Cryptocaria alba and Lithraea caustica; 32 % and 68 % relative leaf and stem growth assumed for all species, respectively, accounting for 5 % leaf and 95 % stem standing biomass. d Nahuelbuta ecosystem composition: 60 % Araucaria araucana, 10 % Chusquea culeou, and 30 % Nothofagus antarctica; 48 % and 52 % relative leaf and stem growth assumed for Araucaria araucana, respectively, accounting for 16 % leaf and 84 % stem standing biomass; 32 % and 68 % relative leaf and stem growth assumed for Chusquea culeou and Nothofagus antarctica, respectively, accounting for 5 % leaf and 95 % stem standing biomass.
The nutrient-uptake fluxes (; Table 2, Eq. (4) and Appendix A) of P and K increase from north to south, such that amounts to 5±2, 70±20, 170±90, and 350±100 mg m−2 yr−1 and amounts to 110±40, 500±200, 2000±1000, and 1400±400 mg m−2 yr−1 in Pan de Azúcar, Santa Gracia, La Campana, and Nahuelbuta, respectively (Table 3). of the elements Ca, K, Mg, Mn, P, and Sr exceeds up to several times. and is similar for Mg, Mn, and Sr in La Campana (Fig. 4; Table 3). of the remaining elements is, with the exception of Fe and Na in Pan de Azúcar, always lower than its release by weathering.
5.4 87Sr∕86Sr isotope ratios
Radiogenic Sr isotope ratios on bulk bedrock and regolith samples disclose mineral-weathering reactions and the incorporation of external sources into the regolith profiles. Moreover, 87Sr∕86Sr in the bioavailable fraction and plants reveal the plants' mineral nutrient sources.
In Pan de Azúcar, the 87Sr∕86Sr ratio of average bedrock is 0.726±0.002 (Fig. 5, Table A2). In regolith, 87Sr∕86Sr differs significantly between the two profiles (0.728±0.003 and 0.733±0.003 on the north- and south-facing regolith profile, respectively) which can be attributed to varying degrees of atmospheric deposition (87Sr∕86Srseaspray=0.7092; Pearce et al., 2015). The 87Sr∕86Sr ratios in the bioavailable fraction of saprolite and soil deviate by 0.02 from those of bulk bedrock and regolith but do not vary considerably between saprolite and soil or between the north- and south-facing slopes. Bulk plant samples yield 87Sr∕86Sr ratios of 0.710 and are thus indistinguishable from the 87Sr∕86Sr ratio in the bioavailable fraction (0.710±0.001; Fig. 5, Table A2).
In Santa Gracia, the 87Sr∕86Sr ratios in both bedrock and the regolith profiles do not differ significantly (87Sr∕86Sr, 87Sr∕86Sr; Fig. 5, Table A2). The radiogenic Sr composition of the bioavailable fractions in saprolite and soil are identical within uncertainty, and no differences in 87Sr∕86Sr between the north- and south-facing regolith profile are apparent. Plants yield an average 87Sr∕86Sr ratio of 0.7062±0.0001 and are thus indistinguishable from the bioavailable fractions in saprolite and soil (Fig. 5, Table A2).
The bulk regolith 87Sr∕86Sr ratio in La Campana ranges from 0.7051 in the north-facing regolith profile to 0.7055 in the south-facing regolith profile. These ratios are lower than bedrock (0.7063±0.0003; Fig. 5, Table A2), which can be attributed to the loss of a mineral with a high 87Sr∕86Sr isotope ratio (e.g., biotite) beneath the sampled regolith profiles. The radiogenic Sr composition of the bioavailable fraction in saprolite and soil amounts to 0.7051 and 0.7053 in the north-facing and south-facing slopes, respectively, and is within the range of bulk regolith. The average 87Sr∕86Sr ratio in plants is 0.7059 and can be as high as 0.7063 in Cryptocaria alba (Data Table S7), which is thus higher than the soil and saprolite bioavailable fractions. All of these ratios are lower than in bulk bedrock.
In Nahuelbuta the radiogenic Sr isotope ratio in bedrock (0.716±0.007) is in good agreement with those reported by Hervé et al. (1976) for the granitoid basement (0.717). However, the large spread among the bedrock samples implies petrological and geochemical heterogeneity of the Nahuelbuta mountain range (e.g., Hervé, 1977). Thus, 87Sr∕86Sr in regolith is also variable (Fig. 5, Table A2 and Data Table S2). The 87Sr∕86Sr ratios in both bioavailable fractions in Nahuelbuta are restricted to a relatively narrow range in both regolith profiles, equal to 0.711±0.002, and are indistinguishable from the mean ratio in plants (Fig. 5, Table A2). Individual plants' radiogenic Sr signature are distinct from each other and reflect the slope's bioavailable fraction that they grow on.
6.1 The source of mineral nutrients
Comparing the radiogenic Sr composition of the bioavailable fractions in saprolite and soil with that of bulk plant serves as a proxy for the nutrient sources of plants. At all four sites, the 87Sr∕86Sr ratio in plants is largely indistinguishable within uncertainty to the bioavailable fraction they grow on (Table A2), and no differences in 87Sr∕86Sr between leaves, twigs, and stems are apparent (Data Table S5). Neither the plant 87Sr∕86Sr ratio nor the 87Sr∕86Sr ratio of the bioavailable fraction is identical to that of bedrock or of bulk regolith. We conclude that plants obtain their Sr from the bioavailable fraction rather than directly from primary minerals or from the atmosphere through leaves. Only La Campana showed evidence for a deep nutrient source (i.e., somewhere between the bottom of the regolith profile and unweathered rock) in the elemental-depletion pattern (Fig. A1 in Appendix A). Here, deep-rooting plants (e.g., Lithraea caustica; Canadell et al., 1996) bypass the bioavailable fraction of saprolite and soil and take up Sr with a higher proportion of radiogenic 87Sr that has been released through biotite weathering beneath the regolith profiles. We can also use the 87Sr∕86Sr ratio to identify the ultimate source of bioavailable Sr. In the southernmost mediterranean and humid-temperate sites of La Campana and Nahuelbuta, the bioavailable Sr is supplied by release from rock and regolith through weathering. In arid Pan de Azùcar the Sr pool in the bioavailable fraction is formed by deposition from atmospheric sources (up to 93 % sea spray contribution; Table A2). In semiarid Santa Gracia, we found a possible combination of both sources (up to 43 % sea spray contribution; Table A2).
Expanding our analysis of the source of mineral nutrients, we normalized both the mineral nutrient concentrations in plants (Table 4) and those in the bioavailable fraction in saprolite and soil (Data Table S3) by the most-demanded rock-derived mineral nutrient P (Fig. 6). This normalization removes differences in concentrations induced by the very different matrices of regolith and plant. In this analysis, an element X that plots on the 1:1 line would have the same X : P ratio in plants and in the bioavailable fraction. In turn, any deviation from that line would indicate positive or negative discrimination of an element contained in the regolith bioavailable fraction by plants relative to P. We find a good correlation in the X : P ratios for all elements, and the ratios found in plants reflect those in the bioavailable regolith fraction to within an order of magnitude. We interpret this correlation to confirm nutrient uptake mainly from the bioavailable fraction. We also note that the X : P ratios increasingly approach the 1:1 line with increasing NPP from Pan de Azúcar to Nahuelbuta, and the agreement is more pronounced in soil than in saprolite. We interpret these shifts to denote the increasing significance of recycling, a topic we return to in the next section.
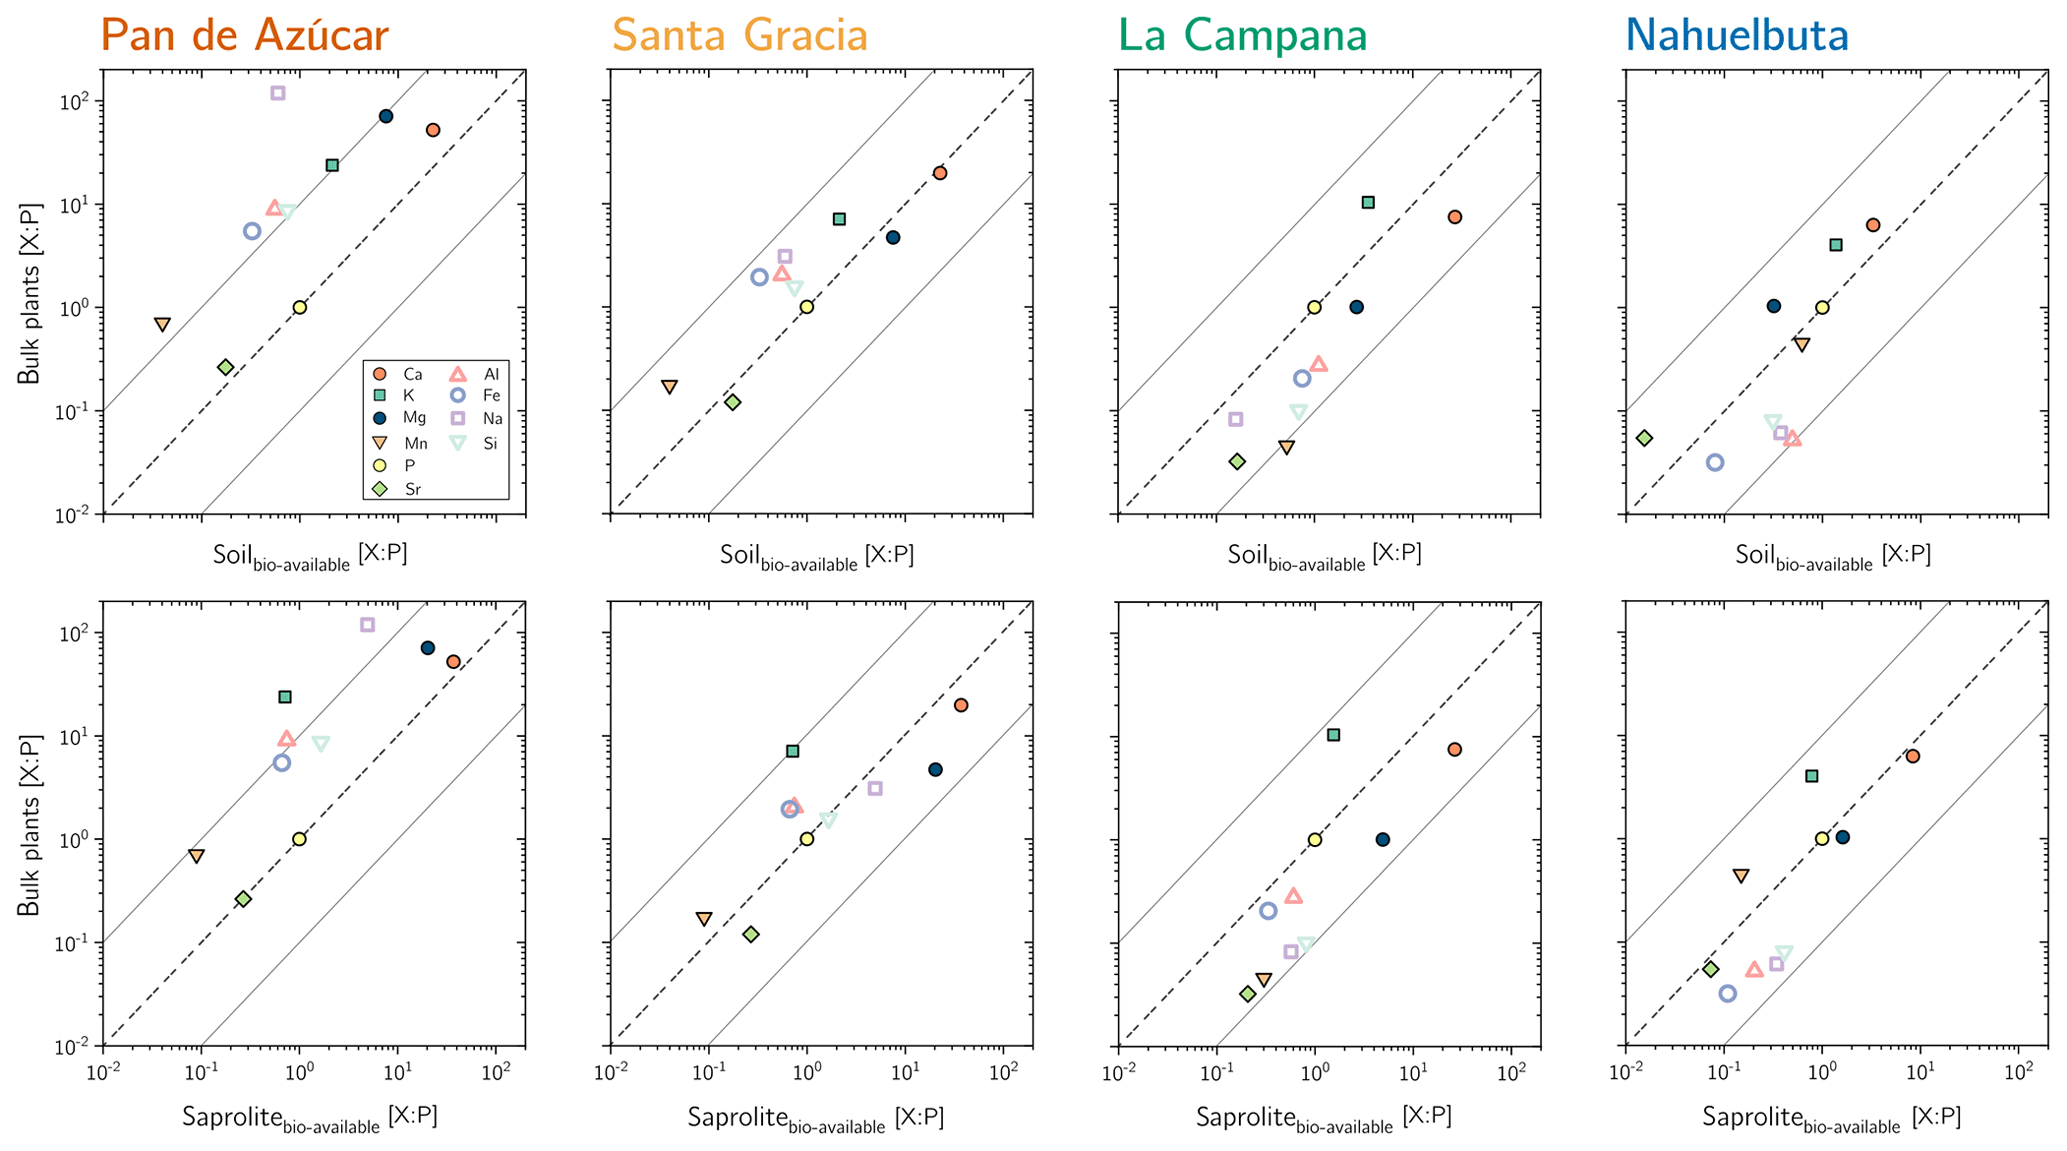
Figure 6P-normalized element composition for bulk plants and the bioavailable fraction in soil and saprolite. Solid grey lines reflect the 10× P and 0.1× P concentration, respectively. Note that with increasing recycling from Santa Gracia to Nahuelbuta, the bioavailable fractions' X : P successively approaches X : P in vegetation.
6.2 An increase in nutrient recycling with NPP
In Sect. 5.1.2 we established that neither total weathering rate W nor elemental weathering rates correlate with NPP. Only at La Campana are weathering rates elevated, as expected from the higher denudation rate. Santa Gracia and Nahuelbuta have similar denudation rates and element release rates by weathering , yet elemental uptake rates of P, K, and Ca increase by between a factor of 2 and 5 (Fig. 4). We examine these correlations in more detail in Sect. 6.5. Here we first focus on the following question: how is mineral nutrient demand satisfied at the more vegetated sites?
Table 5Nutrient recycling factors in Pan de Azùcar, Santa Gracia, La Campana, and Nahuelbuta. Shown in brackets are the RecX prior corrections for atmospheric deposition.
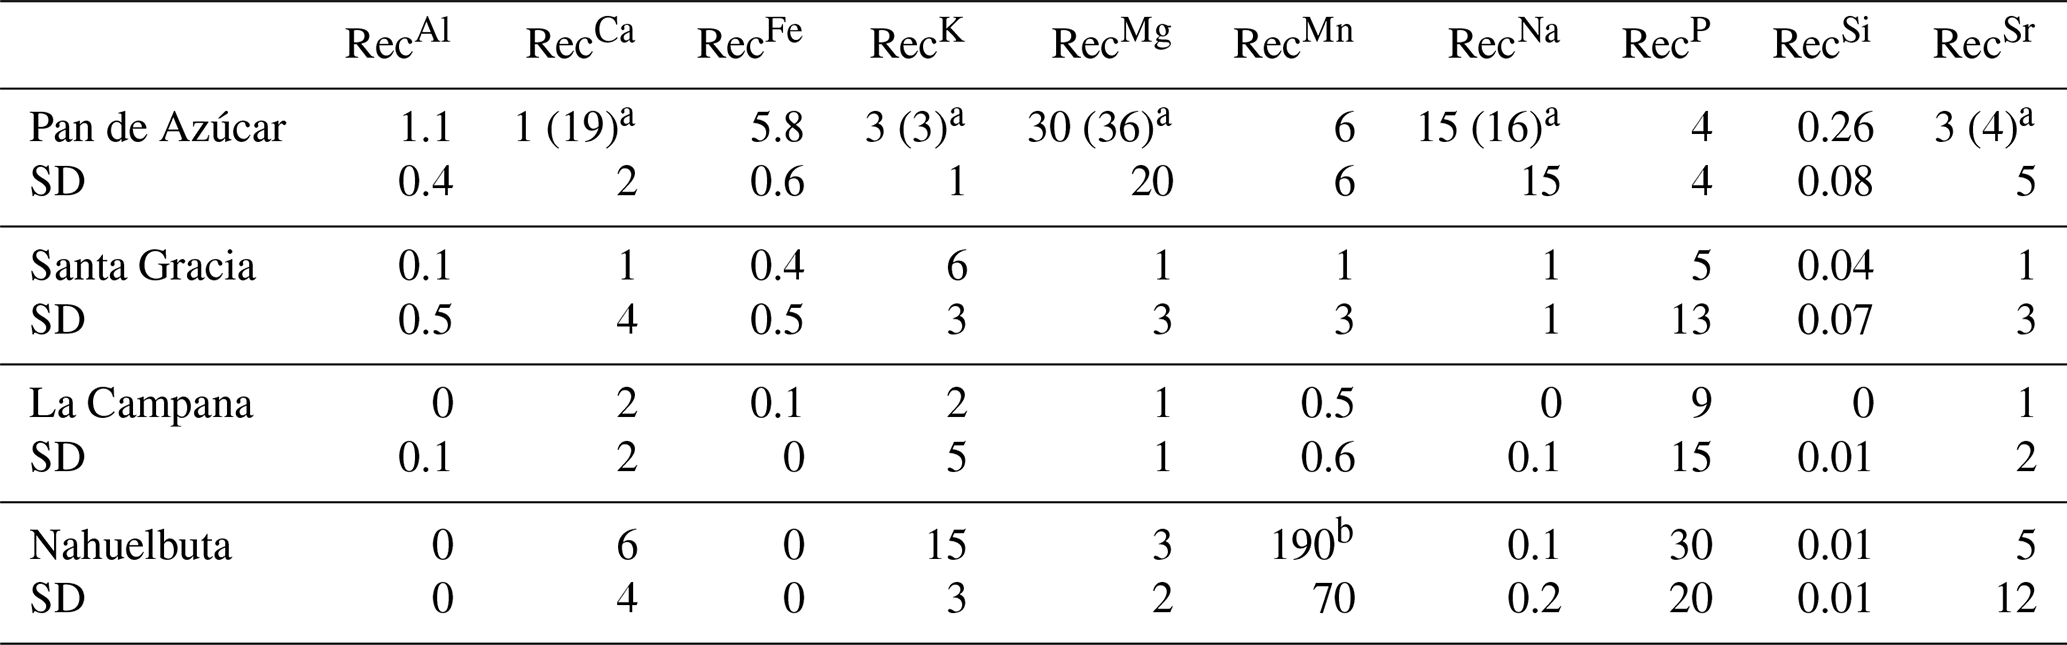
a RecX in Pan de Azúcar has been corrected for atmospheric deposition of sea spray, which ultimately decreases the recycling rates of weathering-derived nutrients by 95 %, 22 %, 18 %, 12 %, and 10 % for Ca, K, Mg, Na, and Sr, respectively (see supporting information in Oeser and von Blanckenburg, 2020, and Fig. A6 for further explanation). b Values not being considered in the discussion as are potentially biased by high bedrock heterogeneities.
Recycling of mineral nutrients from organic material is the key mechanism enabling differences in NPP. We quantified recycling by the nutrient recycling factor RecX (Table 2, Eq. 7, and Appendix A; Table 5; note that in this discussion we use the RecX calculated for from rock weathering, whereas in Table 5 and Fig. A4 we also show RecX including atmospheric inputs in Pan de Azúcar). The amplitude of recycling varies from nutrient to nutrient and site to site. In the arid Pan de Azùcar, nutrients are primarily recycled via photodegradation of shrubs (e.g., Gallo et al., 2006; Day et al., 2015). In the remaining sites RecX occurs through all organic-bearing soil horizons and increases from Santa Gracia to Nahuelbuta and is highest for Ca (increasing from 1 to 6), K (increasing from 6 to 15), and P (increasing from 5 to 30; Table 5). Thus, despite having the smallest nutrient inventory of bioavailable nutrients (Table A1) but the highest NPP, Nahuelbuta can at least partially satisfy its nutrient requirements through efficient nutrient recycling. In the mediterranean site La Campana, nutrient requirements are satisfied through recycling and uptake from depth – a mechanism that has just recently been shown to balance losses by erosion and contribute to ecosystem nutrition (Uhlig et al., 2020). In contrast, in the (semi)arid sites, where the bioavailable pool is larger, plants forage nutrients and water by deep rooting from depth (McCulley et al., 2004).
The RecX metric reflects a mass balance between the total weathering zone and the total vegetation cover but does not yield insight to the mechanisms of recycling. The elemental stoichiometric considerations presented above show that recycling is indeed fed from plant material accumulated in soil (Lang et al., 2017). With increasing recycling the nutrient pools in the soil bioavailable fraction are increasingly dominated by the pool of recycled nutrients, thus shifting the X : P ratio in the bioavailable fraction successively towards the X : P ratio in vegetation (Fig. 6). In other words, over the course of several recycling loops, the chemical composition of the bioavailable fraction and biota eventually approaches a ratio close to the relative requirement of the ecosystem for the different nutrients (Vitousek et al., 1998).
6.3 Processes that set the size of the bioavailable pool
In none of our sites is the bioavailable nutrient pool entirely depleted (Table 3), but its elemental concentrations strongly shift along the gradient. The concentrations of the mineral nutrients K, Ca, and Mg in saprolite are highest in the arid site, lower in the semiarid and mediterranean sites, and lowest in the humid-temperate site. The element concentration in the bioavailable fraction translates into the size of the inventory, quantifying the pool size. Note, however, that the true inventory can in fact be larger than the 1 m inventory that we have used for its calculation. This is suggested by the elevated 87Sr∕86Sr ratios in plants at La Campana, suggesting extraction of a pool beneath the bioavailable upper saprolite. Nutrient uptake from greater depths have recently been demonstrated by Uhlig et al. (2020). The bioavailable pool represents the link between the organic and the geogenic pathway. This is because weathering in the geogenic pathway supplies elements that plants take up and recycle in the organic pathway (Uhlig and von Blanckenburg, 2019). We thus briefly review the potential processes that may set the pool size.
If a bioavailable pool is in conceptual steady state, input fluxes and loss fluxes balance. Over millennial timescales or longer, we consider that such a balance must exist, as otherwise a pool might become depleted. In this case the inventory of the pool is set by the input fluxes of an element and a first-order rate constant that describes the relationship between the loss flux as a function of element inventory and thus the retention capacity. Essentially it is the inverse of the turnover time of an element. Biotic processes likely contribute towards setting this retention capacity directly or indirectly, a topic we return to below. Given that elemental weathering fluxes do not correlate with pool size, we assume that retention capacity sets the pool size.
A first potential control over element retention capacity are pedogenic properties. The decrease of the soil pH from 8 at the arid site to 4 at the humid-temperate site (Bernhard et al., 2018) might cause the decrease in the bioavailable divalent base cations Mg, Ca, and Sr. Conversely, the decrease in pH could be the result of the loss of these elements and thus their pH buffering capacity. Another possibility is the degree of complexing of elements to organic molecules. Such complexing might lead to either higher retention or higher loss, depending on the element. Organic complexing is likely more pronounced in the mediterranean and humid-temperate sites where soil organic carbon concentrations are higher compared to the (semi)arid sites (Bernhard et al., 2018). However, elements like Al and P, which are readily complexed, are abundant in higher concentration in the humid-temperate and mediterranean sites than in the other two sites. The difference in water flow is the third cause we discuss. Where fluid residence times are long, concentrations of solutes are more likely to be at equilibrium with secondary minerals (Maher and Chamberlain, 2014) and the bioavailable fraction, formed by precipitation and sorption from pore fluids, can build up. We consider this to be the case in the low-precipitation sites. At sites with high MAP regolith fluids may be diluted and thus desorb elements from the bioavailable pool (i.e., leaching). Such dilution effect might be in effect at Nahuelbuta for elements like Mg and Ca. At Nahuelbuta these are also the elements with the lowest bioavailable inventory. We consider the pH and water flow to be the main factor governing the size of the bioavailable pool.
6.4 Concepts for biota's role in setting fluxes in the geogenic and the organic nutrient cycle
Even if they are negligible on ecological timescales, ecosystems experience losses of nutrients through erosion (e.g., Heartsill Scalley et al., 2012) and as solutes (e.g., Chaudhuri et al., 2007). To prevent bioavailable nutrients becoming depleted over longer timescales, the pool must be replenished (Uhlig and von Blanckenburg, 2019). Biological mechanisms comprise two means to regulate this delicate balance between nutrient replenishment by weathering and plant uptake. The first is by adjusting the recycling of nutrients, as shown in Sect. 6.2. At Nahuelbuta, where the bioavailable pool is smallest, nutrient recycling rates are the highest. If the bioavailable pool is small, plants may invest energy into reusing P and other elements from leaf litter, rather than foraging P at depth, which is associated with higher energy expenditure (Andrino et al., 2019). This is a component of the organic nutrient cycle. The biochemical mechanisms of nutrient-recycling are beyond the scope of this paper but are thought to be related to leaf litter quality (Hattenschwiler et al., 2011), soil fungal and microbial communities (Fabian et al., 2017; Lambers et al., 2008), and plant diversity (Lambers et al., 2011; Oelmann et al., 2011; van der Heijden et al., 1998).
The second means for biota to influence the bioavailable pool is via the geogenic pathway. Nutrient replenishment may take place either by exogenous inputs (e.g., Boy and Wilcke, 2008; Porder et al., 2007; Vitousek, 2004; Vitousek et al., 2010) or by weathering of primary minerals (Uhlig et al., 2017; Uhlig and von Blanckenburg, 2019). In arid Pan de Azúcar, where weathering–release fluxes are low, these pools are being replenished by the deposition of atmospheric sources (up to 93 %; Table A2). In the other study sites the bioavailable pools are replenished by weathering of rock and regolith. The timescales of replenishment from weathering are long and typically orders of magnitude longer than their turnover times with respect to plant uptake . For example, the inventory of K in the bioavailable soil pool at Nahuelbuta is turned over every 30 years between soil and plants, but it takes 400 years to be replenished in its entirety by weathering (Table A3). Previous models in ecosystem science (e.g., Bormann et al., 1969; Vitousek and Reiners, 1975; Vitousek et al., 1998) suggest that increasing mineral–nutrient demand will eventually lead to tightly coupled recycling loops, such that nutrient losses will be minimized and plant nutrition will be sustained. Our data are also consistent with a relationship between demand (i.e., NPP) and recycling efficiency.
If recycling indeed exerts the dominant role in the supply of mineral nutrients, then we need to revisit the significance of biogenic weathering towards the nutrition of plants. The direct and indirect impacts of plants and their associated microbiota on weathering is well documented and can be categorized into four suites of processes. (a) The first suite is direct primary mineral dissolution by ectomycorrhizal fungi. Ectomycorrhizal fungi can directly extract nutrients such as P, K, Ca, Mg, and Fe from minerals distant from the root, even under dry conditions, and thereby actively increase mineral dissolution kinetics. Laboratory dissolution experiments (Balogh-Brunstad et al., 2008b; Gerrits et al., 2020; Kalinowski et al., 2000), plant growth mesocosms (Bonneville et al., 2011; Smits et al., 2012), and deployment of minerals within the soil of natural ecosystems (Balogh-Brunstad et al., 2008a) all show either evidence for mineral dissolution by mycorrhiza or quantify an increase in mineral dissolution over abiotic controls. Whether these short-term experiments can be extrapolated to the millennial timescales of the geogenic nutrient pathway is not obvious (review by Finlay et al., 2020). Over these timescales, mineral dissolution is often slowed by the development of nanoscale layers at the interface (Gerrits et al., 2020) or coatings by secondary precipitates (Oelkers et al., 2015). Slowing of mineral dissolution with time, known from weathering zone studies, has also been attributed to coating by secondary precipitates (White and Brantley, 2003) or to chemical saturation of pore fluids (Maher, 2010). (b) The second suite is the process of roots deepening regolith thickness. Tree roots can physically penetrate and biogeochemically alter the immobile regolith underlying mobile soil (Brantley et al., 2017). They can take water up from depth, recycle water to depth for storage, or provide pathways in which water bypasses rather than infiltrates the shallow regolith (Fan et al., 2017). Deep roots aid nutrient transfer from the subsoil to shallow levels (Jobbágy and Jackson, 2004). (c) The third suite is canopies and roots converting precipitation into evapotranspiration (Drever and Zobrist, 1992). In sites with higher vegetation cover, water vapor is recycled and does not immediately enter runoff. By providing canopy, trees both modulate infiltration and turn water back into transpiration (Ibarra et al., 2019). For example, Ibarra et al. (2019) have shown that total runoff can decrease by up to 23 % as vegetation cover increases from barely vegetated to highly vegetated sites. Water recycling hence decreases total runoff and potentially reduces weathering–release fluxes in the highly vegetated sites. (d) The fourth and final suite is increasing mineral solubility by release of soil CO2 and organic complexing agents. Through the respiratory release of soil CO2 and excretion of organic complexing agents, plants, hyphae, and their associated microbiota can increase the solubility limits of primary and secondary minerals by up to a factor of 10 (Perez-Fodich and Derry, 2019; Winnick and Maher, 2018). If dissolution is not kinetically limited, we would indeed expect higher solute concentrations with higher soil CO2, and hence higher dissolution rates of primary minerals (Winnick and Maher, 2018).
Studies of biogenic weathering in natural Critical Zone systems struggle to disentangle expressions of these biogenic drivers of weathering rates from various competing drivers of weathering. Although the sites were selected to minimize potential confounding effects, this study also faces this challenge. We turn to a statistical approach in isolating any potential biogenic weathering signal.
6.5 Is weathering modulated by biota? A statistical analysis
To single out the possible biogenic weathering driver from the confounding factors at the EarthShape sites, we used correlational statistics between indicators of weathering and metrics for its potential drivers along the EarthShape gradient. We determined Pearson correlation coefficients to determine how the degree of weathering (CDF, τX) and the flux of weathering (W, ) depend on denudation rate D, water availability (approximated by mean annual precipitation, MAP), and biomass growth as quantified by net primary productivity (NPP). See Appendix B for a detailed description on statistical analysis and Tables A4, A5, and A6 for the results. We used these statistics to evaluate three starting hypotheses that reflect the basic confounding factors: (1) where denudation rate D is high, bulk weathering fluxes are high, since minerals with fast dissolution kinetics, such as plagioclase and P-bearing apatite, are supply limited (Dixon et al., 2012; Porder et al., 2007). Where D is high, regolith residence times are low, such that τX for elements not mostly contained in rapidly dissolving minerals is not depleted. (2) At sites at which MAP and hence runoff is high, weathering fluxes are high. This is because weathering rate is proportional to runoff for the chemostatic elements that comprise the bulk of the weathering flux, amongst them Si that contributes roughly half of the flux (e.g., Godsey et al., 2019; Maher and Chamberlain, 2014). As a result, CDF and τX will also be high. τX of soluble elements (e.g., Na) will be higher at higher runoff than τX of elements that strongly partition into secondary phases. (3) If NPP is high the degree (CDF, τX) and rate of weathering (W, ) will be high (e.g., Berner et al., 2003; Brantley et al., 2011; Buss et al., 2005; Kelly et al., 1998; Porder, 2019; Schwartzman, 2015), for the reasons predicted in Sect. 6.4.
In support of hypothesis (1) we find that total and elemental weathering rates correlate well with D (Table A4) and only a weak correlation relates denudation rate with the degree of weathering and elemental depletion. Thus, denudation rate is the predominant driver of weathering rate. However, D itself is also correlated with MAP and NPP. To evaluate whether D is nevertheless the main driver we exclude the La Campana site of unusually high D. The correlations between W, , and D are still significant (Table A5), confirming that D is the main driver of weathering rate. Concerning hypothesis (2), neither the degree nor rates of weathering correlate with MAP. Only the soluble element Na becomes more depleted (Table A5) at higher MAP. Thus, a competing effect seems to counteract the expected increase in weathering rate with precipitation. As NPP is an output of the LPJ-GUESS model for which MAP is the basis, it is no surprise that both parameters are strongly correlated (Tables A4 and A5). We would thus expect the same strong relationship between the degree and rates of weathering and NPP as with MAP. This is indeed the case. However, weathering release rates for elements like Na, P, and Si correlate slightly more strongly with NPP than with MAP (Table A5). This is the only indication that biomass growth exerts any control over weathering at all. In summary, neither MAP nor NPP seem to have a major impact on the degree and rates of weathering, and D is the main driver of total and elemental weathering rate at the EarthShape sites.
In this analysis we have not evaluated the potential confounding effects of differences in bedrock mineral composition. Because of the lack of an unequivocal metric allowing a statistical evaluation of the resulting differences in rock weatherability, we focus on a comparison between the two study sites in semiarid (Santa Gracia) and humid-temperate climates (Nahuelbuta). At these two sites, denudation rates (15–48 t km−2 yr−1) and soil residence times (22–28 kyr; Schaller et al., 2018b) are similar. Although they are both granitoid, bedrock between the two sites differs. Santa Gracia is underlain by diorite, a mafic rock, while Nahuelbuta is underlain by granodiorite (Oeser et al., 2018). Thus, the suite of primary minerals in Santa Gracia is more prone to weathering than in Nahuelbuta. Specifically, this means a higher amount of plagioclase and amphibole and less unreactive quartz at Santa Gracia. These differences in predominantly Ca- and Mg-bearing minerals are reflected in higher Ca and Mg inventories in bulk regolith in Santa Gracia (Table A1), which also translate into higher Ca and Mg weathering fluxes (Table 3). Total soil weathering rates (5–10 t km−2 yr−1; Table 1) and differences in weathering properties are not statistically significant (Table A6). The weathering–release fluxes (Fig. 4, Table 3) for K, Na, P, and Si are similar despite massive differences in vegetation cover, NPP, and even MAP (Tables 1 and A6). These similarities and the higher weathering fluxes of Ca and Mg at Santa Gracia can be explained with the confounding effects of higher rock weatherability at Santa Gracia and the higher precipitation at Nahuelbuta. A comparison of concentration–discharge relationships between catchments underlain by mafic (basaltic) and granitoid rock (Ibarra et al., 2016) shows higher solute concentrations for all major elements in the basaltic catchments at a given runoff, and the preservation of chemostatic solute concentrations to higher runoff than in granitoid catchments. As a result, weathering fluxes in mafic catchments at low runoff are similar to fluxes from granitoid rock subjected to high runoff, as we observe at Santa Gracia and Nahuelbuta. Regardless, an increase in either weathering rate or degree of weathering at Nahuelbuta resulting from the 3.5 times higher NPP at Nahuelbuta is not discernible.
6.6 Do negative feedbacks decouple biomass growth from weathering rate and degree?
Why do neither the degree nor the rate of weathering increase with NPP or MAP, and why does higher biomass growth not overwhelm differences in rock mineralogy? Nutrient recycling may be the mechanism that decouples weathering from NPP, as shown in Sect. 6.2. Even so, the higher runoff results in a greater loss of nutrients from the bioavailable pool and thus requires higher weathering rate to balance the loss. We thus speculate that the increased vegetation cover might even counteract a potential increase in weathering that would be caused by the increase in MAP, essentially damping the geogenic pathway. We return to the four suites of processes as outlined in Sect. 6.4 on the direct and indirect impacts of plants and their associated microbiota on weathering and discuss their potential operation at the EarthShape sites.
(a) Direct primary mineral dissolution by ectomycorrhizal fungi. As of yet we have no direct observations on nutrient foraging by fungi and other microbes in regolith from the EarthShape sites as obtained on other mountain sites in Chile (Godoy and Mayr, 1989). Proxies for total microbial biomass in saprolite do not increase along the gradient: total gene copy numbers have similar ranges in Santa Gracia and Nahuelbuta, and DNA amounts even decrease slightly (Oeser et al., 2018). Common strategies of microbial symbionts with tree roots suggest that energy investment into nutrient recycling from leaf litter is more advantageous than dissolving primary minerals (Andrino et al., 2019). Thus, we would expect that mycorrhiza predominantly aid recycling in Nahuelbuta. In Santa Gracia, however, the absence of a litter layer may prompt the subsurface fungal network to invest in primary mineral dissolution, adding microbial weathering to total weathering at that site.
(b) Roots deepening regolith thickness. A detailed survey of rooting depth along the gradient has not been completed, but deep roots were not observed in Santa Gracia, whereas in Nahuelbuta and La Campana individual roots reach several meters into the saprolite. A and B horizons in Santa Gracia are shallow (20–40 cm), whereas they are deep in Nahuelbuta (80–100 cm; Bernhard et al., 2018; Oeser et al., 2018). We do not know the depth of the weathering front, which appears to be at least a dozen of meters depth or more at both sites. Thus, deep rooting can benefit plant growth by increasing the size of the bioavailable pool.
(c) Canopy and roots converting precipitation into evapotranspiration. Along the EarthShape transect the potential 23 % reduction in runoff predicted by Ibarra et al. (2019) is minor considering the 100-fold increase in precipitation over the entire gradient. A larger effect may occur if roots provide preferential flow paths such that infiltrating water bypasses the regolith matrix available for weathering (Brantley et al., 2017). However, given the deep weathering fronts – likely beneath rooting depth – we consider this effect to be minor or even as acting to increase deep weathering. Thus, we consider the hydrological impact of plants on weathering to be minor along the gradient.
(d) Increasing solubility by release of soil CO2 and organic complexing agents. Although with increasing NPP soil respiration of CO2 should lead to increased primary mineral dissolution, plants potentially impose a negative feedback onto this dependence by influencing the silicon cycle. Because silicon is the most abundant element in felsic rock and regolith (besides oxygen), it exerts a major control on the total weathering fluxes. The Si concentration in the bioavailable pool is key in setting the saturation with respect to the various dissolving and precipitating minerals in regolith. Plants can impact this pool in both directions. Some plant species accumulate Si by active transporter-mediated uptake or through passive uptake within the transpiration stream, while others exclude Si and avoid accumulation (Ma and Yamaji, 2008; Schaller et al., 2018a). Enhanced Si uptake from soil solution by Si-accumulating plants would result in Si undersaturation of solutions with respect to secondary minerals and would thus result in an increase in weathering rates. However, this increase may be damped. That is because these plants would also convert silicon into biosilica (e.g., phytoliths). If returned to soil in plant debris this biosilica becomes a key factor in the stability of secondary minerals (e.g., kaolinite; Lucas, 2001). However, neither factor seems to be the case: in the EarthShape sites, the average Si concentration in the above-ground living ecosystems ranges from 110 µg g−1 in Nahuelbuta to 2500 µg g−1 in Pan de Azúcar (Table 4). Thus, the Si weathering flux exceeds the Si uptake flux throughout (Table 3), and uptake from soil solution by plants equates to only 5 %, 0.2 %, and 2 % of the Si release flux in Santa Gracia, La Campana, and Nahuelbuta, respectively. Only in Pan de Azúcar is relative uptake of Si higher (25 %). The ecosystems at our sites can thus be regarded to be below the threshold considered for Si accumulators (Schaller et al., 2018a). We can therefore exclude plant Si uptake and recycling of Si as a factor that increases weathering rates substantially. Rather, if plants in these ecosystems are discriminating against Si uptake while taking up water, the residual pore waters will get oversaturated with respect to secondary minerals. In this regard a key observation is provided by the analysis of pedogenic oxides (i.e., dithionite-extractable Al and Si extracted by oxalate, dithionite, and pyrophosphate; Oeser et al., 2018) and cation exchange capacity (Bernhard et al., 2018). These analyses suggest high amounts of amorphous precipitates and secondary minerals in the regolith of Nahuelbuta. We thus argue that Si is effectively captured in these barely soluble secondary minerals after initial dissolution from rock and regolith. In turn, in Nahuelbuta is subdued despite elevated solubility of primary minerals due to increased CO2 respiration by roots.
Ecosystems thus exert substantial control over weathering by both directly and indirectly modulating processes. These processes can either enhance or reduce weathering fluxes and result, in combination with effective recycling loops of plant litter material, in well-balanced nutrient cycles. From our field data, we did not find evidence for coupling of silicate weathering fluxes with the mineral nutrient demands of biota to an extent that exceeds other controlling factors of weathering. Our data suggest that the combination of recycling and negative feedbacks on weathering by secondary mineral formation within the regolith decrease weathering rates in areas of high vegetation cover and net primary productivity from what they would be in the absence of high biomass density.
Even though the EarthShape study sites define a north–south gradient in precipitation and biomass production, no such gradient is apparent for weathering rates and weathering intensity between the study sites situated in semiarid, mediterranean, and humid-temperate climate.
At all four sites we locate the primary mineral nutrient source to plants in the bioavailable fraction. This pool of mineral nutrients is initially fed by geogenic sources, which comprise the weathering of primary minerals. It is further fed from organic sources, which involves recycling of nutrients from leaf litter. The size of the bioavailable nutrient pool decreases from north to south, and while pedogenic properties (e.g., pH) likely contribute to set its size, we attribute its decrease mainly to an increase in the below-ground water flow. To fulfill their mineral nutrient demand at increasing NPP but decreasing pool size, ecosystems increase nutrient recycling rather than enhance biogenic weathering. We consequently find that the organic nutrient cycle intensifies, whereas the geogenic nutrient pathway is steady despite increasing MAP and NPP.
In fact, the presence of plants might even counteract a potential weathering increase along the gradient by inducing secondary mineral formation rather than nutrient acquisition through weathering. Due to nutrient buffering by recycling and a potential biological dampening of weathering, any additional contribution to weathering by NPP is unresolvable in our data and is certainly smaller than abiotic controls like denudation, rainfall, or bedrock mineralogy. The global silicate-weathering cycle may thus not be as sensitive to plant growth as commonly thought and cannot be simulated in a straightforward manner in weathering models. This nonlinear behavior is of relevance for models of the global weathering and the linked carbon cycle, of which accelerated weathering by land plants since the Ordovician is a common component.
Zr, Ti, and Nb are commonly used to estimate mass losses to the dissolved form during weathering (Eqs. 5 and 6), as they are presumed to be the least mobile elements during weathering (Chadwick et al., 1990; White et al., 1998). The suitability of these elements for the EarthShape study sites has been evaluated and thoroughly discussed on a site-to-site basis in Oeser et al. (2018). Based on possible Ti mobility in some samples and the fact that Zr is used as a reference element in the majority of weathering and soil production studies worldwide (e.g., Fisher et al., 2017; Green et al., 2006; Hewawasam et al., 2013; Riebe and Granger, 2013; Riebe et al., 2001; Schuessler et al., 2018; Uhlig et al., 2017), Zr was taken as an immobile reference element in this study.
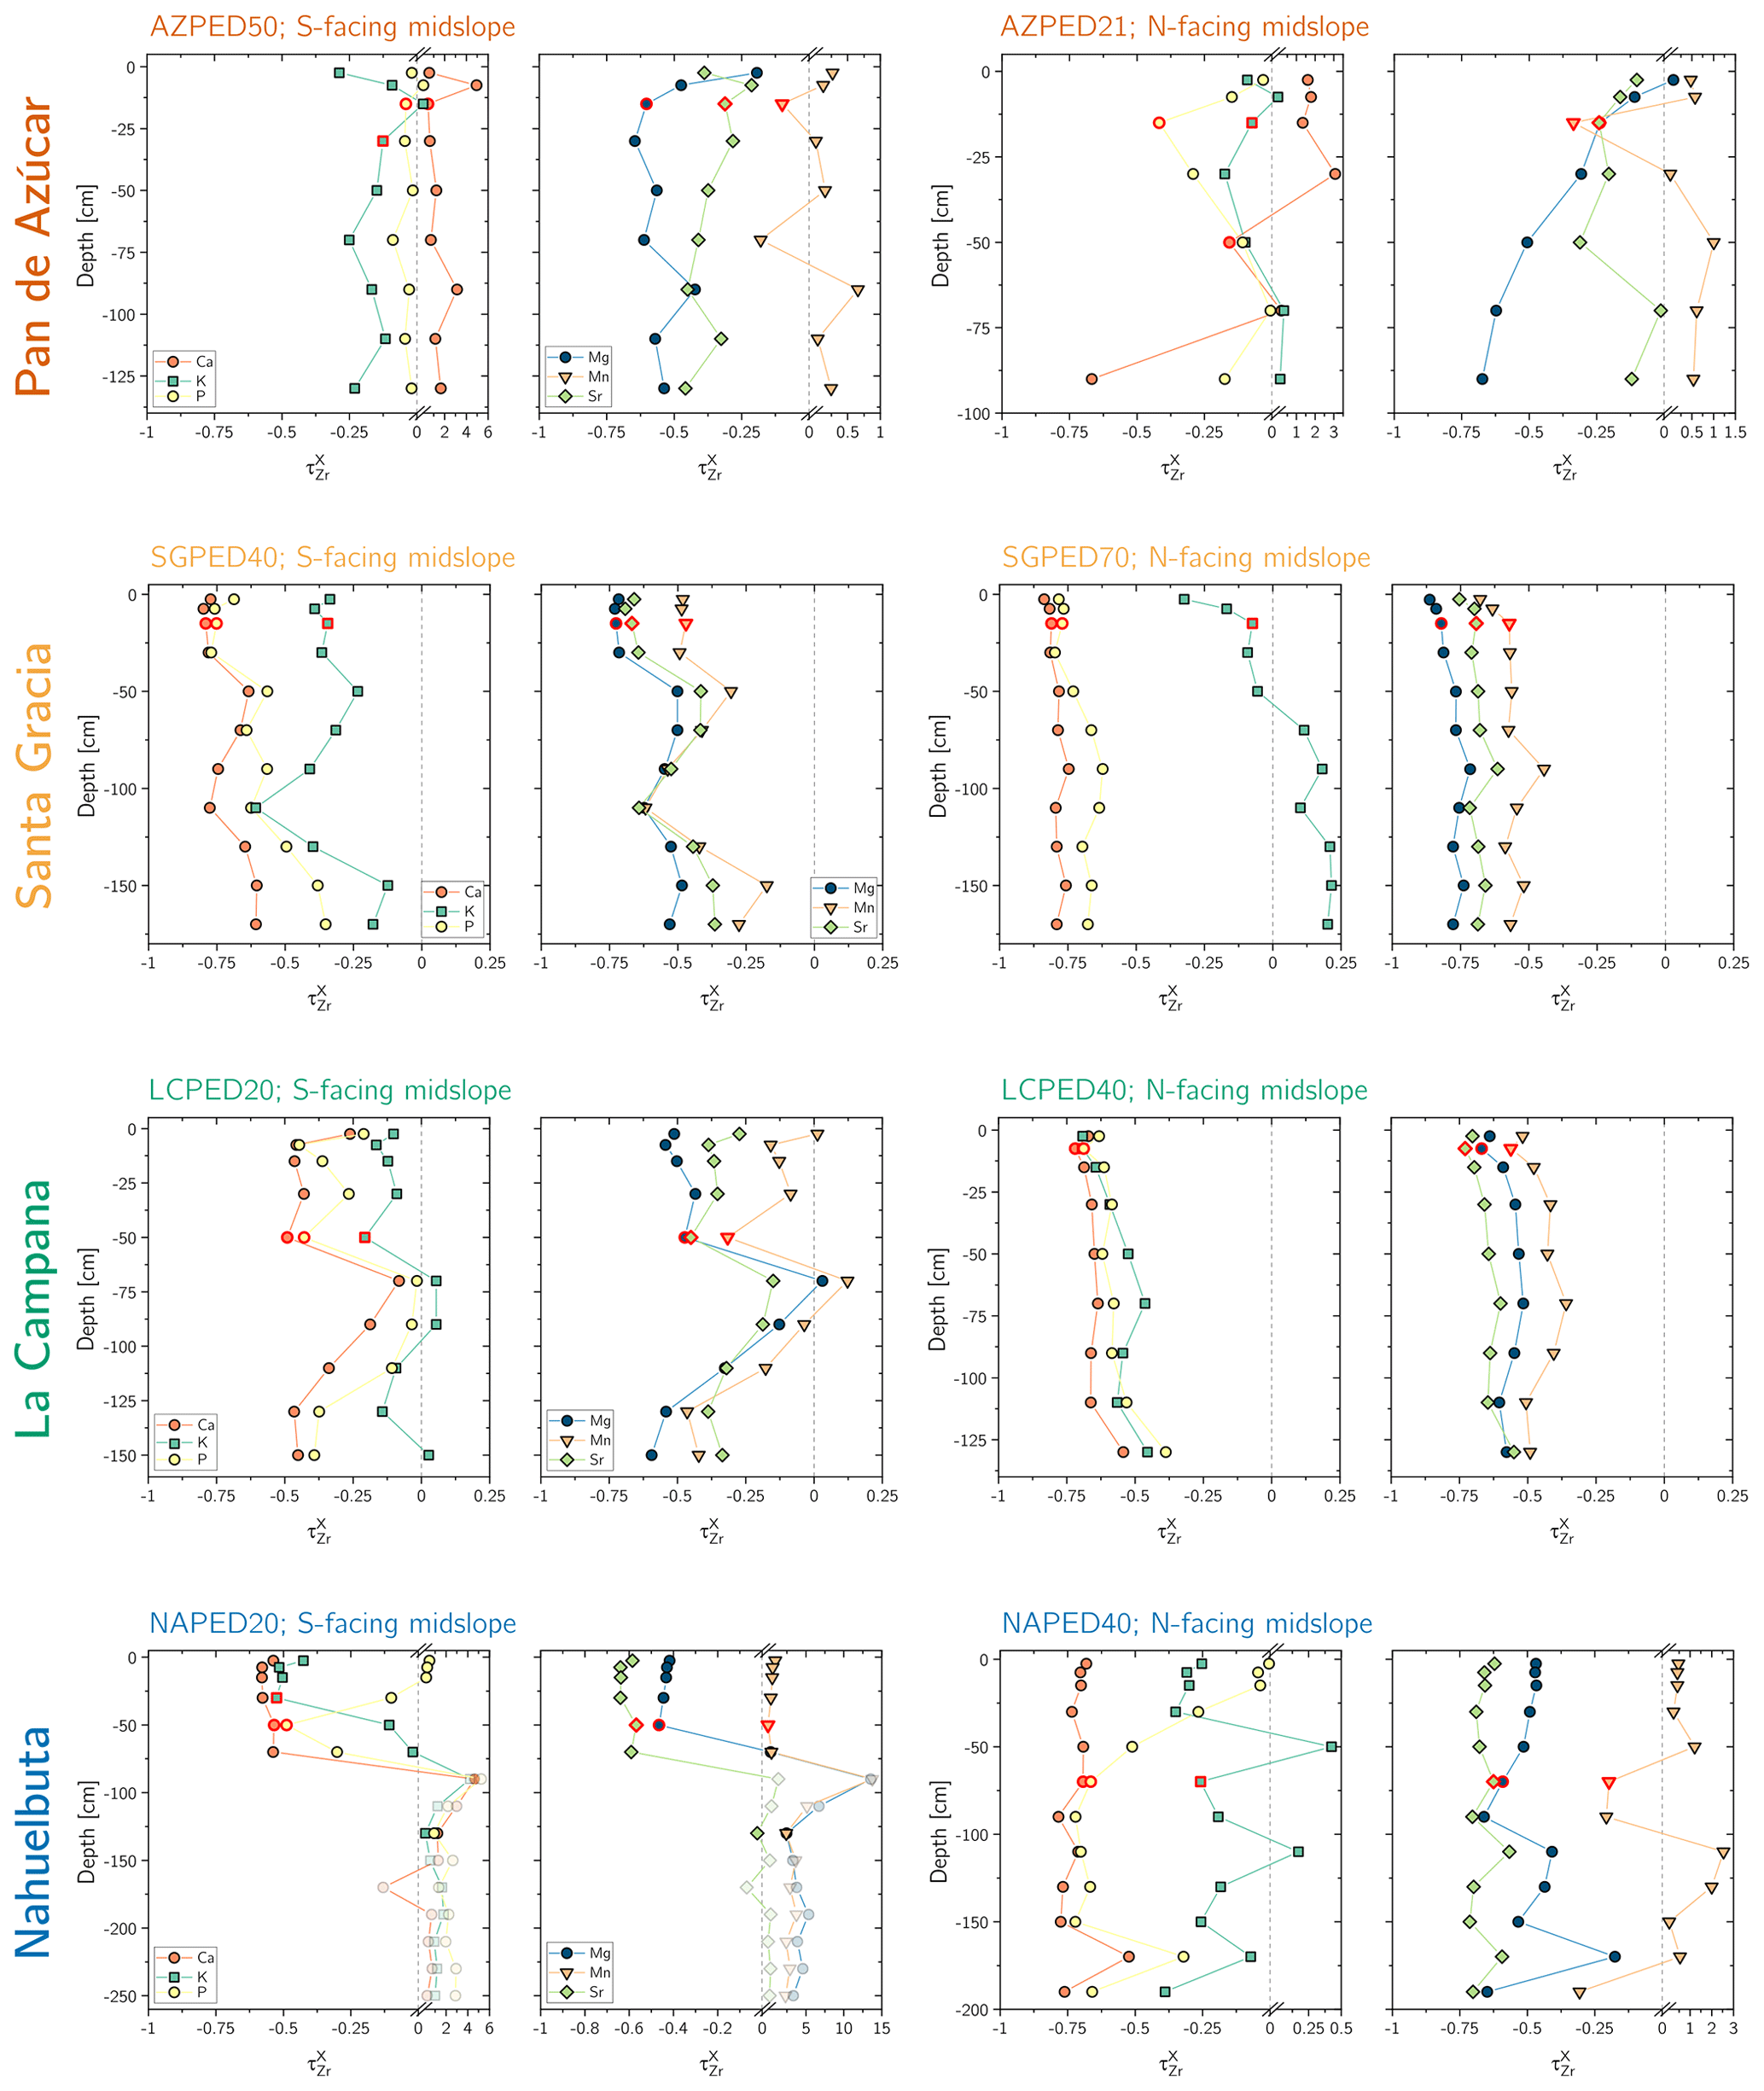
Figure A1Depth distribution of the elemental loss and gain fractions (i.e., elemental mass transfer coefficient, τ). The dashed vertical line indicates and represents unweathered parent bedrock. The τ values corresponding to the shallowest mineral soil samples are highlighted with a red rim. Grey symbols in Nahuelbuta are discarded due to the samples' anomalous low Zr concentration. Note that these τ values differ from those reported in Oeser et al. (2018) because in this work they have been calculated relative to the initial bedrocks' chemical composition.
Table A1Inventories of elements in bulk regolith and the bioavailable fraction in soil and saprolite. Apart from phosphorus, the accessibility of these elements was determined using a sequential extraction method described by Arunachalam et al. (1996); Tessier et al. (1979); He et al. (1995). P accessibility in the bioavailable fraction has been determined by Brucker and Spohn (2019) using a modified Hedley sequential P fractionation method. Data Tables S3 and S4 include depth-dependent concentrations of the bioavailable fraction (pooled) and the deionized and NH4O Ac extractions used for calculation of the inventories.

inventory of element X in the soil bioavailable fraction; extent amounts to maximum soil depth. inventory of element X in the saprolite bioavailable fraction. inventory of element X in bulk regolith. * The extent of the saprolite and regolith inventory have been scaled to 1.0 m for purposes of comparison between the four study sites and the lack of an absolute measure of the depth of saprolite. The abbreviation “n.c.” stands for not calculated, as the respective bioavailable fraction (Data Table S4) was below the limit of calibration of ICP-OES measurements.
The calculations of these weathering indices rely on a good approximation of the chemical composition of the initial bedrock from which regolith formed. To this end, any regolith sample with a Zr concentration that was lower than the mean of unweathered bedrock by more than 1 standard deviation (1 SD) was excluded from further consideration. Because a lower Zr concentration cannot be due to weathering, such regolith samples likely originate from chemically distinct bedrock or small-scale bedrock heterogeneities (e.g., a pegmatitic vein). Saprolite samples were also excluded from our dataset if Cr and Ti concentrations were twice those of unweathered bedrock (+1 SD). Elevated concentrations of these elements imply the presence of mafic precursor rock, such as that commonly present in bedrocks' mafic enclaves. All such excluded samples are marked in grey in Figs. 3 and A1 and mainly affect only the lower section of the south-facing Nahuelbuta profile.
The concentration of K throughout the entire regolith profiles in Santa Gracia is 3-fold higher than K contained in local bedrock samples (Oeser et al., 2018). We thus assume that the K concentration in the bedrock samples of Santa Gracia as determined by Oeser et al. (2018) underestimates the actual occurring K concentration of local bedrock. Thus, τK has been calculated using published values for K and Zr concentration from a study nearby (Miralles González, 2013).
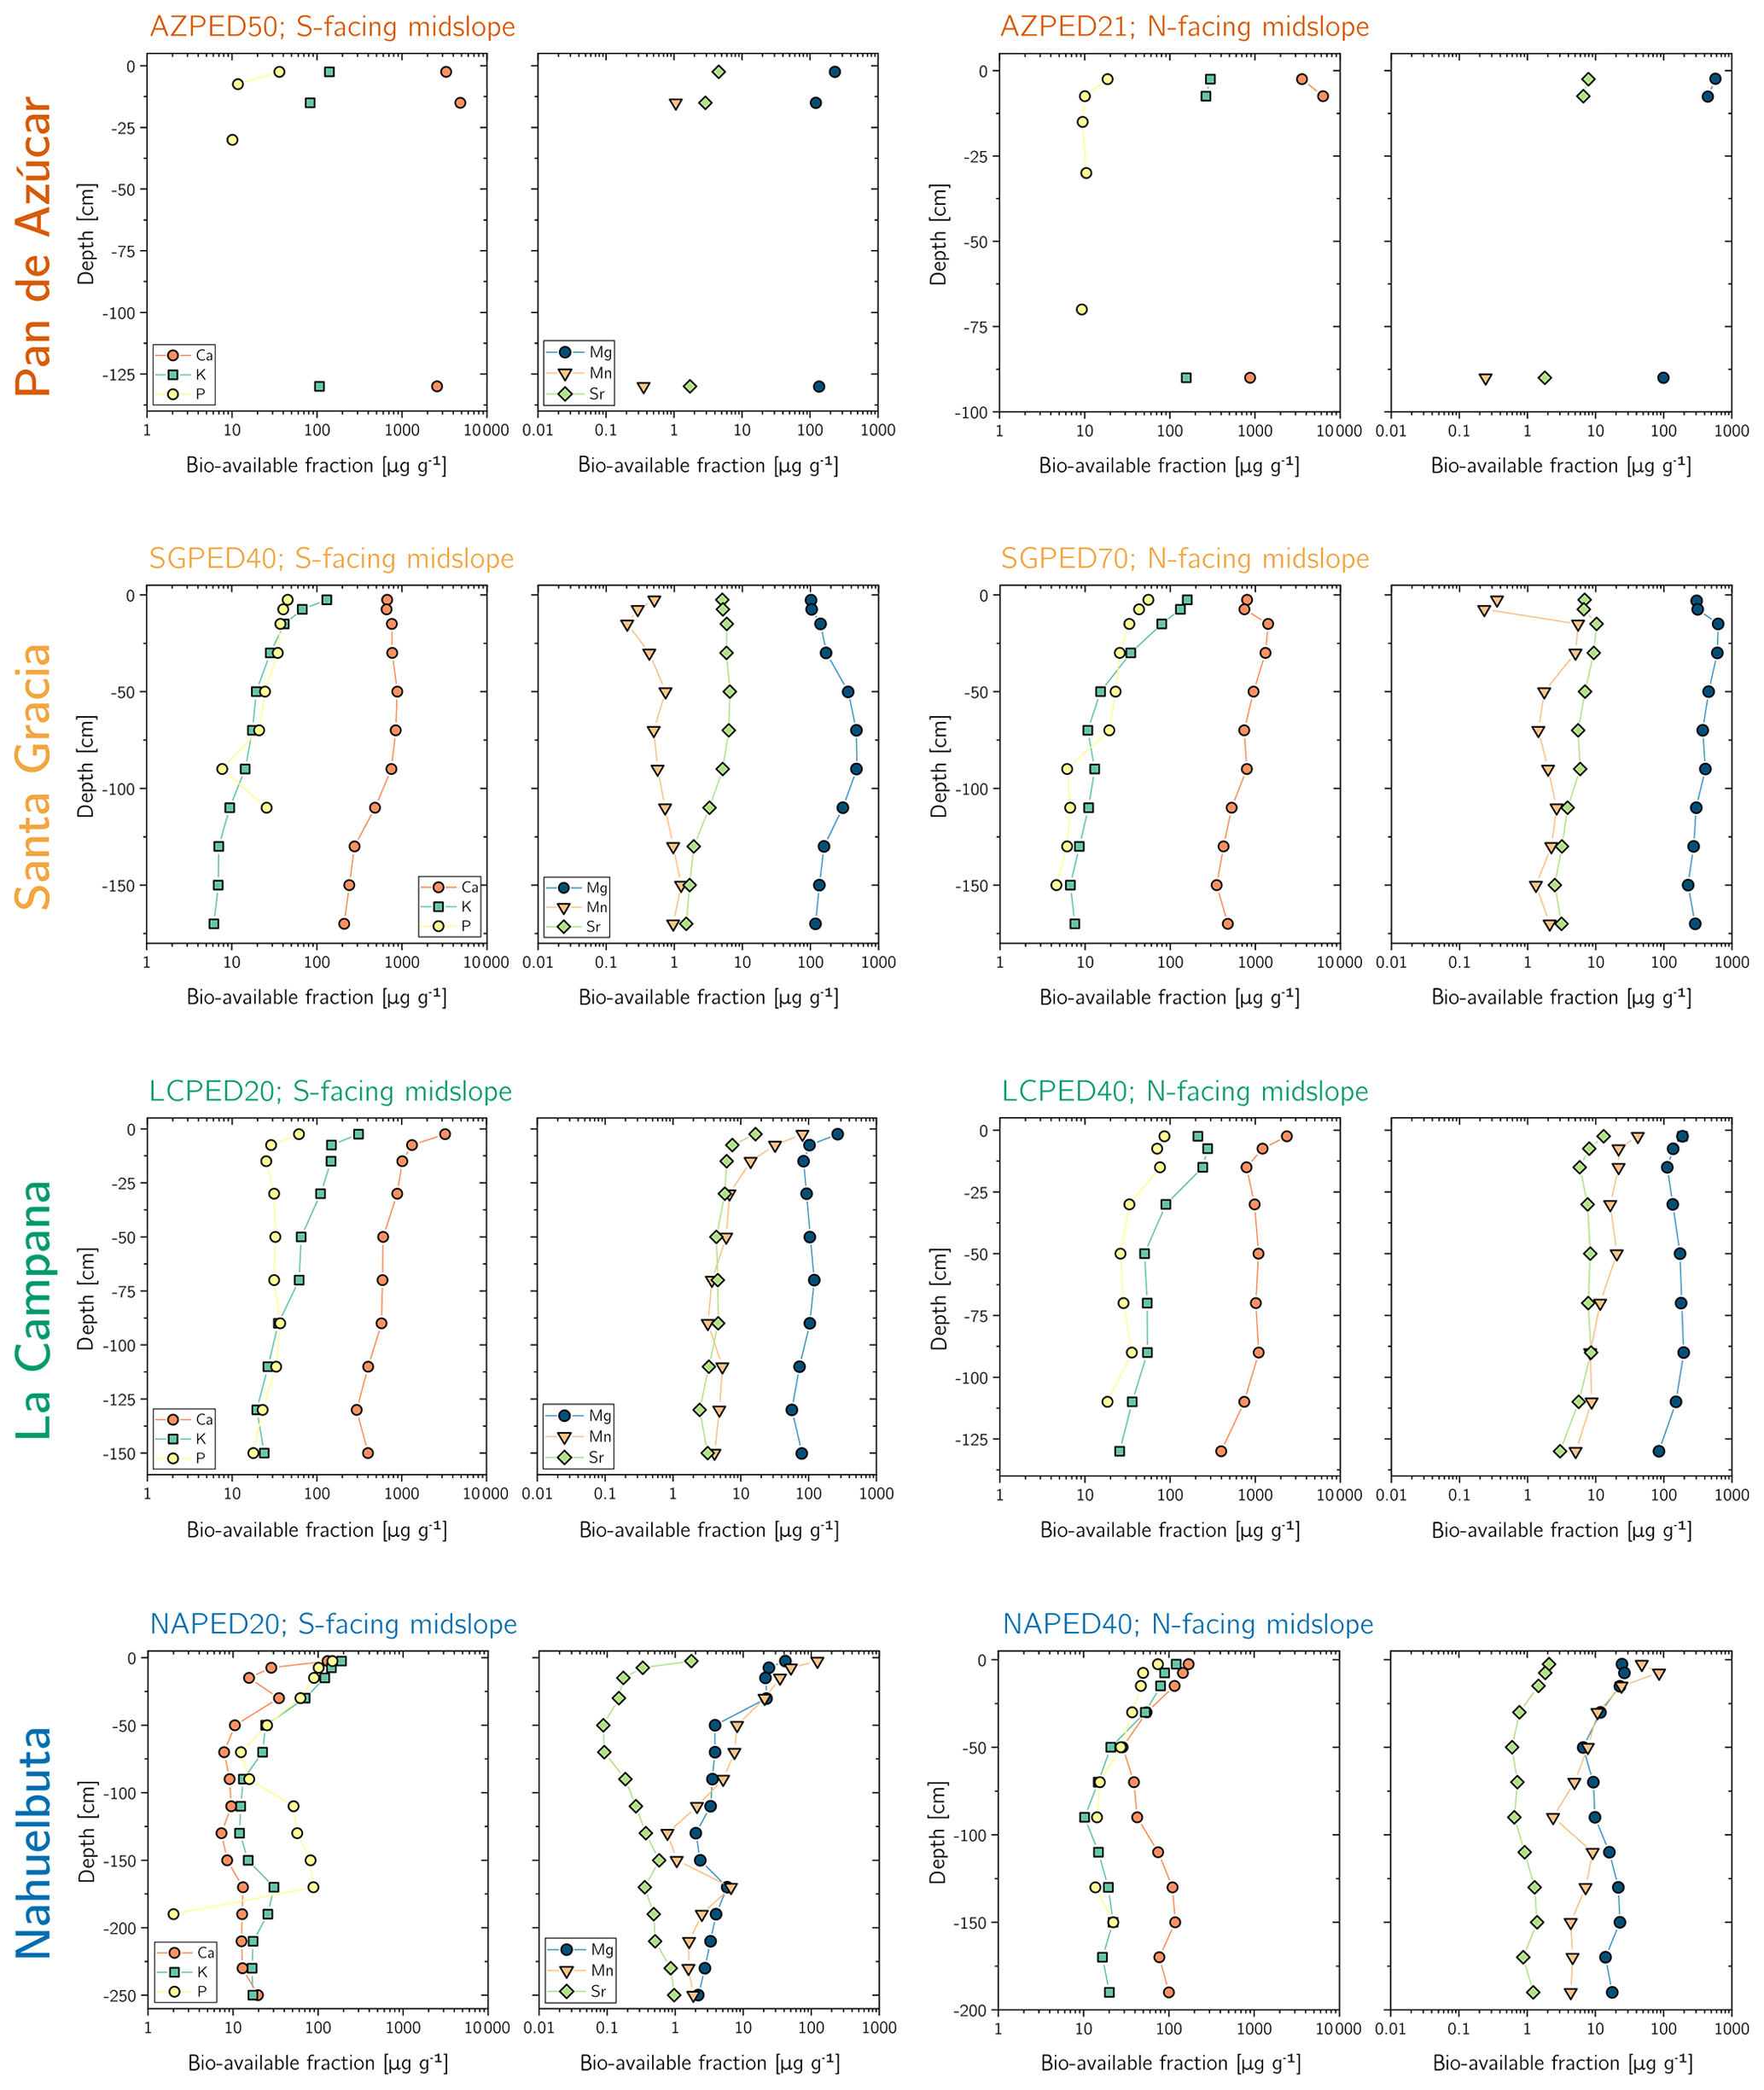
Figure A2Depth distribution of the concentration of sequentially extracted bioavailable fraction of mineral nutrients including Sr, comprised of the water soluble (18 MΩ Deionized H2O) and the exchangeable (1 M NH4O Ac) fractions. P accessibility in the bioavailable fraction has been determined by Brucker and Spohn (2019) using a modified Hedley sequential P fractionation method. Note that in Pan de Azùcar the acquisition of the bioavailable fraction was only possible on three samples per site. Data gaps do occur if both extractions of one sample were below limit of detection.
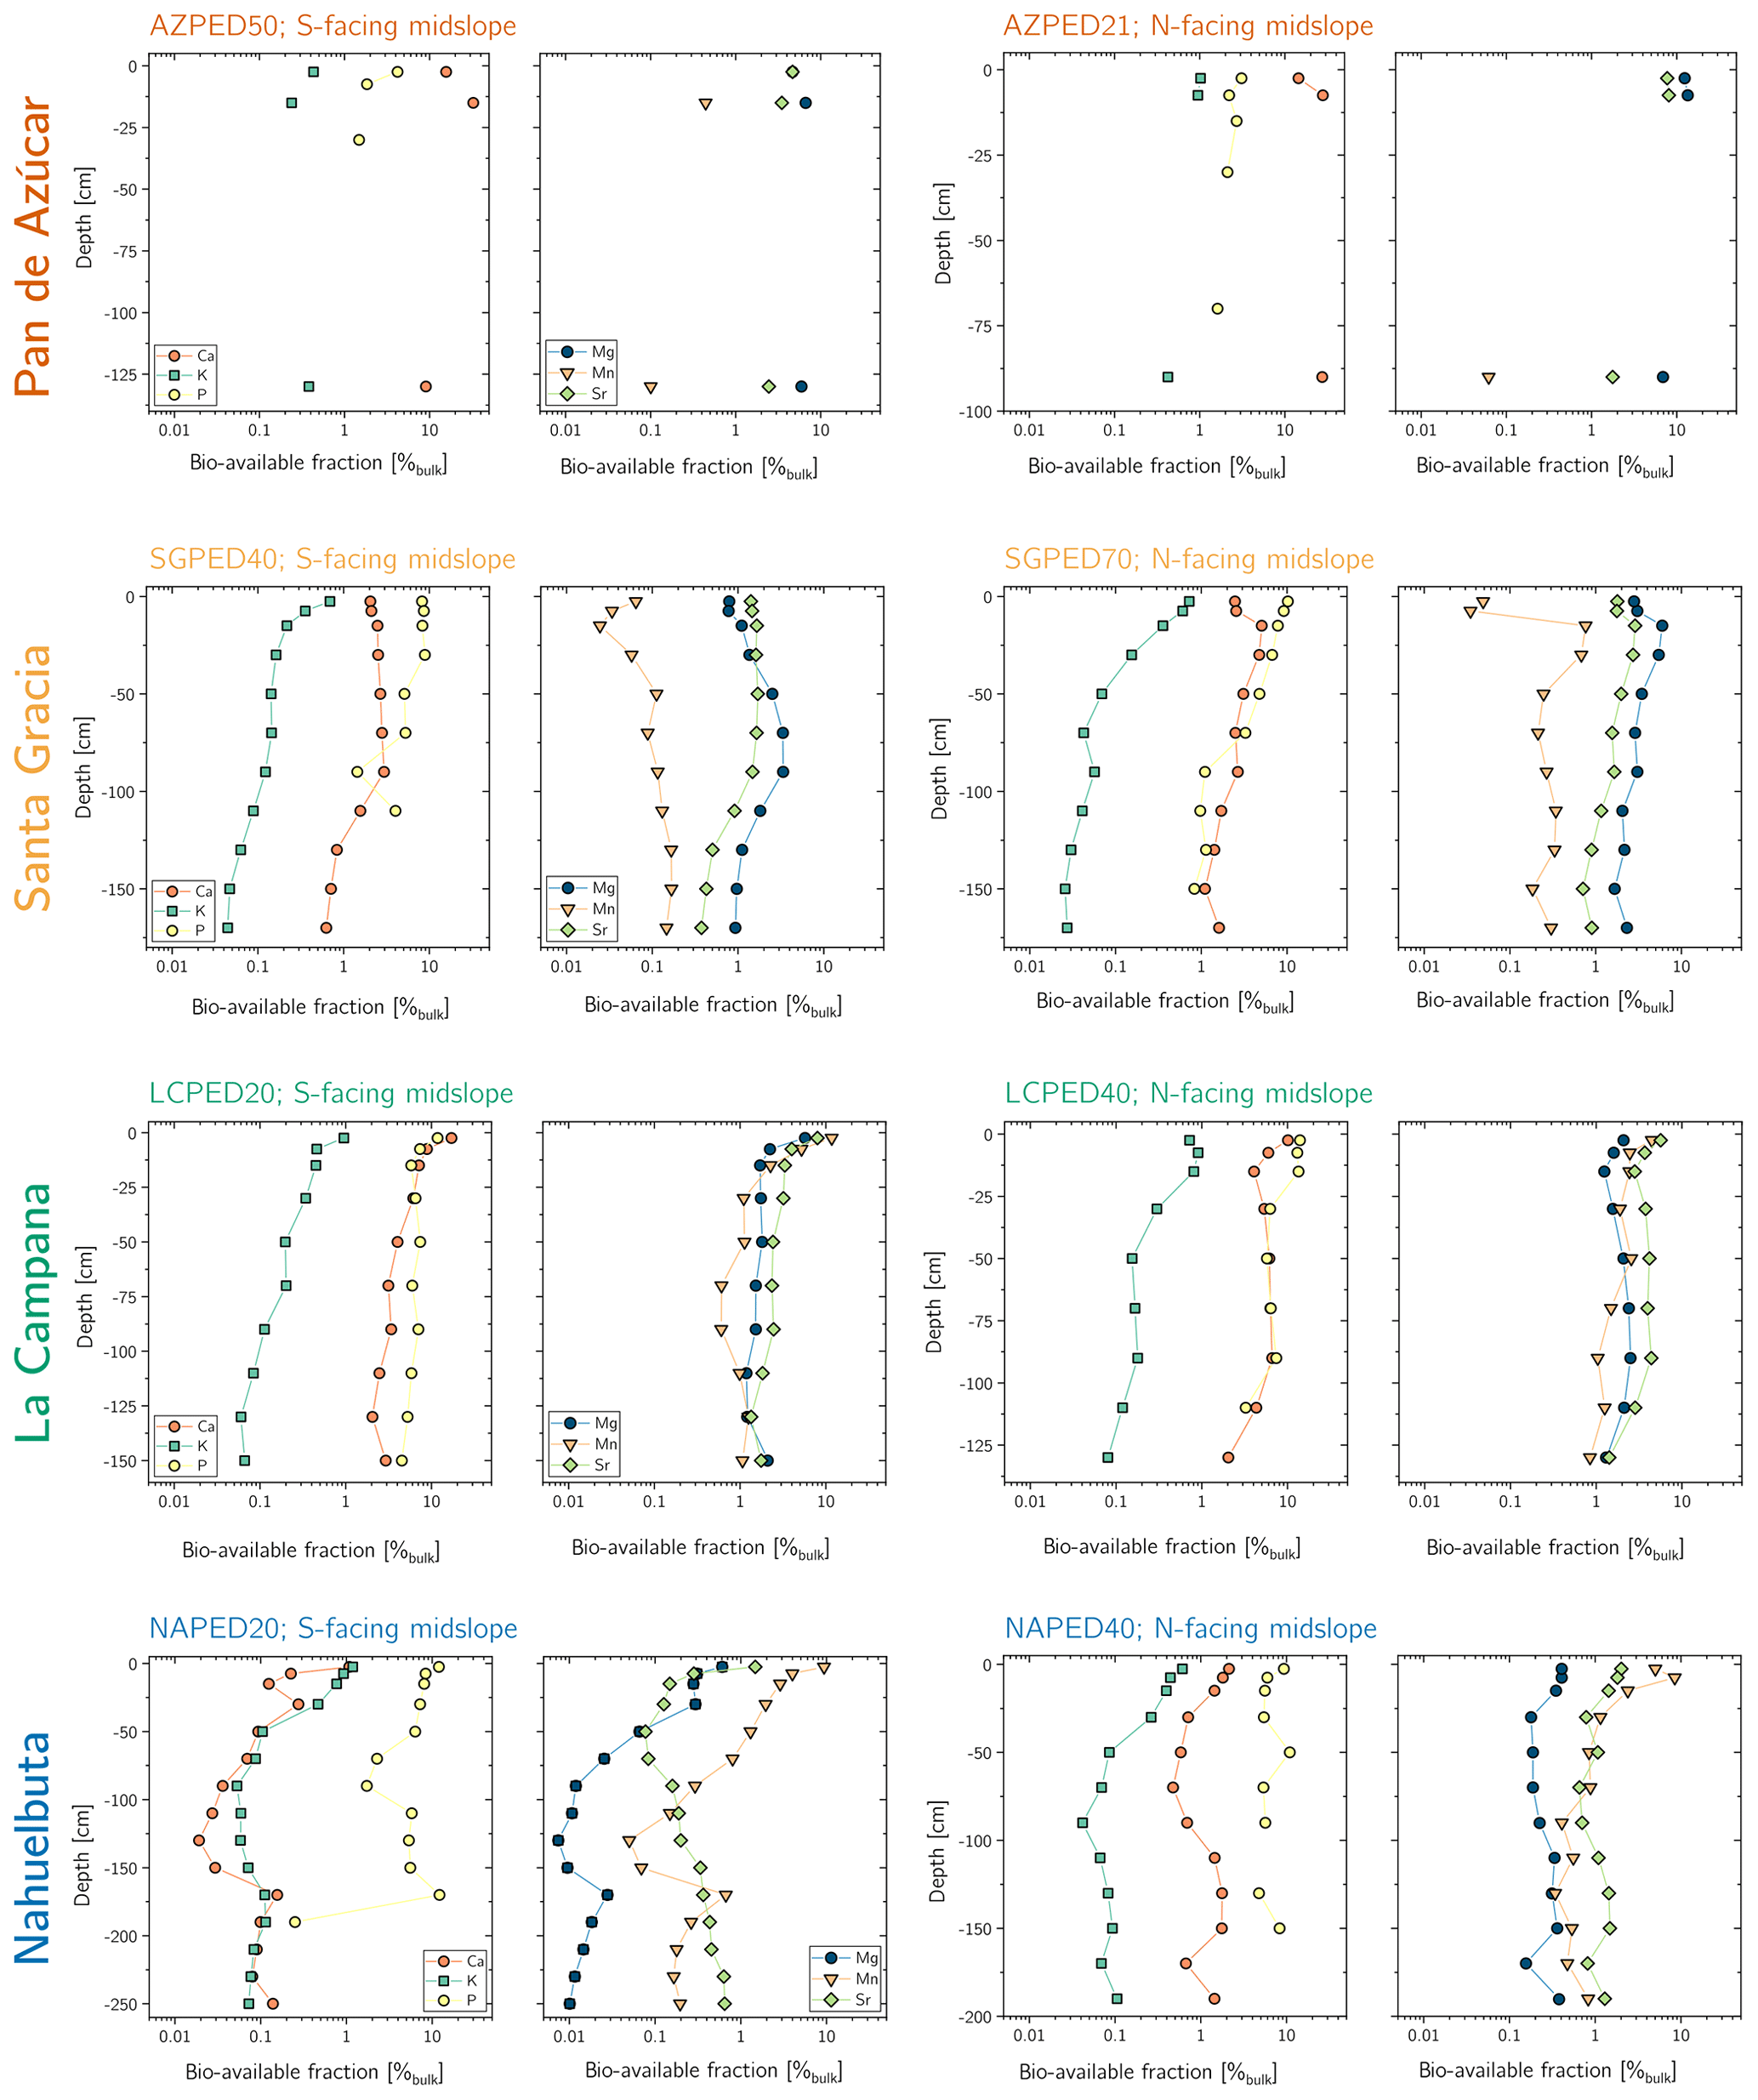
Figure A3Depth distribution of the sequentially extracted bioavailable fraction of mineral nutrients including Sr, relative to their respective amount contained in bulk regolith, comprised of the water soluble (18 MΩ deionized H2O) and the exchangeable (1 M NH4O Ac) fractions. P accessibility in the bioavailable fraction has been determined by Brucker and Spohn (2019) using a modified Hedley sequential P fractionation method. Note that in Pan de Azùcar the acquisition of the bioavailable fraction was only possible on three samples per site. Data gaps do occur if both extractions of one sample were below the limit of detection.
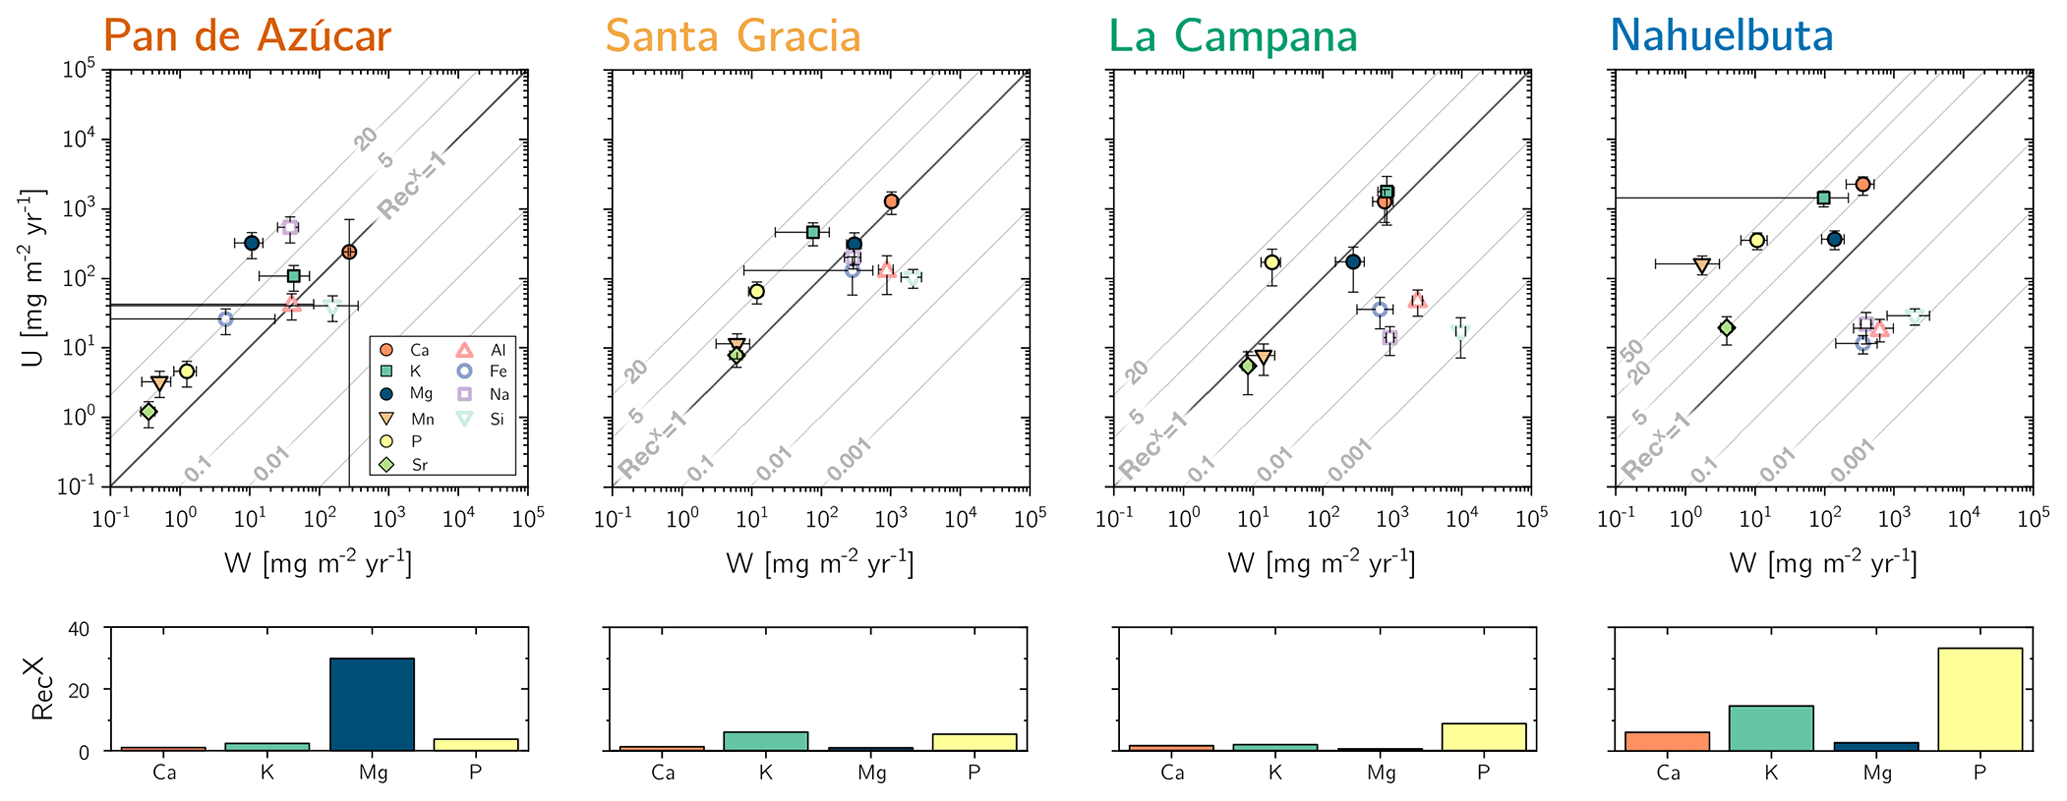
Figure A4Chemical weathering flux () and ecosystem nutrient-uptake fluxes () for Pan de Azùcar, Santa Gracia, La Campana, and Nahuelbuta (from left to right). Weathering–release fluxes for Ca, K, Mg, Na, and Sr in Pan de Azúcar have been complemented by atmospheric depositional fluxes such that the total amount of available nutrients increases by 95 %, 22 %, 18 %, 12 %, and 10 %, respectively. Grey contour lines emphasize the nutrient recycling factor (RecX), which is the ratio of to . Uncertainty bars show 1 SD. Differences in nutrient recycling factors for Ca, K, Mg, and P among the four study sites are highlighted in the lower panels.
A1 Weathering fluxes
To estimate elemental release fluxes from regolith (Eq. 3) for each study site, the most negative τ-values from the shallowest mineral soil sample of each regolith profile were used (red-circled symbols in Fig. A1). This practice is common in eroding regolith, where the loss indicators τ and CDF represent the integrated mass loss over the time and depth interval that a given sample moved from bedrock reference level to its present position (Brantley and Lebedeva, 2011; Ferrier et al., 2010; Hewawasam et al., 2013; Uhlig and von Blanckenburg, 2019). The elemental chemical weathering flux () at each study site has been averaged. Because not all of this flux might be within reach of plant roots (e.g., if a fraction is lost into deep groundwater), this is an upper estimate of the nutrient supply from rock into vegetation. is reported in Table 3.
Table A2Average 87Sr∕86Sr ratio for bulk bedrock, bulk regolith, and the bioavailable fraction in saprolite and soil. 87Sr∕86Sr in bulk plants are weighted by the plant organs' relative growth rate and relative species abundance in the respective ecosystem (see Table 4). Radiogenic Sr composition for each single specimen is reported in Data Tables S2 (bulk regolith samples), S3 (bioavailable fraction of saprolite and soil), and S5 (plant samples).

a Sea spray composition from Pearce et al. (2015). b Standard deviation corresponds to species-to-species differences in 87Sr∕86Sr. c Potential sea spray input into the bioavailable fraction derived from a simple two-component mixing equation using bulk bedrock and sea spray as end-members. Substantial sea spray incorporation into the bioavailable fraction in La Campana and Nahuelbuta is very unlikely (see text for discussion) and is therefore not shown.
Table A3Turnover times for the soil and saprolite bioavailable fraction with respect to the release by weathering and turnover times for bioavailable fraction in soil with respect to uptake into plants.
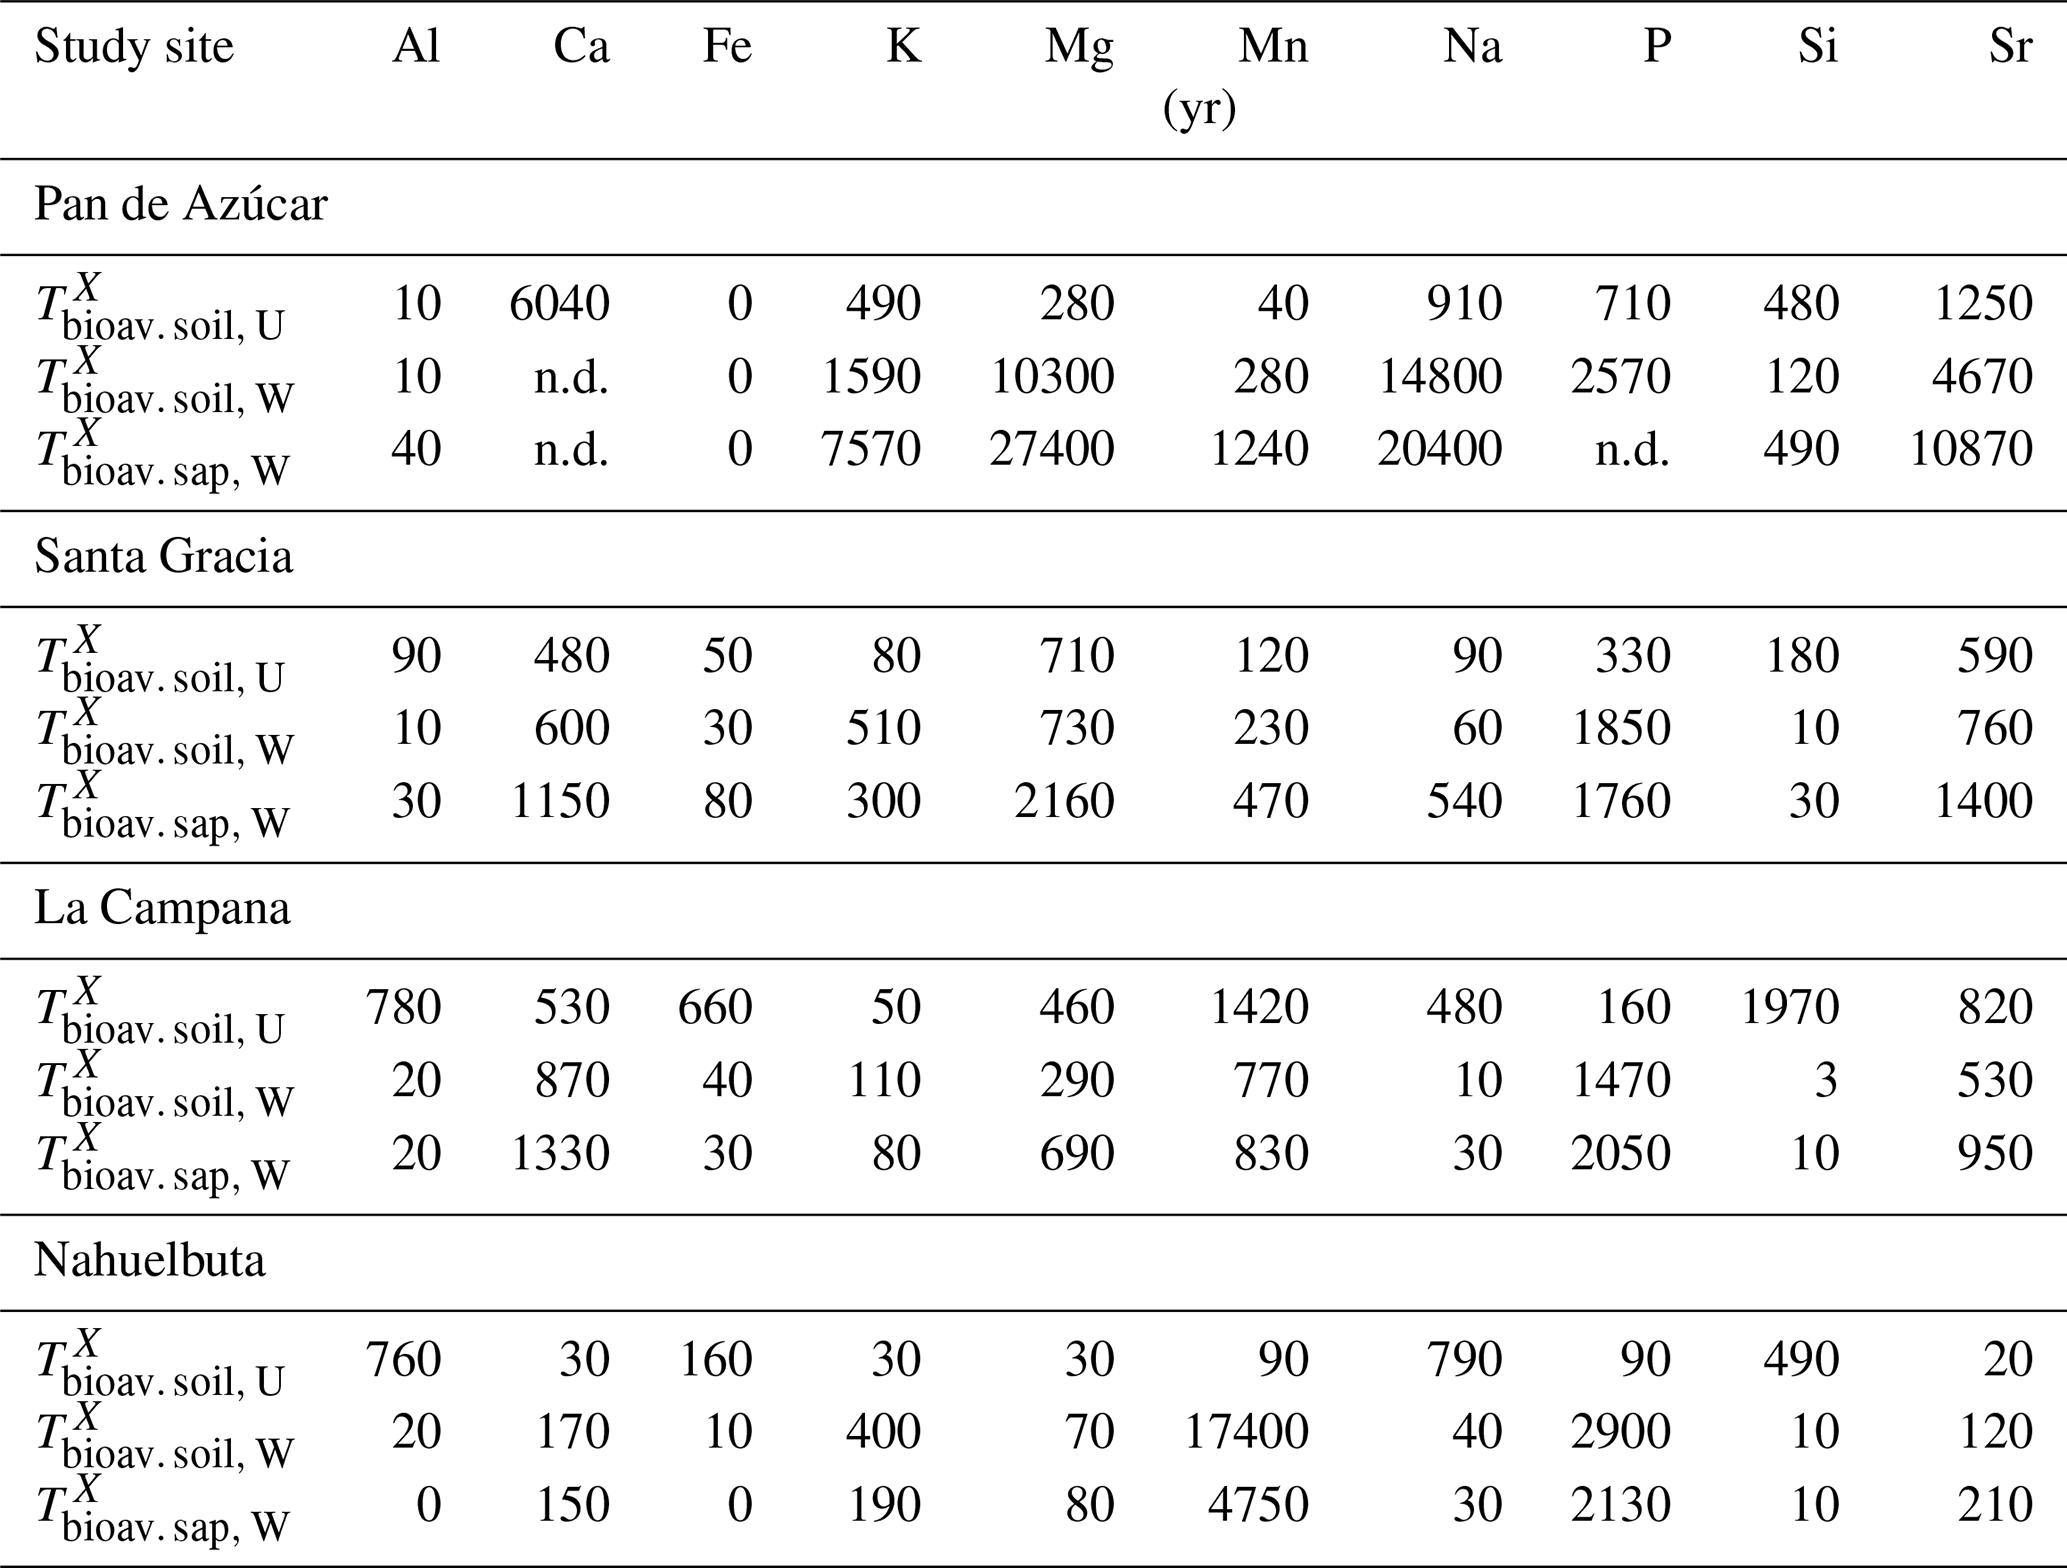
turnover time of element X in the soil bioavailable fraction with respect to uptake into the ecosystem. turnover time of element X in the soil bioavailable fraction with respect to supply from dissolution of primary minerals and secondary precipitates. turnover time of element X in the saprolite bioavailable fraction with respect to supply from dissolution of primary minerals and secondary precipitates. The abbreviation n.d. stands for turnover times where the respective inventory (Table A1) could not be determined.
Table A4Correlation matrix with Pearson's correlation coefficients and significance (: p<0.01; *: p<0.05) for net primary productivity (NPP), denudation rate (D), mean annual precipitation (MAP), and indices of total and elemental degree and rate of weathering. Here we treat each regolith profile as independent, i.e., n=8. Correlation coefficients involve the entire EarthShape study area. Bold numbers denote significant correlation.
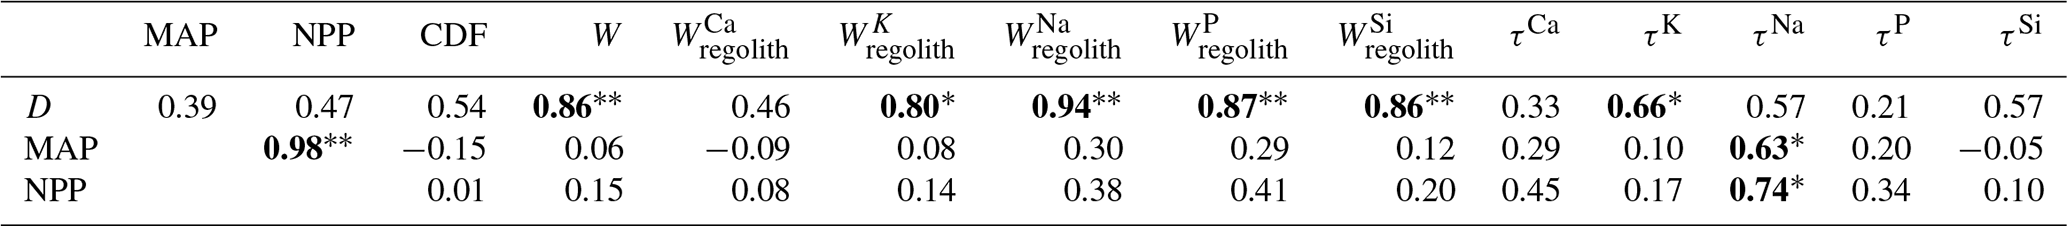
CDF is chemical depletion fraction. W is soil weathering rate. is elemental weathering flux. τX is elemental mass transfer coefficient. Note that because CDF and τX are by definition different in sign (i.e., a CDF of +1 denotes entire depletion, whereas a τX of −1 denotes entire depletion), τX was multiplied by −1 for presentation purposes.
Table A5Correlation matrix with Pearson's correlation coefficients and significance (: p<0.01; *: p<0.05) for net primary productivity (NPP), denudation rate (D), mean annual precipitation (MAP), and indices of total and elemental degree and rate of weathering. Correlation coefficients involve the study sites Pan de Azúcar, Santa Gracia, and Nahuelbuta. Here we treat each regolith profile as independent, i.e., n=6. La Campana has been excluded because it features the steepest relief of all sites, which causes elevated denudation rates. Bold numbers denote significant correlation.
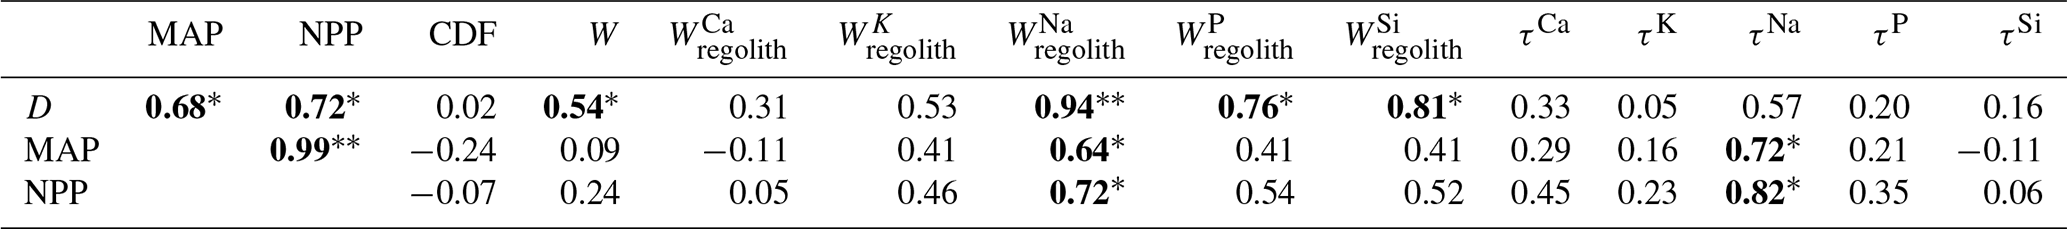
CDF is chemical depletion fraction. W is soil weathering rate. is elemental weathering flux. τX is elemental mass transfer coefficient. Note that because CDF and τX are by definition different in sign (i.e., a CDF of +1 denotes entire depletion, whereas a τX of −1 denotes entire depletion), τX was multiplied by −1 for presentation purposes.
Table A6ANOVAs evaluating variations in denudation rate (D), the chemical depletion fraction (CDF), soil weathering rate (W), and the elemental weathering rates for Ca, K, Na, P, and Si (, , , ) among sites (single regolith profiles treated as independent from each other, n=8). The Tukey HSD test for site comparison is shown below. Sig =1 indicates significant differences between the sites. The comparison between Santa Gracia and Nahuelbuta is highlighted in bold because of their importance in the discussion.
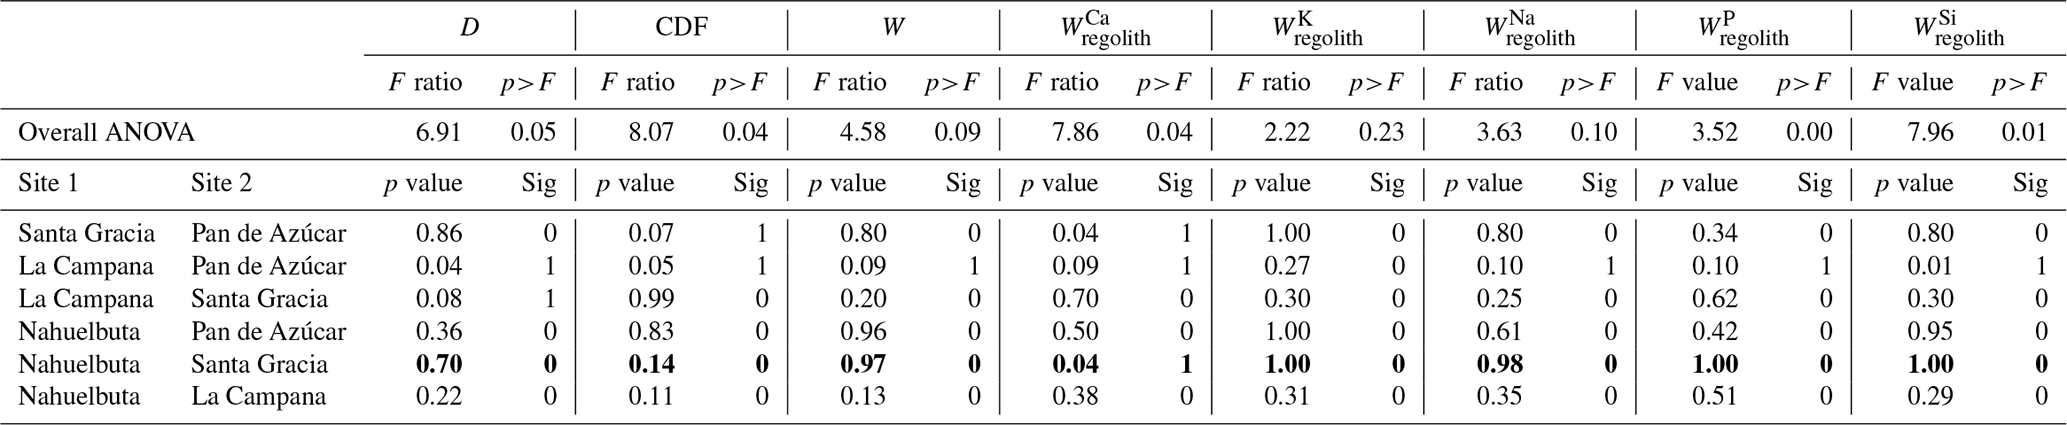
F ratio is the ratio of two mean square values. A p value of ≤0.1 indicates that populations have significant different mean values. Sig stands for significance (0: not significant; 1: significant).
A2 Ecosystem nutrient uptake fluxes
Total ecosystem nutrient uptake fluxes () have been evaluated using Eq. 4 and are reported in Table 3. Because we compare these to the weathering fluxes that integrate over several millennia, we estimate uptake fluxes that are representative for the Holocene. Net primary productivity (NPP), has been derived from a dynamic vegetation model (LPJ-GUESS) simulating vegetation cover and composition during the Holocene (Werner et al., 2018) and is reported in Table 1. Biomass production was estimated from NPP(C) by assuming that dry biomass consists of 50 wt % carbon. To obtain the element-specific uptake rate , NPP is multiplied with the bulk concentration of X in the plants [X]Plant.
The sampling and analyses of roots was not done in this study, because of the difficulties in obtaining entire roots or representative root segments from a specific tree or shrub including fine roots. For elemental analysis this difficulty is compounded by the need to remove any remaining soil particles or attached precipitates that might bias measured concentrations. To nevertheless estimate bulk plant elemental composition, we applied the dimensionless organ growth quotients GL/GS (leaf growth relative to stem growth) and GL/GR (leaf growth relative to root growth) in accordance with Niklas and Enquist (2002). This estimation invokes several assumptions: (1) root biomass growth contributes little to total plant growth, namely 9 % in angiosperms and 17 % in gymnosperms (Niklas and Enquist, 2002). We thus treat roots and stems or twigs as one plant compartment. In total, the pooled growth of root, stem, and twig amounts to 68 % and 52 % of relative growth in angiosperms and gymnosperms, respectively. (2) Differences in biomass allocation are relevant only between angiosperms and gymnosperms and not between single plant species of a given class. (3) The pattern of relative growth and standing biomass allocation holds true across a minimum of 8 orders of magnitude of species size (Niklas and Enquist, 2002). We thus adapted the organ growth quotients from the work of Niklas and Enquist (2002), such that we only differentiate between the growth rate of leaves and stem, respectively, and the adapt these quotients between angiosperms and gymnosperms. The bulk elemental ecosystem composition (Table 4) has been determined by weighting the averaged elemental composition for each sampled plant for their relative abundance in the respective ecosystem.
A3 Inventories
The inventories for the bioavailable fraction () and in bulk regolith () have been calculated using Eq. (8) and are reported in Table A1. was determined for both the bioavailable fraction in soil (comprised of the A and B horizon; ) and saprolite of 1 m thickness (). For the calculation of all inventories, we used the soils' bulk density determined by Bernhard et al. (2018). is comprised of elements contained in fine-earth material and in fragmented rocks and coarse material (e.g., core stones). We derive the relative amount of coarse material of each depth increment from Bernhard et al. (2018) and allocate them the bedrocks' chemical composition (Data Table S1). If information on either bulk density or the relative amount of coarse material was unavailable, the respective horizons' average has been used for the calculation of . In none of the eight regolith profiles is the depth to unweathered bedrock known. Thus, for comparison purposes, we calculated the inventories of the bioavailable fraction in saprolite () and in bulk regolith () to the depth of the respective regolith profile and normalized this value to the arbitrary value of 1 m.
A4 Nutrient recycling factor
We find the ratio of nutrient uptake to nutrient supply by weathering the “nutrient recycling factor” RecX, which was calculated using Eq. (7) and is reported in Table 5. Importantly, as defined, this factor finds ratios of fluxes between entire regolith and total uptake into the entire vegetation cover (the same rationale as used by Cleveland et al., 2013, for the inverse: the “new” fraction of P). RecX represents a minimum estimate as some fraction of will bypass nutrient uptake by plants if it is drained directly via groundwater into streams. RecX might represent an underestimate for some elements that are returned to soil by stem flow or throughfall. According to, for example, Wilcke et al. (2017), these fluxes are generally highest for K compared to other elements. RecX might also be an overestimate if a substantial fraction of nutrient is eroded by leaf litter and other plant debris after uptake, rendering it unavailable for recycling (Oeser and von Blanckenburg, 2020a).
In Pan de Azùcar, where atmospheric deposition ( and ) is known to be an important component of ecosystem element budgets (e.g., increasing τ values towards the profile top in absence of bio-lifting of elements and field observation; Oeser et al., 2018), we need to consider these inputs in addition to the weathering release fluxes (). Thus, to account for all potential sources of elements available for plant uptake, the nutrient recycling factor in Pan de Azúcar is given as follows:
Atmospheric deposition fluxes have been estimated by determining the absolute difference between the lowest τ value in the shallowest mineral soil sample and the highest τ value in the soil profile above it. Further, we assume that elemental gains (i.e., increasing τ values) in the regolith profiles are attributed solely to atmospheric deposition. We test these estimates for atmospheric depositional fluxes by placing the elemental gains in proportion to the initially determined weathering release fluxes (, Eq. 3; Table 3).
A5 Uncertainty estimation of nutrient fluxes
The analytical uncertainty of measured samples and certified international reference materials are reported in section “Analytical methods” and in the data publication of Oeser and von Blanckenburg (2020b).
The uncertainties in the nutrient fluxes of and were estimated by Monte Carlo simulations in which 20 000 random datasets were sampled within the standard deviation of all input parameters using a Box–Muller transformation (Box and Muller, 1958). The simulation of each regolith profiles' incorporates the SD of the average soil denudation rate D (Table 1), the SD of the concentration of the element of interest in bedrock (Data Table S1), and 3 % relative uncertainty in the element concentration in regolith samples. In the case of , the SD of the respective study sites' NPP and the SD of the chemical composition of the weighted plants (Table 4) were used. The resultant uncertainties in both fluxes are reported in Table 3.
B1 Replication
We present our results on nutrient fluxes, inventories, and turnover times as study site averages for synthesis reasons only. Indeed, at each study site four replicate regolith profiles have been analyzed in previous studies. Within a given site, these profiles show no significant differences in chemistry and pedogenic properties (Bernhard et al., 2018; Oeser et al., 2018). In this study we focused on two regolith profiles situated on opposing slopes (north- and south facing mid-slope profiles) to account for the variations in substrate and/or the effects of insolation and microclimate on weathering and nutrient uptake by plants. However, these profiles are natural replicates and are considered independent from each other.
B2 Statistical analysis
An analysis of variance (ANOVA) was performed to evaluate how denudation rate (D); the chemical depletion fraction (CDF); soil weathering rate (W), and the elemental weathering rates for Ca, K, Na, P, and Si () vary among sites. Variance homogeneity was tested using Levene's test before applying ANOVAs and pair-wise differences were assessed using Tukey's HSD test. In these, p values ≤0.1 were considered significant. The correlations between D, MAP, NPP, and the degree (CDF, τX) and rate (W, ) of weathering were evaluated using Pearson's correlation coefficients. To test for the significance of D in these weathering parameters, Pearson's correlation coefficients were evaluated twice, i.e., with (Table A4) and without La Campana (Table A5). This test is possible because of the high denudation rate of this site which originates from the steepest relief of all sites (Oeser et al., 2018; Schaller et al., 2018b; van Dongen et al., 2019). The sample set comprises the tested parameters for each regolith profile and each regolith profile is considered independent from each other (i.e., n=8). Statistical analyses were conducted using the statistics packages included in the software OriginPro (Version 2020).
Given the small sample size (n=8), testing for equal variances failed. Still, overall ANOVA showed all weathering patterns (except for ) differed among sites on the total population (Table A6). However, post hoc comparisons indicated that sites did not always differ and that differences between sites varied for the different weathering parameters (Table A6). Specifically, few statistically significant differences exist between the semiarid site Santa Gracia, the mediterranean site La Campana, and the humid-temperate site Nahuelbuta. In these three sites the weathering release fluxes do not differ significantly (Table A6) despite massive differences in D, MAP, and NPP (Table 1).
Supplementary data are available via GFZ data services (Oeser and von Blanckenburg, 2020b).
All sample metadata are already available on a public server using unique sample identifiers as “International Geo Sample Number” (IGSN).
RAO conducted field sampling, analyzed samples, interpreted data, and wrote the text. FvB designed the study, selected the study sites, interpreted data, and wrote the text.
The authors declare that they have no conflict of interest.
The study was conducted within the framework of the priority program of the Deutsche Forschungsgemeinschaft “EarthShape: Earth Surface Shaping by Biota” (DFG-SPP 1803; http://www.earthshape.net, last access: 30 June 2020). Ralf A. Oeser and Friedhelm von Blanckenburg are grateful for funding. We thank Leandro Paulino (Departamento de Suelos y Recursos Naturales, Universitad de Concepción, Chile) and Kirstin Übernickel for managing the priority program and Todd Ehlers (both Institute for Geosciences, Universität Tübingen, Germany) for its co-coordination. We acknowledge CONAF in Chile for providing us with the opportunity to work in the national parks of Pan de Azúcar, La Campana, and Nahuelbuta. We also thank CEAZA for facilitating access to the Reserva Natural Santa Gracia. We are grateful to Jens Boy (Soil Sciences, Leibniz Universität Hannover, Germany) for discussions and David Uhlig (Institute of Bio- and Geosciences, Forschungszentrum Jülich, Germany), Michaela Dippold (Department of Crop Sciences, Georg-August University Goettingen, Germany), Matthew Winnick (Department of Geosciences, University of Massachusetts, USA), and Patrick Frings (Section “Earth Surface Geochemistry”, GFZ German Research Centre for Geosciences, Germany) for informal reviews of the text. We thank the three anonymous referees and Marijn van de Broeck and his MSc students for their detailed critique of our work which led us to revise the manuscript with the aim of attempting to avoid the pitfalls that emerge when working across disciplines.
This research has been supported by the German National Science Foundation (grant no. DFG-SPP 1803).
The article processing charges for this open-access
publication were covered by a Research
Centre of the Helmholtz Association.
This paper was edited by Jack Middelburg and reviewed by three anonymous referees.
Amundson, R., Richter, D. D., Humphreys, G. S., Jobbágy, E. G., and Gaillardet, J. R. M.: Coupling between Biota and Earth Materials in the Critical Zone, Elements, 3, 327–332, https://doi.org/10.2113/gselements.3.5.327, 2007.
Andrino, A., Boy, J., Mikutta, R., Sauheitl, L., and Guggenberger, G.: Carbon Investment Required for the Mobilization of Inorganic and Organic Phosphorus Bound to Goethite by an Arbuscular Mycorrhiza (Solanum lycopersicum × Rhizophagus irregularis), Front. Environ. Sci., 7, 26, https://doi.org/10.3389/fenvs.2019.00026, 2019.
Armesto, J. J., Vidiella, P. E., and Gutiérrez, J. R.: Plant communities of the fog-free coastal desert of Chile: plant strategies in a fluctuating environment, Rev. Chil. Hist. Nat., 66, 271–282, 1993.
Arunachalam, J., Emons, H., Krasnodebska, B., and Mohl, C.: Sequential extraction studies on homogenized forest soil samples, Sci. Total Environ., 181, 147–159, https://doi.org/10.1016/0048-9697(95)05005-1, 1996.
Bahre, C. J.: Destruction of the natural vegetation of north-central Chile, University of California Press, Berkeley and Los Angeles, 117 pp., 1979.
Balogh-Brunstad, Z., Keller, C. K., Gill, R. A., Bormann, B. T., and Li, C. Y.: The effect of bacteria and fungi on chemical weathering and chemical denudation fluxes in pine growth experiments, Biogeochemistry, 88, 153–167, https://doi.org/10.1007/s10533-008-9202-y, 2008a.
Balogh-Brunstad, Z., Kent Keller, C., Thomas Dickinson, J., Stevens, F., Li, C. Y., and Bormann, B. T.: Biotite weathering and nutrient uptake by ectomycorrhizal fungus, Suillus tomentosus, in liquid-culture experiments, Geochim. Cosmochim. Ac., 72, 2601–2618, https://doi.org/10.1016/j.gca.2008.04.003, 2008b.
Beerling, D. J. and Berner, R. A.: Feedbacks and the coevolution of plants and atmospheric CO2, P. Natl. Acad. Sci. USA, 102, 1302–1305, https://doi.org/10.1073/pnas.0408724102, 2005.
Berg, K. and Baumann, A.: Plutonic and metasedimentary rocks from the Coastal Range of northern Chile: Rb-Sr and U-Pb isotopic systematics, Earth. Planet. Sc. Lett., 75, 101–115, https://doi.org/10.1016/0012-821X(85)90093-7, 1985.
Berg, K. and Breitkreuz, C.: Mesozoische Plutone in der nordchilenischen Küstenkordillere: petrogenese, geochronologie, Geochemie und Geodynamik mantelbetonter Magmatite, Geotectonic Research, Vol. 66, Schweizerbart Science Publishers, 107 pp., 1983.
Berner, E. K., Berner, R. A., and Moulton, K. L.: Plants and Mineral Weathering: Present and Past, in: Treatise on Geochemistry, Vol. 5, 169–188, https://doi.org/10.1016/b0-08-043751-6/05175-6, 2003.
Bernhard, N., Moskwa, L.-M., Schmidt, K., Oeser, R. A., Aburto, F., Bader, M. Y., Baumann, K., von Blanckenburg, F., Boy, J., van den Brink, L., Brucker, E., Canessa, R., Dippold, M. A., Ehlers, T. A., Fuentes, J. P., Godoy, R., Köster, M., Kuzyakov, Y., Leinweber, P., Neidhard, H., Matus, F., Mueller, C. W., Oelmann, Y., Oses, R., Osses, P., Paulino, L., Schaller, M., Schmid, M., Spielvogel, S., Spohn, M., Stock, S., Stroncik, N., Tielbörger, K., Übernickel, K., Scholten, T., Seguel, O., Wagner, D., and Kühn, P.: Pedogenic and microbial interrelations to regional climate and local topography: new insights from a climate gradient (arid to humid) along the Coastal Cordillera of Chile, Catena, 170, 335–355, https://doi.org/10.1016/j.catena.2018.06.018, 2018.
Blanco-Chao, R., Pedoja, K., Witt, C., Martinod, J., Husson, L., Regard, V., Audin, L., Nexer, M., Delcaillau, B., Saillard, M., Melnick, D., Dumont, J. F., Santana, E., Navarrete, E., Martillo, C., Pappalardo, M., Ayala, L., Araya, J. F., Feal-Perez, A., Correa, D., and Arozarena-Llopis, I.: The rock coast of South and Central America, in: Rock Coast Geomorphology: A Global Synthesis., 1, The Geological Society, London, 155–191, https://doi.org/10.1144/m40.10, 2014.
Blum, J. D., Klaue, A., Nezat, C. A., Driscoll, C. T., Johnson, C. E., Siccama, T. G., Eagar, C., Fahey, T. J., and Likens, G. E.: Mycorrhizal weathering of apatite as an important calcium source in base-poor forest ecosystems, Nature, 417, 729–731, https://doi.org/10.1038/nature00793, 2002.
Bonneville, S., Morgan, D. J., Schmalenberger, A., Bray, A., Brown, A., Banwart, S. A., and Benning, L. G.: Tree-mycorrhiza symbiosis accelerate mineral weathering: Evidences from nanometer-scale elemental fluxes at the hypha–mineral interface, Geochim. Cosmochim. Ac., 75, 6988–7005, https://doi.org/10.1016/j.gca.2011.08.041, 2011.
Bormann, F., Likens, G., and Eaton, J.: Biotic regulation of particulate and solution losses from a forest ecosystem, Bioscience, 19, 600–610, https://doi.org/10.2307/1294934, 1969.
Box, G. E. P. and Muller, M. E.: A note on the generation of random normal deviates, Ann. Math. Statist., 29, 610–611, https://doi.org/10.1214/aoms/1177706645, 1958.
Boy, J. and Wilcke, W.: Tropical Andean forest derives calcium and magnesium from Saharan dust, Global Biogeochem. Cy., 22, GB1027, https://doi.org/10.1029/2007gb002960, 2008.
Brantley, S. L. and Lebedeva, M.: Learning to Read the Chemistry of Regolith to Understand the Critical Zone, Annu. Rev. Earth Pl. Sc., 39, 387–416, https://doi.org/10.1146/annurev-earth-040809-152321, 2011.
Brantley, S. L., Megonigal, J. P., Scatena, F. N., Balogh-Brunstad, Z., Barnes, R. T., Bruns, M. A., Van Cappellen, P., Dontsova, K., Hartnett, H. E., Hartshorn, A. S., Heimsath, A., Herndon, E., Jin, L., Keller, C. K., Leake, J. R., McDowell, W. H., Meinzer, F. C., Mozdzer, T. J., Petsch, S., Pett-Ridge, J., Pregitzer, K. S., Raymond, P. A., Riebe, C. S., Shumaker, K., Sutton-Grier, A., Walter, R., and Yoo, K.: Twelve testable hypotheses on the geobiology of weathering, Geobiology, 9, 140–165, https://doi.org/10.1111/j.1472-4669.2010.00264.x, 2011.
Brantley, S. L., Lebedeva, M., and Heimshath, E. H.: A Geobiological View of Weathering and Erosion, in: Fundamentals of Geobiology, edited by: Knoll, A. H., Blackwell Publishing, 205–227, https://doi.org/10.1002/9781118280874.ch12, 2012.
Brantley, S. L., Eissenstat, D. M., Marshall, J. A., Godsey, S. E., Balogh-Brunstad, Z., Karwan, D. L., Papuga, S. A., Roering, J., Dawson, T. E., Evaristo, J., Chadwick, O., McDonnell, J. J., and Weathers, K. C.: Reviews and syntheses: on the roles trees play in building and plumbing the critical zone, Biogeosciences, 14, 5115–5142, https://doi.org/10.5194/bg-14-5115-2017, 2017.
Brucker, E. and Spohn, M.: Formation of soil phosphorus fractions along a climate and vegetation gradient in the Coastal Cordillera of Chile, Catena, 180, 203–211, https://doi.org/10.1016/j.catena.2019.04.022, 2019.
Buendía, C., Kleidon, A., and Porporato, A.: The role of tectonic uplift, climate, and vegetation in the long-term terrestrial phosphorous cycle, Biogeosciences, 7, 2025–2038, https://doi.org/10.5194/bg-7-2025-2010, 2010.
Bullen, T. D. and Chadwick, O.: Ca, Sr and Ba stable isotopes reveal the fate of soil nutrients along a tropical climosequence in Hawaii, Chem. Geol., 422, 25–45, https://doi.org/10.1016/j.chemgeo.2015.12.008, 2016.
Buss, H. L., Bruns, M. A., Schultz, D. J., Moore, J., Mathur, C. F., and Brantley, S. L.: The coupling of biological iron cycling and mineral weathering during saprolite formation, Luquillo Mountains, Puerto Rico, Geobiology, 3, 247–260, https://doi.org/10.1111/j.1472-4669.2006.00058.x, 2005.
Calmels, D., Gaillardet, J., and François, L.: Sensitivity of carbonate weathering to soil CO2 production by biological activity along a temperate climate transect, Chem. Geol., 390, 74–86, https://doi.org/10.1016/j.chemgeo.2014.10.010, 2014.
Canadell, J., Jackson, R., Ehleringer, J., Mooney, H., Sala, O., and Schulze, E.-D.: Maximum rooting depth of vegetation types at the global scale, Oecologia, 108, 583–595, 1996.
Chadwick, K. D. and Asner, G. P.: Tropical soil nutrient distributions determined by biotic and hillslope processes, Biogeochemistry, 127, 273–289, https://doi.org/10.1007/s10533-015-0179-z, 2016.
Chadwick, O. A., Brimhall, G. H., and Hendricks, D. M.: From a black to a gray box – a mass balance interpretation of pedogenesis, Geomorphology, 3, 369–390, https://doi.org/10.1016/0169-555x(90)90012-f, 1990.
Chadwick, O. A., Derry, L. A., Vitousek, P. M., Huebert, B. J., and Hedin, L. O.: Changing sources of nutrients during four million years of ecosystem development, Nature, 397, 491–497, https://doi.org/10.1038/17276, 1999.
Chapin III, F. S.: The mineral nutrition of wild plants, Annu. Rev. Ecol. Syst., 11, 233–260, 1980.
Chapin III, F. S., Matson, P. A., and Vitousek, P. M.: Principles of Terrestrial Ecosystem Ecology, 2nd Edn., 529 pp., 2011.
Chaudhuri, S., Clauer, N., and Semhi, K.: Plant decay as a major control of river dissolved potassium: A first estimate, Chem. Geol., 243, 178–190, https://doi.org/10.1016/j.chemgeo.2007.05.023, 2007.
Cleveland, C. C., Houlton, B. Z., Smith, W. K., Marklein, A. R., Reed, S. C., Parton, W., Del Grosso, S. J., and Running, S. W.: Patterns of new versus recycled primary production in the terrestrial biosphere, P. Natl. Acad. Sci. USA, 110, 12733–12737, https://doi.org/10.1073/pnas.1302768110, 2013.
Dal Bo, I., Klotzsche, A., Schaller, M., Ehlers, T. A., Kaufmann, M. S., Fuentes Espoz, J. P., Vereecken, H., and van der Kruk, J.: Geophysical imaging of regolith in landscapes along a climate and vegetation gradient in the Chilean coastal cordillera, Catena, 180, 146–159, https://doi.org/10.1016/j.catena.2019.04.023, 2019.
Day, T. A., Guénon, R., and Ruhland, C. T.: Photodegradation of plant litter in the Sonoran Desert varies by litter type and age, Soil Biol. Biochem., 89, 109–122, https://doi.org/10.1016/j.soilbio.2015.06.029, 2015.
Delhaize, E. and Ryan, P. R.: Aluminum Toxicity and Tolerance in Plants, Plant Physiol., 107, 315–321, https://doi.org/10.1104/pp.107.2.315, 1995.
Dere, A. L., White, T. S., April, R. H., Reynolds, B., Miller, T. E., Knapp, E. P., McKay, L. D., and Brantley, S. L.: Climate dependence of feldspar weathering in shale soils along a latitudinal gradient, Geochim. Cosmochim. Ac., 122, 101–126, https://doi.org/10.1016/j.gca.2013.08.001, 2013.
Dixon, J. L., Heimsath, A. M., Kaste, J., and Amundson, R.: Climate-driven processes of hillslope weathering, Geology, 37, 975–978, https://doi.org/10.1130/g30045a.1, 2009.
Dixon, J. L., Hartshorn, A. S., Heimsath, A. M., DiBiase, R. A., and Whipple, K. X.: Chemical weathering response to tectonic forcing: A soils perspective from the San Gabriel Mountains, California, Earth. Planet. Sc. Lett., 323/324, 40–49, https://doi.org/10.1016/j.epsl.2012.01.010, 2012.
Dixon, J. L., Chadwick, O. A., and Vitousek, P. M.: Climate-driven thresholds for chemical weathering in postglacial soils of New Zealand, J. Geophys. Res.-Earth Surf., 121, 1619–1634, https://doi.org/10.1002/2016jf003864, 2016.
Dosseto, A., Buss, H. L., and Suresh, P. O.: Rapid regolith formation over volcanic bedrock and implications for landscape evolution, Earth. Planet. Sc. Lett., 337/338, 47–55, https://doi.org/10.1016/j.epsl.2012.05.008, 2012.
Doughty, C. E., Taylor, L. L., Girardin, C. A. J., Malhi, Y., and Beerling, D. J.: Montane forest root growth and soil organic layer depth as potential factors stabilizing Cenozoic global change, Geophys. Res. Lett., 41, 983–990, https://doi.org/10.1002/2013gl058737, 2014.
Drever, J. I.: The effect of land plants on weathering rates of silicate minerals, Geochim. Cosmochim. Ac., 58, 2325–2332, https://doi.org/10.1016/0016-7037(94)90013-2, 1994.
Drever, J. I. and Zobrist, J.: Chemical weathering of silicate rocks as a function of elevation in the southern Swiss Alps, Geochim. Cosmochim. Ac., 56, 3209–3216, https://doi.org/10.1016/0016-7037(92)90298-w, 1992.
Eger, A., Yoo, K., Almond, P. C., Boitt, G., Larsen, I. J., Condron, L. M., Wang, X., and Mudd, S. M.: Does soil erosion rejuvenate the soil phosphorus inventory?, Geoderma, 332, 45–59, https://doi.org/10.1016/j.geoderma.2018.06.021, 2018.
Egli, M., Mirabella, A., Sartori, G., and Fitze, P.: Weathering rates as a function of climate: results from a climosequence of the Val Genova (Trentino, Italian Alps), Geoderma, 111, 99–121, https://doi.org/10.1016/S0016-7061(02)00256-2, 2003.
Fabian, J., Zlatanovic, S., Mutz, M., and Premke, K.: Fungal-bacterial dynamics and their contribution to terrigenous carbon turnover in relation to organic matter quality, ISME J., 11, 415–425, https://doi.org/10.1038/ismej.2016.131, 2017.
Fan, Y., Miguez-Macho, G., Jobbagy, E. G., Jackson, R. B., and Otero-Casal, C.: Hydrologic regulation of plant rooting depth, P. Natl. Acad. Sci. USA, 114, 10572–10577, https://doi.org/10.1073/pnas.1712381114, 2017.
Ferrier, K. L., Kirchner, J. W., and Finkel, R. C.: Erosion rates over millennial and decadal timescales at Caspar Creek and Redwood Creek, Northern California Coast Ranges, Earth Surf. Proc. Land., 30, 1025–1038, https://doi.org/10.1002/esp.1260, 2005.
Ferrier, K. L., Kirchner, J. W., Riebe, C. S., and Finkel, R. C.: Mineral-specific chemical weathering rates over millennial timescales: Measurements at Rio Icacos, Puerto Rico, Chem. Geol., 277, 101–114, https://doi.org/10.1016/j.chemgeo.2010.07.013, 2010.
Ferrier, K. L., Kirchner, J. W., and Finkel, R. C.: Weak influences of climate and mineral supply rates on chemical erosion rates: Measurements along two altitudinal transects in the Idaho Batholith, J. Geophys. Res.-Earth Surf., 117, F02026, https://doi.org/10.1029/2011jf002231, 2012.
Finlay, R. D., Mahmood, S., Rosenstock, N., Bolou-Bi, E. B., Köhler, S. J., Fahad, Z., Rosling, A., Wallander, H., Belyazid, S., Bishop, K., and Lian, B.: Reviews and syntheses: Reviews and syntheses: Biological weathering and its consequences at different spatial levels – from nanoscale to global scale, Biogeosciences, 17, 1507–1533, https://doi.org/10.5194/bg-17-1507-2020, 2020.
Fisher, B. A., Rendahl, A. K., Aufdenkampe, A. K., and Yoo, K.: Quantifying weathering on variable rocks, an extension of geochemical mass balance: Critical zone and landscape evolution, Earth Surf. Proc. Land., 42, 2457–2468, https://doi.org/10.1002/esp.4212, 2017.
Gallo, M. E., Sinsabaugh, R. L., and Cabaniss, S. E.: The role of ultraviolet radiation in litter decomposition in arid ecosystems, Appl. Soil Ecol., 34, 82–91, https://doi.org/10.1016/j.apsoil.2005.12.006, 2006.
Gerrits, R., Pokharel, R., Breitenbach, R., Radnik, J., Feldmann, I., Schuessler, J. A., von Blanckenburg, F., Gorbushina, A. A., and Schott, J.: How the rock-inhabiting fungus K. petricola A95 enhances olivine dissolution through attachment, Geochim. Cosmochim. Ac., 282, 76–97, https://doi.org/10.1016/j.gca.2020.05.010, 2020.
Giehl, R. F. and von Wiren, N.: Root nutrient foraging, Plant Physiol., 166, 509–517, https://doi.org/10.1104/pp.114.245225, 2014.
Godoy, R. and Mayr, R.: Caracterización morfológica de micorrizas vesículo-arbusculares en coníferas endémicas del sur de Chile, Bosque, 10, 89–98, 1989.
Godsey, S. E., Hartmann, J., and Kirchner, J. W.: Catchment chemostasis revisited: Water quality responds differently to variations in weather and climate, Hydrol. Process., 33, 3056–3069, https://doi.org/10.1002/hyp.13554, 2019.
Green, E., Dietrich, W., and Banfield, J.: Quantification of chemical weathering rates across an actively eroding hillslope, Earth. Planet. Sc. Lett., 242, 155–169, https://doi.org/10.1016/j.epsl.2005.11.039, 2006.
Hahm, W. J., Riebe, C. S., Lukens, C. E., and Araki, S.: Bedrock composition regulates mountain ecosystems and landscape evolution, P. Natl. Acad. Sci. USA, 111, 3338–3343, https://doi.org/10.1073/pnas.1315667111, 2014.
Hasenmueller, E. A., Gu, X., Weitzman, J. N., Adams, T. S., Stinchcomb, G. E., Eissenstat, D. M., Drohan, P. J., Brantley, S. L., and Kaye, J. P.: Weathering of rock to regolith: The activity of deep roots in bedrock fractures, Geoderma, 300, 11–31, https://doi.org/10.1016/j.geoderma.2017.03.020, 2017.
Hattenschwiler, S., Coq, S., Barantal, S., and Handa, I. T.: Leaf traits and decomposition in tropical rainforests: revisiting some commonly held views and towards a new hypothesis, New Phytol., 189, 950–965, https://doi.org/10.1111/j.1469-8137.2010.03483.x, 2011.
He, X. T., Logan, T. J., and Traina, S. J.: Physical and chemical characteristics of selected US municipal solid waste composts, J. Environ. Qual., 24, 543–552, https://doi.org/10.2134/jeq1995.00472425002400030022x, 1995.
Heartsill Scalley, T., Scatena, F. N., Moya, S., and Lugo, A. E.: Long-term dynamics of organic matter and elements exported as coarse particulates from two Caribbean montane watersheds, J. Trop. Ecol., 28, 127–139, https://doi.org/10.1017/s0266467411000733, 2012.
Heimsath, A. M., Dietrich, W. E., Nishiizumi, K., and Finkel, R. C.: The soil production function and landscape equilibrium, Nature, 388, 358–361, https://doi.org/10.1038/41056, 1997.
Hervé, F., Munizaga, F., Mantovani, M., and Hervé, M.: Edades Rb/Sr neopaleozoicas del basamento cristallino de la Cordillera de Nahuelbuta, Primer Congresso Geologico Chileno, Santiago, F214–F224, 1976.
Hervé, F.: Petrology of the crystalline basement of the Nahuelbuta Mountains, south-central Chile, Comparative studies on the Geology of the Circum-Pacific orogenic belt in Japan and Chile, edited by: Ishikava, I. and Aguirre, L., Japan Society for the Promotion of Science, 1–51, 1977.
Hewawasam, T., von Blanckenburg, F., Bouchez, J., Dixon, J. L., Schuessler, J. A., and Maekeler, R.: Slow advance of the weathering front during deep, supply-limited saprolite formation in the tropical Highlands of Sri Lanka, Geochim. Cosmochim. Ac., 118, 202–230, https://doi.org/10.1016/j.gca.2013.05.006, 2013.
Houlton, B. Z., Morford, S. L., and Dahlgren, R. A.: Convergent evidence for widespread rock nitrogen sources in Earth's surface environment, Science, 360, 58–62, https://doi.org/10.1126/science.aan4399, 2018.
Ibarra, D. E., Caves, J. K., Moon, S., Thomas, D. L., Hartmann, J., Chamberlain, C. P., and Maher, K.: Differential weathering of basaltic and granitic catchments from concentration–discharge relationships, Geochim. Cosmochim. Ac., 190, 265–293, https://doi.org/10.1016/j.gca.2016.07.006, 2016.
Ibarra, D. E., Rugenstein, J. K. C., Bachan, A., Baresch, A., Lau, K. V., Thomas, D. L., Lee, J.-E., Boyce, C. K., and Chamberlain, C. P.: Modeling the consequences of land plant evolution on silicate weathering, Am. J. Sci., 319, 1–43, https://doi.org/10.2475/01.2019.01, 2019.
Jobbágy, E. G. and Jackson, R. B.: The uplift of soil nutrients by plants: Biogeochemical consequences across scales, Ecology, 85, 2380–2389, 2004.
Jobbágy, E. G. A. J. and Robert B: The distribution of soil nutrients with depth: global patterns and the imprint of plants, Biogeochemistry, 53, 51–77, https://doi.org/10.1023/A:1010760720215, 2001.
Joos, O., Hagedorn, F., Heim, A., Gilgen, A. K., Schmidt, M. W. I., Siegwolf, R. T. W., and Buchmann, N.: Summer drought reduces total and litter-derived soil CO2 effluxes in temperate grassland – clues from a 13C litter addition experiment, Biogeosciences, 7, 1031–1041, https://doi.org/10.5194/bg-7-1031-2010, 2010.
Jung, M., Reichstein, M., Margolis, H. A., Cescatti, A., Richardson, A. D., Arain, M. A., Arneth, A., Bernhofer, C., Bonal, D., Chen, J., Gianelle, D., Gobron, N., Kiely, G., Kutsch, W., Lasslop, G., Law, B. E., Lindroth, A., Merbold, L., Montagnani, L., Moors, E. J., Papale, D., Sottocornola, M., Vaccari, F., and Williams, C.: Global patterns of land-atmosphere fluxes of carbon dioxide, latent heat, and sensible heat derived from eddy covariance, satellite, and meteorological observations, J. Geophys. Res., 116, G00J07, https://doi.org/10.1029/2010jg001566, 2011.
Kalinowski, B. E., Liermann, L. J., Givens, S., and Brantley, S. L.: Rates of bacteria-promoted solubilization of Fe from minerals: a review of problems and approaches, Chem. Geol., 169, 357–370, https://doi.org/10.1016/s0009-2541(00)00214-x, 2000.
Kelly, A. E. and Goulden, M. L.: A montane Mediterranean climate supports year-round photosynthesis and high forest biomass, Tree Physiol., 36, 459–468, https://doi.org/10.1093/treephys/tpv131, 2016.
Kelly, E. F., Chadwick, O. A., and Hilinski, T. E.: The effect of plants on mineral weathering, Biogeochemistry, 42, 21–53, https://doi.org/10.1023/a:1005919306687, 1998.
Kleidon, A., Fraedrich, K., and Heimann, M.: A Green Planet Versus a Desert World: Estimating the Maximum Effect of Vegetation on the Land Surface Climate, Climatic Change, 44, 471–493, https://doi.org/10.1023/a:1005559518889, 2000.
Kronzucker, H. J. and Britto, D. T.: Sodium transport in plants: a critical review, New Phytol., 189, 54–81, https://doi.org/10.1111/j.1469-8137.2010.03540.x, 2011.
Kump, L. R., Brantley, S. L., and Arthur, M. A.: Chemical Weathering, Atmospheric CO2, and Climate, Annu. Rev. Earth Pl. Sc., 28, 611–667, https://doi.org/10.1146/annurev.earth.28.1.611, 2000.
Laliberte, E., Grace, J. B., Huston, M. A., Lambers, H., Teste, F. P., Turner, B. L., and Wardle, D. A.: How does pedogenesis drive plant diversity?, Trends Ecol. Evol., 28, 331–340, https://doi.org/10.1016/j.tree.2013.02.008, 2013.
Lambers, H., Raven, J. A., Shaver, G. R., and Smith, S. E.: Plant nutrient-acquisition strategies change with soil age, Trends Ecol. Evol., 23, 95–103, https://doi.org/10.1016/j.tree.2007.10.008, 2008.
Lambers, H., Brundrett, M. C., Raven, J. A., and Hopper, S. D.: Plant mineral nutrition in ancient landscapes: high plant species diversity on infertile soils is linked to functional diversity for nutritional strategies, Plant Soil, 348, 7–27, https://doi.org/10.1007/s11104-011-0977-6, 2011.
Lang, F., Bauhus, J., Frossard, E., George, E., Kaiser, K., Kaupenjohann, M., Krüger, J., Matzner, E., Polle, A., Prietzel, J., Rennenberg, H., and Wellbrock, N.: Phosphorus in forest ecosystems: New insights from an ecosystem nutrition perspective, J. Plant Nutr. Soil Sci., 179, 129–135, https://doi.org/10.1002/jpln.201500541, 2016.
Lang, F., Krüger, J., Amelung, W., Willbold, S., Frossard, E., Bünemann, E. K., Bauhus, J., Nitschke, R., Kandeler, E., Marhan, S., Schulz, S., Bergkemper, F., Schloter, M., Luster, J., Guggisberg, F., Kaiser, K., Mikutta, R., Guggenberger, G., Polle, A., Pena, R., Prietzel, J., Rodionov, A., Talkner, U., Meesenburg, H., von Wilpert, K., Hölscher, A., Dietrich, H. P., and Chmara, I.: Soil phosphorus supply controls P nutrition strategies of beech forest ecosystems in Central Europe, Biogeochemistry, 136, 5–29, https://doi.org/10.1007/s10533-017-0375-0, 2017.
Lee, J.-E. and Boyce, K.: Impact of the hydraulic capacity of plants on water and carbon fluxes in tropical South America, J. Geophys. Res., 115, D23123, https://doi.org/10.1029/2010jd014568, 2010.
Lenton, T. M., Crouch, M., Johnson, M., Pires, N., and Dolan, L.: First plants cooled the Ordovician, Nat. Geosci., 5, 86–89, https://doi.org/10.1038/ngeo1390, 2012.
Liang, Y., Sun, W., Zhu, Y. G., and Christie, P.: Mechanisms of silicon-mediated alleviation of abiotic stresses in higher plants: a review, Environ. Pollut., 147, 422–428, https://doi.org/10.1016/j.envpol.2006.06.008, 2007.
Lin, H.: Linking principles of soil formation and flow regimes, J. Hydrol., 393, 3–19, https://doi.org/10.1016/j.jhydrol.2010.02.013, 2010.
Lucas, Y.: The Role of Plants in Controlling Rates and Products of Weathering: Importance of Biological Pumping, Annu. Rev. Earth Pl. Sc., 29, 135–163, https://doi.org/10.1146/annurev.earth.29.1.135, 2001.
Luebert, F. and Pliscoff, P.: Sinópsis bioclimática y vegetacional de Chile., Editorial Universitaria, Santiago de Chile, 316 pp., 2006.
Ma, J. F. and Yamaji, N.: Functions and transport of silicon in plants, Cell. Mol. Life Sci., 65, 3049–3057, https://doi.org/10.1007/s00018-008-7580-x, 2008.
Maher, K.: The dependence of chemical weathering rates on fluid residence time, Earth. Planet. Sc. Lett., 294, 101–110, https://doi.org/10.1016/j.epsl.2010.03.010, 2010.
Maher, K. and Chamberlain, C. P.: Hydrologic regulation of chemical weathering and the geologic carbon cycle, Science, 343, 1502–1504, https://doi.org/10.1126/science.1250770, 2014.
McCulley, R. L., Jobbágy, E. G., Pockman, W. T., and Jackson, R. B.: Nutrient uptake as a contributing explanation for deep rooting in arid and semi-arid ecosystems, Oecologia, 141, 620–628, https://doi.org/10.1007/s00442-004-1687-z, 2004.
Melnik, D.: Rise of the central Andean coast by Earthquakes straddling the Moho, Nat. Geosci., 9, 401–407, https://doi.org/10.1038/ngeo2683, 2016.
Ministerio de Obras Públicas: Información Oficial Hidrometeorológica y de Calidad de Aguas en Línea: https://snia.dga.cl/BNAConsultas/reportes (last access: 12 June 2017), 2017.
Minyard, M. L., Bruns, M. A., Liermann, L. J., Buss, H. L., and Brantley, S. L.: Bacterial Associations with Weathering Minerals at the Regolith-Bedrock Interface, Luquillo Experimental Forest, Puerto Rico, Geomicrobiol. J., 29, 792–803, https://doi.org/10.1080/01490451.2011.619640, 2012.
Miralles Gonzaìlez, C.: Evaluación de los factores que controllan la geoquímica de sedimentos fluviales de la cuenca del Río Elqui, Región de Coquimbo, Chile, Depeartamento de Geología, Universidad de Chile, 109 pp., 2013.
Molina, P. G., Parada, M. A., Gutiérrez, F. J., Ma, C., Li, J., Yuanyuan, L., Reich, M., and Aravena, Á.: Protracted late magmatic stage of the Caleu pluton (central Chile) as a consequence of heat redistribution by diking: Insights from zircon data and thermal modeling, Lithos, 227, 255–268, https://doi.org/10.1016/j.lithos.2015.04.008, 2015.
Mooney, H. A., Gulmon, S. L., Ehleringer, J., and Rundel, P. W.: Atmospheric water uptake by an Atacama Desert shrub, Science, 209, 693–694, 1980.
Moscoso, R., Nasi, C., and Salinas, P.: Hoja Vallenar y parte norte de La Serena: regiones de Atacama y Coquimbo: carta geológica de Chile 1: 250.000, Servicio Nacional de Geología y Minería Chile, 1982.
Moulton, K. L., West, J., and Berner, R. A.: Solute flux and mineral mass balance approaches to the quantification of plant effects on silicate weathering, Am. J. Sci., 300, 539–570, https://doi.org/10.2475/ajs.300.7.539, 2000.
Nier, A. O.: The Isotopic Constitution of Strontium, Barium, Bismuth, Thallium and Mercury, Phys. Rev., 54, 275–278, https://doi.org/10.1103/PhysRev.54.275, 1938.
Niklas, K. J. and Enquist, B. J.: Canonical rules for plant organ biomass partitioning and annual allocation, Am. J. Bot., 89, 812–819, 2002.
Oelkers, E. H., Benning, L. G., Lutz, S., Mavromatis, V., Pearce, C. R., and Plümper, O.: The efficient long-term inhibition of forsterite dissolution by common soil bacteria and fungi at Earth surface conditions, Geochim. Cosmochim. Ac., 168, 222–235, https://doi.org/10.1016/j.gca.2015.06.004, 2015.
Oelmann, Y., Richter, A. K., Roscher, C., Rosenkranz, S., Temperton, V. M., Weisser, W. W., and Wilcke, W.: Does plant diversity influence phosphorus cycling in experimental grasslands?, Geoderma, 167/168, 178–187, https://doi.org/10.1016/j.geoderma.2011.09.012, 2011.
Oeser, R. A. and von Blanckenburg, F.: Strontium isotopes trace biological activity in the Critical Zone along a climate and vegetation gradient, Chem. Geol., https://doi.org/10.1016/j.chemgeo.2020.119861, 2020a.
Oeser, R. A. and von Blanckenburg, F.: Dataset for evaluation element fluxes released by weathering and taken up by plants along the EarthShape climate and vegetation gradient, GFZ Data Services, https://doi.org/10.5880/GFZ.3.3.2020.003, 2020b.
Oeser, R. A., Stroncik, N., Moskwa, L.-M., Bernhard, N., Schaller, M., Canessa, R., van den Brink, L., Köster, M., Brucker, E., Stock, S., Fuentes, J. P., Godoy, R., Matus, F. J., Oses Pedraza, R., Osses McIntyre, P., Paulino, L., Seguel, O., Bader, M. Y., Boy, J., Dippold, M. A., Ehlers, T. A., Kühn, P., Kuzyakov, Y., Leinweber, P., Scholten, T., Spielvogel, S., Spohn, M., Übernickel, K., Tielbörger, K., Wagner, D., and von Blanckenburg, F.: Chemistry and Microbiology of the Critical Zone along a steep climate and vegetation gradient in the Chilean Coastal Cordillera, Catena, 170, 183–203, https://doi.org/10.1016/j.catena.2018.06.002, 2018.
OriginPro: OriginLab Corporation, Northampton, MA, USA, available at: https://www.originlab.com ( last access: 13 October 2020), Version 2020.
Pagani, M., Caldeira, K., Berner, R., and Beerling, D. J.: The role of terrestrial plants in limiting atmospheric CO2 decline over the past 24 million years, Nature, 460, 85–88, https://doi.org/10.1038/nature08133, 2009.
Parada, M. A. and Larrondo, P.: Thermochronology of the Lower Cretaceous Caleu Pluton in the coastal range of central Chile: tectonostratigraphic implications, Abstracts, 4th International Symposium of Andean Geodynamics, Göttingen, 563–566, 1999.
Parada, M. A., Larrondo, P., Guiresse, C., and Roperch, P.: Magmatic Gradients in the Cretaceous Caleu Pluton (Central Chile): Injections of Pulses from a Stratified Magma Reservoir, Gondwana Res., 5, 307–324, https://doi.org/10.1016/s1342-937x(05)70725-5, 2002.
Parada, M. A., López-Escobar, L., Oliveros, V., Fuentes, F., Morata, D., Calderón, M., Aguirre, L., Féraud, G., Espinoza, F., Moreno, H., Figueroa, O., Muñoz Bravo, J., Vásquez, R. T., and Stern, C. R.: Andean magmatism, in: The Geology of Chile, edited by: Moreno, T. and Gibbons, W., The Geological Society of London, 115–146, https://doi.org/10.1144/GOCH.4, 2007.
Pearce, C. R., Parkinson, I. J., Gaillardet, J., Chetelat, B., and Burton, K. W.: Characterising the stable (δ 88/86 Sr) and radiogenic (87Sr ∕ 86Sr) isotopic composition of strontium in rainwater, Chem. Geol., 409, 54–60, https://doi.org/10.1016/j.chemgeo.2015.05.010, 2015.
Perez-Fodich, A. and Derry, L. A.: Organic acids and high soil CO2 drive intense chemical weathering of Hawaiian basalts: Insights from reactive transport models, Geochim. Cosmochim. Ac., 249, 173–198, https://doi.org/10.1016/j.gca.2019.01.027, 2019.
Porada, P., Lenton, T. M., Pohl, A., Weber, B., Mander, L., Donnadieu, Y., Beer, C., Poschl, U., and Kleidon, A.: High potential for weathering and climate effects of non-vascular vegetation in the Late Ordovician, Nat. Commun., 7, 12113, https://doi.org/10.1038/ncomms12113, 2016.
Porder, S.: How Plants Enhance Weathering and How Weathering is Important to Plants, Elements, 15, 241–246, https://doi.org/10.2138/gselements.15.4.241, 2019.
Porder, S. and Chadwick, O. A.: Climate and soil-age constraints on nutrient uplift and retention by plants, Ecology, 90, 623–636, https://doi.org/10.1890/07-1739.1, 2009.
Porder, S., Vitousek, P. M., Chadwick, O. A., Chamberlain, C. P., and Hilley, G. E.: Uplift, Erosion, and Phosphorus Limitation in Terrestrial Ecosystems, Ecosystems, 10, 159–171, https://doi.org/10.1007/s10021-006-9011-x, 2007.
Powers, J. S., Becklund, K. K., Gei, M. G., Iyengar, S. B., Meyer, R., O'Connell, C. S., Schilling, E. M., Smith, C. M., Waring, B. G., and Werden, L. K.: Nutrient addition effects on tropical dry forests: a mini-review from microbial to ecosystem scales, Front. Earth Sci., 3, 34 pp., https://doi.org/10.3389/feart.2015.00034, 2015.
Quirk, J., Andrews, M. Y., Leake, J. R., Banwart, S. A., and Beerling, D. J.: Ectomycorrhizal fungi and past high CO2 atmospheres enhance mineral weathering through increased below-ground carbon-energy fluxes, Biol. Lett., 10, 20140375, https://doi.org/10.1098/rsbl.2014.0375, 2014.
Rempe, D. M. and Dietrich, W. E.: Direct observations of rock moisture, a hidden component of the hydrologic cycle, P. Natl. Acad. Sci. USA, 115, 2664–2669, https://doi.org/10.1073/pnas.1800141115, 2018.
Riebe, C. S. and Granger, D. E.: Quantifying effects of deep and near-surface chemical erosion on cosmogenic nuclides in soils, saprolite, and sediment, Earth Surf. Proc. Land., 38, 523–533, https://doi.org/10.1002/esp.3339, 2013.
Riebe, C. S., Kirchner, J. W., Granger, D. E., and Finkel, R. C.: Strong tectonic and weak climatic control of long-term chemical weathering rates, Geology, 29, 511–514, 2001.
Rundel, P. W., Ehleringer, J., Mooney, H. A., and Gulmon, S. L.: Patterns of drought response in leaf-succulent shrubs of the coastal Atacama Desert in Northern Chile, Oecologia, 46, 196–200, https://doi.org/10.1007/BF00540126, 1980.
Schaller, J., Turner, B. L., Weissflog, A., Pino, D., Bielnicka, A. W., and Engelbrecht, B. M. J.: Silicon in tropical forests: large variation across soils and leaves suggests ecological significance, Biogeochemistry, 140, 161–174, https://doi.org/10.1007/s10533-018-0483-5, 2018a.
Schaller, M., Ehlers, T. A., Lang, K. A. H., Schmid, M., and Fuentes-Espoz, J. P.: Addressing the contribution of climate and vegetation cover on hillslope denudation, Chilean Coastal Cordillera (26∘–38∘ S), Earth. Planet. Sc. Lett., 489, 111–122, https://doi.org/10.1016/j.epsl.2018.02.026, 2018b.
Schuessler, J. A., Kämpf, H., Koch, U., and Alawi, M.: Earthquake impact on iron isotope signatures recorded in mineral spring water, J. Geophys. Res.-Sol. Ea., 121, 1–21, https://doi.org/10.1002/2016JB013408, 2016.
Schuessler, J. A., von Blanckenburg, F., Bouchez, J., Uhlig, D., and Hewawasam, T.: Nutrient cycling in a tropical montane rainforest under a supply-limited weathering regime traced by elemental mass balances and Mg stable isotopes, Chem. Geol., 497, 74–87, https://doi.org/10.1016/j.chemgeo.2018.08.024, 2018.
Schwartzman, D. W.: The Geobiology of Weathering: a 13th Hypothesis, available at: https://arxiv.org/pdf/1509.04234.pdf (last access: 14 October 2020), 2015.
Smeck, N. E., Runge, E., and Mackintosh, E.: Dynamics and genetic modeling of soil systems, in: Pedogenesis and soil taxonomy, edited by: Wilding, L. P., Elsevier, 51–81, 1983.
Smits, M. M., Bonneville, S., Benning, L. G., Banwart, S. A., and Leake, J. R.: Plant-driven weathering of apatite – the role of an ectomycorrhizal fungus, Geobiology, 10, 445–456, 2012.
Sohrt, J., Uhlig, D., Kaiser, K., von Blanckenburg, F., Siemens, J., Seeger, S., Frick, D. A., Krüger, J., Lang, F., and Weiler, M.: Phosphorus Fluxes in a Temperate Forested Watershed: Canopy Leaching, Runoff Sources, and In-Stream Transformation, Front. Forest. Glob. Change, 2, 85, https://doi.org/10.3389/ffgc.2019.00085, 2019.
Spohn, M. and Sierra, C. A.: How long do elements cycle in terrestrial ecosystems?, Biogeochemistry, 139, 69–83, https://doi.org/10.1007/s10533-018-0452-z, 2018.
Sprenger, M., Stumpp, C., Weiler, M., Aeschbach, W., Allen, S. T., Benettin, P., Dubbert, M., Hartmann, A., Hrachowitz, M., Kirchner, J. W., McDonnell, J. J., Orlowski, N., Penna, D., Pfahl, S., Rinderer, M., Rodriguez, N., Schmidt, M., and Werner, C.: The Demographics of Water: A Review of Water Ages in the Critical Zone, Rev. Geophys., 57, 800–834, https://doi.org/10.1029/2018rg000633, 2019.
Stock, S. C., Köster, M., Dippold, M. A., Nájera, F., Matus, F., Merino, C., Boy, J., Spielvogel, S., Gorbushina, A., and Kuzyakov, Y.: Environmental drivers and stoichiometric constraints on enzyme activities in soils from rhizosphere to continental scale, Geoderma, 337, 973–982, https://doi.org/10.1016/j.geoderma.2018.10.030, 2019.
Tessier, A., Campbell, P. G. C., and Bisson, M.: Sequential Extraction Procedure for the Speciation of Particulate Trace Metals, Anal. Chem., 51, 844–851, 1979.
Tielbörger, K., Bilton, M. C., Metz, J., Kigel, J., Holzapfel, C., Lebrija-Trejos, E., Konsens, I., Parag, H. A., and Sternberg, M.: Middle-Eastern plant communities tolerate 9 years of drought in a multi-site climate manipulation experiment, Nat. Commun., 5, 5102, https://doi.org/10.1038/ncomms6102, 2014.
Tiessen, H. and Moir, J. O.: Characterization of available P by sequential extraction, in: Soil sampling and methods of analysis, Lewis Publishers Boca Raton, FL, USA, 5–229, 1993.
Tipping, E., Woof, C., Rigg, E., Harrison, A., Ineson, P., Taylor, K., Benham, D., Poskitt, J., Rowland, A., and Bol, R.: Climatic influences on the leaching of dissolved organic matter from upland UK moorland soils, investigated by a field manipulation experiment, Environ. Int., 25, 83–95, https://doi.org/10.1016/s0160-4120(98)00098-1, 1999.
Uhlig, D. and von Blanckenburg, F.: How Slow Rock Weathering Balances Nutrient Loss During Fast Forest Floor Turnover in Montane, Temperate Forest Ecosystems, Front. Earth Sci., 7, 159, https://doi.org/10.3389/feart.2019.00159, 2019.
Uhlig, D., Schuessler, J. A., Bouchez, J., Dixon, J. L., and von Blanckenburg, F.: Quantifying nutrient uptake as driver of rock weathering in forest ecosystems by magnesium stable isotopes, Biogeosciences, 14, 3111–3128, https://doi.org/10.5194/bg-14-3111-2017, 2017.
Uhlig, D., Amelung, W., and von Blanckenburg, F.: Mineral nutrients sourced in deep regolith sustain long-term nutrition of mountainous temperate forest ecosystems, Global Biogeochem. Cy., 34, e2019GB006513, https://doi.org/10.1029/2019GB006513, 2020.
van der Heijden, M. G. A., Klironomos, J. N., Ursic, M., Moutoglis, P., Streitwolf-Engel, R., Boller, T., Wiemken, A., and Sanders, I. R.: Mycorrhizal fungal diversity determines plant biodiversity, ecosystem variability and productivity, Nature, 396, 69–72, https://doi.org/10.1038/23932, 1998.
van Dongen, R., Scherler, D., Wittmann, H., and von Blanckenburg, F.: Cosmogenic 10Be in river sediment: where grain size matters and why, Earth Surf. Dynam., 7, 393–410, https://doi.org/10.5194/esurf-7-393-2019, 2019.
van Schöll, L., Kuyper, T. W., Smits, M. M., Landeweert, R., Hoffland, E., and Breemen, N. v.: Rock-eating mycorrhizas: their role in plant nutrition and biogeochemical cycles, Plant Soil, 303, 35–47, https://doi.org/10.1007/s11104-007-9513-0, 2007.
Vitousek, P., Chadwick, O., Matson, P., Allison, S., Derry, L., Kettley, L., Luers, A., Mecking, E., Monastra, V., and Porder, S.: Erosion and the Rejuvenation of Weathering-derived Nutrient Supply in an Old Tropical Landscape, Ecosystems, 6, 762–772, https://doi.org/10.1007/s10021-003-0199-8, 2003.
Vitousek, P. M.: Nutrient Cycling and Limitation: Hawai'i as a Model System, Princeton Environment Al Institute Series, 223 pp., 2004.
Vitousek, P. M. and Chadwick, O. A.: Pedogenic Thresholds and Soil Process Domains in Basalt-Derived Soils, Ecosystems, 16, 1379–1395, https://doi.org/10.1007/s10021-013-9690-z, 2013.
Vitousek, P. M. and Farrington, H.: Nutrient limitation and soil development: Experimental test of a biogeochemical theory, Biogeochemistry, 37, 63–75, https://doi.org/10.1023/a:1005757218475, 1997.
Vitousek, P. M. and Reiners, W. A.: Ecosystem Succession and Nutrient Retention: A Hypothesis, Bioscience, 25, 376–381, https://doi.org/10.2307/1297148, 1975.
Vitousek, P. M., Hedin, L. O., Matson, P. A., Fownes, J. H., and Neff, J.: Within-System Element Cycles, Input-Output Budgets, and Nutrient Limitation, in: Successes, Limitations, and Frontiers in Ecosystem Science, Springer, New York, 432–451, https://doi.org/10.1007/978-1-4612-1724-4_18, 1998.
Vitousek, P. M., Porder, S., Houlton, B. Z., and Chadwick, O. A.: Terrestrial phosphorus limitation: mechanisms, implications, and nitrogen–phosphorus interactions, Ecol. Appl., 20, 5–15, https://doi.org/10.1890/08-0127.1, 2010.
von Blanckenburg, F., Wittmann, H., and Schuessler, J. A.: HELGES: Helmholtz Laboratory for the Geochemistry of the Earth Surface, Journal of large-scale research facilities, 2, A84, https://doi.org/10.17815/jlsrf-2-141, 2016.
Werner, C., Schmid, M., Ehlers, T. A., Fuentes-Espoz, J. P., Steinkamp, J., Forrest, M., Liakka, J., Maldonado, A., and Hickler, T.: Effect of changing vegetation and precipitation on denudation – Part 1: Predicted vegetation composition and cover over the last 21 thousand years along the Coastal Cordillera of Chile, Earth Surf. Dynam., 6, 829–858, https://doi.org/10.5194/esurf-6-829-2018, 2018.
White, A. F. and Brantley, S. L.: The effect of time on the weathering of silicate minerals: why do weathering rates differ in the laboratory and field?, Chem. Geol., 202, 479–506, https://doi.org/10.1016/j.chemgeo.2003.03.001, 2003.
White, A. F., Blum, A. E., Schulz, M. S., Vivit, D. V., Stonestrom, D. A., Larsen, M., Murphy, S. F., and Eberl, D.: Chemical Weathering in a Tropical Watershed, Luquillo Mountains, Puerto Rico: I. Long-Term Versus Short-Term Weathering Fluxes, Geochim. Cosmochim. Ac., 62, 209–226, https://doi.org/10.1016/s0016-7037(97)00335-9, 1998.
Wilcke, W., Yasin, S., Abramowski, U., Valarezo, C., and Zech, W.: Nutrient storage and turnover in organic layers under tropical montane rain forest in Ecuador, Eur. J. Soil Sci., 53, 15–27, 2002.
Wilcke, W., Velescu, A., Leimer, S., Bigalke, M., Boy, J., and Valarezo, C.: Biological versus geochemical control and environmental change drivers of the base metal budgets of a tropical montane forest in Ecuador during 15 years, Biogeochemistry, 136, 167–189, https://doi.org/10.1007/s10533-017-0386-x, 2017.
Winnick, M. J. and Maher, K.: Relationships between CO2, thermodynamic limits on silicate weathering, and the strength of the silicate weathering feedback, Earth. Planet. Sc. Lett., 485, 111–120, https://doi.org/10.1016/j.epsl.2018.01.005, 2018.
- Abstract
- Introduction
- Conceptual perspectives
- Study area and previous results
- Methods
- Results
- Discussion
- Conclusions
- Appendix A: Calculation of fluxes and inventories in terrestrial ecosystem weathering indices (CDF and τ)
- Appendix B: Data presentation and statistical analyses
- Data availability
- Sample availability
- Author contributions
- Competing interests
- Acknowledgements
- Financial support
- Review statement
- References