the Creative Commons Attribution 4.0 License.
the Creative Commons Attribution 4.0 License.
 | 14 Oct 2020
Effects of 238U variability and physical transport on water column 234Th downward fluxes in the coastal upwelling system off Peru
Frédéric A. C. Le Moigne
Insa Rapp
Jan Lüdke
Beat Gasser
Marcus Dengler
Volker Liebetrau
Eric P. Achterberg
The eastern boundary region of the southeastern Pacific Ocean hosts one of the world's most dynamic and productive upwelling systems with an associated oxygen minimum zone (OMZ). The variability in downward export fluxes in this region, with strongly varying surface productivity, upwelling intensities and water column oxygen content, is however poorly understood. Thorium-234 (234Th) is a powerful tracer to study the dynamics of export fluxes of carbon and other elements, yet intense advection and diffusion in nearshore environments impact the assessment of depth-integrated 234Th fluxes when not properly evaluated. Here we use vessel-mounted acoustic Doppler current profiler (VmADCP) current velocities, satellite wind speed and in situ microstructure measurements to determine the magnitude of advective and diffusive fluxes over the entire 234Th flux budget at 25 stations from 11 to 16∘ S in the Peruvian OMZ. Contrary to findings along the GEOTRACES P16 eastern section, our results showed that weak surface wind speed during our cruises induced low upwelling rates and minimal upwelled 234Th fluxes, whereas vertical diffusive 234Th fluxes were important only at a few shallow shelf stations. Horizontal advective and diffusive 234Th fluxes were negligible because of small alongshore 234Th gradients. Our data indicated a poor correlation between seawater 238U activity and salinity. Assuming a linear relationship between the two would lead to significant underestimations of the total 234Th flux by up to 40 % in our study. Proper evaluation of both physical transport and variability in 238U activity is thus crucial in coastal 234Th flux studies. Finally, we showed large temporal variations on 234Th residence times across the Peruvian upwelling zone and cautioned future carbon export studies to take these temporal variabilities into consideration while evaluating carbon export efficiency.
- Article
(4971 KB) - Full-text XML
-
Supplement
(488 KB) - BibTeX
- EndNote


Isotopes of thorium (Th) are widely used as tracers for particle cycling in the oceans (Waples et al., 2006). In particular, 234Th has been extensively used to trace particle dynamics and export fluxes in the upper ocean and to quantify the marine budgets of important macro- and micronutrients such as carbon (C), nitrogen (N), phosphorus (P) and iron (Fe) (e.g., Bhat et al., 1968; Buesseler et al., 1992; Coale and Bruland, 1987; Lee et al., 1998; Le Moigne et al., 2013; Cochran and Masqué, 2003; Van Der Loeff et al., 2006; Black et al., 2019). 234Th has a relatively short half-life ( d) that allows studies of biological and physical processes occurring on timescales of days to weeks. Unlike its radioactive parent uranium-238 (238U, Ga) that is soluble in seawater, 234Th is highly particle reactive with a particle–water partition coefficient of 103 to 108 (Santschi et al., 2006, and references therein) and is thus strongly scavenged by particles (Bhat et al., 1968). Generally, a deficit of 234Th relative to 238U is observed in the surface ocean and reflects net removal of 234Th due to particle sinking, whereas secular equilibrium between 234Th and 238U is observed for intermediate and deep waters. Integrating this surface 234Th deficit with depth yields the sinking flux of 234Th and, if elemental : 234Th ratios are known, the sinking flux of elements such as C, N, P, Si and trace metals (e.g., Bhat et al., 1968; Buesseler et al., 1998, 1992, 2006; Coale and Bruland, 1987; Weinstein and Moran, 2005; Owens et al., 2015; Black et al., 2019; Puigcorbé et al., 2020).
Various 234Th models have been put forward to study adsorption–desorption, aggregation and export, but single box models that assume negligible 234Th fluxes due to physical transport are commonly used to calculate oceanic 234Th-derived particle fluxes (see detailed review by Savoye et al., 2006). This assumption is typically appropriate in open-ocean settings where 234Th fluxes due to advection and diffusion are small relative to the downward fluxes of 234Th associated with particle sinking. However, in upwelling regions such as the equatorial Pacific and coastal systems, advective and diffusive 234Th fluxes may become increasingly important (e.g., Bacon et al., 1996; Buesseler et al., 1998, 1995; Dunne and Murray, 1999). For example, in the equatorial Pacific, strong upwelling post El Niño could account for ∼50 % of the total 234Th fluxes (Bacon et al., 1996; Buesseler et al., 1995). Ignoring the upwelling term could thus lead to an underestimation of 234Th fluxes by a factor of 2. Conversely, horizontal diffusion carrying recently upwelled, 234Th-replete waters has been shown to balance the upwelled 234Th fluxes in the central equatorial Pacific (Dunne and Murray, 1999). To the contrary, advective and diffusive 234Th fluxes were minimal off the Crozet Islands in the Southern Ocean due to limited horizontal 234Th gradients, long residence time of water masses, and low upwelling rates and diffusivities (Morris et al., 2007).
The dynamic nature of coastal processes requires that physical terms be included in 234Th flux calculation whenever possible. Accurate measurements of current velocities and diffusivities are however challenging, and thus direct observations of the effects of physical processes on 234Th distributions in coastal regions are scarce. Limited studies have incorporated advection and diffusion in the nearshore zones of the Arabian Sea (Buesseler et al., 1998), Gulf of Maine (Gustafsson et al., 1998; Benitez-Nelson et al., 2000), South China Sea (Cai et al., 2008) and Peruvian oxygen minimum zone (OMZ) (Black et al., 2018). In the Arabian Sea, coastal upwelling during the southwest monsoon season could account for over 50 % of the total 234Th flux (Buesseler et al., 1998). Horizontal advection has been shown to be substantial in the inner Casco Bay of the Gulf of Maine (Gustafsson et al., 1998), whereas offshore advection and diffusion are only important in late summer (Benitez-Nelson et al., 2000). Therefore, the importance of physical processes on the 234Th flux estimate is highly dependent on the seasonal and spatial variability of the current velocities, diffusivities and 234Th gradients. In terms of the Peruvian OMZ, Black et al. (2018) showed that coastal upwelling accounts for >50 % of total 234Th fluxes at 12∘ S; however, how upwelling 234Th fluxes vary seasonally and spatially in this region is unclear.
Another uncertainty in 234Th flux calculations in such regions stems from variations on dissolved 238U activities. Generally speaking, U behaves conservatively under open-ocean oxic conditions and is linearly correlated with salinity (Chen et al., 1986; Ku et al., 1977; Owens et al., 2011). However, numerous studies have shown that such a correlation breaks down in various marine environments including the tropical Atlantic (Owens et al., 2011), Mediterranean Sea (Schmidt and Reyss, 1991) and Arabian Sea (Rengarajan et al., 2003). Although it is generally accepted that deviations from the linear 238U–salinity correlation will lead to differences in the final calculated 234Th fluxes, there is currently little knowledge on how significant these differences could be.
In this study, we report vertical profiles of 234Th and 238U along four transects perpendicular to the coastline of Peru (i.e., shelf–offshore transects). We evaluate the 238U–salinity correlation in low-oxygen waters and how deviations from this correlation impact final 234Th flux estimates. We also assess the spatial and temporal importance of advection and diffusion on 234Th flux estimates.
2.1 Seawater sampling and analysis
Seawater samples were collected at 25 stations along four shelf–offshore transects between 11 and 16∘ S in the Peruvian OMZ during two cruises, M136 and M138, on board the R/V Meteor (Fig. 1). Cruise M136 took place in austral autumn (11 April to 3 May 2017) along two main transects at 12 and 14∘ S (Dengler and Sommer, 2017). Two stations from M136 (stations 458 and 495) were reoccupied within a week (repeat stations 508 and 516, respectively) to evaluate the steady-state assumption in the 234Th flux calculation. The surface sample of the repeat station 508 (reoccupied 4.5 d after station 458) was missing so only results from repeat stations 495 and 516 (occupation interval 1.5 d) were compared and discussed in terms of the non-steady-state model (Sect. 3.3). 234Th sampling during cruise M138 was carried out in austral winter (1 June to 4 July 2017) and focused on four shelf–offshore transects at 11, 12, 14 and 16∘ S.
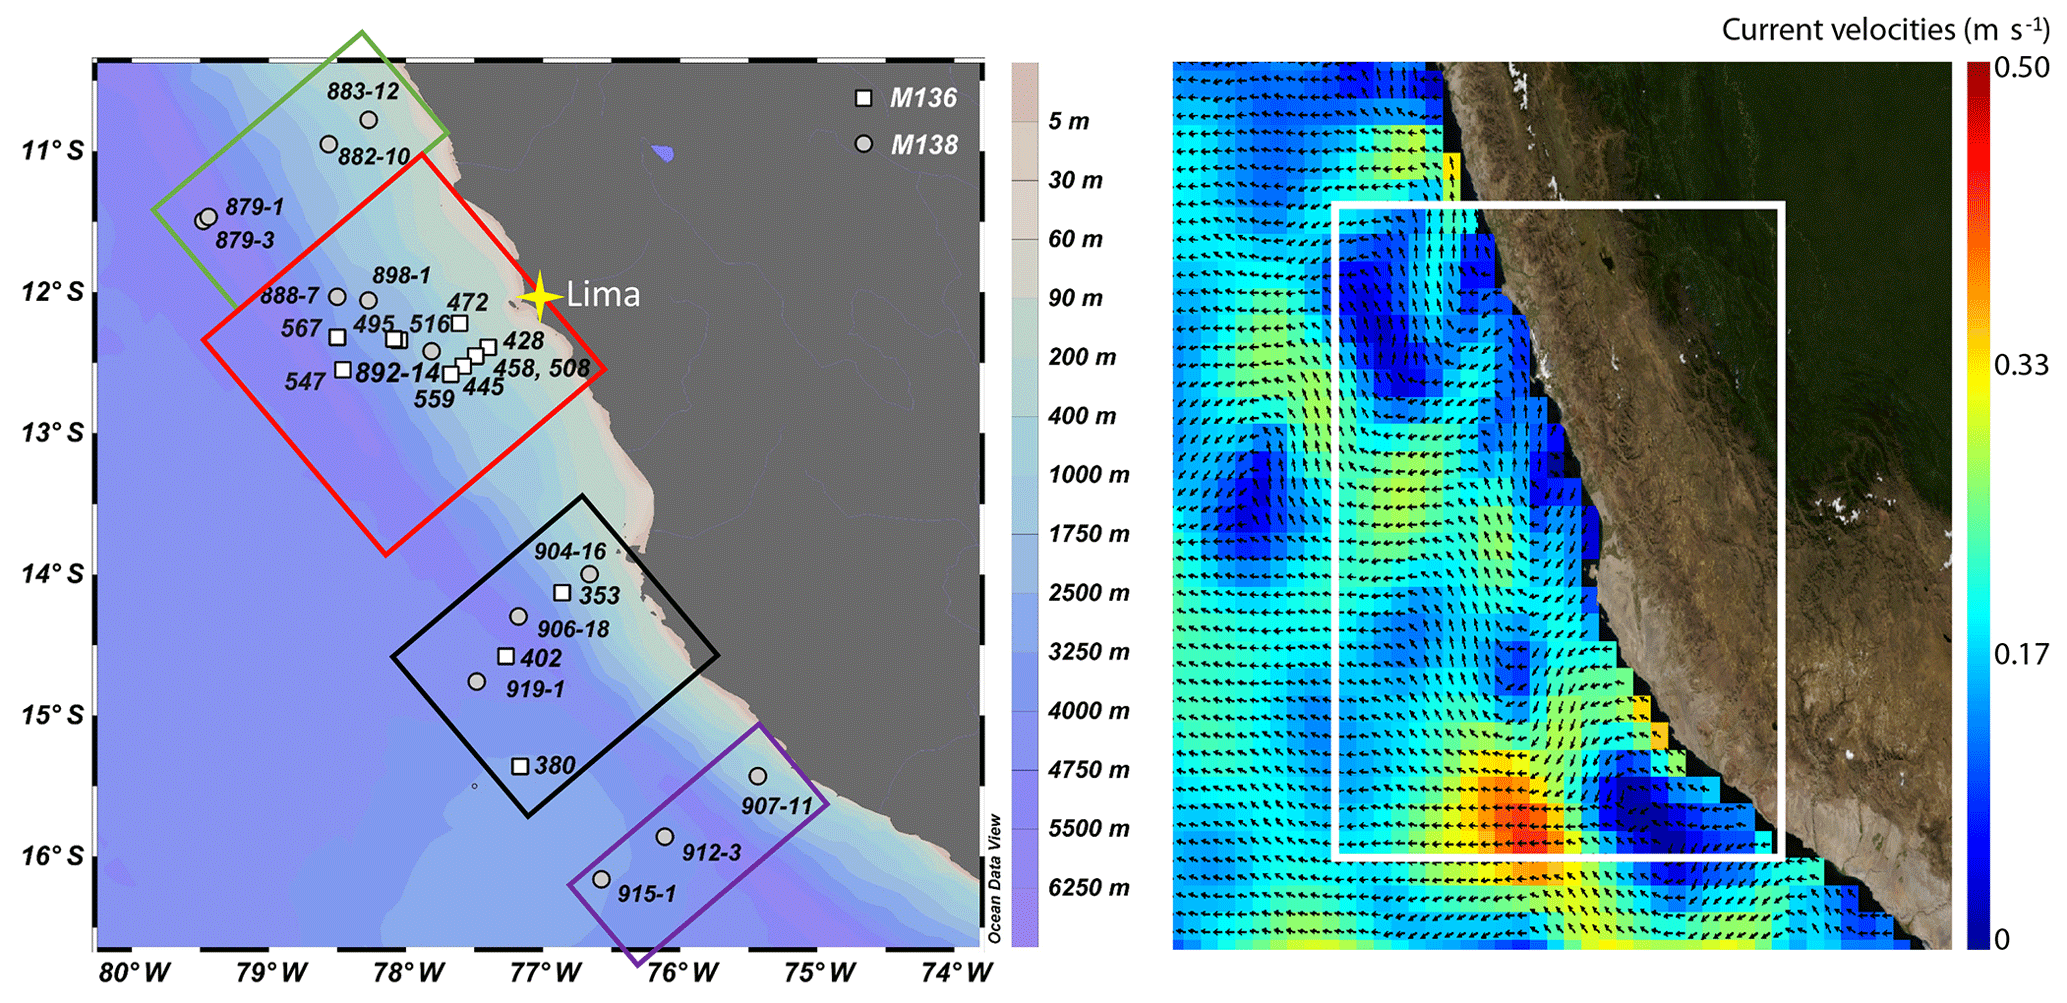
Figure 1Maps showing (a) locations of each station from M136 (white squares) and M138 (grey circles) and (b) monthly-averaged current field in the top 15 m from 16 April to 15 May 2017 derived from altimetry measurements (http://marine.copernicus.eu/, last access: 8 June 2020; product ID: MULTIOBS_GLO-PHY_REP_015_004). Color boxes in (a) schematically divide the four shelf–offshore transects. Map (a) was created with Ocean Data View (Schlitzer, 2014). The white box in (b) highlights our study area.
At each station, a stainless-steel rosette with Niskin bottles (Ocean Test Equipment®) was deployed for sampling of total 234Th in unfiltered seawater and dissolved 238U (0.2 µm pore size, AcroPak® polycarbonate membrane). High-vertical-resolution sampling was performed in the upper 200 m where most of the biological activity occurs; additional depths were sampled down to 600 m, or 50 m above the seafloor. Deep seawater at 1000, 1500, and 2000 m was sampled at three stations to determine the absolute β counting efficiency. Salinity, temperature, oxygen concentrations and fluorescence data (Table S1 in the Supplement) were derived from the sensors (Seabird Electronics® 9plus system) mounted on the CTD frame (Krahmann, 2018; Lüdke et al., 2020).
Sample collection and subsequent chemical processing and analysis for total 234Th followed protocols by Pike et al. (2005) and the SCOR working group RiO5 cookbook (https://cmer.whoi.edu/, last access: 27 March 2019). Briefly, a 230Th yield tracer (1 dpm) was added to each sample (4 L) before Th was extracted with MnO2 precipitates. Precipitates were filtered onto 25 mm quartz microfiber filters (Whatman® QMA, 2.2 µm nominal pore size) and dried overnight at 50 ∘C, after which they were counted at sea on a Risø® low-level beta GM multicounter until uncertainty was below 3 % and again 6 months later at the home laboratory for background 234Th activities. After the second beta counting, filters were digested in an 8 M HNO3 ∕ 10 % H2O2 solution (Carl Roth®, trace metal grade). A total of 10 dpm of 229Th was added to each sample at the beginning of digestion to achieve a 1 : 1 atom ratio between 229Th and 230Th. Digested samples were diluted in a 2.5 % HNO3 ∕ 0.01 % HF mixture, and 229Th ∕230Th ratios were measured using an inductively coupled plasma mass spectrometer (ICP-MS) (ThermoFisher® Element XR) to determine the chemistry yield and final 234Th activities. The average yield was calculated to be 97 % ± 6 % (n=247). For a subset of samples (marked in Table S1) whose analysis failed during initial ICP-MS measurement, anion chromatography (Bio-Rad® AG1x8, 100–200 mesh, Poly-Prep columns) was performed to remove Mn from the sample matrix before another ICP-MS analysis. This subset of samples also included three samples (marked in Table S1) whose initial ICP-MS measurement was successful to test whether anion chromatography affects final ICP-MS results. Identical 229Th ∕230Th ratios were measured for samples with and without column chromatography (see Table S1 footnotes for details).
Each 238U sample was acidified to pH∼1.6 at sea and transported home for analysis. Samples of dissolved 238U were diluted 20 times in 1 N HNO3 at the home laboratory and spiked with an appropriate amount of 236U spike to achieve 236U:238U ∼ 1 : 1. Ratios of 236U:238U were analyzed by ICP-MS (ThermoFisher Element XR), and activities of 238U were calculated using isotope dilution. Seawater certified reference materials (CRMs), CASS-6 and NASS-7, and the International Association for the Physical Sciences of the Oceans (IAPSO) standard seawater were analyzed routinely for uranium concentrations.
2.2 Flux calculation
Assuming a one-box model, the temporal change of 234Th activities is balanced by production from 238U, radioactive decay of 234Th, removal of 234Th onto sinking particles, and transport into or out of the box by advection and diffusion (Bhat et al., 1968; Savoye et al., 2006; and references therein):
where AU and ATh are respectively the activities of dissolved 238U and total 234Th, λ is the decay constant of 234Th, P is the net removal flux of 234Th, and V is the sum of advective and diffusive fluxes. It is recommended that the time interval between station occupations should be >2 weeks in order to adequately capture the temporal variability of the mean spatial gradients rather than small local changes (Resplandy et al., 2012). The solution of Eq. (1) (Savoye et al., 2006) is
where Δt is the time interval between repeat occupations of a station, and ATh1 and ATh2 are respectively total 234Th activities during the first and second occupation. At times when repeat sampling is not possible within an adequate cruise timeframe, steady-state conditions are generally assumed, i.e., . In this case, Eq. (1) is simplified into
The vertical flux of 234Th, P (dpm m−2 d−1), is integrated to the depth of interest. Earlier studies generally used arbitrarily fixed depths (e.g., the base of mixed layer or ML, and 100 m) for 234Th and particulate organic carbon (POC) flux estimates (e.g., Bacon et al., 1996; Buesseler et al., 1992). Recent studies emphasized the need to normalize POC flux to the depth of the euphotic zone (EZ), which separates the particle production layer in the surface from the flux attenuation layer below (Black et al., 2018; Buesseler and Boyd, 2009; Rosengard et al., 2015). In the open ocean, the depth of EZ is generally similar to ML depth. The PAR (photosynthetically active radiation) sensor was not available during both of our cruises, so it was not possible to identify the base of the EZ. For the purpose of this study, the slight difference of the exact depth chosen (ML vs. EZ) was of little relevance to the significance of physical processes and 238U variability. Due to sampling logistics, however, we did not sample at the base of the ML but 5–20 m below the ML. This depth corresponded closely to the EZ depth used in Black et al. (2018) in the same study area during austral spring 2013. For the purpose of comparison with earlier studies which reported 234Th fluxes at 100 m, we also calculated 234Th fluxes at 100 m in this study.
2.3 Quantification of the physical fluxes
The physical term V in Eq. (2) is expressed as follows:
where w is the vertical (i.e., upwelling) velocity (m s−1); u and v are respectively the zonal and meridional current velocities (m s−1); and Kx, Ky, and Kz represent eddy diffusivities (m2 s−1) in zonal, meridional and vertical directions, respectively. , and are vertical and horizontal 234Th gradients (dpm L−1 m−1); and , and are respectively the second derivative of 234Th (dpm L−1 m−2) on the zonal, meridional and vertical directions.
2.3.1 Estimation of upwelling velocities
In the Mauritanian and Peruvian coastal upwelling regions, there is strong evidence that upwelling velocities in the mixed layer derived from satellite scatterometer winds and Ekman divergence (Gill, 1982) agree well with those from helium isotope disequilibrium (Steinfeldt et al., 2015). The parameterization by Gill (1982) considers the baroclinic response of winds blowing parallel to a coastline in a two-layer ocean. Vertical velocity (w) at the interface yields
where τ is the wind stress (kg m−1 s−2) parallel to the coast line, ρ the water density (1023 kg m−3), f the Coriolis parameter (s−1) as a function of latitude, a the first baroclinic Rossby radius (km) and X the distance (km) to the coast.
Upwelling velocities were calculated at stations within 60 nautical miles of the coast, where upwelling is the most significant (Steinfeldt et al., 2015). We used a=15 km for all stations based on the results reported by Steinfeldt et al. (2015) for the same study area. The magnitude of monthly wind stress was estimated from the monthly wind velocities (Smith, 1988):
where ρair is the air density above the sea surface (1.225 kg m−3), CD the drag coefficient (10−3 for wind speed <6 m s−1) and U the wind speed.
Monthly wind speed (m s−1) fields from the MetOp-A ASCAT scatterometer sensor with a spatial resolution of 0.25∘ (Bentamy and Croize-Fillon, 2010) were retrieved from the Centre de Recherche et d'Exploitation Satellitaire (CERSAT), at IFREMER, Plouzané (France) (data version numbers L3-MWF-GLO-20170903175636-01.0 and L3-MWF-GLO-20170903194638-01.0). We assumed a linear decrease of w from the base of the mixed layer toward both the ocean surface and 240 m depth (bottom depth of our shallowest station). Upwelling rates at any depth between 0 and 240 m at individual stations could thus be determined once w was estimated. Following Rapp et al. (2019), an error of 50 % was assigned to estimated upwelling velocities to account for uncertainties associated with the spatial structure and temporal variability of the wind field, as well as the satellite wind product near the coast.
2.3.2 Estimation of upper-ocean velocities
During both cruises a phased-array vessel-mounted acoustic Doppler current profiler (VmADCP; 75 kHz Ocean Surveyor, Teledyne RD Instruments) continuously measured zonal and meridional velocities in the upper 700 m of the water column (Lüdke et al., 2020). Postprocessing of the velocity data included water track calibration and bottom editing. After calibration, the remaining uncertainty of hourly averages of horizontal velocities is smaller than 3 cm s−1 (e.g., Fischer et al., 2003). For the horizontal advective flux calculation (Eq. 3), velocities collected within a 10 km radian at inshore stations (stations 353, 428, 458, 475, 508, 904 and 907) and within a 50 km radian at offshore stations (Lüdke et al., 2020) were averaged. Data collected at the same positions within 5 d due to station repeats were also included in the velocity average. As representative for the near-surface flow, we extracted the velocity data from the top 30 m for M136 stations and top 50 m for M138 stations (defined as the “top layer” hereafter); these depths correspond to 5–20 m below the base of the ML during each cruise.
2.3.3 Estimation of vertical and horizontal eddy diffusivities
While the strength of ocean turbulence determines the magnitude of diapycnal or vertical eddy diffusivities, the intensity of meso- and submesoscale eddies determines the magnitude of lateral eddy diffusivities. During the R/V Meteor cruise (M136) and the follow-up cruise (M137) in the same region, the strength of upper-ocean turbulence was measured using shear probes mounted to a microstructure profiler. The loosely tethered profiler was optimized to sink at a rate of 0.55 m s−1 and equipped with three shear sensors; a fast-response temperature sensor; an acceleration sensor; two tilt sensors; and conductivity, temperature, depth sensors sampling with a lower response time. On transit between each CTD station 3 to 9 microstructure profiles were collected. Standard processing procedures were used to determine the dissipation rate of turbulent kinetic energy (ε) in the water column (see Schafstall et al., 2010, for a detailed description). Subsequently, turbulent vertical diffusivities Kz were determined from (Osborn, 1980), where N is stratification and Γ is the mixing efficiency for which a value of 0.2 was used following Gregg et al. (2018). Stratification (buoyancy frequency) was calculated using CTD data retrieved from microstructure profilers and following the gsw_Nsquared function from the Gibbs Sea Water library (McDougall et al., 2009; Roquet et al., 2015). A running mean of 10 dbar was applied to avoid including unstable events due to turbulent overturns. The 95 % confidence intervals for averaged Kz values were determined from Gaussian error propagation following Schafstall et al. (2010).
Altogether, 189 microstructure profiles were collected during M136 (Thomsen and Lüdke, 2018) and 258 profiles during the follow-up cruise M137 (unpublished data; 6–29 May 2017). An average turbulent vertical diffusivity profile was calculated from all inshore (<500 m water depth) profiles and another one from all offshore (>500 m water depth) profiles (Fig. S1 in the Supplement). Microstructure profiles collected during cruise M138 were not available, but there were very small variations amongst the cruise average inshore and offshore microstructure profiles from M136 and M137 despite the drastic change in the intensities of the poleward Peru–Chile Undercurrent (Lüdke et al., 2020). It thus appears appropriate to apply these average vertical diffusivities also to stations during M138.
Horizontal eddy diffusivity could not be determined from data collected during the cruises. Surface eddy diffusivities in the North Atlantic OMZ were estimated to be on the order of a few 1000 m2 s−1, which decrease exponentially with depth (Hahn et al., 2014). A similar magnitude of eddy diffusivities was estimated for the eastern equatorial South Pacific based on surface drifter data and satellite altimetry (Abernathey and Marshall, 2013; Zhurbas and Oh, 2004). We thus consider an eddy diffusivity of 1000 m2 s−1 as a good approximation in this study for the evaluation of horizontal diffusive 234Th fluxes.
2.4 Residence time of 234Th
The residence time (τTh) of total 234Th represents a combination of the time required for the partition of dissolved 234Th onto particulate matter and that for particle removal. In a one-box model, the residence time of an element of interest can be estimated by determining the standing stock of this element and the rates of elemental input to the ocean or the rate of elemental removal from seawater to sediments (Bewers and Yeats, 1977; Zimmerman, 1976):
For the case of 234Th, ATh(mean) is the averaged 234Th activities of the surface layer, Z is the depth of top layer and P is the removal flux of 234Th.
3.1 Profiles of dissolved 238U, total 234Th, oxygen and fluorescence
The vertical profiles of 238U and 234Th activities are shown in Fig. 2 and tabulated in Table S1. Data from station 508 were reported in Fig. 2 and Table S1 but excluded in the Discussion section, because the surface sample at 5 m from this station was missing, which prevents any flux calculation. Also tabulated in Table S1 are temperature, salinity, and concentrations of oxygen and fluorescence obtained from the CTD sensors. Uranium concentrations of CRMs and the IAPSO standard seawater are reported in Table S2.
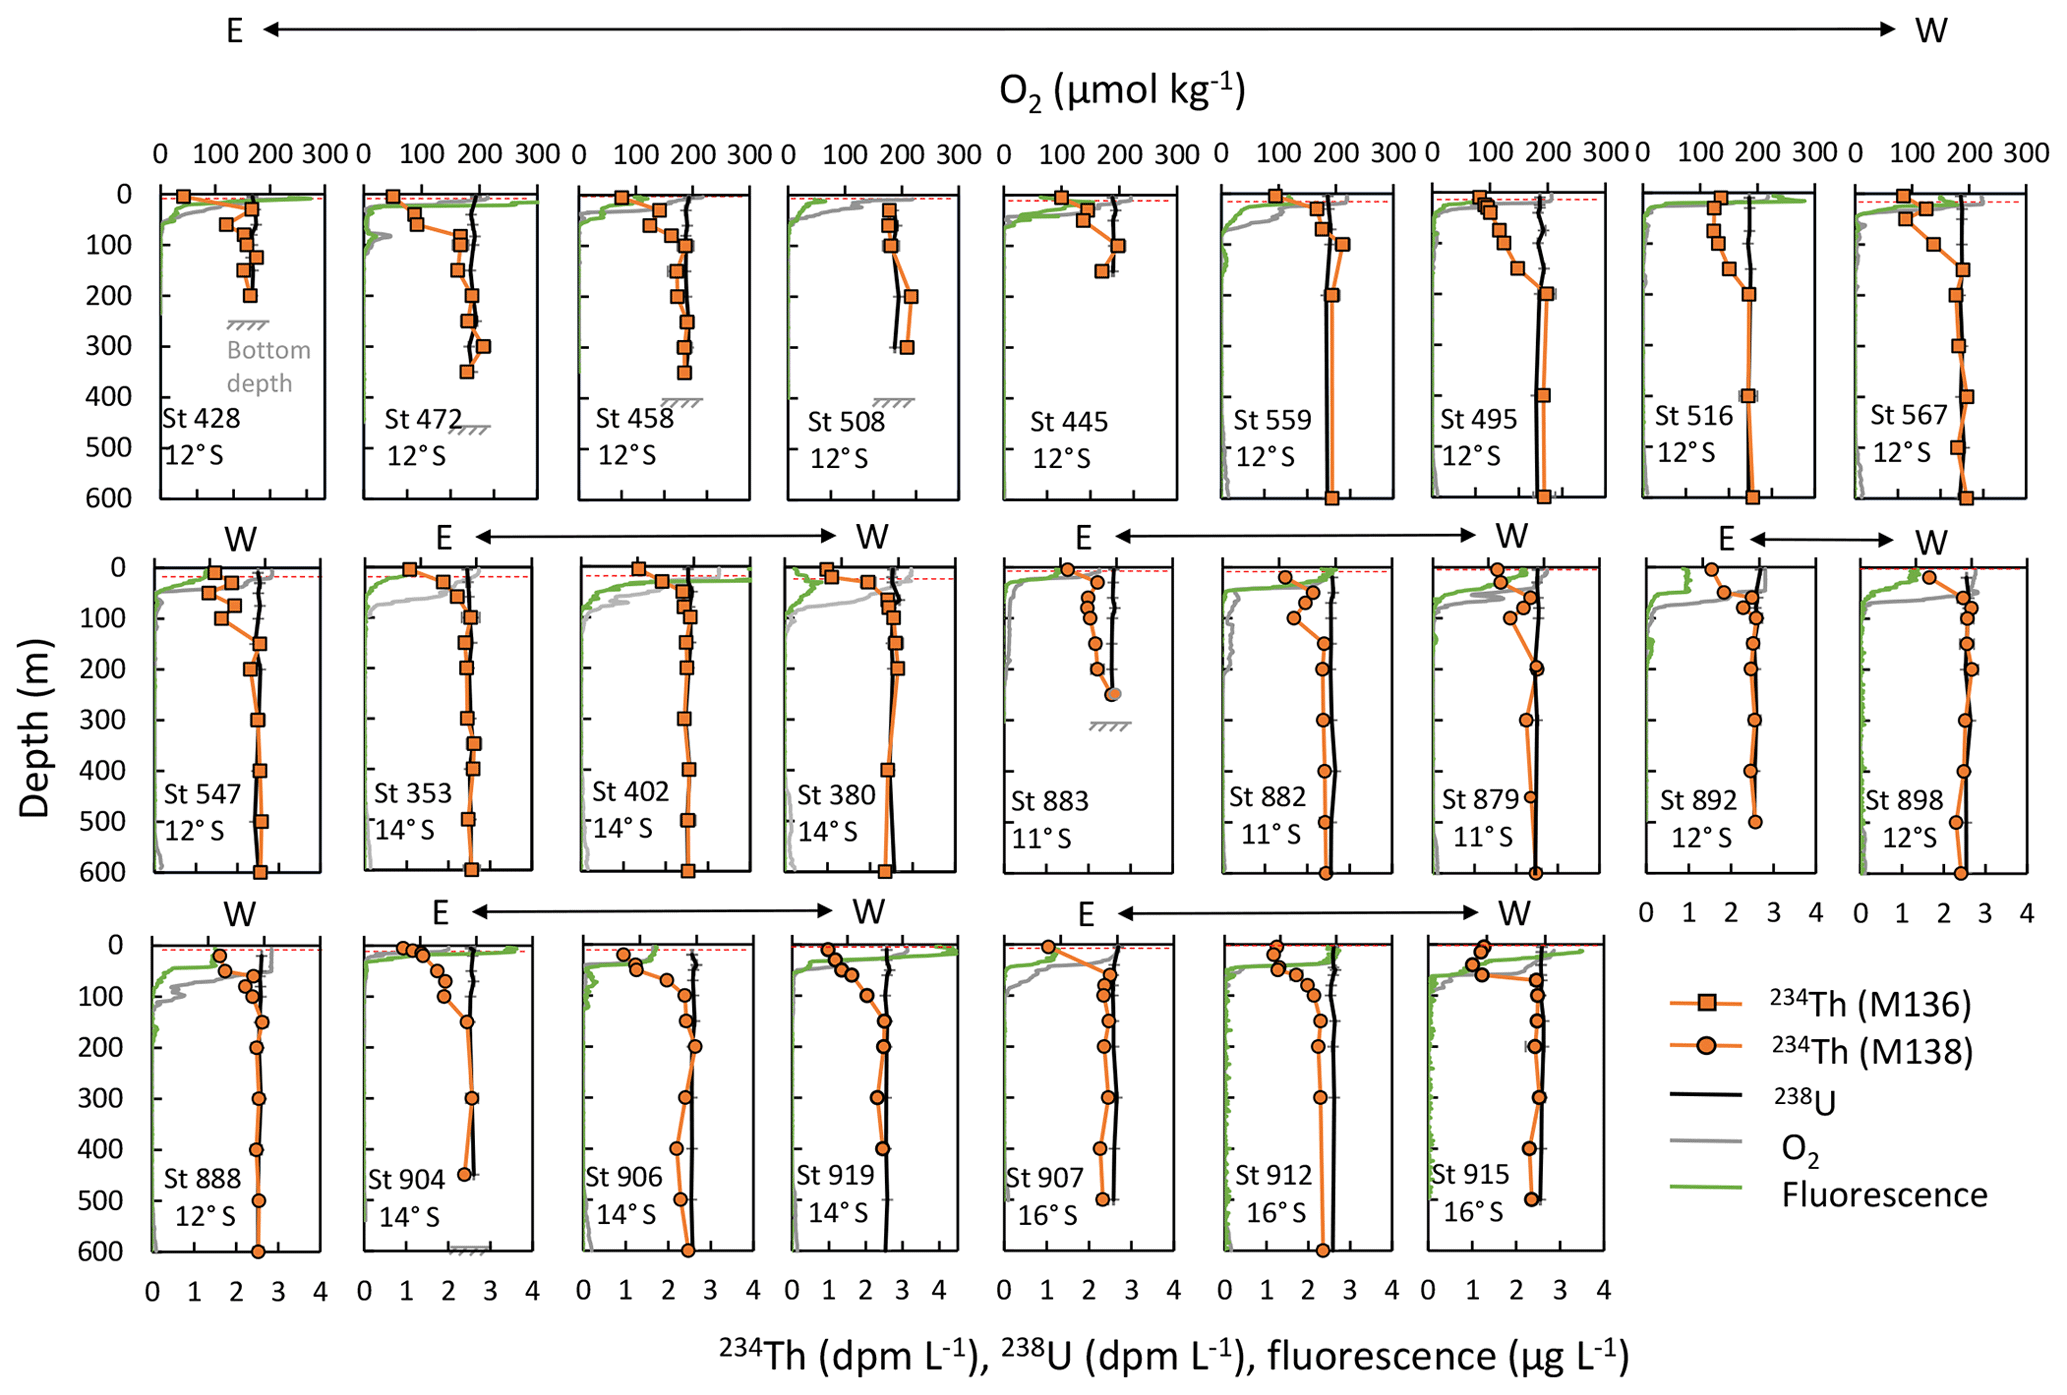
Figure 2Profiles of 238U (black) and 234Th (orange squares – M136; orange circles – M138) along with concentrations of oxygen (grey) and fluorescence (green). Profiles are organized by cruises, transects, and distance to shore from left to right and top to bottom, indicated by east (E) to west (W) arrows. Error bars for both 238U and 234Th are indicated. Dashed red lines indicate the depth of the mixed layer. The start of the oxygen-deficient zone is where oxygen diminishes. Bottom depths are indicated for stations whose bottom depths are shallower than 600 m.
Activities of 238U showed small to negligible variations with depth, averaging 2.54±0.05 dpm L−1 (or 3.28±0.07 ng g−1, 1 SD, n=247) at all stations. The vertical distributions of 238U did not appear to be affected by water column oxygen concentrations or the extent of surface fluorescence maxima (Fig. 2). Average U concentrations of both CASS-6 (2.77±0.04 ng g−1, 1 SD, n=5) and NASS-7 (2.86±0.05 ng g−1, 1 SD, n=5) measured in this study agreed well with certified values (2.86±0.42 ng g−1 and 2.81±0.16 ng g−1, respectively). Average 238U concentration measured in our IAPSO standard seawater (OSIL batch P156) (3.24±0.06 ng g−1, 1 SD, n=27) is slightly higher than that reported in Owens et al. (2011) (3.11±0.03 ng g−1, 1 SD, n=10, OSIL P149) and may reflect slight differences in U concentrations between different OSIL batches.
Total 234Th activities varied from 0.63 to 2.89 dpm L−1 (Fig. 2). All stations showed large 234Th deficits in surface waters with 234Th ∕238U ratios as low as 0.25 (Fig. 3). The extent of surface 234Th deficits did not vary as a function of depths of either mixed layer or the upper oxic–anoxic interface or as a function of the magnitude of surface fluorescence concentrations (Table 1, Fig. 2). 234Th at all stations generally reached equilibrium with 238U at depths between 30 and 250 m (Table 1). The equilibrium depths were slightly shallower toward the shelf at the 11, 12 and 16∘ S transects (Fig. 3). At station 912, deficits of 234Th extended beyond 600 m depth (Fig. 2). The following stations (stations 428, 879, 898, 906, 907, 915, 919) displayed a secondary 234Th deficit below the equilibrium depth, indicative of 234Th removal processes. A small 234Th excess at depth was only observed for station 559 at 100 m. Ratios of 234Th ∕238U for deep samples at 1000, 1500, and 2000 m varied between 0.95 and 1.02 (1.00±0.04, 1 SD, n=11), suggesting that 234Th was at equilibrium with 238U at these depths.
Table 1234Th fluxes due to production and decay, upwelling, and vertical diffusion below the mixed layer and at 100 m. Horizontal advective fluxes were not quantified at 100 m. Refer to text for details.
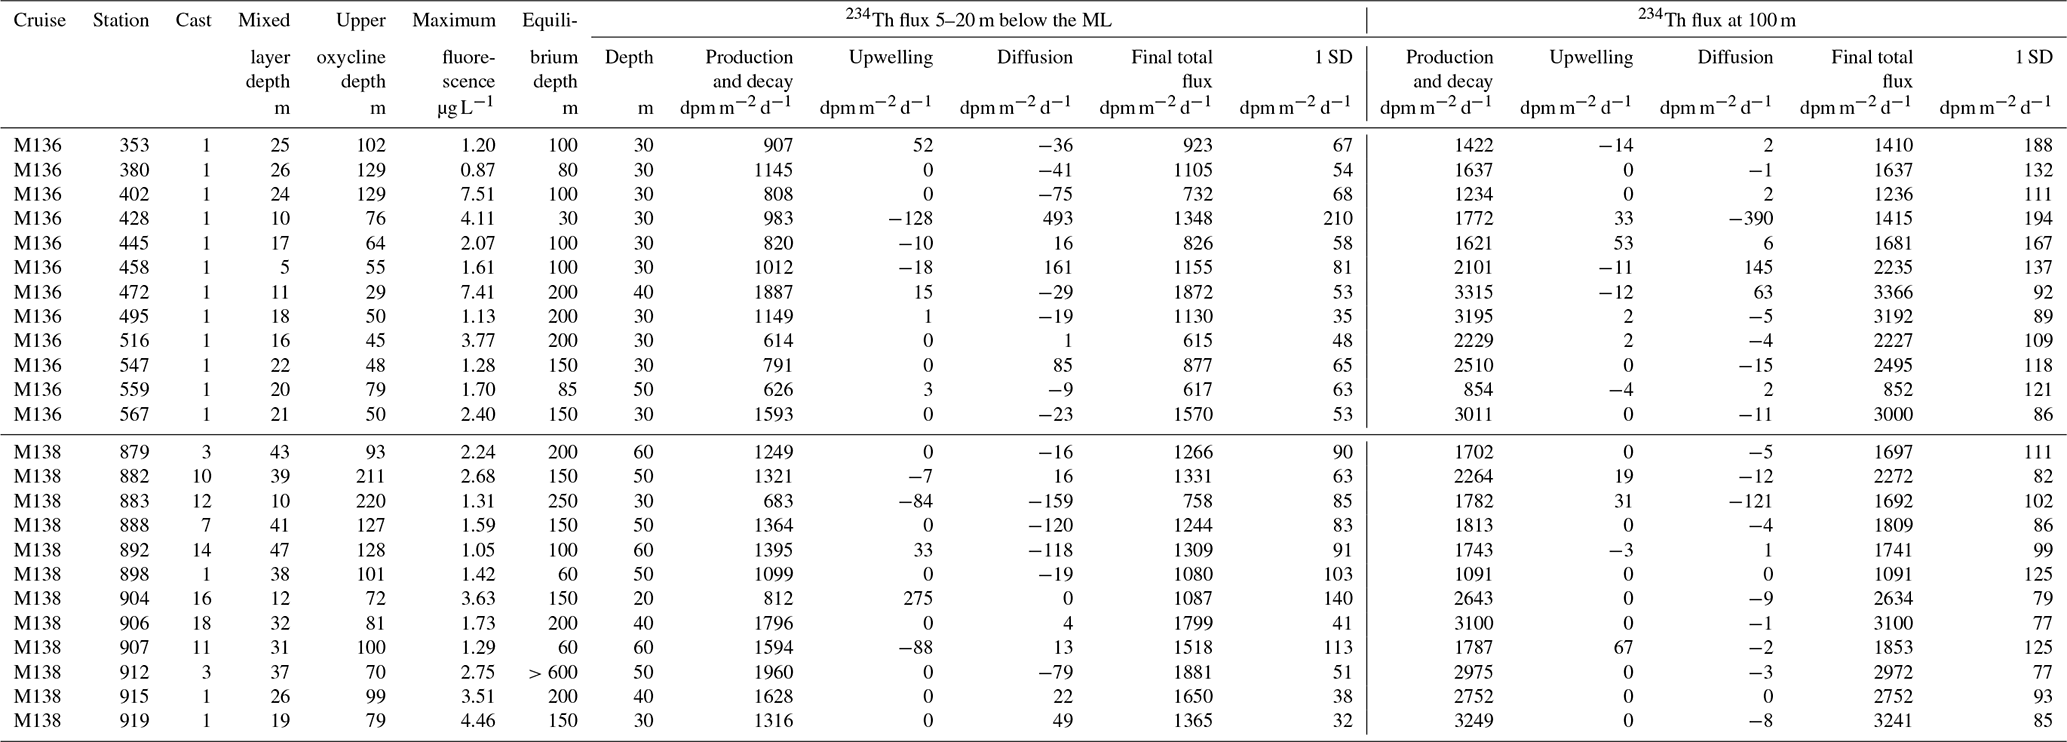
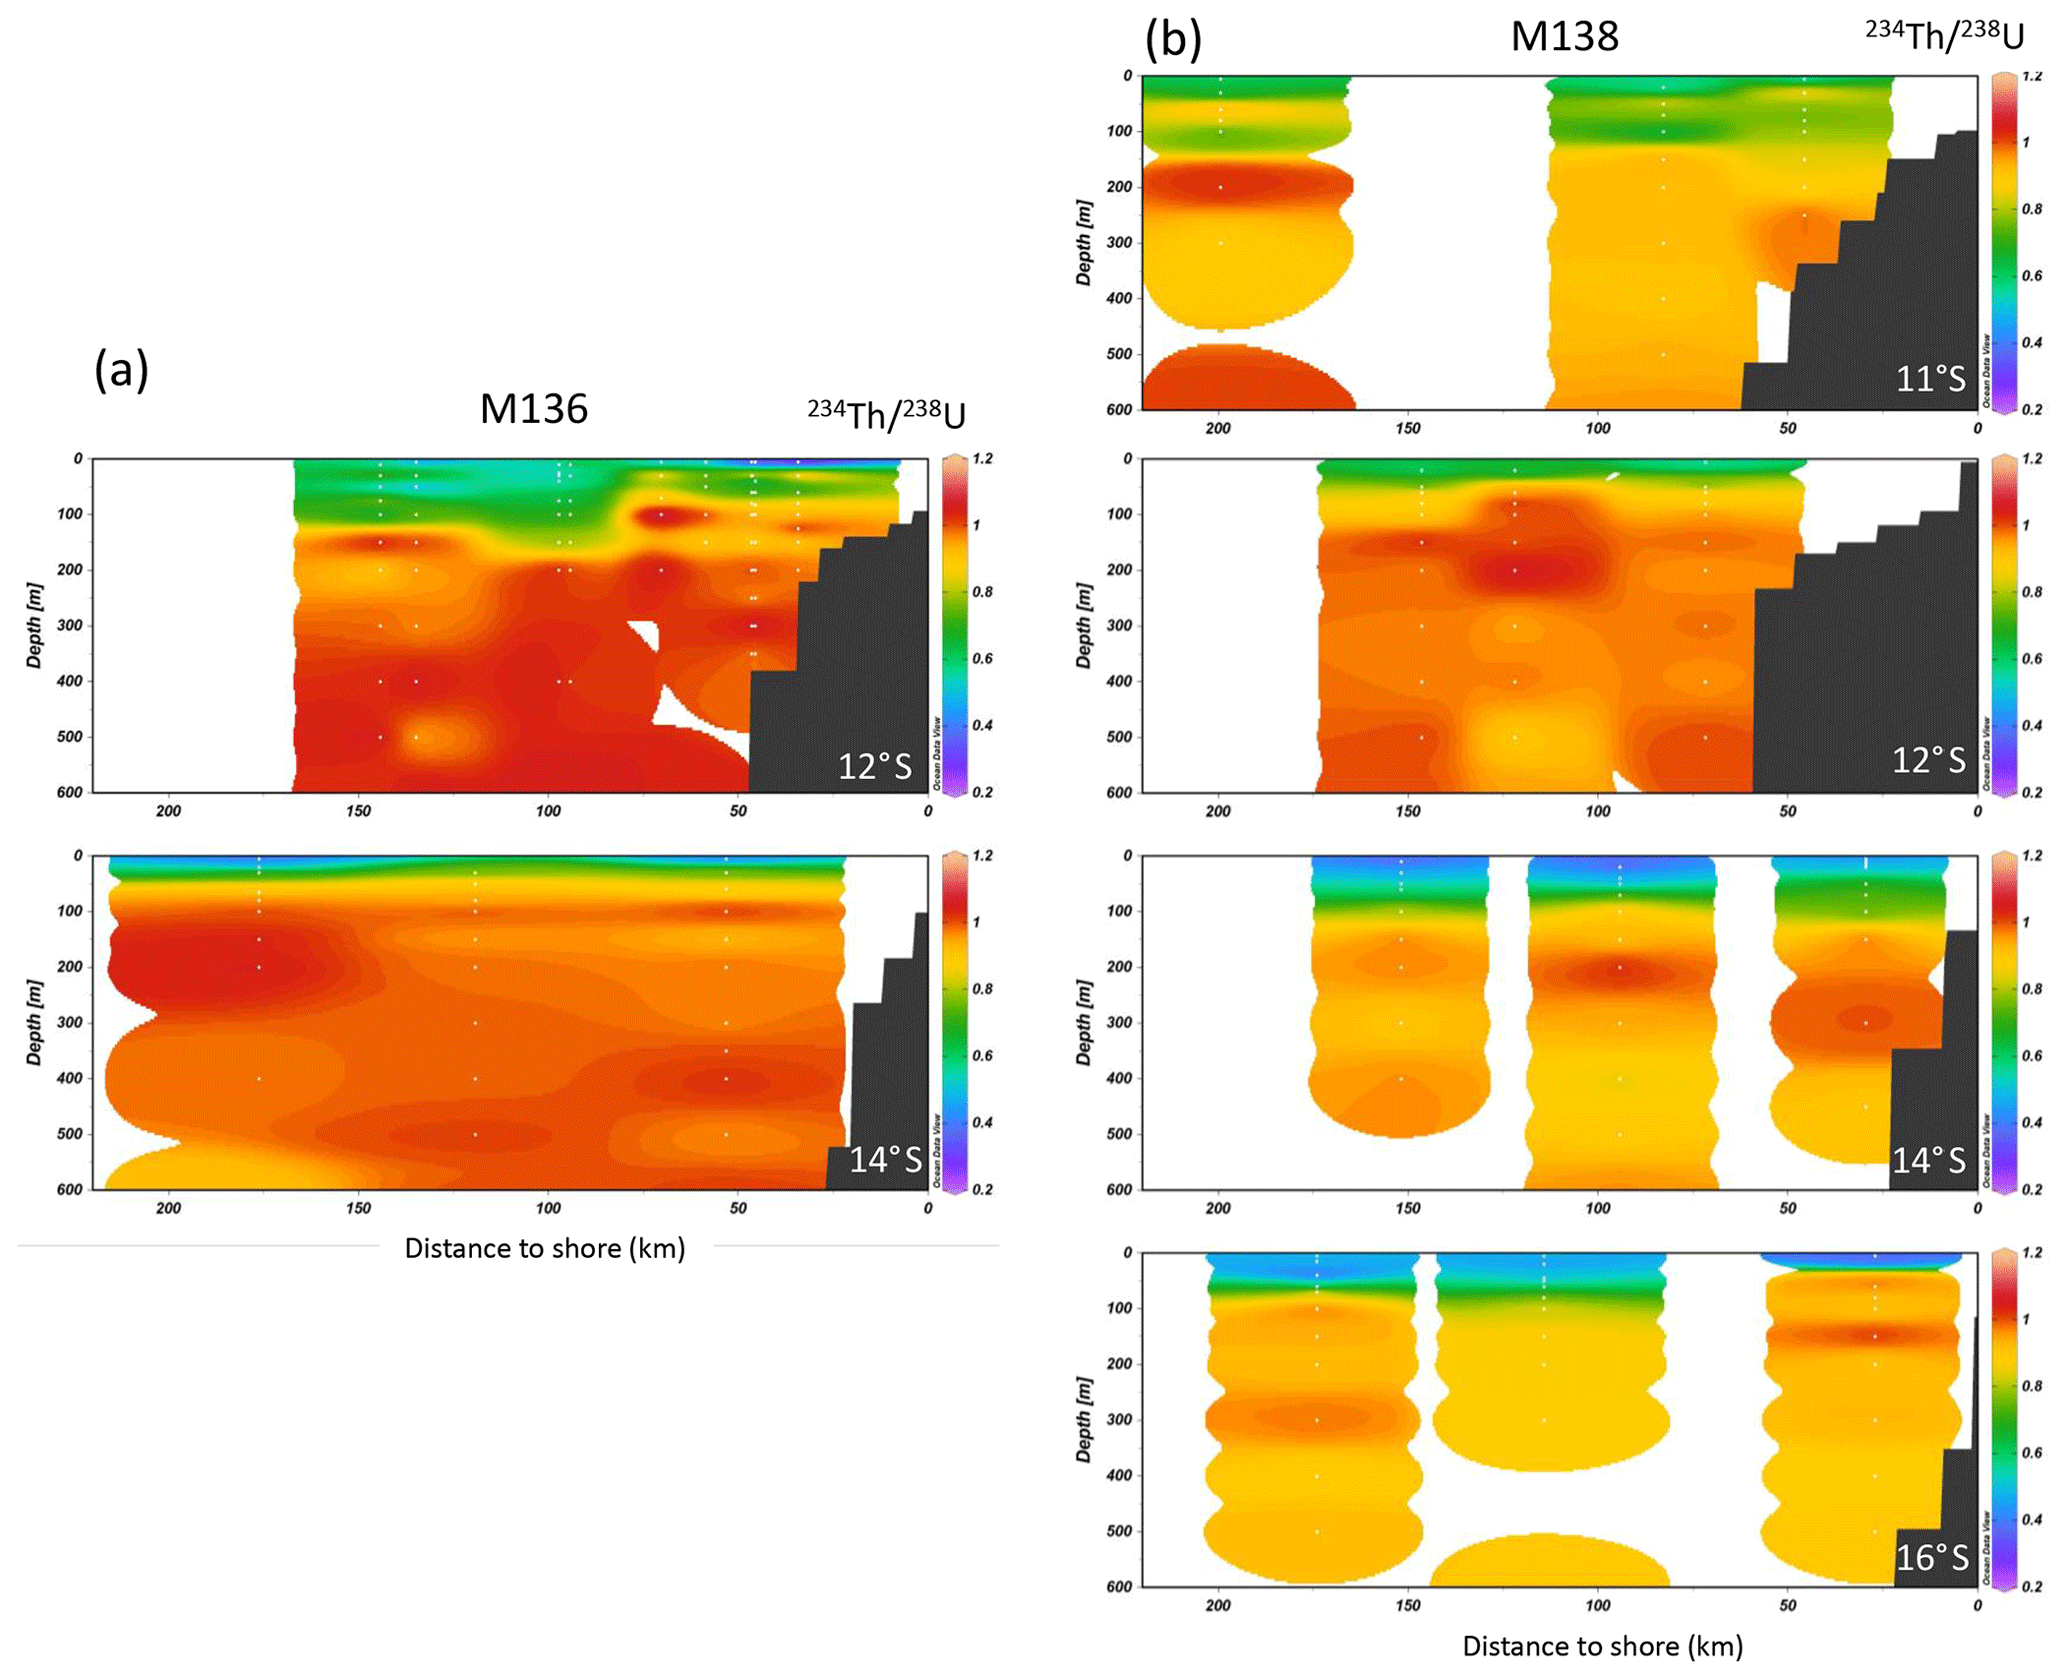
Figure 3Shelf–offshore distributions of 234Th ∕238U along the four studied transects, as shown in Fig. 1, for M136 (a) and M138 (b). White dots denote station location.
3.2 Vertical and horizontal 234Th gradients
Discrete vertical 234Th gradients in each profile (or the curvature of the profile) were estimated by the difference in 234Th activities and that in sampling depths. As such, vertical 234Th gradients varied greatly amongst stations and were larger at shallow depths ranging from 0.003 to 0.085 dpm L−1 m−1 (median 0.013 dpm L−1 m−1). Vertical 234Th gradients were essentially negligible at and below equilibrium depths.
While calculation of the vertical 234Th gradient is straightforward, the same is hardly true for the determination of horizontal 234Th gradient. Mean 234Th activities in the top layer (see Sect. 2.3.2 for depth definition) of the water column are highly variable amongst stations (Table 3, Fig. 4) and likely reflect variations occurring at small temporal and spatial scales in the Peruvian OMZ. Quantification of the horizontal 234Th gradient between individual station may thus not be adequate to evaluate large-scale advection and eddy diffusion across the study area. Therefore, alongshore 234Th gradients on a larger spatial scale (1∘ apart) were instead calculated by grouping stations into 1∘ by 1∘ grids and averaging 234Th activities of each grid for the top layer. Alongshore 234Th gradients in the top layer at nearshore stations for M138 are fairly consistent, ranging from to dpm L−1 m−1, with a slightly stronger gradient in the north compared to the south. The net difference in alongshore 234Th gradient is merely dpm L−1 m−1. A slightly smaller alongshore 234Th gradient of dpm L−1 m−1 was observed for M136. The magnitude of the net difference in alongshore 234Th gradient for M136 cannot be adequately quantified, due to smaller spatial sampling coverage. Judging on the similarity in the spatial distributions of mean 234Th between cruises M136 and M138 (Fig. 4), it is reasonable to assume that the net difference in alongshore 234Th gradient remained similar during both cruises.
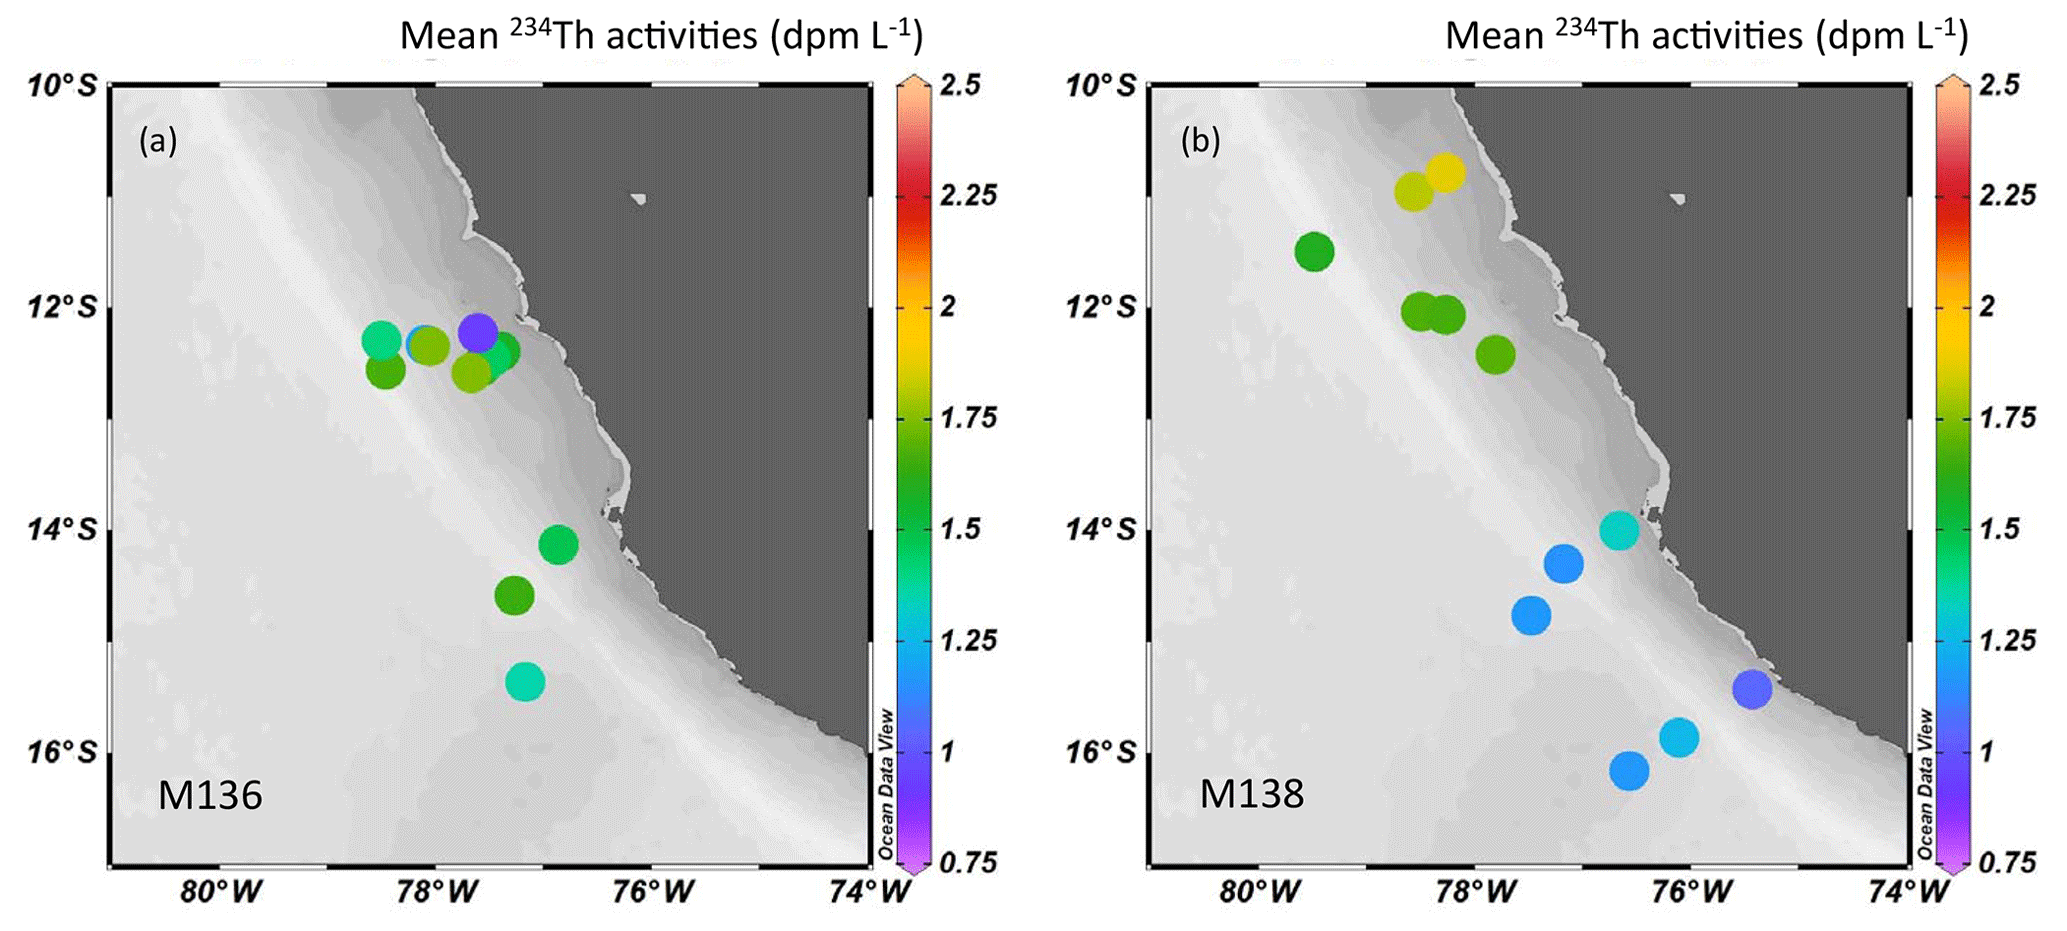
Figure 4Distributions of averaged 234Th activities during M136 (a, top 30 m) and M138 (b, top 50 m).
3.3 Steady-state vs. non-steady-state models
The relative importance of 234Th fluxes due to advection and diffusion was assessed here assuming steady-state conditions, which assume negligible temporal 234Th variability. But how valid is this assumption in the Peruvian upwelling zone? Profiles of temperature and oxygen at repeat stations 458 and 508 showed that a lightly cooler and oxygen-depleted water mass dominated at the upper 50 m at station 508 (Fig. 5). However, an assessment of the 234Th fluxes at these two stations was not possible as the surface sample from station 508 was missing. Repeat stations 495 and 516 show substantial temporal variations in 234Th activities at each sampled depth in the top 200 m, while temperature and salinity profiles confirmed that similar water masses were sampled during both occupations (Fig. 5). Particularly, the surface 234Th deficit was more intense at station 495 () compared to station 516 (). Correspondingly, 234Th fluxes decreased substantially from station 495 to station 516. At 100 m, the difference in 234Th fluxes between these two stations was ∼30 % (3200±90 dpm m−2 d−1 at station 495 and 2230±110 dpm m−2 d−1 at station 516). At 200 m where 234Th resumed equilibrium with 238U at both stations, the 234Th flux difference was ∼25 % (4510±220 dpm m−2 d−1 at station 495 and 3455±200 dpm m−2 d−1 at station 516). Taking the non-steady-state term in Eq. (1) into consideration (see details in Resplandy et al., 2012, and Savoye et al., 2006, for the derivation of flux formulation and error propagation) increased total 234Th at station 516 by 40 % to 3110±1870 dpm m−2 d−1 at 100 m (or 45 % to 5040±2290 dpm m−2 d−1 at 200 m), which is indistinguishable within error from fluxes at station 495. The large errors associated with the non-steady-state calculation due to the short duration between station occupations prevent a meaningful application of this model in the current study (also see discussion in Resplandy et al., 2012). As estimation of the physical fluxes is independent of the models chosen between steady and non-steady states, the following results and discussion sections regarding physical effects on the 234Th flux estimates are based on the steady-state model only.
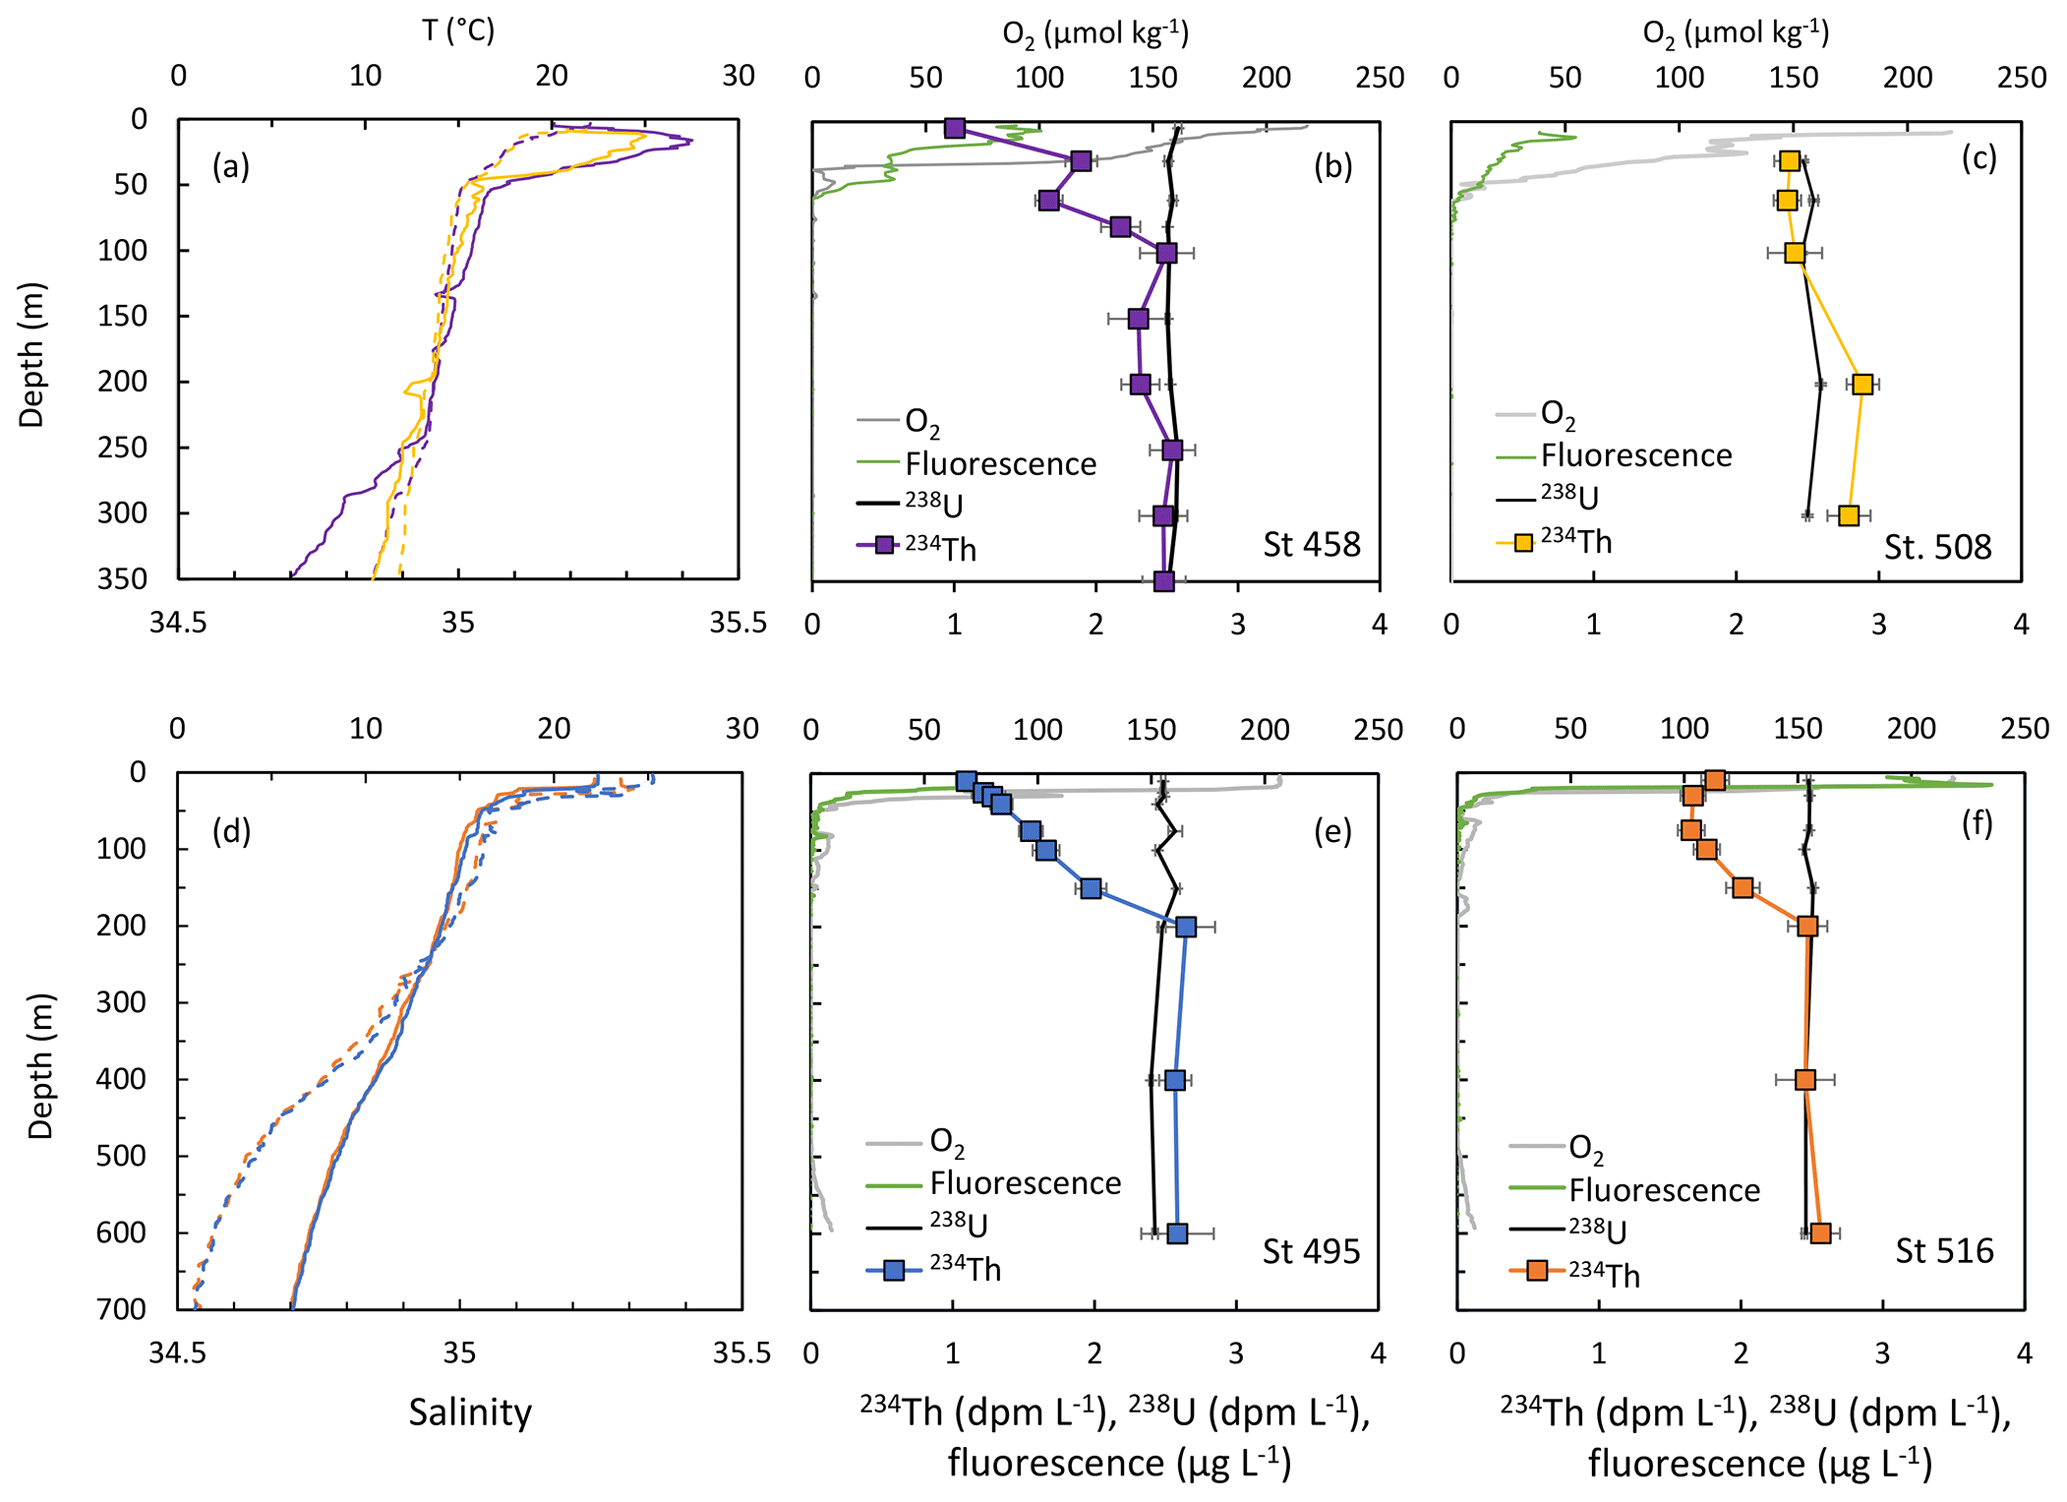
Figure 5Profiles of temperature (solid lines) and salinity (dashed lines) for repeated stations (a) 458 (purple) and 508 (yellow) and (d) 495 (blue) and 516 (orange). Panels (b) and (c) are respectively profiles for stations 458 and 508 of 238U (black), 234Th (color squares), and concentrations of oxygen (grey) and fluorescence (green). Panels (e) and (f) are respectively profiles for stations 495 and 516 of 238U (black), 234Th (color squares), and concentrations of oxygen (grey) and fluorescence (green).
3.4 Export fluxes of 234Th
Fluxes of 234Th due to radioactive production and decay (hereafter “production flux”), upwelling, and vertical diffusion were reported in Table 1 and Fig. 6 for both depths 5–20 m below the ML and at 100 m. The production fluxes of 234Th at 5–20 m below the ML ranged from 560 to 1880 dpm m−2 d−1, whereas at 100 m they were much higher at 850 to 3370 dpm m−2 d−1. There is no discernable trend regarding the production fluxes between the shelf and offshore stations, similar to those seen along the eastern GP16 transect (Black et al., 2018).
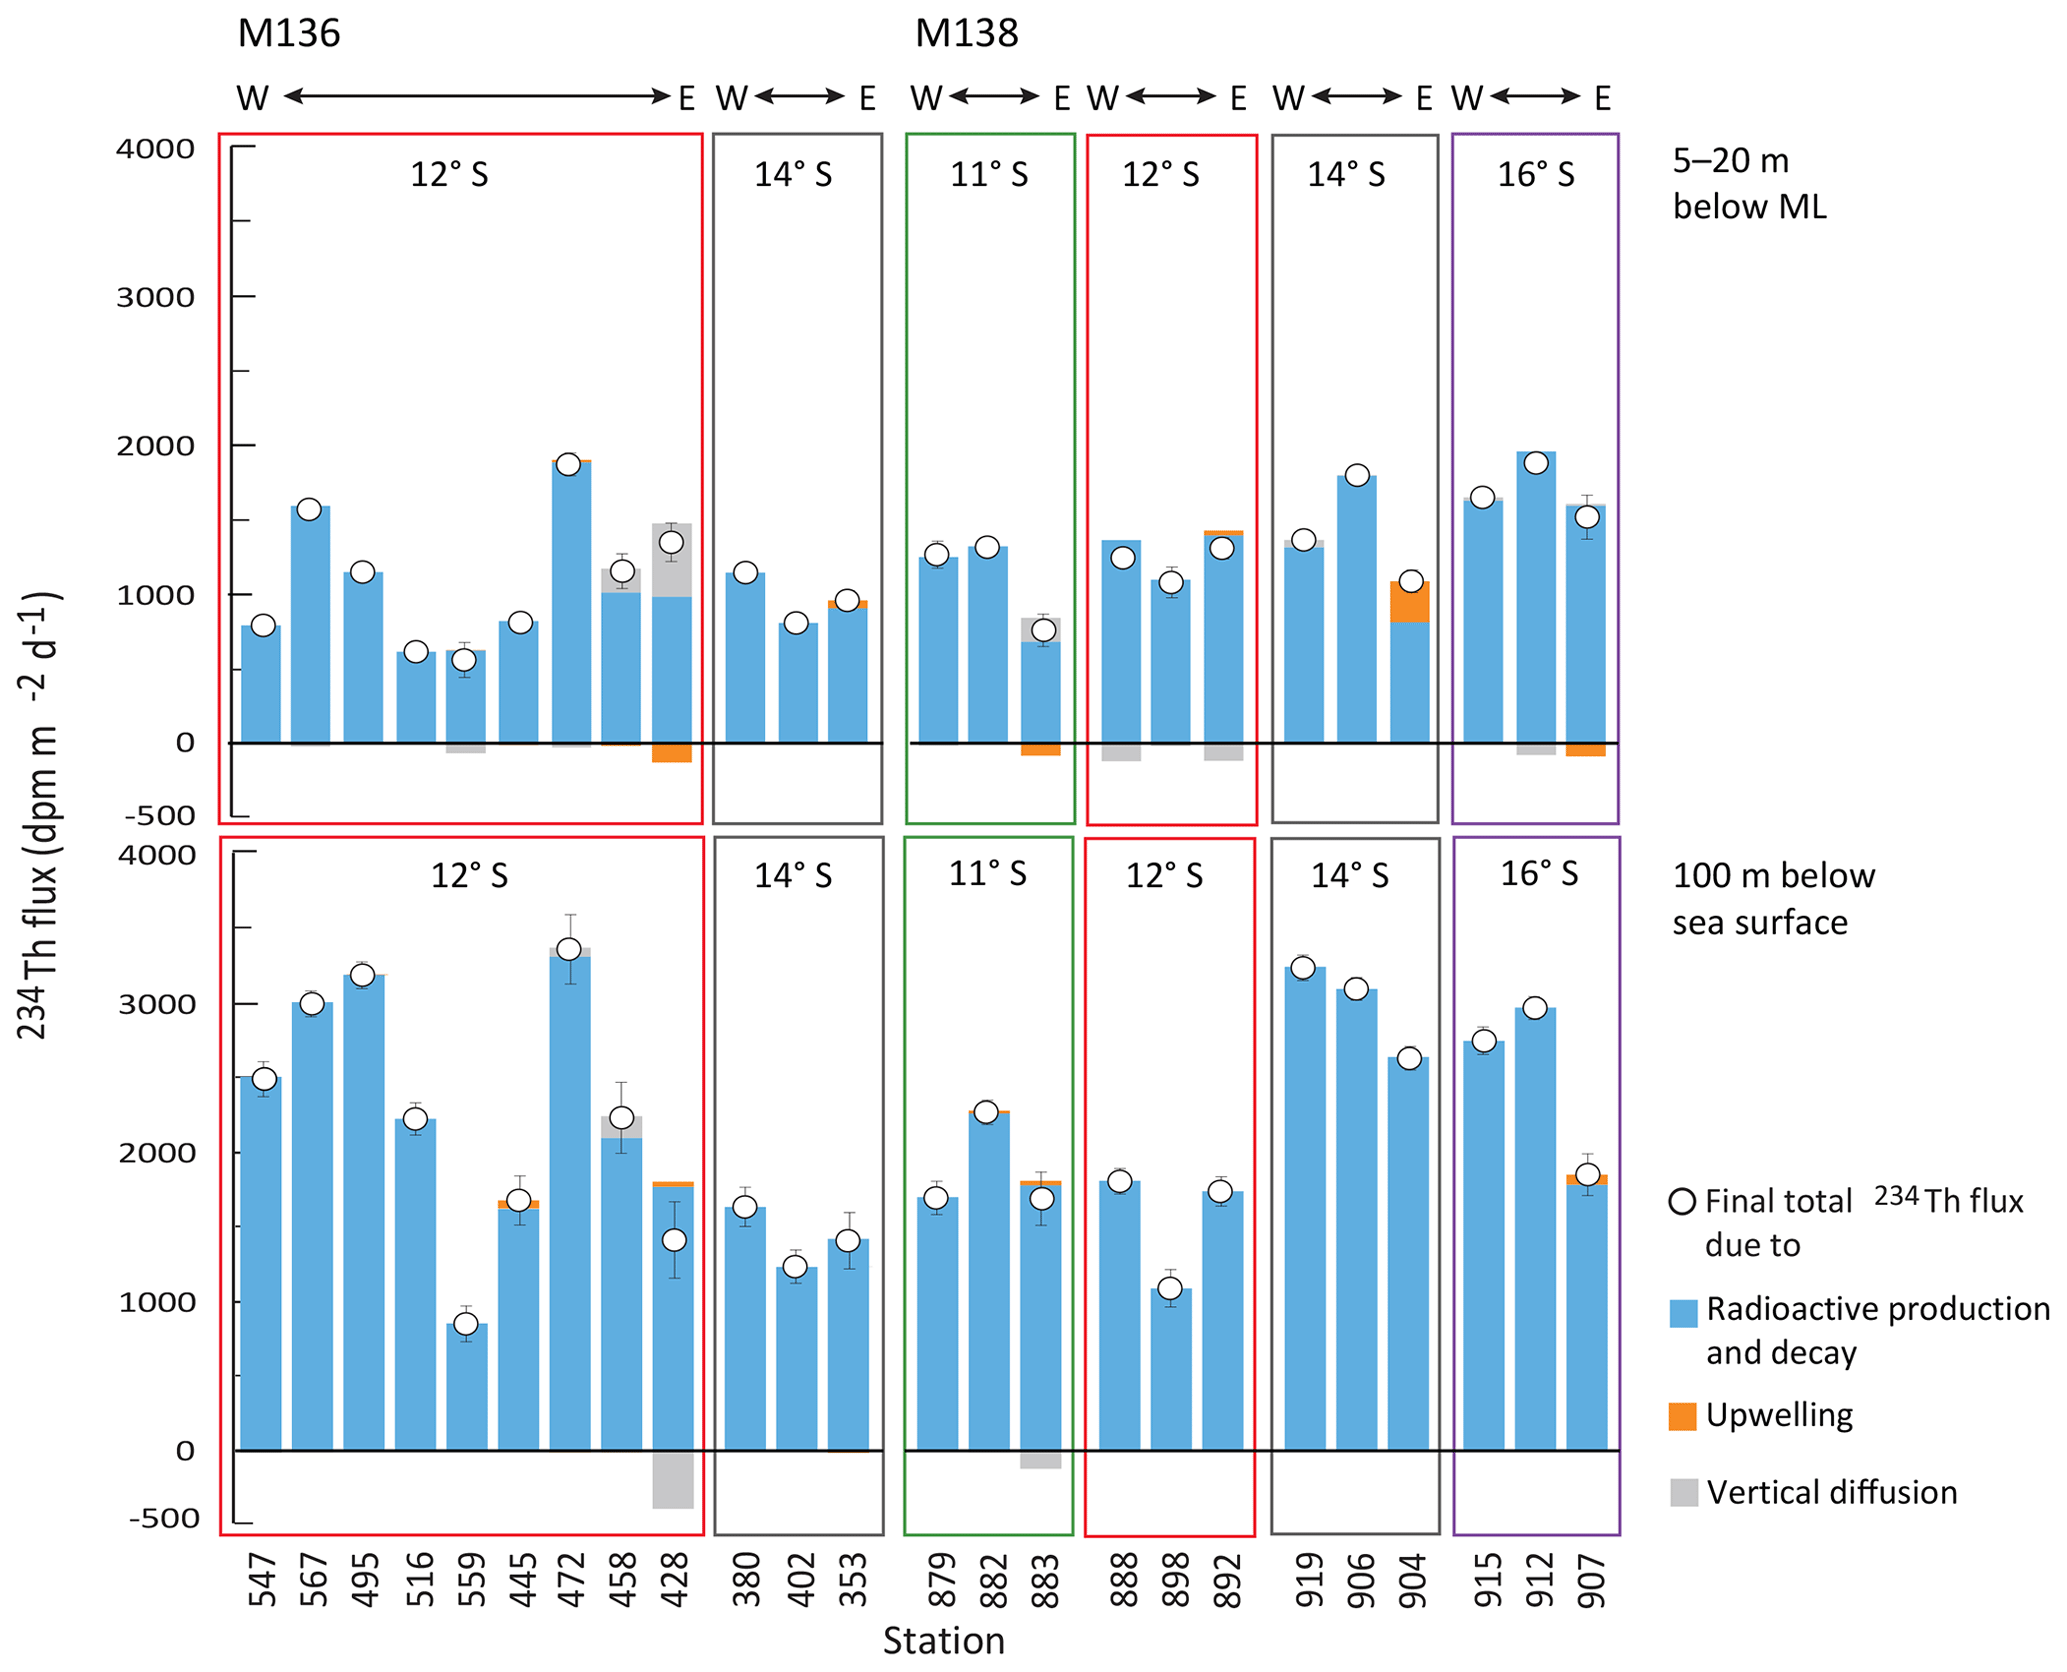
Figure 6Bar charts of 234Th fluxes due to production and decay (blue), upwelling (orange) and vertical diffusion (grey) for the depths at 5–20 m below the ML (top) and 100 m below sea surface (bottom). Color boxes corresponds to individual transects in Fig. 1. Within each transect, stations from west (offshore) to east (nearshore) are listed from left to right. Error bars (1 SE) are indicated.
Alongshore winds were unusually weak off Peru preceding and during our sampling campaign as a result of the 2017 coastal El Niño (Echevin et al., 2018; Lüdke et al., 2020; Peng et al., 2019), which resulted in nominal upwelling in the water column. At nearshore stations, upwelling rates at the base of the ML varied between and m s−1, whereas upwelling rates at offshore stations were on the order of 10−10 to 10−8 m s−1 and essentially negligible. As a result, upwelled 234Th fluxes at 5–20 m below the ML were only significant at stations closest to shore; these stations were 428 (130 dpm m−2 d−1), 883–12 (80 dpm m−2 d−1) and 904–16 (280 dpm m−2 d−1), whose upwelled 234Th fluxes accounted for 10 %, 11 % and 25 % of the total 234Th fluxes respectively (Fig. 6). Upwelled 234Th fluxes at the rest of the stations accounted for less than 2 % of the total 234Th fluxes (6 % at stations 353 and 907–11) and were insignificant. At 100 m, both vertical 234Th gradients and upwelling rates were significantly smaller compared to shallower depths. As a result, upwelled 234Th fluxes were less than 70 dpm m−2 d−1, or less than 4 % of total 234Th fluxes.
Similarly, vertical diffusivities, shown as running mean over 20 m in Fig. S1, were an order of magnitude higher at shallow stations ( m2 s−1; 1 SD, 27 to 100 m below sea surface) compared to those at deep stations ( m2 s−1; 1 SD; 34–100 m below sea surface). Within the upper 27 to 33 m layer at offshore deep stations, vertical diffusivities decreased exponentially by an order of magnitude within a few meters; below this depth, vertical diffusivities remained relatively stable (Fig. S1). This is not surprising as wind-driven turbulence is most significant at the ocean surface (Buckingham et al., 2019). In this study, the sampling depths immediately below the ML were generally 30 and 60 m. A few high-vertical-diffusivity values around 30 m at deep stations were not likely representative for the 30–60 m water column layer. We thus opted to only apply vertical diffusivities below 33 m at deep stations. Relative standard errors (RSEs) associated with diffusivity estimates varied from 35 % to 55 %. Vertical diffusive 234Th fluxes at 5–20 m below the ML, determined using both vertical diffusivity and vertical 234Th gradient, varied greatly amongst stations. At shallow stations 428, 458 and 883–12, vertical diffusive 234Th fluxes made up 37 % (490 dpm m−2 d−1), 14 % (160 dpm m−2 d−1) and 21 % (160 dpm m−2 d−1) of total 234Th fluxes, respectively (Fig. 6). At the rest of the stations, vertical diffusive 234Th fluxes appeared to be insignificant, ranging between 1 % and 10 % in the total 234Th flux budget. At 100 m, vertical diffusive 234Th fluxes at station 428, 458 and 883–12 remained high at 390, 150 and 120 dpm m−2 d−1, respectively, whereas those at the rest of the stations accounted for <2 % of the total 234Th flux.
Horizontal advective and diffusive 234Th fluxes were both very small. Average alongshore current velocities (Lüdke et al., 2020) for the top layer varied from 0.06 to 0.34 m s−1. At the periphery of a freshly formed anticyclonic eddy (station 915-1), alongshore current velocities could be as high as 0.53 m s−1. Taking the mean alongshore velocity of 0.2 m s−1 and the net difference in the alongshore 234Th gradient of dpm L−1 m−1, the resulting net horizontal advective 234Th flux at the top layer is ∼50 dpm m−2 d−1, a mere 3 %–9 % of the total 234Th fluxes.
Horizontal diffusive 234Th flux was estimated using an average eddy diffusivity of 1000 m2 s−1 (see methods Sect. 2.3.3) and the alongshore 234Th gradient. A maximum value of 10 dpm m−2 d−1 was calculated, which accounted for <1 % of total 234Th flux at all stations. Note that the horizontal advective and lateral diffusive fluxes presented here are a rough estimate and should only provide an idea of their order of magnitude. Due to the uncertainty inherent to the estimates, we refrain from adding these values to Table 1.
4.1 Lack of linear 238U–salinity correlation in the Peruvian OMZ
The water column profiles of 238U in the Peruvian OMZ (Fig. 2) are similar to those seen in the open ocean (see compilations in Owens et al., 2011, and Van Der Loeff et al., 2006, and references therein). It thus appears that water column suboxic/anoxic conditions alone are not sufficient to remove U, in contrast to sedimentary U studies underlying low-oxygen waters where soluble U(VI) diffuses downward into subsurface sediments and is reduced to insoluble U(IV) (Anderson et al., 1989; Böning et al., 2004; Scholz et al., 2011). Our inference is in accord with water column 238U studies in intense OMZs in the eastern tropical North Pacific (Nameroff et al., 2002) and the Arabian Sea (Rengarajan et al., 2003), where 238U concentrations remain constant over the entire upper water column studied.
Dissolved 238U and salinity across the entire Peruvian OMZ displayed poor linear correlation regardless of seawater oxygen concentrations (Fig. 7a–b). The general consensus is that U behaves conservatively in oxic seawater in the open ocean, and early observations have shown that 238U activities can be calculated from salinity based on a simple linear correlation between the two (e.g., Chen et al., 1986; Ku et al., 1977). Compilations in Van Der Loeff et al. (2006) and Owens et al. (2011) further demonstrated that the majority of uranium data points in the global seawater dataset follow a linear correlation with seawater salinity. The 238U-salinity formulations from either Chen et al. (1986) or Owens et al. (2011) are thus generally appropriate for open-ocean conditions and have been widely used in 234Th flux studies. However, this linear 238U–salinity correlation breaks down in the Peruvian OMZ. Furthermore, the measured 238U activities in this study correlated poorly with those calculated from salinity using the Owens formulation regardless of water column oxygen concentrations (Table S2, Fig. 7c), with the former significantly higher than the projected values and differences up to 10 %. This evidence suggested that non-conservative processes have introduced significant amount of dissolved U into the water column.
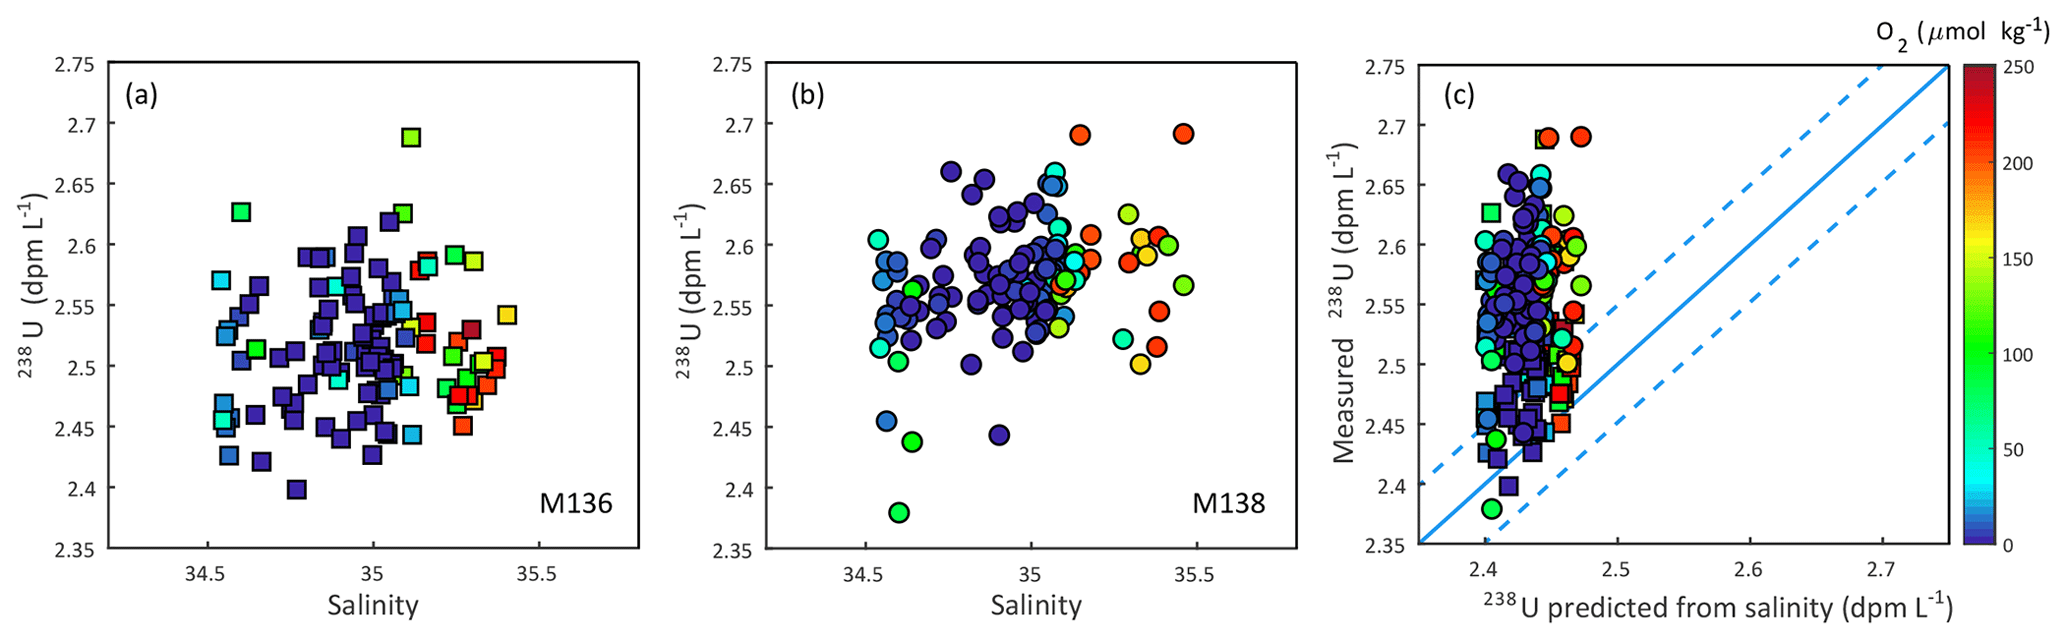
Figure 7Cross plots of measured 238U activities vs. salinity for M136 (a) and M138 (b), showing poor linear relationship between 238U and salinity. Panel (c) shows a direct comparison between measured and salinity-based 238U to further highlight the large difference between the two. The solid blue line indicates the 1 : 1 ratio between measured and projected 238U. Dashed blue lines indicate the ± errors reported in Owens et al. (2011). Error bars for measured 238U activities are smaller than symbols.
It is likely that this poor 238U–salinity correlation in the water column is not a unique feature off the coast of Peru. Poor correlations between dissolved 238U and salinity have been previously observed in open-ocean settings such as the Arabian Sea (Rengarajan et al., 2003) and the Pacific Ocean (Ku et al., 1977), as well as shelf–estuary systems such as the Amazon shelf (McKee et al., 1987; Swarzenski et al., 2004). It is possible that the narrow range of salinity within any single ocean basin precludes a meaningful 238U–salinity correlation (Ku et al., 1977; Owens et al., 2011). For the Peruvian shelf system, two possible scenarios may further explain the lack of linear 238U–salinity correlation in the water column. Firstly, authigenic U within the sediments may be remobilized under El Niño–Southern Oscillation (ENSO)-related oxygenation events. In reducing pore water, U reduction and removal from pore water is usually seen within the Fe reduction zone (Barnes and Cochran, 1990; Barnes and Cochran, 1991; Scholz et al., 2011). As such, a downward diffusive flux of U across the water–sediment interface is expected in reducing sedimentary environment. However, pore water and bottom water geochemistry measurements during two previous cruises (M77-1 and M77-2) along an 11∘ S transect off Peru showed large diffusive fluxes of U out of the Peruvian shelf sediments despite the fact that both Fe reduction and U reduction took place in the top centimeters of sediments (Scholz et al., 2011). It was suggested that a minute increase in bottom water oxygen concentration induced by El Niño events would be sufficient in shifting the U(VI)/U(IV) boundary by a few centimeters and remobilize authigenic U (Scholz et al., 2011). Preceding and during our sampling campaign, a coastal El Niño event, with coastal precipitation as strong as the 1997–1998 El Niño event, had developed rapidly and unexpectedly in January and disappeared by May 2017 during cruise M136 (Echevin et al., 2018; Garreaud, 2018; Peng et al., 2019). This strong coastal El Niño event could induce an oxygenation event large enough to remobilize authigenic U along the Peruvian shelf. Secondly, resuspension of bottom sediments and subsequent desorption of U from ferric oxyhydroxides could affect the 238U-salinity relationship, similar to that seen on the Amazon shelf at salinity above 10 (McKee et al., 1987) and in laboratory experiments (Barnes and Cochran, 1993). Fe reduction and release from the Peruvian shelf sediments (Noffke et al., 2012; Scholz et al., 2014) could release additional U to overlying waters. The magnitude of such, however, has not been quantified.
The consequence of the notable difference between measured 238U in this study and salinity-based 238U to 234Th flux according to Eq. (2) is neither linear nor straightforward, because the vertical gradients of both 238U and 234Th strongly affects the impacts of 238U variations on 234Th fluxes. In this study, 234Th fluxes at 100 m derived from salinity-based 238U lead to significant underestimation of 234Th fluxes by an average of 20 % and as high as 40 % (Table 2). These differences in 234Th fluxes will have direct consequences for 234Th-derived elemental fluxes such as C, N, P and trace metals. It is thus important to note that U concentrations in coastal systems are highly sensitive to bottom water oxygen concentrations and redox-related U addition, the variability of which is expected to intensify with future climate change (Shepherd et al., 2017). Relatively minor variations in dissolved 238U could account for substantial overestimation/underestimation of the depth-integrated 234Th fluxes. We thus encourage future 234Th flux studies in such environments to include seawater 238U analysis.
Table 2Comparison of 234Th fluxes at 100 m calculated with measured 238U activities and those with salinity-based 238U.

* For the purpose of evaluating flux difference due to uranium variability, we report here 234Th fluxes only due to radioactive production and decay.
4.2 Dynamic advective and diffusive 234Th fluxes
The significance of advection and diffusion in the total 234Th flux budget highly depends on the upwelling rate, current velocity, vertical diffusivity, and 234Th gradient on the horizontal and vertical directions. Our results demonstrated that physical processes off Peru during and after the 2017 coastal El Niño have very limited impact on the downward fluxes of 234Th (Fig. 6).
Our findings are in reasonable agreement with those from the GEOTRACES GP16 eastern section along 12∘ S from Peru to Tahiti, in which Black et al. (2018) quantified both horizontal and vertical advective 234Th fluxes. Horizontal advective fluxes for the upper 30 m water column estimated during GP16 were ∼180 dpm m−2 d−1 for all nearshore and offshore stations, similar in magnitude to those estimated in our study (∼50 dpm m−2 d−1). Upwelling fluxes along GP16 eastern section were suggested to account for 50 % to 80 % of total 234Th fluxes at the base of the euphotic zone (Black et al., 2018), a depth similar to or slightly deeper than ML depths in the current study where upwelling fluxes accounted for less than 25 % of total 234Th fluxes. Total 234Th fluxes along the GP16 eastern section, ranging from 4000 to 5000 dpm m−2 d−1 at the base of the euphotic zone, were much higher than those in our study (560 to 1900 dpm m−2 d−1 5–20 m below the ML). This difference could be related to the period of sampling (austral autumn and winter 2017 in our study vs. austral spring 2013 for the GP16 section). We note that the estimated vertical mixing rates based on 7Be isotope at the base of the euphotic zone along the GP16 section (Kadko, 2017) were at least an order of magnitude higher than the upwelling rates at the base of the ML at nearby stations in our study. This difference could stem from different methods used to estimate upwelling rates at different timescales and may also reflect the dynamic upwelling system off Peru in which upwelling rates vary greatly seasonally and interannually. During cruises M136 and M138, upwelling favorable easterly winds off Peru were weak, resulting in negligible coastal upwelling. Coastal upwelling in the same general area was also suggested to be negligible in austral summer 2013 during cruise M92 due to nominal surface wind stress (Thomsen et al., 2016). Results from studies conducted in the same year (October to December 2013, Kadko, 2017; December 2012, Steinfeldt et al., 2015; January 2013, Thomsen et al., 2016) indicate that seasonal upwelling rates vary drastically in the Peruvian upwelling zone. The seasonal dynamics of coastal upwelling off Peru are similar to those seen in the Arabian Sea, where large upwelled 234Th fluxes only occurred during the middle-to-late southwest monsoon at stations close to shore (Buesseler et al., 1998). Our findings lend further support to earlier studies that advection and diffusion are seasonally important for 234Th fluxes in regions with high upwelling velocities and diffusivities such as the equatorial Pacific (Bacon et al., 1996; Buesseler et al., 1995; Dunne and Murray, 1999) and coastal sites such as the Arabian Sea (Buesseler et al., 1998) and offshore Peru (Black et al., 2018; this study).
4.3 Residence time of 234Th in the Peruvian OMZ
The residence time calculated using Eq. (6) was based on a simplified one-dimension (1D) model of Zimmerman (1976). This 1D steady-state model is obviously an oversimplification of a multi-dimensional process; it however provides a good first-order estimate for understanding the highly dynamic nature of the 234Th residence time. It also provides a reasonable value that can be directly compared to values estimated in earlier 234Th flux studies that did not consider the physical processes. Furthermore, we showed in the Discussion (Sect. 4.2) that physical processes, namely upwelling and vertical diffusion, are only important at a few shelf stations. We thus consider this simple 1D model robust in estimating the residence time of total 234Th.
In this study, residence time of total 234Th in the top layer varied from 20 d at shallow stations to 95 d at deep stations (mean d, 1 SD, n=24; Table 3). These values were similar to those estimated within the California Current (Coale and Bruland, 1985) and the residence times of particulate organic carbon (POC) and nitrogen (PON) (Murray et al., 1989) but were much longer than predicted in nearshore shelf waters where residence times of total 234Th were on the order of a few days (Kaufman et al., 1981; Kim et al., 1999; and references therein). The longer residence times estimated in our study could reflect a combination of weak surface 234Th deficits (234Th=0.63 to 1.82 dpm L−1) (Fig. 3) and low export fluxes (800 to 2000 dpm m−2 d−1, Fig. 7). Nearshore seawater samples during GP16 (Black et al., 2018) featured similar surface 234Th deficits (234Th = 0.63 to 1.33 dpm L−1) but much higher downward 234Th fluxes (4000 to 5000 dpm m−2 d−1) as a result of strong upwelling, implying that residence times of total 234Th in the Peruvian OMZ during GP16 occupation would be 3–6 times shorter. Indeed, a quick reassessment of the GP16 data predicted a shorter residence time of total 234Th of 5–23 d within the euphotic zone of the coastal Peruvian OMZ.
Table 3Residence time of total 234Th in the top layers of Peruvian OMZ.
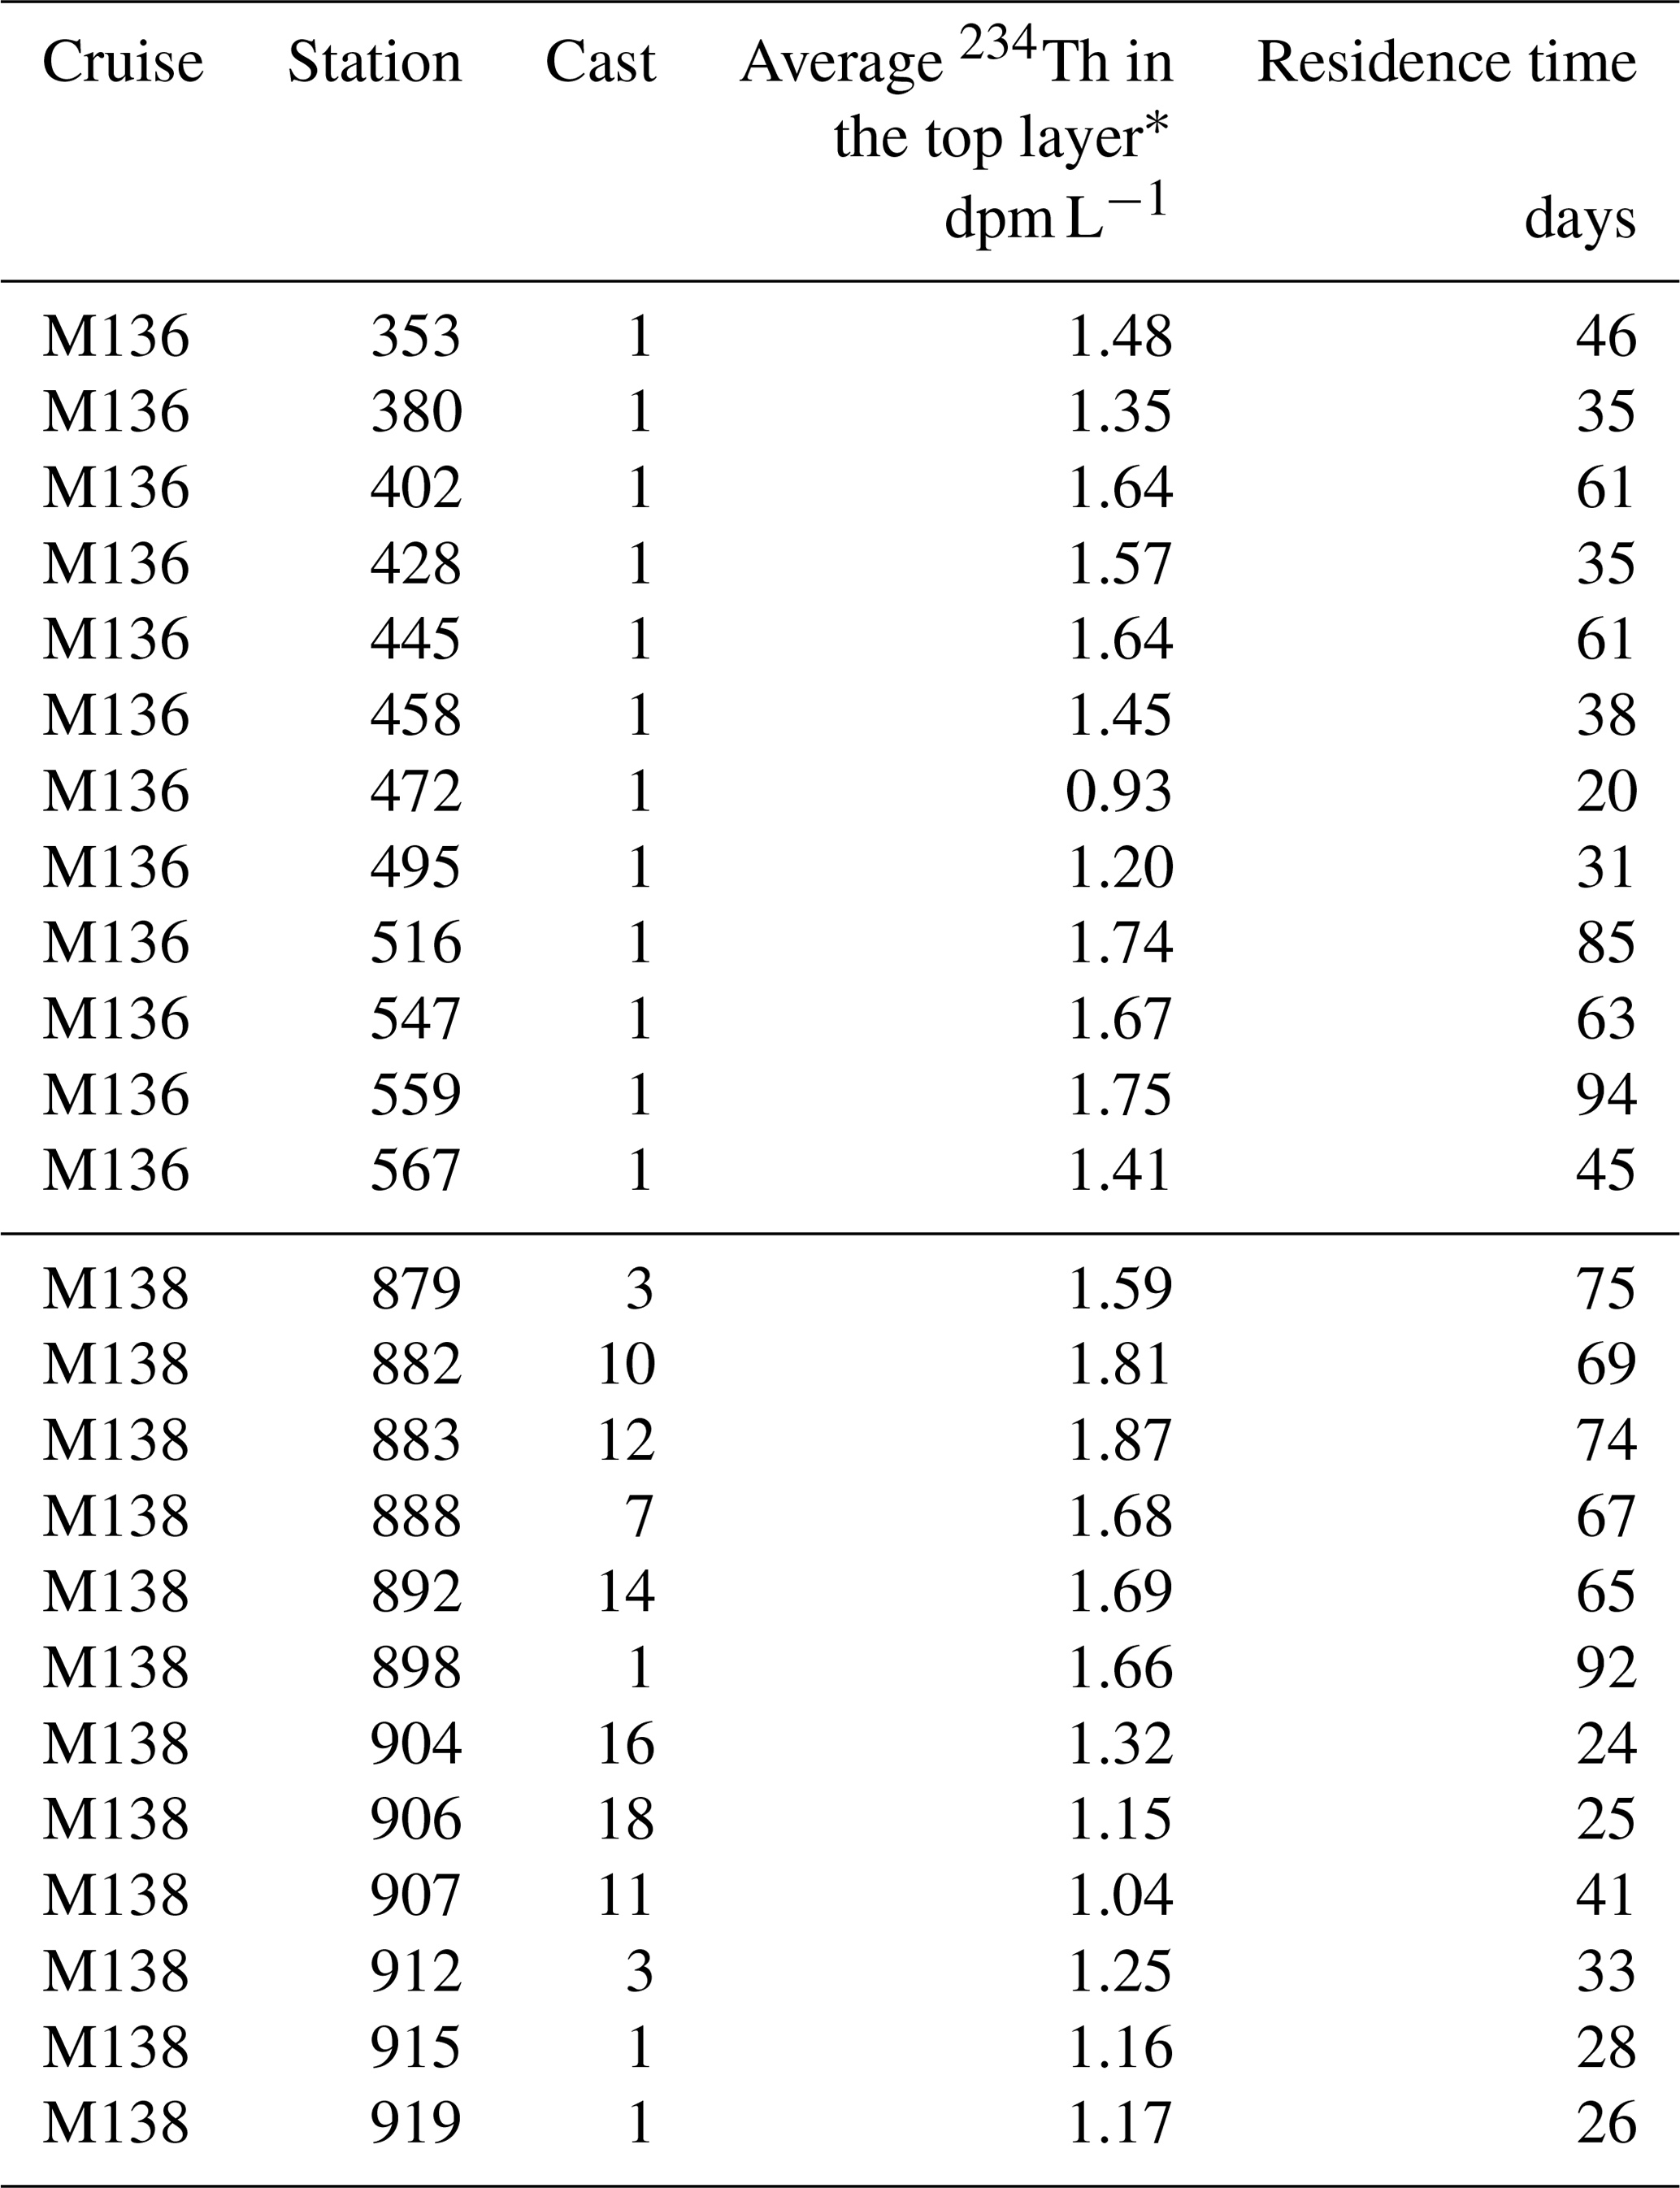
* Here “the top layer” refers to the top 30 m during M136 and top 50 m during M138.
These temporal variations on the residence times of total 234Th have important implications for the estimation of POC fluxes and quantification of carbon export efficiency. Firstly, seasonal changes in Th residence times reflect variations in particle removal over different integrated timescales. For example, POC produced in surface waters during GP16 (austral spring 2013) (Black et al., 2018) would have been exported out of the euphotic zone 3–6 times faster than during austral autumn 2017 (this study). Secondly, to properly evaluate carbon export efficiency, surface net primary production (NPP) should be averaged over a timescale similar to the residence time of total 234Th during station occupation. Applying a 16 d averaged NPP for the export efficiency estimate (Black et al., 2018; Henson et al., 2011) would likely not be appropriate in the current study in which total 234Th fluxes integrated timescales of several weeks. 234Th residence times should thus be properly quantified in coastal studies before deriving export efficiencies over varying NPP integration timescales.
Advection and diffusion are important in coastal and upwelling regions with respect to 234Th export fluxes (Bacon et al., 1996; Buesseler et al., 1995, 1998; Dunne and Murray, 1999). Our findings show that their significance is subject to the seasonal variability of the current and upwelling velocities, diffusivities, and 234Th gradients and should be evaluated on a case-by-case basis. Advective fluxes are perhaps the most straightforward to estimate as current velocities can be obtained routinely from shipboard ADCP measurements and upwelling rates calculated from satellite wind stress (Steinfeldt et al., 2015; Bacon et al., 1996). Horizontal and vertical velocities derived from general ocean circulation models also provide a good first-order estimate for advective 234Th fluxes; this approach has been successfully demonstrated in a few studies (Buesseler et al., 1995, 1998). In addition, the anthropogenic SF6 tracer and radium isotopes, widely used to quantify nutrient and Fe fluxes (Charette et al., 2007; Law et al., 2001), as well as 7Be isotope (Kadko, 2017), could be used independently to constrain horizontal and vertical exchange rates of 234Th (Morris et al., 2007; Charette et al., 2007; Buesseler et al., 2005). When in situ microstructure measurements are available (this study), vertical diffusivity can be directly calculated to estimate the vertical diffusive 234Th fluxes. Yet, microstructure analysis is not a routine measurement on oceanographic cruises. Earlier studies in the equatorial Pacific and the Gulf of Maine have shown that general ocean circulation models and a simple assumption on dissipation coefficients could provide a robust estimate on vertical and horizontal diffusivities (Benitez-Nelson et al., 2000; Gustafsson et al., 1998; Charette et al., 2001). Therefore, the calculation of physical fluxes is possible, though challenging, and 234Th fluxes due to physical processes should be carefully considered when conducting research in a coastal and upwelling systems.
A striking finding in this study is that the assumption of a linear 238U–salinity correlation could lead to one of the largest errors in 234Th flux estimates. In our study, using the salinity-based 238U activities resulted in significant underestimation of total 234Th fluxes by as much as 40 %. Because the translation of 238U activities to 234Th fluxes is not linear, larger differences between measured and salinity-based 238U do not necessarily contribute to greater overestimation or underestimation of 234Th fluxes. For example, a moderate difference of 3 %–6 % in 238U throughout the upper 100 m at station 898 leads to a 40 % difference in the final 234Th flux, while a 5 %–9 % difference in 238U at station 906 only resulted in a 16 % 234Th flux difference (Tables 2, S2). We would thus stress the importance of 238U measurements in future 234Th flux studies, particularly in coastal and shelf regions.
Finally, our study showed that the residence times of total 234Th in the Peruvian nearshore waters varied seasonally. Tropical OMZs are important hotspots for carbon sequestration from the atmosphere and enhanced sedimentary carbon preservation (Arthur et al., 1998; Suess et al., 1987). These OMZs are projected to intensify as a result of future climate change (Keeling and Garcia, 2002; Schmidtko et al., 2017; Stramma et al., 2008). Future studies should take into consideration the large temporal variations of the residence times of total 234Th in order to properly evaluate how carbon biogeochemical cycles and carbon export efficiency in these OMZs will respond to continuing ocean deoxygenation.
Data are available in supplementary tables and archived at https://doi.org/10.1594/PANGAEA.921917 (Xie et al., 2020).
The supplement related to this article is available online at: https://doi.org/10.5194/bg-17-4919-2020-supplement.
RCX, FACLM and EAP designed the study. RCX carried out sampling, onboard beta counting of 234Th, and drafted the manuscript. IR conducted 234Th and 238U analyses at the home laboratory. JL computed current velocities and vertical diffusivities respectively from VmADCP and microstructure profiler data. All coauthors had a chance to review the manuscript and contributed to the discussion and interpretation of the data presented.
The authors declare that they have no conflict of interest.
This article is part of the special issue “Ocean deoxygenation: drivers and consequences – past, present and future (BG/CP/OS inter-journal SI)”. It is a result of the International Conference on Ocean Deoxygenation, Kiel, Germany, 3–7 September 2018.
We thank the crew and science party on board M136 and M138 for their help in sample collection and instrument operation. Thank you to SiaoJean Ko, Dominik Jasinski, André Mutzberg and Mario Esposito for their laboratory assistance. We thank two anonymous reviewers and the associate editor, Marilaure Grégoire, for their constructive comments. The project, cruises, Insa Rapp, Jan Lüdke and Ruifang C. Xie were funded by the German SFB 754 program (Climate-Biogeochemistry Interactions in the Tropical Ocean); Ruifang C. Xie additionally by a DFG research grant (project number 432469432); and Frédéric A. C. Le Moigne by a DFG fellowship of the excellence cluster “The Future Ocean” (CP1403). This manuscript benefited from stimulating discussions at the BIARRITZ (“bridging international activity and related research into the twilight zone”) workshop held in Southampton, UK in 2019.
This research has been supported by the DFG SFB 754 (project no. 27542298) and a DFG grant to Ruifang C. Xie (project no. 432469432).
The article processing charges for this open-access
publication were covered by a Research Centre
of the Helmholtz Association.
This paper was edited by Marilaure Grégoire and reviewed by two anonymous referees.
Abernathey, R. P. and Marshall, J.: Global surface eddy diffusivities derived from satellite altimetry, J. Geophys. Res.-Oceans, 118, 901-916, https://doi.org/10.1002/jgrc.20066, 2013.
Anderson, R. F., Fleisher, M. Q., and LeHuray, A. P.: Concentration, oxidation state, and particulate flux of uranium in the Black Sea, Geochim. Cosmochim. Ac., 53, 2215–2224, https://doi.org/10.1016/0016-7037(89)90345-1, 1989.
Arthur, M. A., Dean, W. E., and Laarkamp, K.: Organic carbon accumulation and preservation in surface sediments on the Peru margin, Chem. Geol., 152, 273–286, https://doi.org/10.1016/S0009-2541(98)00120-X, 1998.
Bacon, M., Cochran, J., Hirschberg, D., Hammar, T., and Fleer, A.: Export flux of carbon at the equator during the EqPac time-series cruises estimated from 234Th measurements, Deep-Sea Res. Pt. II, 43, 1133–1153, https://doi.org/10.1016/0967-0645(96)00016-1, 1996.
Barnes, C. and Cochran, J.: Uranium removal in oceanic sediments and the oceanic U balance, Earth Planet. Sc. Lett., 97, 94–101, https://doi.org/10.1016/0012-821X(90)90101-3, 1990.
Barnes, C. E. and Cochran, J. K.: Geochemistry of uranium in Black Sea sediments, Deep.-Sea Res., 38, S1237–S1254, https://doi.org/10.1016/S0198-0149(10)80032-9, 1991.
Barnes, C. E. and Cochran, J. K.: Uranium geochemistry in estuarine sediments: Controls on removal and release processes, Geochim. Cosmochim. Ac., 57, 555–569, https://doi.org/10.1016/0016-7037(93)90367-6, 1993.
Benitez-Nelson, C. R., Buesseler, K. O., and Crossin, G.: Upper ocean carbon export, horizontal transport, and vertical eddy diffusivity in the southwestern Gulf of Maine, Cont. Shelf. Res., 20, 707–736, https://doi.org/10.1016/S0278-4343(99)00093-X, 2000.
Bentamy, A. and Croize-Fillon: Gridded surface wind fields from Metop/ASCAT measurements, Int. J. Remote Sens., 33, 1729–1754, https://doi.org/10.1080/01431161.2011.600348, 2010.
Bewers, J. and Yeats, P.: Oceanic residence times of trace metals, Nature, 268, 595–598, https://doi.org/10.1038/268595a0, 1977.
Bhat, S., Krishnaswamy, S., Lal, D., and Moore, W.: 234Th ∕238U ratios in the ocean, Earth Planet. Sc. Lett., 5, 483–491, https://doi.org/10.1016/S0012-821X(68)80083-4, 1968.
Black, E. E., Buesseler, K. O., Pike, S. M., and Lam, P. J.: 234Th as a tracer of particulate export and remineralization in the southeastern tropical Pacific, Mar. Chem., 201, 35–50, https://doi.org/10.1016/j.marchem.2017.06.009, 2018.
Black, E. E., Lam, P. J., Lee, J. M., and Buesseler, K. O.: Insights From the 238U–234Th Method Into the Coupling of Biological Export and the Cycling of Cadmium, Cobalt, and Manganese in the Southeast Pacific Ocean, Global Biogeochem. Cy., 33, 15–36, https://doi.org/10.1029/2018GB005985, 2019.
Böning, P., Brumsack, H.-J., Böttcher, M. E., Schnetger, B., Kriete, C., Kallmeyer, J., and Borchers, S. L.: Geochemistry of Peruvian near-surface sediments, Geochim. Cosmochim. Ac., 68, 4429–4451, https://doi.org/10.1016/j.gca.2004.04.027, 2004.
Buckingham, C. E., Lucas, N. S., Belcher, S. E., Rippeth, T. P., Grant, A. L. M., Le Sommer, J., Ajayi, A. O., and Naveira Garabato, A. C.: The Contribution of Surface and Submesoscale Processes to Turbulence in the Open Ocean Surface Boundary Layer, J. Adv. Model. Earth Sy., 11, 4066–4094, https://doi.org/10.1029/2019MS001801, 2019.
Buesseler, K., Ball, L., Andrews, J., Benitez-Nelson, C., Belastock, R., Chai, F., and Chao, Y.: Upper ocean export of particulate organic carbon in the Arabian Sea derived from thorium-234, Deep-Sea Res. Pt. II, 45, 2461–2487, https://doi.org/10.1016/S0967-0645(98)80022-2, 1998.
Buesseler, K. O., Bacon, M. P., Cochran, J. K., and Livingston, H. D.: Carbon and nitrogen export during the JGOFS North Atlantic Bloom Experiment estimated from 234Th : 238U disequilibria, Deep.-Sea Res., 39, 1115–1137, https://doi.org/10.1016/0198-0149(92)90060-7, 1992.
Buesseler, K. O., Andrews, J. A., Hartman, M. C., Belastock, R., and Chai, F.: Regional estimates of the export flux of particulate organic carbon derived from thorium-234 during the JGOFS EqPac program, Deep-Sea Res. Pt. II, 42, 777–804, https://doi.org/10.1016/0967-0645(95)00043-P, 1995.
Buesseler, K. O., Andrews, J., Pike, S. M., Charette, M. A., Goldson, L. E., Brzezinski, M. A., and Lance, V.: Particle export during the southern ocean iron experiment (SOFeX), Limnol. Oceanogr., 50, 311–327, https://doi.org/10.4319/lo.2005.50.1.0311, 2005.
Buesseler, K. O., Benitez-Nelson, C. R., Moran, S., Burd, A., Charette, M., Cochran, J. K., Coppola, L., Fisher, N., Fowler, S., and Gardner, W.: An assessment of particulate organic carbon to thorium-234 ratios in the ocean and their impact on the application of 234Th as a POC flux proxy, Mar. Chem., 100, 213–233, https://doi.org/10.1016/j.marchem.2005.10.013, 2006.
Buesseler, K. O. and Boyd, P. W.: Shedding light on processes that control particle export and flux attenuation in the twilight zone of the open ocean, Limnol. Oceanogr., 54, 1210–1232, https://doi.org/10.4319/lo.2009.54.4.1210, 2009.
Cai, P., Chen, W., Dai, M., Wan, Z., Wang, D., Li, Q., Tang, T., and Lv, D.: A high-resolution study of particle export in the southern South China Sea based on 234Th : 238U disequilibrium, J. Geophys. Res.-Oceans, 113, C04019, https://doi.org/10.1029/2007JC004268, 2008.
Charette, M. A., Moran, S. B., Pike, S. M., and Smith, J. N.: Investigating the carbon cycle in the Gulf of Maine using the natural tracer thorium 234, J. Geophys. Res.-Oceans, 106, 11553–11579, https://doi.org/10.1029/1999JC000277, 2001.
Charette, M. A., Gonneea, M. E., Morris, P. J., Statham, P., Fones, G., Planquette, H., Salter, I., and Garabato, A. N.: Radium isotopes as tracers of iron sources fueling a Southern Ocean phytoplankton bloom, Deep-Sea Res. Pt. II, 54, 1989–1998, https://doi.org/10.1016/j.dsr2.2007.06.003, 2007.
Chen, J., Edwards, R. L., and Wasserburg, G. J.: 238U, 234U and 232Th in seawater, Earth Planet. Sc. Lett., 80, 241–251, https://doi.org/10.1016/0012-821X(86)90108-1, 1986.
Coale, K. H. and Bruland, K. W.: 234Th: 238U disequilibria within the California Current 1, Limnol. Oceanogr., 30, 22–33, https://doi.org/10.4319/lo.1985.30.1.0022, 1985.
Coale, K. H. and Bruland, K. W.: Oceanic stratified euphotic zone as elucidated by 234Th: 238U disequilibria 1, Limnol. Oceanogr., 32, 189–200, https://doi.org/10.4319/lo.1987.32.1.0189, 1987.
Cochran, J. and Masqué, P.: Short-lived U/Th series radionuclides in the ocean: tracers for scavenging rates, export fluxes and particle dynamics, Rev. Mineral. Geochem., 52, 461–492, https://doi.org/10.2113/0520461, 2003.
Dengler, M. and Sommer, S.: Coupled benthic and pelagic oxygen, nutrient and trace metal cycling, ventilation and carbon degradation in the oxygen minimum zone of the Peruvian continental margin (SFB 754), Cruise No. M 136, 11.04.–03.05.2017 Callao (Peru)–Callao Solute-Flux Peru I, METEOR-Berichte, https://doi.org/10.3289/CR_M136, 2017.
Dunne, J. P. and Murray, J. W.: Sensitivity of 234Th export to physical processes in the central equatorial Pacific, Deep-Sea Res. Pt. I, 46, 831–854, https://doi.org/10.1016/S0967-0637(98)00098-3, 1999.
Echevin, V. M., Colas, F., Espinoza-Morriberon, D., Anculle, T., Vasquez, L., and Gutierrez, D.: Forcings and evolution of the 2017 coastal El Niño off Northern Peru and Ecuador, Front. Mar. Sci., 5, 367, https://doi.org/10.3389/fmars.2018.00367, 2018.
Fischer, J., Brandt, P., Dengler, M., Müller, M., and Symonds, D.: Surveying the upper ocean with the Ocean Surveyor: a new phased array Doppler current profiler, J. Atmos. Ocean. Tech., 20, 742–751, https://doi.org/10.1175/1520-0426(2003)20<742:STUOWT>2.0.CO;2, 2003.
Garreaud, R. D.: A plausible atmospheric trigger for the 2017 coastal El Niño, Int. J. Climatol., 38, e1296–e1302, https://doi.org/10.1002/joc.5426, 2018.
Gregg, M., D'Asaro, E., Riley, J., and Kunze, E.: Mixing efficiency in the ocean, Annu. Rev. Mar. Sci., 10, 443–473, https://doi.org/10.1146/annurev-marine-121916-063643, 2018.
Gustafsson, Ö., Buesseler, K. O., Rockwell Geyer, W., Bradley Moran, S., and Gschwend, P. M.: An assessment of the relative importance of horizontal and vertical transport of particle-reactive chemicals in the coastal ocean, Cont. Shelf. Res., 18, 805–829, https://doi.org/10.1016/S0278-4343(98)00015-6, 1998.
Hahn, J., Brandt, P., Greatbatch, R. J., Krahmann, G., and Körtzinger, A.: Oxygen variance and meridional oxygen supply in the Tropical North East Atlantic oxygen minimum zone, Clim. Dynam., 43, 2999–3024, https://doi.org/10.1007/s00382-014-2065-0, 2014.
Henson, S. A., Sanders, R., Madsen, E., Morris, P. J., Le Moigne, F., and Quartly, G. D.: A reduced estimate of the strength of the ocean's biological carbon pump, Geophys. Res. Lett., 38, L04606, https://doi.org/10.1029/2011gl046735, 2011.
Kadko, D.: Upwelling and primary production during the US GEOTRACES East Pacific Zonal Transect, Global Biogeochem. Cy., 31, 218–232, https://doi.org/10.1002/2016GB005554, 2017.
Kaufman, A., Li, Y.-H., and Turekian, K. K.: The removal rates of 234Th and 228Th from waters of the New York Bight, Earth Planet. Sc. Lett., 54, 385–392, https://doi.org/10.1016/0012-821X(81)90054-6, 1981.
Keeling, R. F. and Garcia, H. E.: The change in oceanic O2 inventory associated with recent global warming, P. Natl. Acad. Sci. USA, 99, 7848–7853, https://doi.org/10.1073/pnas.122154899, 2002.
Kim, G., Hussain, N., and Church, T. M.: How accurate are the 234Th based particulate residence times in the ocean?, Geophys. Res. Lett., 26, 619–622, https://doi.org/10.1029/1999GL900037, 1999.
Ku, T.-L., Knauss, K. G., and Mathieu, G. G.: Uranium in open ocean: concentration and isotopic composition, Deep-Sea Res., 24, 1005–1017, https://doi.org/10.1016/0146-6291(77)90571-9, 1977.
Law, C., Martin, A., Liddicoat, M., Watson, A., Richards, K., and Woodward, E.: A Lagrangian SF6 tracer study of an anticyclonic eddy in the North Atlantic: Patch evolution, vertical mixing and nutrient supply to the mixed layer, Deep-Sea Res. Pt. II, 48, 705–724, https://doi.org/10.1016/S0967-0645(00)00112-0, 2001.
Le Moigne, F. A. C., Henson, S. A., Sanders, R. J., and Madsen, E.: Global database of surface ocean particulate organic carbon export fluxes diagnosed from the 234Th technique, Earth Syst. Sci. Data, 5, 295–304, https://doi.org/10.5194/essd-5-295-2013, 2013.
Lee, C., Murray, D., Barber, R., Buesseler, K., Dymond, J., Hedges, J., Honjo, S., Manganini, S., Marra, J., and Moser, C.: Particulate organic carbon fluxes: compilation of results from the 1995 US JGOFS Arabian Sea process study: By the Arabian Sea carbon flux group, Deep-Sea Res. Pt. II, 45, 2489–2501, https://doi.org/10.1016/S0967-0645(98)00079-4, 1998.
Lüdke, J., Dengler, M., Sommer, S., Clemens, D., Thomsen, S., Krahmann, G., Dale, A. W., Achterberg, E. P., and Visbeck, M.: Influence of intraseasonal eastern boundary circulation variability on hydrography and biogeochemistry off Peru, Ocean Sci. Discuss., 2019, 1–31, https://doi.org/10.5194/os-2019-93, in review 2020.
McDougall, T., Feistel, R., Millero, F., Jackett, D., Wright, D., King, B., Marion, G., Chen, C., Spitzer, P., and Seitz, S.: The International Thermodynamic Equation Of Seawater 2010 (TEOS-10): Calculation and Use of Thermodynamic Properties, Global Ship-based Repeat Hydrography Manual, IOCCP Report No. 14, 2009.
McKee, B. A., DeMaster, D. J., and Nittrouer, C. A.: Uranium geochemistry on the Amazon shelf: Evidence for uranium release from bottom sediments, Geochim. Cosmochim. Ac., 51, 2779–2786, https://doi.org/10.1016/0016-7037(87)90157-8, 1987.
Morris, P. J., Sanders, R., Turnewitsch, R., and Thomalla, S.: 234Th-derived particulate organic carbon export from an island-induced phytoplankton bloom in the Southern Ocean, Deep-Sea Res. Pt. II, 54, 2208–2232, https://doi.org/10.1016/j.dsr2.2007.06.002, 2007.
Murray, J. W., Downs, J. N., Strom, S., Wei, C.-L., and Jannasch, H. W.: Nutrient assimilation, export production and 234Th scavenging in the eastern equatorial Pacific, Deep.-Sea Res., 36, 1471–1489, https://doi.org/10.1016/0198-0149(89)90052-6, 1989.
Nameroff, T., Balistrieri, L., and Murray, J.: Suboxic trace metal geochemistry in the eastern tropical North Pacific, Geochim. Cosmochim. Ac., 66, 1139–1158, https://doi.org/10.1016/S0016-7037(01)00843-2, 2002.
Noffke, A., Hensen, C., Sommer, S., Scholz, F., Bohlen, L., Mosch, T., Graco, M., and Wallmann, K.: Benthic iron and phosphorus fluxes across the Peruvian oxygen minimum zone, Limnol. Oceanogr., 57, 851–867, https://doi.org/10.4319/lo.2012.57.3.0851, 2012.
Osborn, T.: Estimates of the local rate of vertical diffusion from dissipation measurements, J. Phys. Oceanogr., 10, 83–89, https://doi.org/10.1175/1520-0485(1980)010<0083:EOTLRO>2.0.CO;2, 1980.
Owens, S., Buesseler, K., and Sims, K.: Re-evaluating the 238U-salinity relationship in seawater: Implications for the 238U–234Th disequilibrium method, Mar. Chem., 127, 31–39, https://doi.org/10.1016/j.marchem.2011.07.005, 2011.
Owens, S. A., Pike, S., and Buesseler, K. O.: Thorium-234 as a tracer of particle dynamics and upper ocean export in the Atlantic Ocean, Deep-Sea Res. Pt. II, 116, 42–59, https://doi.org/10.1016/j.dsr2.2014.11.010, 2015.
Peng, Q., Xie, S.-P., Wang, D., Zheng, X.-T., and Zhang, H.: Coupled ocean-atmosphere dynamics of the 2017 extreme coastal El Niño, Nat. Commun., 10, 298, https://doi.org/10.1038/s41467-018-08258-8, 2019.
Pike, S., Buesseler, K., Andrews, J., and Savoye, N.: Quantification of 234Th recovery in small volume sea water samples by inductively coupled plasma-mass spectrometry, J. Radioanal. Nucl. Ch., 263, 355–360, https://doi.org/10.1007/s10967-005-0594-z, 2005.
Puigcorbé, V., Masqué, P., and Le Moigne, F. A. C.: Global database of ratios of particulate organic carbon to thorium-234 in the ocean: improving estimates of the biological carbon pump, Earth Syst. Sci. Data, 12, 1267–1285, https://doi.org/10.5194/essd-12-1267-2020, 2020.
Rapp, I., Schlosser, C., Menzel Barraqueta, J.-L., Wenzel, B., Lüdke, J., Scholten, J., Gasser, B., Reichert, P., Gledhill, M., Dengler, M., and Achterberg, E. P.: Controls on redox-sensitive trace metals in the Mauritanian oxygen minimum zone, Biogeosciences, 16, 4157–4182, https://doi.org/10.5194/bg-16-4157-2019, 2019.
Rengarajan, R., Sarin, M., and Krishnaswami, S.: Uranium in the Arabian Sea: role of denitrification in controlling its distribution, Oceanol. Acta., 26, 687–693, https://doi.org/10.1016/j.oceact.2003.05.001, 2003.
Resplandy, L., Martin, A. P., Le Moigne, F., Martin, P., Aquilina, A., Mémery, L., Lévy, M., and Sanders, R.: How does dynamical spatial variability impact 234Th-derived estimates of organic export?, Deep-Sea Res. Pt. I, 68, 24–45, https://doi.org/10.1016/j.dsr.2012.05.015, 2012.
Roquet, F., Madec, G., McDougall, T. J., and Barker, P. M.: Accurate polynomial expressions for the density and specific volume of seawater using the TEOS-10 standard, Ocean Model., 90, 29–43, https://doi.org/10.1016/j.ocemod.2015.04.002, 2015.
Rosengard, S. Z., Lam, P. J., Balch, W. M., Auro, M. E., Pike, S., Drapeau, D., and Bowler, B.: Carbon export and transfer to depth across the Southern Ocean Great Calcite Belt, Biogeosciences, 12, 3953–3971, https://doi.org/10.5194/bg-12-3953-2015, 2015.
Santschi, P., Murray, J. W., Baskaran, M., Benitez-Nelson, C. R., Guo, L., Hung, C.-C., Lamborg, C., Moran, S., Passow, U., and Roy-Barman, M.: Thorium speciation in seawater, Mar. Chem., 100, 250–268, https://doi.org/10.1016/j.marchem.2005.10.024, 2006.
Savoye, N., Benitez-Nelson, C., Burd, A. B., Cochran, J. K., Charette, M., Buesseler, K. O., Jackson, G. A., Roy-Barman, M., Schmidt, S., and Elskens, M.: 234Th sorption and export models in the water column: a review, Mar. Chem., 100, 234–249, https://doi.org/10.1016/j.marchem.2005.10.014, 2006.
Schafstall, J., Dengler, M., Brandt, P., and Bange, H.: Tidal-induced mixing and diapycnal nutrient fluxes in the Mauritanian upwelling region, J. Geophys. Res.-Oceans, 115, https://doi.org/10.1029/2009jc005940, 2010.
Schmidt, S. and Reyss, J.: Uranium concentrations of Mediterranean seawater with high salinities, Comptes Rendus de l'Academie des Sciences. Serie 2, 312, 479–484, 1991.
Schmidtko, S., Stramma, L., and Visbeck, M.: Decline in global oceanic oxygen content during the past five decades, Nature, 542, 335, https://doi.org/10.1038/nature21399, 2017.
Scholz, F., Hensen, C., Noffke, A., Rohde, A., Liebetrau, V., and Wallmann, K.: Early diagenesis of redox-sensitive trace metals in the Peru upwelling area–response to ENSO-related oxygen fluctuations in the water column, Geochim. Cosmochim. Ac., 75, 7257–7276, https://doi.org/10.1016/j.gca.2011.08.007, 2011.
Scholz, F., McManus, J., Mix, A. C., Hensen, C., and Schneider, R. R.: The impact of ocean deoxygenation on iron release from continental margin sediments, Nat. Geosci., 7, 433–437, https://doi.org/10.1038/ngeo2162, 2014.
Shepherd, J. G., Brewer, P. G., Oschlies, A., and Watson, A. J.: Ocean ventilation and deoxygenation in a warming world: introduction and overview, Philos. T. R. Soc. A, 375, 20170240, https://doi.org/10.1098/rsta.2017.0240, 2017.
Smith, S. D.: Coefficients for sea surface wind stress, heat flux, and wind profiles as a function of wind speed and temperature, J. Geophys. Res.-Oceans, 93, 15467–15472, https://doi.org/10.1029/JC093iC12p15467, 1988.
Steinfeldt, R., Sültenfuß, J., Dengler, M., Fischer, T., and Rhein, M.: Coastal upwelling off Peru and Mauritania inferred from helium isotope disequilibrium, Biogeosciences, 12, 7519–7533, https://doi.org/10.5194/bg-12-7519-2015, 2015.
Stramma, L., Johnson, G. C., Sprintall, J., and Mohrholz, V.: Expanding oxygen-minimum zones in the tropical oceans, Science, 320, 655–658, https://doi.org/10.1126/science.1153847, 2008.
Suess, E., Kulm, L., and Killingley, J.: Coastal upwelling and a history of organic-rich mudstone deposition off Peru, Geological Society, London, Special Publications, 26, 181–197, https://doi.org/10.1144/GSL.SP.1987.026.01.11, 1987.
Swarzenski, P., Campbell, P., Porcelli, D., and McKee, B.: The estuarine chemistry and isotope systematics of 234,238U in the Amazon and Fly Rivers, Cont. Shelf. Res., 24, 2357–2372, https://doi.org/10.1016/j.csr.2004.07.025, 2004.
Thomsen, S. and Lüdke, J.: Microstructure measurements during METEOR cruise M136, PANGAEA, https://doi.org/10.1594/PANGAEA.890121, 2018.
Thomsen, S., Kanzow, T., Krahmann, G., Greatbatch, R. J., Dengler, M., and Lavik, G.: The formation of a subsurface anticyclonic eddy in the Peru-Chile Undercurrent and its impact on the near-coastal salinity, oxygen, and nutrient distributions, J. Geophys. Res.-Oceans, 121, 476–501, https://doi.org/10.1002/2015JC010878, 2016.
Van Der Loeff, M. R., Sarin, M. M., Baskaran, M., Benitez-Nelson, C., Buesseler, K. O., Charette, M., Dai, M., Gustafsson, Ö., Masque, P., and Morris, P. J.: A review of present techniques and methodological advances in analyzing 234Th in aquatic systems, Mar. Chem., 100, 190–212, https://doi.org/10.1016/j.marchem.2005.10.012, 2006.
Waples, J. T., Benitez-Nelson, C., Savoye, N., van der Loeff, M. R., Baskaran, M., and Gustafsson, Ö.: An introduction to the application and future use of 234Th in aquatic systems, Mar. Chem., 100, 166–189, https://doi.org/10.1016/j.marchem.2005.10.011, 2006.
Weinstein, S. E. and Moran, S. B.: Vertical flux of particulate Al, Fe, Pb, and Ba from the upper ocean estimated from 234Th ∕238U disequilibria, Deep-Sea Res. Pt. I, 52, 1477–1488, https://doi.org/10.1016/j.dsr.2005.03.008, 2005.
Xie, R. C., Le Moigne, F. A. C., Rapp, I., Lüdke, J., Gasser, B., Degnler, M., Liebetrau, V., and Achterberg, E. P.: Activities of total 234Th and dissolved 238U during cruises M136 and M138 from the Peruvian Oxygen Minimum Zone, PANGAEA, https://doi.org/10.1594/PANGAEA.921917, 2020.
Zhurbas, V. and Oh, I. S.: Drifter-derived maps of lateral diffusivity in the Pacific and Atlantic oceans in relation to surface circulation patterns, J. Geophys. Res.-Oceans, 109, C05015, https://doi.org/10.1029/2003JC002241, 2004.
Zimmerman, J. T. F.: Mixing and flushing of tidal embayments in the western Dutch Wadden Sea part I: Distribution of salinity and calculation of mixing time scales, Neth. J. Sea Res., 10, 149–191, https://doi.org/10.1016/0077-7579(76)90013-2, 1976.