the Creative Commons Attribution 4.0 License.
the Creative Commons Attribution 4.0 License.
 | 16 Oct 2020
Using 226Ra and 228Ra isotopes to distinguish water mass distribution in the Canadian Arctic Archipelago
Chantal Mears
Paul B. Henderson
Matthew A. Charette
Hugh MacIntyre
Frank Dehairs
Christophe Monnin
Alfonso Mucci
As a shelf-dominated basin, the Arctic Ocean and its biogeochemistry are heavily influenced by continental and riverine sources. Radium isotopes (226Ra, 228Ra, 224Ra, and 223Ra), are transferred from the sediments to seawater, making them ideal tracers of sediment–water exchange processes and ocean mixing. As the two long-lived isotopes of the radium quartet, 226Ra and 228Ra (226Ra with a t1∕2 of 1600 years and 228Ra with a t1∕2 of 5.8 years) can provide insight into the water mass compositions, distribution patterns, as well as mixing processes and their associated timescales throughout the Canadian Arctic Archipelago (CAA). The wide range of 226Ra and 228Ra activities, as well as of the 228Ra∕226Ra, measured in water samples collected during the 2015 GEOTRACES cruise, complemented by additional chemical tracers – dissolved inorganic carbon (DIC), total alkalinity (AT), barium (Ba), and the stable oxygen isotope composition of water (δ18O) – highlight the dominant biogeochemical, hydrographic, and bathymetric features of the CAA. Bathymetric features, such as the continental shelf and shallow coastal sills, are critical in modulating circulation patterns within the CAA, including the bulk flow of Pacific waters and the inhibited eastward flow of denser Atlantic waters through the CAA. Using a principal component analysis, we unravel the dominant mechanisms and apparent water mass end-members that shape the tracer distributions. We identify two distinct water masses located above and below the upper halocline layer throughout the CAA and distinctly differentiate surface waters in the eastern and western CAA. Furthermore, we highlight water exchange across 80∘ W, inferring a draw of Atlantic water (originating from Baffin Bay) into the CAA. This underscores the presence of an Atlantic water “U-turn” located at Barrow Strait, where the same water mass is seen along the northernmost edge at 80∘ W as well as along the southeasternmost confines of Lancaster Sound. Overall, this study provides a stepping stone for future research initiatives within the Canadian Arctic Archipelago, revealing how quantifying disparities in the distributions of radioactive tracers can provide valuable information on water mass distributions, flow patterns, and mixing within vulnerable areas such as the CAA.
Please read the corrigendum first before continuing.
-
Notice on corrigendum
The requested paper has a corresponding corrigendum published. Please read the corrigendum first before downloading the article.
-
Article
(9748 KB)
-
The requested paper has a corresponding corrigendum published. Please read the corrigendum first before downloading the article.
- Article
(9748 KB) - Full-text XML
- Corrigendum
- BibTeX
- EndNote


1.1 General background
Over the past 30 years, major research initiatives have been undertaken within the Arctic, highlighting this region's global importance and vulnerability to climate change (Prinsenberg and Bennett, 1987; Shadwick et al., 2013). One of the primary causes of this vulnerability is a modification of the regional hydrographic regime, characterized by cool, CO2-charged (less alkaline) Pacific waters, which enter the Arctic Ocean via the Bering Strait, flowing along the southern parts of the Canadian Arctic Archipelago (CAA) and being dispersed into Baffin Bay. Previous studies have shown that these eastward-flowing waters contribute significantly to carbon sequestration and instigate deep-water formation in the North Atlantic (e.g., Aagaard and Carmack, 1989; Burt et al., 2016a; Curry et al., 2011; Hamilton and Wu, 2013; Holland et al., 2001; Ingram and Prinsenberg, 1998; Rahmstorf, 2002; Shadwick et al., 2011a).
Although the various water masses delivered to Baffin Bay play a role in establishing and maintaining the global thermohaline circulation, little is known about the distribution, composition, and modes of delivery of water through the Canadian Arctic Archipelago. This study contributes to the knowledge base of circulation patterns in the CAA by using the radioactive radium isotopes 228Ra and 226Ra as well as dissolved inorganic carbon (DIC), total alkalinity (AT), barium (Ba), and the stable oxygen isotope composition of water (δ18O) as tracers of water mass distribution, mixing, and composition throughout the region. Moreover, we hope that this study will provide a foundation for further investigations of how changes in environmental conditions within this vulnerable area will affect the distribution of these tracers, as well as biogeochemical cycles and circulation in the CAA.
1.2 Oceanographic setting
Approximately 30 %–50 % of the Arctic Ocean surface area (comprising 9.5×10⁶ km2) is dominated by polar continental shelves (Coachman and Aagaard, 1974; Jakobsson, 2002; Rutgers van der Loeff et al., 1995; Shadwick et al., 2011b; Walsh, 1991; Xing et al., 2003). The CAA, a region of branching channels and straits that extends from approximately 120 to 80∘ W is located in this shelf-dominated region (Fig. 1). Spanning only 65 km across at its widest point, this narrow, polar network provides a critical connection between the Pacific and Atlantic oceans and facilitates the export of approximately one-third of the Arctic Ocean's outflowing water (Coachman and Aagaard, 1974; Hamilton et al., 2013; Hamilton and Wu, 2013).
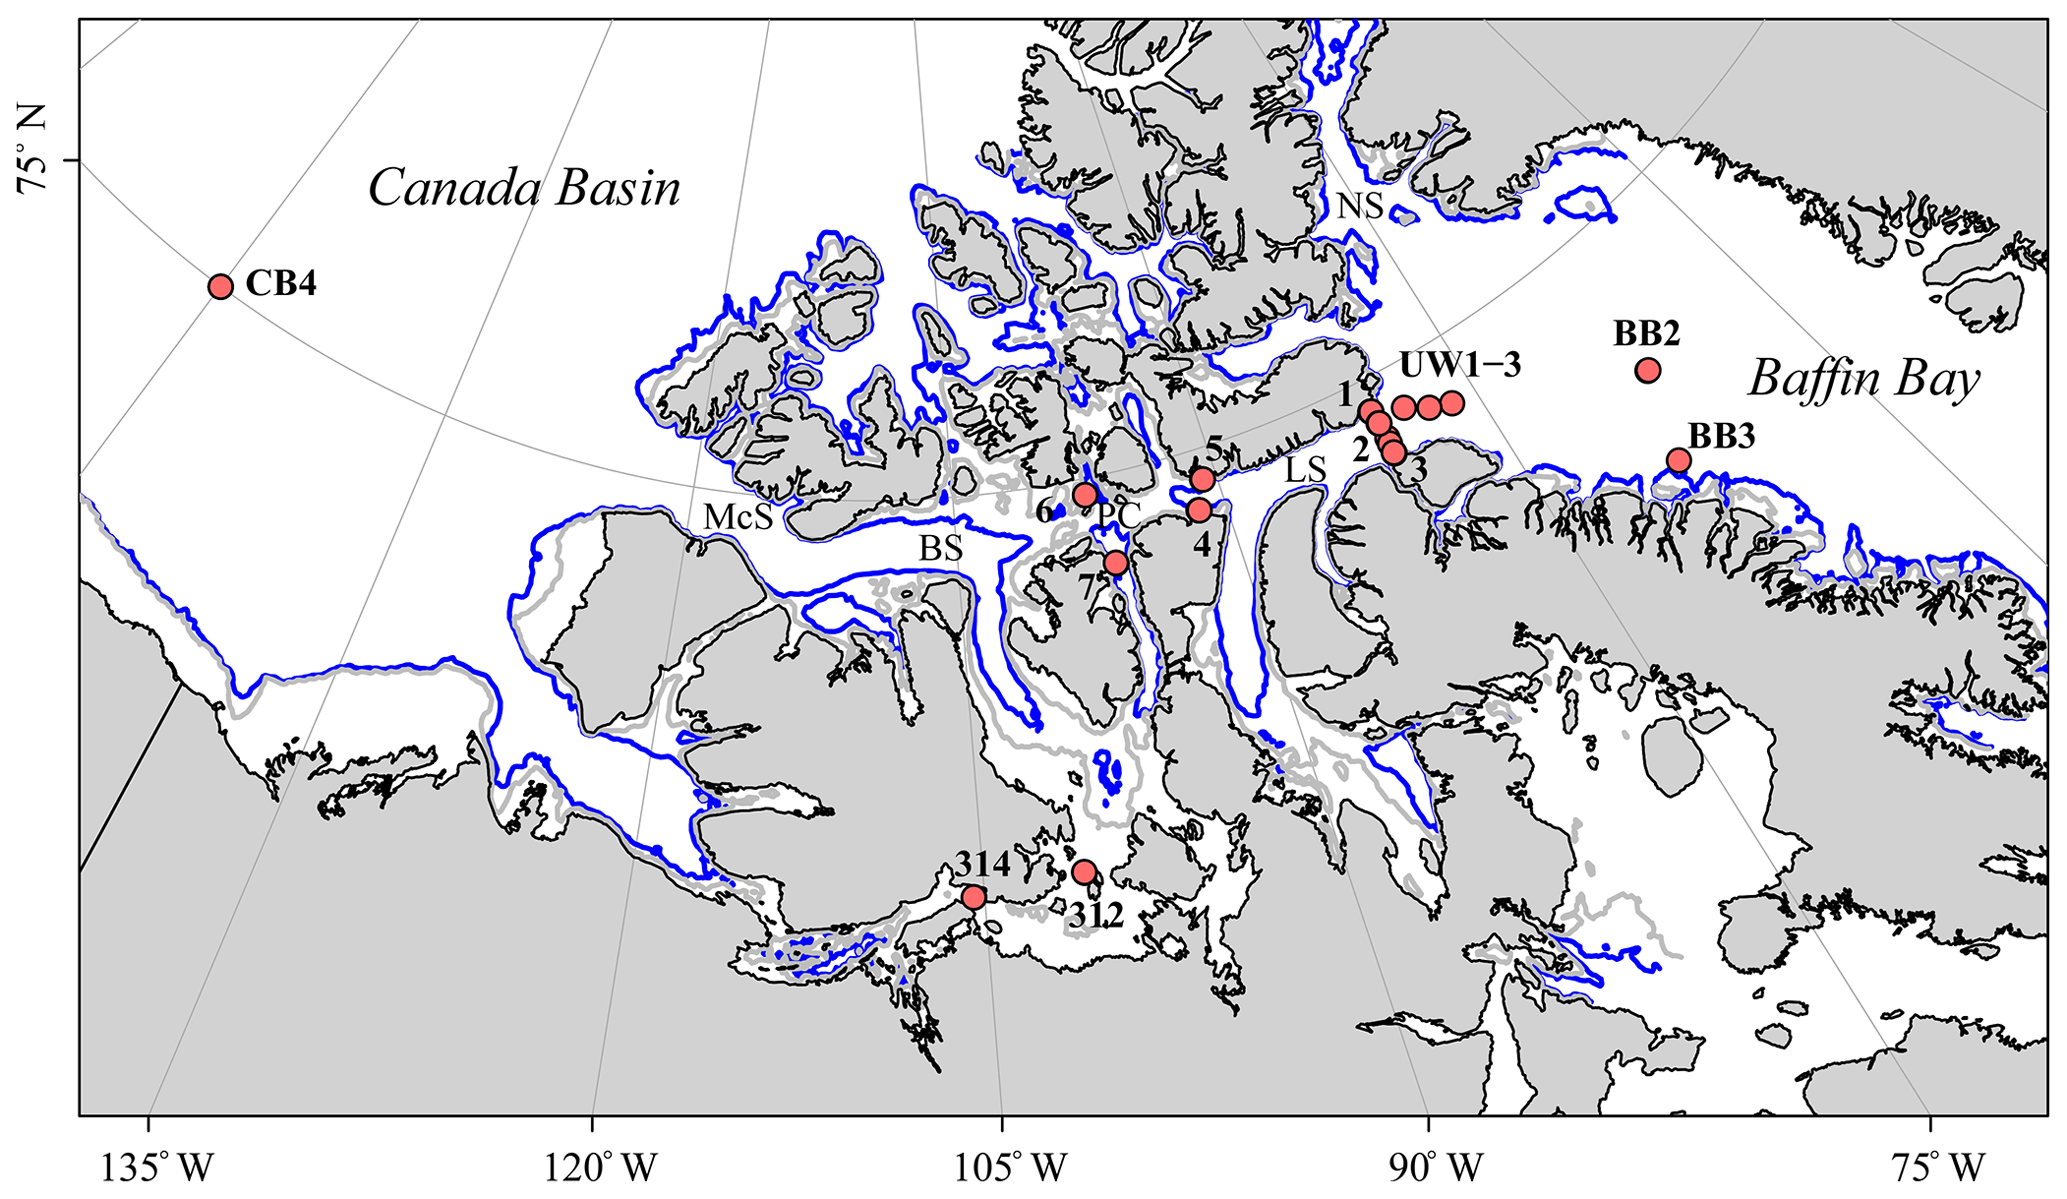
Figure 1Map of the Canadian Arctic Archipelago (CAA) showing the 17 stations sampled during the 2015 GEOTRACES cruise aboard the CCGS Amundsen (red dots); the two unlabeled stations along the eastern CAA cross-channel transect are the surface stations 323 and 324, and the numbers refer to CAA stations (CAA1–CAA7). The Nares Strait (NS), Barrow Strait (BS), McClure Strait (McS), Lancaster Sound (LS), and Parry Channel (PC) are denoted, with the latter connecting the CAA from McS via BS to LS. Underway (UW) samples were taken on the way from Baffin Bay (BB) into Lancaster Sound. Finally, the blue and gray lines indicate the 200 m and 100 m isobaths, respectively.
Previous research has recognized the partitioning of the water column in the CAA into three salinity-defined water masses, the deepest and most saline being the “Atlantic layer” (ATL, SP>33.1), followed by the “Pacific upper halocline layer” (UHL; ), and finally the least saline and uppermost being the “polar mixed layer” (PML; SP<31) (e.g., Aagaard et al., 1981; Aagaard and Carmack, 1994; Bauch et al., 1995; Mathis et al., 2005; Shadwick et al., 2011a). All three water masses have been identified at both the eastern and western boundaries of the CAA, whereas only the upper two layers (PML and UHL) are found throughout the CAA. The presence of a 200 m shoal at Barrow Strait (Fig. 1), which bridges the western and eastern regions, prevents the deep ATL water mass from flowing eastward through the CAA (Jones, 2003; Macdonald et al., 1987; Newton and Coachman, 1974). As a result, the bulk eastward transport is composed of the cool, CO2-charged (less alkaline) Pacific and fresh surface waters that flow from the Canada Basin to Baffin Bay through the CAA (Hamilton and Wu, 2013; Prinsenberg et al., 2009; Wang et al., 2012; Xing et al., 2003).
In addition to the bulk eastward transport through the CAA, the northern regions of the CAA host an occasional westward flowing countercurrent during late summer (Peterson et al., 2012; Prinsenberg and Bennett, 1987; Prinsenberg et al., 2009; Rudels, 1986). This suggests that there may be the intrusion of Atlantic waters originating from Baffin Bay, moving into the CAA along the northern edge from the east, and possibly creating a “U-turn” as the westward current reroutes back into Baffin Bay along the southern edge. The importance of this “U-turn” will be discussed later in Sect. 3.
1.3 Some considerations about the two long-lived radium isotopes
226Ra and 228Ra are the two longer-lived isotopes of the radium quartet (226Ra with a t1∕2 of 1600 years and 228Ra with a t1∕2 of 5.8 years) and are often present at readily detectable activities that are largely unperturbed by biological activity in seawater. Thus, 226Ra and 228Ra are often considered as conservative radioactive tracers (Charette et al., 2015, 2016; IAEA, 2010; Moore et al., 1980). Both long-lived Ra isotopes are formed from the decay of different thorium (Th) isotopes (226Ra is the daughter of 230Th, whereas 228Ra is the daughter of 232Th) in terrestrial soils and marine sediments. Subsequently, they are distributed to the ocean through riverine inputs, porewater advection, and diffusion across the sediment–water interface (Charette et al., 2015). As 228Ra is more rapidly regenerated within sediments and its half-life is relatively short in comparison with 226Ra, its activity in coastal and continental shelf regions decreases rapidly away from the source towards the open ocean. Thus, 228Ra tracks the sediment–ocean or shelf–ocean transition (van Beek et al., 2007; Burt et al., 2016b; Kadko and Muench, 2005; Kawakami and Kusakabe, 2008; Moore et al., 1980, 2008; Rutgers van der Loeff et al., 1995). For the purpose of this study, we assume that 228Ra has no pelagic source. As 226Ra is released from the sediment and disperses into the water column through advective and diffusive mixing (Charette et al., 2015; IAEA, 2010; Rutgers van der Loeff and Moore, 1999), its longer half-life allows it to be distributed over great distances, often decaying within the oceanic water column (Charette et al., 2015; IAEA, 1988). A slight enrichment in Pacific Ocean deep waters, relative to deep waters of the Atlantic Ocean is primarily attributed to 226Ra uptake in the coprecipitation of barite (BaSO4) or its uptake by biological silicate or calcium tests (van Beek et al., 2007; Charette et al., 2015; Moore and Dymond, 1991). With this exception, 226Ra displays a “nearly” conservative distribution in the oceans, which facilitates its use as a long-term pelagic-based tracer of water masses and of shelf inputs (Broecker et al., 1967; Charette et al., 2015; Chung, 1980). These characteristics allow the two long-lived Ra isotopes to be used as radioactive geochemical tracers to distinguish water mass sources and their distribution patterns within the CAA.
2.1 Sample collection
During the summer of 2015 Canadian GEOTRACES cruise, 64 water samples were collected throughout the Canadian Arctic Archipelago aboard the icebreaker CCGS Amundsen at 17 different stations as a subset of the overall biogeochemical sampling (Fig. 1). Samples for dissolved inorganic carbon (DIC), total alkalinity (AT), barium (Ba), the stable oxygen isotope composition of water (δ18O), and Ra isotopes were collected at various depths from the surface to 1000 m on the upcast of a rosette system equipped with (24) 12 L Niskin bottles. Surface samples (2–12 m) for Ra were collected using an onboard pump that collected alongside the ship. In addition, temperature and salinity (SP) measurements were recorded on the downcast by a Sea-Bird SBE 9 (Seasave V 7.23.2) CTD (conductivity, temperature, and depth) probe. The CTD salinity-probe measurements were calibrated post-cruise using a Guidline salinometer in the home laboratory against discrete samples taken directly from the Niskin bottles into 250 mL screw-cap high-density polyethylene (HDPE) bottles. DIC and AT samples were collected directly from the Niskin bottles into 250 or 500 mL borosilicate glass bottles to which 100 µL of a saturated HgCl2 solution was added before being sealed with ground-glass stoppers, Apiezon® type M grease and elastic closures (Burt et al., 2016a). The bottles were then stored in the dark at room temperature or 4 ∘C until they could be processed on board. A VINDTA 3C (Versatile Instrument for the Determination of Titration Alkalinity, Marianda) was used to analyze the DIC and AT samples by coulometric titrations and potentiometric titrations, respectively (Shadwick et al., 2011a). A calibration of the instrument was performed against certified reference materials (CRMs) provided by Andrew Dickson (Scripps Institution of Oceanography), and the reproducibility of the DIC and AT measurements was better than 0.1 %.
Each Ra sample (105–215 L) was sequentially pre-filtered through 10 and 1 µm filters, either directly using the ship's pump or using a high-volume pump connected to the Niskin bottles. The Ra isotopes were then pre-concentrated by elution through manganese-dioxide-coated acrylic fiber cartridges at a constant flow rate of 1 L min−1 (Charette et al., 2001; Moore and Reid, 1973; Rutgers van der Loeff and Moore, 1999). To verify the extraction efficiency of the manganese dioxide fiber cartridge, occasionally a second fiber filter was mounted in series. 224Ra was then determined using a radium delayed coincidence counter (RaDeCC; Moore, 2008) that had been calibrated against an IAEA (International Atomic Energy Agency) distributed reference material. The detection limit was estimated to 3 atoms L−1 (0.05 dpm 100 L−1) for 224Ra (see Moore, 2008, and Moore and Arnold, 1996, for details). No 224Ra activity could be detected in any of the second cartridges mounted in series, confirming 100 % extraction efficiency. The manganese dioxide fibers were then shipped to the Woods Hole Oceanographic Institution to be ashed at 820 ∘C for 16 h, homogenized, and transferred to counting vials (Charette et al., 2001). Well-type gamma spectrometers (Canberra and Ortec high-purity germanium) were used to quantify 226Ra (via 214Pb at 352 keV) and 228Ra (via 228Ac at 338 and 911 keV) (IAEA, 2010). Each detector was calibrated with manganese dioxide fiber ash spiked with NIST-certified standard reference material 4967A (226Ra) or a gravimetrically prepared Th(NO3)4 solution with the 228Ra daughter in secular equilibrium with its parent 232Th. Detection limits, calculated using the Currie Hypothesis test (De Geer, 2004), were determined to be 0.2 dpm for both 226Ra and 228Ra (Gonneea et al., 2013), which is equivalent to ∼0.15 dpm 100 L−1 for a typical 130 L sample.
Barium (Ba) concentrations were determined in water transferred directly from the Niskin bottles to 30mL HDPE plastic bottles containing 15 µL of concentrated ultrapure hydrochloric acid (Thomas et al., 2011). Each subsample was then analyzed by isotope dilution using sector field inductively coupled plasma mass spectrometry (SF-ICP-MS, Element 2, Thermo Finnigan) in Brussels. The instrument was run in the low mass resolution mode . The limit of detection and limit of quantification based on blank analyses were 0.06 and 0.20 nM, respectively (LOD =3X SD blank; LOQ =10X SD blank). Reproducibility of multiple measurements of reference materials (SLRS5; SLRS3; OMP) was ≤2.5 %. Details of the instrument's operational conditions are given by Thomas et al. (2011). The barite saturation state (Qi) is the ratio of the aqueous barium and sulfate ion activity product (Q(BaSO4, aq)) to the barite solubility product (KSp):
As described in greater detail by Thomas et al. (2011), Qi was computed according to Monnin (1999) and Hoppema et al. (2010).
Samples destined for the measurement of the stable oxygen isotope composition of seawater (δ18O) were taken directly from the Niskin bottles into 13 mL screw-cap plastic test tubes (Lansard et al., 2012). The samples were analyzed at the Geotop-UQAM stable isotope laboratory using the CO2 equilibrium method of Epstein and Mayeda (1953) on a Micromass Isoprime universal triple collector isotope ratio mass spectrometer in dual-inlet mode (Mucci et al., 2018) at the Geotop-UQAM Light Stable Isotope Geochemistry Laboratory. The data were normalized against three internal reference waters, which had been calibrated against Vienna Standard Mean Ocean Water (V-SMOW) and Vienna Standard Light Arctic Precipitation (V-SLAP). Data are reported on the δ-scale in per mill with respect to V-SMOW, and the average relative standard deviation on replicate measurements is better than 0.05 ‰.
2.2 Principal component analysis
Principal component analyses (PCAs) were performed to quantitatively determine the correlation between variables as well as the affinity between each of the samples to arbitrary components, while reducing the effects of random variation by using a correlation matrix (Gunasekaran and Kasirajan, 2017; Jolliffe and Cadima, 2016; Pearson, 1901; Peres-Neto et al., 2003). In this study, associated or derived variables such as the radium isotopic ratios were excluded from the PCAs due to the congruency with other incorporated variables. Prior to statistical analysis, the variables from each station and depth were transformed to fit a near-normal distribution and were normalized to satisfy the parameters of the analysis. Interpolations of the δ18O and Ba data were made with respect to salinity, as samples were not collected at every depth at each station. The interpolations were verified relative to the original data by means of linear regression and comparison of slopes. Only three surface data samples were interpolated for Ba samples, all from within Baffin Bay. After interpolation and normalization, each sample was categorized by depth: surface, middle depth, deep archipelago, or deep Atlantic, ranging from 0 to 20, from 21 to 80, from 81 to 500, and below 500 m, respectively.
In addition, quantitative analyses of the PCA results were conducted using a broken stick analysis as a means to distinguish the loading significance of each variable. To this end, eigenvectors were scaled to V-vectors (product of eigenvector multiplied by the square root of the specific eigenvalue) and V2 vectors (V-vectors2) (Jackson, 2004; Peres-Neto et al., 2003). End-members were calculated for each of the variables significantly loading on PC1 from the derived partial values (eigenvector for associated variable multiplied by the PC score for that sample). Each partial value was then de-normalized and back-transformed, thereby deriving a refined rendition of the original data set (Table A1). Lastly, linear regressions of each variable against the practical salinity were plotted to express robust end-member relationships from within the previously categorized salinity-defined water masses present throughout the CAA. We report the respective end-members as “apparent end-members”, as they resemble the mean end-member properties in the CAA. For example, an apparent freshwater end-member at null practical salinity (SP=0) would be composed of various individual river and meteoric water end-members, in consideration of their relative weights in this composite. As 228Ra originates from shelf sediments, which in our study are primarily located in waters at the lower salinity (SP≈25) range of the CAA, the 228Ra end-member was derived from the linear regression to SP=25 (e.g., Rutgers van der Loeff et al., 2003).
3.1 Water mass properties
Surface values of SP, density, DIC, AT, and δ18O were found to increase from west to east through the CAA (Figs. 1, 2a, c, d, f, g, A1). This trend was extended to the temperature profiles taken throughout the CAA, with the exception of station CAA5, which was found to closely resemble the temperature profile of CAA3 (Figs. 2b, A1). Prinsenberg and Bennett (1987) reported similar trends employing samples collected in 1982 across Barrow Strait, a sill less than 200 m deep located roughly between 105 and 90∘ W, where analogous transects for salinity and temperature were recorded throughout the surface layer (Fig. 1). This is both the widest and shallowest section of the CAA. It is responsible for restricting the eastward flow of deep ATL waters found in the western Canada Basin and inhibiting high salinity (SP>33.1) ATL water within Baffin Bay from venturing westward (Hamilton and Wu, 2013; Jones, 2003; Prinsenberg, 1982; Prinsenberg and Bennett, 1987; Shadwick et al., 2011a; Yamamoto-Kawai et al., 2010).
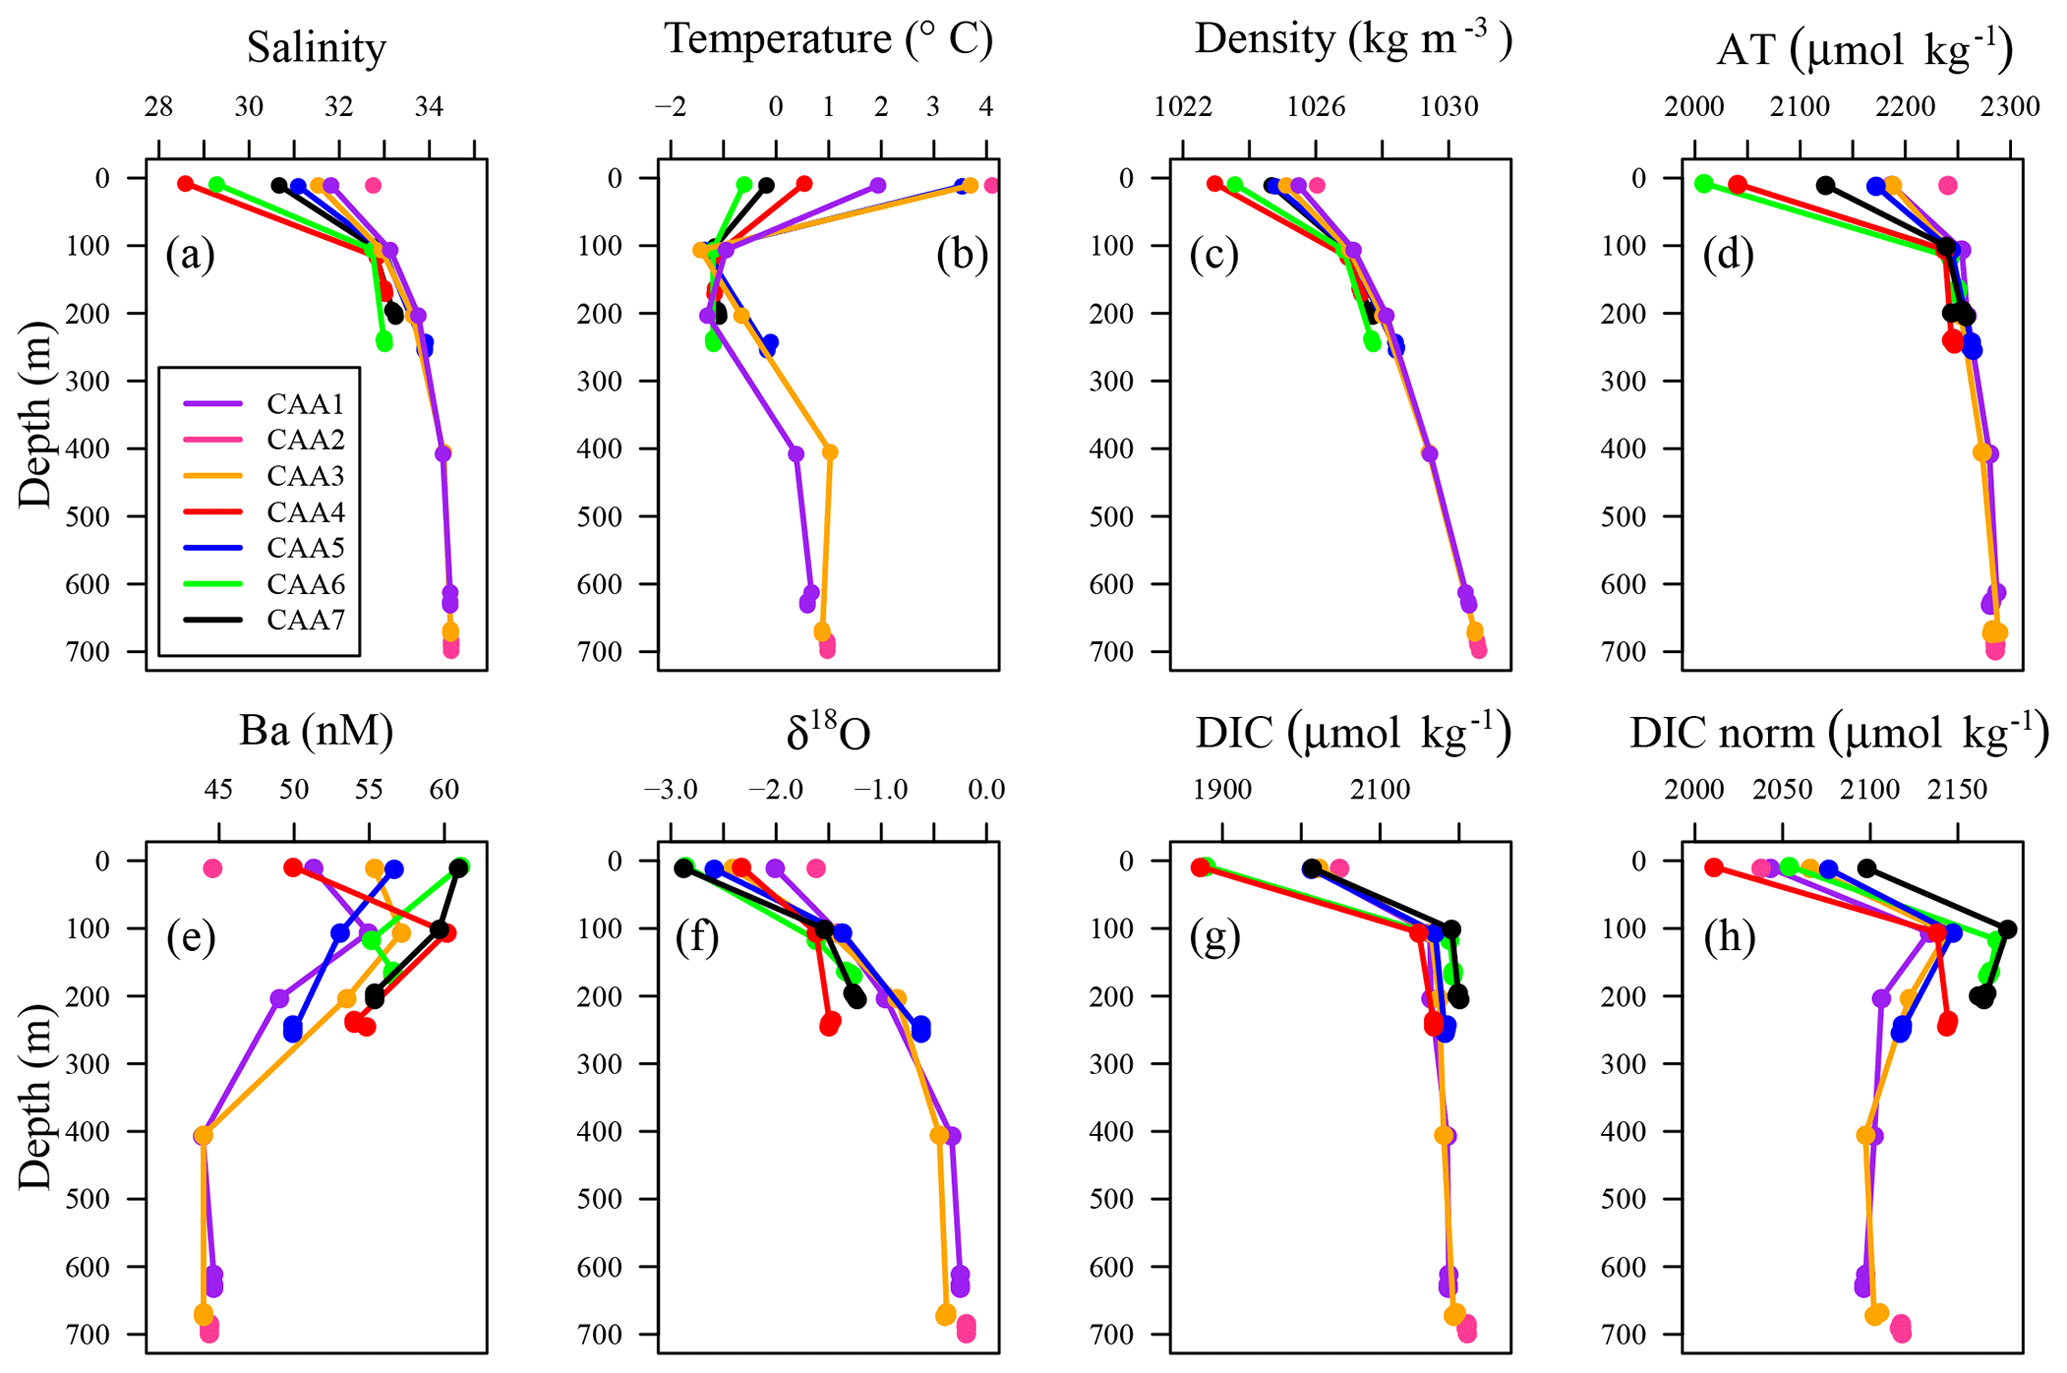
Figure 2Vertical distributions of (a) practical salinity, (b) temperature, (c) density, (d) AT, (e) Ba, (f) δ18O, (g) DIC, and (h) normalized DIC (DICnorm) observed at stations CAA1 to CAA7 throughout the CAA.
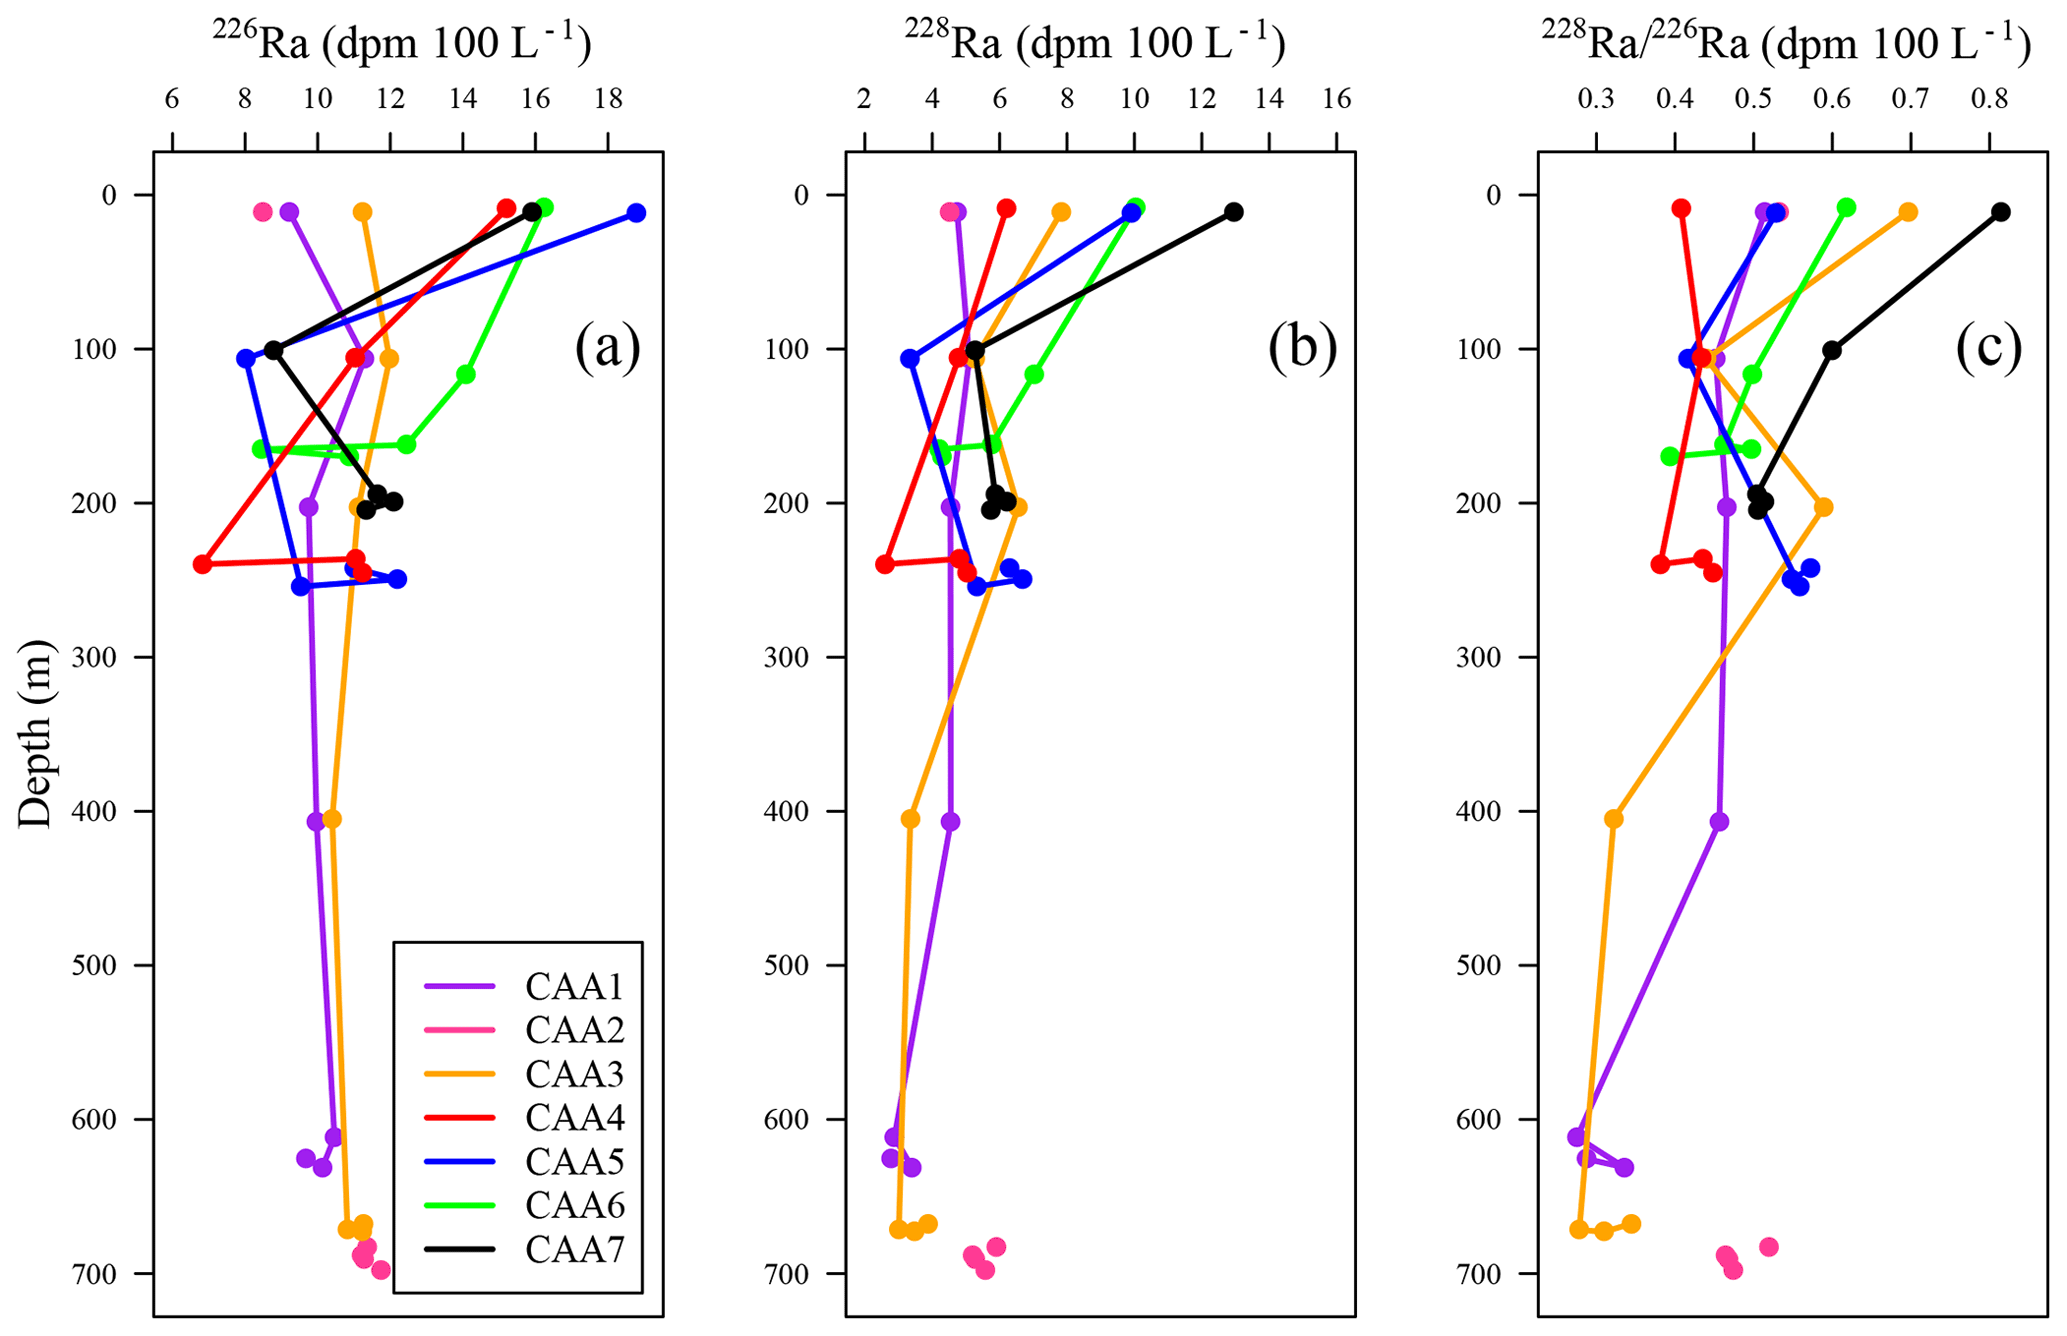
Figure 3(a) 226Ra, (b) 228Ra, and (c) 228Ra∕226Ra profiles ranging from the surface to depth for stations CAA1 to CAA7 (where pink dots indicate station CAA2, which was only sampled at the surface and bottom) throughout the Canadian Arctic Archipelago.
In contrast, dissolved Ba, 226Ra, and 228Ra decreased eastward both at the surface as well as at the mid-depth maximum. This is assumed to reflect the elevated flow rates, increasing distance from their source within the CAA, and proximity to the Ba- and 228Ra-depleted ATL waters in Baffin Bay (Figs. 2e, 3, A1, A2; Thomas et al., 2011). Most often, the 228Ra∕226Ra decreases with depth (Fig. 3c), but occasionally it follows a more complex spatial pattern, which will be discussed later.

Figure 4Total alkalinity (AT) vs. salinity (SP) measured throughout the CAA with the colors indicating (a) depth and (b) longitude. A linear regression analysis yields AT (R2=0.91).
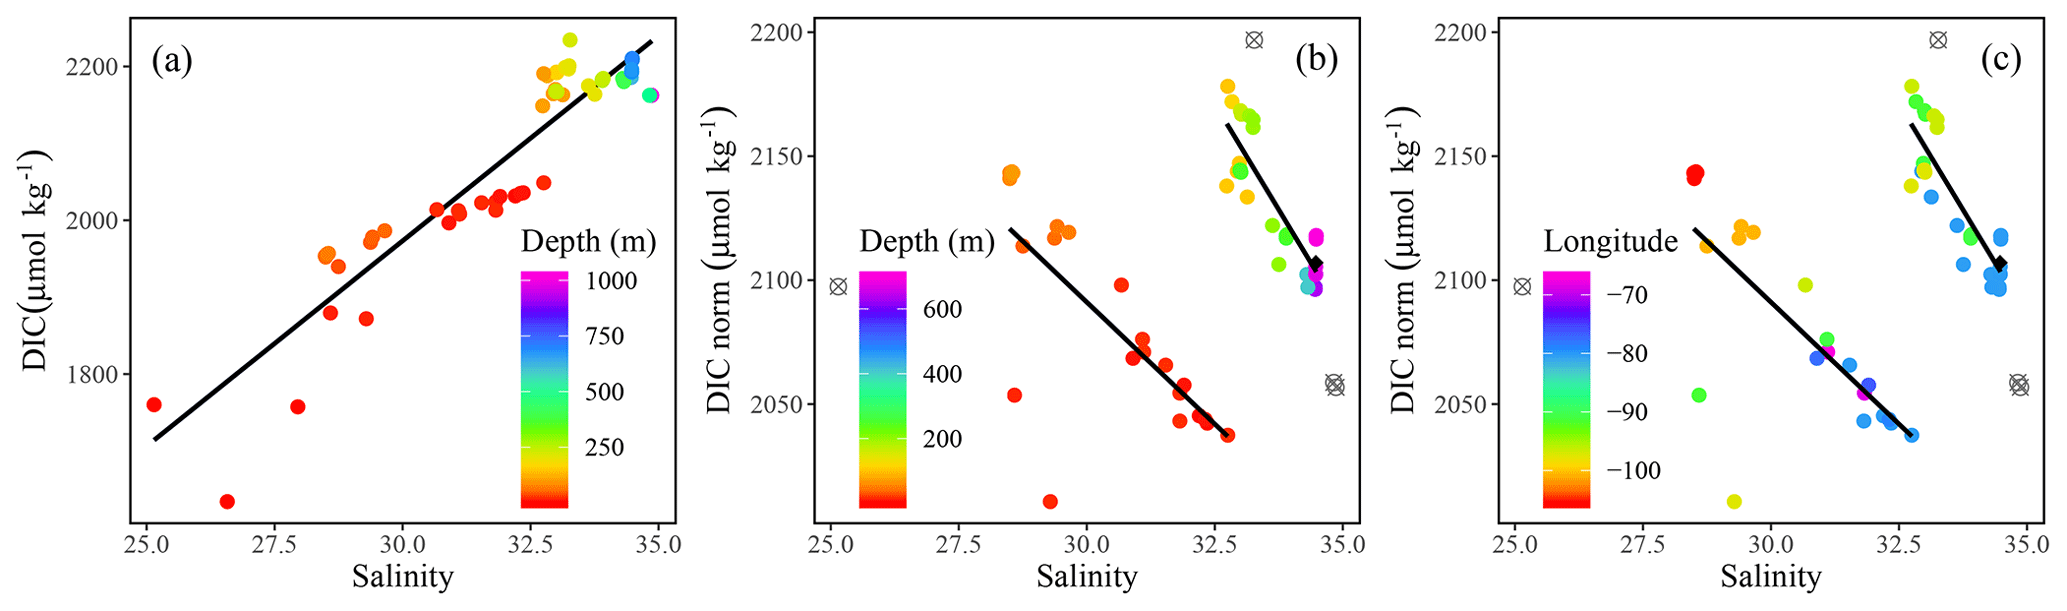
Figure 5(a) Dissolved inorganic carbon (DIC) and (b) salinity-normalized dissolved inorganic carbon (DICnorm) were plotted against salinity (SP) with the colors indicating (a, b) depth (m) and (c) longitude. The DIC vs. SP regression yields DIC (R2=0.86). The DICnorm vs. SP plots were fitted with a piecewise regression analysis representing the surface, DIC (R2=0.5), and at depth, DIC (R2=0.76). In panels (b) and (c) CB4 was excluded from the piecewise regression (represented by unfilled, crossed out gray circles), whereas the surface samples from stations 312 and 314 were excluded entirely. The black diamonds identify the average Atlantic deep-water samples from stations CAA1, CAA2, and CAA3.
Positive relationships between DIC and AT vs. SP (Figs. 4 and 5a for regression intercepts and error) indicate the importance of freshwater inputs from sea-ice melt (SIM) and meteoric water (MW; surface runoff and direct precipitation). These freshwater additions contribute to the low AT and DIC found in the surface PML waters of the stations west of 96.5∘ W (Figs. 1, 2, 4, 5c). The highest DIC concentrations were observed at the pycnocline of the westernmost station (CB4; Figs. 2, 4, 5a, A1). This maximum in metabolic (respiratory) DIC decreased slightly eastward due to the increasing contribution of low-DIC ATL waters (Fig. 5a; Shadwick et al., 2011a). AT, lacking the metabolic maximum witnessed within the DIC samples, increased linearly with depth and eastward (Figs. 2d, g, 4). This is explained by the concomitant increase in AT and SP values, rather than a decrease associated with metabolic activity, thus distinguishing AT from DIC (Burt et al., 2016a; Shadwick et al., 2011a; Thomas et al., 2011).
Despite the intrusion of deep Atlantic Ocean waters throughout the CAA (Jones, 2003; Newton and Coachman, 1974), CB4 (in the Canada Basin) displays different ATL, UHL, and PML water mass characteristics than those observed at stations within the CAA (Figs. A1, A2). Hence, for the remainder of this study, we will omit data from CB4 from our discussion of the circulation in the CAA, although we will return to the role and positioning of CB4 in relation to the CAA waters later, particularly in relation to the 228Ra∕226Ra.
In order to identify water mass distributions and mixing regimes within the CAA, DIC was normalized to a constant salinity (DICnorm) (Eq. 2). This approach accounts for the influence of fresh water inputs, thereby highlighting possible nonconservative behavior related to biological processes at the timescale of mixing (Friis et al., 2003; Shadwick et al., 2011b).
DICnorm decreases eastward in surface waters along the eastward bulk flow throughout the CAA, consistent with observations that surface DIC values were lowest in the western samples (Figs. 1, 2g, h, 5b, c). The reversal in trend reflects the decrease in accumulated respiratory DIC as waters flow eastward through the CAA. The presence of two distinct water masses was highlighted by the DICnorm–SP relationship, distinguishing the surface (PML) from subsurface samples (Figs. 1, 5c), within each of which mixing processes control the DICnorm distribution. The two water masses themselves, however, hardly mix. A similar water mass grouping has been proposed based on Ba distributions in waters above and below the UHL (Figs. 2, 5b, c; Shadwick et al., 2011a; Thomas et al., 2011).
3.2 The use of radium isotopes as water mass tracers
Radium isotopes, specifically 226Ra, 228Ra, and their ratio (228Ra∕226Ra), were used as proxies to reconstruct the water mass distribution throughout the CAA. Like the chemical constituents DIC, AT, δ18O, and Ba, as well as the stable oxygen isotopic composition of waters, Ra isotope activity and ratios were found to vary between stations, with depth, and across water masses (Fig. A2). The highest 228Ra activities were observed at the surface, particularly at the shallow stations 312 and 314, located in the center of the CAA, indicating the 228Ra source in coastal sediments (Figs. 1, 6). Lower 228Ra activities were found at higher salinities and depths, comparable to values reported by Burt et al. (2016a) in the North Sea, where elevated 228Ra activities were present within the shallow, lower salinity waters. Like the DICnorm–SP relationship, the 228Ra–SP relationship (Figs. 5b, c, 6) reveals two distinct water masses that distinguish the surface (PML) from subsurface waters. For the surface sample grouping, a negative slope (228Ra–SP) was obtained (slope ), whereas for the deeper samples a less negative slope was found (slope ). The more negative slope, associated with the surface samples collected throughout the CAA, indicates that the system is heavily influenced by the influx of 228Ra from the CAA shelf sediments (Fig. 6). In contrast, the slope derived from the 228Ra activities recorded in the deeper waters of the CAA may imply that these samples originate from an open-ocean setting, which has had minimal (or much less) contact with the continental shelf or coastline sediments over the past few decades. As noted earlier (Figs. 3, 6b), the 228Ra activities decrease from west to east through the CAA in both the surface and deep samples. These values are interpreted as reflecting the mixing of Pacific waters with Atlantic (Baffin Bay) waters east of Barrow Strait. We provide a more detailed analysis of the 228Ra activity distribution pattern below (Sect. 3.3.1).
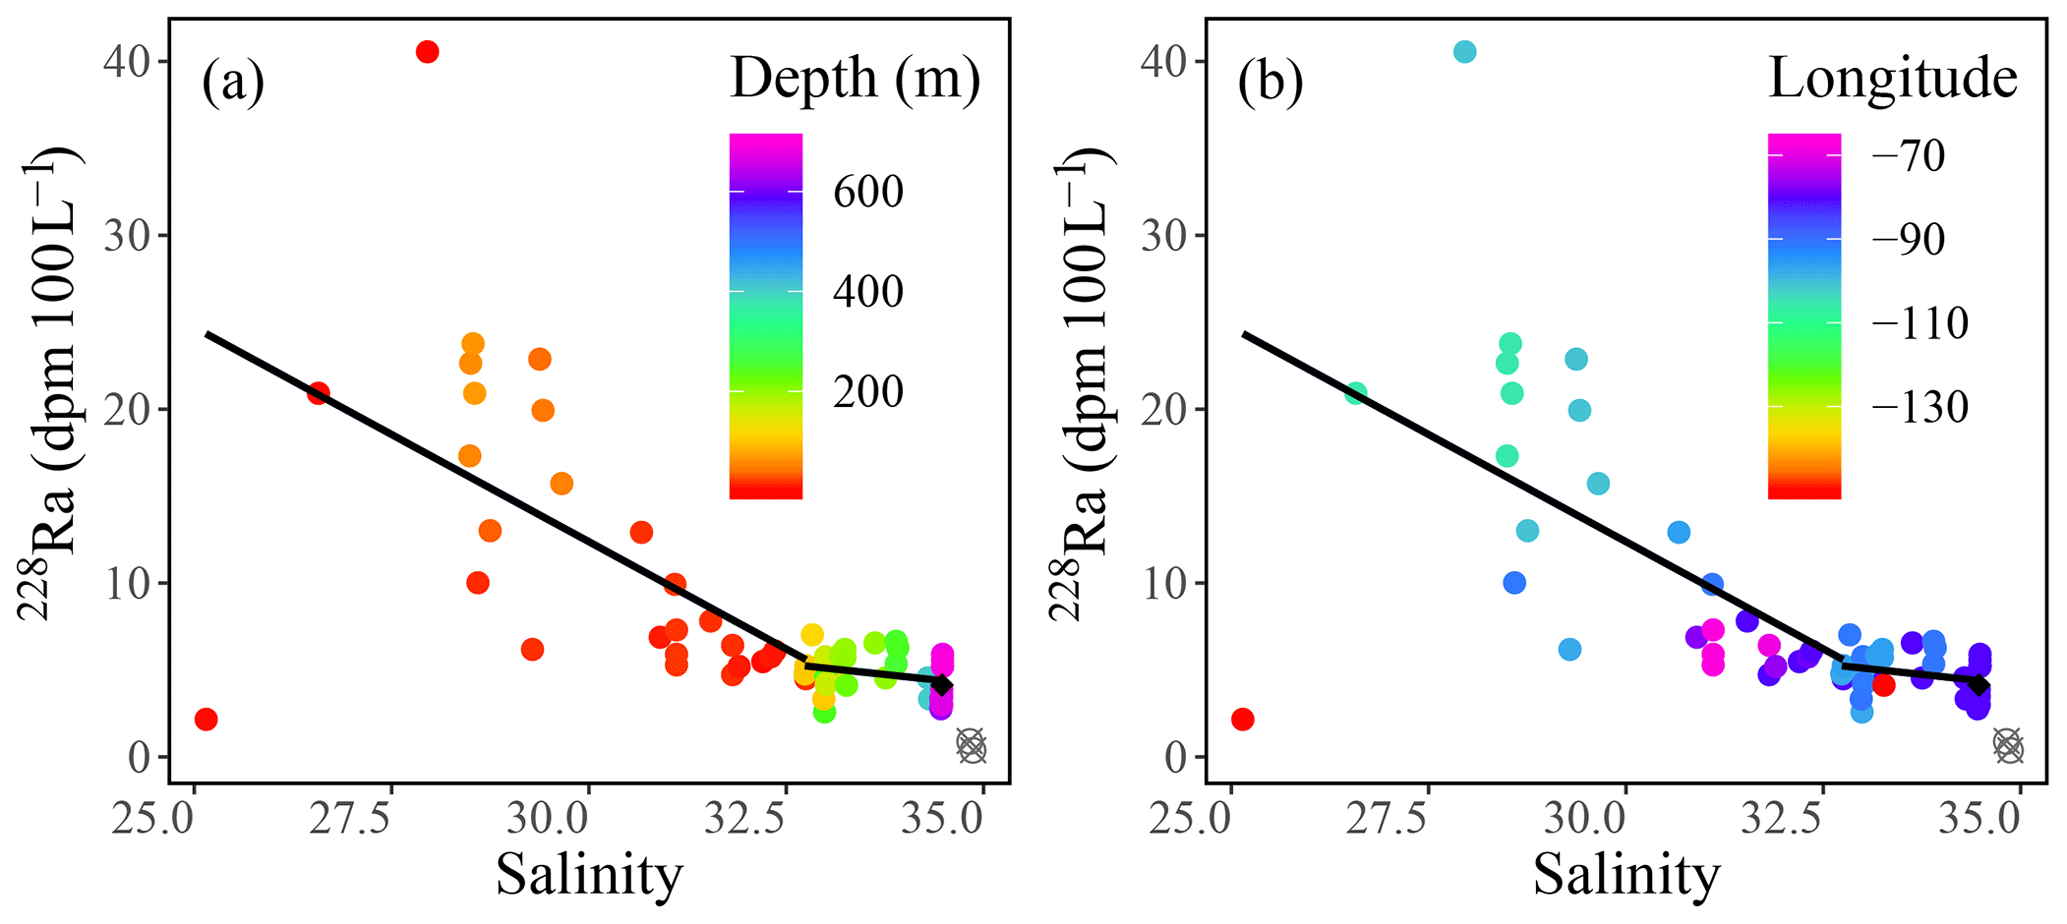
Figure 6228Ra (dpm 100 L−1) plotted against practical salinity (SP), with the color indicating (a) depth and (b) longitude, fitted with a piecewise regression excluding the deep stations of the Canada Basin (gray circles) and yielding (R2=0.28) for the surface trend (0–80 m) and (R2=0.07) for the deep trend (>80 m). The average of Atlantic deep waters sampled from stations CAA1, CAA2, and CAA3 is defined using a black diamond.
3.3 Characterizing water masses and isolating end-members through principal component analysis (PCA)
Further investigation of the dominant water mass patterns was undertaken through principal component analyses (PCAs). The first and second principal components (PCs) accounted for 59.1 % and 17.5 % (total 76.6 %) of the variability in the data, respectively (Fig. 7, Table 1). The third PC accounted for a further 13.2 % of the variability (89.8 % in total). The fourth and fifth PCs together accounted for less than 10 % of the variability and were not included in subsequent analyses. PC1, in turn, was inverted to establish apparent end-members of the source waters found in the CAA (Sects. 3.3.2 and 2.2).
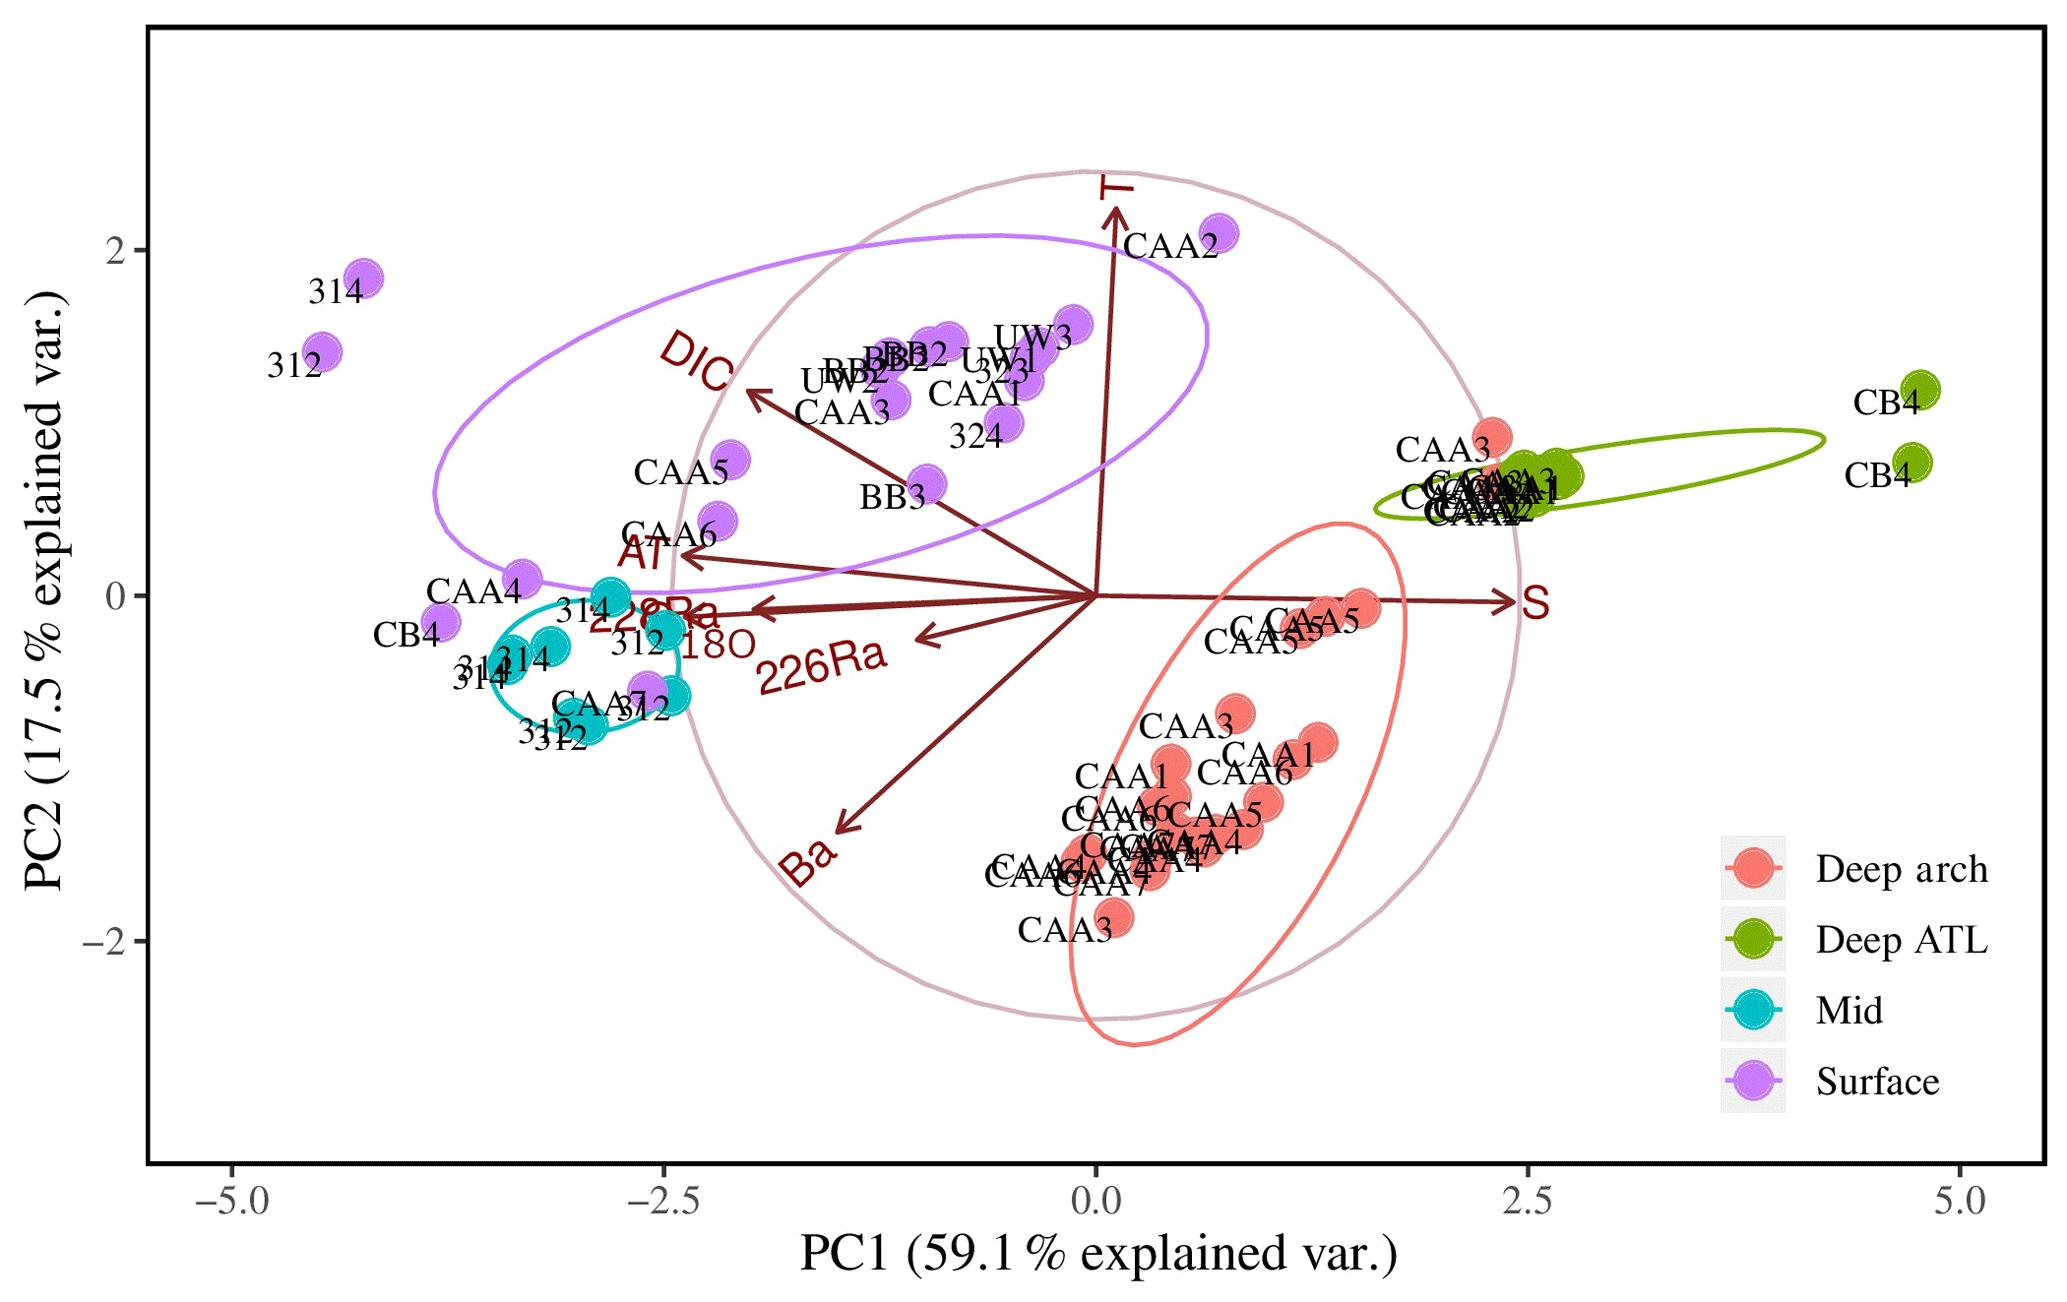
Figure 7Eight-variable principal component analysis (PCA) of PC1 and PC2 for 64 samples from 17 stations throughout the Canadian Arctic Archipelago, distinguished by depth groupings: surface (0–20 m; purple), mid (20–80 m; blue), and deep archipelago (deep arch, 80–500 m; red), and deep Atlantic (deep ATL, >500 m; green). The sample collected at station CB4 at a depth of 200 m was excluded from this plot. The ellipses represent 95 % confidence intervals associated with each water mass grouping.
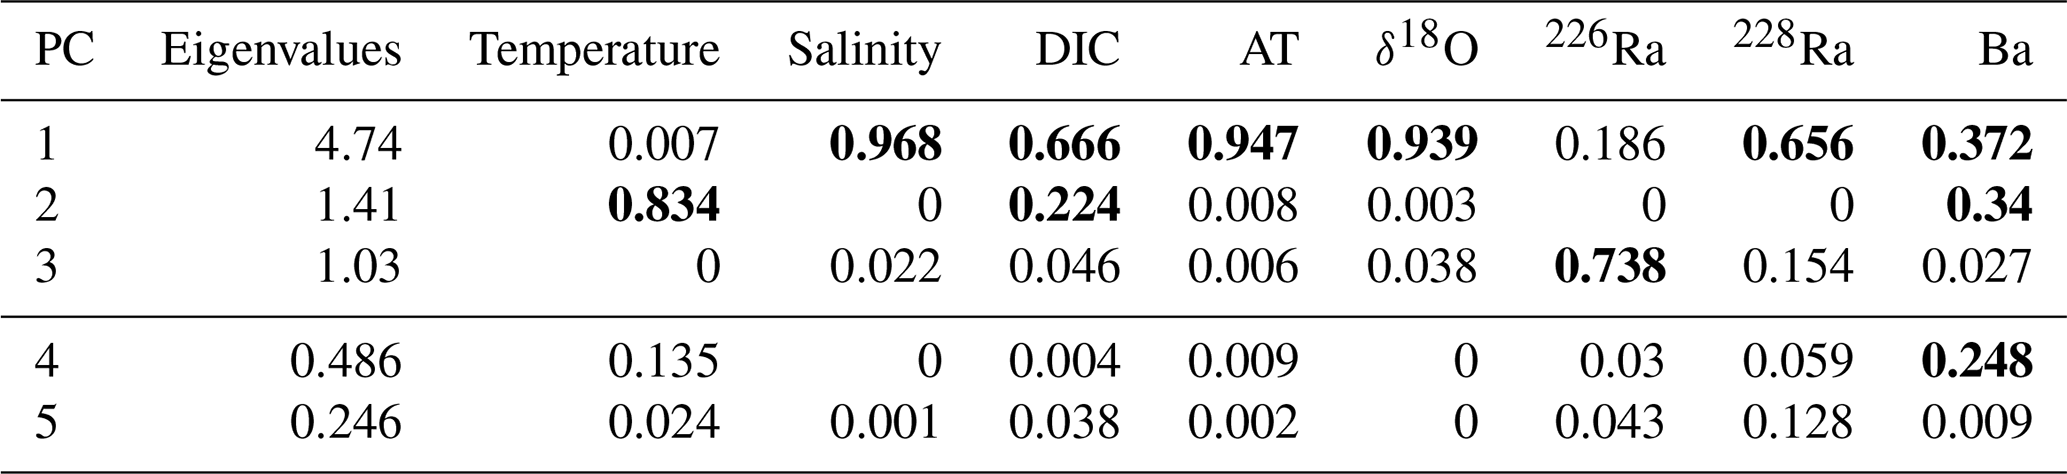
Table 1Eigenvalues and normalized V2 vectors for transformed and normalized temperature, salinity (SP), dissolved inorganic carbon (DIC), total alkalinity (AT), δ18O, 226Ra, 228Ra, and barium (Ba), where bold values represent significant weight attributed to that principal component (where PC 4 and 5 were not analyzed – bottom two rows) derived from the original eight-variable PCA (Fig. 7).
3.3.1 Qualitative analysis of PCA
Surface water mass distinction
The first PC (PC1) loaded very heavily on salinity, AT, and δ18O, accounting for 94 %–97 % of the variability in each (see Table 1). It also loaded heavily on DIC and 228Ra (67 % and 66 % of variability) and less heavily on Ba (37 %). The latter five transformed parameters were all inversely correlated with the transform of salinity (Fig. 7). The second PC (PC2) loaded heavily on temperature (83 % of variability) and relatively weakly on DIC (a further 22 % of variability for a total of 89 % between PC1 and PC2) and Ba (34 %, for a total of 71 % between PC1 and PC2). There is a correlation between temperature and DIC (Fig. 7), so the component of DIC accounted for by PC2 cannot be ascribed to temperature-dependent solubility. The third PC (PC3), which only accounted for 13.2 % of the variability in the data, loaded on 226Ra (74 % of its variability) and was the only PC that did so.
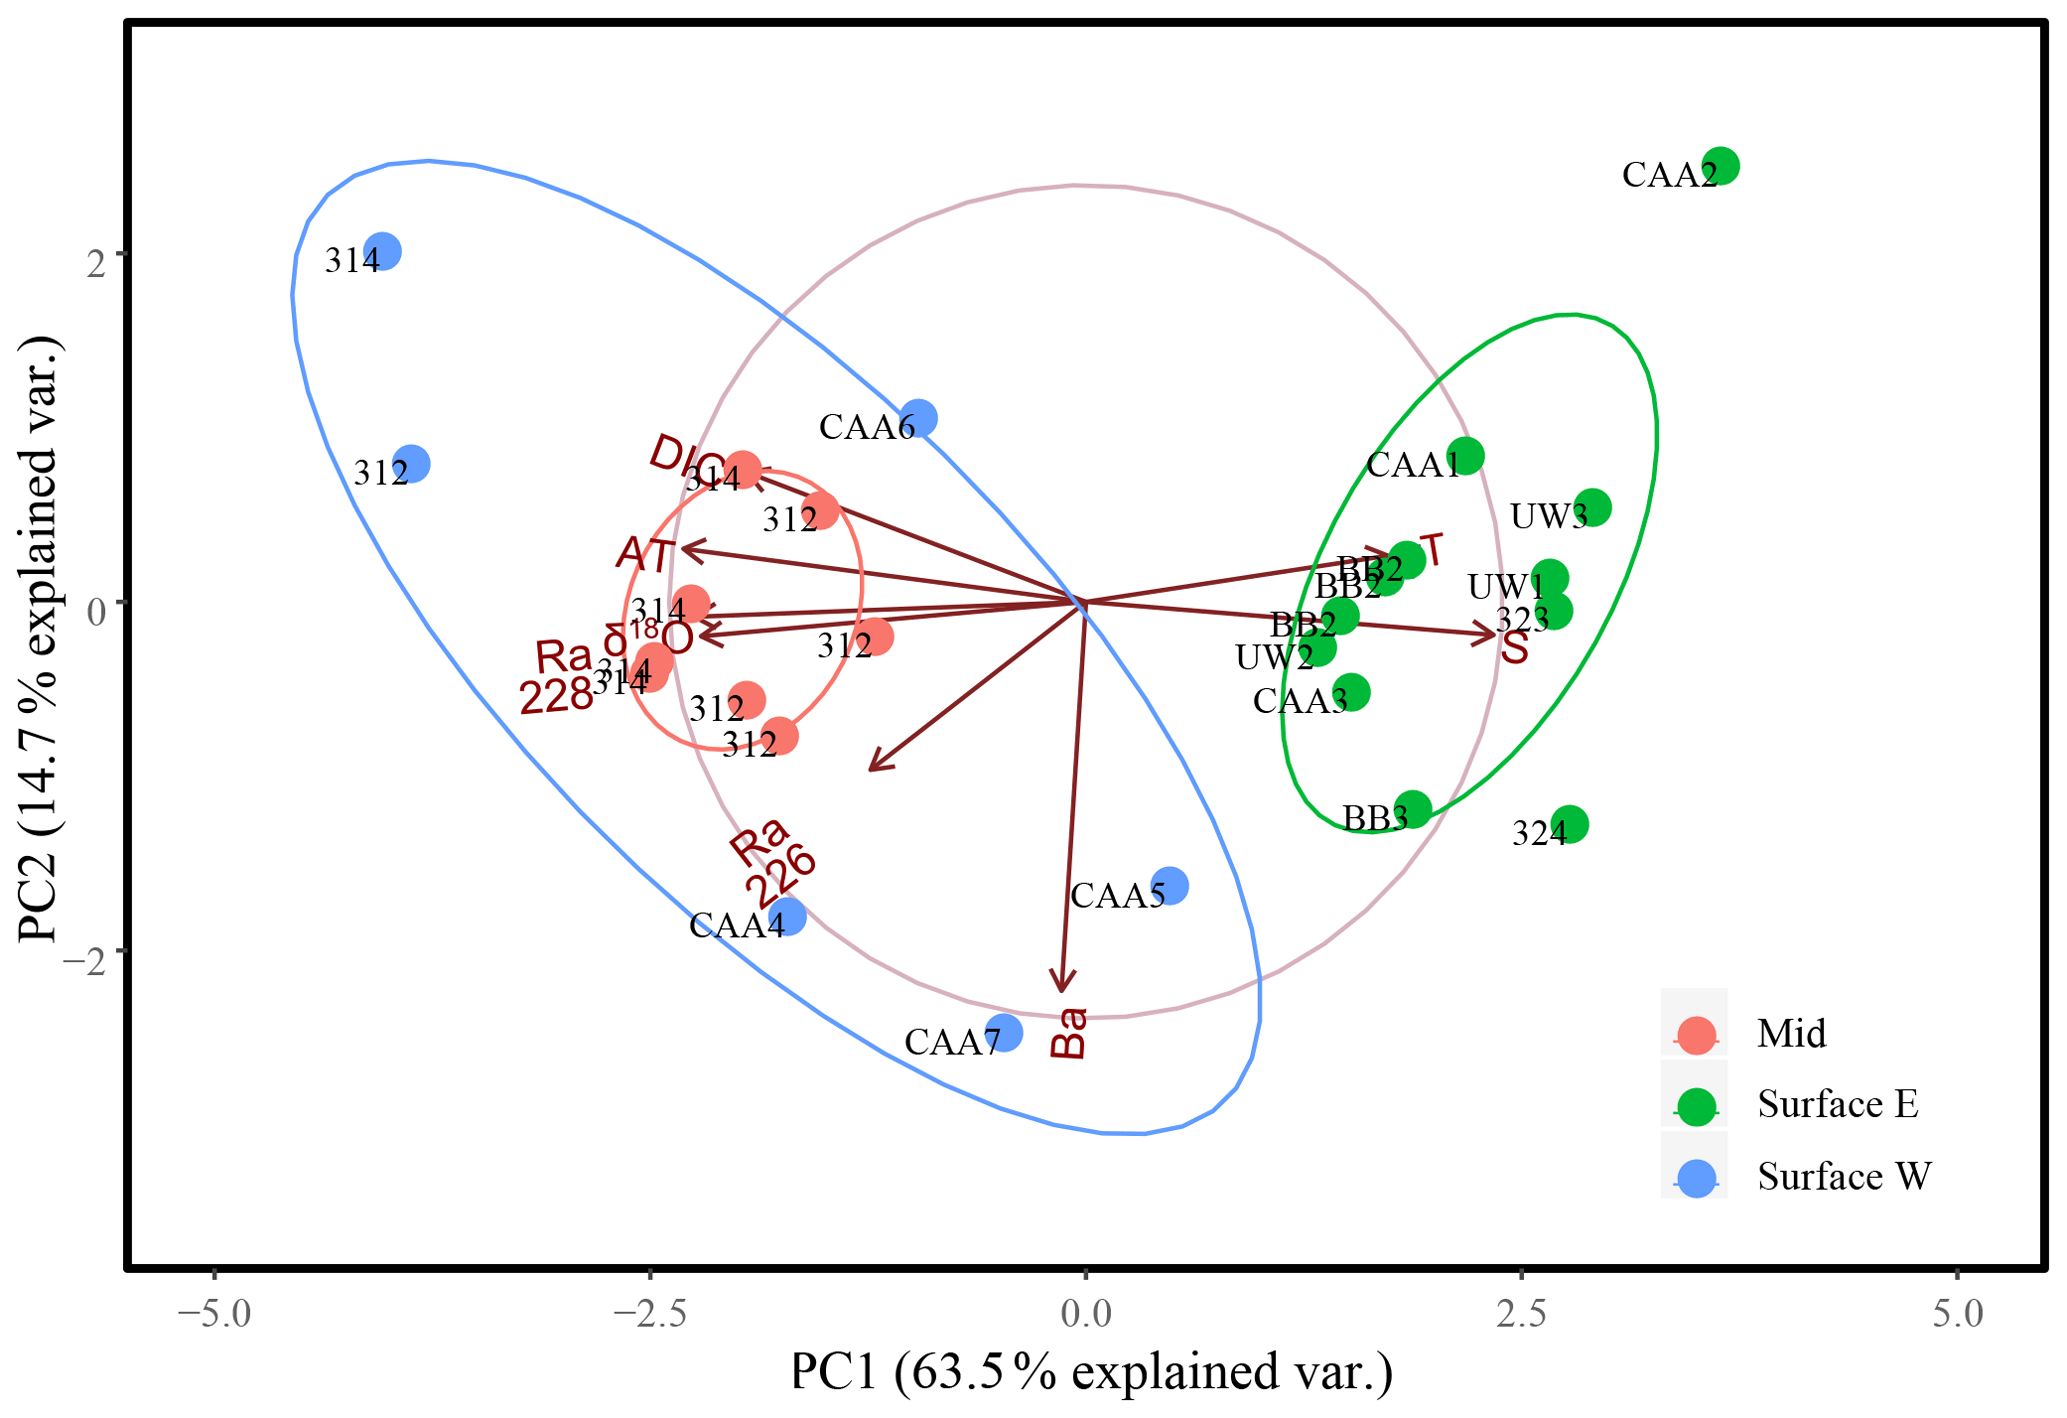
Figure 8Eight-variable principal component analysis of surface samples (0–20 m), east (green, east of 85∘ W) and west (blue, west of 85∘ W), and mid-depth (20–80 m; red) samples collected throughout the Canadian Arctic Archipelago analyzing PC1 and PC2 for 27 samples from 17 stations, with the exception of the surface sample collected at station CB4, which was excluded from this plot. The ellipses represent 95 % confidence intervals associated with each water mass grouping.
The ordination of samples on PC1 and PC2 shows a strong separation between surface and mid-depth samples vs. deep samples (Fig. 7), reflecting the consistent differences in their parameter values (Figs. 2, 3, 4, 5, 6). Variability within surface and subsurface layers was examined by rerunning the analysis, using only these data, to minimize the influence of the systematically different deep-water data on their ordination. The restricted analysis retained most of the parameter relationships observed in the full PCA (Figs. 7, 8). The first PC explained slightly more of the variability (63.5 % vs. 59.15 %), while the second PC explained slightly less (14.7 % vs. 17.5 %), for a total of 77.2 % vs. 76.7 %. There was strong loading of salinity, AT, δ18O, DIC, and 228Ra on PC1, with the latter four transformed parameters being inversely correlated with the transform of salinity. In contrast, temperature was strongly correlated with salinity rather than orthogonal to it, and Ba was strongly loaded on PC2.
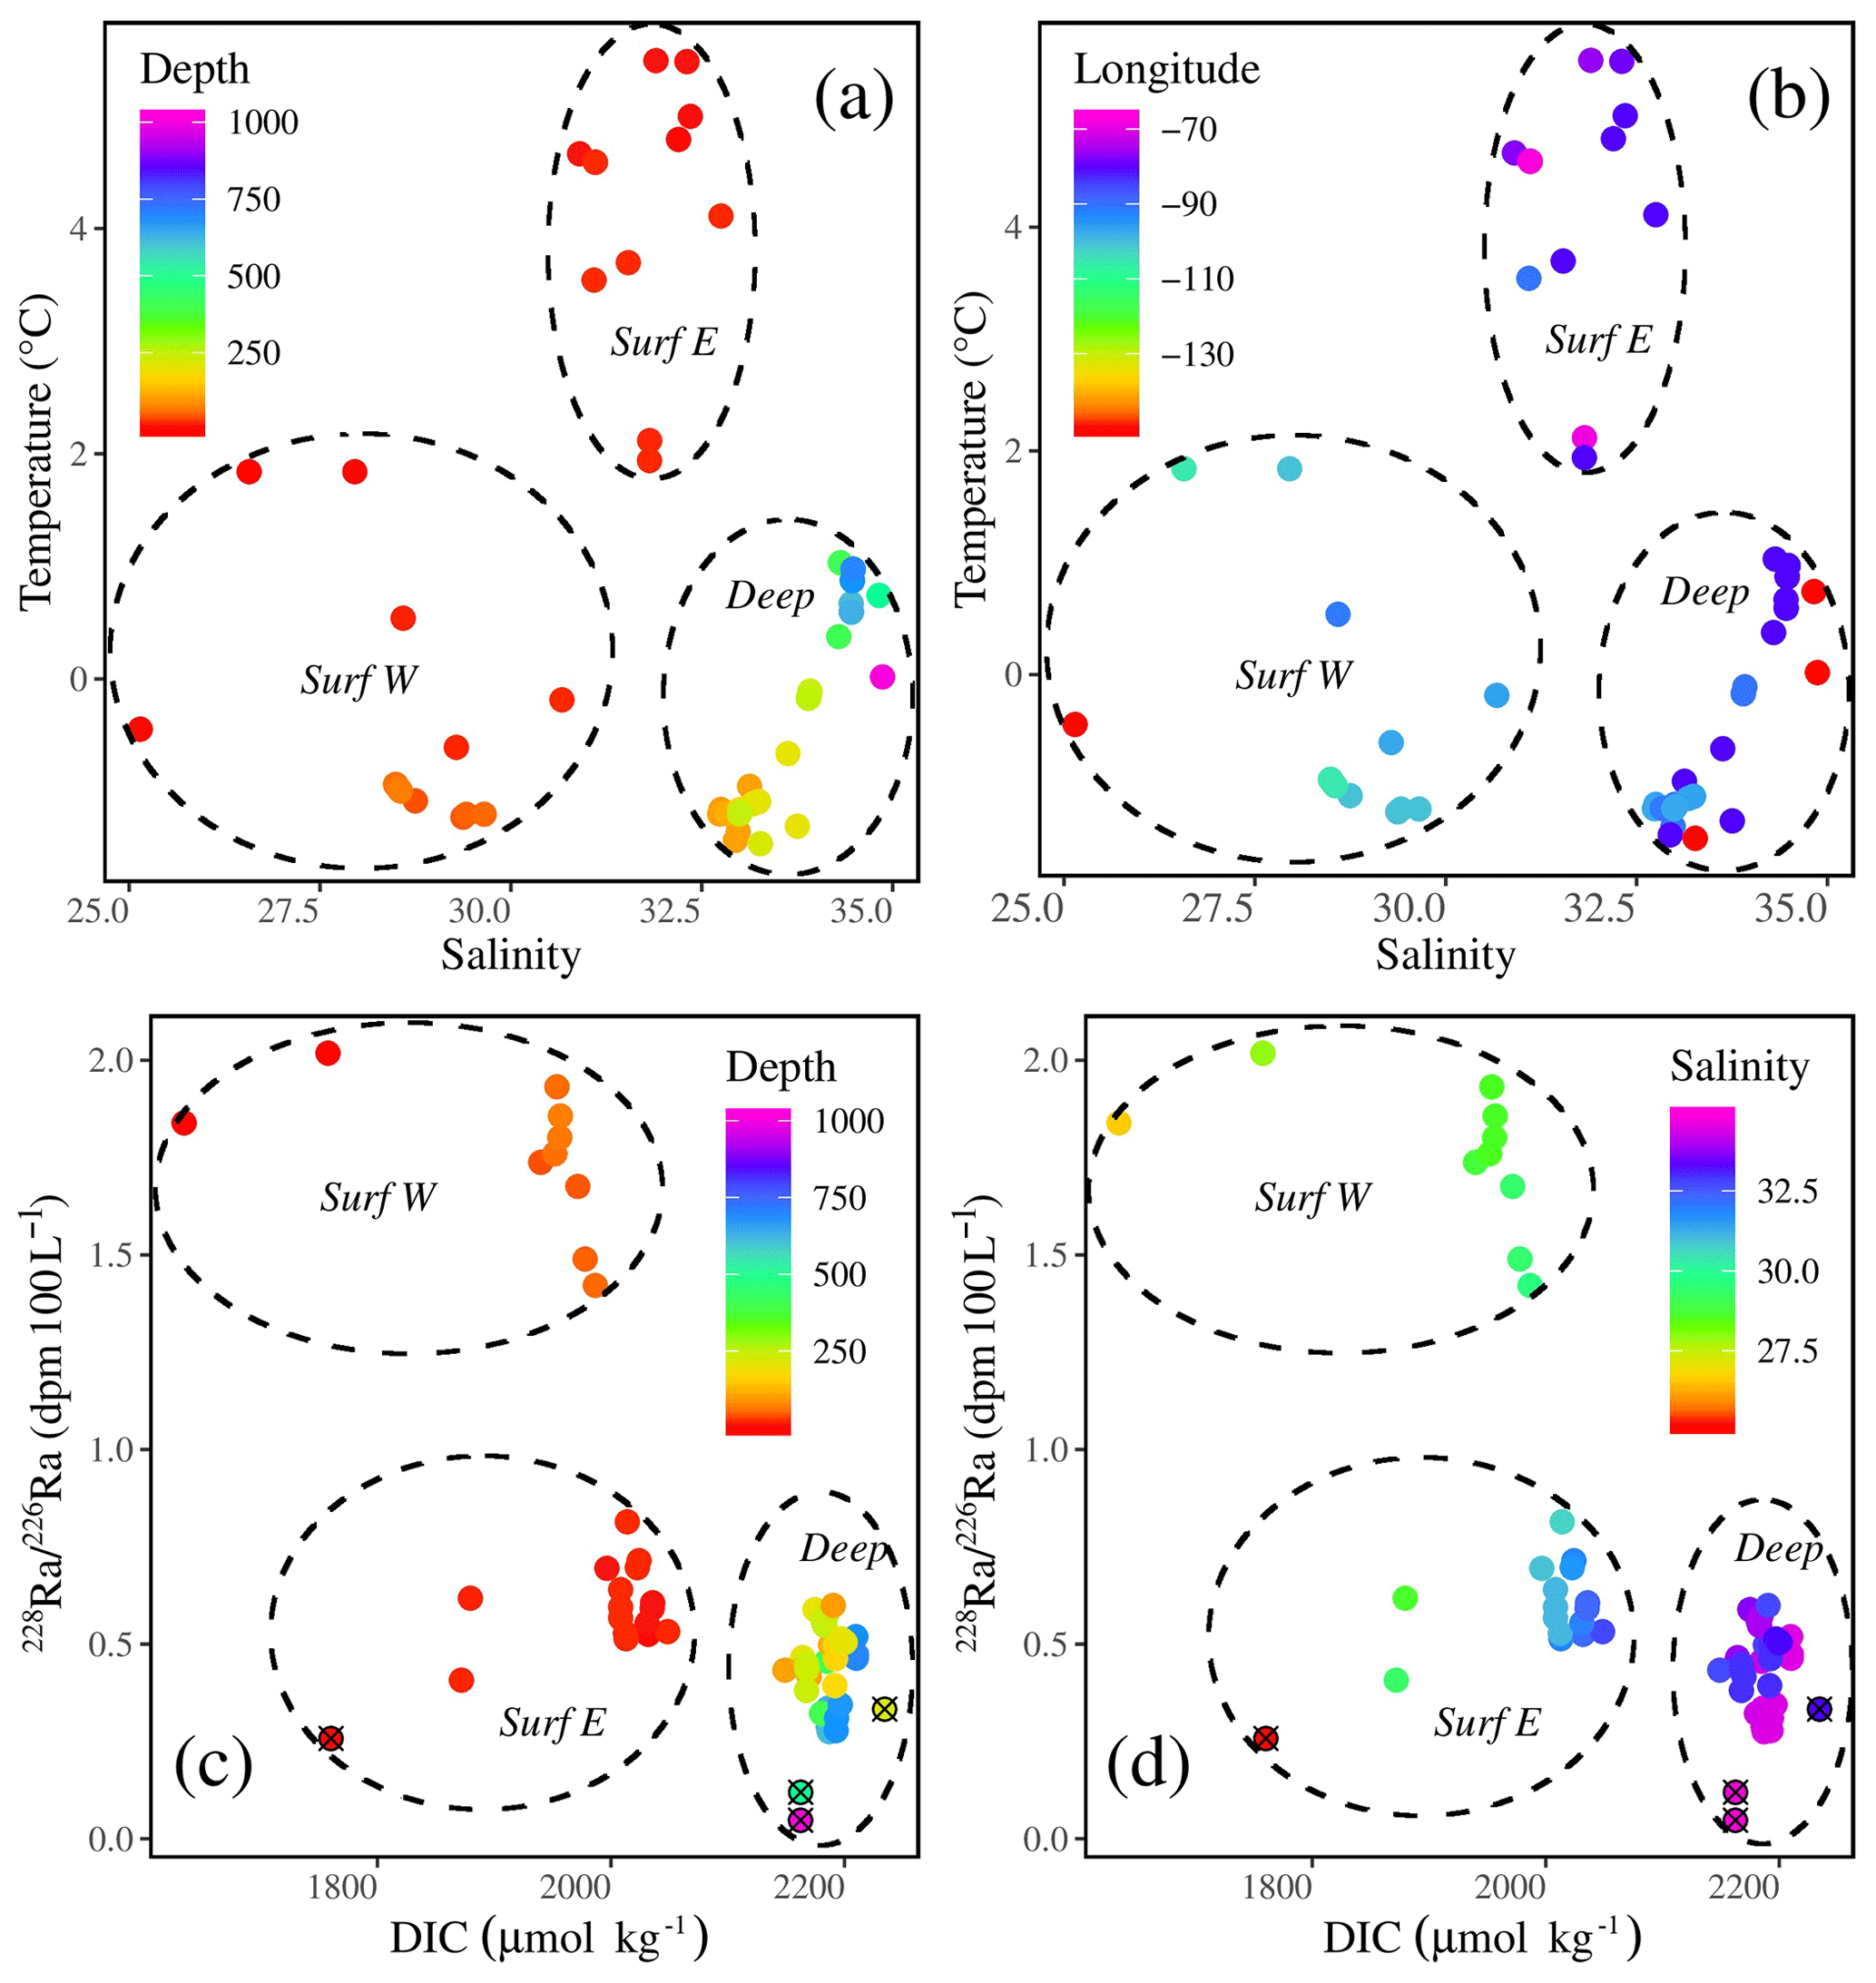
Figure 9Temperature–salinity plots with the colors indicating (a) depth and (b) longitude. Radium isotopic ratio (228Ra∕226Ra)–DIC plots with the colors indicating (c) depth and (d) salinity, highlighting three water masses throughout the CAA: the two surface water masses, the western surface (Surf W) and eastern surface (Surf E) waters, and one water mass (Atlantic) at depth (Deep). In panels (c) and (d), station CB4 has been denoted using a circle and cross.
The re-ordination of the surface and mid-depth data indicates a strong geographic separation of the samples on PC1 (Fig. 8), which is also evidenced by temperature–salinity (T–S) and 228Ra∕226Ra–DIC plots (Fig. 9). The first surface group comprises samples from the eastern edge of the CAA, under the influence of Atlantic waters, which enter the CAA via Baffin Bay and Lancaster Sound. The second group comprises the PML-influenced surface samples from the two southern interior CAA stations (312 and 314) and the northwestern CAA stations (CAA4–CAA7) as well as the mid-water samples (also from stations 312 and 314). It is worth noting that the outermost western surface samples, likely best visible in the bottom-left quadrant of Fig. 9b, came from station CB4. This attribution will be explained later with reference to the apparent end-member properties.
Distinction of deep-water masses and indication of flow
The ordination in the initial PCA is analogous to a T–S diagram, given that PC1 loads on salinity and its covariates and PC2 loads most heavily on temperature. There are very strong similarities between deep-water samples collected in Baffin Bay (Fig. 7; deep ATL). The deep-water samples within the CAA are ordinated along a gradient between the deep ATL samples and an end-member that would have negative factor loadings on PC1 and PC2. This would likely be Pacific water. The two deep samples from the westernmost station, CB4, are anomalous (Fig. 7). Their ordination suggests that they are an end-member for the deep ATL water, likely deep ATL waters that flow west past Svalbard, before crossing the Lomonosov Ridge and accumulating in the Canada Basin (Coachman and Barnes, 1963; Newton and Coachman, 1974).
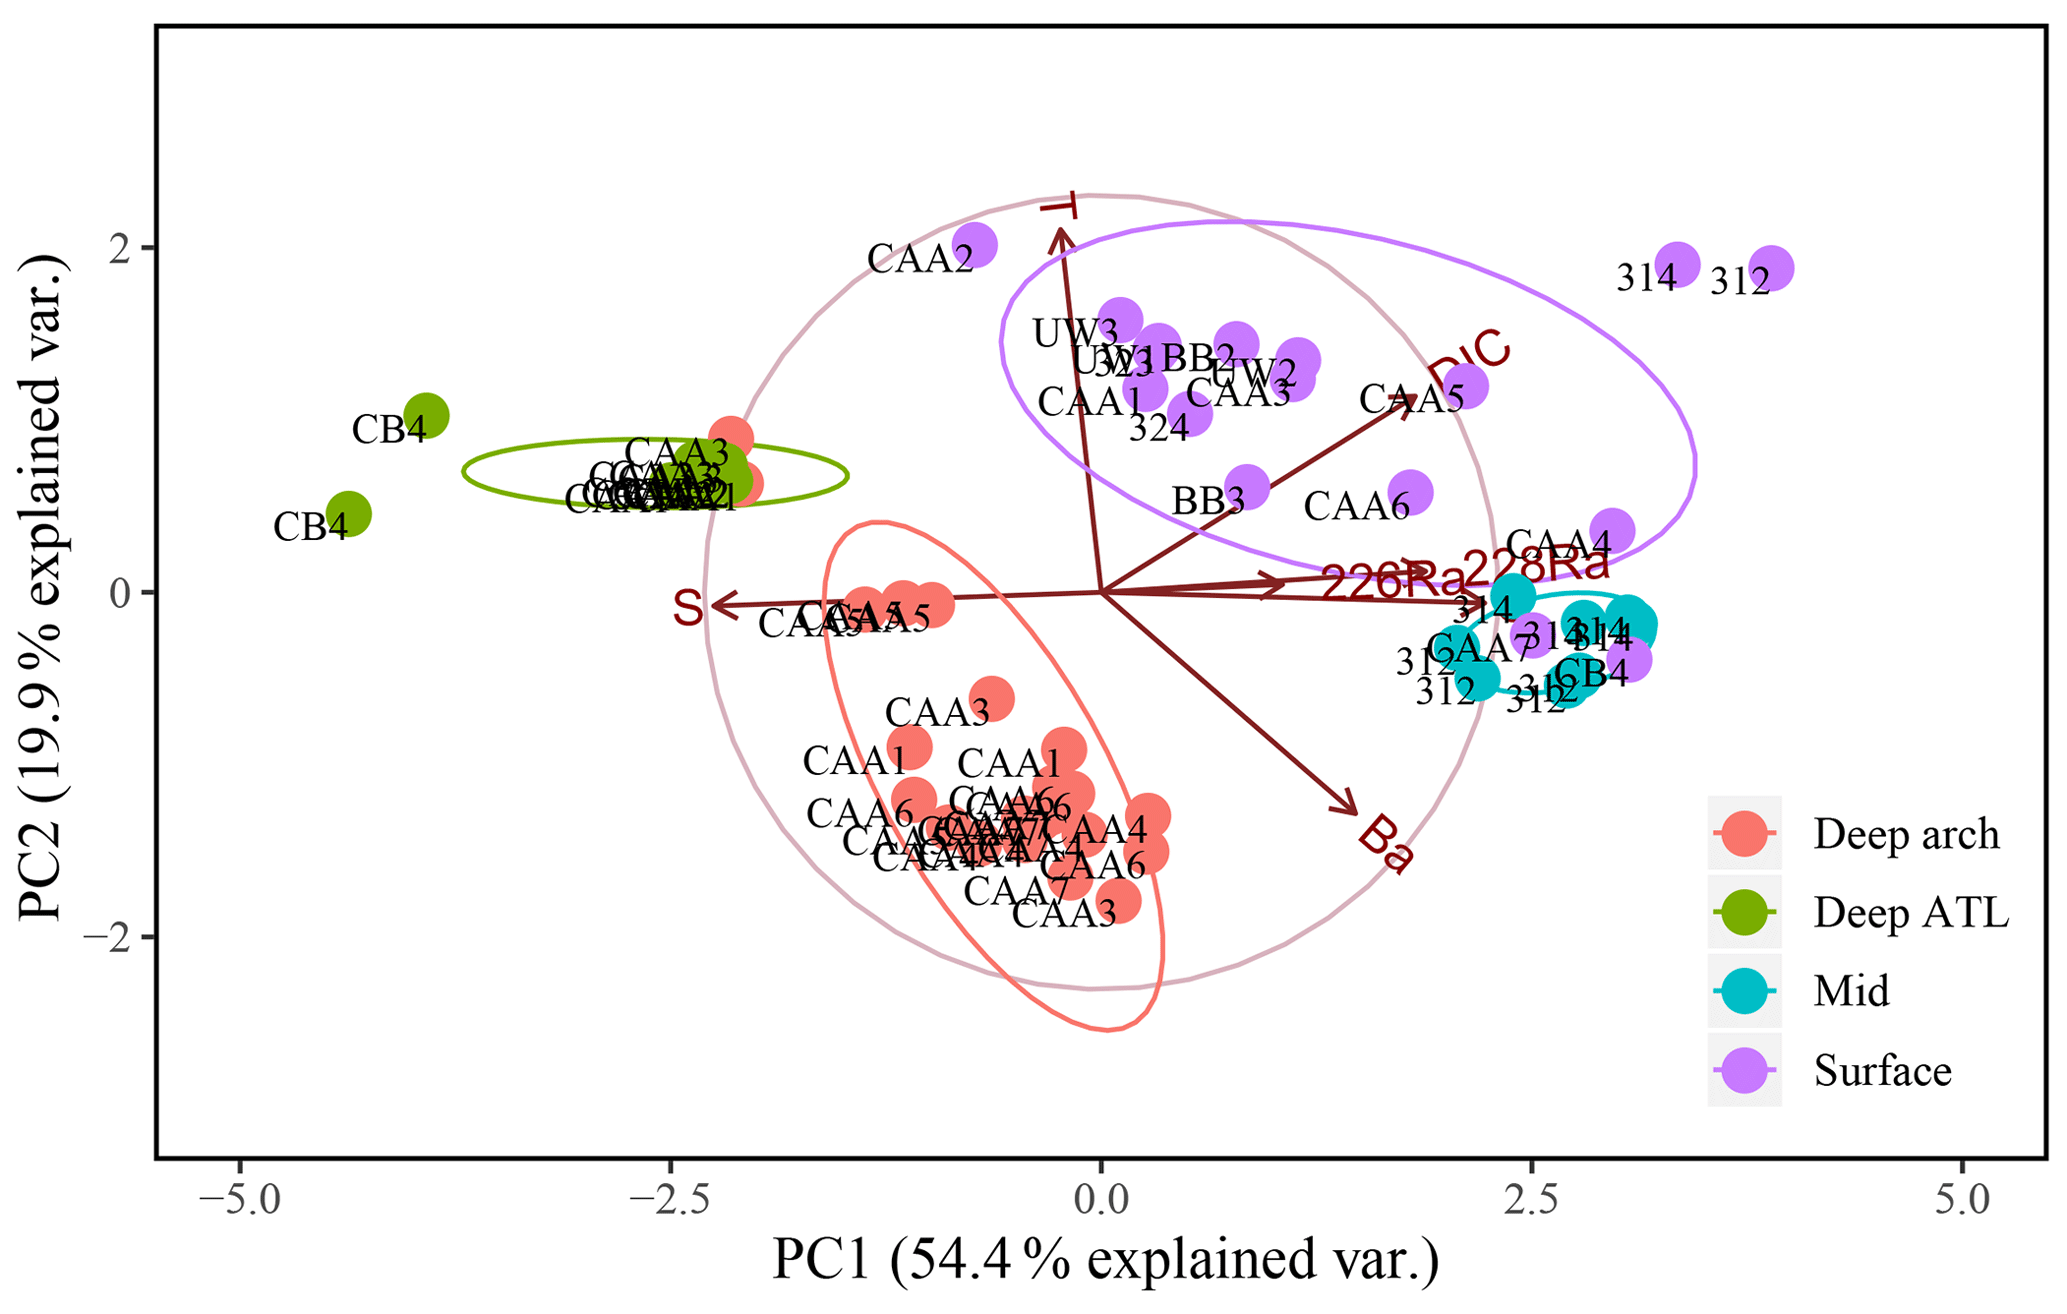
Figure 10Principal component analysis (PCA) of PC1 and PC2 for 64 samples from 17 stations throughout the Canadian Arctic Archipelago, composed of the seven transformed and normalized variables: salinity (SP), temperature (T), DIC, Ba, δ18O, 228Ra, and 226Ra, excluding AT. They are distinguished by depth groupings: surface (0–20 m; purple), mid (20–80 m; blue), and deep archipelago (deep arch, 80–500 m; red), and deep Atlantic (deep ATL, >500 m; green).
Paradoxically, samples collected at station CAA3 are found at both ends of this trend, having both the highest and lowest similarity to samples collected in the deep ATL from within the CAA. The three deep-water samples collected at CAA5 are intermediate between the deep ATL and deep CAA3 waters. The very strong similarity between the deep-water samples collected at CAA3 and those from Baffin Bay indicate that they are ATL water that recirculated counterclockwise around Baffin Bay, combined with Arctic outflow through Nares Strait (Bacle et al., 2002; Curry et al., 2011; Lobb et al., 2003). A third PCA was performed excluding the alkalinity (that clearly expresses the bulk eastward flow), in order to visualize the transition of deep ATL water as it mixes with the UHL in the CAA (Fig. 10). Results of this analysis reveal that the deep arch water mass, present at stations CAA1, CAA3, and CAA5, is more closely linked to the deep ATL group implying that it is in fact part of the deep ATL water mass (Fig. 10). This suggests that there is an intrusion of ATL water along the northern edge of the CAA. This westward flow with a speed of 2.2 cm s−1 was observed by Prinsenberg et al. (2009) and is weaker than the dominant eastward current flow (15.3 cm s−1). This mild inflow of water along the northern edge of the archipelago is then assumed to be redirected and exits back to Baffin Bay through the southern archipelago station (CAA3).
There is further support from observations of dissolved Ba and the barite saturation states (Qi) along the north-to-south transect across the eastern Lancaster Sound (CAA1, CAA2, 323, 324, and CAA3; Fig. 11a, b). An increase in Ba and Qi was observed from north to south at the surface as well as at depth. Lower Ba concentrations and barite saturation states have been observed in Baffin Bay waters, which are fed by the West Greenland Current. In contrast, the continentally impacted waters of the CAA are characterized by significantly higher values for the two Ba properties, such that the origin of the waters from the Atlantic and the CAA can clearly be discriminated (Thomas et al., 2011). Furthermore, substantially lower values of the 228Ra∕226Ra at depth (Fig. 11c) indicate the inflow of Atlantic water on the northern side of Lancaster Sound as well as its outflow along its southern side. Compatibly, the pattern is again revealed by the 226Ra∕Ba (Fig. 11d), which is dominated by 226Ra variability (Fig. 13b, c). The lowest 226Ra∕Ba value reflects the inflow of low 226Ra waters from the Atlantic Ocean (Fig. 11d), as the observed 226Ra activities (8–9 dpm 100 L−1, Fig. 3a) are in the same range as those measured in the surface waters of the Atlantic Ocean (Le Roy et al., 2018), part of which feed into the West Greenland Current. As 226Ra activities reveal a much larger north-to-south gradient across Lancaster Sound than Ba does (Figs. 2e, 3a), the discrepancy in the gradients shown in Fig. 11c and d is dominated by changes in 226Ra. The waters transiting through the CAA and exiting on its southern side are enriched with both 228Ra and 226Ra as they interact with the shallow sediments. The differential half-lives of the two isotopes generate the gradient in the ratio (Figs. 11c, 12), generally revealing higher 228Ra fractions for water masses that have had more recent contact with shelf sediments. The Ba and Ra data are consistent in revealing the bidirectional flow that links the northern and southern stations along 80∘ W. This can be attributed to the counterclockwise, cyclonic circulation found throughout Baffin Bay (Figs. 11, 13, 14).

Figure 11Cross section at stations CAA1–CAA3, 323, and 324 for (a) dissolved Ba and (b) barite saturation state (Qi) as well as (c) 228Ra∕226Ra and (d) 226Ra∕Ba (dpm µmol−1). The low values of both properties indicate the presence of Atlantic water (see Thomas et al., 2011).
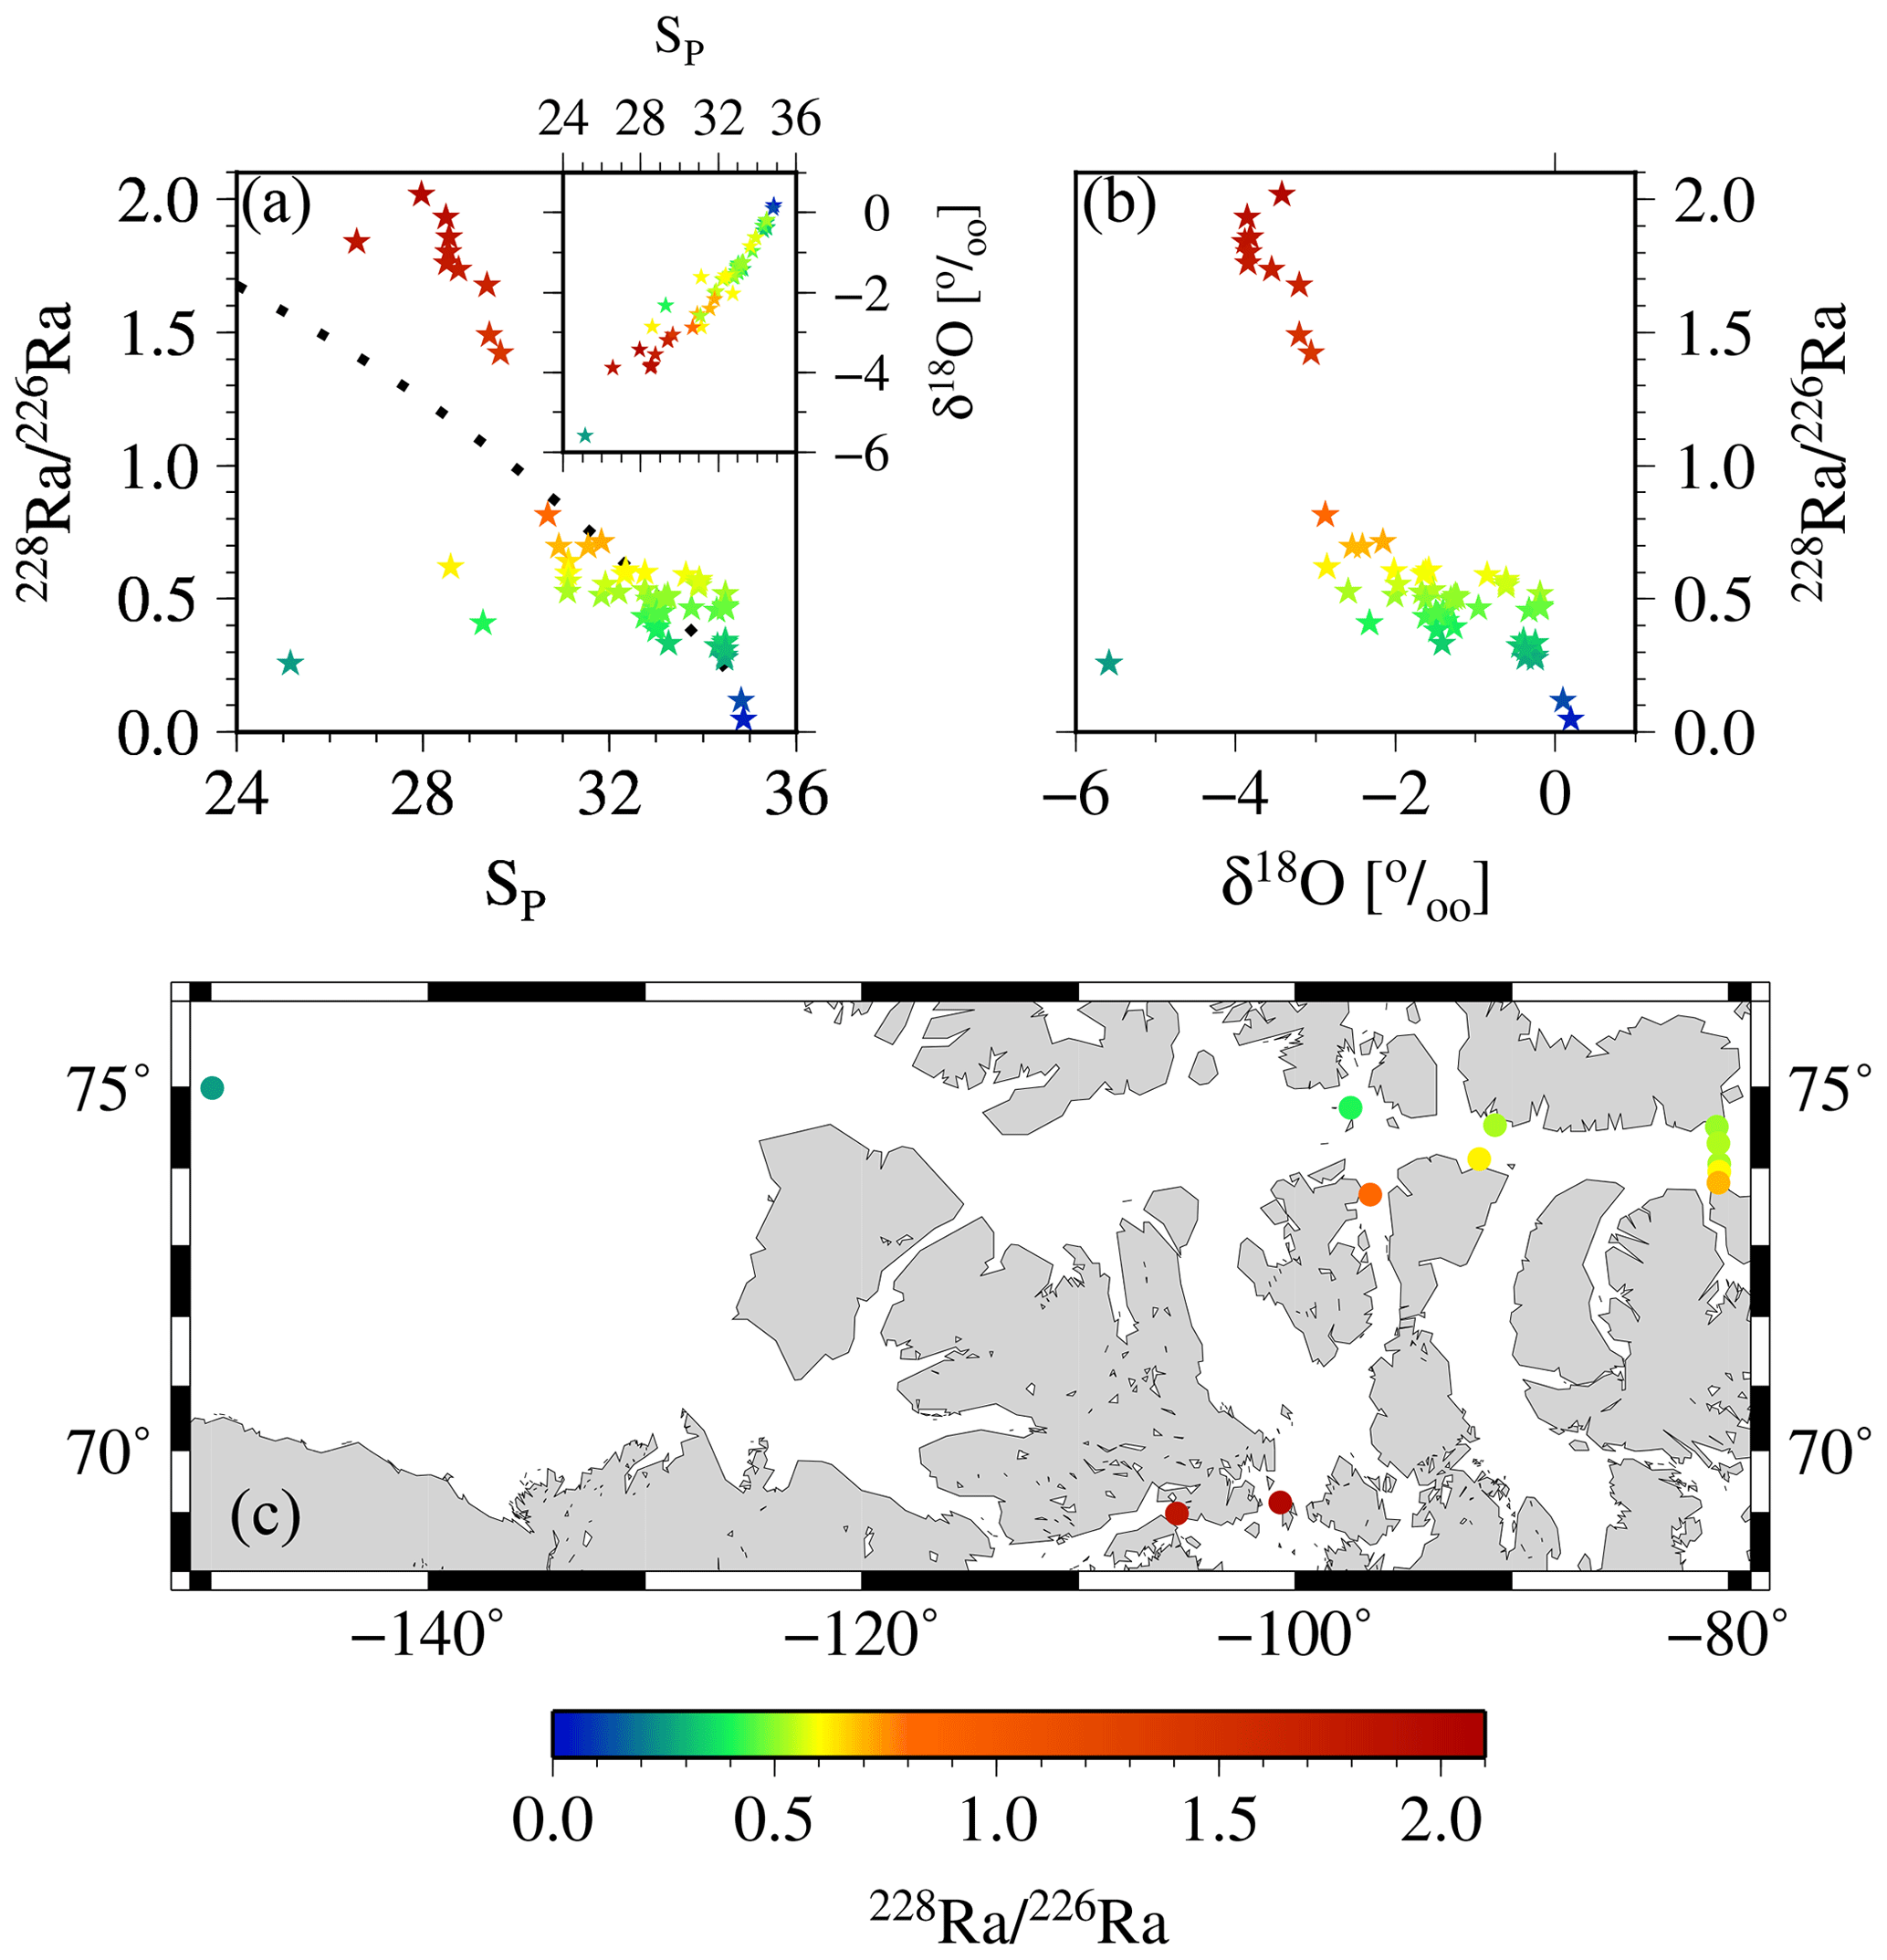
Figure 12Relationship between 228Ra∕226Ra as derived from the apparent end-members vs. (a) salinity and (b) δ18O. The inset in panel (a) shows the SP vs. δ18O relationship. Increasing fractions of sea ice would cause a near-horizontal shift in that relationship (sea-ice δ18O end-member ‰), whereas meteoric water would cause a “diagonal” shift (meteoric water δ18O end-member ‰); see also Thomas et al., 2011 for more details. In panel (c) 228Ra∕226Ra in surface samples across the CAA depict the different flow passes via the Northwest Passage and via McClure Strait, Parry Channel, and Lancaster Sound, respectively. For reasons of clarity, only the surface samples have been shown in panel (c). The color coding groups the samples into water masses with high salinity and low isotopic ratio (ATL), with low salinity and high isotopic ratio (shelf waters near the 228Ra source), and with low salinity and low isotopic ratio (waters in direction of CB4), respectively.
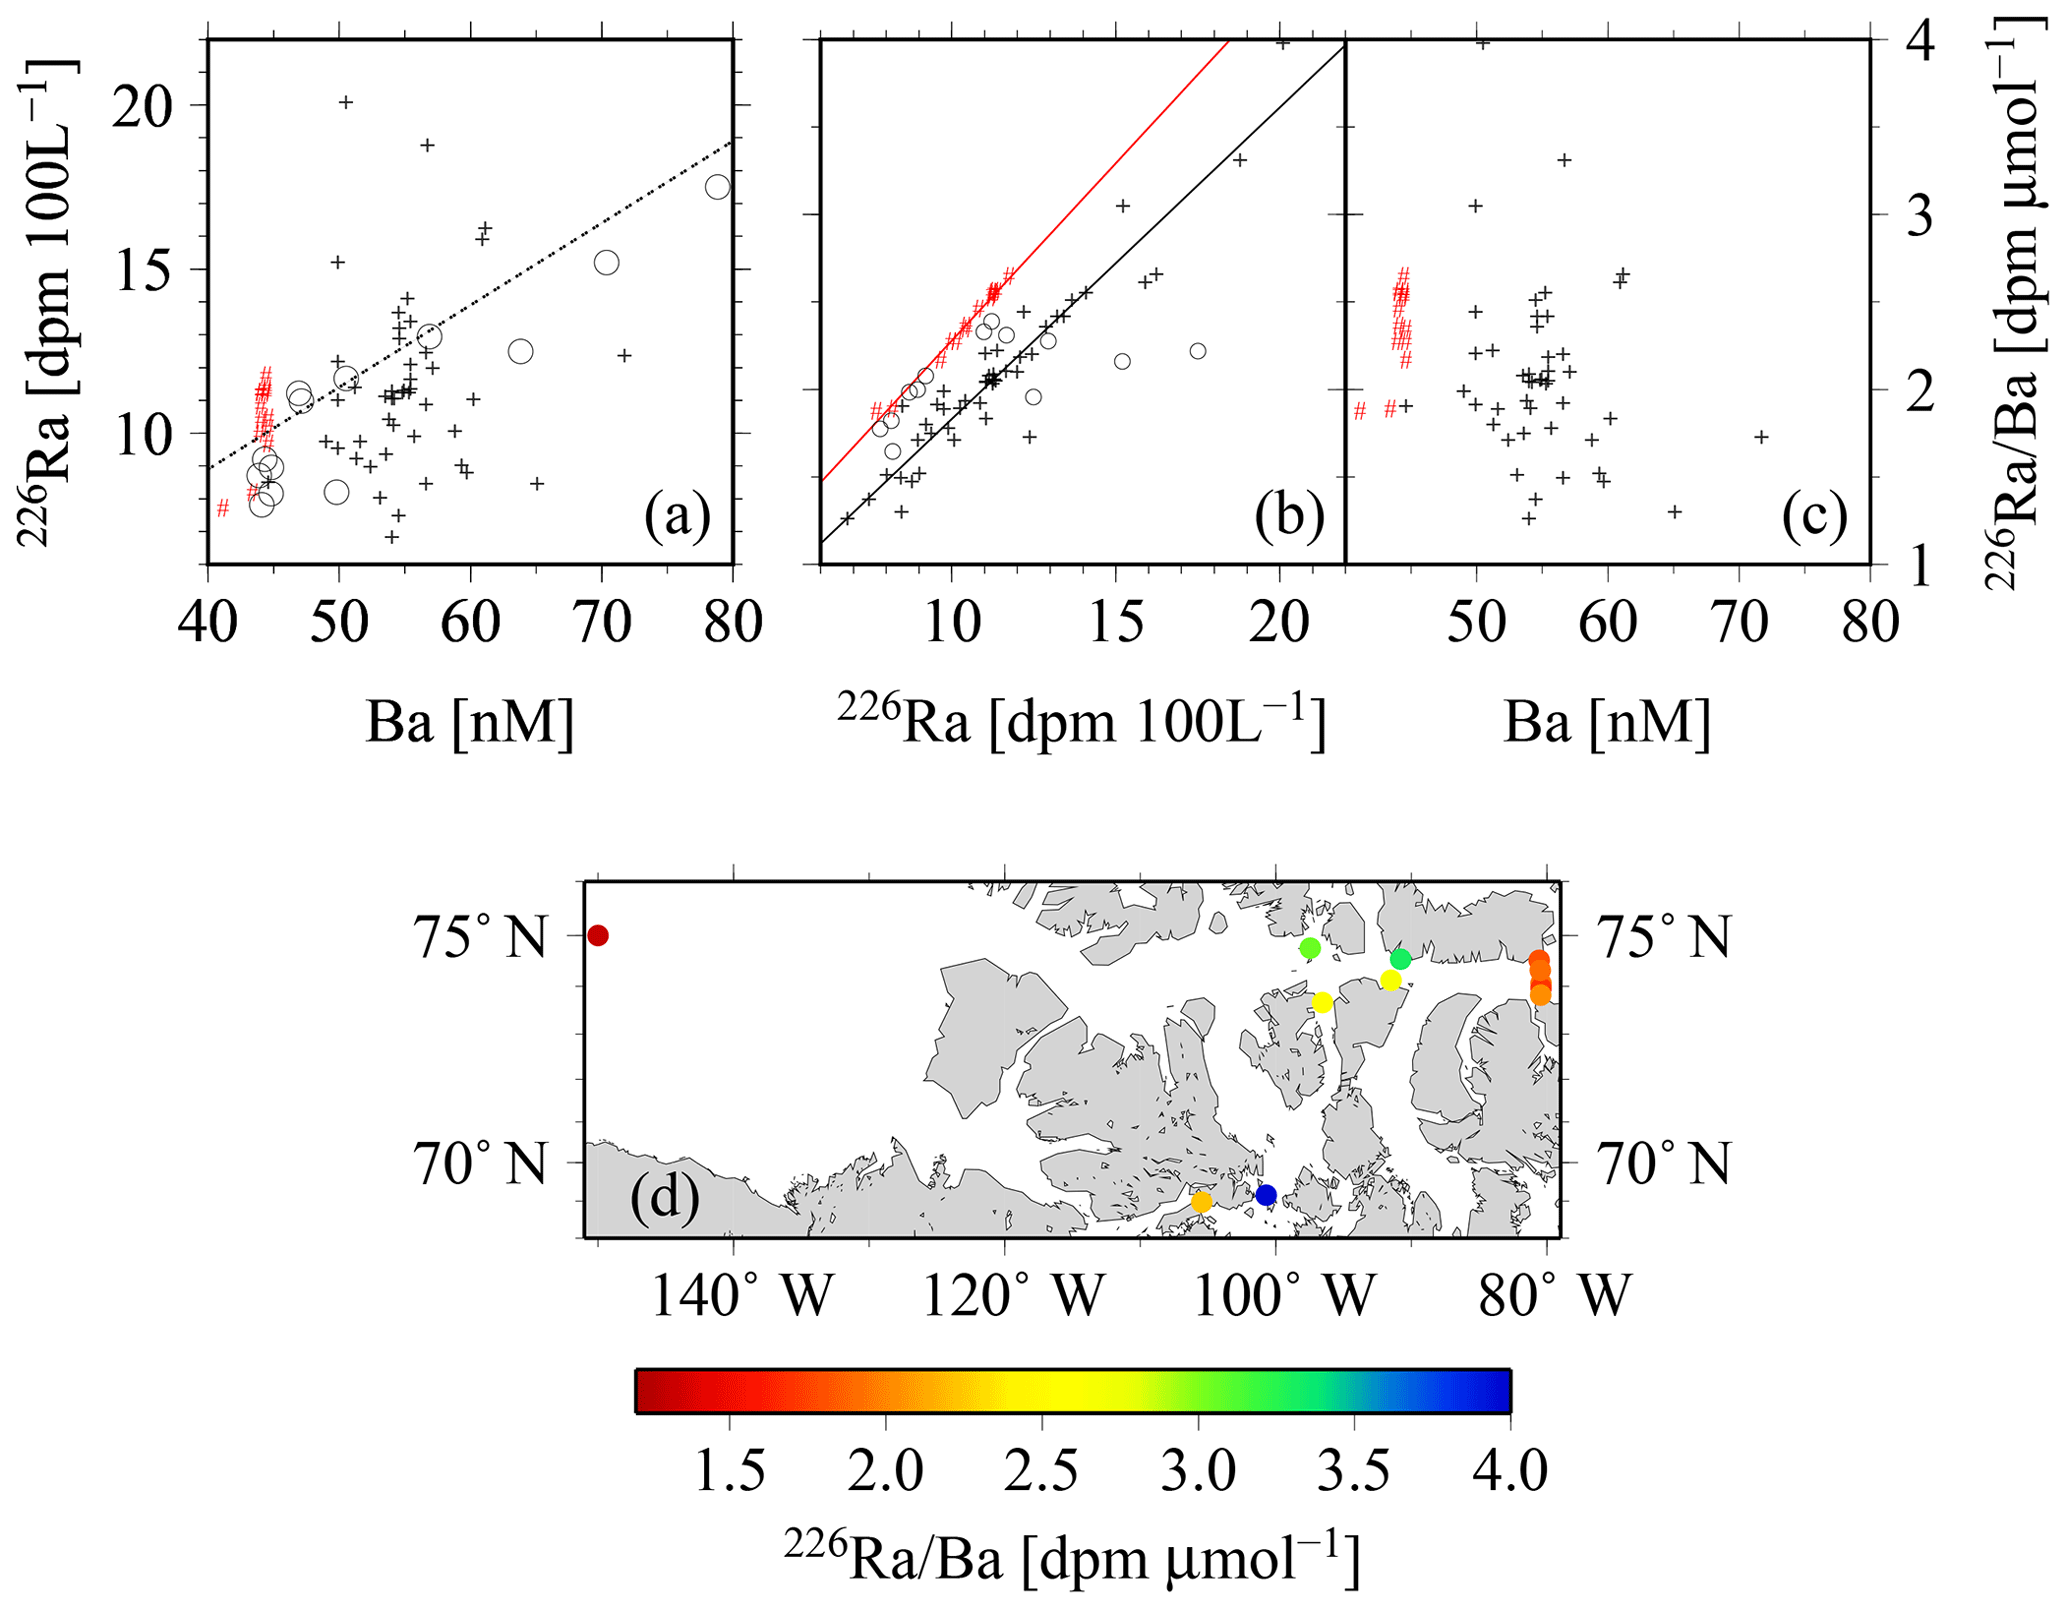
Figure 13The relationships between (a) 226Ra and Ba, and the relationships between 226Ra∕Ba and the (b) 226Ra and (c) Ba concentrations. The red symbols indicate samples with SP>34 (Atlantic origin). In panel (b), the linear regressions yield , R2=0.99, for samples with SP>34, and they yield , R2=0.90, for samples with SP<34. Within panels (a) and (b), open circles are drawn from van Beek et al. (2007), whereas the dashed line in panel (a) is redrawn from Le Roy et al. (2018). Panel (d) depicts the spatial distribution of the 226Ra∕Ba in surface waters across the CAA.

Figure 14Sketch of the proposed surface flow pattern as identified in the current study, where dotted lines indicate reduced certainty of trends.
A closer look at the 226Ra–Ba relationship reveals the association between water masses observed in the CAA and those of the surrounding oceans, in particular the Atlantic Ocean (Fig. 13). 226Ra and Ba appear to vary without an apparent clear relationship. The highest surface values of the 226Ra∕Ba are observed in the interior of the CAA, whereas the lowest are found in the Canada Basin and the eastern side of the CAA (Fig. 13d). The direct relationship between 226Ra activities and Ba concentrations shows that the Arctic samples with a SP>34, i.e., waters of Atlantic origin, fall along the relationship established by Le Roy et al. (2018) for the Atlantic or those reported by van Beek et al. (2007) for the Sargasso Sea (Fig. 13a). This relationship, in turn, is similar to the one for the world ocean established from the GEOSECS database (Le Roy et al., 2018). This implies that the deep Lancaster Sound samples, as well as the deep Canada Basin samples, can similarly be linked to an Atlantic origin. The remaining CAA samples with a SP<34 display a clear deviation from this relationship and towards higher Ba values (Fig. 13b), which can be attributed to the high Ba runoff from rivers draining into the CAA (Guay and Falkner, 1998). The open-ocean 226Ra∕Ba value has been reported to be relatively constant at about 2.2–2.5 dpm µmol−1, with elevated values observed only near deep-ocean sediments (van Beek et al., 2007; Le Roy et al., 2018). In contrast, the CAA data show a wider range of 226Ra∕Ba values, which appear to be strongly controlled by the 226Ra activity, rather than variability of the Ba concentration (Fig. 13b, c). The 226Ra∕Ba values in water masses of Atlantic origin (SP>34) are offset toward higher ratios for a given 226Ra activity, which is a consequence of the relatively higher Ba content of the water masses transiting through the CAA. The highest 226Ra∕Ba surface values were observed in the interior of the CAA, whereas the lowest values were measured in the Canada Basin and the eastern side of the CAA (Fig. 13d).
3.3.2 Interpretations of PC1 and PC2
Principal component 1: advection and the land–ocean transition
PC1 was found to correlate significantly with SP, DIC, AT, δ18O, 228Ra, and Ba, suggesting that this axis represents the land–ocean gradient, i.e., the advective (estuarine) mixing regime of fresh and salt water (Table 1, Fig. 7). This interpretation is consistent with our previous attribution of the longitudinal, eastward increase in SP, DIC, and AT of surface waters through the CAA to a decreasing coastal influence (Figs. 3, 4, 5).
Here, the 228Ra activity has to be viewed from a somewhat different perspective, as the sedimentary/shelf sources also reside in the low salinity range of our samples (SP∼25–30), but does not align with any riverine source (e.g., Rutgers van der Loeff et al., 2003, see below). Therefore, with regard to the PC1 axis, 228Ra relative to 226Ra represents the coastal shelf to open-ocean transition, decreasing in activity laterally as waters primarily follow the bulk eastward flow and are transported away from the sedimentary source within the CAA (Figs. 12, 13, see also Charette et al., 2016). Accordingly, the fresher 228Ra end-member was defined with SP=25.
The loading of PC1 on δ18O and Ba is also high, particularly for δ18O. These variables allow us to discriminate between freshwater sources (MW vs. SIM) while also demonstrating a clear mixing gradient along the land–ocean transition (Guay et al., 2009; Macdonald et al., 1999; Yamamoto-Kawai et al., 2010).
Table 2Apparent dissolved inorganic carbon (DIC, µmol kg−1), total alkalinity (AT, µmol kg−1), δ18O, barium (Ba, nM), 226Ra (dpm 100 L−1), and 228Ra (dpm 100 L−1) end-members, analyzed for the salinity (SP) defined water masses sea-ice melt and melt water (SIM and MW), the upper halocline layer (UHL), and the Atlantic layer (ATL) from PC1 of the original eight-variable PCA (Fig. 7) with the exception of 226Ra, which does not significantly coincide with PC1.
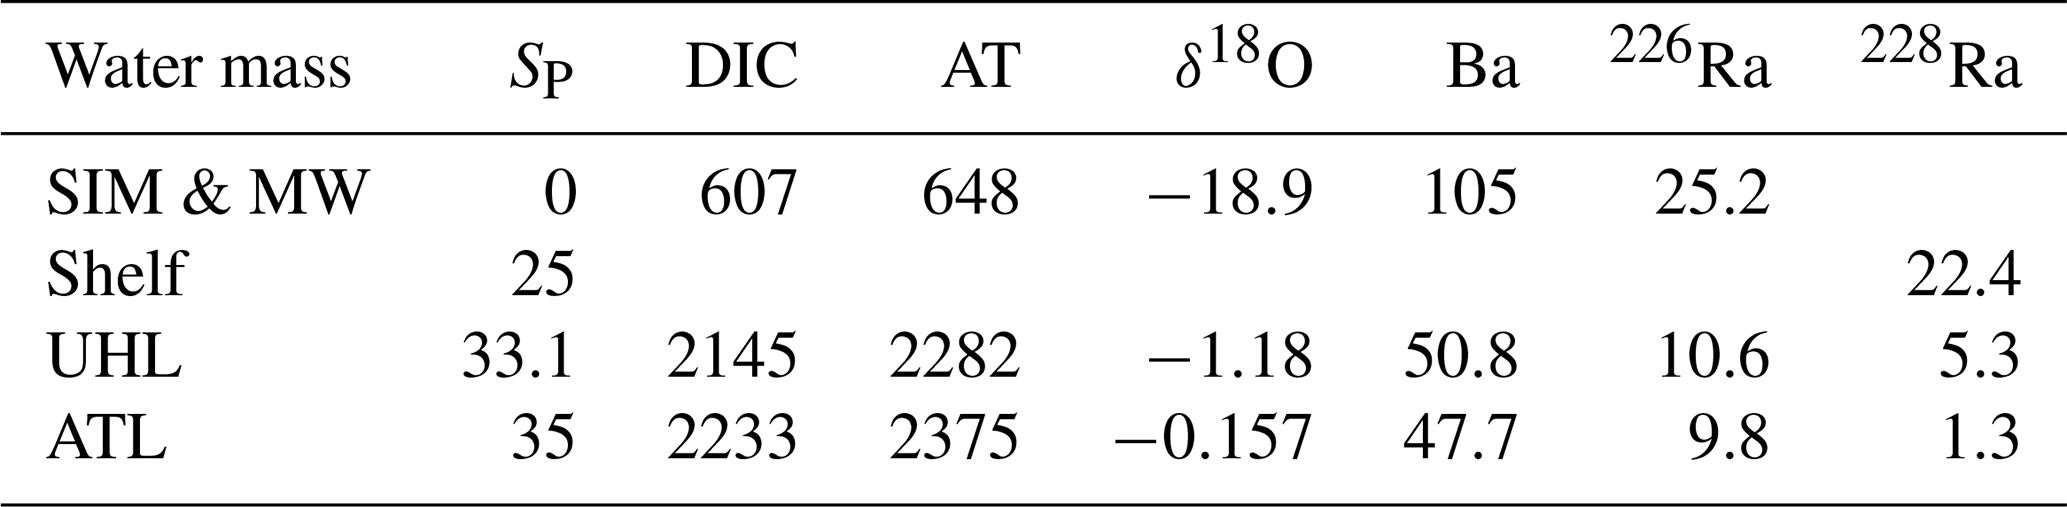
We exploit the relationships of salinity with the individual properties derived from PC1 in order to define the freshwater and marine (saline) end-members (Table 2). Again, these end-members should be considered as “apparent”, as they represent observed mean end-member properties, and not end-member water masses, for example, end-members of individual rivers. “Apparent” end-members for each of the significant loading variables associated with PC1 were calculated (Table 2). It should be noted that 226Ra was included in the PC1 analysis even though it primarily weighs on the PC3 axis (73.8 %) not the PC1 axis. This is because salinity is not a significant loading factor on the PC3 axis (Table 1). Therefore, with the exception of PC3, 226Ra most closely associates with the PC1 axis (18.6 %), allowing for PC1 to be used to establish the 226Ra “mixing” end-member (Table 1).
The computed “apparent” end-members sit along the mixing curve, many located “halfway” between the SIM and MW values reported in the literature (e.g., Cooper et al., 2005; Guay and Falkner, 1998; Macdonald et al., 1989; Shadwick et al., 2011a; Thomas et al., 2011). Thus, these “apparent” freshwater end-members (SP=0) reflect a combination of freshwater sources. As both the MW and SIM are equally represented in the “apparent” DIC, AT, and Ba end-members, it can be assumed that the freshwater end-member is located within the western portion of the CAA, as the freshwater contribution to the eastern ATL water mass is dominated by SIM, with little to no MW (Shadwick et al., 2011a, b). The “apparent” end-member surface values for δ18O were found to closely resemble MW (rather than the larger SIM values), with MW being, in essence, the dominant source of freshwater (Table 2; e.g., Thomas et al., 2011). The end-members associated with the UHL and ATL were also found to be very similar to those reported in the literature, especially AT, Ba, and δ18O (Guay and Falkner, 1997, 1998; Lansard et al., 2012; Macdonald et al., 1989; Shadwick et al., 2011a; Thomas et al., 2011; Yamamoto-Kawai et al., 2010). The “apparent” DIC end-members for these water masses do not closely concur with literature values nor do those produced here (Fig. 5a), as the DIC end-member associated with the UHL is expected to be larger than that of the ATL (e.g., Lansard et al., 2012; Shadwick et al., 2011a). We argue that this is due to the impact of biological processes, which cannot be resolved solely from mixing-conservative properties. These characteristics will be discussed within the context of PC2 in Sect. 3.3.2. Furthermore, this result may be due to the normalization required for the PCA linearization of the deep ATL and arch samples, which may diminish the characteristic DIC maximum at the pycnocline. Lastly, we propose apparent end-members for 226Ra and 228Ra in the CAA. The highest 228Ra and 226Ra activities were found in the fresh(er) sources attributed to the surface samples collected in the western CAA (Fig. 6). The SP=0 end-member for 226Ra (25.2 dpm 100 L−1) is consistent with the effective 226Ra end-member for the Mackenzie River (26.1 dpm 100 L−1; Kipp et al., 2019), which contributes to the freshwater budget of the CAA. Smith et al. (2003) reported a Beaufort Shelf end-member with a 228Ra activity of 12 dpm 100 L−1 at SP=2 and a 228Ra∕226Ra of ∼1. Therefore, with a shelf apparent end-member for 228Ra of 22.4 dpm 100 L−1 at SP=25 (Table 2) and a 228Ra∕226Ra of ∼2, the shelf sediment influence of 228Ra in the CAA is conclusive.
Similar apparent end-member 226Ra activities were observed within the open waters of the UHL and ATL, whereas substantially lower 228Ra activities were recorded in the ATL (Table 2). Rutgers van der Loeff et al. (2003) reported high-salinity 226Ra end-members in a similar range (∼6–9 dpm 100 L−1) to the apparent ones reported here, whereas the apparent 228Ra end-members obtained in our study are clearly lower than those reported by Rutgers van der Loeff et al. (2003, ∼3.2–15.4 dpm 100 L−1). An obvious explanation for this discrepancy may be the circulation history of the respective water masses, as the Atlantic end-member reaches the CAA much later than the Eurasian sector of the Arctic Ocean. Thus, the longer circulation history of the ATL waters observed in the CAA allows for a substantial decay of 228Ra compared with the ATL waters observed on the Eurasian side. Furthermore, the salinity of the samples reported in this study are higher than the samples measured by Rutgers van der Loeff et al. (2003), implying the presence of a stronger ATL component in our samples. The differences between the high salinity apparent 226Ra and 228Ra end-members might reflect their vastly different half-lives, allowing for an appreciable decay of 228Ra at oceanic transport timescales in contrast to the “nearly conservative” 226Ra. Coinciding with the previous result, higher variability in 228Ra was seen throughout the water column, whereas 226Ra activities varied only slightly. Overall, the identification of Ra end-members in the region highlights the Ra sources and transport pathways throughout this complex coastal/shelf environment.
We use the derived apparent end-member properties of 228Ra and 226Ra to gain further insight into the distributions of the two isotopes and, thus, the flow pattern within the CAA. The 228Ra∕226Ra was computed as a function of salinity from the apparent end-members and compared to the relationship between the 228Ra∕226Ra and δ18O (Fig. 12a, b). The apparent 228Ra∕226Ra over SP mixing ratio appears as if the ratio was only affected by conservative mixing of the two respective end-members (Table 2). When relating this ideal behavior to the ratios observed in our study, three main groups of samples can be identified: (A) the higher salinity (SP>32, ) samples, which more or less fall together with the mixing relationship; (B) the samples characterized by substantially higher 228Ra∕226Ra (, ); and (C) the second group of low-salinity samples with (), characterized by a substantially lower 228Ra∕226Ra isotopic ratio. The spatial distribution (Fig. 12c) of these sample groups unravels processes that shape the Ra distributions, which, at the first glance, did not seem to fit into the broader scheme described in Fig. 9. Samples with higher 228Ra∕226Ra values than the mixing ratios are located within the CAA, at stations 312 and 314, and at the downstream stations along the southern coast of the Northwest Passage, which, in turn, are under the strong influence of shelf- or sediment-derived 228Ra accumulation as they flow eastward. This water mass mixes on the southern side of Lancaster Sound with the water from Baffin Bay, yielding a flow pattern highlighted by the higher 228Ra∕226Ra in the CAA (Figs. 11c, 12c). The stations with lower Ra isotopic ratios than the mixing ratios are located on the northern part of the Lancaster Sound and connect to the Canada Basin via McClure Strait and Parry Channel (Figs. 1, 12c). The waters at stations with lower Ra isotopic ratios mix with (inflowing) water from Baffin Bay along the northern side of Lancaster Sound (Fig. 11c). The overall lower 228Ra∕226Ra waters reflect the long-term isolation of CB4 waters from their margin source (e.g., Kipp et al., 2018) such that the 228Ra activities are diminished noticeably by radioactive decay. Consistent with this finding is the clear separation between water of the northern and southern sides of Lancaster Sound, as discussed in Fig. 11. We integrate the observations and findings featured in Figs. 11–13 into a revised scheme, shown in Fig. 14, to reveal the main flow pattern.
This analysis can further be exploited to highlight the release of 228Ra from shallow shelf sediments to waters in the lower salinity range rather than from rivers. Both 228Ra∕226Ra–SP and 228Ra∕226Ra–δ18O reveal a nonconservative addition of 228Ra to waters in the salinity range of (Fig. 12). Furthermore, when considering δ18O, conservative mixing from a riverine source can be excluded (see also Burt et al., 2016b; Kipp et al., 2018; Moore, 2000, 2007). On the other hand, the δ18O values of −3 ‰ to −4 ‰ imply that the 228Ra source is under riverine influence, as the δ18O signature of the sea-ice end-member is generally thought to be approximately −2 ‰ (e.g., Eicken et al., 2002; Thomas et al., 2011; Yamamoto-Kawai et al., 2009, and references therein, see also Thomas et al., 2011; Fig. 5d).
Principal component 2: particle-related impacts (nutrient-type behavior)
The correlation of Ba, DIC, and temperature with PC2 is based on the hydrographic peculiarities of the CAA, where temperature displays a “classical”, inverse nutrient-type profile (Fig. 2), resulting from the presence of a temperature minimum in the UHL. As is the case for Ba and DIC, nutrient-type profiles are generally shaped by the interaction of biological (production/respiration, adsorption/desorption) processes and gravitational particle settling. Properties revealing such distributions are represented by PC2, with the temperature minimum coinciding with those minima found at the pycnocline depths.
It is our hope that with a better understanding of the distributions of the long-lived Ra isotopes, coupled with other chemical constituents, future initiatives can be supported to investigate the changes in water mass distribution in this region. Given the results of the PCA as well as the distribution of 228Ra, our data reveal the existence of a western flow of water along the northeastern edge of the CAA. This flow is a component of a cyclonic U-turn of Baffin Bay water, intruding westward into the CAA before being rerouted back to the east. The bulk eastward transport of water through the CAA was confirmed, highlighted by the distribution of Ra radioisotopes and chemical constituents in apparent end-members throughout the region. Overall, the results from this study provide the foundation for future GEOTRACES studies and other initiatives that focus on the sensitivity of trace element fluxes to changing environmental conditions by identifying and quantifying anomalies in the distribution of radioactive isotopes in the Canadian Arctic Archipelago. Furthermore, this study provides an additional tool to better understand and characterize water mass distributions, flow patterns, mixing, and their respective timescales in challenging sampling areas such as the Arctic.
Table A1Equations used to normalize (X0) the data distribution for temperature (T), practical salinity (SP), dissolved inorganic carbon (DIC, µmol kg−1), δ18O, 226Ra (dpm 100 L−1), 228Ra (dpm 100 L−1), and Ba (nM) collected throughout the CAA 2015 GEOTRACES cruise in preparation for principal component analyses.
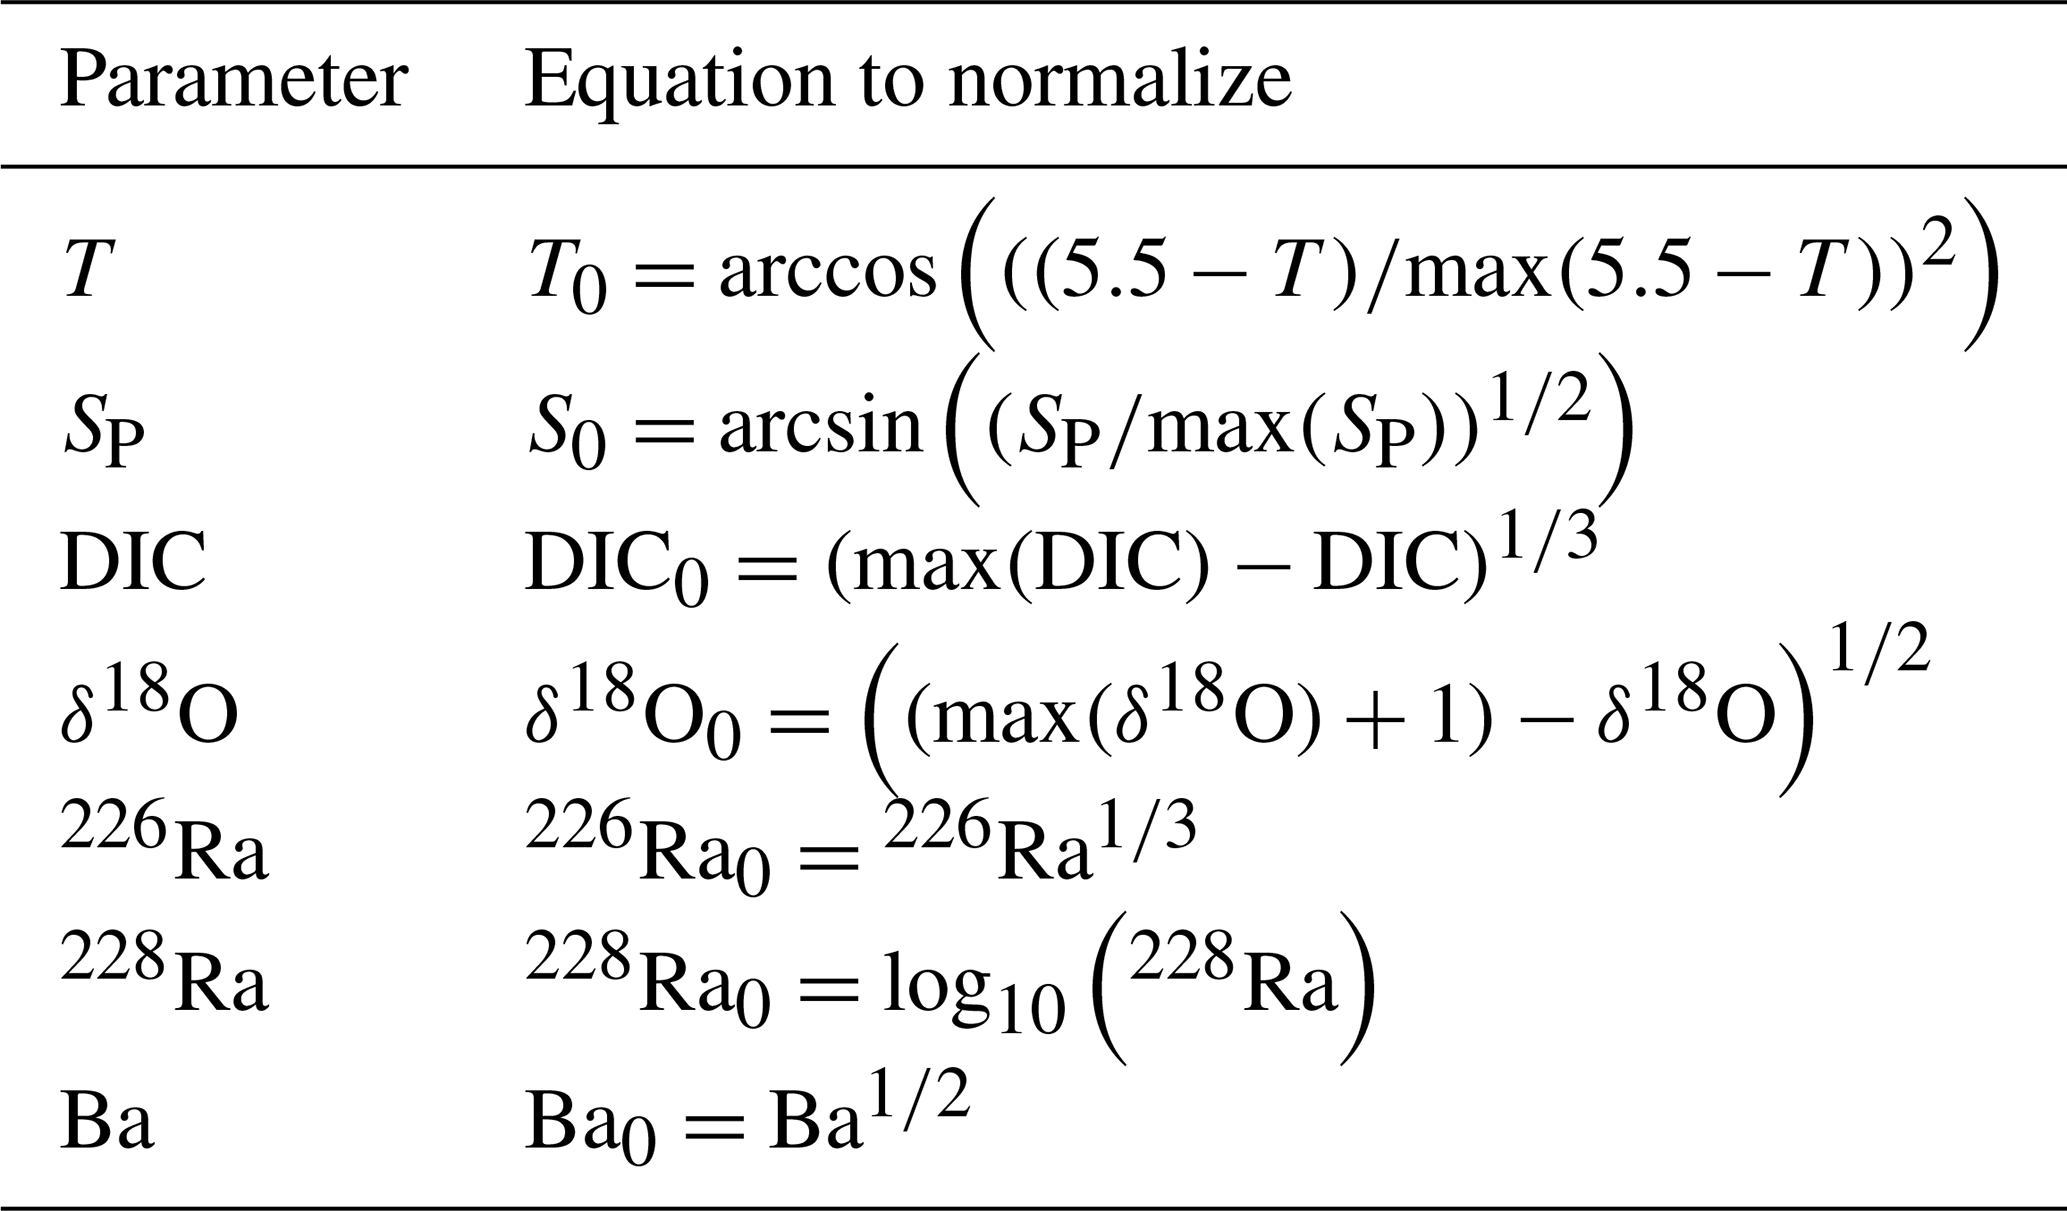
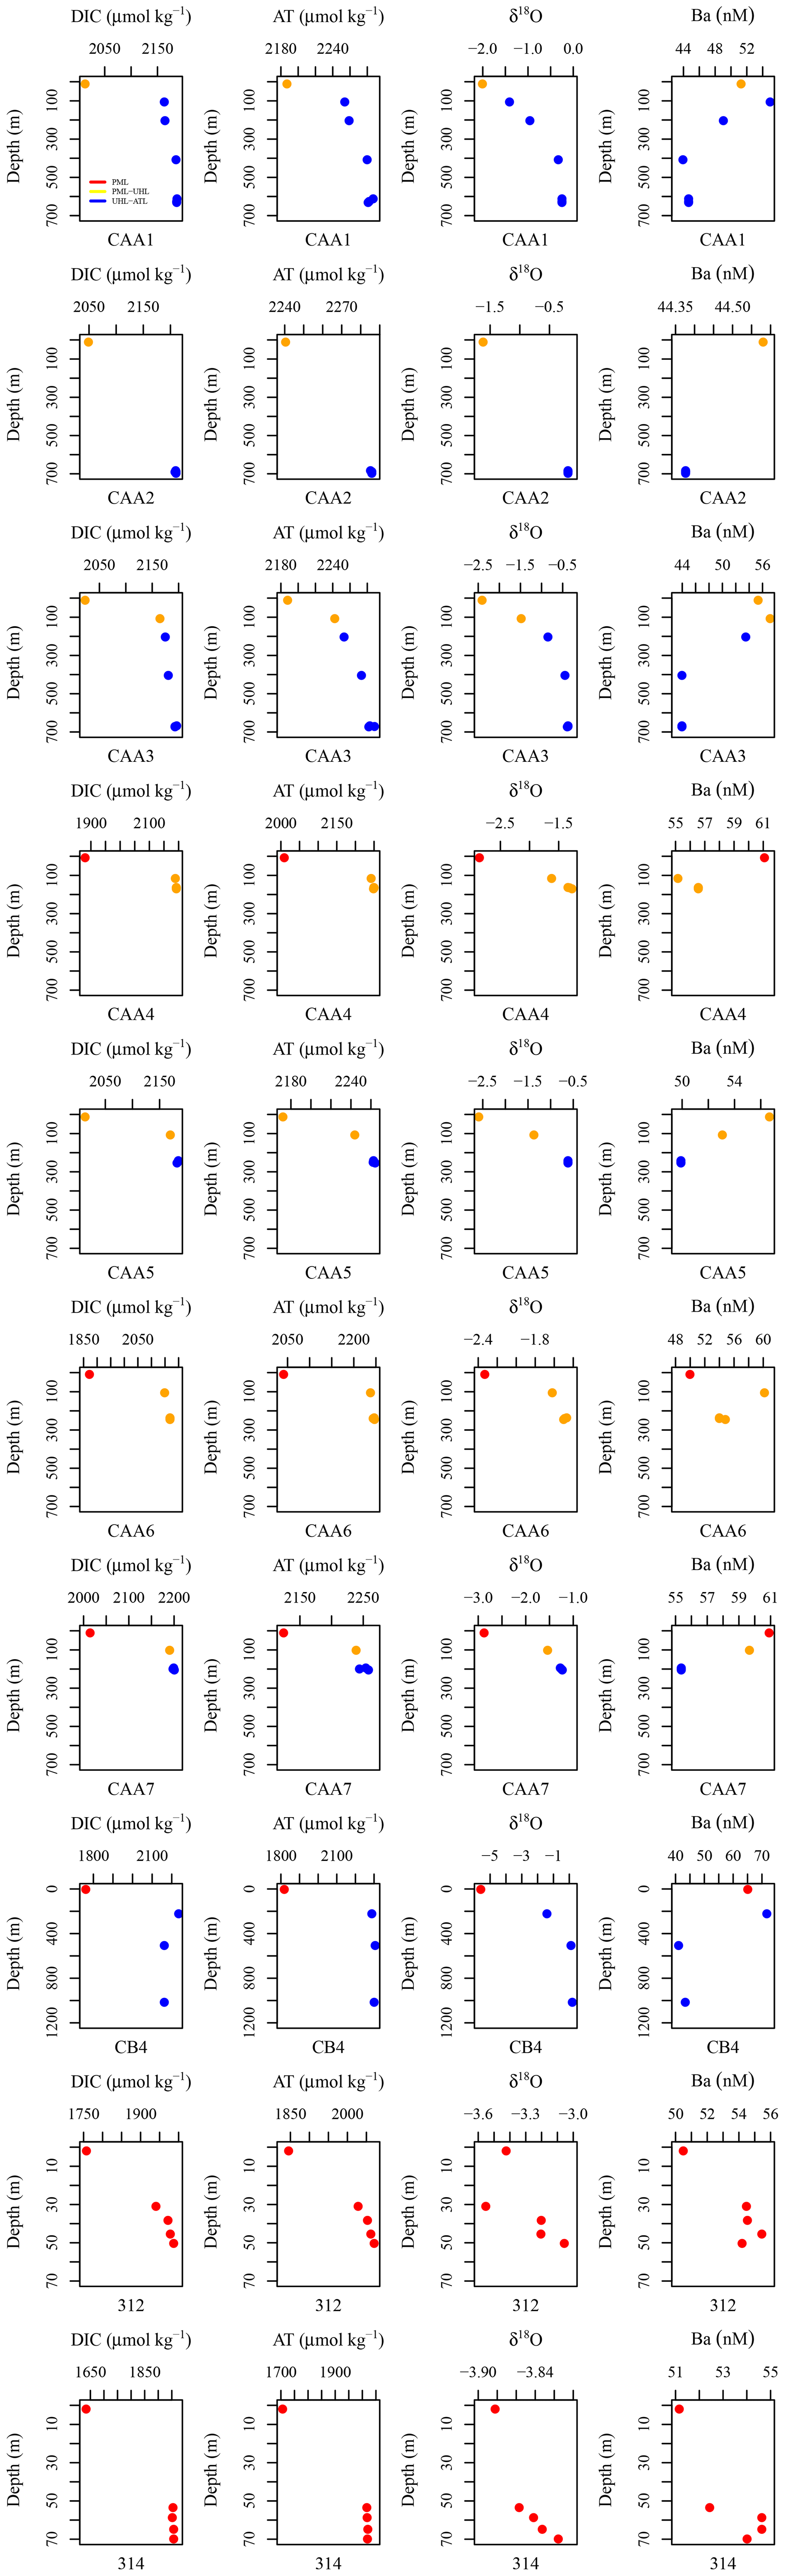
Figure A1DIC (µmol kg−1), AT (µmol kg−1), δ18O, and Ba (nM) plotted against depth for each station including CAA1, CAA2, CAA3, CAA4, CAA5, CAA6, CB4, 312, and 314, where profiles were taken throughout the 2015 GEOTRACES cruise in the Canadian Arctic Archipelago. Colors indicate the water masses present at the sampled depths: red is the polar mixed layer (PML), yellow is the upper halocline layer (UHL), and blue is the Atlantic layer (ATL).
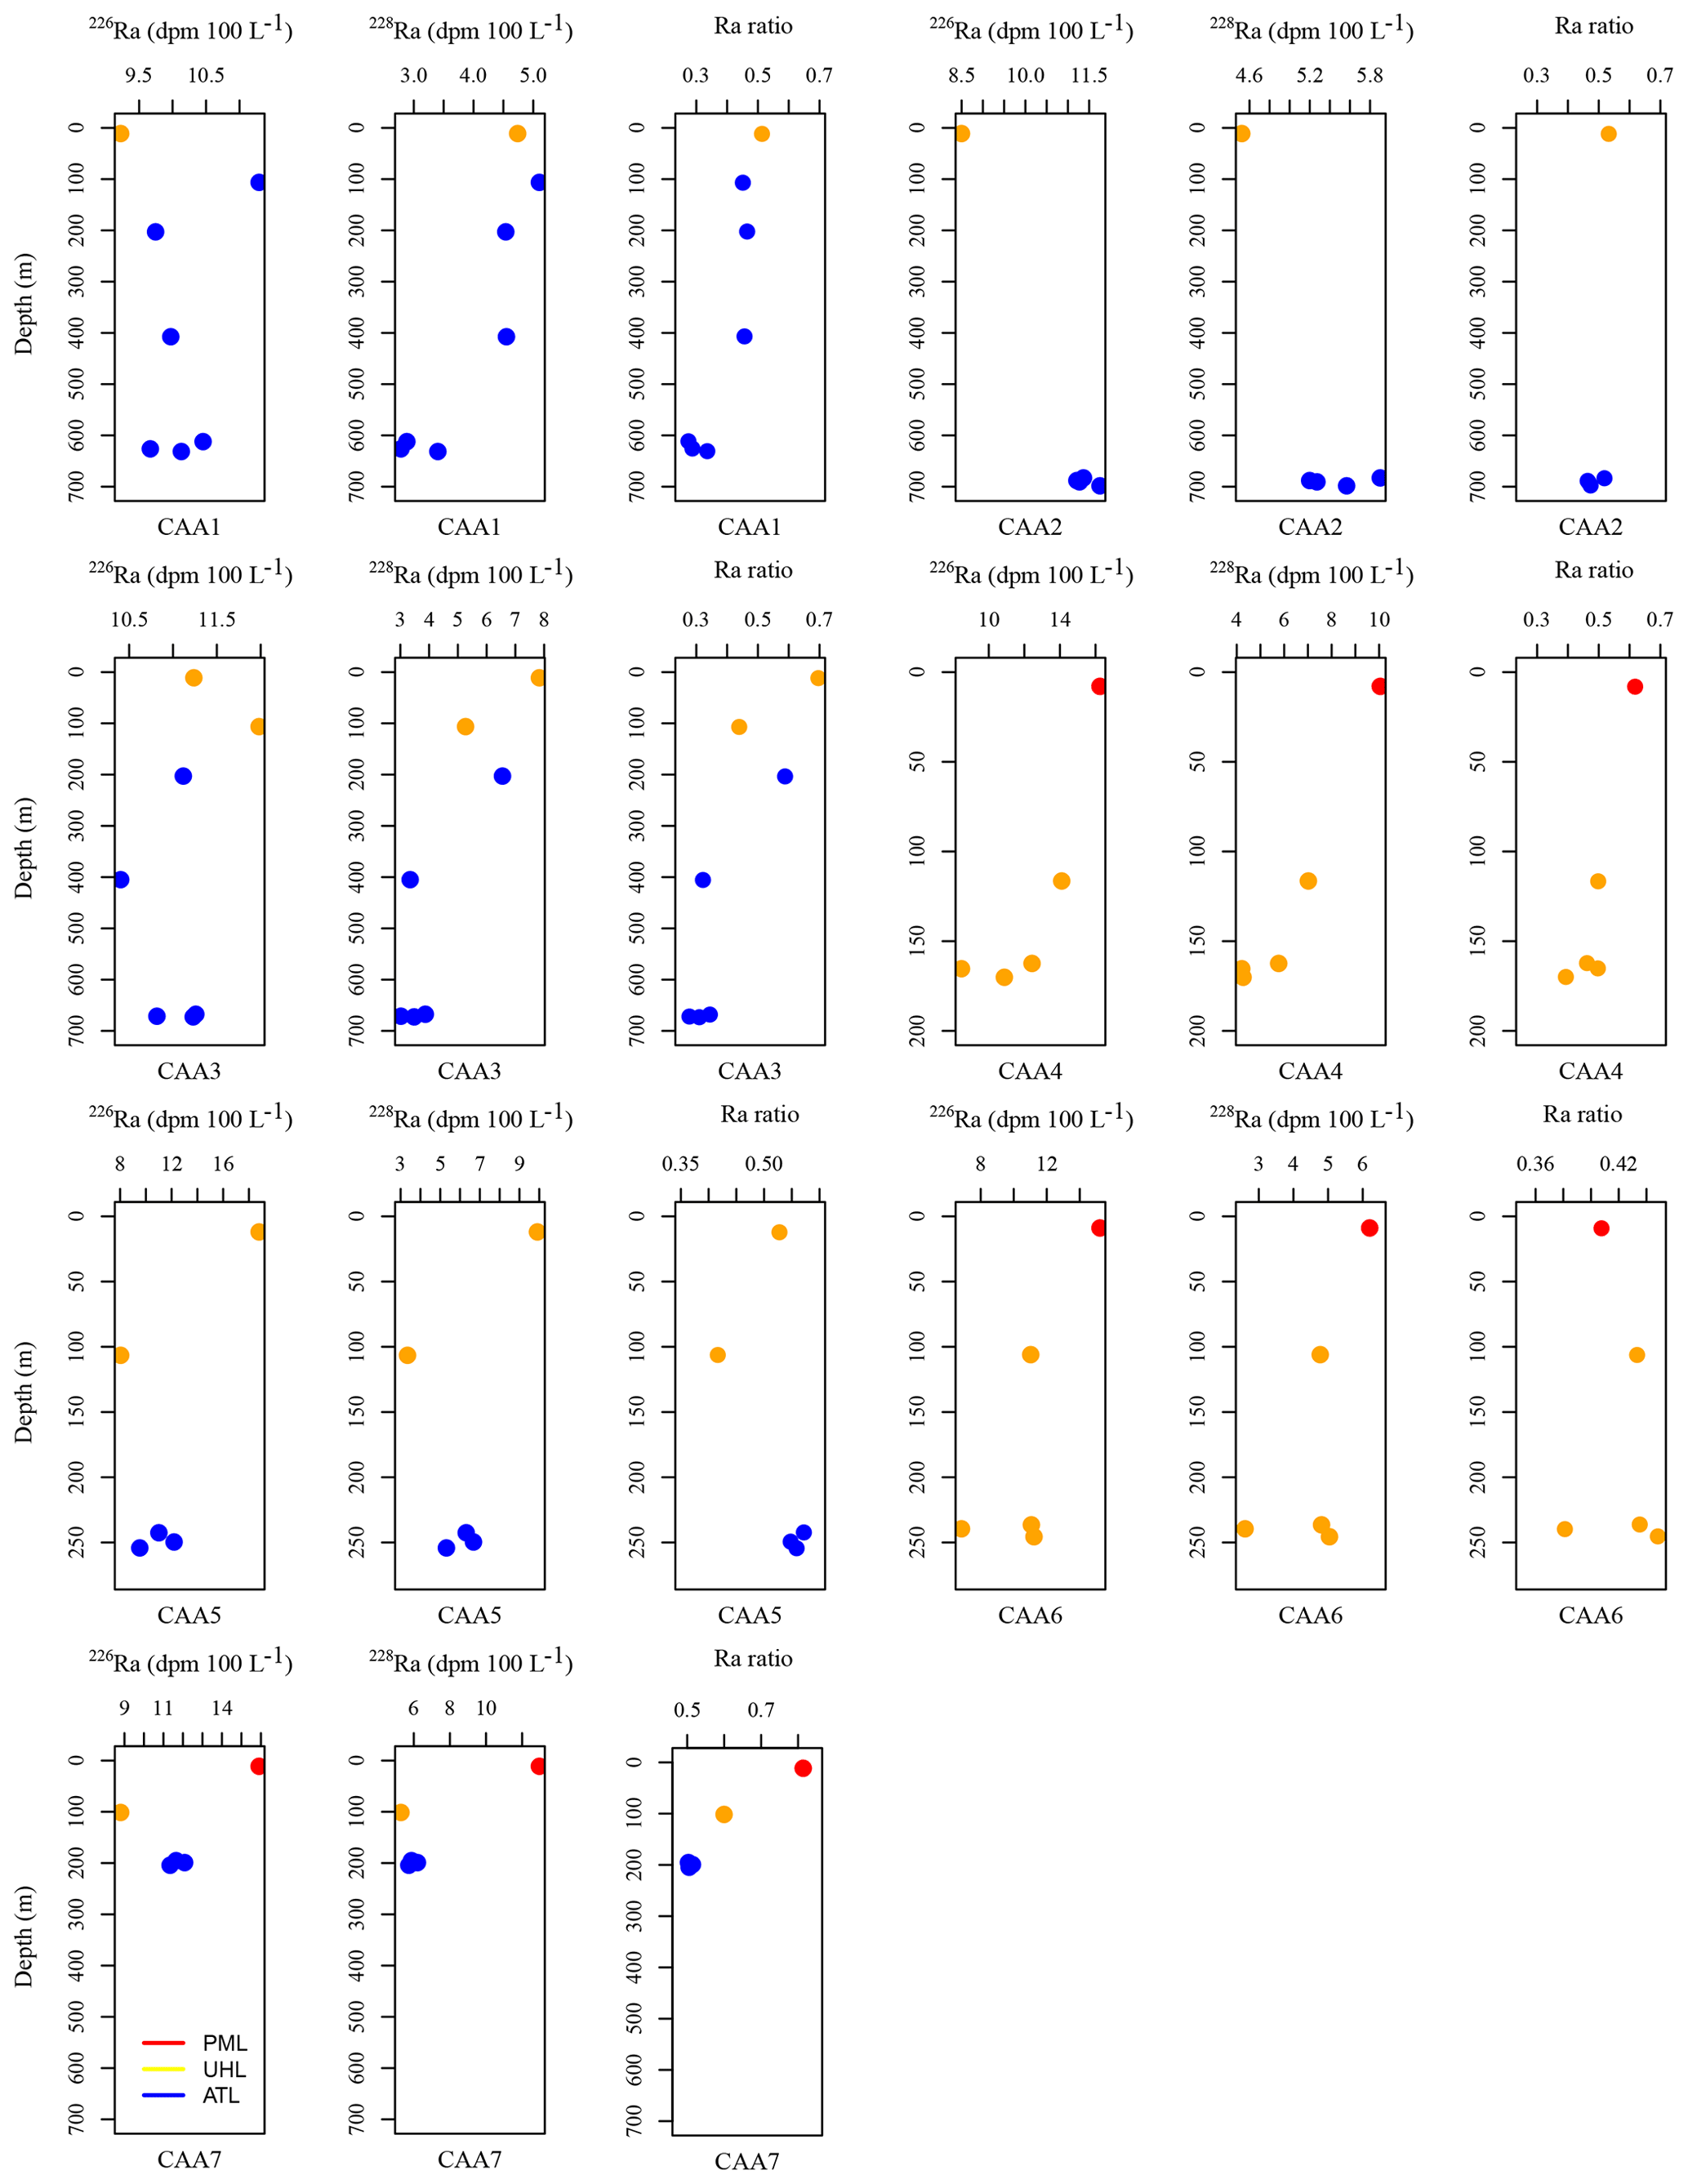
Figure A2226Ra (dpm 100 L−1), 228Ra (dpm 100 L−1), and Ra isotopic ratio (228Ra∕226Ra) plotted against depth for each station, including CAA1, CAA2, CAA3, CAA4, CAA5, CAA6, and CAA7, where profiles were taken throughout the 2015 GEOTRACES cruise in the Canadian Arctic Archipelago. Colors indicate the water masses present at the sampled depths: red is the polar mixed layer (PML), yellow is the upper halocline layer (UHL), and blue is the Atlantic layer (ATL).
Data will be released as a contribution to the GEOTRACES 2015 data product.
CMe evaluated and scientifically interpreted the data. HT supported sampling activities and provided scientific and editorial recommendations. AM provided δ18O data and scientific recommendations. MAC and PBH provided Ra measurements and scientific recommendations. FD and CMo provided Ba and Ba saturation state data, respectively, as well as scientific recommendations. HM provided advice on the PCA and the interpretation of the related results.
The authors declare that they have no conflict of interest.
We wish to express our sincere gratitude to Michiel Rutgers van der Loeff, Michael E. Böttcher, and Amber Annett, whose constructive reviews greatly helped to improve our paper. Furthermore, we wish to thank the captains and crew of the icebreaker CCGS Amundsen as well as the chief scientist, Roger Francois and his team for their support at sea. We would also like to extend our appreciation to Jacoba Mol and colleagues on the ship for their collaboration. This study was financially supported by the Canadian GEOTRACES program, as part of the NSERC-CCAR initiative. Matthew A. Charette and Paul B. Henderson were supported by U.S. GEOTRACES via the NSF Chemical Oceanography program (grant no. OCE-1458305). Frank Dehairs is grateful to Jacques Navez, Martine Leermakers, Kokuhennadige Hashan Niroshana for assistance during the Ba analyses in Brussels. Helmuth Thomas acknowledges support from the German Academic Exchange service (DAAD, MOPGA-GRI, grant no. 57429828), which received funds from the German Federal Ministry of Education and Research (BMBF).
This research has been supported by Canadian GEOTRACES via NSERC-CCAR, the U.S. GEOTRACES via NSF Chemical Oceanography (grant no. OCE-1458305), and the DAAD, MOPGA-GRI (grant no.57429828).
The article processing charges for this open-access
publication were covered by a Research
Centre of the Helmholtz Association.
This paper was edited by Manmohan Sarin and reviewed by Michael E. Böttcher, Michiel Rutgers van der Loeff, and Amber Annett.
Aagaard, K. and Carmack, E. C.: The role of sea ice and other fresh water in the Arctic circulation, J. Geophys. Res., 94, 14485, https://doi.org/10.1029/JC094iC10p14485, 1989.
Aagaard, K. and Carmack, E. C.: The Arctic Ocean and Climate: A Perspective, in The Polar Oceans and Their Role in Shaping the Global Environment, Geophys. Monogr. Ser., vol. 85, 5–20, AGU, Washington, D.C., USA, 1994.
Aagaard, K., Coachman, L. K., and Carmack, E.: On the halocline of the Arctic Ocean, Deep-Sea Res. Pt. A, 28, 529–545, https://doi.org/10.1016/0198-0149(81)90115-1, 1981.
Bacle, J., Carmack, E. C., and Ingram, R. G.: Water column structure and circulation under the North Water during spring transition: April–July 1998, Deep Sea Res. Part II Top. Stud. Oceanogr., 49(22–23), 4907–4925, https://doi.org/10.1016/S0967-0645(02)00170-4, 2002.
Bauch, D., Schlosser, P., and Fairbanks, R. G.: Freshwater balance and the sources of deep and bottom waters in the Arctic Ocean inferred from the distribution of H218O, Prog. Oceanogr., 35, 53–80, https://doi.org/10.1016/0079-6611(95)00005-2, 1995.
Broecker, W. S., Li, Y. H., and Cromwell, J.: Radium-226 and radon-222: Concentration in Atlantic and Pacific Oceans, Science, 158, 1307–1310, https://doi.org/10.1126/science.158.3806.1307, 1967.
Burt, W. J., Thomas, H., Hagens, M., Patsch, J., Clargo, N. M., Salt, L. A., Winde, V., and Bottcher, M. E.: Carbon sources in the North Sea evaluated by means of radium and stable carbon isotope tracers, Limnol. Oceanogr., 61, 666–683, https://doi.org/10.1002/lno.10243, 2016a.
Burt, W. J., Thomas, H., Miller, L. A., Granskog, M. A., Papakyriakou, T. N., and Pengelly, L.: Inorganic carbon cycling and biogeochemical processes in an Arctic inland sea (Hudson Bay), Biogeosciences, 13, 4659–4671, https://doi.org/10.5194/bg-13-4659-2016, 2016b.
Charette, M. A., Buesseler, K. O., and Andrews, J. E.: Utility of radium isotopes for evaluating the input and transport of groundwater-derived nitrogen to a Cape Cod estuary, Limnol. Oceanogr., 46, 465–470, https://doi.org/10.4319/lo.2001.46.2.0465, 2001.
Charette, M. A., Morris, P. J., Henderson, P. B., and Moore, W. S.: Radium isotope distributions during the US GEOTRACES North Atlantic cruises, Mar. Chem., 177, 184–195, https://doi.org/10.1016/j.marchem.2015.01.001, 2015.
Charette, M. A., Lam, P. J., Lohan, M. C., Kwon, E. Y., Hatje, V., Jeandel, C., Shiller, A. M., Cutter, G. A., Thomas, A., Boyd, P. W., Homoky, W. B., Milne, A., Thomas, H., Andersson, P. S., Porcelli, D., Tanaka, T., Geibert, W., Dehairs, F., and Garcia-Orellana, J.: Coastal ocean and shelf-sea biogeochemical cycling of trace elements and isotopes: lessons learned from GEOTRACES, Philos. T. Roy. Soc. A, 374, 20160076, https://doi.org/10.1098/rsta.2016.0076, 2016.
Chung, Y.: Radium-barium-silica correlations and a two-dimensional radium model for the world ocean, Earth Planet. Sc. Lett., 49, 309–318, https://doi.org/10.1016/0012-821X(80)90074-6, 1980.
Coachman, L. K. and Aagaard, K.: Physical Oceanography of Arctic and Subarctic Seas, in Marine Geology and Oceanography of the Arctic Seas, Springer Berlin Heidelberg, Berlin, Heidelberg, Germany, 1–72, 1974.
Coachman, L. K. and Barnes, C. A.: the Movement of Atlantic Water in the Arctic Ocean, Arctic, 16, 1–80, https://doi.org/10.14430/arctic3517, 1963.
Cooper, L. W., Benner, R., Mcclelland, J. W., Peterson, B. J., Holmes, R. M., Raymond, P. A., Hansell, D. A., Grebmeier, J. M., Codispoti, L. A., Cooper, L. W., Benner, R., Mcclelland, J. W., Peterson, B. J., Holmes, R. M., Raymond, P. A., Hansell, D. A., Grebmeier, J. M., and Codispoti, L. A.: Linkages among runoff, dissolved organic carbon, and the stable oxygen isotope composition of seawater and other water mass indicators in the Arctic Ocean, J. Geophys. Res., 110, 2013, https://doi.org/10.1029/2005JG000031, 2005.
Curry, B., Lee, C. M., and Petrie, B.: Volume, Freshwater, and Heat Fluxes through Davis Strait, 2004-05*, J. Phys. Oceanogr., 11, 429–436, https://doi.org/10.1175/2010JPO4536.1, 2011.
De Geer, L. E.: Currie detection limits in gamma-ray spectroscopy, Appl. Radiat. Isotopes, 61, 151–160, 2004.
Eicken, H., Krouse, H. R., Kadko, D., and Perovich, D. K.: Tracer studies of pathways and rates of meltwater transport through Arctic summer sea ice, J. Geophys. Res.-Oceans, 107, SHE 22-1–SHE 22-20, https://doi.org/10.1029/2000jc000583, 2002.
Epstein, S. and Mayeda, T.: Variation of O18 content of waters from natural sources, Geochim. Cosmochim. Ac., 4, 213–224, https://doi.org/10.1016/0016-7037(53)90051-9, 1953.
Friis, K., Kortzinger, A., and Wallace, D. W. R.: The salinity normalization of marine inorganic carbon chemistry data, Geophys. Res. Lett., 30, 1–4, https://doi.org/10.1029/2002GL015898, 2003.
Gonneea, M. E., Mulligan, A. E., and Charette, M. A.: Seasonal cycles in radium and barium within a subterranean estuary: Implications for groundwater derived chemical fluxes to surface waters, Geochim. Cosmochim. Ac., 119, 164–177, https://doi.org/10.1016/j.gca.2013.05.034, 2013.
Guay, C. K. and Falkner, K. K.: Barium as a tracer of Arctic halocline and river waters, Deep-Sea Res. Pt. II, 44, 1543–1559., 1997.
Guay, C. K. and Falkner, K.: A survey of dissolved barium in the estuaries of major Arctic rivers and adjacent seas, Cont. Shelf Res., 18, 859–882, 1998.
Guay, C. K. H., Mclaughlin, F. A., and Yamamoto-Kawai, M.: Differentiating fluvial components of upper Canada Basin waters on the basis of measurements of dissolved barium combined with other physical and chemical tracers, J. Geophys. Res., 114, C00A09, https://doi.org/10.1029/2008JC005099, 2009.
Gunasekaran, R. and Kasirajan, T.: Principal Component Analysis (PCA) for Beginners, Int. J. Adv. Sci. Res. Manag., 2, 9–11, 2017.
Hamilton, J. and Wu, Y.: Synopsis and trends in the physical environment of Baffin Bay and Davis Strait, Can. Tech. Rep. Hydrogr. Ocean Sci., 282, 1–39, 2013.
Hamilton, J., Collins, K., and Prinsenberg, S. J.: Links between ocean properties, ice cover, and plankton dynamics on interannual time scales in the Canadian Arctic Archipelago, J. Geophys. Res.-Oceans, 118, 5625–5639, https://doi.org/10.1002/jgrc.20382, 2013.
Holland, M. M., Bitz, C. M., Eby, M., and Weaver, A. J.: The role of ice-ocean interactions in the variability of the North Atlantic thermohaline circulation, J. Climate, 14, 656–675, https://doi.org/10.1175/1520-0442(2001)014<0656:TROIOI>2.0.CO;2, 2001.
Hoppema, M., Dehairs, F., Navez, J., Monnin, C., Jeandel, C., Fahrbach, E., and de Baar, H. J. W.: Distribution of barium in the Weddell Gyre: Impact of circulation and biogeochemical processes, Mar. Chem., 122, 118–129, https://doi.org/10.1016/j.marchem.2010.07.005, 2010.
Ingram, R. G. and Prinsenberg, S. J.: Coastal oceanography of Hudson Bay and surrounding eastern Canadian Arctic Waters Coastal Segment (26P), in: The Sea, edited by: Robinson, A. R. and Brink, K. H., Wiley, New York, USA, vol. 11, 835–861, 1998.
International Atomic Energy Agency (IAEA): Inventories of Selected Radionoclides in the Oceans, Vienna, Austria, 1988.
International Atomic Energy Agency (IAEA): Analytical Methodology for the Determination of Radium Isotopes in Environmental Samples (IAEA/AQ–19), Seiberdorf, Austria, 2010.
Jackson, J. E.: Scaling of Data, in: A Use's Guide to Principal Components, edited by: Jackson, J. E., https://doi.org/10.1002/0471725331.ch3, 2004.
Jakobsson, M.: Hypsometry and volume of the Arctic Ocean and its constituent seas, Geochem. Geophy. Geosy., 3, 1–18, https://doi.org/10.1029/2001GC000302, 2002.
Jolliffe, I. T. and Cadima, J.: Principal component analysis: a review and recent developments, Philos. Trans. A. Math. Phys. Eng. Sci., 374, 20150202, https://doi.org/10.1098/rsta.2015.0202, 2016.
Jones, E. P.: Tracing Pacific water in the North Atlantic Ocean, J. Geophys. Res., 108, 3116, https://doi.org/10.1029/2001JC001141, 2003.
Kadko, D. and Muench, R.: Evaluation of shelf-basin interaction in the western Arctic by use of short-lived radium isotopes: The importance of mesoscale processes, Deep-Sea Res. Pt. II, 52, 3227–3244, https://doi.org/10.1016/j.dsr2.2005.10.008, 2005.
Kawakami, H. and Kusakabe, M.: Surface water mixing estimated from 228Ra and 226Ra in the northwestern North Pacific, J. Environ. Radioact., 99, 1335–1340, https://doi.org/10.1016/j.jenvrad.2008.04.011, 2008.
Kipp, L. E., Charette, M. A., Moore, W. S., Henderson, P. B., and Rigor, I. G.: Increased fluxes of shelf-derived materials to the central Arctic Ocean, Sci. Adv., 4, 1–9, https://doi.org/10.1126/sciadv.aao1302, 2018.
Kipp, L. E., Kadko, D. C., Pickart, R. S., Henderson, P. B., Moore, W. S., and Charette, M. A.: Shelf-Basin Interactions and Water Mass Residence Times in the Western Arctic Ocean: Insights Provided by Radium Isotopes, J. Geophys. Res.-Oceans, 124, 3279–3297, https://doi.org/10.1029/2019JC014988, 2019.
Lansard, B., Mucci, A., Miller, L. A., Macdonald, R. W., and Gratton, Y.: Seasonal variability of water mass distribution in the southeastern Beaufort Sea determined by total alkalinity and δ18O, J. Geophys. Res.-Oceans, 117, C03003, https://doi.org/10.1029/2011JC007299, 2012.
Le Roy, E., Sanial, V., Charette, M. A., van Beek, P., Lacan, F., Jacquet, S. H. M., Henderson, P. B., Souhaut, M., García-Ibáñez, M. I., Jeandel, C., Pérez, F. F., and Sarthou, G.: The 226Ra–Ba relationship in the North Atlantic during GEOTRACES-GA01, Biogeosciences, 15, 3027–3048, https://doi.org/10.5194/bg-15-3027-2018, 2018.
Lobb, J., Carmack, E. C., Ingram, R. G., and Weaver, A. J.: Structure and mixing across an Arctic/Atlantic front in northern Baffin Bay, Geophys. Res. Lett., 30, 1833, https://doi.org/10.1029/2003GL017755, 2003.
Macdonald, R. W., Wong, C. S., and Erickson, P. E.: The distribution of nutrients in the southeastern Beaufort Sea: Implications for water circulation and primary production, J. Geophys. Res., 92, 2939, https://doi.org/10.1029/JC092iC03p02939, 1987.
Macdonald, R. W., Carmack, E. C., McLaughlin, F. A., Iseki, K., Macdonald, D. M., and O'Brien, M. C.: Composition and modification of water masses in the Mackenzie shelf estuary, J. Geophys. Res., 94, 18057, https://doi.org/10.1029/JC094iC12p18057, 1989.
Macdonald, R. W., Carmack, E. C., Mclaughlin, F. A., Falkner, K. K., and Swift, J. H.: Connections among ice, runoff and atmospheric forcing in the Beaufort Gyre, Geophys. Res. Lett., 26, 2223–2226, https://doi.org/10.1029/1999GL900508, 1999.
Mathis, J. T., Hansell, D. A., and Bates, N. R.: Strong hydrographic controls on spatial and seasonal variability of dissolved organic carbon in the Chukchi Sea, Deep-Sea Res. Pt. II, 52, 3245–3258, https://doi.org/10.1016/J.DSR2.2005.10.002, 2005.
Monnin, C.: A thermodynamic model for the solubility of barite and celestite in electrolyte solutions and seawater to 200 ∘C and to 1 kbar, Chem. Geol., 153, 187–209, https://doi.org/10.1016/S0009-2541(98)00171-5, 1999.
Moore, W. S.: Determining coastal mixing rates using radium isotopes, Cont. Shelf Res., 20, 1993–2007, https://doi.org/10.1016/S0278-4343(00)00054-6, 2000.
Moore, W. S.: Seasonal distribution and flux of radium isotopes on the southeastern U.S. continental shelf, J. Geophys. Res., 112, C10013, https://doi.org/10.1029/2007JC004199, 2007.
Moore, W. S.: Fifteen years experience in measuring 224Ra and 223Ra by delayed-coincidence counting, Mar. Chem., 109, 188–197, https://doi.org/10.1016/j.marchem.2007.06.015, 2008.
Moore, W. S. and Arnold, R.: Measurement of 223 Ra and 224 Ra in coastal waters using a delayed coincidence counter, J. Geophys. Res.-Oceans, 101, 1321–1329, https://doi.org/10.1029/95JC03139, 1996.
Moore, W. S. and Dymond, J.: Fluxes of 226Ra and barium in the Pacific Ocean: The importance of boundary processes, Earth Planet. Sc. Lett., 107, 55–68, https://doi.org/10.1016/0012-821X(91)90043-H, 1991.
Moore, W. S. and Reid, D. F.: Extraction of Radium from Natural Waters Using Manganese-Impregnated Acrylic Fibers, J. Geophys. Res., 78, 8880–8886, https://doi.org/10.1029/JC078i036p08880, 1973.
Moore, W. S., Feely, H. W., and Li, Y.-H.: Radium isotopes in sub-Arctic waters, Earth Planet. Sc. Lett., 49, 329–340, https://doi.org/10.1016/0012-821X(80)90076-X, 1980.
Moore, W. S., Sarmiento, J. L., and Key, R. M.: Submarine groundwater discharge revealed by 228Ra distribution in the upper Atlantic Ocean, Nat. Geosci., 1, 309–311, https://doi.org/10.1038/ngeo183, 2008.
Mucci, A., Levasseur, M., Gratton, Y., Martias, C., Scarratt, M., Gilbert, D., Tremblay, J.-E., Ferreyra, G., and Lansard, B.: Tidally induced variations of pH at the head of the Laurentian Channel, Can. J. Fish. Aquat. Sci., 75, 1128–1141, https://doi.org/10.1139/cjfas-2017-0007, 2018.
Newton, J. L. and Coachman, L. K.: Atlantic Water Circulation in the Canada Basin, Arctic, 27, 297–303, https://doi.org/10.14430/arctic2886, 1974.
Pearson, K.: On lines and planes of closet fit to systems of points in space, J. Sci., 2, 559–572, https://doi.org/10.1080/14786440109462720, 1901.
Peres-Neto, P. R., Jackson, D. A., and Somers, K. M.: Giving meaningful interpritation to ordination axes: Assesing loading significance in principal components analysis, Ecology, 84, 2347–2363, https://doi.org/10.1890/00-0634, 2003.
Peterson, I., Hamilton, J., Prinsenberg, S., and Pettipas, R.: Wind-forcing of volume transport through Lancaster Sound, J. Geophys. Res.-Oceans, 117, C11018, https://doi.org/10.1029/2012JC008140, 2012.
Prinsenberg, S. J.: Volume, Heat and freshwater flxes through the Canadian Arctic Archipelago: Present Understanding and Future Research Plans, report, Bedford Institute of Oceanography, Fisheries and Oceans Canada, Dartmouth, NS, Canada, 1982.
Prinsenberg, S. J. and Bennett, E. B.: Mixing and transports in Barrow Strait, the central part of the Northwest Passage, Cont. Shelf Res., 7, 913–935, https://doi.org/10.1016/0278-4343(87)90006-9, 1987.
Prinsenberg, S. J., Hamilton, J., Peterson, I., and Pettipas, R.: Observing and interpreting the seasonal variability of the oceanographic fluxes passing through Lancaster Sound of the Canadian Arctic Archipelago, in: Influence of Climate Change on the Changing Arctic and Sub-Arctic Conditions, edited by: Nihoul, J. C. J. and Kostianoy, A. G., NATO Science for Peace and Security Series C: Environmental Security, Springer, Dordrecht, https://doi.org/10.1007/978-1-4020-9460-6_10, 2009.
Rahmstorf, S.: Ocean circulation and climate during the past 120,000 years, Nature, 419, 207–214, https://doi.org/10.1038/nature01090, 2002.
Rudels, B.: The outflow of polar water through the Arctic Archipelago and the oceanographic conditions in Baffin Bay, Polar Res., 4, 161–180, https://doi.org/10.3402/polar.v4i2.6929, 1986.
Rutgers Van Der Loeff, M. M., Key, R. M., Scholten, J., Bauch, D., and Michel, A.: 228Ra as a tracer for shelf water in the arctic ocean, Deep-Sea Res. Pt. II, 42, 1533–1553, https://doi.org/10.1016/0967-0645(95)00053-4, 1995.
Rutgers Van Der Loeff, M. and Moore, W. S.: Determination of natural radioactive tracers, in: Methods of Seawater Analysis, edited by: Grasshoff, K., Kremling, K., and Ehrhardt, M., https://doi.org/10.1002/9783527613984.ch13, 2007.
Rutgers Van Der Loeff, M., Kuhne, S., Wahsner, M., Holtzen, H., Frank, M., Ekwurzel, B., Mensch, M., and Rachold, V.: 228Ra and 226Ra in the Kara and Laptev seas, Cont. Shelf Res., 23, 113–124, https://doi.org/10.1016/S0278-4343(02)00169-3, 2003.
Shadwick, E. H., Thomas, H., Gratton, Y., Leong, D., Moore, S. A., Papakyriakou, T., and Prowe, A. E. F.: Export of Pacific carbon through the Arctic Archipelago to the North Atlantic, Cont. Shelf Res., 31, 806–816, https://doi.org/10.1016/j.csr.2011.01.014, 2011a.
Shadwick, E. H., Thomas, H., Chierici, M., Else, B., Fransson, A., Michel, C., Miller, L. A., Mucci, A., Niemi, A., Papakyriakou, T. N., and Tremblay, J.-E.: Seasonal variability of the inorganic carbon system in the Amundsen Gulf region of the southeastern Beaufort Sea, Limnol. Oceanogr., 56, 303–322, https://doi.org/10.4319/lo.2011.56.1.0303, 2011b.
Shadwick, E. H., Trull, T. W., Thomas, H., and Gibson, J. A. E.: Vulnerability of Polar Oceans to Anthropogenic Acidification: Comparison of Arctic and Antarctic Seasonal Cycles, Sci. Rep., 3, 2339, https://doi.org/10.1038/srep02339, 2013.
Smith, J., Moran, S., and Macdonald, R.: Shelf–basin interactions in the Arctic Ocean based on 210Pb and Ra isotope tracer distributions, Deep-Sea Res. Pt. I, 50, 397–416, https://doi.org/10.1016/S0967-0637(02)00166-8, 2003.
Thomas, H., Shadwick, E., Dehairs, F., Lansard, B., Mucci, A., Navez, J., Gratton, Y., Prowe, F., Chierici, M., Fransson, A., Papakyriakou, T. N., Sternberg, E., Miller, L. A., Tremblay, J. E., and Monnin, C.: Barium and carbon fluxes in the Canadian Arctic Archipelago, J. Geophys. Res., 116, 1–16, https://doi.org/10.1029/2011JC007120, 2011.
van Beek, P., Bourquin, M., Reyss, J.-L., Souhaut, M., Charette, M. A., and Jeandel, C.: Radium isotopes to investigate the water mass pathways on the Kerguelen Plateau (Southern Ocean), Deep-Sea Res. Pt. II, 55, 622–637, https://doi.org/10.1016/J.DSR2.2007.12.025, 2007.
Walsh, J. J.: Importance of continental margins in the marine biogeochemical cycling of carbon and nitrogen, Nature, 350, 53–55, https://doi.org/10.1038/350053a0, 1991.
Wang, Q., Myers, P. G., Hu, X., and Bush, A. B. G.: Flow Constraints on Pathways through the Canadian Arctic Archipelago, Atmos.-Ocean, 50, 373–385, https://doi.org/10.1080/07055900.2012.704348, 2012.
Xing, N., Chen, M., Huang, Y., Cai, P., and Qiu, Y.: Distribution of 226Ra in the Arctic Ocean and the Bering Sea and its hydrologic implications, Sci. China Ser. D, 46, 516–528, https://doi.org/10.1360/03yd9045, 2003.
Yamamoto-Kawai, M., Mclaughlin, F. A., Carmack, E. C., Nishino, S., Shimada, K., and Kurita, N.: Surface freshening of the Canada Basin, J. Geophys. Res., 114, C00A05, https://doi.org/10.1029/2008JC005000, 2009.
Yamamoto-Kawai, M., Carmack, E. C., McLaughlin, F. A., and Falkner, K. K.: Oxygen isotope ratio, barium and salinity in waters around the North American coast from the Pacific to the Atlantic: Implications for freshwater sources to the Arctic throughflow, J. Mar. Res., 68, 97–117, https://doi.org/10.1357/002224010793078988, 2010.
The requested paper has a corresponding corrigendum published. Please read the corrigendum first before downloading the article.
- Article
(9748 KB) - Full-text XML