the Creative Commons Attribution 4.0 License.
the Creative Commons Attribution 4.0 License.
 | 29 Oct 2020
Methane paradox in tropical lakes? Sedimentary fluxes rather than pelagic production in oxic conditions sustain methanotrophy and emissions to the atmosphere
Cédric Morana
Steven Bouillon
Vimac Nolla-Ardèvol
Fleur A. E. Roland
William Okello
Jean-Pierre Descy
Angela Nankabirwa
Erina Nabafu
Dirk Springael
Alberto V. Borges
Despite growing evidence that methane (CH4) formation could also occur in well-oxygenated surface fresh waters, its significance at the ecosystem scale is uncertain. Empirical models based on data gathered at high latitude predict that the contribution of oxic CH4 increases with lake size and should represent the majority of CH4 emissions in large lakes. However, such predictive models could not directly apply to tropical lakes, which differ from their temperate counterparts in some fundamental characteristics, such as year-round elevated water temperature. We conducted stable-isotope tracer experiments, which revealed that oxic CH4 production is closely related to phytoplankton metabolism and is a common feature in five contrasting African lakes. Nevertheless, methanotrophic activity in surface waters and CH4 emissions to the atmosphere were predominantly fuelled by CH4 generated in sediments and physically transported to the surface. Indeed, CH4 bubble dissolution flux and diffusive benthic CH4 flux were several orders of magnitude higher than CH4 production in surface waters. Microbial CH4 consumption dramatically decreased with increasing sunlight intensity, suggesting that the freshwater “CH4 paradox” might be also partly explained by photo-inhibition of CH4 oxidizers in the illuminated zone. Sunlight appeared as an overlooked but important factor determining the CH4 dynamics in surface waters, directly affecting its production by photoautotrophs and consumption by methanotrophs.
- Article
(1746 KB) - Full-text XML
-
Supplement
(922 KB) - BibTeX
- EndNote


Emissions from inland waters are an important component of the global methane (CH4) budget (Bastviken et al., 2011), in particular from tropical latitudes (Borges et al., 2015). While progress has been made in evaluating the CH4 emission rates, much less attention has been given to the underlying microbial production (methanogenesis) and loss (methane oxidation) processes. It is generally assumed that CH4 in lakes originates from the degradation of organic matter in anoxic sediments. Because most methanogens are considered to be strict anaerobes, and net vertical diffusion of CH4 from anoxic bottom waters is often negligible (Bastviken et al., 2003), physical processes of CH4 transport from shallow sediments are usually invoked to explain patterns of local CH4 concentration maxima in surface waters (Fernández et al., 2016; Peeters et al., 2019; Martinez-Cruz et al., 2020). Indeed, CH4-rich pore water is regularly released from littoral sediment into the water column during resuspension events associated with surface waves (Hofmann et al., 2010).
The view that CH4 is formed under strictly anaerobic conditions has been challenged by several recent studies, which have proposed that acetoclastic methanogens directly attached to phytoplankton cells are involved in epilimnetic CH4 production (Grossart et al., 2011; Bogard et al., 2014) and are responsible for distinct near-surface peaks of CH4 concentration in certain thermally stratified, well-oxygenated waterbodies (Tang et al., 2016). It has also been shown that Cyanobacteria (Biz̆ić et al., 2020) and widespread marine phytoplankton (Klintzsch et al., 2019) are able to release a substantial amount of CH4 during a culture study, and this CH4 production mechanism might be linked to photosynthesis. From a model-based approach, epilimnetic CH4 production was shown to sustain most of the CH4 oxidation in 14 Canadian lakes (DelSontro et al., 2018) and would even represent up to 90 % of the CH4 emitted from a temperate lake (Donis et al., 2017). Further, empirical models based on data gathered in boreal and temperate lakes predict that the contribution of oxic CH4 increases with lake size (Günthel et al., 2019) and should represent the majority of CH4 emissions in lakes larger than 1 km2. Still, aerobic CH4 production has so far only been documented in temperate and boreal lakes so that such predictive models could not directly apply to tropical lakes, which differ from their temperate counterparts in some fundamental characteristics, such as year-round elevated water temperature. Primary production, methanogenic and methanotrophic activities, and cyanobacterial dominance are potentially much higher in tropical lakes due to favourable temperature (Lewis, 1987; Kosten et al., 2012). It has also been shown that CH4 emissions are positively related to temperature at the ecosystem scale (Yvon-Durocher et al., 2014)
Here, we tested the hypothesis that phytoplankton metabolism could fuel CH4 production in well-oxygenated waters in five contrasting tropical lakes in East Africa covering a wide range of sizes, depths, and productivity (Lake Edward, Lake George, Lake Katinda, Lake Nyamusingere and Lake Kyambura). Phytoplankton activity could provide diverse substrates required for CH4 production mediated by methanogenic Archaea, or alternatively CH4 could be directly released by phytoplankton cells. Additionally, the significance of epilimnetic CH4 production at the scale of the aquatic ecosystem was assessed by quantifying CH4 release from sediments, CH4 production and oxidation rates in the water column, and CH4 diffusive and ebullitive emissions to the atmosphere.
2.1 Site description
The sampled lakes cover a wide range of size (<1 to 2300 km2), maximum depth (3–117 m), mixing regimes, phytoplankton biomass and primary productivity (Table S1 in the Supplement). Oligotrophic Lake Kyamwinga (−0.18054∘ N, 30.14625∘ E) and eutrophic Lake Katinda (−0.21803∘ N, 30.10702∘ E) are stratified, small but deep tropical lakes located in western Uganda. Neighbouring Lake Nyamusingere (−0.284364∘ N, 30.037635∘ E) is a small but shallow and polymictic eutrophic lake. Lake George is a larger (250 km2), hypereutrophic, shallow lake located at the Equator (−0.02273∘ N, 30.19724∘ E). A single outlet (Kazinga Channel) flows from Lake George to the neighbouring Lake Edward (−0.28971∘ N, 29.73327∘ E), a holomictic, mesotrophic large lake (2325 km2).
Water samples from pelagic stations of Lake Katinda (0.3 km from shore, 14 m deep), Lake George (2 km from shore, 2.5 m deep) and Lake Edward (15 km from shore, 20 m deep) were collected in April 2017 (rainy season) and January 2018 (dry season). Pelagic sites of Lake Kyamwinga (0.5 km from shore, 40 m deep) and Lake Nyamusingere (0.2 km from shore, 3 m deep) were sampled only once, in April 2017 and January 2018, respectively.
2.2 Environmental setting of the study sites
Conductivity, temperature and dissolved-oxygen concentration measurements were performed with a Yellow Spring Instrument EXO II multi-parametric probe. Samples for particulate organic carbon (POC) concentration were collected on glass fibre filters (0.7 µm nominal pore size) and analysed with an elemental analyser coupled to an isotope ratio mass spectrometer (EA–IRMS; Morana et al., 2015a). Pigment concentrations were determined by high-performance liquid chromatography (Descy et al., 2017) after filtration of water samples through glass fibre filters (0.7 µm nominal pore size).
Water samples for determination of dissolved CH4 concentration were transferred with tubing from the Niskin bottle to 60 mL borosilicate serum bottles that were poisoned with 200 µL of a saturated solution of HgCl2, closed with a butyl stopper and sealed with an aluminium cap. The concentrations of dissolved CH4 were measured with the headspace equilibration technique (20 mL headspace) using a gas chromatograph with flame ionization detection (GC–FID, SRI8610C).
Samples for δ13C–CH4 determination were collected in 60 mL serum bottles following the same procedure as samples for CH4 concentration determination. In the laboratory, δ13C–CH4 was measured as described in Morana et al. (2015b). Briefly, a 20 mL helium headspace was created in the serum bottles, then samples were vigorously shaken and left to equilibrate overnight. The sample gas was flushed out through a double-hole needle and purified of non-CH4 volatile organic compounds in a liquid N2 trap, CO2 and H2O were removed with a soda lime and magnesium perchlorate traps, and the CH4 was converted to CO2 in an online combustion column similar to that in an elemental analyser (EA). The resulting CO2 was subsequently pre-concentrated in a custom-built cryo-focussing device by immersion of a stainless-steel loop in liquid N2, passed through a micro-packed GC column (HayeSep Q 2 m, 0.75 mm ID; Restek), and finally measured on a Thermo Scientific Delta V Advantage isotope ratio mass spectrometer (IRMS). CO2 produced from certified reference standards for δ13C analysis (IAEA-CO1 and LSVEC) were used to calibrate δ13C–CH4 data. Reproducibility of measurements estimated based on duplicate injection of a selection of samples was typically better than 0.5 ‰ or better than 0.2‰ when estimated based on multiple injection of standard gas.
2.3 Diffusive CH4 flux calculation
Surface CH4 concentrations were used to compute the diffusive air–water CH4 fluxes (FCH4) according to Eq. (1):
where k is the gas transfer velocity of CH4 computed from wind speed (Cole and Caraco, 1998) and the Schmidt number of CH4 in fresh water (Wanninkhof, 1992), and ΔCH4 is the air–water gradient. Wind speed data were acquired with a Davis Instruments meteorological station located on Mweya peninsula (0.11∘ S, 29.53∘ E).
2.4 CH4 ebullition flux
CH4 ebullition flux was investigated in lakes Edward (at 20 m), George (at 2.5 m), and Nyamusingere (at 3 m) only, at the same sampling sites where biogeochemical processes were measured. Bubble traps made with an inverted funnel (24 cm diameter) connected to a 60 mL syringe were deployed for a period between 24 and 48 h at 0.5 m below the water surface (four replicates). Measurements were performed at sites with water depth of 20, 2.5 and 3 m for lakes Edward, George and Nyamusingere, respectively. After measuring the gas volume collected within the trap during the sampling period, the gas bubbles were transferred in a tightly closed 12 mL Exetainer vial (Labco) for subsequent analysis of their CH4 concentration. Variability of the gas volume in the four replicates was less than 10 %. We used the SiBu-GUI software (McGinnis et al., 2006; Greinert and McGinnis, 2009) to correct for gas exchange within the water column during the rise of bubbles and thus obtained the CH4 ebullition and CH4 bubble dissolution fluxes. Calculations were made following several scenarios: two extreme bubble-size scenarios considering a release of many small (3 mm diameter) bubbles or fewer large (10 mm) bubbles and an intermediate scenario of release of 6 mm diameter bubbles. Delwiche and Hemond (2017) experimentally determined that a large majority (∼90 %) of the bubbles released from lake sediments fall in this size interval.
2.5 Potential CH4 flux across the sediment–water interface
The potential CH4 flux across the sediment–water interface was determined from short-term intact core incubations in Lake Edward, Lake George and Lake Nyamusingere only, at the same sampling sites where biogeochemical processes were measured. CH4 flux was quantified from the change in CH4 concentration in overlying waters at five different time steps, every 2 h. Briefly, in every lake, two sediment cores (6 cm wide; ∼30 cm of sediment and 30 cm of water) were collected, taking care to avoid disturbance at the sediment–water interface. Cores were kept in the dark until back in the laboratory, typically 6 h later. Overlying water was carefully removed with a syringe, taking care to avoid any disturbance of the sediments. It was replaced by bottom lake water, which had been previously filtered through 0.2 µm polycarbonate filters (GSWP, Millipore) in order to remove water column methanotrophs and degassed with helium for 20 min in order to remove background O2 and CH4, and the filtered and degassed water was gently returned to the core tubes on top of the sediments. Core tubes were tightly closed with a thick rubber stopper equipped with two sampling valves. A magnetic stirrer placed ∼10 cm above the sediments was allowed to rotate gently in order to homogenize the overlying water layer during the incubation. At each time step, 60 mL of overlying water was sampled by connecting a syringe to the first sampling valve while an equivalent volume of degassed water was allowed to flow through the second valve in order to avoid any pressure disequilibrium. Subsamples of overlying water were transferred into two 20 mL serum bottles filled without headspace and poisoned with HgCl2. Determination of the dissolved CH4 concentration was performed with a GC–FID following the same procedure as described above. The removal of oxygen might have inhibited the biogeochemical activity of aerobic methanotrophs present at the sediment–water interface; hence we considered that the results gathered from this experiment are representative of a potential (maximal) CH4 flux.
2.6 Primary production and N2 fixation
Primary production and N2 fixation rates were determined from dual stable-isotope photosynthesis–irradiance experiments using NaH13CO3 (Eurisotop) and dissolved 15N2 (Eurisotop) as tracers for incorporation of dissolved inorganic carbon (DIC) and N2 into the biomass. The 15N2 tracer was dissolved in water (Mohr et al., 2010). Incident light intensity was measured by a LI-190SB quantum sensor during daytime during the entire duration of the sampling campaign. At each station a sample of surface waters (500 mL) was spiked with the tracers (final 15N atom excess ∼5 %). Three subsamples were preserved with HgCl2 in 12 mL Exetainer vials (Labco) for the determination of the exact initial 13C–DIC and 15N–N2 enrichment. The rest of the sample was divided into nine 50 mL polycarbonate flasks, filled without headspace. Eight flasks were placed into a floating incubation device, providing a range of light intensity (from 0 % to 80 % natural light) using neutral density filter screen (LEE Filters). The last one was immediately amended with neutral formaldehyde (0.5 % final concentration) and served as a killed control sample. Samples were incubated in situ for 2 h around midday just below the surface at lake surface temperature. After incubation, biological activity was stopped by adding neutral formaldehyde into the flasks, and the nine samples were filtered on pre-combusted glass fibre (GF/F grade) filters when back in the lab. Glass fibre filters were decarbonated with HCl fumes overnight, dried, and their δ13C–POC and δ15N–PN (particulate nitrogen) values were determined with an EA–IRMS (Thermo Flash HT – Delta V Advantage). For the measurement of the initial 15N2 enrichment, a 2 mL helium headspace was created, and after 12 h equilibration, a fraction of the headspace was injected into the above-mentioned EA–IRMS equipped with a Cu column warmed at 640 ∘C and a CO2 trap. Initial enrichment of 13C–DIC was also measured.
Photosynthetic (Pi; Hama et al., 1983) and N2 fixation (N2fixi; Montoya et al., 1996) rates in individual bottles were calculated and corrected for any abiotic tracer incorporation by subtraction of the killed control value. For each experiment, the maximum photosynthetic and N2 fixation rates (Pmax, N2fixmax) and the irradiance at the onset of light saturation (Ik_PP, Ik_N2fix) were determined by fitting Pi and N2fixi to the light intensity gradient provided by the incubator (Ii) using Eq. (2) for photosynthesis activity (Vollenweider, 1965) and (Eq. 3) for N2 fixation (Mugidde et al., 2003).
2.7 Determination of CH4 oxidation rates
CH4 oxidation rates in surface waters (1 m depth) were determined from the decrease in CH4 concentrations measured during short (typically <24 h) time course experiments. Samples for CH4 oxidation rate measurement were collected in 60 mL glass serum bottles filled directly from the Niskin bottle with tubing, left to overflow, and immediately closed with butyl stoppers previously boiled in Milli-Q water and sealed with aluminium caps. The first bottle was then poisoned with a saturated solution of HgCl2 (100 µL) injected through the butyl stopper with a polypropylene syringe and a steel needle and corresponded to the initial CH4 concentration at the beginning of the incubation (T0).
The remaining bottles were incubated in the dark at in situ (∼26 ∘C) temperature for ∼12 h or ∼24 h except in lakes George and Nyamusingere, where the incubation was shorter (∼6 h). At four different time steps, one bottle was poisoned with 100 µL of HgCl2 and stored in the dark until measurement of the CH4 concentrations with the above-mentioned GC–FID. CH4 oxidation rates were calculated as a linear regression of CH4 concentrations over time (r2 generally better than 0.80) during the course of the incubation. O2 consumption was followed in a parallel incubation of water samples in 60 mL biological oxygen demand bottles (Wheaton) to ensure the samples were incubated under oxic conditions during the full course of this short-term experiment.
2.8 Sunlight inhibitory effect on CH4 oxidation
The influence of light intensity on methanotrophy was investigated in Lake Edward (April 2017 and January 2018), Lake Nyamusingere and Lake George (January 2018) by means of a stable-isotope (13CH4) labelling experiment. For each experiment, 12 serum bottles (60 mL) were filled with lake surface waters (1 m) as described above. All bottles were spiked with 100 µL of a solution of dissolved 13CH4 (50 µmol L−1 final concentration, 99 % enrichment) added in excess. In Lake Edward in January, half of the bottles were amended with 3-(3,4-dichlorophenyl)-1,1-dimethylurea (DCMU; 0.5 mg L−1) in order to inhibit photosynthesis (Bishop, 1958) and investigate the hypothetical inhibitory effect of dissolved O2 production by phytoplankton. Two bottles were poisoned immediately with pH-neutral formaldehyde (0.5 % final concentration) and served as killed controls. The 10 others were incubated for 24 h at 26 ∘C in a floating device providing five different light intensities (from 0 % to 80 % of natural light using neutral density filter screens; LEE Filters). For every bottle at the end of the incubation, one 12 mL vial (Labco Exetainer) was filled with the water sample and preserved with 50 µL HgCl2. The rest of the sample (∼50 mL) was filtered on a pre-combusted glass fibre (GF/F grade) filter for subsequent δ13C–POC measurement.
δ13C–DIC and δ13C–POC were determined with an EA–IRMS following the method described in Gillikin and Bouillon (2007) and Morana et al. (2015), respectively. The methanotrophic bacterial production (MBP), defined as the CH4-derived 13C incorporation rates into the POC pool, was calculated as in Eq. (4) (Morana et al., 2015):
where POCt is the concentration of POC after incubation, %13C–POCt and %13C–POCi are the final and initial percentage of 13C in the POC, t is the incubation time, and %13C–CH4 is the percentage of 13C in CH4 after the inoculation of the bottles with the tracer. Similarly, the methanotrophic bacterial respiration (MBR) rates, defined as the CH4-derived 13C incorporation rates into the DIC pool, were calculated as in Eq. (5):
where DICt is the concentration of DIC after the incubation, %13C–DICt and %13C–DICi are the final and initial percentage of 13C in DIC, and %13C–CH4 is the percentage of 13C in CH4 after the inoculation of the bottles with the tracer.
Potential CH4 oxidation rate (MOX) was calculated as the sum of MBP and MBR rates. The fraction (%) of MOX inhibited by light was calculated at every light intensity as (Eq. 6):
where MOXi is the potential CH4 oxidation for a given light treatment, and MOXdark is the potential CH4 oxidation in the dark.
2.9 Determination of pelagic CH4 production rates
Time course 13C tracer experiments were carried out in well-oxygenated surface waters at every sampling site. Measurement of the isotopic enrichment of the CH4 during this experiment allowed us to estimate production rates of CH4 issued from three different precursors: 13C–DIC (NaH13CO3), 13C(1,2)–acetate and 13Cmethyl–methionine. Serum bottles (60 mL) were spiked with 1 mL of 13C tracer solution or with an equivalent volume of distilled water for the control treatment. NaH13CO3 was added in the bottles at a tracer level (less than 5 % of ambient concentration), while 13C(1,2)–acetate and 13Cmethyl–methionine were added largely in excess (>99 % of ambient concentration). Therefore, we assume the CH4 production rates measured from 13C–DIC could be representative of in situ rates, but the production rates measured from 13C–acetate and 13C–methionine should instead be viewed as potential rates. The exact amount of 13C–DIC added in the bottles was determined filling borosilicate 12 mL Exetainer vials preserved and analysed for δ13C–DIC as described above.
The control bottles and the bottles amended with the different 13C tracer were incubated under constant temperature conditions (26 ∘C) following three different treatments: (1) one-third were incubated under constant light (PAR of ∼200 µmol photon m−2 s−1); (2) another third were incubated under the same light intensity conditions but were first amended with DCMU (0.5 mg L−1 ; final concentration), an inhibitor of photosynthesis; (3) and the last third were incubated in the dark.
At each time step (typically every 6–12 h, five time steps), the biological activity was stopped by adding 100 µL of a saturation solution of HgCl2. Bottles were kept in the dark until CH4 concentration measurement and δ13C–CH4 determination as described above. O2 consumption was followed in a parallel incubation of water samples in 60 mL biological oxygen demand bottles (Wheaton) to ensure the samples were incubated under oxic conditions during the full course of the experiment.
The term CH4_prod (nmol L−1 h−1), defined as the amount of CH4 produced from a specific tracer during a time interval t (h), was calculated following this equation (Eq. 7) derived from Hama et al. (1983):
where CH4_t and %13CCH4_t represents the CH4 concentration (nmol L−1) and the %13C atom of the CH4 pool at a given time step, respectively. %13CCH4_i represents the %13C atom of the pool of CH4 at the beginning of the experiment. %13Ctracer represent the %13C atom of the isotopically enriched pool of the precursor molecule tested (NaHCO3, methionine or acetate, depending on the treatment). %13Ctracer was assumed constant during the full course of the incubation given the high concentration of ambient DIC in the sampled lakes (∼2 mmol L−1 in Lake George, >6 mmol L−1 in the other lakes) and that acetate and methionine were spiked in large excess (>99 %).
2.10 DNA extraction
Surface water samples for DNA analysis (between 1 and 0.15 L, depending on the biomass) were first filtered through 5.0 µm pore size polycarbonate filters (Millipore). The eluent was then subsequently filtered through 0.2 µm pore size polycarbonate filters (Millipore) to retain free living prokaryotes. Filters were stored frozen (−20 ∘C) and immersed in a lysis buffer until processing in the laboratory. Total DNA was extracted from the 0.2 and 5.0 µm 47 mm filters using DNeasy PowerWater kit (Qiagen) following the manufacturer's instructions. Quality and quantity of the extracted DNA were estimated using the NanoDrop ND-1000 spectrophotometer (Thermo Fisher) and the Qubit 3.0 fluorometer (Life Technologies). Extracted DNA was stored at −20 ∘C until further use.
2.11 Quantification of mcrA via qPCR
Quantification of mcrA gene copies was performed by quantitative polymerase chain reaction (qPCR) on the total extracted DNA. The used primer pair consisted of forward primer qmcrA-F 5′-TTCGGTGGATCDCARAGRGC-3′ and qmcrA-R 5′-GBARGTCGWAWCCGTAGAATCC-3′ (Denman et al., 2007). The reaction mixture contained 3 µL of total community DNA extract, 7.5 µL of ABsolute qPCR SYBR Green Mix (Thermo Fisher, Cat. AB1158B), 0.3 µL of 10 µM forward primer mcrF, 0.3 µL of 10 µM reverse primer mcrR, 1.5 µL of a 1 % w∕v bovine serum albumin solution (Amersham Bioscience), and 2.4 µL of nuclease- and DNA-free water. The qPCR was performed in a Rotorgene 3000 (Corbett Research) using the following conditions: 95 ∘C (15 min) followed by 40 cycles of 20 s at 95 ∘C, 20 s at 58 ∘C, 20 s at 72 ∘C and a final extension step of 5 s at 80 ∘C. Standard curves were prepared from serial dilutions of a pre-quantified mcrA PCR fragment amplified using primers mcrF and mcrR from a plasmid extract carrying the complete mcrA gene using concentrations ranging from 1×10² to 1×10⁸ copies µL−1. Samples were analysed in triplicates.
2.12 16S rRNA gene amplicon sequencing
Sequencing of the 16S rRNA gene was done on the total extracted DNA to assess community composition. The 16S rRNA gene sequencing was done with the Illumina MiSeq v3 chemistry following the “16S Metagenomic Sequencing Library Preparation” protocol with the following universal 16S rRNA gene primers targeting the V4 region, forward UniF/A519F-(S-D-Arch-0519-a-S-15) 5′-CAGCMGCCGCGGTAA-3′ and reverse UniR/802R-(S-D-Bact-0785-b-A-18) 5′-TACNVGGGTATCTAATCC-3′ (Klindworth et al., 2013). Sequenced read quality was checked using FastQC v0.11 (https://www.bioinformatics.babraham.ac.uk/projects/fastqc/, last access: 4 June 2018). Short reads were trimmed to 250 bp with FastX Toolkit v0.0.13 (http://hannonlab.cshl.edu/fastx_toolkit/, last access: 4 June 2018) in order to remove trailing Ns and low-quality bases. Operational taxonomical units (OTUs) for each analysed sample were obtained from the quality-trimmed reads using mothur v1.39.5 (Kozich et al., 2013) and following the online MiSeq SOP (https://mothur.org/wiki/MiSeq_SOP, last access: 4 June 2018) using the Silva v128 16S rRNA database with the following parameters: maxambig = 0 bp, maxlength = 300 bp, maxhomop = 8 and classify OTUs to 97 % identity. The generated OTU table was used to calculate relative abundances of each OTU per sample.
3.1 Environmental settings
The sampled lakes cover a wide range of sizes (<1 to 2300 km2), maximum depths (3–117 m), mixing regimes, phytoplankton biomass and primary productivity (Table S1, Fig. S1). Phytoplankton biomass (chlorophyll a from 3.6 to 190.2 µg L−1) was dominated by Cyanobacteria (>95 %) in the most productive lakes, while diatoms (<20 %) and chrysophytes (<40 %) also contributed in the less productive ones (Fig. S2). Maximum potential photosynthetic activity (Pmax) varied from 1.5 µmol C L−1 h−1 in Lake Edward to 199.0 µmol C L−1 h−1 in Lake George and was linearly related to chlorophyll a concentration. Light-dependent N2 fixation was detected in every lake with the exception of Lake Kyamwinga. No significant N2 fixation rates were measured in the dark. Maximum potential N2 fixation rates (N2fixmax) ranged between 1 and 128 nmol L−1 h−1 and were positively related to Pmax (Fig. S1).
We detected and quantified the abundance of the archaeal alpha subunit of methyl-coenzyme M reductase gene (mcrA), a proxy for methanogens, in the surface waters of each lake. mcrA gene copy abundance (mcrA copy ng DNA−1) ranged between 319±41 (Lake Edward) and 7537±476 (Lake Katinda) in the fraction of seston <5 µm and between 541±19 (Lake Edward) and 7968±167 (Lake Katinda) in the fraction of seston >5 µm (Fig. S3). Illumina 16S rRNA gene amplicon sequencing indicated that methanogens accounted for a small fraction of the prokaryotic community in the surface waters of Lake Edward (0.01 %), Lake Kyamwinga (0.03 %) and Lake Nyamunsingere (0.08 %). They represented a substantially higher fraction of the community in Lake Katinda (0.38 %) and Lake George (0.57 %; Fig. S4). In all lakes, hydrogenotrophic (Methanomicrobiales and Methanobacteriales) were always more abundant than acetoclastic (Methanosarcinales) microorganisms, representing at least 65 % of the methanogens (up to 95 % in Lake Katinda; Fig. S4).
3.2 Water column CH4 concentration and δ13C–CH4 patterns
Surface waters were supersaturated in CH4 in all lakes, with surface concentrations (at 1 m) ranging between 78 and 652 nmol L−1 (atmospheric equilibrium ∼2 nmol L−1). Diffusive CH4 emissions varied between 0.05 (Lake Edward) and 0.40 mmol m−2 d−1 (Lake Katinda). The benthic CH4 flux across the sediment–water interface was elevated in comparison with the diffusive CH4 emissions in the three lakes where it was measured: Lake Edward (0.96 mmol m−2 d−1), Lake George (9 mmol m−2 d−1) and Lake Nyamusingere (5 mmol m−2 d−1). CH4 ebullition was the dominant pathway of CH4 evasion to the atmosphere in the three lakes (Lake Edward, Lake George, Lake Nyamusingere), where ebullitive fluxes were investigated. Ebullitive flux in Lake Edward ranged between 0.16 and 0.24 mmol m−2 d−1, depending on the bubble-size scenario considered (see material and methods), being at least 4 times higher than the diffusive CH4 flux. This discrepancy was even larger in the shallower Lake George (13.26–13.9. mmol m−2 d−1) and Lake Nyamusingere (19.03–19.09 mmol m−2 d−1) where CH4 ebullition appeared ∼100 and ∼50 times higher than diffusive CH4 emissions. During the ascent of CH4 bubbles to the surface, gas exchange occurs, and we estimated that, depending on the CH4 bubble size considered, between 0.04 and 0.21 mmol CH4 m−2 d−1 dissolved in the water column of Lake Edward during bubble ascent. This bubble dissolution flux ranged between 0.70 and 3.30 and between 1.21 and 5.55 mmol m−2 d−1 in Lake George and Lake Nyamusingere, respectively.
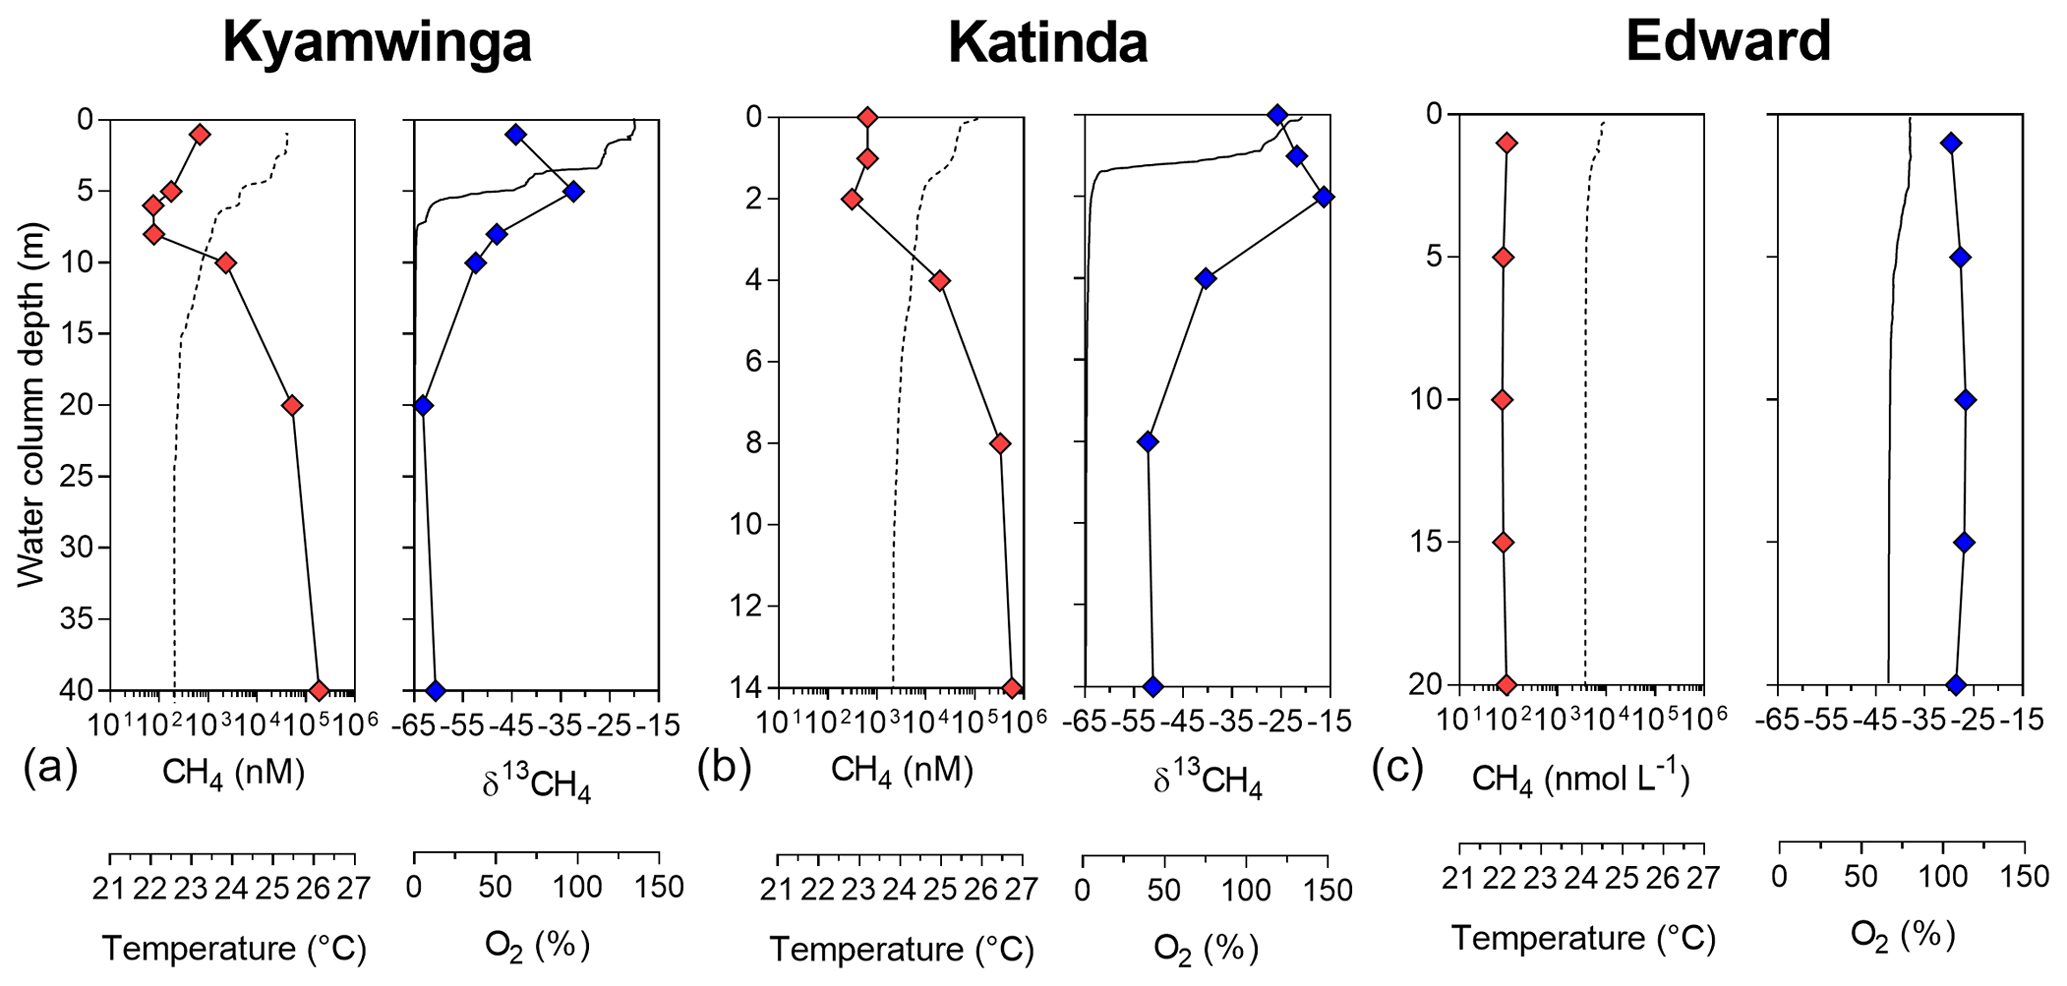
Figure 1Depth profile. Depth profile of the temperature (∘C; dashed line), CH4 concentration (nmol L−1 ; red symbols), dissolved-oxygen saturation (%; solid line) and stable-isotope carbon composition of CH4 (δ13C–CH4; ‰; blue symbols) in Lake Kyamwinga (a), Lake Katinda (b) and Lake Edward (c).
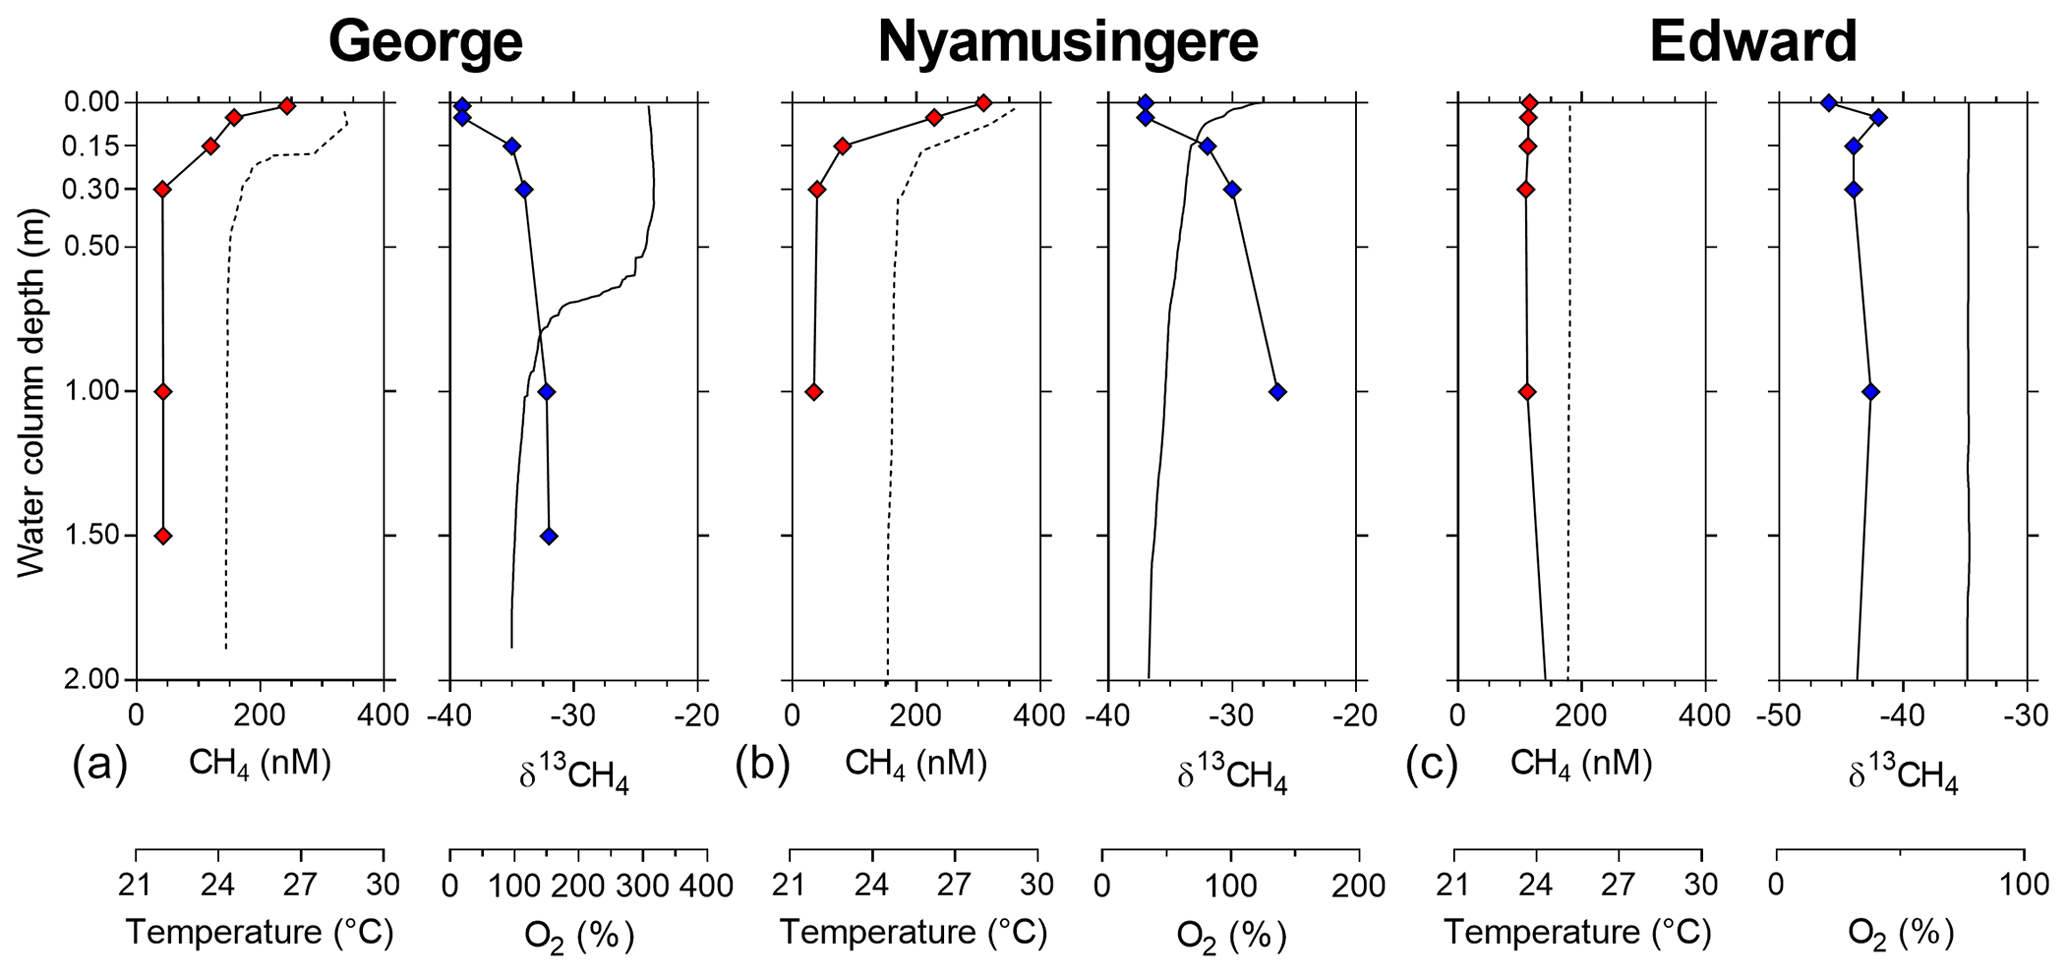
Figure 2Depth profile, focus on the surface. Depth profile of the temperature (∘C; dashed line), CH4 concentration (nmol L−1 ; red symbols), dissolved-oxygen saturation (%; solid line) and stable-isotope carbon composition of CH4 (δ13C–CH4; ‰; blue symbols) in Lake George (a), Lake Nyamusingere (b) and the surface waters (0–2 m) of Lake Edward (c).
Vertical patterns of CH4 and stable carbon isotope composition of CH4 (δ13C–CH4) were variable among the different lakes. In lakes Kyamwinga and Katinda, higher CH4 concentrations and lower δ13C–CH4 values were observed in the well-oxygenated epilimnion compared to the metalimnion showing a source of relatively 13C-depleted CH4 to the epilimnetic CH4 pool (Fig. 1). The CH4 concentrations and δ13C–CH4 were homogeneous in the water column of Lake Edward, which is much larger than the other studied lakes (2300 km2; Table S1) and characterized by a higher wind exposure and a substantially weaker thermal stratification (Fig. 1). However, a clear horizontal gradient in CH4 concentration and δ13C–CH4 occurred between the littoral and pelagic zones (Fig. S5). Vertical gradients were also observed at a much smaller scale near the subsurface (top 0.3 m) and in the shallow and entirely well-oxygenated Lake George and Lake Nyamusingere (Fig. 2). In both lakes CH4 concentrations were relatively modest in the hypolimnion (<50 nmol L−1) but increased abruptly in the thermal gradient (0.3 m interval) to reach a surface maximum >240 nmol L−1 (Fig. 2). δ13C–CH4 mirrored this pattern with significantly lower values at the surface than at the bottom of the water column, indicating that a source of relatively 13C-depleted CH4 contributed to the higher epilimnetic CH4.
3.3 Occurrence of microbial CH4 production in surface waters under oxic conditions
Despite the prevalence of oxic conditions, 13C-labelling experiments revealed that CH4 was produced in surface waters of each lake with the exception of Lake Kyamwinga (Fig. 3). The kinetic of incorporation of NaH13CO3 into the CH4 pool revealed that a substantially higher amount of CH4 was produced from dissolved inorganic carbon (DIC) in illuminated waters, and this mechanism of CH4 formation appears to be related to photosynthesis as no or only modest quantities of CH4 were produced from 13C-labelled DIC in darkness or when photosynthesis was inhibited by DCMU (Figs. 3a and S6). Furthermore, CH4 production from DIC appeared strongly correlated (r2=0.91) to the photosynthetic activity (Fig. 4a) and N2 fixation rates (Fig 4b), supporting the view that CH4 formation in oxic waters was directly linked to phytoplankton metabolism (Bizic et al., 2020).
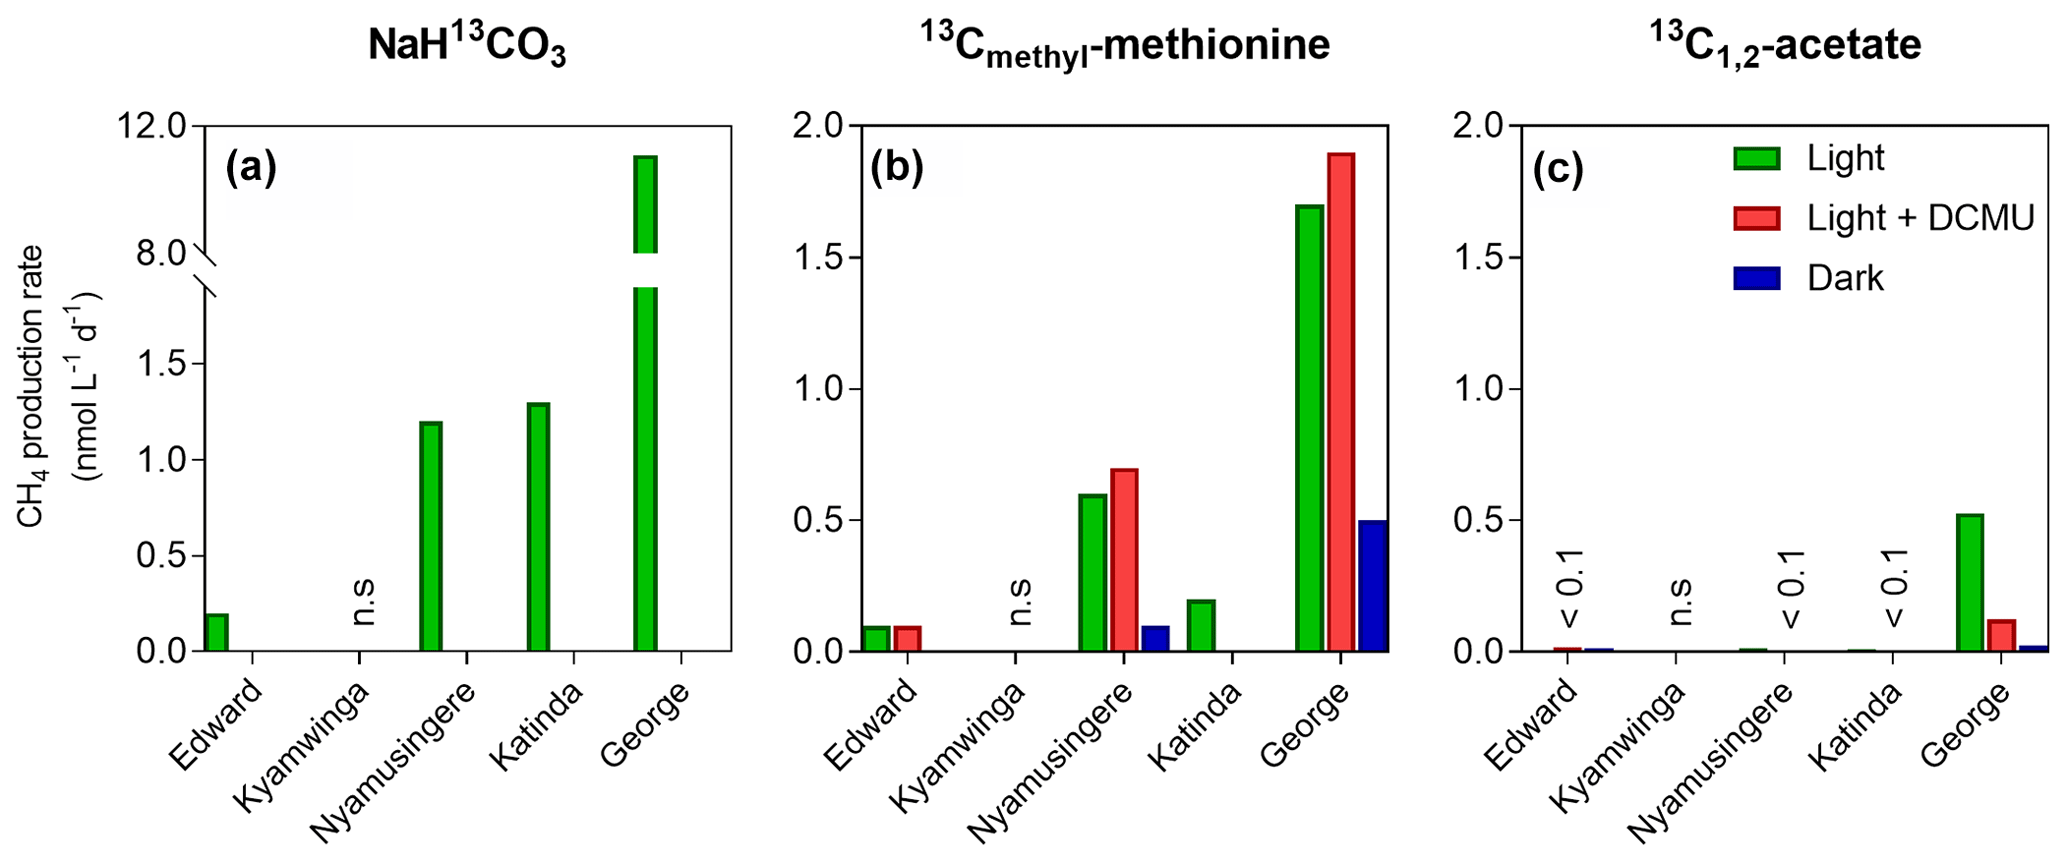
Figure 3Tracer experiments show CH4 production in well-oxygenated surface waters. CH4 production rates (nmol L−1 d−1) from dissolved inorganic carbon (a), the methyl group of methionine (b) and acetate (c) measured in the surface waters (0.3 m) of a variety of African tropical lakes. Green, grey and dark bars, respectively, represent rates measured under light, light in the presence of a photosynthesis inhibitor (DCMU) and darkness. Values showed for Lake Edward, Lake George and Lake Katinda are the average of 2017 and 2018 sampling campaign measurement; n.s. = not significant, <0.1= below 0.1 nmol L−1 d−1.
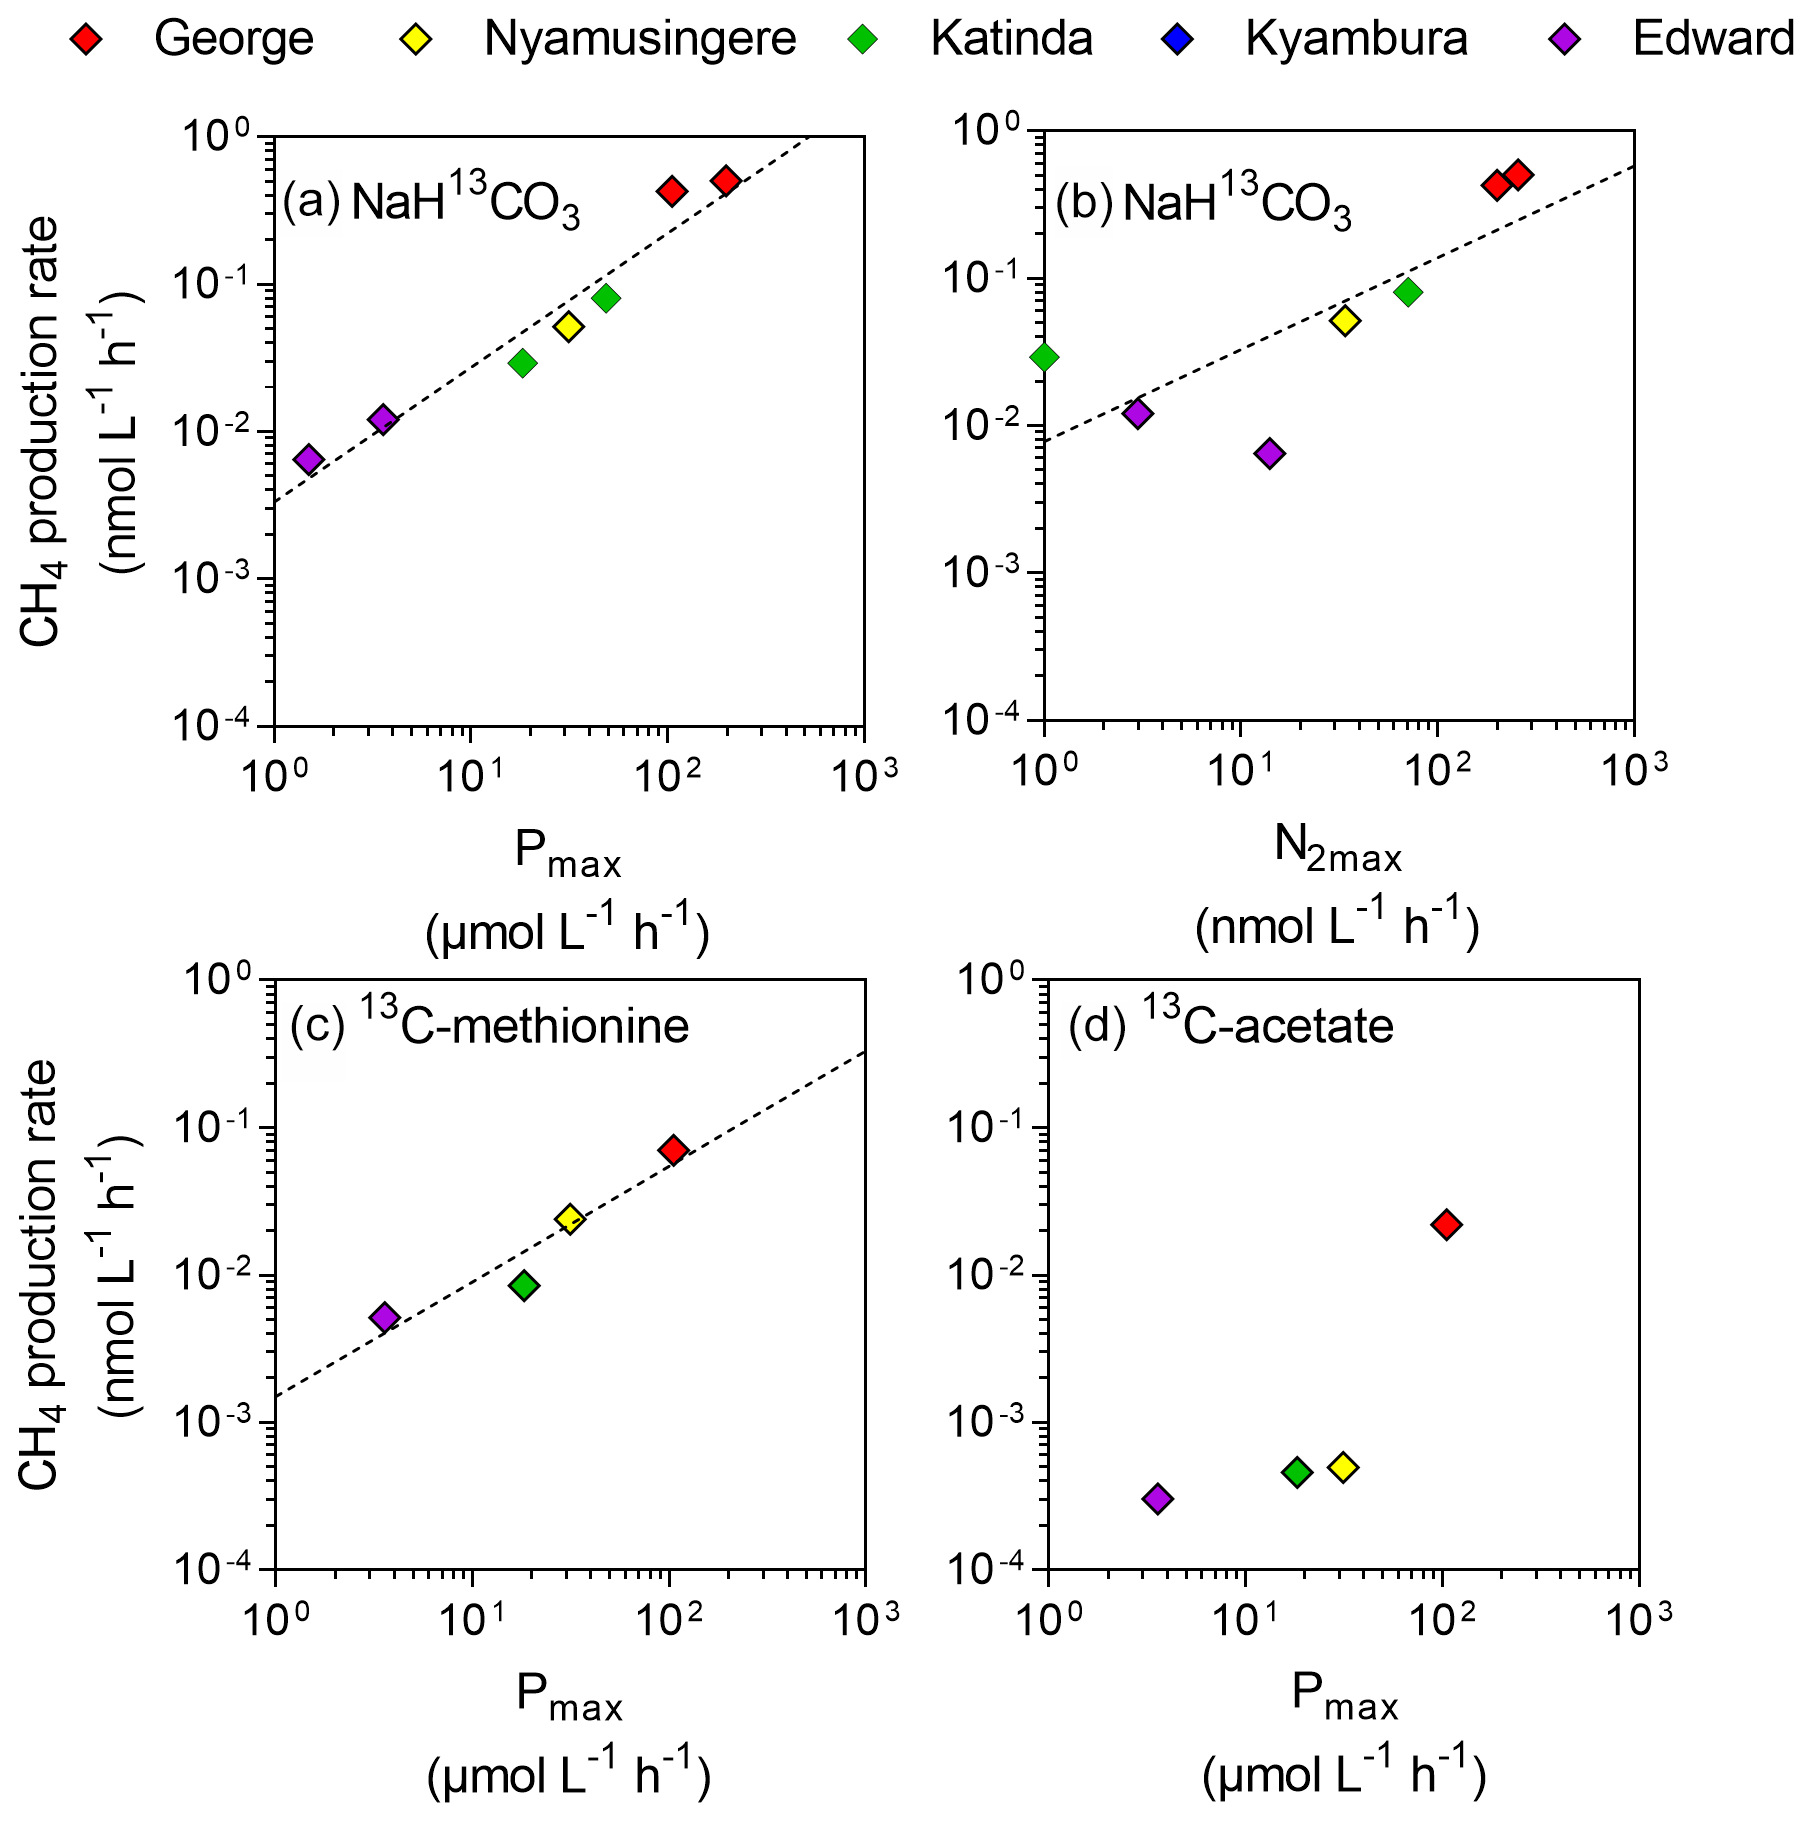
Figure 4Direct link between CH4 production and phytoplankton metabolism. Relationship between the maximum photosynthetic activity (Pmax; µmol C L−1 h−1) or maximum nitrogen fixation rates (N2max; nmol L−1 h−1) and surface CH4 production rates (nmol C L−1 h−1) from dissolved inorganic carbon (a, b), methyl group of methionine (c) and acetate (d).
Aside from DIC, an appreciable amount of CH4 was generated in all lakes from the sulfur-bonded methyl group of methionine when bottles were incubated under light, irrespective of the addition of DCMU (Figs. 3b and S6). CH4 production rates were approximately 4 times higher in the bottles incubated in the light than in the dark. In addition, a positive relationship between CH4 production from methionine in the light and the photosynthetic activity was found (Fig. 4c).
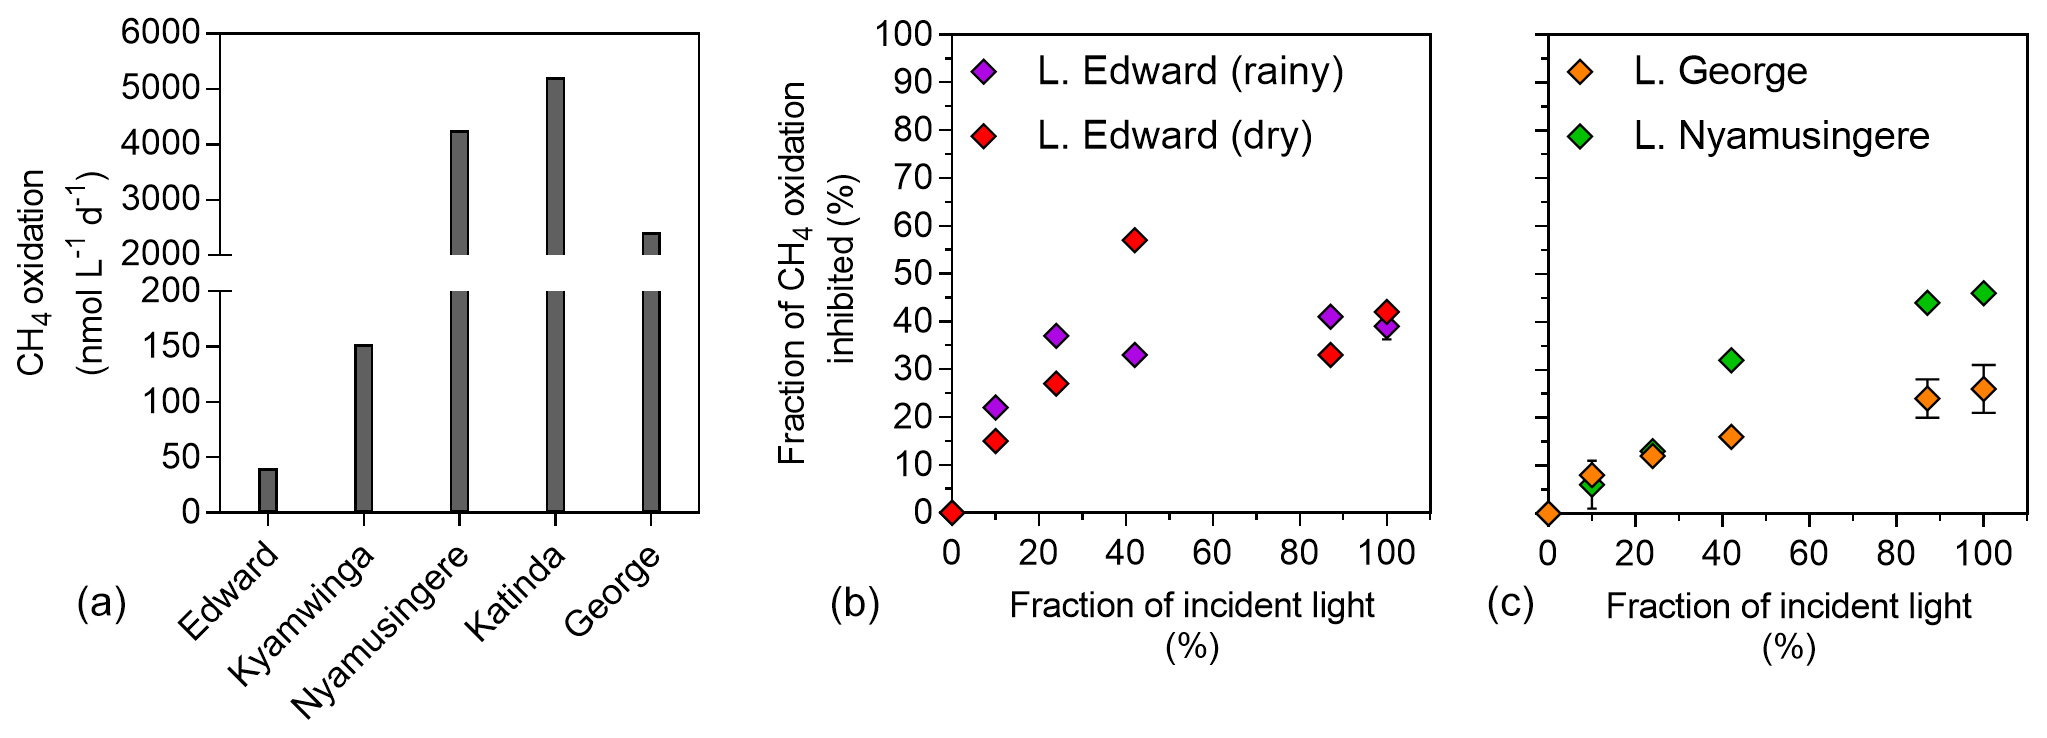
Figure 5Light inhibition patterns of CH4 oxidation in surface waters. (a) CH4 oxidation rates (nmol L−1 d−1) measured in the dark in the surface waters (0.3 m) of a variety of African tropical lakes. (b) Relationship between illumination (fraction of incident sunlight irradiance; %) and CH4 oxidation inhibition (fraction of CH4 oxidation in the dark, inhibited at a given irradiance; %) in Lake Edward, Lake George and Lake Nymusingere. Symbols represent the mean, and error bars represent the maximum and minimum of duplicate experiments.
13C-labelled acetate, the substrate of acetoclastic methanogenesis, supported the production of CH4 in all lakes with the exception of Lake Kyamwinga but at much lower rates compared to light-dependent CH4 production from DIC (50 times lower, n=7) or methionine (10 times lower, n=4; Figs. 3c and S6). δ13C analysis of the DIC in the bottles spiked with 13C-labelled acetate showed that the acetate was mineralized at rates of 5–6 orders of magnitude higher than acetoclastic methanogenesis so that added acetate appeared to be used almost exclusively by heterotrophic microorganisms other than methanogens. Patterns of acetate-derived production of CH4 were similar in light and dark treatments (Figs. 3c and S6), and this mode of CH4 production appeared to be unrelated to phytoplankton activity (Fig. 4d).
3.4 Microbial methane oxidation
Net CH4 oxidation was detected in all five investigated lakes ranging from 11 to 5212 nmol L−1 d−1 (Fig. 5), and was by far the largest loss term of dissolved CH4 at the ecosystem scale (8 to 46 times higher than the diffusive emission to the atmosphere). Surface water CH4 turnover times were particularly short in the shallow and eutrophic Lake George (2 h) and Lake Nyamusingere (3 h) and slightly longer in the deeper and less productive Lake Katinda (11 h), Lake Kyamwinga (77 h) and Lake Edward (100 h). In all studied lakes, the volumetric CH4 oxidation rates were always much higher than the volumetric CH4 production we measured during the stable-isotope tracer experiments, regardless of the CH4 precursors tested. Pelagic CH4 production rates represented 8.5 %, 2.6 %, 0.2 % and 0.1 % of CH4 oxidation rates in lakes Edward, George, Katinda and Nyamusingere, respectively.
The influence of light on methanotrophy was investigated in the deep Lake Edward and shallow Lake George and Lake Nyamusingere, revealing that CH4 oxidation rates decreased dramatically with increasing light intensity (Fig. 5). For instance, when exposed to full sunlight intensity, methanotrophs consumed only 42 % (Lake Edward), 54 % (Lake Nyamusingere) or 74 % (Lake George) of the CH4 they were able to oxidize in the dark. The magnitude of this sunlight-induced inhibition decreased substantially with decreasing sunlight intensities (Fig. 5). In Lake Edward (April 2017) sunlight inhibition of methanotrophy followed the same pattern of lower rates at high sunlight intensities in the bottles where O2 production (via photosynthesis) was stopped by DCMU addition.
4.1 Mechanisms of CH4 production under aerobic conditions
The results from the stable-isotope labelling experiment highlight that only a minimal fraction of the CH4 produced under aerobic conditions originated from acetate in contrast with several earlier studies (Bogard et al., 2014; Donis et al., 2017), which proposed, based on the apparent fractionation factor of δ13C–CH4, that acetoclastic methanogenesis linked to phytoplankton production of organic matter would be the dominant biochemical pathway of pelagic CH4 production in oxic fresh waters. Instead, our results support the study of Bizic et al. (2020) and suggest that epilimnetic CH4 production in well-oxygenated conditions was related to DIC fixation by photosynthesis (Fig. 3) and correlated to primary production (Fig. 4a) and N2 fixation (Fig. 4b). When normalized to POC concentrations, the average DIC-derived CH4 production rates (0.08±0.05 nmol mmol h−1 n=7) were remarkably similar to the CH4 production rates recently reported in Cyanobacteria cultures (0.04±0.02 nmol mmol h−1) grown at 30 ∘C, among which the freshwater Microcystis aeruginosa (Bizic et al., 2020), the dominant Cyanobacterium species in the tropical lakes investigated in our study (see Fig. S2). These CH4 production rates are 2 orders of magnitude higher than rates reported in an axenic culture of the eukaryote Emiliania huxleyi (0.19±0.07 pmol mmol d−1; Lenhart et al., 2016), but they are 4 orders of magnitude lower than typical anoxic CH4 production rates by methanogenic Archaea (Mountfort and Asher, 1979). Although it seems improbable that 13C–DIC acted as a direct precursor molecule for the CH4 released by phytoplankton (Lenhart et al., 2016; Klintzsch et al., 2019), 13C–DIC could have been taken up by phytoplankton cells and then used as a C source for the synthesis of many different organic molecules that may serve as the actual CH4 precursors. Indeed, healthy phytoplankton cells actively release a variety of low-molecular-weight molecules, which are generally highly labile and rapidly consumed (Baines and Pace, 1991; Morana et al., 2014). Phytoplankton metabolism could have fuelled CH4 production pathways, at least partially, excreting substrates involved in CH4 production via biochemical processes such as demethylation of a variety of organic molecules like methionine, one of the S-bonded methylated amino acids (Lenhart et al., 2016), trimethylamine (Bizic et al., 2018) or methylphosphonate (Yao et al., 2016).
While the source of methylphosphonate in fresh waters is obscure, and its actual natural abundance remains to be determined, dissolved free amino acids would represent up to 4 % of the DOC produced by phytoplankton and are rapidly consumed by heterotrophic bacteria (Sarmento et al., 2013). Our incubations indeed demonstrated that the methyl group of methionine was a potential precursor of CH4 in all lakes investigated, in line with recent findings showing that Emiliania huxleyi could act as a direct source of CH4 in oxic conditions using methionine as a precursor without the involvement of any other microorganisms (Lenhart et al., 2016). We found that CH4 production from methionine was clearly stimulated under light, even when photosynthetic activity was inhibited by DCMU, while little CH4 from methionine was produced in darkness (Fig. 3b). DCMU notably prevents reduction in plastoquinone at photosystem II and generates singlet oxygen (Petrillo et al., 2014). The mechanism of CH4 production from methionine is still unclear, but its residue in proteins is particularly sensitive to oxidation to methionine sulfoxide by radical oxygen species (ROSs; Levine et al., 1996) so that methionine would act as an effective ROS scavenger and play important protective roles under photo-oxidative stress conditions, as shown in vascular plants (Bruhn et al., 2012). The side chain of methionine sulfoxide is identical to dimethyl sulfoxide, which is known to react with hydroxyl radicals (OH) to form CH4 (Repine et al., 1979). Besides its photoprotective role for phytoplankton, methionine could also be catabolized by a wide variety of microorganisms to methanethiol, which could in turn be transformed to CH4 as shown in Arctic Ocean surface waters (Damm et al., 2010). Nevertheless, occurrence of this latter mechanism in the tropical lakes investigated seems unlikely as this mode of CH4 production would be expected to be insensitive to light irradiance, and no CH4 was produced from methionine in the dark during the incubations.
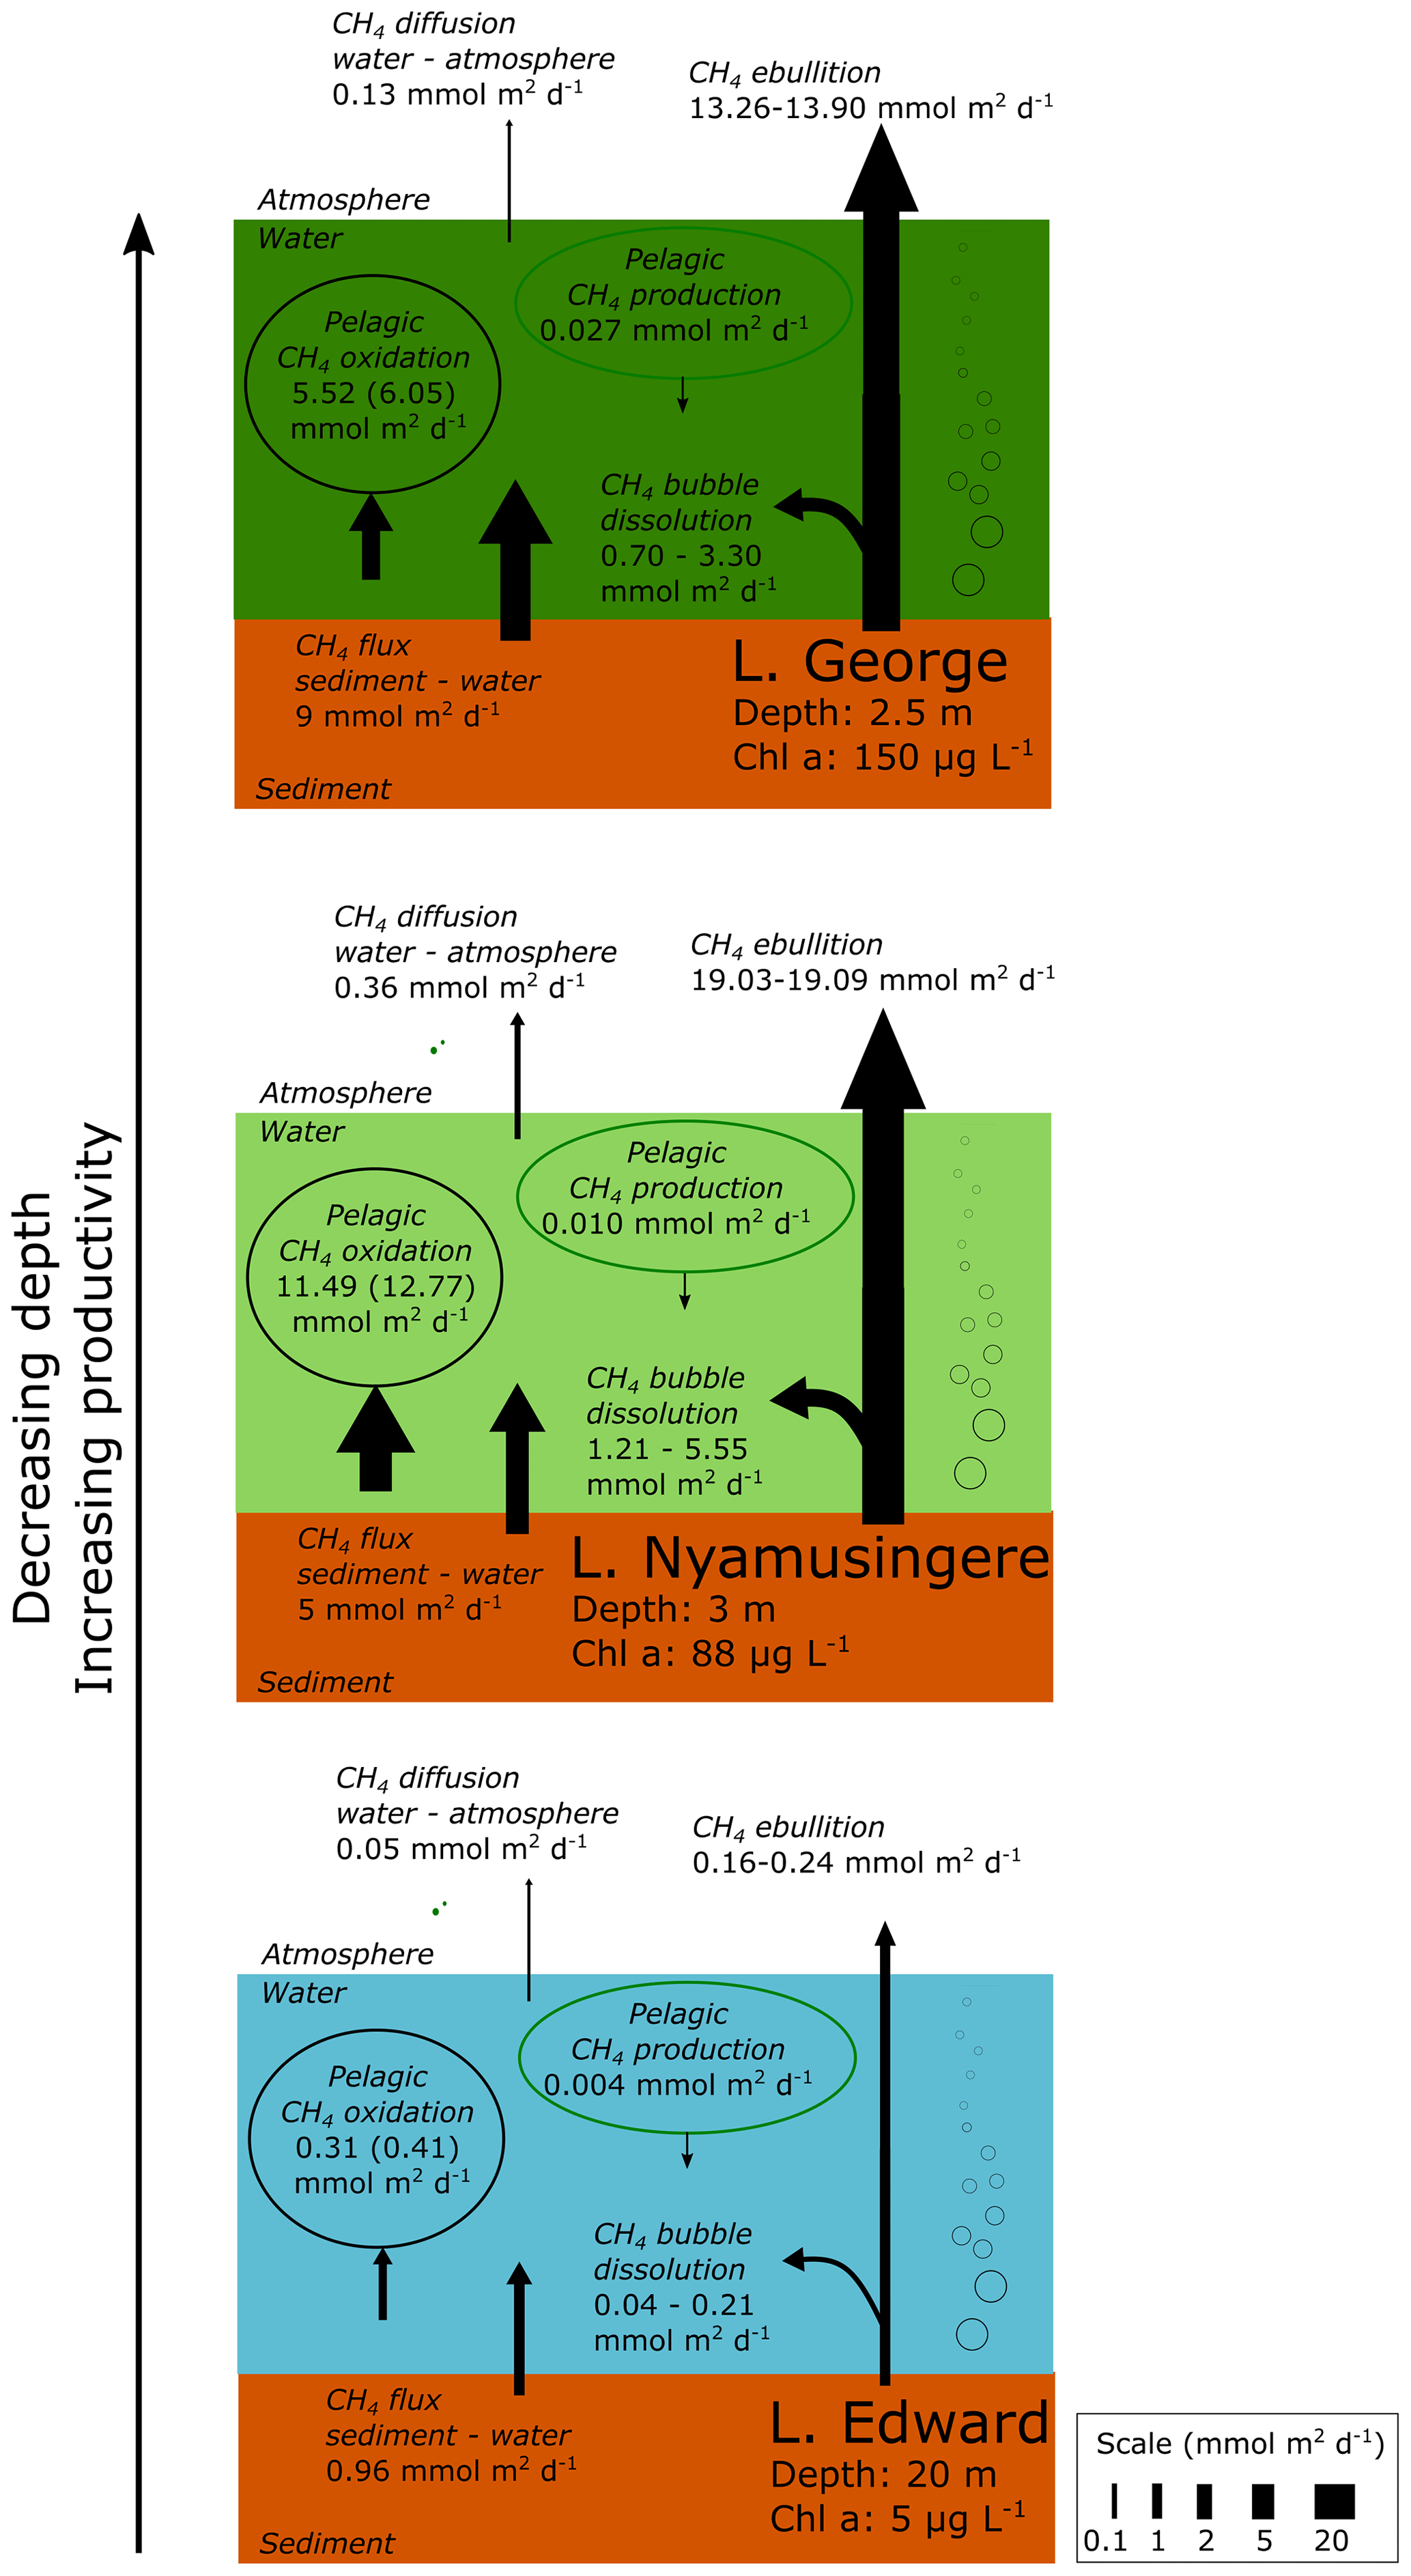
Figure 6Epilimnetic CH4 production is a marginal source of CH4 compared to sedimentary sources and CH4 sinks in several contrasting African lakes. Summary of the different CH4 flux experimentally measured in Lake Edward, Lake George and Lake Nyamusingere. Values of CH4 oxidation in brackets are values not considering CH4 photoinhibition. Pelagic CH4 production are values determined from NaH13CO3 (∼5 % final enrichment) and 13C–acetate (99 % final enrichment), as described in the methods section. 13C-labelling experiment carried out under constant light irradiance. CH4 flux at the water–air and sediment–water interface was determined experimentally as described in the methods section. CH4 bubble dissolution and CH4 ebullition flux were determined using the SiBu-GUI software (Greinert and McGinnis, 2009); minimum and maximum represent the values obtained from two extreme bubble-size scenarios considering a release of many small (3 mm diameter) bubbles or fewer large (10 mm) bubbles.
4.2 Relevance of pelagic CH4 production compared to methanotrophy and CH4 emissions at the ecosystem scale
The stable-isotope labelling experiments revealed that microbial CH4 oxidation largely exceed the pelagic CH4 production. All of the major sources and sinks of CH4 at the ecosystem scale were experimentally determined offshore in three lakes (lakes Edward at 20 m depth, George at 2.5 m and Nyamusingere at 3 m; Fig. 6). In contrast with high-latitude lakes where no ebullition could be detected in locations with a water column depth higher than 2 m (DelSontro et al., 2018), we found that the CH4 ebullition flux dominates over the CH4 diffusion flux in every sampling site. However, due to the dissolution of arising bubbles, the contribution of ebullition to the total CH4 emissions might be lower in deeper (>20 m) locations of Lake Edward (maximum depth of 113 m), as shown elsewhere (DelSontro et al., 2015). Comparison of the CH4 production, consumption and emission fluxes (Fig. 6) shows that the depth-integrated CH4 production rates determined from diverse precursor molecules were modest relative to the diffusive CH4 efflux to the atmosphere and the depth-integrated microbial CH4 oxidation. In opposition, the combined CH4 bubble dissolution flux and diffusive benthic CH4 flux were several orders of magnitude higher than CH4 production in surface waters and were sufficient to support the microbial CH4 oxidation and the emissions to the atmosphere(Fig. 6). These results gathered in tropical lakes of various size (from 0.44 to 2300 km2) and depth are in sharp contrast with the estimation of an empirical model (Gunthel et al., 2019) which proposed that mechanisms of oxic CH4 production represents the majority of CH4 emissions in lakes larger than 1 km2. This discrepancy highlights the need to consider the unique limnological characteristics of a vast region of the world that harbours 16 % of the total surface of lakes (Lehner and Döll, 2004). One of the most distinctive features of the tropical aquatic environment is the persistent elevated water temperature in the hypolimnion and at the water–sediment interface, which favours methanogenic activity in sediment and decreases CH4 solubility, enhancing bubble formation.
Epilimnetic CH4 production appeared as a marginal flux at the ecosystem scale and could not explain alone the accumulation of 13C-depleted CH4 in the epilimnion of most of the lakes of our dataset (Figs. 1, 2), for which we propose a combination of two other alternative mechanisms: dissolution of arising CH4 bubbles in the epilimnion combined with inhibition by light of CH4 oxidation. The partial dissolution of the CH4 bubbles as they rise in the epilimnion would allow a rapid transport of 13C-depleted CH4 from the sediment, bypassing the hotspot of CH4 oxidation at the sediment–water interface and representing an alternative source of 13C-depleted CH4 in water column. This mechanism of bubble-mediated transport to the epilimnion would be especially important in shallow lakes as CH4 ebullition is widely variable as a function of water column depth (DelSontro et al., 2015). The shallower Lake George and Lake Nyamusingere were notably characterized by sharp thermal-density gradients (Fig. 2) and extreme phytoplankton biomass largely dominated by Microcystis aeruginosa (chlorophyll a up to 190 µg L−1). Microcystis aeruginosa cells form large aggregates (>1 mm) embedded in a matrix of extracellular polymeric substance that might act as a barrier to trap small CH4 bubbles arising from the sediment (Fig. S7 in the Supplement). Dissolution of CH4 bubbles could be enhanced at the very near surface due to the entrapments of bubbles at the air–water interface by abundant surface organic films that delay the bubble “burst”. The presence of a sharp subsurface temperature gradient would further enhance CH4 accumulation during daytime near the air–water interface (by blocking vertical redistribution of CH4 by mixing). We hypothesize that this process could be widespread in shallow tropical lakes, which are characterized by high productivity and are simultaneously susceptible to being large benthic CH4 sources.
The stable-isotope labelling experiment carried out to investigate the inhibitory effect of light on methanotrophic activity demonstrated that CH4 consumption dramatically decreased with increasing light intensities (Fig. 5), as already reported in a tropical reservoir (Dumestre et al., 1999) and Lake Biwa (Murase and Sugimoto, 2005). The inhibitory effect of light on freshwater methanotrophs remains surprisingly understudied since it was first reported 20 years ago (Dumestre et al., 1999), so the physiological mechanism of photoinhibition is still not understood. The physiological mechanism of photoinhibition of CH4 oxidation could be related to the fact that the copper-containing methane mono-oxygenase enzyme and be structurally close to the ammonia mono-oxygenase enzyme, and it might be inactivated by ROS produced during photo-oxidative stress, as shown for ammonium oxidizers (French et al., 2012; Tolar et al., 2016). Altogether, our results emphasize the role of sunlight irradiance as an important but frequently overlooked environmental factor driving the CH4 dynamics in lake surface waters and possibly contributing to the occurrence of 13C-depleted CH4 in surface waters.
All data included in this study are available upon request by contacting the corresponding author.
The supplement related to this article is available online at: https://doi.org/10.5194/bg-17-5209-2020-supplement.
This study was designed by CM, AVB and SB. All authors participated in sample collection, data acquisition and analysis. The manuscript was drafted by CM and substantially improved with the input of all authors. All authors approved the final version of the paper.
The authors declare that they have no conflict of interest.
We are grateful to Marc-Vincent Commarieu and Dries Grauwels for their help in the lab and during the field sampling. We also thank the Uganda Wildlife Agency for research permission in the Queen Elizabeth National Park (Uganda), the staff of the Tembo Canteen for the use of their incubation room and the crew of the Katwe Marine research vessel for their help during the Lake Edward sampling. We also thank the associate editor (Tyler Cyronak), D. F. McGinnis and one anonymous reviewer, who helped to improve the initial version of this paper. This work was funded by the Belgian Federal Science Policy Office (BELSPO; HIPE project, BR/154/A1/HIPE) and by the Fonds Wetenschappelijk Onderzoek (FWO-Vlaanderen, Belgium), with travel grants awarded to Cédric Morana and Steven Bouillon. Alberto V. Borges is a research director at the Fond National de la Recherche Scientifique (FNRS; Belgium).
This research has been supported by the Belgian Federal Science Policy Office (grant no. BR/154/A1/HIPE).
This paper was edited by Tyler Cyronak and reviewed by D. F. McGinnis and one anonymous referee.
Bastviken, D., Ejlertsson, J., Sundh, I., and Tranvik, L.: Methane as a source of carbon and energy for lake pelagic food webs, Ecology, 84, 969–981, 2003.
Bastviken, D., Tranvik, L. J., Downing, J. A., Crill, P. M., and Enrich-Prast, A.: Freshwater methane emissions offset the continental carbon sink, Science, 331, 50–50, 2011.
Baines, S. B. and Pace, M. L: The production of dissolved organic matter by phytoplankton and its importance to bacteria: patterns across marine and freshwater systems, Limnol. Oceanogr., 36, 1078–1090, https://doi.org/10.4319/lo.1991.36.6.1078, 1991.
Bishop, N. I.: The influence of the herbicide, DCMU, on the oxygen-evolving system of photosynthesis, Biochim. Biophys. Acta, 27, 205–206, https://doi.org/10.1016/0006-3002(58)90313-5, 1958.
Bižić, M., Ionescu, D., Günthel, M., Tang, K. W., and Grossart, H. P.: Oxic Methane Cycling: New Evidence for Methane Formation in Oxic Lake Water, Biogenesis of Hydrocarbons, 1, 1–22, 2018.
Bižić, M., Klintzsch, T., Ionescu, D., Hindiyeh, M. Y., Günthel, M., Muro-Pastor, A. M., Eckert, W., Urich, T., and Grossart, H. P.: Aquatic and terrestrial cyanobacteria produce methane, Sci. Adv., 6, eaax5343, https://doi.org/10.1126/sciadv.aax5343, 2020.
Bogard, M. J., Del Giorgio, P. A., Boutet, L., Chaves, M. C. G., Prairie, Y. T., Merante, A., and Derry, A. M.: Oxic water column methanogenesis as a major component of aquatic CH4 fluxes, Nat. Commun., 5, 5350, https://doi.org/10.1038/ncomms6350, 2014.
Borges, A. V., Darchambeau, F., Teodoru, C. R., Marwick, T. R., Tamooh, F., Geeraert, N., Morana, C., Okuku, E., and Bouillon, S.: Globally significant greenhouse-gas emissions from African inland waters, Nat. Geosci., 8, 637–642, 2015.
Bruhn, D., Møller, I. M., Mikkelsen, T. N., and Ambus, P.: Terrestrial plant methane production and emission, Physiol. Plantarum, 144, 201–209, https://doi.org/10.1111/j.1399-3054.2011.01551, 2012.
Cole, J. J. and Caraco, N. F.: Atmospheric exchange of carbon dioxide in a low-wind oligotrophic lake measured by the addition of SF6, Limnol. Oceanogr., 43, 647–656, https://doi.org/10.4319/lo.1998.43.4.0647, 1998.
Damm, E., Helmke, E., Thoms, S., Schauer, U., Nöthig, E., Bakker, K., and Kiene, R. P.: Methane production in aerobic oligotrophic surface water in the central Arctic Ocean, Biogeosciences, 7, 1099–1108, https://doi.org/10.5194/bg-7-1099-2010, 2010.
DelSontro, T., McGinnis, D. F., Wehrli, B., and Ostrovsky, I.: Size does matter: Importance of large bubbles and small-scale hot spots for methane transport, Environ. Sci. Technol., 49, 1268–1276, https://doi.org/10.1021/es5054286, 2015.
DelSontro, T., del Giorgio, P. A., and Prairie, Y. T.: No longer a paradox: the interaction between physical transport and biological processes explains the spatial distribution of surface water methane within and across lakes, Ecosystems, 21, 1073–1087, https://doi.org/10.1007/s10021-017-0205-1, 2018.
Delwiche, K. B. and Hemond, H. F.: Methane bubble size distributions, flux, and dissolution in a freshwater lake, Environ. Sci. Technol., 51, 13733–13739, https://doi.org/10.1021/acs.est.7b04243, 2017.
Denman, S. E., Tomkins, N. W., and McSweeney, C. S.: Quantitation and diversity analysis of ruminal methanogenic populations in response to the antimethanogenic compound bromochloromethane, FEMS Microbiol. Ecol., 62, 313–322, https://doi.org/10.1111/j.1574-6941.2007.00394.x, 2007.
Descy, J. P., Darchambeau, F., Lambert, T., Stoyneva-Gaertner, M. P., Bouillon, S., and Borges, A. V.: Phytoplankton dynamics in the Congo River, Freshwater Biol., 62, 87–101, 2017.
Donis, D., Flury, S., Stöckli, A., Spangenberg, J. E., Vachon, D., and McGinnis, D. F.: Full-scale evaluation of methane production under oxic conditions in a mesotrophic lake, Nat. Commun., 8, 1661, https://doi.org/10.1038/s41467-017-01648-4, 2017.
Dumestre, J. F., Guézennec, J., Galy-Lacaux, C., Delmas, R., Richard, S., and Labroue, L.: Influence of Light Intensity on Methanotrophic Bacterial Activity in Petit Saut Reservoir, French Guiana, Appl. Environ. Microbiol., 65, 534–539, https://doi.org/10.1128/aem.65.2.534-539.1999, 1999.
Fernández, J. E., Peeters, F., and Hofmann, H.: On the methane paradox: Transport from shallow water zones rather than in situ methanogenesis is the major source of CH4 in the open surface water of lakes, J. Geophys. Res.-Biogeo., 121, 2717–2726, https://doi.org/10.1002/2016JG003586, 2016.
French, E., Kozlowski, J. A., Mukherjee, M., Bullerjahn, G., and Bollmann, A.: Ecophysiological characterization of ammonia-oxidizing archaea and bacteria from freshwater, Appl. Environ. Microbiol., 78, 5773–5780, https://doi.org/10.1128/aem.00432-12, 2012.
Gillikin, D. P. and Bouillon, S.: Determination of delta O-18 of water and delta C-13 of dissolved inorganic carbon using a simple modification of an elemental analyzer-isotope ratio mass spectrometer: an evaluation, Rapid Commun. Mass Sp., 21, 1475–1478, https://doi.org/10.1002/rcm.2968, 2007.
Greinert, J. and McGinnis, D. F.: Single Bubble Dissolution Model: The Graphical User Interface SiBu-GUI, Environ. Modell. Softw., 24, 1012–1013, https://doi.org/10.1016/j.envsoft.2008.12.011, 2009.
Grossart, H. P., Frindte, K., Dziallas, C., Eckert, W., and Tang, K. W.: Microbial methane production in oxygenated water column of an oligotrophic lake, P. Natl. Acad. Sci. USA, 108, 19657–19661, https://doi.org/10.1073/pnas.1110716108, 2011.
Günthel, M., Donis, D., Kirillin, G., Ionescu, D., Bizic, M., McGinnis, D. F., Grossart, H. P., and Tang, K. W.: Contribution of oxic methane production to surface methane emission in lakes and its global importance, Nat. Commun., 10, 5497, https://doi.org/10.1038/s41467-019-13320-0, 2019.
Hama, T., Miyazaki, T., Ogawa, Y., Iwakuma, T., Takahashi, M., Otsuki, A., and Ichimura, S.: Measurement of photosynthetic production of a marine phytoplankton population using a stable 13C isotope, Mar. Biol., 73, 31–36, https://doi.org/10.1007/BF00396282, 1983.
Hofmann, H., Federwisch, L., and Peeters, F.: Wave-induced release of methane: littoral zones as source of methane in lakes, Limnol. Oceanogr., 55, 1990–2000, https://doi.org/10.4319/lo.2010.55.5.1990, 2010.
Klindworth, A., Pruesse, E., Schweer, T., Peplies, J., Quast, C., Horn, M., and Glöckner, F. O.: Evaluation of general 16S ribosomal RNA gene PCR primers for classical and next-generation se,quencing-based diversity studies, Nucleic Acids Res., 41, e1, https://doi.org/10.1093/nar/gks808, 2013.
Klintzsch, T., Langer, G., Nehrke, G., Wieland, A., Lenhart, K., and Keppler, F.: Methane production by three widespread marine phytoplankton species: release rates, precursor compounds, and potential relevance for the environment, Biogeosciences, 16, 4129–4144, https://doi.org/10.5194/bg-16-4129-2019, 2019.
Kosten, S., Huszar, V. L., Bécares, E., Costa, L. S., van Donk, E., Hansson, L. A., Jeppesen, E., Kruk, C., Lacerot, G., Mazzeo, N., De Meester, L., Moss, B., Lurling, M., Noges, T., Romo, S., and Scheffer, M.: Warmer climates boost cyanobacterial dominance in shallow lakes, Glob. Change Biol., 18, 118–126, https://doi.org/10.1111/j.1365-2486.2011.02488.x, 2012.
Kozich, J. J., Westcott, S. L., Baxter, N. T., Highlander, S. K., and Schloss, P. D.: Development of a dual-index sequencing strategy and curation pipeline for analyzing amplicon sequence data on the MiSeq Illumina sequencing platform, Appl. Environ. Microbiol., 79, 5112–5120, https://doi.org/10.1128/aem.01043-13, 2013.
Lehner, B. and Döll, P.: Development and validation of a global database of lakes, reservoirs and wetlands, J. Hydrol., 296, 1–22, https://doi.org/10.1016/j.jhydrol.2004.03.028, 2004.
Lenhart, K., Klintzsch, T., Langer, G., Nehrke, G., Bunge, M., Schnell, S., and Keppler, F.: Evidence for methane production by the marine algae Emiliania huxleyi, Biogeosciences, 13, 3163–3174, https://doi.org/10.5194/bg-13-3163-2016, 2016.
Levine, R. L., Mosoni, L., Berlett, B. S., and Stadtman, E. R.: Methionine residues as endogenous antioxidants in proteins, P. Natl. Acad. Sci. USA, 93, 15036–15040, https://doi.org/10.1073/pnas.93.26.15036, 1996.
Lewis Jr., W. M.: Tropical limnology, Annu. Rev. Ecol. Syst., 18, 159–184, https://doi.org/10.1146/annurev.es.18.110187.001111, 1987.
Martinez-Cruz, K., Sepulveda-Jauregui, A., Greene, S., Fuchs, A., Rodriguez, M., Pansch, N., Gonsiorczyk, T., and Casper, P.: Diel variation of CH4 and CO2 dynamics in two contrasting temperate lakes, Inland Waters, 10, 333–347, https://doi.org/10.1080/20442041.2020.1728178, 2020.
McGinnis, D. F., Greinert, J., Artemov, Y., Beaubien, S. E., and Wüest, A. N. D. A.: Fate of rising methane bubbles in stratified waters: How much methane reaches the atmosphere?, J. Geophys. Res.-Ocean., 111, C09007, https://doi.org/10.1029/2005JC003183, 2006.
Mohr, W., Grosskopf, T., Wallace, D. W., and LaRoche, J.: Methodological underestimation of oceanic nitrogen fixation rates, PloS One, 5, e12583, https://doi.org/10.1371/journal.pone.0012583, 2010.
Montoya, J. P., Voss, M., Kahler, P., and Capone, D. G.: A Simple, High-Precision, High-Sensitivity Tracer Assay for N (inf2) Fixation, Appl. Environ. Microbiol., 62, 986–993, https://doi.org/10.1128/aem.62.3.986-993.1996, 1996
Morana, C., Sarmento, H., Descy, J. P., Gasol, J. M., Borges, A. V., Bouillon, S., and Darchambeau, F.: Production of dissolved organic matter by phytoplankton and its uptake by heterotrophic prokaryotes in large tropical lakes, Limnol. Oceanogr., 59, 1364–1375, https://doi.org/10.4319/lo.2014.59.4.1364, 2014.
Morana, C., Darchambeau, F., Roland, F. A. E., Borges, A. V., Muvundja, F., Kelemen, Z., Masilya, P., Descy, J.-P., and Bouillon, S.: Biogeochemistry of a large and deep tropical lake (Lake Kivu, East Africa: insights from a stable isotope study covering an annual cycle, Biogeosciences, 12, 4953–4963, https://doi.org/10.5194/bg-12-4953-2015, 2015a.
Morana, C., Borges, A. V., Roland, F. A. E., Darchambeau, F., Descy, J. P., and Bouillon, S.: Methanotrophy within the water column of a large meromictic tropical lake (Lake Kivu, East Africa), Biogeosciences, 12, 2077–2088, https://doi.org/10.5194/bg-12-2077-2015, 2015b.
Mountfort, D. O. and Asher, R. A.: Effect of inorganic sulfide on the growth and metabolism of Methanosarcina barkeri strain DM, Appl. Environ. Microbiol., 37, 670–675, 1979.
Mugidde, R., Hecky, R. E., Hendzel, L. L., and Taylor, W. D.: Pelagic nitrogen fixation in lake Victoria (East Africa), J. Great Lakes Res., 29, 76–88, https://doi.org/10.1016/S0380-1330(03)70540-1, 2003.
Murase, J. and Sugimoto, A: Inhibitory effect of light on methane oxidation in the pelagic water column of a mesotrophic lake (Lake Biwa, Japan), Limnol. Oceanogr., 50, 1339–1343, https://doi.org/10.4319/lo.2005.50.4.1339, 2005.
Peeters, F., Fernandez, J. E., and Hofmann, H.: Sediment fluxes rather than oxic methanogenesis explain diffusive CH4 emissions from lakes and reservoirs, Sci. Rep., 9, 1–10, https://doi.org/10.1038/s41598-018-36530-w, 2019.
Petrillo, E., Herz, M. A. G., Fuchs, A., Reifer, D., Fuller, J., Yanovsky, M. J., Simpson, C., Brown, J. W. S., Barta, A., Kalyna, M., and Kornblihtt, A. R.: A chloroplast retrograde signal regulates nuclear alternative splicing, Science, 344, 427–430, https://doi.org/10.1126/science.1250322, 2014.
Repine, J. E., Eaton, J. W., Anders, M. W., Hoidal, J. R., and Fox, R. B.: Generation of hydroxyl radical by enzymes, chemicals, and human phagocytes in vitro: detection with the anti-inflammatory agent, dimethyl sulfoxide, J. Clin. Invest., 64, 1642–1651, https://doi.org/10.1172/jci109626, 1979.
Sarmento, H., Romera-Castillo, C., Lindh, M., Pinhassi, J., Sala, M. M., Gasol, J. M., Marassé, C., and Taylor, G. T.: Phytoplankton species-specific release of dissolved free amino acids and their selective consumption by bacteria, Limnol. Oceanogr., 58, 1123–1135, https://doi.org/10.4319/lo.2013.58.3.1123, 2013.
Tang, K. W., McGinnis, D. F., Ionescu, D., and Grossart, H. P.: Methane production in oxic lake waters potentially increases aquatic methane flux to air, Environ. Sci. Technol. Lett., 3, 227–233, https://doi.org/10.1021/acs.estlett.6b00150, 2016.
Tolar, B. B., Powers, L. C., Miller, W. L., Wallsgrove, N. J., Popp, B. N., and Hollibaugh, J. T.: Ammonia oxidation in the ocean can be inhibited by nanomolar concentrations of hydrogen peroxide, Front. Mar. Sci., 3, 237, https://doi.org/10.3389/fmars.2016.00237, 2016
Vollenweider, R. A.: Calculations models of photosynthesis-depth curves and some implications regarding day rate estimates in primary production measurements, Memorie dell'Istituto Italiano di Idrobiologia, 18, 425–457, 1965.
Wanninkhof, R.: Relationship between wind speed and gas exchange over the ocean, J. Geophys. Res.-Ocean., 97, 7373–7382, https://doi.org/10.1029/92JC00188, 1992.
Yao, M., Henny, C., and Maresca, J. A.: Freshwater bacteria release methane as a byproduct of phosphorus acquisition, Appl. Environ. Microbiol., 82, 6994–7003, https://doi.org/10.1128/aem.02399-16, 2016.
Yvon-Durocher, G., Allen, A. P., Bastviken, D., Conrad, R., Gudasz, C., St-Pierre, A., Thanh-Duc, N., and Del Giorgio, P. A.: Methane fluxes show consistent temperature dependence across microbial to ecosystem scales, Nature, 507, 488–491, https://doi.org/10.1038/nature13164, 2014.