the Creative Commons Attribution 4.0 License.
the Creative Commons Attribution 4.0 License.
 | 11 Nov 2020
Microclimatic conditions and water content fluctuations experienced by epiphytic bryophytes in an Amazonian rain forest
Nina Löbs
David Walter
Cybelli G. G. Barbosa
Sebastian Brill
Rodrigo P. Alves
Gabriela R. Cerqueira
Marta de Oliveira Sá
Alessandro C. de Araújo
Leonardo R. de Oliveira
Florian Ditas
Daniel Moran-Zuloaga
Ana Paula Pires Florentino
Stefan Wolff
Ricardo H. M. Godoi
Jürgen Kesselmeier
Sylvia Mota de Oliveira
Meinrat O. Andreae
Christopher Pöhlker
In the Amazonian rain forest, major parts of trees and shrubs are covered by epiphytic cryptogams of great taxonomic variety, but their relevance in biosphere–atmosphere exchange, climate processes, and nutrient cycling is largely unknown. As cryptogams are poikilohydric organisms, they are physiologically active only under moist conditions. Thus, information on their water content (WC) as well as temperature and light conditions experienced by them are essential to analyze their impact on local, regional, and even global biogeochemical processes. In this study, we present data on the microclimatic conditions, including water content, temperature, and light conditions experienced by epiphytic bryophytes along a vertical gradient, and combine these with above-canopy climate data collected at the Amazon Tall Tower Observatory (ATTO) in the Amazonian rain forest between October 2014 and December 2016. While the monthly average of above-canopy light intensities revealed only minor fluctuations over the course of the year, the light intensities experienced by the bryophytes varied depending on the location within the canopy, probably caused by individual shading by vegetation. In the understory (1.5 m), monthly average light intensities were similar throughout the year, and individual values were extremely low, remaining below 3 µmol m−2 s−1 photosynthetic photon flux density more than 84 % of the time. Temperatures showed only minor variations throughout the year, with higher values and larger height-dependent differences during the dry season. The indirectly assessed water content of bryophytes varied depending on precipitation, air humidity, dew condensation, and bryophyte type. Whereas bryophytes in the canopy were affected by diel fluctuations of the relative humidity and condensation, those close to the forest floor mainly responded to rainfall patterns. In general, bryophytes growing close to the forest floor were limited by light availability, while those growing in the canopy had to withstand larger variations in microclimatic conditions, especially during the dry season. For further research in this field, these data may be combined with CO2 gas exchange measurements to investigate the role of bryophytes in various biosphere–atmosphere exchange processes, and could be a tool to understand the functioning of the epiphytic community in greater detail.
- Article
(4418 KB) - Full-text XML
-
Supplement
(3096 KB) - BibTeX
- EndNote


Epiphytic bryophyte communities widely cover the stems and branches of trees in the tropics (Campos et al., 2015). Within that habitat, they may play a prominent role in environmental nutrient cycling (Coxson et al., 1992) and also influence the microclimate within the forest (Porada et al., 2019), thus contributing to the overall fitness of the host plants and the surrounding vegetation (Zartman, 2003). However, they are also affected by deforestation and increasing forest fragmentation (Zartman, 2003; Zotz et al., 1997).
Physiologically, cryptogamic organisms are characterized by their poikilohydric nature as they do not actively regulate their water status but passively follow the water conditions of their surrounding environment (Walter and Stadelmann, 1968). In a dry state, many of them can outlast extreme weather conditions, being reactivated by water (Oliver et al., 2005; Proctor, 2000; Proctor et al., 2007; Seel et al., 1992). This water can be supplied by precipitation, either directly intercepted or taken up from stemflow. For several species, also condensation of fog and dew can serve as a source of water (Lancaster et al., 1984; Lange et al., 2006; Lange and Kilian, 1985; Reiter et al., 2008). In contrast, high water content (WC) may cause suprasaturation when gas diffusion is restrained, causing reduced CO2 gas exchange rates (Cowan et al., 1992; Lange and Tenhunen, 1981; Snelgar et al., 1981) and even ethanolic fermentation, as shown for lichens (Wilske et al., 2001). Accordingly, their physiological activity is primarily regulated by the presence of water and only secondarily by light and temperature (Lange et al., 1996, 1998, 2000; Rodriguez-Iturbe et al., 1999). The amount of available water is relevant to determine the range of photosynthetic activity of these organisms; therefore, rainfall, stemflow, and condensation processes as well as morphological characteristics of bryophytes influencing water conduction or retention are important to understand the activity patterns.
In the Amazonian rain forest, cryptogamic communities mainly occur epiphytically on the stems, branches, and even leaves of trees, and in open forest fractions they may also occur on the soil (Richards, 1954). By 2013, 800 species of mosses and liverworts, 250 lichen species, and 1800 fungal species have been reported for the Amazon region (Campos et al., 2015; Gradstein et al., 2001; Komposch and Hafellner, 2000; Normann et al., 2010; Piepenbring, 2007). Whereas studies in temperate zones address the importance of cryptogamic communities for the ecosystem (Gimeno et al., 2017; Rastogi et al., 2018), only few reports for the tropical region can be found in the literature.
The Amazonian rain forest has been described to play important roles in the water cycle as well as in carbon, nitrogen, and phosphorus fluxes on regional and global scales (Andreae et al., 2015). Up to now, the relevance of cryptogamic communities in these regional cycling processes is largely unknown (Hargis et al., 2019). These data are urgently needed as this ecosystem is under severe pressure and it is hard to predict the extent to which the ongoing and envisioned environmental changes will still ensure its ecological services as the “green lung” and carbon sink of planet earth (Soepadmo, 1993).
In the current study, long-term continuous measurements of temperature, light, and water content inside bryophyte communities were conducted along a vertical gradient. To our knowledge, our study is the first one measuring microclimatic parameters and the water status inside bryophyte communities in a rain forest environment. With these data on the microclimate along a vertical profile and during different seasons, we believe to provide a unique dataset combined with an estimation of the activity patterns of bryophyte communities in a tropical rain forest.
2.1 Study site
The study site is located within a terra firme (plateau) forest area in the Amazonian rain forest, approximately 150 km northeast of Manaus, Brazil. The average annual rainfall is 2540 mm a−1 (de Ribeiro, 1984), reaching its monthly maximum of ∼ 335 mm in the wet (February to May) and its minimum of ∼ 47 mm in the dry season (August to November; Andreae et al., 2015). These main seasons are linked by transitional periods covering June and July after the wet and December and January after the dry season (Andreae et al., 2015; Martin et al., 2010; Pöhlker et al., 2016). The terra firme forest has an average growth height of ∼ 21 m and a tree density of ∼ 598 trees ha−1, and it harbors around 4590 tree species over an area of ∼ 3.78 × 10⁶ km2, thus comprising a very high species richness compared to other forest types (McWilliam et al., 1993; ter Steege et al., 2013). Measurements were conducted at the research site ATTO (Amazon Tall Tower Observatory; 02∘08.602′ S, 59∘00.033′ W; 130 m a.s.l.), which has been fully described by Andreae et al. (2015). It comprises one walk-up tower and one mast of 80 m each, being operational since 2012, and a 325 m tower, which was erected in 2015. The ATTO research platform has been established to investigate the functioning of tropical forests within the earth system. It is operated to conduct basic research on greenhouse gas as well as reactive gas exchange between forests and the atmosphere and contributes to our understanding of climate interactions driven by carbon exchange, atmospheric chemistry, aerosol production, and cloud condensation.
2.2 Microclimatic conditions within epiphytic habitat
The parameters temperature and light within and on top of the bryophyte communities and their WC were measured with a microclimate station installed along one evergreen tree of the species Buchenavia parvifolia (Combretaceae) in September 2014 (Fig. S1). The family regularly occurs in the Amazonian rain forest and represents a common genus in tropical America, growing on clayey soil in plateau environments. It presents flowers during the dry and fruits during the wet season (Stace, 2007). The sensors were placed along a vertical gradient at 1.5, 8, and 23 m above the ground on one tree, corresponding to the zones 1, 2, and 4 (i.e., at the base, the lower trunk, and the base of the crown) described by Oliveira and ter Steege (2015), to investigate the variation within the story structure of the forest.
It needs to be mentioned that not only one single species was measured by one sensor but usually several bryophyte species and also other cryptogams, such as lichenized and nonlichenized fungi and algae as well as heterotrophic fungi, bacteria, and archaea, which grow together, forming a cryptogamic community. Thus, the organisms mentioned throughout this paper were the dominating but not solitarily living species. The restriction of the measurements to one individual tree needs to be considered as a complete independence of the replicate sensors could not be assured. However, due to the large effort of such an installation within the rain forest, it was not possible to equip more trees with additional instruments. Thus, the data obtained from the measurements on this individual tree should be considered as exemplary.
The WC sensors were placed in four different bryophyte communities being heterogeneously distributed along three height levels. At 1.5 m height, the WC sensors were installed in communities dominated by Sematophyllum subsimplex (five sensors) and Leucobryum martianum (one sensor), at 8 m in Octoblepharum cocuiense (two sensors) and Symbiezidium barbiflorum (one sensor), and at 23 m in Symbiezidium barbiflorum (three sensors; Figs. S2, S3). The communities used for a placement of the sensors reflect the distribution of bryophytes among height zones in the Amazonian rain forest (Cornelissen and ter Steege, 1989; Oliveira, 2010; Oliveira and ter Steege, 2015; Pantoja et al., 2015). Studies describe that Lejeuneaceae (common liverwort family of the Amazon region comprising the genus Symbiezidium) are more diverse and abundant in the canopy area, while mosses are mainly concentrated at the tree base and trunk in a plateau ecosystem (Campos et al., 2019; Oliveira, 2010, 2018). The species identified by us (Table S1) have also been reported as being frequent at other tropical rain forest sites (Campos et al., 2015; Dislich et al., 2018; Gradstein and Salazar Allen, 1992; Mota de Oliveira et al., 2009; Pinheiro da Costa, 1999). They show different water-holding capacities, which are influenced by their life-form (Lakatos et al., 2006; Romero et al., 2006; Williams and Flanagan, 1996; Proctor, 1990). The liverwort Symbiezidium barbiflorum (Lejeuneaceae) has been described to have the life-form of mats (Batista and Santos, 2016; Mägdefrau, 1982; Valente et al., 2017), which are characterized by a high capillary retention of water, supporting the storage of condensed water. Mats also have an increased drought tolerance, being more adapted to dry conditions as well as to extreme changes (Gimingham and Birse, 1957). Sematophyllum subsimplex (Sematophyllaceae) and Leucobryum martianum (Dicranaceae) belong to the life-forms of wefts and turfs, respectively (Mägdefrau, 1982; Batista and Santos, 2016; Valente et al., 2017). Turfs show high capillary water conduction and are well known for special water-retaining cells, whereas wefts show high values of capillary water conduction but lower values of water retention (Mägdefrau, 1982), being characteristic for humid areas (Gimingham and Birse, 1957).
Additionally, at each height level two temperature and two light sensors (except for 1.5 m, with only one light sensor) were installed in or on top of the bryophyte communities located on the approximately 26 m high tree (Fig. S2, Table S1). The temperature sensors were installed in the same communities as the WC sensors, and the light sensors were installed adjacent to them on ∼ 5 cm long sticks (Fig. S1). As the morphology of the different species affects their overall WC, different maximum WC values were observed (Tables S1, S2). At 1.5 and 8 m the sensors were installed vertically along the trunk, whereas at 23 m they were placed at the upper side of a horizontal branch. Thus, also the orientation at the stem may influence the WC of the bryophyte communities, not only the species and the height above ground. Furthermore, sample properties such as their thickness and density might play a relevant role for their WC as samples at 1.5 m height tended to be more loose and thinner as compared to the ones at the upper height levels (Fig. S4). Since the installation, automatic measurements at 5 min intervals were taken with a data logger (CR1000; Campbell Scientific, Logan, Utah, USA) equipped with a relay multiplexer (AM16/32; Campbell Scientific, Bremen, Germany) and two interfaces.
The WC sensors, initially developed for biological soil crust research (Tucker et al., 2017; Weber et al., 2016), were optimized for measurements in epiphytic bryophyte communities by a straight-lined construction and with outer pins of 25 mm length, serving as an effective holdfast. However, during stormy episodes and/or physical friction, some WC and temperature sensors fell out of the bryophyte samples and required a reinstallation. Additionally, during some episodes the sensors showed unreliable data, which had to be removed from the overall dataset. All data that could be used for data analysis are shown in Fig. S5.
The electrical conductivity (EC) values, on which the WC calculations were based (see Sect. 2.3 below), showed some unexplained oscillation, causing an inaccuracy corresponding to approximately 20 mV. Besides the specific position in the substrate, the EC also depends on the texture of the sample material, its ion concentration, and the temperature. Because of all these factors influencing the sensor readings, the provided values of the WC should be considered as the best possible estimates and not as exact values. For the temperature measurements, thermocouples (Conatex, St. Wendel, Germany) with a tip length of 80 mm and a measurement accuracy of ± 0.5 ∘C were used. For the light sensors, GaAsP photodiodes (G1118, Hamamatsu Photonics Deutschland GmbH, Herrsching, Germany) were placed in a housing covered by a convex translucent polytetrafluoroethylene (PTFE) cap and calibrated against a PAR (photosynthetically active radiation) quantum sensor (SKP215; Skye Instruments, Llandrindod Wells, Powys, UK).
The average daily PAR values were calculated from the data collected during daytime, i.e., 06:00 to 18:00 LT (local time), while PARmax represents the daily maximum value. The 5 min readings obtained from the light sensors fluctuated by approximately ± 10 µmol m−2 s−1 photosynthetic photon flux density (PPFD). To smoothen the microclimate data (i.e., the PPFD values obtained from light sensors, the temperature values measured within the bryophytes, and water content values obtained from electrical conductivity sensors), 30 min averages were calculated and used for all further calculations. During measurements, the light sensors were regularly checked for algal growth and cleaned accordingly.
2.3 Calculation of the water content (WC)
The WC sensors measure the electrical conductivity in the field (ECt), which is influenced by temperature; consequently, a temperature correction was performed according to Eq. (1), analogous to Weber et al. (2016).
with EC25 as EC at 25 ∘C, T as bryophyte temperature (∘C), and the temperature conversion factor fT:
The WC sensor has a fixed distance between the sensor pins, which ensures that in all sensors the resistance is equal. This guarantees that the electrical voltage, being the inverse resistance, is proportional to the electrical conductivity. The values of the sensors were recorded as electrical voltage in millivolts and by calibration transformed into the WC of the samples, given as dry weight percentage, as explained below.
To determine the maximum water content of the different bryophyte communities, samples of them were collected in the forest area surrounding the ATTO site. They were removed from the stem with a pocket knife and stored in paper bags in an air-conditioned lab container until calibration (a few hours after collection). Prior to the calibration, the samples were cleaned from adhering material using forceps. The weight of the bryophytes was determined when they were moistened until saturation (temperature 30 ∘C; relative humidity, RH, 100 %) and again after drying in a dryer overnight (temperature 40 ∘C, RH 30 %) to simulate the natural range of the WC under controlled temperature and RH conditions. The dry weight (DW) was determined after drying at 60 ∘C until weight consistency was reached (Caesar et al., 2018). The WC of the sample was calculated in analogy to Eq. 3 in Weber et al. (2016):
with FW being the fresh weight (g) and DW the dry weight (g) of the sample.
In a previous approach, calibration curves were established under controlled conditions, logging the electrical conductivity values and the corresponding weight and water content of samples of the different bryophyte species during drying, analogous to Weber et al. (2016). However, the variability of electrical conductivity values between samples and even at different spots within one sample turned out to be too large, and thus this was not a feasible approach to calibrate the sensors. On the other hand, the electrical conductivity values decreased in a linear way with decreasing sample weight, demonstrating that a linear relationship between both factors could be assumed (except for water content close to saturation).
In the current approach, the calibration of the water content was performed based on the maximum and minimum values of electrical conductivity reached in the field and the maximum WC reached during the laboratory measurements. We assumed that the maximum electrical conductivity achieved in the field corresponds to the maximum WC achieved in the laboratory due to water saturation of the samples during the laboratory measurement. The minimum electrical conductivity achieved in the field was used as an approximation (simplification) of a water content of 0 %. We are aware of the fact that bryophytes do not reach a water content of 0 % under field conditions, but they can be expected to dry to a water content of a few percent, which we assume to be close enough for this model assumption in a tropical rain forest environment. Accordingly, the WC was calculated as follows:
where WCmax corresponds to the maximum WC measured in the laboratory, ECi is the electrical conductivity, ECmin is the minimum electrical conductivity, and ECmax is the maximum electrical conductivity measured in the field.
The measured electrical conductivity values showed short-time oscillations, which might be caused by the fact that the bryophyte cushions have some air spaces in-between as we observed that these oscillations are less pronounced in denser substrate. Nevertheless, the overall functionality of the sensors is still ensured also in less dense material, and the short-term fluctuations could be removed with a 30 min smoothing algorithm. Thus, for all calculations the 30 min averages were used. The electrical conductivity data of replicate samples at the same height were combined to obtain average values for each height.
2.4 Meteorology
For the purpose of long-term monitoring, a set of meteorological parameters has been being measured within the ATTO project since 2012. In our study we used rainfall data measured at 81 m (mm min−1; rain gauge TB4, Hydrological Services Pty. Ltd., Australia), RH measured at 26 m (%), air temperature measured at 26 m (∘C; thermohygrometer CS215, Rotronic Measurement Solutions,UK), and photosynthetically active radiation (PAR) measured at 75 m height above the ground (µmol m−2 s−1 PPFD; Quantum sensor PAR LITE, Kipp & Zonen, Netherlands). All data were recorded at 1 min intervals with data loggers (CR3000 and CR1000, Campbell Scientific, Logan, Utah, USA) on the walk-up tower (Andreae et al., 2015).
For calculation of the average light intensities per month, season, or year (PARavg month, PARavg season, PARavg year), only values during daytime (06:00–18:00 LT) were considered. Rainfall data are presented as accumulated values in millimeters per month, season, or year, which were calculated by an integration of 30 min intervals. As there were gaps in the data record of the rain detection, additional information from the WC sensors was used to calculate the number of days with rain events. The sensors at 1.5 m height were found to react reliably to rain events. Thus, the gaps in the rain detection were corrected with the information received from these sensors. Furthermore, the amount of rain within each month was corrected by assuming that during the missing days there were the same amounts as during the rest of the month. Overall, a malfunction of the rain detection was observed on only 6 % of the days (Table S3).
The information on fog events was provided by visibility measurements using an optical fog sensor (OFS; Eigenbrodt GmbH, Königsmoor, Germany) installed at 50 m height. Fog was defined to occur at visibility values below 2000 m.
In order to assess the potential water input by condensation, we calculated the dew point temperature, at which saturated air humidity levels are reached. If the temperature drops below the dew point, condensation might occur and form liquid water. The dew point spread is the temperature difference between a surface temperature and the dew point of the surrounding air and can be used to assess potential condensation processes at surfaces. If the difference between the surface temperature Ts and the dew point of the surrounding air Td is negative, water vapor is able to condense at the colder surface. The calculations were performed according to Eqs. (5) and (6):
and
where ΔTd is the dew point spread (∘C), Ts is the surface temperature (bryophytes sensors, 23 m or 1.5 m; ∘C), Td is the dew point temperature air (∘C), ϑ is the temperature (∘C), and φ is the relative humidity (%). The dew point spread calculation was performed for the levels of 23 and 1.5 m height. As a data source for air temperature and humidity, meteorology data assessed at the walk-up tower at 26 and 1.5 m were used. For surface temperature (Ts), the temperature data measured within the bryophyte communities at 23 and 1.5 m height were applied. To analyze if condensation might influence the WC in the bryophytes, a correlation between events with negative ΔTd and the change in the WC in the 4 h before these events was calculated. The potential effect of fog was analyzed by calculating the average change in water content (ΔWC) from the beginning of the fog event until 1 h later. The dew point and fog calculations and correlations were performed with R version 3.6.1 (5 July 2019).
Time readings are always presented as UTC (universal coordinated time) values, except for diurnal cycles, where local time (i.e., UTC-4) is shown, as labeled in the figures.
2.5 Potential physiological activity of bryophytes
The physiological activity of bryophytes – and of cryptogams in general – is primarily controlled by water and light, whereas temperature plays a secondary role, at least in the environment of the central Amazon (Lösch et al., 1994; Wagner et al., 2013). While the availability of water determines the overall time of physiological activity, the light intensity regulates whether net photosynthesis (NP) or dark respiration (DR) dominates the overall metabolic balance. Furthermore, high nighttime temperatures cause increased carbon losses due to high respiration rates, as previously shown for lichens (Lange et al., 1998, 2000). For tropical bryophytes along an altitudinal gradient in Panama, however, it has been shown that respiration loss during the night might not play a determining role for an overall positive net carbon balance as species acclimatized to elevated temperatures but that the restricted time for photosynthesis was a decisive factor (Wagner et al., 2013).
To assess the potential physiological activity of bryophyte communities, the water and light conditions as major drivers of the metabolism were investigated in somewhat greater detail. The lower water compensation point (WCP) presents the minimum WC that allows positive net photosynthesis. For the tropical liverwort Symbiezidium spp., occurring in the lowlands near sea level in Panama, WCP values in the range between ∼ 30 % and ∼ 80 % have been determined (Wagner et al., 2013; Table S4).
The lower light compensation point (LCPl) represents the minimum light intensity that allows a positive primary production; it ranges between ∼ 3 and ∼ 12 µmol m−2 s−1 for bryophytes (based on measurements of Ectropothecium cf. perrottii, Frullania spec, Neckera spec., Plagiochila divergens, Plagiochila squamulosa, Porothamnium stipitatum, Porotrichum molliculum, Racopilum tomentosum, Radula boryana, Rhizogonium spiniforme) occurring in African tropical lowland rain forests (Lösch et al., 1994). The epiphytic bryophytes grew in an upper lowland rain forest in the Kahuzi-Biega National Park (Zaire) at about 800 m a.s.l. Microclimatic conditions inside the forest were similar to the conditions at the ATTO site as RH ranged from around 60 % to 70 % during sunny days, and temperatures remained above 20 ∘C during night and day. At light intensities below the LCPl and WC below the WCP, respiration rates are higher than NP rates, causing overall net respiration to occur.
With regard to temperature, a range for optimum NP (Topt) and an upper compensation point, where NP equals DR (TCP), can be defined. For tropical bryophytes (i. e., the species Octoblepharum pulvinatum, Orthostichopsis tetragona, Plagiochila sp. 1, Stictolejeunea squamata, Symbiezidium spp., Zelometeorium patulum), Topt ranges between 24 and 27 ∘C, and the TCP ranges between 30 and 36 ∘C, as described by Wagner and coauthors (Wagner et al., 2013). For long-term survival and growth, the bryophytes need to be predominantly exposed to temperatures below the upper compensation point, at least under humid conditions. The measurements performed by Wagner et al. (2013) were conducted at a study site (BT) in a lowland rain forest in western Panama on the Bocas del Toro archipelago, located approximately at sea level. The mean temperature was 25 ∘C (26 ∘C during day, 24 ∘C during night), thus slightly warmer than the temperatures measured at ATTO. With 3300 mm a−1 of rain, BT is in a similar range as the ATTO site (2540 mm a−1). Unfortunately, literature data on the compensation points are rare, facilitating only a first approximate assessment of the physiological processes (Lösch et al., 1994; Wagner et al., 2013).
A WC above the compensation point allows NP if both light intensity and temperature are above the lower compensation point. If WC is above the compensation point, but light intensities are too low, or if temperatures are above the upper compensation point, net DR occurs. There is also a narrow span of low WC when samples are activated already, but despite sufficient light intensities only net respiration can be measured. As this span of WC is narrow and respiration rates are low, it has been neglected in the current calculations. The compensation points for the different parameters are also to some extent interrelated; e.g., the water compensation point of lichens has been shown to slightly increase with increasing temperature (Lange, 1980), but this can be neglected in such a first qualitative approach. Finally, also inter- and intraspecific variation in compensation points could not be considered in the current study.
2.6 Data analysis
All data processing steps and analyses were performed with the software Igor Pro (Igor Pro 6.37, WaveMetrics. Inc, Lake Oswego, Oregon, USA). For the average values obtained at the different height levels, the data of the individual sensors were pooled.
Table 1Annual mean values and standard deviations (±SD) of mean daytime photosynthetically active radiation (PARavg), temperature, and water content (WC) of bryophytes at the three height levels and above the canopy (a). Annual sum of rain and fog days as well as the annual sum of rain (b). Mean values were calculated from 30 min intervals. Due to data gaps in the measured rain (shown in brackets), missing values were also extrapolated from existing data as described in the methods section (values behind the brackets). Values for PARmax can be found in Table S6.
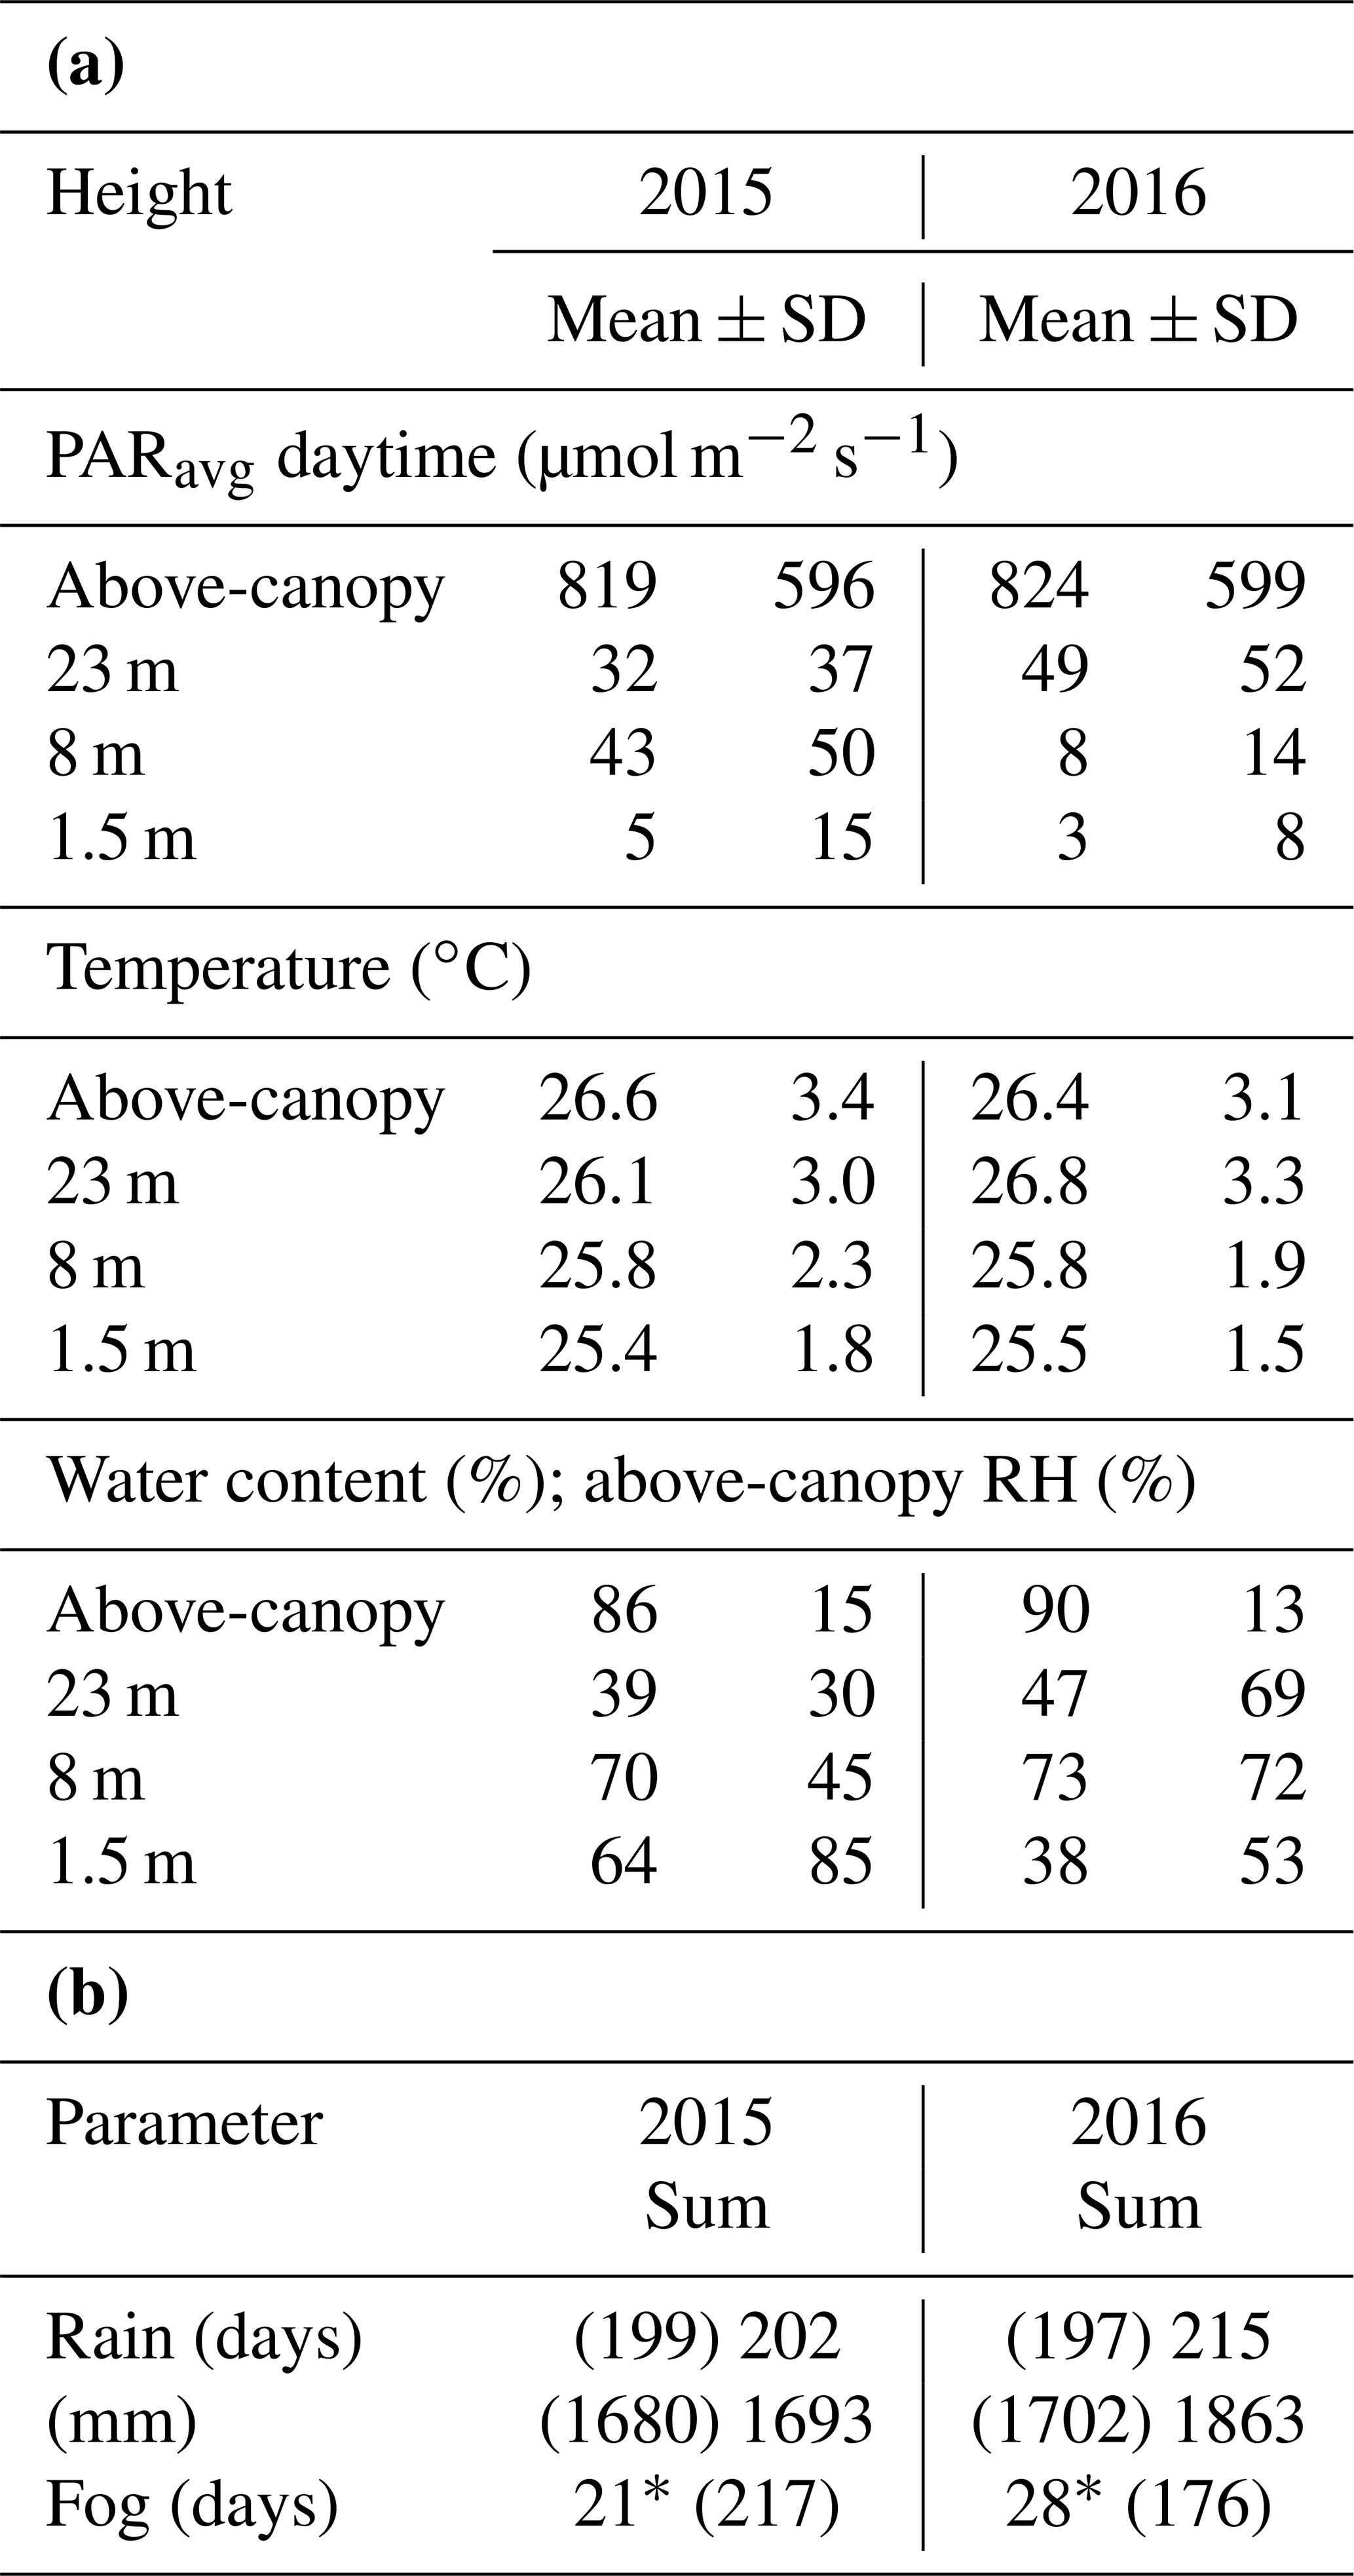
* Gaps in the data record due to malfunction of fog sensor during time windows of 31 May–20 October 2015, 30 April–6 July 2016, and 1 September–31 December 2016. Numbers in brackets are the operational days of the sensor.
3.1 Microclimatic conditions
3.1.1 Annual fluctuation of monthly mean values
Over the course of the 2 years of measurements, the monthly mean values of the WC, temperature, and light conditions experienced by the epiphytic bryophyte communities as well as the above-canopy meteorological conditions varied between seasons and years. Comparing the 2 consecutive years, the effect of an El Niño event was clearly detectable as rainfall amounts were 35 % lower (525 mm versus 805 mm), and relative air humidity was 11 % lower (81 % versus 92 %) between October 2015 and February 2016 as compared to the same time span in the previous year (Fig. 1, Table S3).
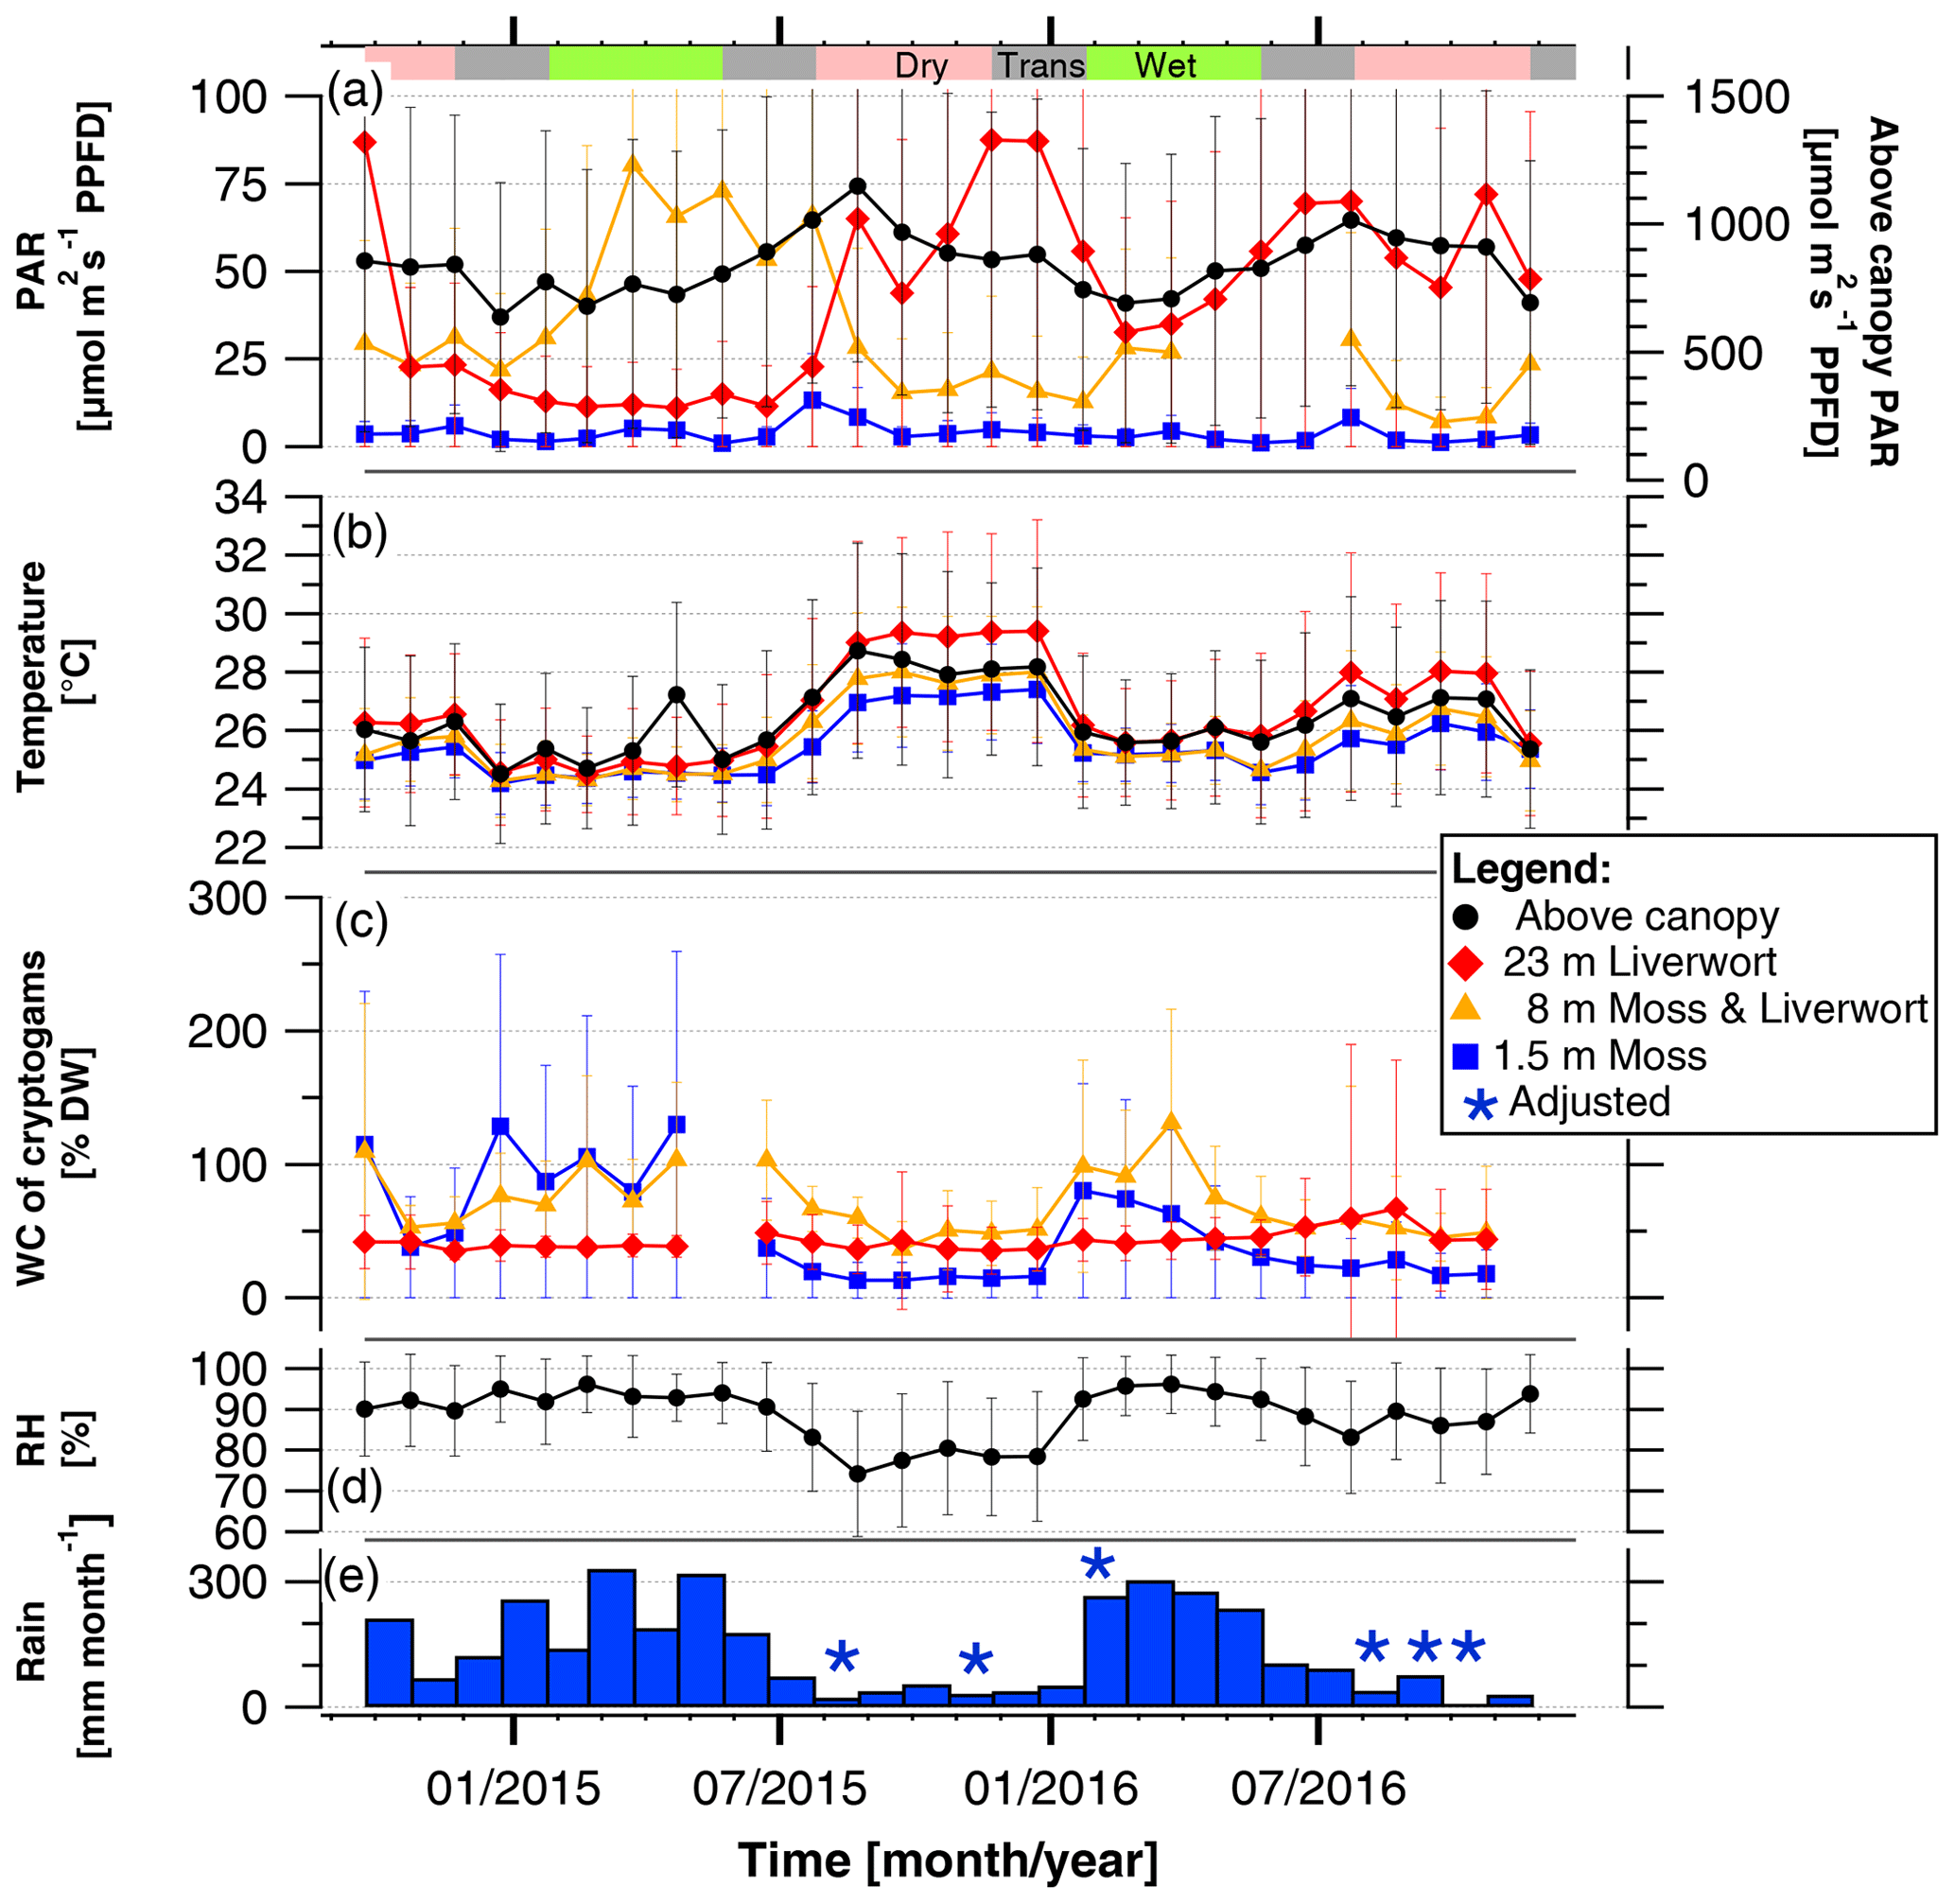
Figure 1Mean light condition (PARavg), temperatures, and water content (WC) experienced by bryophyte communities, and above-canopy meteorological conditions in the Amazonian rain forest. The micrometeorological parameters on top and within epiphytic cryptogamic communities represent monthly mean values ±SD of (a) daily averages (06:00–18:00 LT) of photosynthetically active radiation (PAR) on top, (b) temperature within, and (c) WC of cryptogamic communities. The above-canopy meteorological parameters comprise the (a) monthly mean value of the daily average (µmol m−2 s−1 PPFD) (06:00–18:00 LT) of above-canopy photosynthetically active radiation (PAR at 75 m), (b) monthly mean value of above-canopy temperature (at 26 m), (d) monthly mean value of relative air humidity (RH at 26 m height), and (e) monthly amount of rain. Data of replicate sensors installed within communities at the same height level were pooled, while above-canopy parameters were measured with one sensor each. Colored horizontal bars in the upper part of the figure indicate the seasons. Exact values and additional data are presented in Tables S3 and S5.
The monthly mean values of above-canopy PAR (PARavg) were rather stable throughout the years and did not differ between the years 2015 and 2016, ranging between 635 and 1150 µmol m−2 s−1 during the daytime (Fig. 1, Table 1, Table S3). The PARavg values in the understory at 1.5 m also showed only minor seasonal variation, whereas those at higher levels revealed larger variations (Fig. 1, Table S5). However, the light conditions observed at one individual tree are strongly influenced by its canopy structure and foliation and thus could not be considered as data representative for the canopy in general.
Over the course of the years, the monthly mean temperatures at all heights as well as above-canopy temperatures showed a parallel behavior (Fig. 1). The temperatures decreased in a stepwise manner from the canopy to the understory, and temperatures within bryophytes at 23 m height were frequently higher than the temperatures measured above the canopy (Figs. 1, S6). Overall, temperatures at all height levels were lower and more similar during the wet than the dry seasons.
Over the course of the years, the monthly WC of epiphytic bryophytes showed similar patterns corresponding to the increasing and decreasing values of rain and RH. During the dry season 2015, it rained on 25 % of the days, while in the previous and subsequent years rain occurred at a higher frequency (58 % and 31 % of the days, respectively; Fig. 1, Table S3). Monthly rain amounts varied from 9 mm during the dry to 341 mm during the wet season. In 2016, the rain increased from January to March and decreased from March to August, while in 2015 the monthly rain amounts were more variable but still lower throughout the year. The lowest monthly average of the RH was observed during the dry season 2015, with 74 ± 15 %. The monthly WC values of epiphytic bryophyte communities at 1.5 and 8 m varied between seasons in parallel to the monthly rain amounts, whereas at 23 m the values remained relatively stable over the complete measurement time. During the dry seasons, the WC of the mosses at 1.5 m tended to be lowest, whereas during the wet season this was the case for the liverworts at 23 m height (Fig. 1, Table 2).
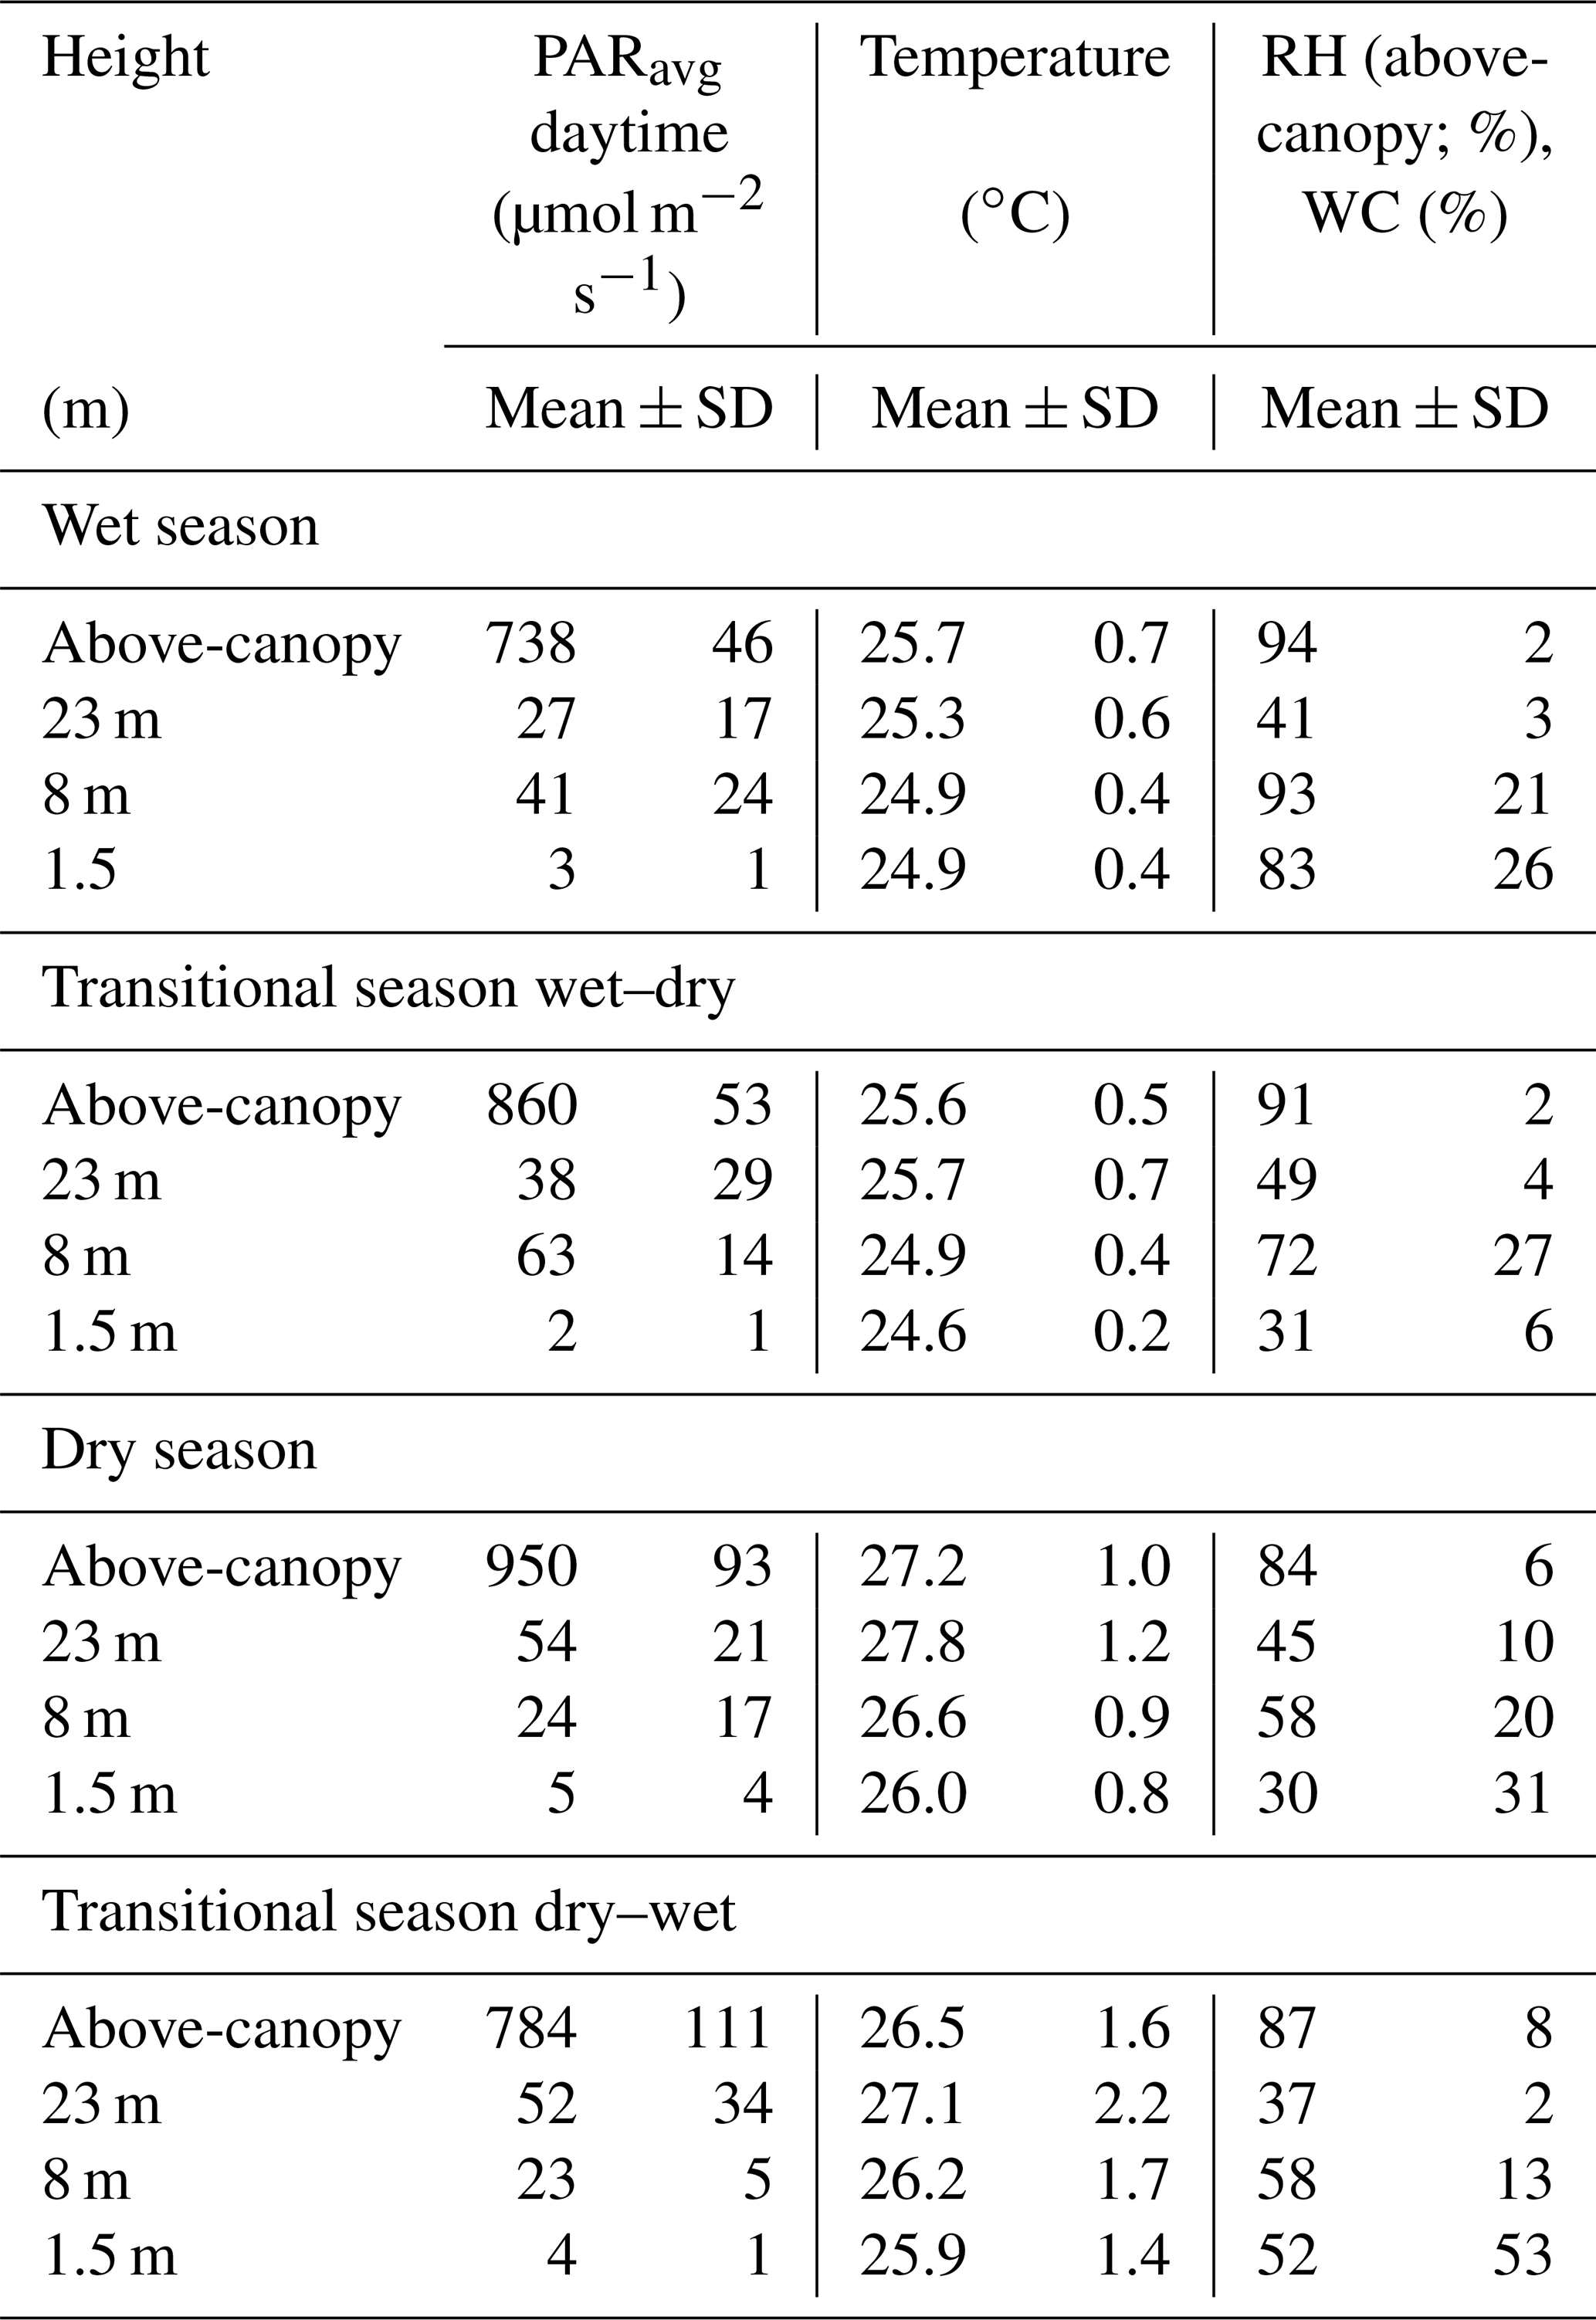
Table 2Seasonal mean values and standard deviations (±SD) of the mean photosynthetically active radiation (PARavg), the temperature, and the above-canopy relative humidity (RH) or water content (WC) of bryophytes determined at different height levels and above the canopy. Mean values for the respective seasons were calculated from 30 min intervals from October 2014 to November 2016. Values for PARmax can be found in Table S7.
3.1.2 Seasonal changes between wet and dry season
The wet seasons were characterized by a high frequency of precipitation events, large amounts of rain per event, the frequent appearance of fog, and high RH values, ranging mostly above 70 % (Fig. 2, S7, Table 2). In contrast, during the dry season the precipitation events were much rarer and smaller, there was hardly any occurrence of fog, and the RH regularly had values below 60 %. Comparing environmental conditions of the seasons, the diel amplitudes of ambient light, temperature, and RH were larger in the dry compared to the wet season (Fig. 3). While the microclimatic temperature and light conditions within and on top of the epiphytic bryophyte communities mostly followed the above-canopy conditions, modified by canopy shading, the WC of bryophytes did not present a clear pattern (Fig. 3).
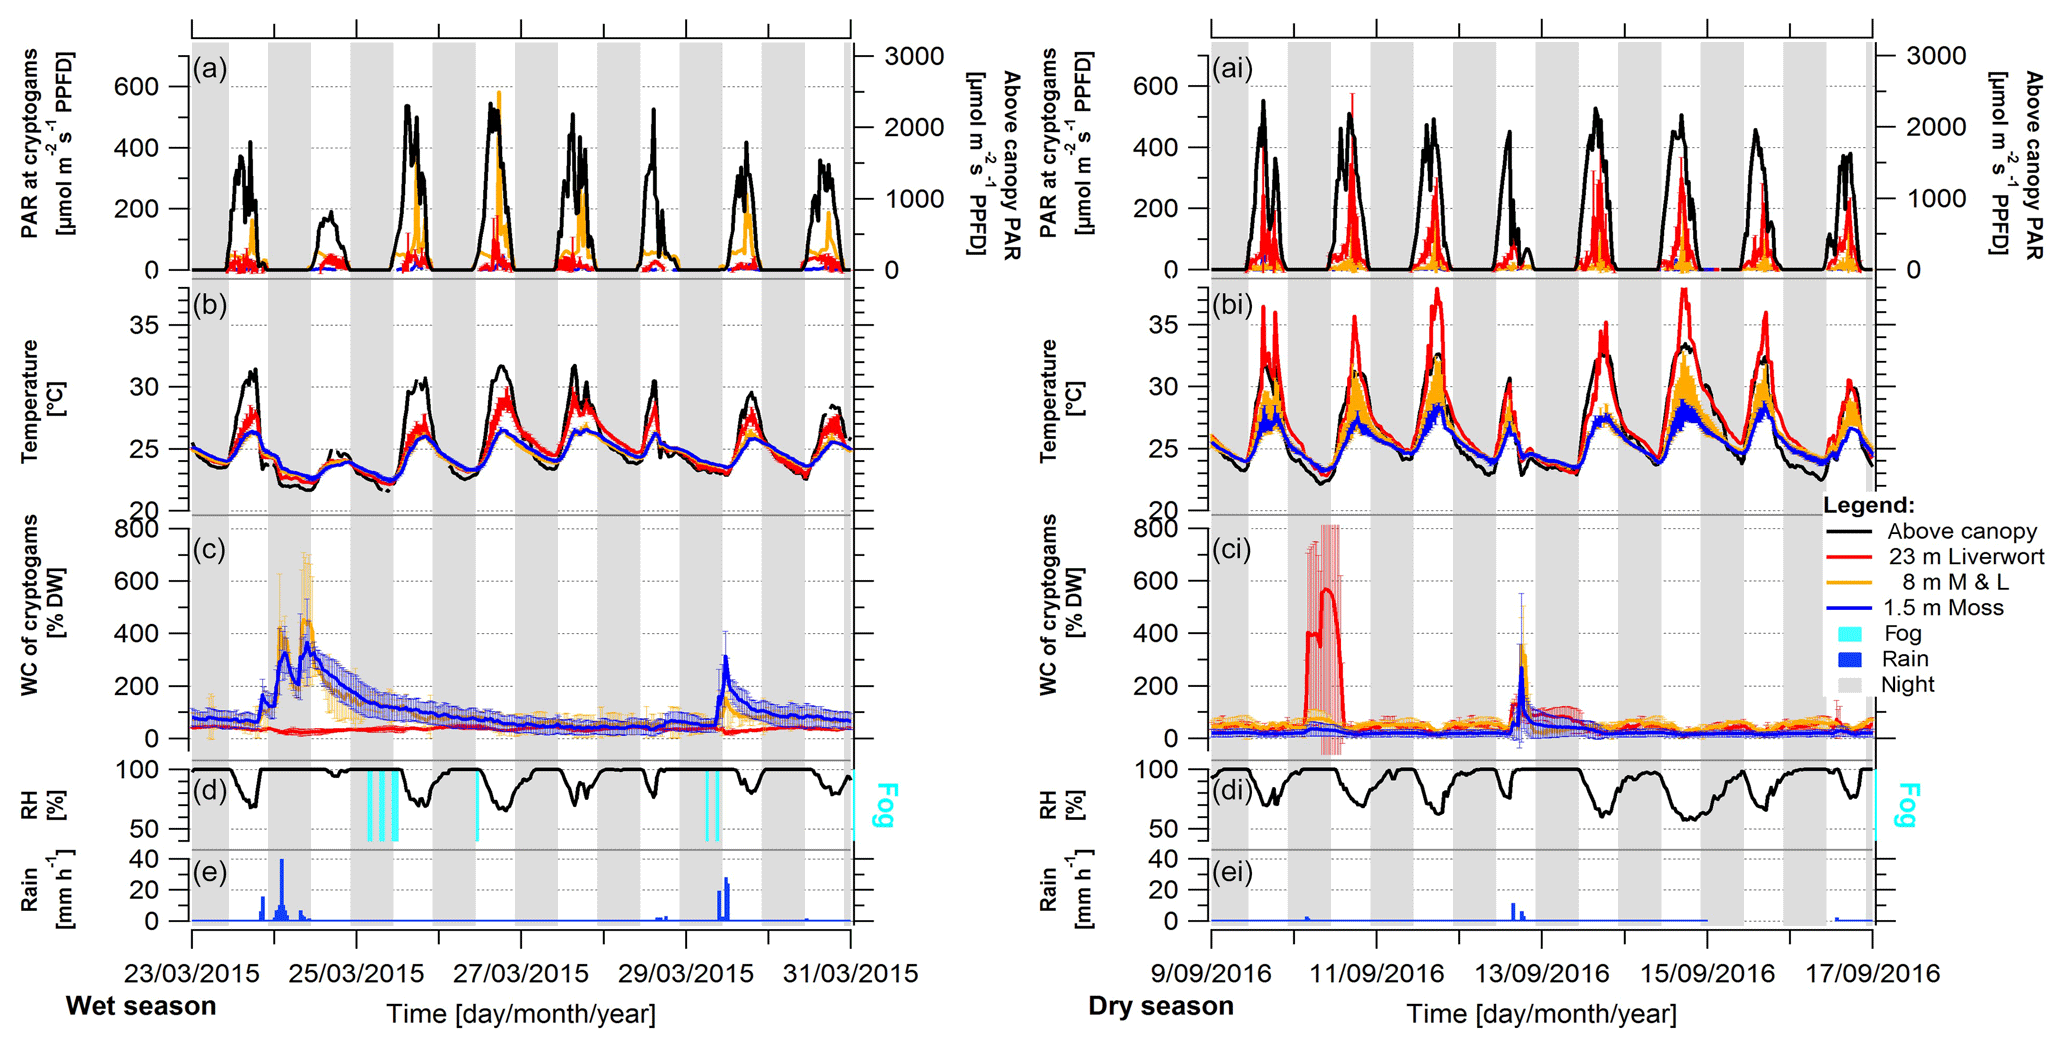
Figure 2Representative periods during the wet and dry season under average conditions, showing light condition (PAR), temperature, and water content (WC) of bryophytes, and above-canopy meteorological conditions in the Amazonian rain forest. Shown are 8 d periods during (left) the wet season 2015 and (right) the dry season 2016. The micrometeorological parameters on top and within epiphytic cryptogamic communities represent (a, ai) the photosynthetically active radiation (PAR) on top, (b, bi) the temperature within, and (c, ci) the WC of cryptogamic communities. The above-canopy meteorological parameters comprise (a, ai) above-canopy photosynthetically active radiation (PAR at 75 m), (b, bi) above-canopy temperature (at 26 m), (d, di) relative air humidity (RH at 26 m height), presence of fog events, and (e, ei) rain amount. The data show 30 min averages ±SD except for rain, which shows hourly sums. Data of replicate sensors installed within communities at the same height level were pooled, while above-canopy parameters were measured with one sensor each. The nighttime is shaded in gray (18:00–06:00 LT).
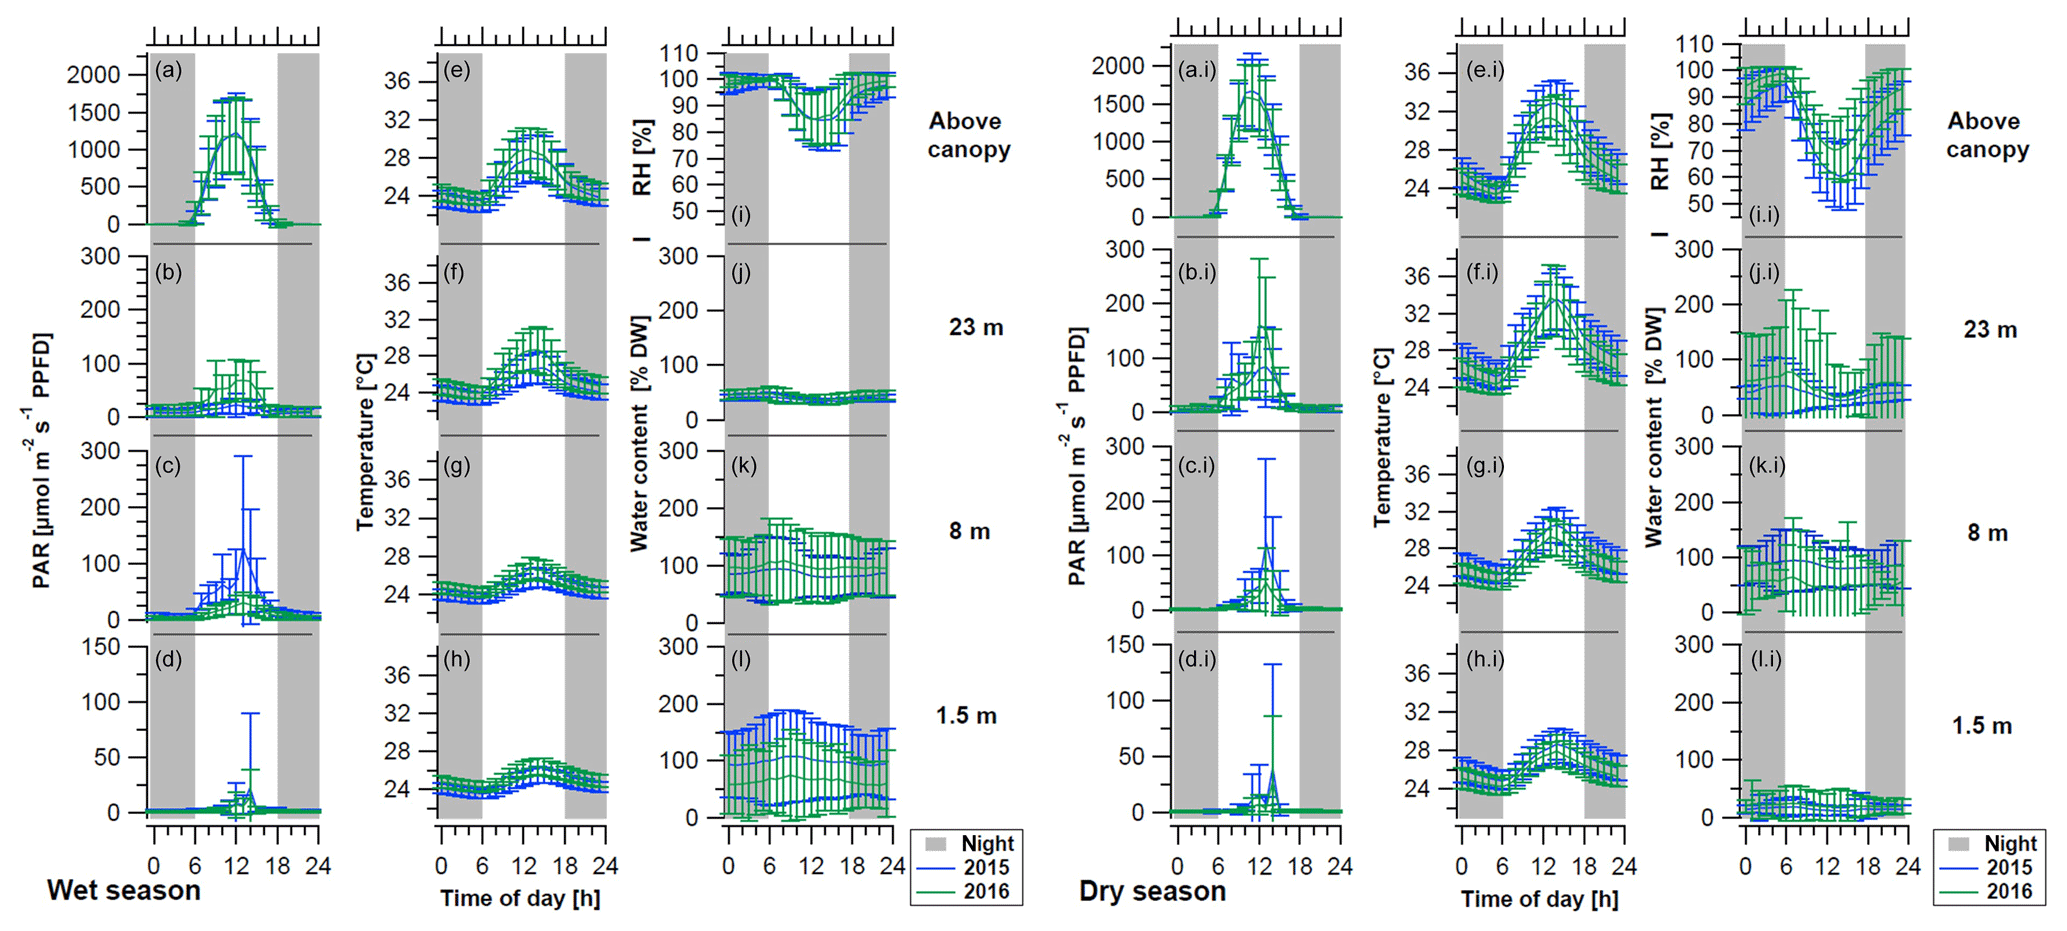
Figure 3Mean diurnal cycles of light conditions (PAR), temperature, and water content (WC) of bryophytes and above-canopy meteorological parameters during (left) the wet season and (right) dry season of the years 2015 (blue lines) and 2016 (green lines). The above-canopy meteorological parameters comprise (a, ai) the photosynthetically active radiation (PAR at 75 m), (e, ei) the temperature (at 26 m), and (i, ii) the relative air humidity (RH at 26 m height). The micrometeorological parameters measured on top and within epiphytic cryptogamic communities comprise (b–d, bi–di) the photosynthetically active radiation (PAR) on top, (f–h, fi–hi) the temperature within, and (j–l, ji–li) the WC of cryptogamic communities at different height levels. Diel cycles were calculated from 30 min intervals of the whole seasons and show hourly mean values ±SD. Data of the sensors installed at the same height level were pooled, while the above-canopy parameters were measured with one sensor each. Nighttime is shaded in gray (18:00–06:00 LT).
The above-canopy light intensity (PARavg daytime) tended to be higher and to show somewhat stronger fluctuations in the dry season than in the wet season (950 ± 93 µmol m−2 s−1 vs. 738 ± 46 µmol m−2 s−1; Table 2). During both main seasons the average light intensity (PARavg daytime) decreased from the canopy towards the understory. During the dry season this happened in a regular stepwise manner, whereas in the wet season there were some irregularities, probably caused by the local canopy structure (Figs. 2, 3, Table 2).
The temperatures showed a decreasing gradient from the canopy (wet season: 25.7 ± 0.7 ∘C; dry season: 27.2 ± 1.0 ∘C) towards the understory (wet season: 24.9 ± 0.4 ∘C; dry season: 26.0 ± 0.8 ∘C), and the differences among heights and diel amplitudes were more pronounced during the dry season (Figs. 2, 3, Table 2). During the dry season, temperatures within the bryophyte communities at 23 m height were frequently higher than the above-canopy values, and even the seasonal average temperature was 0.6 ∘C higher, probably due to surface heating (Table 2).
During the wet seasons of 2015 and 2016, rain occurred on average on 84 % of the days and in the dry season on 28 % of the days (Table S3). During the wet season, an average RH of 94 ± 2 % and frequently even full saturation were reached, while during the dry season the RH reached an average value of 84 ± 6 % (Table 2). Fog was recorded on 60 % of the days during the wet seasons and on 20 % of the days during the dry seasons, respectively (Fig. 2, Table S3). According to our observations, fog observed above the canopy normally also occurred (at least to some extent) within the forest.
The WC of the bryophytes reacted quite reliably upon rain that had fallen in the preceding hours (Figs. S7, S8), with some differences between the different height levels. The sensors at 1.5 and 8 m responded consistently to rain events, while for the liverworts at 23 m height an immediate response was only sometimes observed. During the wet season, the bryophytes at 1.5 and 8 m height contained an increased WC over several days after a rain event, while in the dry season the samples tended to dry quickly again. Overall, the bryophytes at 8 and 23 m showed a regular and pronounced daily fluctuation of the WC, which occurred during all seasons, but was particularly regular during the dry season due to the rare interfering rain events (Figs. 2, S5c, S11). A potential condensation of dew, when the temperature of the bryophytes drops below the dew point of the ambient air, was mostly reached during the morning hours (Figs. S9–S12). This occurred during ∼ 50 % of the wet season and ∼ 30 % of the dry season days at the surface of bryophytes at 23 m height (Figs. S10, S11). Contrastingly, at 1.5 m height dew point temperatures were only surpassed during ∼ 9 % of the days, independently of season. Plots of exemplary dew point events at 1.5 and 23 m height suggest that negative dew point spread values (i.e., bryophyte temperature below dew point of ambient air) cause increased water content values (Fig. S12). To analyze this potential effect, we extracted the largest dewfall spread value per day, and for all negative daily values we calculated the slope of the water content data of the last 4 h prior to the negative dew point spread. Relating these parameters with each other, we obtained small negative Pearson's R values for the three WC sensors at 23 m height (i.e., RWC21: −0.071; RWC23: −0.076; RWC24: −0.040), suggesting that bryophyte temperatures below the dew point temperature of the ambient air caused an increase in water content and thus a condensation of water. An effect of fog occurrence on the WC of bryophytes could not be directly shown as the WC decreased within 1 h after the fog event started (i.e., ΔWC21: −1.6 %; ΔWC23: −0.4 %; ΔWC24: −3.4 %), probably due to the effect of rising temperatures during the morning hours.
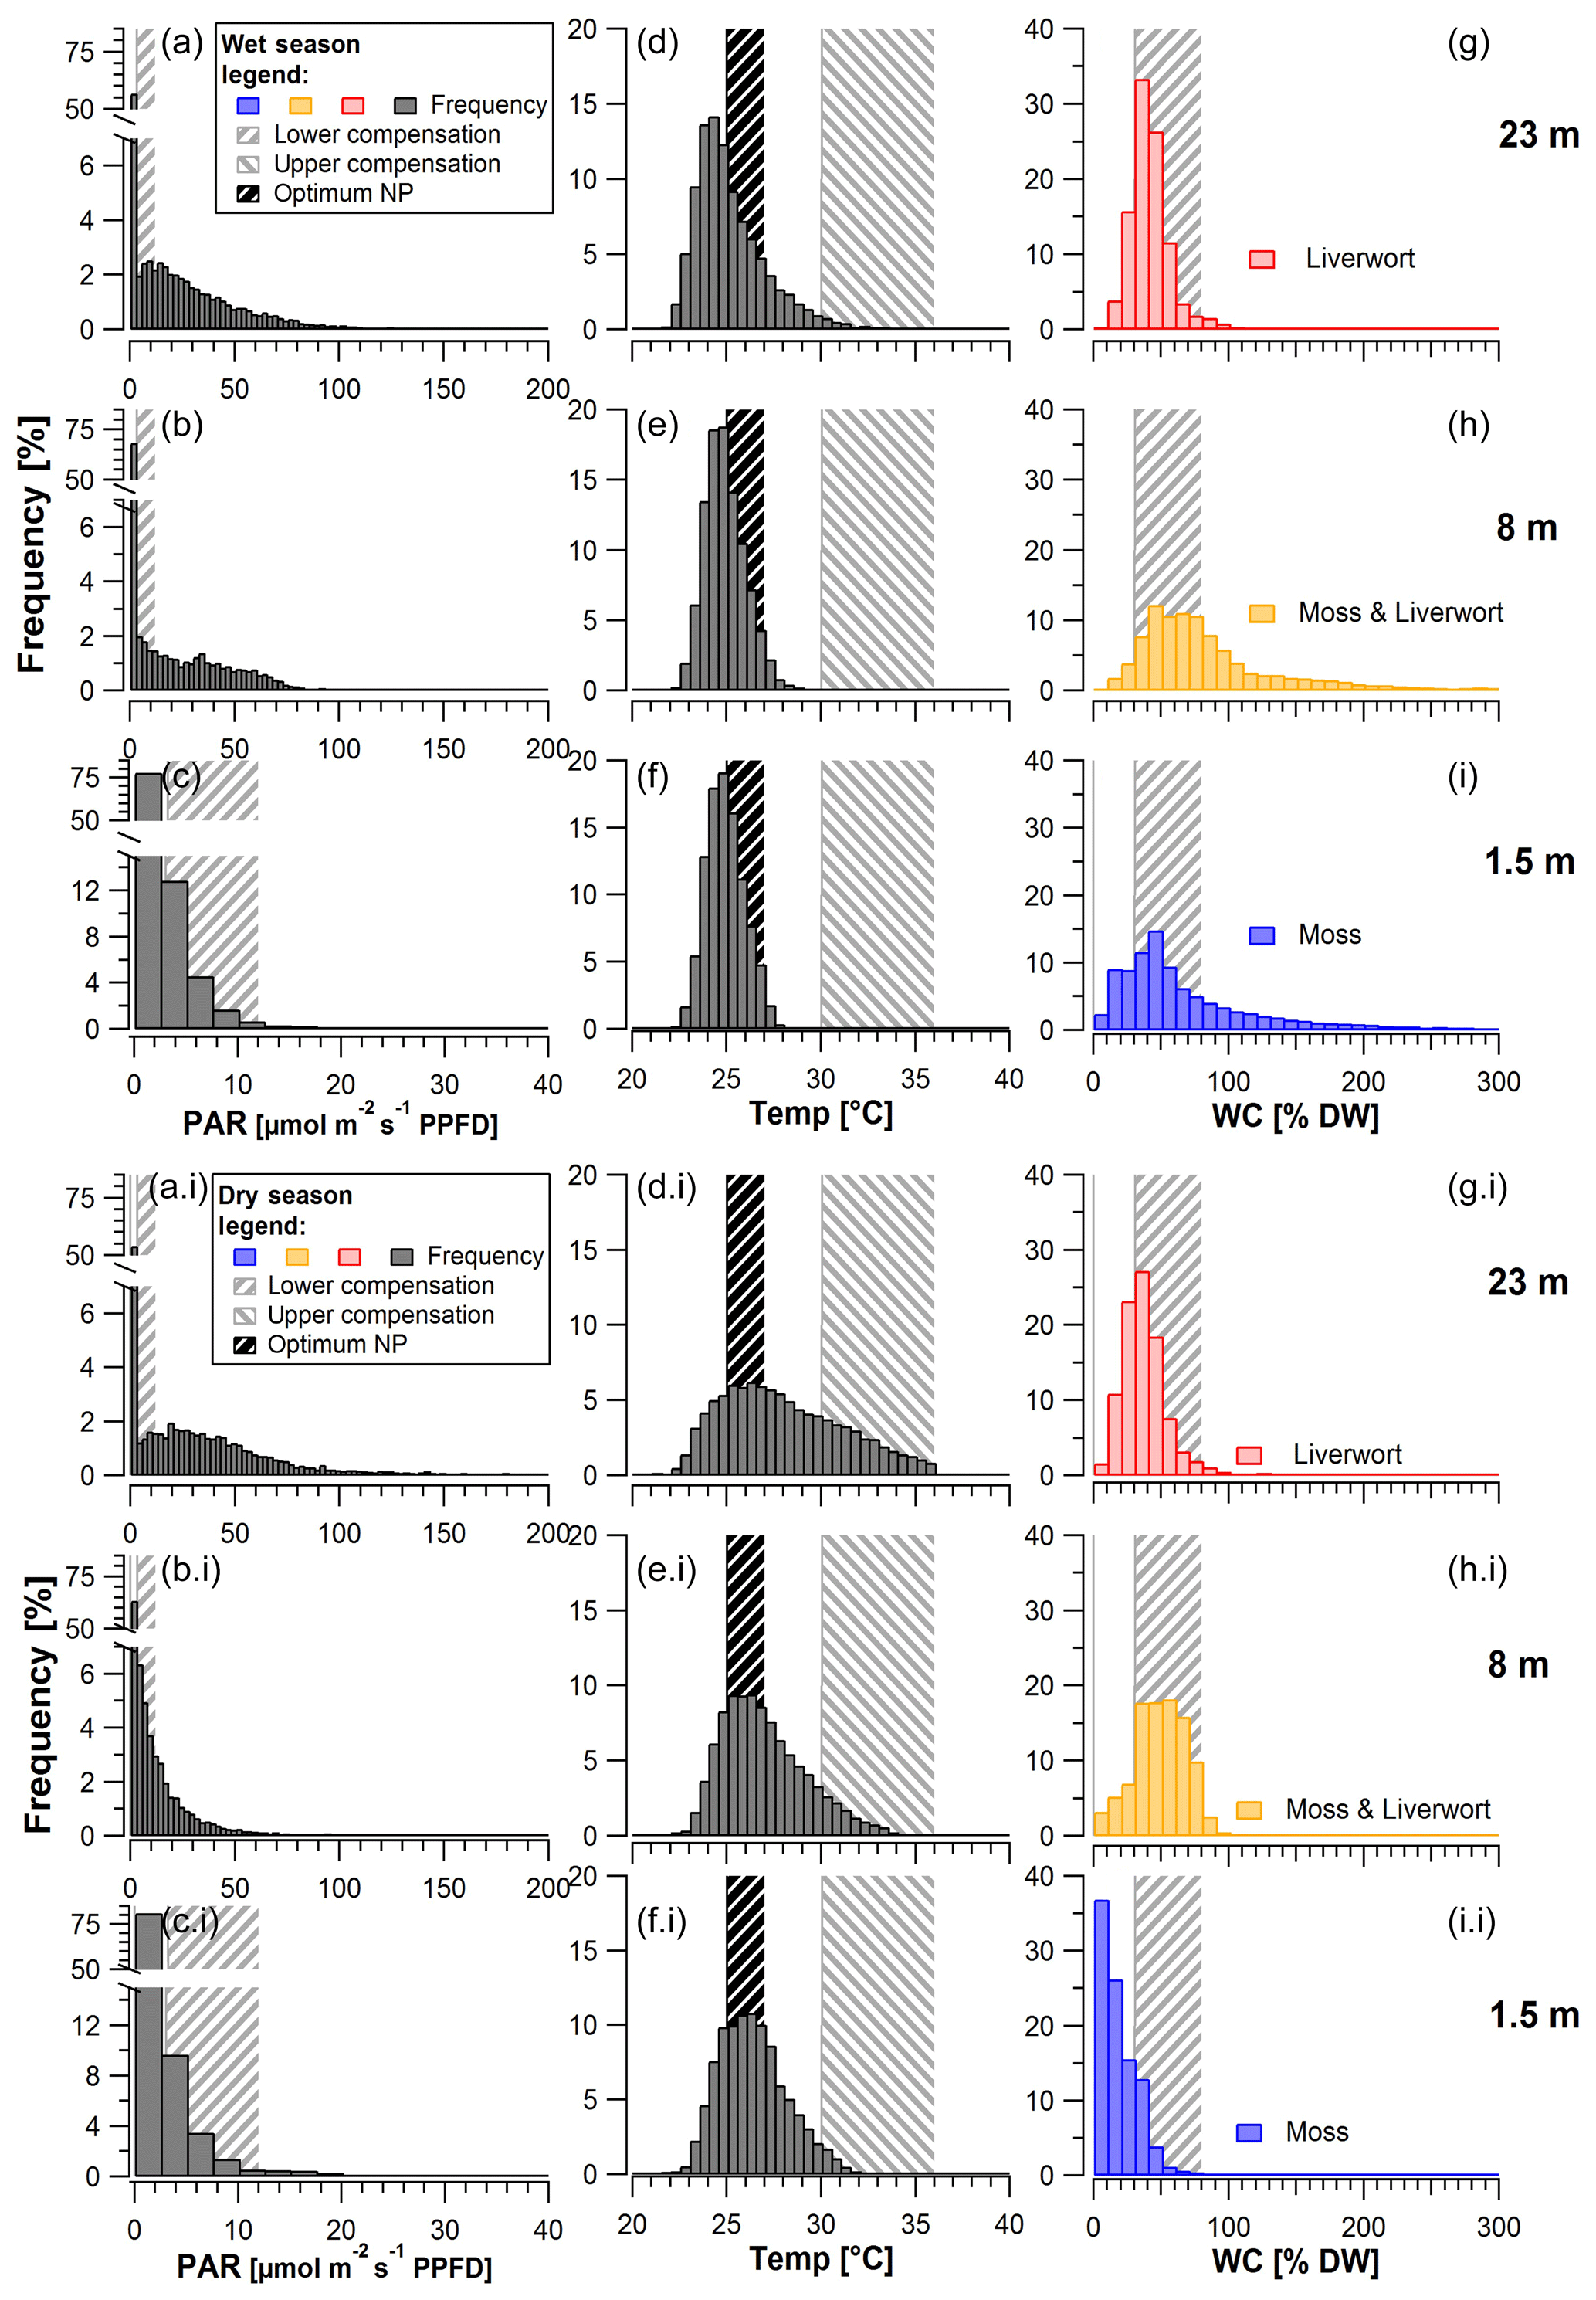
Figure 4Frequency of mean photosynthetically active radiation (PAR; a–c, ai–ci), temperature (Temp; d–f, di–fi), and water content (WC; g–i, gi–ii) measured on top and within bryophytes at 1.5, 8, and 23 m height during (top) the wet and (bottom) the dry season. Calculation of the histograms based on 30 min intervals. Shaded areas represent the ranges of reference values for lower compensation (PAR, WC), upper compensation (temperature), and the optimum (temperature) for net photosynthesis, as measured by Lösch (1994) and Wagner et al. (2013; Table S4). Bin sizes for PAR: 2.5 µmol m−2 s−1; temperature: 0.5 ∘C; WC: 10 %.
3.2 Potential physiological activity of bryophytes
Whereas overall light intensities at the upper two height levels were rather similar, with values below 108 and 147 µmol m−2 s−1 (at 8 and 23 m height) 90 % of the time, the values at 1.5 m height remained below 10 µmol m−2 s−1 during the same time fraction (Fig. 4). In contrast to that, maximum light intensities were similarly high, reaching 1550 (1.5 m), 1500 (8 m), 1040 (18 m), and 950 µmol m−2 s−1 (23 m). If we assume a low light compensation point (LCPl) ranging between 3 and 12 µmol m−2 s−1 (Lösch et al., 1994), the understory samples (1.5 m) exceeded that range only less than 20 % of the time during both the wet and the dry season, whereas at the uppermost height level the bryophytes exceeded these values one-third to almost half of the time (Table 3).
Table 3The potential time fractions (%) during which the epiphytic bryophytes at the different height levels exceeded the lower compensation points of light (LCPl), the upper compensation points for temperature (TCP), and the lower compensation points for water (WCP) and reached the optimal temperature for net photosynthesis (Topt). The results are shown separately for (a) the wet season (February–May) and (b) the dry season (August–November). Values are given for the different height levels (1.5, 8, 23 m) and bryophyte divisions (M= moss, L= liverwort). For the net photosynthesis (NP) it is required that WC > WCP, PAR > LCPl, and T <TCP; for the dark respiration (DR) it is necessary that WC > WCP and PAR <LCPl or WC > WCP and T > TCP; 30 min averages of measurements during the entire measurement period from October 2014 to November 2016 were considered. The data show the averages of the different samples per height zone. The ranges of the compensation points (CPs) and the optimum temperature (opt) were reported in Lösch (1994) and Wagner et al. (2013; see Table S4).

The temperatures inside the moss stands at different height levels mainly ranged between 22 and ∼ 28 ∘C during the wet and between 23 and ∼ 33 ∘C during the dry season (Fig. 4). For tropical lowland regions, the optimum temperatures for bryophytes (Topt) have been suggested to range between 24.0 and 27.0 ∘C (Wagner et al., 2013). If we assume this range for our study, the temperatures in the understory (at 1.5 m height) remained within these limits 91 % of the time during the wet season and 76 % of the time during the dry season (Table 3). In the canopy (at 23 m height), temperatures remained in this range 70 % of the time during the wet and 46 % of the time during the dry season (Table 3). For an upper temperature compensation point (TCP), above which respiration exceeds photosynthesis, Wagner and coauthors suggested 30.0–36.0 ∘C (Wagner et al., 2013). In the understory, this TCP was never surpassed during the wet season and only rarely during the dry season. Similarly, at the uppermost canopy level, the upper TCP was surpassed 0 %–3 % of the time during the wet and 0 %–27 % of the time during the dry season. Overall, the highest temperatures were reached when the bryophytes were relatively dry and most probably inactive (Fig. S13). The WC of bryophytes differed along the vertical profile, with smaller values in the understory at 1.5 m height than in the canopy (8 m and 23 m), particularly during the dry season (Fig. 4). Considering a lower water compensation point (WCP) between 30 % and 80 % according to the literature (Wagner et al., 2013), bryophytes at the uppermost level surpassed these values 3 %–80 % of the time during the wet and 6 %–64 % of the time during the dry season. Contrastingly, at 1.5 and 8 m height there were larger differences between seasons as the assumed upper range of the WCP was only rarely reached during the dry but ∼ 40% of the time during the wet season (Fig. 4, Table 3).
4.1 Microclimatic conditions
In the current study we measured the microclimatic conditions experienced by epiphytic bryophyte communities along a vertical gradient over the course of more than 2 years. In previous studies, microclimatic data on the light, temperature, and air humidity have been assessed at different height levels within the forest (Chazdon and Fetcher, 1984; Lösch et al., 1994; Romero et al., 2006), but long-term measurements of the water content and the light and temperature on top and inside the cryptogamic communities have been missing up to now.
The microclimatic conditions experienced by epiphytic bryophyte communities along a height gradient at the ATTO site followed the meteorological parameters to some extent, but they also revealed microsite-specific properties regarding annual, seasonal, and diel microclimate patterns. Whereas the water content and the temperature mostly followed the patterns of the meteorological parameters precipitation and temperature, the light intensities were clearly altered, particularly in the understory, due to the local canopy structure.
Within one height level, the small-scale environmental conditions (such as radiation and shading), water conditions, and wind velocity vary, depending on the specific habitat conditions, such as, e.g., exposition, tree foliage, and inclination of the substrate (Barkman, 1958; Campos et al., 2019; Cornelissen and ter Steege, 1989; Oliveira and Oliveira, 2016; Sierra et al., 2018). These small-scale patterns also explain the variability observed within one height level.
Over the measurement period, the monthly averages of above-canopy light conditions (PARavg) were rather stable (Fig. 1, Table S3). Within the canopy, the monthly PARavg values at 23 m height tended to be higher during the dry seasons, whereas patterns were less clear at 8 m height, and there was hardly any seasonal variation at 1.5 m height. This was most probably an effect of the canopy structure, cushion orientation, and shading. The sensors at 1.5 and 8 m were installed vertically along the trunk, whereas at 23 m they were positioned on the upper side of a horizontal branch. As the light sensors at 23 m height were located within the canopy, newly growing leaves may have periodically shaded the organisms, which may explain the lower monthly PARavg values at this height level compared to the values at the lower levels, where sunbeams could come through the canopy of neighboring trees and open space.
The diel patterns of PARavg are expected to show a decreasing gradient from the canopy to the understory as the canopy receives the most solar radiation, while the understory vegetation is expected to be shaded by foliage and branches. During the dry season this general pattern was indeed observed, whereas during the wet season mean light intensities were often higher at 8 m than at 23 m, probably also caused by canopy shading effects at the upper two height levels (Fig. 2). High light intensities above 1000 µmol s−2 s−1 occurred in the understory only as small light spots of short duration and thus were only observed 0.008 % of the time. For the understory of a rain forest in Costa Rica, light intensities were reported to range from 10 to 1000 µmol m−2 s−1, and more than in 50 % of the total amount of light resulted from sun flecks (Chazdon and Fetcher, 1984). Bryophyte and lichen taxa in the understory are known to be adapted to these low-light conditions and are able to make efficient use of the rather short periods of high light intensities (Lakatos et al., 2006; Lange et al., 2000; Wagner et al., 2014).
The temperatures measured inside the bryophyte communities followed the above-canopy temperature at all height levels, with a mostly increasing gradient from the understory towards the canopy, probably caused by a reduced shading effect towards the canopy (Fig. 1, Tables 1, 2). At the uppermost height level, mean temperatures inside the bryophyte communities were often even higher than the mean above-canopy temperatures. During the wet season, the overall temperature conditions were more buffered due to reduced incoming radiation caused by clouds and a frequent mixing of the air masses during rain events (von Arx et al., 2012; Gaudio et al., 2017; Thompson and Pinker, 1975).
The microclimatic mean temperature differences measured inside the bryophyte stands between the understory (1.5 m) and the canopy (23 m) were 1.5 ∘C in the dry and only 0.5 ∘C in the wet season. Compared to these results, a temperature difference of 4.0 ∘C was determined during the dry season in a tropical evergreen forest in Thailand, while in the wet season it was below 1.0 ∘C, thus corresponding quite well to our results (Thompson and Pinker, 1975; Table 2). The daily amplitude of the temperature was about twice as large in the canopy as compared to the understory (Fig. 3). This could be caused by the exposure to strong solar radiation and higher wind velocity in the canopy compared to the sheltered understory (Kruijt et al., 2000).
Rainfall amounts and relative air humidity values differed between the seasons and also between the years as they were considerably higher between October 2014 and February 2015 as compared to the following year. This was most probably due to an El Niño event, which caused air humidity and WC of bryophytes to be substantially lower compared to the previous dry season (Fig. 1, Table 1). Generally, the moisture conditions, including rain, condensation of dew and fog, and RH, differed between seasons, resulting in different WC patterns of bryophytes. A higher frequency of rain during the wet season particularly affected the bryophyte communities at the lower levels (1.5 and 8 m), whereas those in the canopy showed similar water content, during all seasons (Figs. 2, S7a, Table 2).
The data also suggest that the position of the measured communities and the tree foliage played a crucial role for rainwater absorption and the subsequent drying process. Whereas the sensors at 1.5 and 8 m height responded quite reliably to rain events during all seasons, those at 23 m responded quite reliably during the dry but only rarely during the wet seasons. This might be caused by dense foliage during the wet season, shading the communities at 23 m from direct inundation, whereas during the dry season the canopy foliage changes a lot, and intense leave shedding takes place before new leaves develop, which seems to allow rain to also reach the samples directly below the canopy (Lopes et al., 2016). Apart from the effect of growing foliage, one has to keep in mind that there was a reinstallation of the sensors around July 2015, which could cause differences in the sensor readings before and after this event.
During the wet season, the WC of bryophytes in the understory and at 8 m height responded strongly to rain events, and subsequently, the water was lost gradually, with bryophytes staying wet and active over prolonged time spans, indicating that large amounts of water were taken up during prolonged rain events (Figs. 2, S7). In contrast to that, during the dry season the drying of the samples occurred quite rapidly after the rain. Most rain events in the central Amazon occur in the early afternoon (12:00–14:00 LT), and more than 75 % of them are weak events of less than 10 mm (Cuartas et al., 2007), which often cause no complete water saturation of the bryophytes. Consequently, the organisms tend to dry much quicker than after strong rain events. Also here, a potential effect of the sensor reinstallation around July 2015 has to be kept in mind.
In this rain forest environment, epiphytes growing in different parts of the tree and along the stem can benefit from different sources of water. The gross precipitation, as the main water source, can be converted into throughfall, stemflow, water storage, and water vapor (Mendieta-Leiva et al., 2020). Thus, rainwater can influence the bryophytes in various ways depending on its redistribution and the microenvironmental conditions: at the canopy level, direct interception of precipitation can be used for water storage, whereas in the understory stemflow is more pronounced and contributes to the water supply of the bryophytes. It has been estimated that in tropical forests, up to 4 % of the annual rainfall amount could be converted into stemflow (Lloyd and Marques, 1988; Marin et al., 2000; van Stan and Gordon, 2018), corresponding to maximum values of 68 and 75 mm in the years 2015 and 2016, respectively, at the ATTO site.
The water content data at 8 and 23 m height showed diel fluctuations, which were particularly regular during the dry season due to rare interfering rain events (Fig. S5c). They showed a parallel behavior to the RH data, with the highest values reached during the morning hours (Fig. S11). It is well known from the literature that moist bryophytes and many cryptogams could utilize high air humidity as a source of water (Lange et al., 2001; Raggio et al., 2017), and this likely also occurs here.
In addition, also condensation and fog need to be considered as potential additional sources of water for epiphytic covers as well as for near-stem vegetation at the forest floor (Lakatos et al., 2012; van Stan and Gordon, 2018.; León-Vargas et al., 2006). Our data show that the necessary conditions for condensation were regularly met and occurred most frequently during the wet season at 23 m height (Fig. S11). Cases with a negative dew point spread, when condensation could occur, were related to increasing water content of the bryophytes, supporting the calculated condensation data. During the occurrence of fog, an increase in water content could not be directly proven, suggesting that fog does not represent a major water source for the bryophytes.
4.2 Potential physiological activity of bryophytes
The microenvironmental conditions influence the WC of epiphytic bryophyte communities, but the ability to deal with these conditions differs among species (interspecific variability), being determined by morphological and physiological features. Apart from the interspecific variability, the performance of a single species under differing microenvironmental conditions can also be modulated by short-term acclimation and long-term adaptation processes, with the latter being driven by environmental exposure, genetic variation among populations, and plasticity, as, for example, shown for bryophytes and lichens (Cornelissen et al., 2007; Marks et al., 2019; Pardow et al., 2010). These aspects help to understand the occurrence of bryophytes under widely varying microclimatic conditions within the canopy. During our study, we measured the microenvironmental conditions of epiphytic bryophytes and observed bryophyte taxa to vary depending on these. Additionally, we estimated the potential ranges of physiological activity based on the compensation points for light, temperature, and WC, which have been reported from other studies in tropical forests (Lösch et al., 1994; Wagner et al., 2013).
In the canopy it is essential for the cryptogams to be adapted to high-light conditions and UV radiation in order to avoid cell damage by radiation (Green et al., 2005; Pardow and Lakatos, 2013; Sinha and Häder, 2008; Westberg and Kärnefelt, 1998). As high-light conditions mainly occur as short light flecks in the understory, the organisms need to react rapidly and efficiently to changing light conditions to reach overall positive net photosynthesis rates. Furthermore, understory bryophytes and lichens show higher rates of net photosynthesis at low-light conditions as compared to canopy species (Kangas et al., 2014; Lakatos et al., 2006; Wagner et al., 2013). Epiphytic organisms growing under low-light conditions in the understory are also known to have lower LCPl values compared to the ones in the canopy, as documented for epiphytic lichens in French Guiana (Lakatos et al., 2006).
The temperature regulates the overall velocity of metabolic processes. While it has a strong impact on the respiration, the photosynthetic light reaction is by far less affected by it (Elbert et al., 2012; Green and Proctor, 2016; Lange et al., 1998). As the measured net photosynthesis rates are the sum of simultaneously occurring photosynthesis and respiration processes, positive net photosynthesis may still be reached at higher temperatures if the photosynthetic capacity is high enough, whereas during the night, high temperatures could cause a major loss of carbon due to high respiration rates (Lange et al., 2000). In the course of our study, the lowest temperatures predominantly occurred during the night, contributing to lower respiration rates, and values were mostly below the upper TCP. Thus, the temperature did not seem to be a limiting factor for the physiological activity of epiphytic bryophytes in this environment (Fig. S11). Similarly, Wagner and coauthors (Wagner et al., 2013) stated that the temperature likely was not a limiting factor for the overall carbon balance of the bryophytes investigated in a low- and highland rain forest in Panama.
Utilizing the compensation points of water, light, and temperature taken from the literature, one can make rough estimates of the time fractions when NP and DR occur at the different height levels (Table 3).
These data suggest that at the upper height level, NP occurred 1 %–30 % and DR 2 %–52 % of the time during the wet season and 1 %–24 % (NP) and 4 %–45 % (DR) of the time during the dry season, respectively (Table 3). These estimates suggest that the duration of DR was about twice as long as that of NP. For the samples at 8 m height, the results were similar, whereas for those in the understory, the duration of DR was about 5- to 30-fold higher than the duration of NP. The large discrepancy between the time ranges for NP and DR calculated for the bryophytes in the understory gives reason to expect the LCPl and the WCP to be at the lower end of the range (3 µmol m−2 s−1, 30 %) for the bryophytes at the lowest height level and to be at the upper end of the range (12 µmol m−2 s−1, 80 %) for the bryophytes at the two upper height levels. For other habitats, LCPl values as low as 1 µmol m−2 s−1 have been defined for lichens (Green et al., 1991), and thus it could be possible that the bryophyte communities in the understory exhibit similarly low LCPl values.
In the environment being studied, the acclimation of the organisms to the environmental conditions is also crucial for their survival. Thus, the time ranges of metabolic activity are only rough estimates, depending on the actual compensation points, which are influenced by inter- and intraspecific variation. There are also some differences between groups as, for example, lichens tend to perform photosynthesis at lower WC than bryophytes, and chlorolichens (with green algae as photobionts) may utilize high air humidity, whereas cyanolichens (cyanobacteria as photobiont) need liquid water (Green et al., 2011; Lange and Kilian, 1985; Raggio et al., 2017). Furthermore, there are also differences between the bryophyte divisions of mosses and liverworts, and also within one division the interspecific variability can be large.
The microclimatic conditions experienced by bryophytes have been being assessed in long-term measurements at the ATTO site since October 2014. These measurements provide a unique dataset of the micrometeorological conditions within the understory and the inner canopy of tropical rain forests and facilitate a rough estimation of the physiological activity patterns of epiphytic bryophytes along a vertical gradient. Within this tropical rain forest habitat, the WC appears to be the key parameter controlling the overall physiological activity of the organisms, with major differences between organisms of the canopy and the understory. In the understory, the WC of the bryophytes responded reliably to rain events, and after major rain events the samples could stay wet for several days before they dried out again. In contrast to that, the WC of the bryophytes in the canopy responded only rarely to rain events during the wet season, probably caused by the dense foliage, and kept relatively stable low water content values. During the dry season, they responded much more reliably to rain events, which is probably caused by less dense foliage, but also an effect of sensor repositioning cannot be completely excluded. The bryophytes at 8 and 23 m height showed regular daily fluctuations of the WC, which went in parallel to RH and reached the highest values during the morning hours. Thus, our data suggest that the relevant water source for bryophytes in the understory is rain, while for the bryophytes in the canopy, RH fluctuations and dew condensation might be relevant. With the current data at hand, however, it cannot be answered if the daily fluctuations and the dew condensation events are large enough to activate physiological processes; this topic, indeed, would deserve to be investigated in a separate in-depth study. The light intensity during periods of physiological activity mainly determines whether NP dominates or whether carbon is lost by dominating respiration. As the temperature shows only minor spatial, diel, and seasonal variation relative to the physiological tolerance of the bryophytes, it seems to be of minor physiological relevance within the given habitat.
Data on the potential physiological activity of bryophytes and cryptogamic organisms in general are not only relevant for their potential role in carbon cycling but may also provide new insights into their relevance as sources of bioaerosols and different trace gases. Thus, these data may form a baseline for studies investigating the overall relevance of cryptogams in the context of biogeochemical cycling in tropical habitats. However, the wide ranges of potential activity and the scarcity of literature data illustrate the necessity of CO2 gas exchange measurements to assess the actual diel and seasonal physiological activity and productivity of rain forest cryptogams under varying environmental conditions.
All data measured for the epiphytic bryophytes and the visibility used in this study are deposited in a data repository and are available in NASA Ames format at https://doi.org/10.17617/3.51 (Löbs et al., 2020). The meteorological data are accessible via the home page of the ATTO project (https://www.attoproject.org/, last access: 9 November 2020) upon request. For data requests beyond the available data, please contact the corresponding authors.
The supplement related to this article is available online at: https://doi.org/10.5194/bg-17-5399-2020-supplement.
BW, CP, and NL designed the measurement setup. NL, CGGB, SB, RPA, and APPF conducted the practical measurements. NL, DW, GRC, MdOS, ACdA, LRdO, FD, and SMdO compiled the data and conducted the analyses. All authors discussed the results. NL and BW prepared the manuscript with contributions from all coauthors.
The authors declare that they have no conflict of interest.
We would like to acknowledge the German Federal Ministry of Education and Research (BMBF) and the Max Planck Society (MPG) for supporting this project as well as the construction and operation of the ATTO site. We also acknowledge the support of the Brazilian Ministério da Ciência, Tecnologia e Inovação (MCTI/FINEP) as well as Amazonas State University (UEA), FAPEAM, LBA/INPA, and SDS/CEUC/RDS-Uatumã for their support during construction and operation of the ATTO site. Furthermore, we would like to thank Ulrich Pöschl for his support, provision of the scientific infrastructure, and the possibility to work in the labs. We would like to thank Reiner Ditz, Susan Trumbore, Alberto Quesada, Thomas Disper, Andrew Crozier, Hermes Braga Xavier, Feliciano de Souza Coelho, Josué Ferreira de Souza, Roberta Pereira de Souza, Holger Ritter, Henno Heintz, and Henning Braß for technical, logistical, and scientific support within the ATTO project. Nina Löbs would like to thank the Max Planck Graduate Center with the Johannes Gutenberg University Mainz (MPGC) for its support. David Walter, Cybelli G. G. Barbosa, Sebastian Brill, Rodrigo P. Alves, Florian Ditas, Daniel Moran-Zuloaga, Ana Paula Pires Florentino, Stefan Wolff, Jürgen Kesselmeier, Christopher Pöhlker, and Bettina Weber appreciate the support by the Max Planck Society. Gabriela R. Cerqueira would like to thank the Instituto Nacional de Pesquisas da Amazônia (INPA) for the support provided by the Programa de Pós-graduação em Botânica. Marta de Oliveira Sá and Leonardo R. de Oliveira appreciate the support of INPA. Alessandro C. de Araújo would like to thank the Empresa Brasileira de Pesquisa Agropecuária (EMBRAPA). Ricardo H. M. Godoi expresses his thanks to the Federal University of Parana. Sylvia Mota de Oliveira would like to thank Stichting Het Kronendak, and Meinrat O. Andreae appreciates the support of the Max Planck Society and the University of San Diego. We would like to thank the two unknown referees and particularly also Maaike Bader, whose comments helped to considerably improve the manuscript. This paper contains results of research conducted under the Technical/Scientific Cooperation Agreement between the National Institute for Amazonian Research, Amazonas State University, and the Max Planck Society. The opinions expressed are the entire responsibility of the authors and not of the participating institutions.
This research has been supported by the Bundesministerium für Bildung und Forschung (grant nos. 01LB1001A and 01LK1602B); the Brazilian Ministério da Ciência, Tecnologia e Inovação (MCTI/FINEP, grant no. 01.11.01248.00); the Max Planck Graduate Center with the Johannes Gutenberg University Mainz (MPGC); and the Max Planck Society (grant no. M.IF.A.CHEM8095).
The article processing charges for this open-access
publication were covered by the Max Planck Society.
This paper was edited by Michael Bahn and reviewed by Maaike Bader and two anonymous referees.
Andreae, M. O., Acevedo, O. C., Araùjo, A., Artaxo, P., Barbosa, C. G. G., Barbosa, H. M. J., Brito, J., Carbone, S., Chi, X., Cintra, B. B. L., Da Silva, N. F., Dias, N. L., Dias-Júnior, C. Q., Ditas, F., Ditz, R., Godoi, A. F. L., Godoi, R. H. M., Heimann, M., Hoffmann, T., Kesselmeier, J., Könemann, T., Krüger, M. L., Lavric, J. V., Manzi, A. O., Lopes, A. P., Martins, D. L., Mikhailov, E. F., Moran-Zuloaga, D., Nelson, B. W., Nölscher, A. C., Santos Nogueira, D., Piedade, M. T. F., Pöhlker, C., Pöschl, U., Quesada, C. A., Rizzo, L. V., Ro, C. U., Ruckteschler, N., Sá, L. D. A., De Oliveira Sá, M., Sales, C. B., Dos Santos, R. M. N., Saturno, J., Schöngart, J., Sörgel, M., De Souza, C. M., De Souza, R. A. F., Su, H., Targhetta, N., Tóta, J., Trebs, I., Trumbore, S., Van Eijck, A., Walter, D., Wang, Z., Weber, B., Williams, J., Winderlich, J., Wittmann, F., Wolff, S., and Yáñez-Serrano, A. M.: The Amazon Tall Tower Observatory (ATTO): Overview of pilot measurements on ecosystem ecology, meteorology, trace gases, and aerosols, Atmos. Chem. Phys., 15, 10723–10776, https://doi.org/10.5194/acp-15-10723-2015, 2015.
Batista, W. V. S. M. and Santos, N. D. D.: Can regional and local filters explain epiphytic bryophyte distributions in the Atlantic Forest of southeastern Brazil?, Acta Bot. Brasil., 30, 462–472, https://doi.org/10.1590/0102-33062016abb0179, 2016.
Caesar, J., Tamm, A., Ruckteschler, N., Lena Leifke, A., and Weber, B.: Revisiting chlorophyll extraction methods in biological soil crusts – Methodology for determination of chlorophyll a and chlorophyll a Cb as compared to previous methods, Biogeosciences, 15, 1415–1424, https://doi.org/10.5194/bg-15-1415-2018, 2018.
Campos, L. V., ter Steege, H., and Uribe, J.: The epiphytic bryophyte flora of the Colombian Amazon, Caldasia, 37, 47–59, https://doi.org/10.15446/caldasia.v37n1.50980, 2015.
Campos, L. V., Oliveira, S. M. D., Benavides, J. C., Uribe-M, J., and ter Steege, H.: Vertical distribution and diversity of epiphytic bryophytes in the Colombian Amazon, J. Bryol., 41, 328–340, https://doi.org/10.1080/03736687.2019.1641898, 2019.
Chazdon, R. L. and Fetcher, N.: Light Environments of Tropical Forests, in: Physiological ecology of plants of the wet tropics: Proceedings of an International Symposium Held in Oxatepec and Los Tuxtlas, Mexico, 29 June to 6 July 1983, edited by: Medina, E., Mooney, H. A., and Vázquez-Yánes, C., Springer Netherlands, Dordrecht, 27–36, 1984.
Cornelissen, J. T. and ter Steege, H.: Distribution and ecology of epiphytic bryophytes and lichens in dry ever-green forest of Guyana, J. Trop. Ecol., 5, 131–150, https://doi.org/10.1017/S0266467400003400, 1989.
Cornelissen, J. H. C., Lang, S. I., Soudzilovskaia, N. A., and During, H. J.: Comparative cryptogam ecology: A review of bryophyte and lichen traits that drive biogeochemistry, Ann. Bot., 99, 987–1001, https://doi.org/10.1093/aob/mcm030, 2007.
Cowan, I. R., Lange, O. L., and Green, T. G. A.: Carbon-dioxide exchange in lichens: determination of transport and carboxylation characteristics, Planta, 187, 282–294, https://doi.org/10.1007/BF00201952, 1992.
Coxson, D. S., McIntyre, D. D., and Vogel, H. J.: Pulse Release of Sugars and Polyols from Canopy Bryophytes in Tropical Montane Rain Pulse Release of Sugars and Polyols from Canopy Bryophytes in Tropical Montane Rain Forest (Guadeloupe, French West Indies), Biotropica, 24, 121–133, 1992.
Cuartas, L. A., Tomasella, J., Nobre, A. D., Hodnett, M. G., Waterloo, M. J., and Múnera, J. C.: Interception water-partitioning dynamics for a pristine rainforest in Central Amazonia: Marked differences between normal and dry years, Agr. Forest Meteorol., 145, 69–83, https://doi.org/10.1016/J.AGRFORMET.2007.04.008, 2007.
de Ribeiro, A.: Local rainfall variability – a potential bias for bioecological studies in the central Amazon, Acta Amaz., 14, 159–174, 1984.
Dislich, R., Marília, E., Pinheiro, L., and Guimarães, M.: Corticolous liverworts and mosses in a gallery forest in Central Brazil: effects of environmental variables and space on species richness and composition, Nov. Hedwigia, 107, 385–406, 2018.
Elbert, W., Weber, B., Burrows, S., Steinkamp, J., Büdel, B., Andreae, M. O., and Pöschl, U.: Contribution of cryptogamic covers to the global cycles of carbon and nitrogen, Nat. Geosci., 5, 459–462, https://doi.org/10.1038/ngeo1486, 2012.
Gaudio, N., Gendre, X., Saudreau, M., Seigner, V., and Balandier, P.: Impact of tree canopy on thermal and radiative microclimates in a mixed temperate forest: A new statistical method to analyse hourly temporal dynamics, Agr. Forest Meteorol., 237/238, 71–79, https://doi.org/10.1016/J.AGRFORMET.2017.02.010, 2017.
Gimeno, T. E., Ogée, J., Royles, J., Gibon, Y., West, J. B., Burlett, R., Jones, S. P., Sauze, J., Wohl, S., Benard, C., Genty, B., and Wingate, L.: Bryophyte gas-exchange dynamics along varying hydration status reveal a significant carbonyl sulphide (COS) sink in the dark and COS source in the light, New Phytol., 215, 965–976, https://doi.org/10.1111/nph.14584, 2017.
Gimingham, C. H. and Birse, E. M: Ecological studies on growth-form in bryophytes: I. Correlations between growth-form and habitat, J. Ecol., 45, 533–545, https://doi.org/10.2307/2256934, 1957.
Gradstein, R., Churchill, S. P., and Salazar Allen, N.: Guide to bryophytes of tropical America, Mem. N. Y. Bot. Gard., 86, 577 pp., 2001.
Gradstein, S. R. and Salazar Allen, N.: Bryophyte diversity along an altitudinal gradient in Darién National Park, Panama, Trop. Bryol., 5, 61–71, 1992.
Green, T. G. A. and Proctor, M. C. F.: Physiology of Photosynthetic Organisms Within Biological Soil Crusts: Their Adaptation, Flexibility, and Plasticity, in: Biological Soil Crusts: An Organizing Principle in Drylands, edited by: Weber, B., Büdel, B., and Belnap, J., Springer International Publishing, Chamber, 347–381, 2016.
Green, T. G. A., Kilian, E., and Lange, O. L.: Pseudocyphellaria dissimilis: a desiccation-sensitive, highly shade-adapted lichen from New Zealand, Oecologia, 85, 498–503, https://doi.org/10.1007/BF00323761, 1991.
Green, T. G. A., Kulle, D., Pannewitz, S., Sancho, L. G., and Schroeter, B.: UV-A protection in mosses growing in continental Antarctica, Polar Biol., 28, 822–827, https://doi.org/10.1007/s00300-005-0011-7, 2005.
Green, T. G. A., Sancho, L. G., and Pintado, A.: Ecophysiology of Desiccation/Rehydration Cycles in Mosses and Lichens, in: Plant Desiccation Tolerance, edited by: Lüttge, U., Beck, E., and Bartels, D., Springer Berlin Heidelberg, Berlin, Heidelberg, 89–120, 2011.
Hargis, H., Gotsch, S. G., Porada, P., Moore, G. W., Ferguson, B., and Van Stan, J. T.: Arboreal Epiphytes in the Soil-Atmosphere Interface?: How Often Are the Biggest “ Buckets ” in the Canopy Empty?, Geosciences, 9, 1–17, 2019.
Kangas, L., Maanavilja, L., Hájek, T., Juurola, E., Chimner, R. A., Mehtätalo, L., and Tuittila, E. S.: Photosynthetic traits of Sphagnum and feather moss species in undrained, drained and rewetted boreal spruce swamp forests, Ecol. Evol., 4, 381–396, https://doi.org/10.1002/ece3.939, 2014.
Komposch, H. and Hafellner, J.: Diversity and vertical distribution of lichens in a venezuelan tropical lowland rain forest, Selbyana, 21, 11–24, 2000.
Kruijt, B., Malhi, Y., Lloyd, J., Norbre, A. D., Miranda, A. C., Pereira, M. G. P., Culf, A., and Grace, J.: Turbulence Statistics Above And Within Two Amazon Rain Forest Canopies, Bound.-Lay. Meteorol., 94, 297–331, https://doi.org/10.1023/A:1002401829007, 2000.
Lakatos, M., Rascher, U., and Büdel, B.: Functional characteristics of corticolous lichens in the understory of a tropical lowland rain forest, New Phytol., 172, 679–695, https://doi.org/10.1111/j.1469-8137.2006.01871.x, 2006.
Lakatos, M., Obregón, A., Büdel, B., and Bendix, J.: Midday dew – an overlooked factor enhancing photosynthetic activity of corticolous epiphytes in a wet tropical rain forest, New Phytol., 194, 245–253, https://doi.org/10.1111/j.1469-8137.2011.04034.x, 2012.
Lancaster, J., Lancaster, N., and Seely, M.: Climate of the Central Namib Desert, Madoqua, 14, 5–61, 1984.
Lange, O. L.: Moisture content and CO2 exchange of lichens, Oecologica, 45, 82–87, 1980.
Lange, O. L. and Kilian, E.: Reaktivierung der Photosynthese trockener Flechten durch Wasserdampfaufnahme aus dem Luftraum: Artspezifisch unterschiedliches Verhalten, Flora, 176, 7–23, https://doi.org/10.1016/S0367-2530(17)30100-7, 1985.
Lange, O. L. and Tenhunen, J. D.: Moisture Content and CO2 Exchange of Lichens. II. Depression of Net Photosynthesis in Ramalina maciformis at High Water Content is Caused by Increased Thallus Carbon Dioxide Diffusion Resistance, Oecologia, 51, 426–429, 1981.
Lange, O. L., Green, T. G. A., Lange, O. L., and Green, T. G. A.: High thallus water content severely limits photosynthetic carbon gain of central European epilithic lichens under natural conditions, Oecologia, 108, 13–20, 1996.
Lange, O. L., Belnap, J., and Reichenberger, H.: Photosynthesis of the cyanobacterial soil-crust lichen Collema tenax from arid lands in southern Utah, USA: Role of water content on light and temperature responses of CO2 exchange, Funct. Ecol., 12, 195–202, https://doi.org/10.1046/j.1365-2435.1998.00192.x, 1998.
Lange, O. L., Büdel, B., Meyer, A., Zellner, H., and Zotz, G.: Lichen carbon gain under tropical conditions?: water relations and CO2 exchange of three Leptogium species of a lower montane rainforest in Panama, Flora – Morphol. Distrib. Funct. Ecol. Plant., 195, 172–190, https://doi.org/10.1016/S0367-2530(17)30965-9, 2000.
Lange, O. L., Green, T. G. A., and Heber, U.: Hydration-dependent photosynthetic production of lichens: what do laboratory studies tell us about field performance?, J. Experim., 52, 2033–2042, 2001.
Lange, O. L., Allan Green, T. G., Melzer, B., Meyer, A., and Zellner, H.: Water relations and CO2 exchange of the terrestrial lichen Teloschistes capensis in the Namib fog desert: Measurements during two seasons in the field and under controlled conditions, Flora – Morphol. Distrib. Funct. Ecol. Plant., 201, 268–280, https://doi.org/10.1016/J.FLORA.2005.08.003, 2006.
León-Vargas, Y., Engwald, S., and Proctor, M. C. F.: Microclimate, light adaptation and desiccation tolerance of epiphytic bryophytes in two Venezuelan cloud forests, J. Biogeogr., 33, 901–913, https://doi.org/10.1111/j.1365-2699.2006.01468.x, 2006.
Lloyd, C. R. and de Marques, A. de O.: Spatial variability of throughfall and stemflow measurements in Amazonian rainforest, Agr. Forest Meteorol., 42, 63–73, 1988.
Löbs, N., Weber, B., and Pöhlker, C.: Available data for the microclimate of epiphytic bryophytes investigated at ATTO, Max Planck Society, https://doi.org/10.17617/3.51, last access: 6 November 2020.
Lopes, A. P., Nelson, B. W., Wu, J., Graça, P. M. L. de A., Tavares, J. V., Prohaska, N., Martins, G. A., and Saleska, S. R.: Leaf flush drives dry season green-up of the Central Amazon, Remote Sens. Environ., 182, 90–98, https://doi.org/10.1016/j.rse.2016.05.009, 2016.
Lösch, R., Mülders, P., Fischer, E., and Frahm, J. P.: Scientific Results of the BRYOTROP Expedition to Zaire and 3. Photosynthetic gas exchange of bryophytes from different forest types in eastern Central Africa, Trop. Bryol., 9, 169–185, 1994.
Mägdefrau, K.: Life-forms of bryophytes. In Bryophyte ecology, edited by: Smith, A. J. E., Springer Netherlands, Dordrecht, 45–58 , https://doi.org/10.1007/978-94-009-5891-3_2, 1982.
Marin, C. T., Bouten, W., and Sevink, J.: Gross rainfall and its partitioning into throughfall, stemflow and evaporation of intercepted water in four forest ecosystems in western Amazonia, J. Hydrol., 237, 40–57, 2000.
Marks, R. A., Pike, B. D., and Nicholas McLetchie, D.: Water stress tolerance tracks environmental exposure and exhibits a fluctuating sexual dimorphism in a tropical liverwort, Oecologia, 191, 791–802, https://doi.org/10.1007/s00442-019-04538-2, 2019.
Martin, S. T., Andreae, M. O., Artaxo, P., Baumgardner, D., Chen, Q., Goldstein, A. H., Guenther, A., Heald, C. L., Mayol-Bracero, O. L., McMurry, P. H., Pauliquevis, T., Pöschl, U., Prather, K. A., Roberts, G. C., Saleska, S. R., Dias, M. A. S., Spracklen, D. V, Swietlicki, E., and Trebs, I.: Sources and properties of Amazonian aerosol particles, Rev. Geophys., 48, RG2002, https://doi.org/10.1029/2008RG000280, 2010.
McWilliam, A.-L. C., Roberts, J. M., Cabral, O., Leitao, M. V. B. R., de Costa, A., Maitelli, G. T., and Zamparoni, C. A. G. P.: Leaf Area Index and Above-Ground Biomass of terra firme Rain Forest and Adjacent Clearings in Amazonia, Funct. Ecol., 7, 310–317, 1993.
Mendieta-Leiva, G., Porada, P., and Bader, M. Y.: Interactions of Epiphytes with Precipitation Partitioning, in: Precipitation Partitioning by Vegetation: A Global Synthesis, edited by: Van StanII, J. T., Gutmann, E., and Friesen, J., Springer International Publishing, Chamber, 133–146, 2020.
Mota de Oliveira, S., ter Steege, H., Cornelissen, J. H. C., and Gradstein, S. R.: Niche assembly of epiphytic bryophyte communities in the Guianas: A regional approach, J. Biogeogr., 41, 2076–2084, https://doi.org/10.1111/j.1365-2699.2009.02144.x, 2009.
Normann, F., Weigelt, P., Gehrig-Downie, C., Gradstein, S. R., Sipman, H. J. M., Obregon, A., and Bendix, J.: Diversity and vertical distribution of epiphytic macrolichens in lowland rain forest and lowland cloud forest of French Guiana, Ecol. Indic., 10, 1111–1118, https://doi.org/10.1016/J.ECOLIND.2010.03.008, 2010.
Oliveira, S. M. D.: Diversity of epiphytic bryophytes across the Amazon (Doctoral Thesis, University Utrecht), available at: https://dspace.library.uu.nl/handle/1874/42818 (last access: 6 November 2020), 2010.
Oliveira, S. M. D.: The double role of pigmentation and convolute leaves in community assemblage of Amazonian epiphytic Lejeuneaceae, Peer J., 6, e5921, https://doi.org/10.7717/peerj.5921, 2018.
Oliveira, S. M. D. and ter Steege, H.: Bryophyte communities in the Amazon forest are regulated by height on the host tree and site elevation, J. Ecol., 103, 441–450, https://doi.org/10.1111/1365-2745.12359, 2015.
Oliver, M. J., Velten, J., and Mishler, B. D.: Desiccation Tolerance in Bryophytes: A Reflection of the Primitive Strategy for Plant Survival in Dehydrating Habitats?, Integr. Comp. Biol., 45, 788–799, 2005.
Pantoja, A. C. C., Ilkiu-Borges, A. L., Tavares-Martins, A. C. C., and Garcia, E. T.: Bryophytes in fragments of Terra Firme forest on the great curve of the Xingu River, Pará state, Brazil, Braz. J. Biol., 75, 238–249, https://doi.org/10.1590/1519-6984.02814BM, 2015.
Pardow, A. and Lakatos, M.: Desiccation Tolerance and Global Change: Implications for Tropical Bryophytes in Lowland Forests, Biotropica, 45, 27–36, https://doi.org/10.1111/j.1744-7429.2012.00884.x, 2013.
Pardow, A., Hartard, B., and Lakatos, M.: Morphological, photosynthetic and water relations traits underpin the contrasting success of two tropical lichen groups at the interior and edge of forest fragments, AoB Plants, 2010, 1–12, https://doi.org/10.1093/aobpla/plq004, 2010.
Piepenbring, M.: Inventoring the fungi of Panama, Biodivers. Conserv., 16, 73–84, https://doi.org/10.1007/s10531-006-9051-8, 2007.
Pinheiro da Costa, D.: Epiphytic Bryophyte Diversity in Primary and Secondary Lowland Rainforests in Southeastern Brazil, Bryologist, 102, 320–326, 1999.
Pöhlker, M. L., Pöhlker, C., Ditas, F., Klimach, T., De Angelis, I. H., Araújo, A., Brito, J., Carbone, S., Cheng, Y., Chi, X., Ditz, R., Gunthe, S. S., Kesselmeier, J., Könemann, T., Lavrič, J. V., Martin, S. T., Mikhailov, E., Moran-Zuloaga, D., Rose, D., Saturno, J., Su, H., Thalman, R., Walter, D., Wang, J., Wolff, S., Barbosa, H. M. J., Artaxo, P., Andreae, M. O., and Pöschl, U.: Long-term observations of cloud condensation nuclei in the Amazon rain forest – Part 1: Aerosol size distribution, hygroscopicity, and new model parametrizations for CCN prediction, Atmos. Chem. Phys., 16, 15709–15740, https://doi.org/10.5194/acp-16-15709-2016, 2016.
Porada, P., Tamm, A., Raggio, J., Cheng, Y., Kleidon, A., Pöschl, U., and Weber, B.: Global NO and HONO emissions of biological soil crusts estimated by a process-based non-vascular vegetation model, Biogeosciences, 16, 2003–2031, https://doi.org/10.5194/bg-16-2003-2019, 2019.
Proctor, M. C. F.: The physiological basis of bryophyte production, Bot. J. Linn. Soc., 104, 61–77, https://doi.org/10.1111/j.1095-8339.1990.tb02211.x, 1990.
Proctor, M. C. F.: The bryophyte paradox: Tolerance of desiccation, evasion of drought, Plant Ecol., 151, 41–49, https://doi.org/10.1023/A:1026517920852, 2000.
Proctor, M. C. F., Oliver, M. J., Wood, A. J., Alpert, P., Stark, L. R., Cleavitt, N. L., and Mishler, B. D.: Desiccation-tolerance in bryophytes: a review, Bryologist, 110, 595–621, 2007.
Raggio, J., Green, T. G. A., Sancho, L. G., Pintado, A., Colesie, C., Weber, B., and Büdel, B.: Metabolic activity duration of biological soil crusts across Europe can be predicted from common climate data, Geoderma, 306, 10–17, https://doi.org/10.1016/j.geoderma.2017.07.001, 2017.
Rastogi, B., Berkelhammer, M., Wharton, S., Whelan, M. E., Itter, M. S., Leen, J. B., Gupta, M. X., Noone, D., and Still, C. J.: Large Uptake of Atmospheric OCS Observed at a Moist Old Growth Forest: Controls and Implications for Carbon Cycle Applications, J. Geophys. Res.-Biogeo., 123, 3424–3438, https://doi.org/10.1029/2018JG004430, 2018.
Reiter, R., Höftberger, M., G. Allan Green, T., and Türk, R.: Photosynthesis of lichens from lichen-dominated communities in the alpine/nival belt of the Alps – II: Laboratory and field measurements of CO2 exchange and water relations, Flora – Morphol. Distrib. Funct. Ecol. Plants, 203, 34–46, 2008.
Richards, P. W.: Notes on the Bryophyte Communities of Lowland Tropical Rain Forest, with Special Reference to Moraballi Creek, British Guiana, Vegetatio, 5, 319–328, 1954.
Rodriguez-Iturbe, I., D'Odorico, P., Porporato, A., and Ridolfi, L.: On the spatial and temporal links between vegetation, climate, and soil moisture, Water Resour. Res., 35, 3709–3722, https://doi.org/10.1029/1999WR900255, 1999.
Romero, C., Putz, F. E., and Kitajima, K.: Ecophysiology in relation to exposure of pendant epiphytic bryophytes in the canopy of a tropical montane oak forest, Biotropica, 38, 35–41, https://doi.org/10.1111/j.1744-7429.2006.00099.x, 2006.
Seel, W. E., Hendry, G. A. F., and Lee, J. A.: The combined effects of desiccation and irradiance on mosses from xeric and hydric habitats, J. Exp. Bot., 43, 1023–1030, https://doi.org/10.1093/jxb/43.8.1023, 1992.
Sinha, R. P. and Häder, D. P.: UV-protectants in cyanobacteria, Plant Sci., 174, 278–289, https://doi.org/10.1016/j.plantsci.2007.12.004, 2008.
Snelgar, W. P., Green, T. G. A., and Wilkins, A. L.: Carbon dioxide exchange in lichens: resistances to CO2 uptake different thallus water contents, New Phytol., 88, 353–361, 1981.
Soepadmo, E.: Tropical rain forests as carbon sinks, Chemosphere, 27, 1025–1039, https://doi.org/10.1016/0045-6535(93)90066-E, 1993.
Stace, C. A.: Combretaceae, in: The Families and Genera of Vascular Plants. Flowering Plants, Eudicots, Vol. 9, edited by: K. Kubitzki, Springer Berlin Heidelberg, 67–82, 2007.
ter Steege, H., Pitman, N. C. A., Sabatier, D., Baraloto, C., Salomão, R. P., Guevara, J. E., Phillips, O. L., Castilho, C. V., Magnusson, W. E., Molino, J. F., Monteagudo, A., Vargas, P. N., Montero, J. C., Feldpausch, T. R., Coronado, E. N. H., Killeen, T. J., Mostacedo, B., Vasquez, R., Assis, R. L., Terborgh, J., Wittmann, F., Andrade, A., Laurance, W. F., Laurance, S. G. W., Marimon, B. S., Marimon, B. H., Vieira, I. C. G., Amaral, I. L., Brienen, R., Castellanos, H., López, D. C., Duivenvoorden, J. F., Mogollón, H. F., Matos, F. D. D. A., Dávila, N., García-Villacorta, R., Diaz, P. R. S., Costa, F., Emilio, T., Levis, C., Schietti, J., Souza, P., Alonso, A., Dallmeier, F., Montoya, A. J. D., Piedade, M. T. F., Araujo-Murakami, A., Arroyo, L., Gribel, R., Fine, P. V. A., Peres, C. A., Toledo, M., Aymard C., G. A., Baker, T. R., Cerón, C., Engel, J., Henkel, T. W., Maas, P., Petronelli, P., Stropp, J., Zartman, C. E., Daly, D., Neill, D., Silveira, M., Paredes, M. R., Chave, J., Lima Filho, D. D. A., Jørgensen, P. M., Fuentes, A., Schöngart, J., Valverde, F. C., Di Fiore, A., Jimenez, E. M., Mora, M. C. P., Phillips, J. F., Rivas, G., Van Andel, T. R., Von Hildebrand, P., Hoffman, B., Zent, E. L., Malhi, Y., Prieto, A., Rudas, A., Ruschell, A. R., Silva, N., Vos, V., Zent, S., Oliveira, A. A., Schutz, A. C., Gonzales, T., Nascimento, M. T., Ramirez-Angulo, H., Sierra, R., Tirado, M., Medina, M. N. U., Van Der Heijden, G., Vela, C. I. A., Torre, E. V., Vriesendorp, C., Wang, O., Young, K. R., Baider, C., Balslev, H., Ferreira, C., Mesones, I., Torres-Lezama, A., Urrego Giraldo, L. E., Zagt, R., Alexiades, M. N., Hernandez, L., Huamantupa-Chuquimaco, I., Milliken, W., Palacios Cuenca, W., Pauletto, D., Valderrama Sandoval, E., Valenzuela Gamarra, L., Dexter, K. G., Feeley, K., Lopez-Gonzalez, G., and Silman, M. R.: Hyperdominance in the Amazonian tree flora, Science, 342, 1243092–1243092, https://doi.org/10.1126/science.1243092, 2013.
Thompson, O. E. and Pinker, R. T.: Wind and temperature profile characteristics in a tropical evergreen forest in Thailand, Tellus, 27, 562–573, https://doi.org/10.1111/j.2153-3490.1975.tb01711.x, 1975.
Tucker, C. L., McHugh, T. A., Howell, A., Gill, R., Weber, B., Belnap, J., Grote, E., and Reed, S. C.: The concurrent use of novel soil surface microclimate measurements to evaluate CO2 pulses in biocrusted interspaces in a cool desert ecosystem, Biogeochemistry, 135, 239–249, https://doi.org/10.1007/s10533-017-0372-3, 2017.
Valente, E. D. B., Pôrto, K. C., and Bastos, C. J. P.: Habitat heterogeneity and diversity of bryophytes in campos rupestres, Ac. Bot. Brasil., 31, 241–249, https://doi.org/10.1590/0102-33062016abb0450, 2017.
van Stan, J. T. and Gordon, D. A.: Mini-Review: Stemflow as a Resource Limitation to Near-Stem Soils, Pront. Plant Sci., 9, 1–7, https://doi.org/10.3389/fpls.2018.00248, 2018.
von Arx, G., Dobbertin, M., and Rebetez, M.: Spatio-temporal effects of forest canopy on understory microclimate in a long-term experiment in Switzerland, Agr. Forest Meteorol., 166/167, 144–155, https://doi.org/10.1016/J.AGRFORMET.2012.07.018, 2012.
Wagner, S., Zotz, G., Salazar Allen, N., and Bader, M. Y.: Altitudinal changes in temperature responses of net photosynthesis and dark respiration in tropical bryophytes, Ann. Bot., 111, 455–465, https://doi.org/10.1093/aob/mcs267, 2013.
Wagner, S., Bader, M. Y., and Zotz, G.: Physiological Ecology of Tropical Bryophytes, in: Photosynthesis in Bryophytes and Early Land Plants, edited by: Hanson, D. T. and Rice, S. K., Springer Netherlands, Dordrecht, 269–289, 2014.
Walter, H. and Stadelmann, E.: The Physiological Prerequisites for the Transition of Autotrophic Plants from Water to Terrestrial Life, Bioscience, 18, 694–701, 1968.
Weber, B., Berkemeier, T., Ruckteschler, N., Caesar, J., Heintz, H., Ritter, H., and Braß, H.: Development and calibration of a novel sensor to quantify the water content of surface soils and biological soil crusts, Methods Ecol. Evol., 7, 14–22, https://doi.org/10.1111/2041-210X.12459, 2016.
Westberg, M. and Kärnefelt, I.: The Genus Fulgensia A. Massal. – De Not., a Diverse Group in the Teloschistaceae, Lichenol., 30, 515–532, https://doi.org/10.1006/lich.1998.0141, 1998.
Williams, T. G. and Flanagan, L. B.: Effect of changes in water content on photosynthesis, transpiration and discrimination against 13C02 and C180160 in Pleurozium and Sphagnum, Oecologia, 2, 38–46, https://doi.org/10.1007/BF00333212, 1996.
Wilske, B., Holzinger, R., and Kesselmeier, J.: Evidence for ethanolic fermentation in lichens during periods of high thallus water content, Symbiosis, 31, 95–111, 2001.
Zartman, C. E.: Habitat fragmentation impacts on epiphyllous bryophyte communities in central Amazonia, Ecology, 84, 948–954, https://doi.org/10.1890/0012-9658(2003)084[0948:HFIOEB]2.0.CO;2, 2003.
Zotz, G., Büdel, B., Meyer, A., Zellner, H., and Lange, L.: Water relations and CO2 exchange of tropical bryophytes in a lower montane rain forest in Panama, Bot. Acta, 110, 9–17, https://doi.org/10.1111/j.1438-8677.1997.tb00605.x, 1997.