the Creative Commons Attribution 4.0 License.
the Creative Commons Attribution 4.0 License.
 | 27 Nov 2020
Investigating the sensitivity of soil heterotrophic respiration to recent snow cover changes in Alaska using a satellite-based permafrost carbon model
Yonghong Yi
John S. Kimball
Jennifer D. Watts
Susan M. Natali
Donatella Zona
Junjie Liu
Masahito Ueyama
Hideki Kobayashi
Walter Oechel
Charles E. Miller
The contribution of soil heterotrophic respiration to the boreal–Arctic carbon (CO2) cycle and its potential feedback to climate change remains poorly quantified. We developed a remote-sensing-driven permafrost carbon model at intermediate scale (∼1 km) to investigate how environmental factors affect the magnitude and seasonality of soil heterotrophic respiration in Alaska. The permafrost carbon model simulates snow and soil thermal dynamics and accounts for vertical soil carbon transport and decomposition at depths up to 3 m below the surface. Model outputs include soil temperature profiles and carbon fluxes at 1 km resolution spanning the recent satellite era (2001–2017) across Alaska. Comparisons with eddy covariance tower measurements show that the model captures the seasonality of carbon fluxes, with favorable accuracy in simulating net ecosystem CO2 exchange (NEE) for both tundra (R>0.8, root mean square error (RMSE – 0.34 g C m−2 d−1), and boreal forest (R>0.73; RMSE – 0.51 g C m−2 d−1). Benchmark assessments using two regional in situ data sets indicate that the model captures the complex influence of snow insulation on soil temperature and the temperature sensitivity of cold-season soil heterotrophic respiration. Across Alaska, we find that seasonal snow cover imposes strong controls on the contribution from different soil depths to total soil heterotrophic respiration. Earlier snowmelt in spring promotes deeper soil warming and enhances the contribution of deeper soils to total soil heterotrophic respiration during the later growing season, thereby reducing net ecosystem carbon uptake. Early cold-season soil heterotrophic respiration is closely linked to the number of snow-free days after the land surface freezes (, p<0.1), i.e., the delay in snow onset relative to surface freeze onset. Recent trends toward earlier autumn snow onset in northern Alaska promote a longer zero-curtain period and enhanced cold-season respiration. In contrast, southwestern Alaska shows a strong reduction in the number of snow-free days after land surface freeze onset, leading to earlier soil freezing and a large reduction in cold-season soil heterotrophic respiration. Our results also show nonnegligible influences of subgrid variability in surface conditions on the model-simulated CO2 seasonal cycle, especially during the early cold season at 10 km scale. Our results demonstrate the critical role of snow cover affecting the seasonality of soil temperature and respiration and highlight the challenges of incorporating these complex processes into future projections of the boreal–Arctic carbon cycle.
- Article
(12136 KB) - Full-text XML
-
Supplement
(1277 KB) - BibTeX
- EndNote


Warming in the northern high latitudes (>50∘ N) is occurring at roughly twice the global rate and has trigged a series of changes in boreal and Arctic ecosystems, including earlier and longer growing seasons, widespread soil thawing, and permafrost degradation (Jeganathan et al., 2014; Liljedahl et al., 2016), with large impacts on the regional carbon cycle (McGuire et al., 2016). Atmospheric CO2 observations indicate a strong increase in the seasonal amplitude of the northern carbon cycle, which may reflect an enhancement of net carbon uptake during the growing season or soil carbon emissions during the cold season in northern ecosystems (Graven et al., 2013). However, there is a lack of consensus on whether increased vegetation productivity or enhanced respiration drives such changes, due to sparse in situ measurements and uncertainties in satellite remote sensing retrievals and model simulations (Fisher et al., 2014; Forkel et al., 2016; Parazoo et al., 2016; Wenzel et al., 2016). For example, there is a large discrepancy in the contribution of cold-season respiration to the annual carbon budget in boreal–Arctic ecosystems (Zona et al., 2016; Euskirchen et al., 2017; Natali et al., 2019a). In addition, potential release of a large amount of carbon currently sequestered in perennially frozen soils in the northern high latitudes adds additional uncertainty in assessing the response of boreal–Arctic ecosystems to future climate change (Schuur et al., 2015).
Pronounced changes have occurred in the northern high latitudes, especially during the shoulder seasons. Satellite remote sensing data sets over the past several decades indicate reductions of 0.8–1.3 d decade−1 in the duration of the annual frozen period in the northern high latitudes (Kim et al., 2015) and ∼ 3–4 d decade−1 in the snow cover duration across the Northern Hemisphere, mostly due to spring snow cover reduction (Hori et al., 2017; Bormann et al., 2018). Strong warming in both spring and fall has significantly reduced snow cover during the shoulder seasons; however, there is large spatial variability across the region, partly due to more variable snow cover conditions during fall and winter (Brown and Derksen, 2013; Hori et al., 2017). Climate models project continued strong warming during the spring and fall in the Arctic and increases in previously rare winter rain events (Bintanja and Andry, 2017). How the boreal–Arctic carbon cycle responds to such changes remains to be understood.
Previous studies reported that the combination of warming and a longer snow-free season has led to widespread greening and enhanced vegetation productivity in the northern latitudes, especially during the early growing season (Aurela et al., 2004; Humphreys and Lafleur, 2011; Buermann et al., 2013; Pulliainen et al., 2017). However, a detailed understanding of how soil respiration and other belowground processes respond to climate variability, especially during the cold season, remains elusive. Soil respiration is mainly the product of respiration by roots (autotrophic) and soil decomposers (heterotrophic), while it is generally difficult to partition soil respiration into the heterotrophic and autotrophic components (Phillips et al., 2017). In this study, we focus on the heterotrophic component of soil respiration and assume it is the dominant component of total soil respiration in northern ecosystems during the cold season due to root dormancy (Tucker et al., 2014; Hicks Pries et al., 2015). Surface warming and a longer snow-free season are associated with earlier soil thawing and deeper active layer thickness (ALT) in permafrost regions, which can result in enhanced soil respiration and reduced annual net carbon uptake (Lund et al., 2012; Yi et al., 2018). Moreover, ALT deepening in permafrost regions will likely lead to a longer zero-curtain period (i.e., soil temperature persists around 0 ∘C), especially in the deeper active layer, which may even form talik and further accelerate permafrost thawing (Connon et al., 2018; Yi et al., 2019). These changes may promote even more soil carbon losses, particularly during the cold season, reinforcing a positive permafrost–carbon feedback (Parazoo et al., 2018). On the other hand, the timing and magnitude of autumn snowfall determine the onset and rate of soil freeze-up, which affects soil microbial activity and soil respiration during fall and early winter (Zona et al., 2016; Arndt et al., 2019). A better understanding of how snow cover trends are affecting soil respiration is needed to inform projections of the potential response of the boreal–Arctic carbon cycle to climate change.
Landscape-level processes can affect the amount and age of soil carbon released to the atmosphere (Hobbie et al., 2000). An important feature of boreal–Arctic landscapes is strong surface heterogeneity, driven by relatively fine-scale microtopographic variability of the order of 0.1–10 m (Zona et al., 2011; Kumar et al., 2016; Grant et al., 2017a, b), which can influence coarser landscape-level behavior. However, current large-scale models generally operate at scales of 10–100 km and are too coarse to resolve finer-scale surface heterogeneity and its influence on active layer dynamics and soil carbon decomposition (Yi et al., 2015; Tao et al., 2019). Satellite or airborne remote sensing can provide information on land surface heterogeneity across large extents and may provide critical constraints on model predictions of regional active layer changes, soil carbon, and permafrost vulnerability. Therefore, the objective of this study was to develop a process-based permafrost carbon model mainly driven by satellite remote sensing data. The model was designed at an intermediate scale (∼1 km) that is efficient for regional runs but also able to bridge the gap between very fine-scale (∼ tens of meters) ground measurements and large-scale (∼ tens of kilometers) Earth system simulations. The model simulations were conducted over a multiyear period (2001–2017) across Alaska to study how soil carbon emissions and the seasonal carbon cycle are responding to recent climate and snow cover trends.
2.1 Model description
The remote-sensing-driven permafrost model (RS-PM), developed by Yi et al. (2018, 2019), was coupled with a terrestrial carbon flux (TCF) model (Yi et al., 2015) to investigate the climate sensitivity of carbon fluxes across Alaska (Fig. 1), with a particular focus on the shoulder season. The soil decomposition model in the original TCF model was revised in this study to account for vertical soil carbon transport in order to better simulate the depth-dependent soil carbon distribution and respiration fluxes. The RS-PM model simulates soil temperature and changes in soil liquid water content due to soil freeze–thaw transitions along the soil profile, using remote-sensing-based land surface temperature (LST), snow cover information, and total soil moisture content as key model forcing. The RS-PM outputs were then used as inputs to the carbon model and as constraints on both the vegetation productivity and soil respiration. A brief description of the modeling framework is described here, with a focus on the revised soil decomposition model, while a detailed description on the RS-PM model is provided in the Supplement.

Figure 1Flow diagram describing the modeling procedure and main input data sets used in this study. The terrestrial carbon flux model has two components, including the light use efficiency algorithm for vegetation productivity estimates and a soil decomposition model for soil heterotrophic respiration estimates. The main equations used for each modeling component are referenced in the appropriate modeling box.
The RS-PM follows the prototype of a detailed permafrost hydrology model (Rawlins et al., 2013; Yi et al., 2015) but has a flexible structure designed to use satellite remote sensing data as the key model drivers and for model parameterization. The RS-PM uses a numerical approach for simulating soil freeze/thaw (F/T) and temperature profiles down to 60 m below the surface, using 23 soil layers with increasing layer thickness at depth. The model also accounts for the effects of seasonal snow cover evolution, organic soil, and soil water phase change on soil F/T processes. Satellite-based LST and snow cover time series data were used as model drivers. Soil thermal properties were parameterized using soil moisture data from the Soil Moisture Active Passive (SMAP) Level 4 (L4) data assimilation system (Reichle et al., 2017). RS-PM validation using in situ measurements shows favorable model accuracy for ALT (mean R=0.60; bias – 1.58 cm, root mean square error (RMSE – 20.32 cm) and zero-curtain period (mean R=0.60; RMSE – 19 d) simulations, especially over the Alaskan North Slope (Yi et al., 2018, 2019).
We coupled the RS-PM and TCF models to represent the influence of permafrost active layer processes on net ecosystem CO2 exchange (NEE) and its component carbon fluxes. The TCF model uses a light use efficiency (LUE) algorithm driven by the satellite fraction of the vegetation canopy absorbed photosynthetically active radiation (FPAR) observations to calculate vegetation productivity and litterfall inputs to a soil decomposition model as follows:
where GPP is the gross primary productivity (g C m−2 d−1), ε (g C MJ−1) is the LUE coefficient converting canopy absorbed photosynthetically active solar radiation (APAR; MJ m−2 d−1) to biomass. The biome-specific maximum LUE coefficient (εmax) was reduced for suboptimal temperature and moisture conditions represented by the scalars Tmn_scalar and SMmn_scalar to estimate ε. Moderate Resolution Imaging Spectroradiometer (MODIS) nighttime LST and SMAP L4 root zone (0–1 m depth) soil moisture records were used to estimate these rate scalars using a simple linear ramp functions (Yi et al., 2015). Vegetation net primary productivity (NPP) was estimated as a fixed portion of GPP for each biome type based on an assumption of conservatism in vegetation carbon use efficiency within similar plant functional types. Annual litterfall was assumed to be equal to annual NPP, without accounting for the impact of disturbance events.
Our soil decomposition model uses multiple litter and soil organic carbon (SOC) pools to characterize the progressive decomposition of fresh litter to more recalcitrant materials, which include three litterfall pools and three SOC pools, with relatively fast turnover rates, and a deep SOC pool, with slow turnover rates (Thornton et al., 2002). The litterfall carbon inputs were first allocated to the three litterfall pools and then transferred to the SOC pools through progressive decomposition. In a previous study (Yi et al., 2015), the litterfall and SOC pools were arbitrarily distributed at different soil depths within the top 3 m of soils to account for depth-dependent differences in litterfall and soil organic matter substrate quality. However, in this study we model the profile of the carbon pools by introducing a vertical dimension (z) and accounting for the vertical carbon transport across the z dimension (Elzein and Balesdent, 1995; Koven et al., 2013a) as follows:
where Ri (g C m−3 d−1) is the carbon input from litterfall allocated to pool i through the profile, and Tji is the fraction of carbon directed from pool j to pool i with fraction rj lost as respiration. ki(kj) is the decomposition rate (d−1) of carbon pool i(j), which was derived as the product of a theoretical maximum rate constant and dimensionless multipliers for soil temperature and liquid water content constraints to decomposition, simulated by the RS-PM model. The diffusivity D was used to account for vertical diffusive soil C transport, while vertical C transport due to advection was ignored here. Constant D values were assigned to permafrost (5.0 cm2 yr−1) and nonpermafrost (2.0 cm2 yr−1) regions within the top 1 m of the soil and then linearly decreased to zero at 3 m below the surface (Koven et al., 2013a). The boundary conditions at the soil surface were defined as follows:
where Rs,i is the carbon input rate (g C m−3 d−1) to the three surface litterfall pools. A zero flux was assigned at the bottom of the soil carbon pool, which was set to 3 m depth.
2.2 Model inputs and parameterization
The main RS-PM inputs include LST, snow cover properties, and soil moisture from global satellite and reanalysis data products. LST and soil moisture records from the MODIS 8 d composite data set (MOD11A2; Wan and Hulley, 2015) and SMAP L4 9 km daily surface (5 cm depth) and root zone (0–1 m depth) products (L4SM, Reichle et al., 2017) were used to define the model boundary conditions and parameterize soil thermal properties (Yi et al., 2018). MODIS 500 m snow cover extent (SCE) data (MOD10A2; Hall and Riggs, 2016) were used to downscale snow depth and density data from the Modern-Era Retrospective Analysis for Research and Applications version 2 (MERRA-2) (∼0.5∘) global reanalysis (Gelaro et al., 2017) to characterize subgrid variability in snow distribution, as described in Yi et al. (2019). The RS-PM model outputs include soil temperature and liquid water fraction within the soil profile, which are the major inputs to the soil decomposition model. Other primary inputs to the TCF model include MODIS normalized difference vegetation index (NDVI), nighttime LST, and MERRA-2 downward solar radiation data. The NDVI data were used to estimate FPAR using a biome-specific empirical relationship (Yi et al., 2015). The nighttime LST and SMAP L4 root zone soil moisture were used to estimate the environmental constraints on LUE and GPP. All model input data sets were reprojected into a 1 km resolution Albers projection and resampled to an 8 d time step consistent with the model simulations.
Other ancillary data sets included the 30 m National Land Cover Database (NLCD) 2011 (Jin et al., 2013), 50 m SOC estimates for Alaska (to 1 m depth; Mishra et al., 2017), and the global 9 km mineral soil texture data developed for the SMAP L4SM algorithm (De Lannoy et al., 2014). The dominant NLCD land cover type within each 1 km pixel was used to define the modeling domain, with open water and perennial ice and snow areas excluded (Fig. 2). The SOC inventory data were used to define the organic fraction of the top 10 model soil layers (∼1.05 m depth), which was used to adjust the soil properties of each soil layer based on the weighted mineral and organic soil components. More details on the data processing and soil parameterization can be found in Yi et al. (2018, 2019).
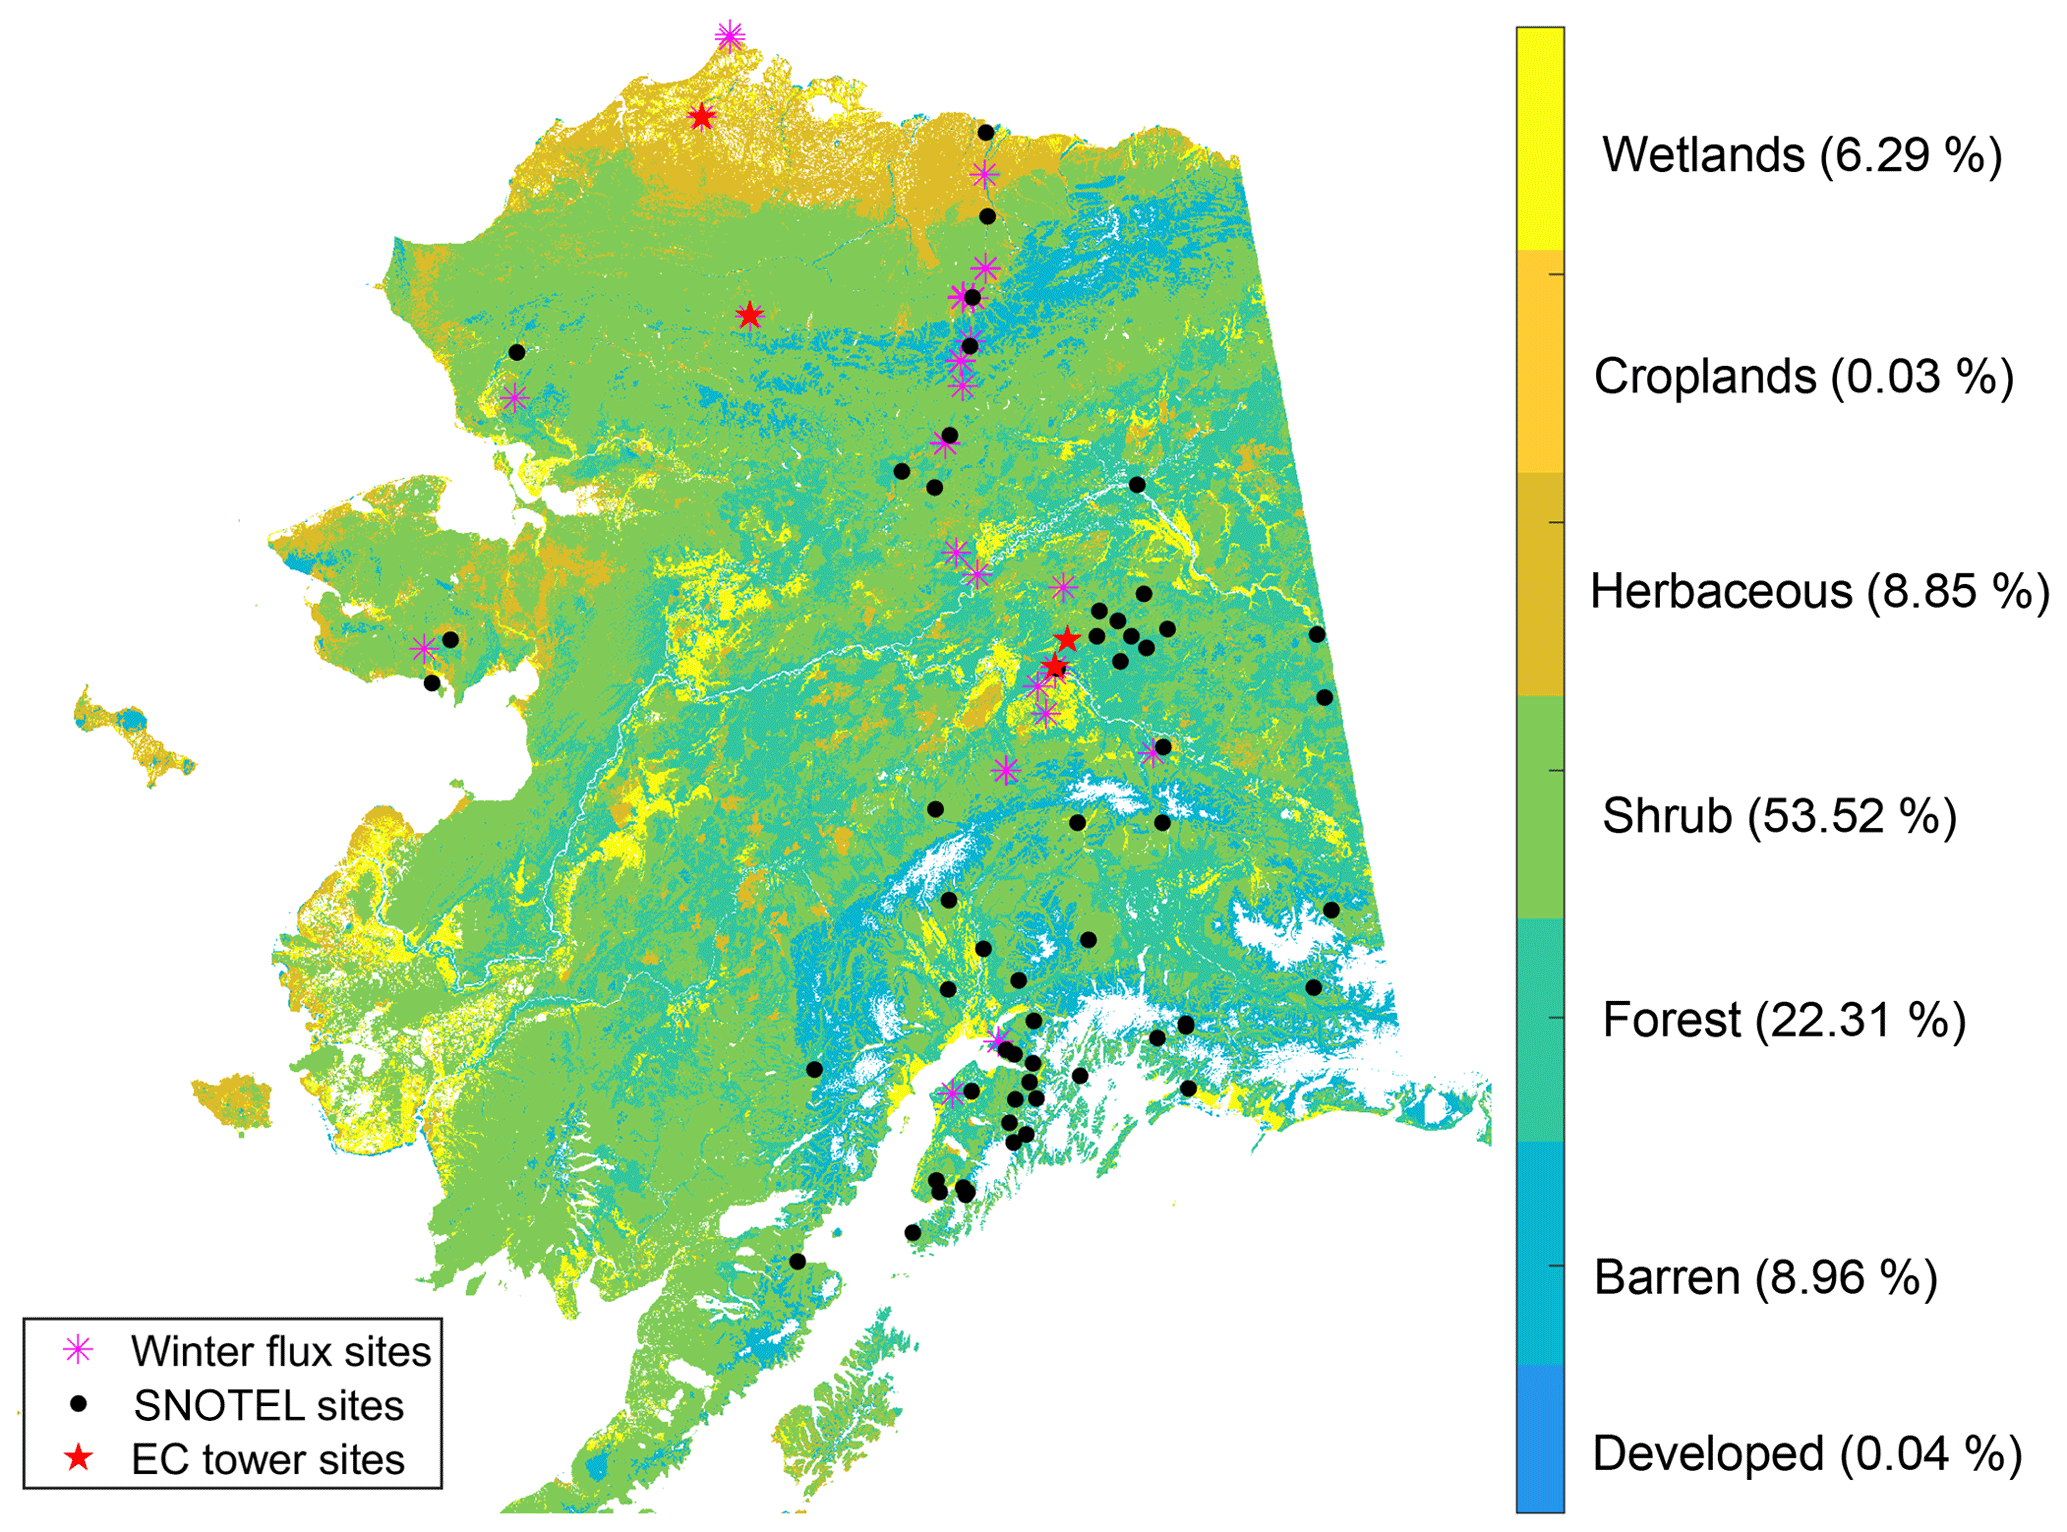
Figure 2The Alaskan land cover map and the location of in situ sites used for model validation. The land cover types are aggregated from the 30 m NLCD map (Jin et al., 2013), while the following land cover classes were used in the model simulations: developed and barren land, forest, scrub/shrub, grassland/herbaceous, croplands, and wetlands. The percentage of each land cover type is provided alongside the color bar legend labels.
A dynamic litterfall allocation scheme, based on the satellite NDVI time series, was used in Yi et al. (2015) to account for litterfall seasonality. We revised this scheme for the present study to incorporate a vertical distribution of root turnover, which is required by the soil decomposition model. The total litterfall was partitioned into aboveground (leaves and woody components) and belowground (mostly fine roots) litterfall using prescribed ratios for each biome type (Table S1 in the Supplement). A constant turnover rate for each 8 d composite period was assigned to the woody components of litterfall. The turnover rates of the other components of litterfall, i.e., leaves and fine roots, were calculated based on the annual time series of MODIS NDVI, with more litterfall generally allocated during the latter half of the year. The belowground litterfall was distributed through the rooting depth based on a vertical root distribution profile (Jackson et al., 1996). The maximum root depth in permafrost areas was limited to the maximum thaw depth. Then, the total litterfall at each depth was first allocated to the three litterfall pools according to the substrate quality of each litterfall component, i.e., labile, cellulose, and lignin fractions, and then transferred to the SOC pools through progressive decomposition. Table S1 provides the main parameters of the TCF model for each biome type, which were largely consistent with the prior study (Yi et al., 2015).
2.3 In situ data and model validation
We used four Alaska eddy covariance (EC) tower sites with multilayer soil temperature or moisture measurements to evaluate the simulated carbon fluxes and temperature sensitivity of ecosystem respiration. Table 1 lists the relevant site characteristics. The Atqasuk site (US-Atq) is about 100 km south of Utqiaġvik on the Alaskan North Slope and consists of a mixture of tussock tundra and shrubs with some sedges and sandy soils (Davidson et al., 2016; Arndt et al., 2019). The Ivotuk site (US-Ivo) is about 300 km south of Utqiaġvik in the northern foothills of the Brooks Range and is characterized as a mixed tussock tundra/moss composition on a gentle slope (Arndt et al., 2019). Soil temperature measurements were available at 5, 15, and 30 cm at US-Atq and 5, 15, 30, and 40 cm at US-Ivo, with full annual cycles recorded in 2014 and 2015. The two boreal forests sites (US-Prr and US-Uaf) are located near Fairbanks, Alaska, and dominated by mature black spruce forest (Ueyama et al., 2014; Ikawa et al., 2015). The leaf area index is ∼ 0.73 at US-Prr and 1.9 at US-Uaf, respectively. Understory vegetation is dominated by peat moss and feather moss. The US-Uaf is located in ice-rich permafrost, and the soil is silt-loam overlain by a 25–45 cm organic layer. Measurement records longer than 7 years were available at both forest sites; however, soil temperature measurements at the two sites show some drift throughout the period, while soil moisture measurements are more consistent. Therefore, for the boreal sites, we used the relationship between ecosystem response and the zero-curtain period calculated from the soil moisture measurements to evaluate the temperature response of cold-season respiration. The zero-curtain period was defined as the difference between surface freeze-up and the soil freeze-up dates, where soil freeze-up was defined as the date on which the soil liquid water content dropped below 15 %–20 % of the annual amplitude after surface freeze-up (Yi et al., 2019).
Table 1Characteristics of the eddy covariance tower sites used for model validation. Note: Tsoil – soil temperature; SM – soil moisture.
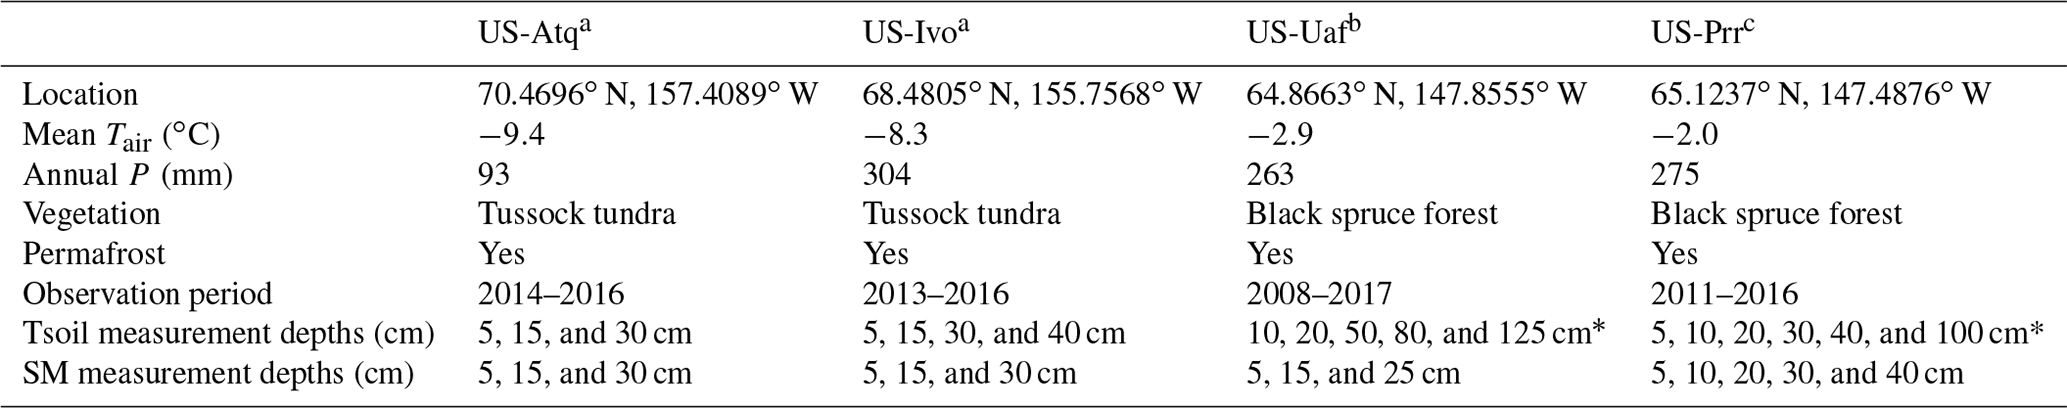
* Data were not consistent throughout the observational period. Site references: a Davidson et al. (2016) and Arndt et al. (2019), b Ueyama et al. (2014), and c Ikawa et al. (2015).
We used two regional data sets to evaluate the model performance during the cold season. Daily snow depth and soil temperature measurements at SNOwpack TELemetry (SNOTEL) sites across Alaska (http://www.wcc.nrcs.usda.gov, last access: 3 January 2020) were used to evaluate the model's skill in representing snow insulation effects during the cold season, using a snow and heat transfer metric (SHTM) defined in Slater et al. (2017), which was based on the deviation of a model-simulated snow insulation curve from observations. The snow insulation curve can be characterized as an exponential relationship of attenuated soil temperature amplitude with increasing snow depth in which snow insulation influence diminishes beyond a certain depth as follows:
where Anorm is the normalized temperature amplitude difference between air temperature and soil temperature, ranging from 0 to 1. The effective snow depth Sdepth,eff describes the snow insulation impact and is the integrated monthly snow depth from October to March weighted by its duration. P and Q are empirical parameters, and R is the effective damping soil depth, which can be determined using a data-fitting method. We chose to evaluate the modeled snow insulation effects using the SHTM metric, rather than directly comparing the modeled and observed soil temperatures. This approach minimizes the influence of potentially large differences between the relatively coarse (∼1 km resolution) model input data and the local site observations, particularly for SNOTEL sites located in mountainous terrain.
We used the Natali et al. (2019b) in situ winter soil CO2 flux data set to evaluate our simulated temperature sensitivity of cold-season respiration. The CO2 flux measurements were collected from previous studies using a variety of methods (e.g., chamber and EC tower), and reported as the daily average over the monthly or seasonal interval when monthly data were not available. This data set represents CO2 emissions from belowground ecosystems, including respiration contributions from both autotrophic (from roots) and heterotrophic components. In this study, we compared the model-simulated soil heterotrophic respiration directly with the measured soil CO2 flux since the model assumes the autotrophic respiration (as a portion of GPP) is very low throughout the cold season, especially for tundra (Tucker et al., 2014; Hicks Pries et al., 2015). Soil temperature measurements were also provided in the data set at varying depths. Soil temperature data at 10 cm depth were collected if available; otherwise, surface soil temperature reported in the studies were collected. The data set contains 366 data records at tundra sites and 174 data records at boreal forest sites across Alaska from October to April during the study period (2001–2017). However, most of the data records were collected from the same sites, with 17 tundra sites and 16 boreal forest sites in total (Fig. 2). For the tundra sites, modeled ecosystem respiration and NEE from October to April are quite similar due to negligible GPP. For the boreal sites, simulated NEE can be very small or even negative (net sink) when soil temperatures approach 0 ∘C. We chose simulated ecosystem respiration and soil temperature values at the center of layer 3 (∼8 cm) as a representative depth and aggregated these model outputs to monthly or seasonal averages for comparison with the observation data set.
For all of the site comparisons, the model was run using the 1 km spatial input data sets described in Sect. 2.2, and the model outputs from the 1 km grid cell encompassing each validation site were extracted. For the winter flux comparison, 1 km grid cells with biome types inconsistent with the local in situ sites were removed prior to the comparison.
2.4 Model analysis
The permafrost carbon model was run at 1 km resolution and 8 d time step from 2001 to 2017. The model domain encompassed the majority of the Alaska land area ( km2). The model was initialized using a two-step spin-up process prior to the transient simulations. The model was first spun up using satellite-based LST, snow depth, and soil moisture data for 50 years to bring soil temperatures in the top ∼3 m into dynamic equilibrium. The model was then run using the same meteorology inputs, simulated soil temperature, and liquid water content fields over several thousands of years to bring the soil carbon pools (0–3 m) into equilibrium. Due to an incomplete MODIS record in the year 2000, the year 2001 was used for the spin-up period. The permafrost mode simulation is sensitive to the choice of spin-up year. However, our analysis focused on the interannual variability in the model simulations and the associated model sensitivity to environmental factors, which were less affected by the choice of spin-up year. In order to examine the impact of model resolution on the simulated ecosystem carbon fluxes, another set of model simulation was conducted at 10 km resolution, and the statistical distribution of the model-simulated carbon fluxes was compared between the two simulations. For the 10 km runs, all model input meteorology data sets were aggregated to the coarser resolution, and the dominant land cover type within each 10 km grid cell was used.
Correlation analysis was used to examine the sensitivity of soil freeze-up and carbon fluxes to snow cover changes and other environmental variables across Alaska. We first calculated the onset of land surface freeze based on the MODIS LST data, which was defined as the center date of the 8 d period at which the mean LST during three consecutive 8 d periods dropped below 0 ∘C. Soil-freezing onset for each soil layer was then determined when the simulated soil temperature dropped below −0.35 ∘C and after land surface freezing; this temperature threshold corresponds to ∼ 15 %–20 % liquid water content in the model simulations at an Arctic Alaskan site (Yi et al., 2019). The soil-freezing delay at each layer was defined as the duration between land surface freeze onset and freeze onset of the given soil layer. In permafrost areas, this was also the duration of the zero-curtain period. Unfrozen conditions in the deep active layer may persist well into the cold season and even into January, causing a temporal lag in soil-freezing onset at these depths that may extend into the following calendar year. Since the model was only run from 2001 to 2017, the soil-freezing onset delay in the year 2017 was not calculated. The number of snow-free days after the land surface temperature drops below 0 ∘C will affect how fast and deep the soil freezes (Bjerke et al., 2015). Therefore, we calculated the number of snow-free days after the land surface freeze onset (defined as the difference between the snow onset and land surface freeze onset) and analyzed its correlation with the above soil-freezing indices. The timing of the snow onset after the summer snow-free period was defined as the center date of the 8 d composite period when both the snow depth for this period and the mean snow depth within the 24 d moving window was greater than 5 cm.
Finally, we used the gradient boosting regression (GBR) method to quantify the contribution of selected environmental variables to the annual carbon fluxes. The GBR method consists of a sequence of models, and each consecutive model is developed based on the errors of previously added models (Friedman et al., 2000). The above model-simulated annual carbon fluxes from 2002 to 2017 were used to train and evaluate the GBR models. We chose the following nine contributing environmental factors or predictors of annual carbon fluxes during the model fitting, including summer (June–August) NDVI, annual freezing and thawing index, mean annual downward solar radiation, root zone soil moisture during the thaw season, snow offset and onset, mean snow depth averaged from January to March (representing annual maximum snow depth), and snow depth during the early snow season (from October to November). The GBR method was implemented using the sklearn package in Python 2.7. The following method was used to determine the relative importance of each predictor to the model predictive performance. We first ran the model using all nine predictors, and the model results were referred to as the baseline simulation (GBRbaseline). We then ran the fitted model successively with one randomized variable and the other variables intact, with the model outputs denoted as GBRone_variable_randomized. The reduction in the Pearson's correlation coefficient between the two model runs was used to quantify the relative importance of each variable, computed as follows (Karjalainen et al., 2019; Zheng et al., 2020):
where Ix represents the reduction in the correlation coefficient of the model runs with the variable x randomized, and RIx is the relative importance value of variable x.
3.1 Model validation
Previous studies have evaluated the performance of the RS-PM model in reproducing regional ALT patterns over the Alaskan domain (Yi et al., 2018) and the zero-curtain period in Arctic Alaska (Yi et al., 2019). Here we focus on assessing the model's capability of representing snow insulation effects and ecosystem carbon fluxes, particularly during the cold season.
3.1.1 Model representation of snow insulation effects
The relationship between the normalized temperature amplitude difference between surface air and 20 cm depth soil conditions (Anorm), and the effective mean snow depth (Sdepth,eff) derived from the SNOTEL observations and model simulations is shown in Fig. 3. Both the model simulations and in situ data indicate an increase in the snow insulation effect with increasing snow depth until Sdepth,eff reaches approximately 0.3 m; this relationship is also significantly (p<0.1) correlated with the fitted curve derived from Slater et al. (2017; observations – R=0.56; model – R=0.48). Using an interval of 0.01 m for Sdepth,eff below 0.3 m, the RS-PM model's snow and heat metric was 0.85, indicating good performance. Similar performance was found using 5 cm depth soil temperatures. However, relatively few data points were available with Sdepth,eff lower than 0.2 m; the biases toward deeper Sdepth,eff conditions were attributed to the model snow depth inputs. MERRA-2 generally shows earlier snow accumulation compared with the MODIS SCE data, which leads to model overestimation of Sdepth,eff (Fig. S1 in the Supplement). During the downscaling process, the snow depth during the early period was reassigned as zero when the MODIS SCE record indicated no snow conditions, which may also contribute to a higher value of Sdepth,eff.
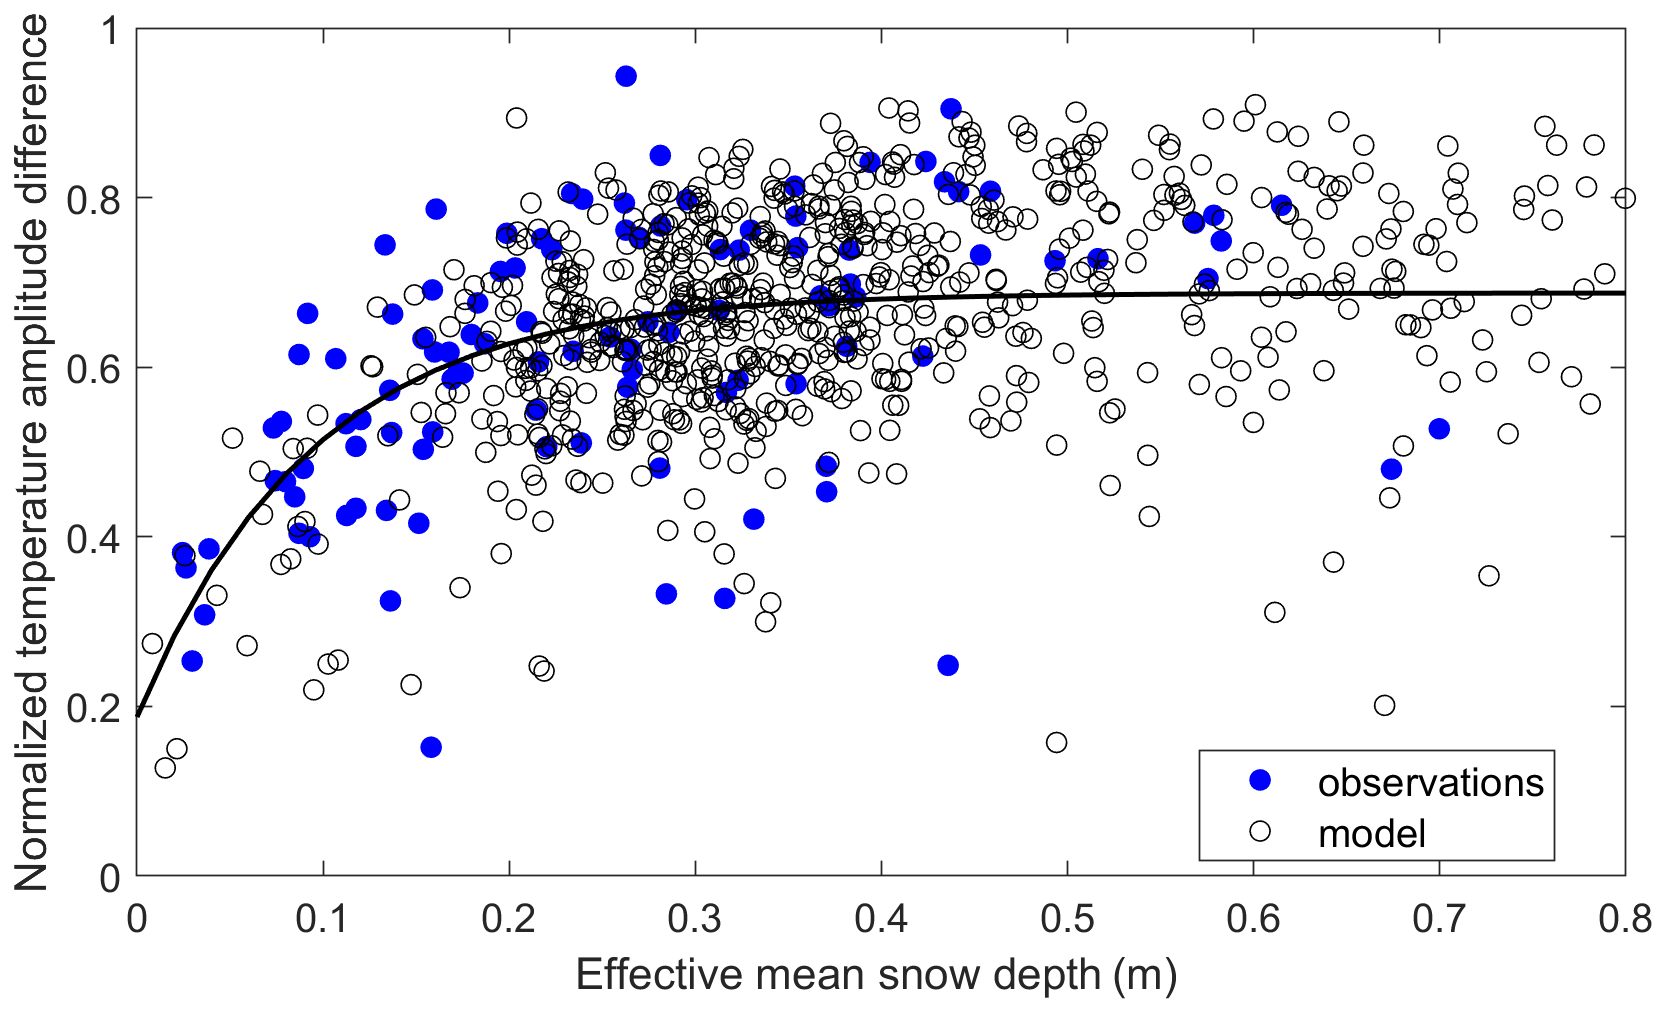
Figure 3Comparison of the snow insulation curve derived from in situ measurements and model simulations at the Alaskan SNOTEL sites. The dark line is drawn using the following parameters presented in Slate et al. (2017): . Observations have fewer data points due to data gaps in the observed snow depth and soil temperatures at the SNOTEL sites.
3.1.2 Model-simulated carbon fluxes and temperature sensitivity
The model simulations showed overall favorable agreement with tower-based 8 d composite carbon fluxes at the two tundra sites (Fig. 4), including strong correlation (R>0.8, p<0.1), minimal mean bias (0.065 g C m−2 d−1 for US-Ivo and −0.015 g C m−2 d−1 for US-Atq), and low RMSE (0.39 g C m−2 d−1 for US-Atq and 0.29 g C m−2 d−1 for US-Ivo) differences. However, the model showed an apparent overestimation of GPP at the US-Ivo site (bias – 0.18 gC m−2 d−1; RMSE – 0.71 g C m−2 d−1). Here the aggregated land cover map indicated shrub/scrub vegetation at this site, while in situ surveys show a mixture of tussock sedge, dwarf shrub, and moss communities (Davidson et al., 2016). Alternative model simulations for the site using the less productive tundra land cover type markedly reduced the resulting model GPP discrepancy (bias – −0.01 g C m−2 d−1; RMSE – 0.42 g C m−2 d−1). The model-simulated GPP at US-Atq showed no apparent bias compared with the tower measurements (bias – −0.04 g C m−2 d−1, RMSE – 0.34 g C m−2 d−1).
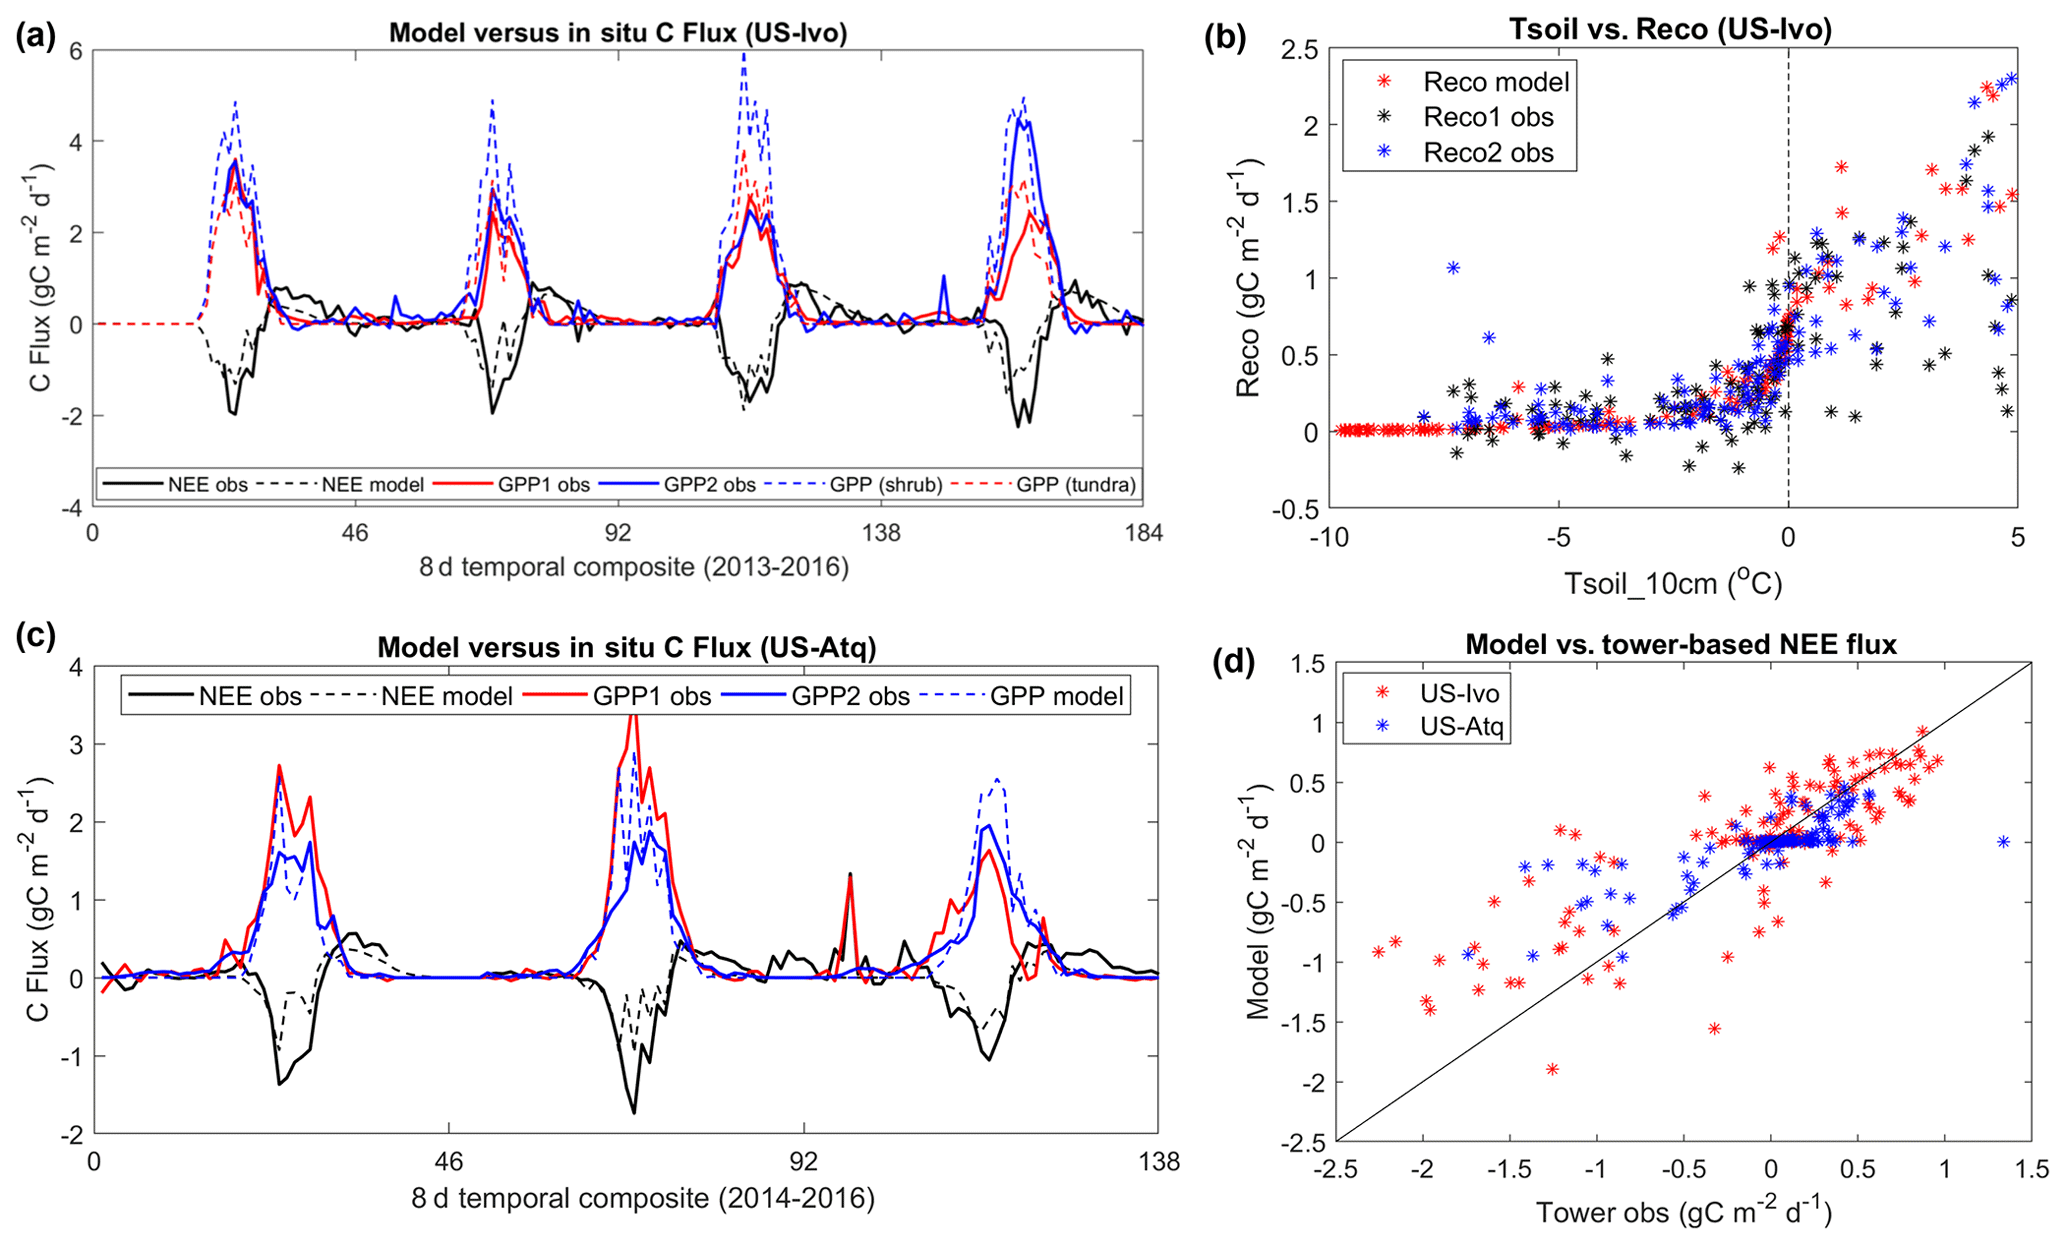
Figure 4Model-simulated carbon fluxes and temperature sensitivity of ecosystem respiration at two tundra sites (US-Ivo and US-Atq). “GPP1 obs” and “GPP2 obs” represent the gross primary productivity (GPP) estimates derived using tower-based net ecosystem CO2 exchange (NEE) measurements and different partitioning methods provided by the tower PI, similar to “Reco1 obs” and “Reco2 obs”. At the US-Ivo site, two GPP simulations were conducted using different maximum light use efficiency (LUE) parameters representing two different vegetation types (shrub and grassland tundra), indicated as “GPP (shrub)” and “GPP (tundra)” in (a). Comparisons between model and tower-based NEE fluxes at the two sites are shown in (d).
At both sites, abrupt decreases in the model-simulated GPP and the net carbon uptake occur during the peak growing season (Fig. 4a, c), which was mainly due to imposed low-minimum temperatures and associated LUE reductions defined by the MODIS nighttime LST observations. The largest GPP reductions during the peak season were generally caused by very low nighttime LST, which may have large uncertainties in cloudy sky conditions. In addition, there is also large uncertainty imposed from the NEE partitioning method, with different methods resulting in large differences (up to more than 1 g C m−2 d−1) in the tower-based GPP and Reco estimates. Both the model simulations and tower observations indicate a significant nonzero carbon flux during early cold season. The model-simulated Reco also shows overall similar sensitivity to surface soil temperature (Tsoil) as the tower data, including a large decrease in respiration when surface soil temperatures drop below −2 ∘C (Figs. 4b and S2). However, the tower-based data indicate a large amount of scatter in the Reco−Tsoil relationship for Tsoil above 0 ∘C, depending on the partitioning method.
The model-simulated soil temperatures showed overall good correspondence with the in situ measurements over the soil profile (R>0.9 and RMSE < 2 ∘C; Figs. S3 and S4). Both the tower-based and model-simulated soil temperature profiles show a consistent pattern of soil warming over the growing season, followed by gradual freezing with cold-season onset; however, the soil temperature of the middle and bottom active layer can stay near 0 ∘C through December. The model-simulated soil respiration density profile largely follows soil temperature, with respiration peaks during midsummer, followed by gradual diminishment with active-layer freeze-up.
The model-simulated carbon fluxes were also comparable to the in situ data at the two boreal forest sites (Figs. 5 and S5). The model showed a slight underestimation of GPP and the relationship between ecosystem respiration (Reco) at the US-Uaf site, with a respective mean bias of −0.32 and −0.34 g C m−2 d−1. The model showed a slightly lower positive bias in GPP and Reco at the US-Prr site, averaging 0.16 and 0.06 g C m−2 d−1. At both sites, no obvious bias was observed in model-simulated NEE during the growing-season despite the model's assumption of dynamic equilibrium in the estimated carbon pools at these two mature forest sites. A much stronger decrease in ecosystem respiration, when the surface soil temperature drops below 0 ∘C, was observed at the US-Prr site relative to the US-Uaf site (Fig. S6), which may partially reflect soil temperature measurement uncertainty (Sect. 2.3). Significant respiration fluxes were observed at the US-Uaf site when soil temperatures were less than 0 ∘C and even below −10 ∘C. At the US-Uaf site, the in situ data indicate a linear increase in the total respiration fluxes, with a longer zero-curtain duration during this period (Fig. 5c, n=10, R=0.6, p<0.1). The model simulations for this site indicate a similar Reco relationship with the zero curtain but with a much shorter estimated zero-curtain period. The apparent model discrepancy was attributed to a lower SMAP-L4SM-derived mean annual soil saturation level at two boreal forest sites (∼ 45 %–50 %), while the in situ measurements indicate much higher saturation (>80 %) in the deep soils. We were unable to conduct a similar analysis at the US-Prr site due to the relatively short measurement record for this site compared with the US-Uaf site.
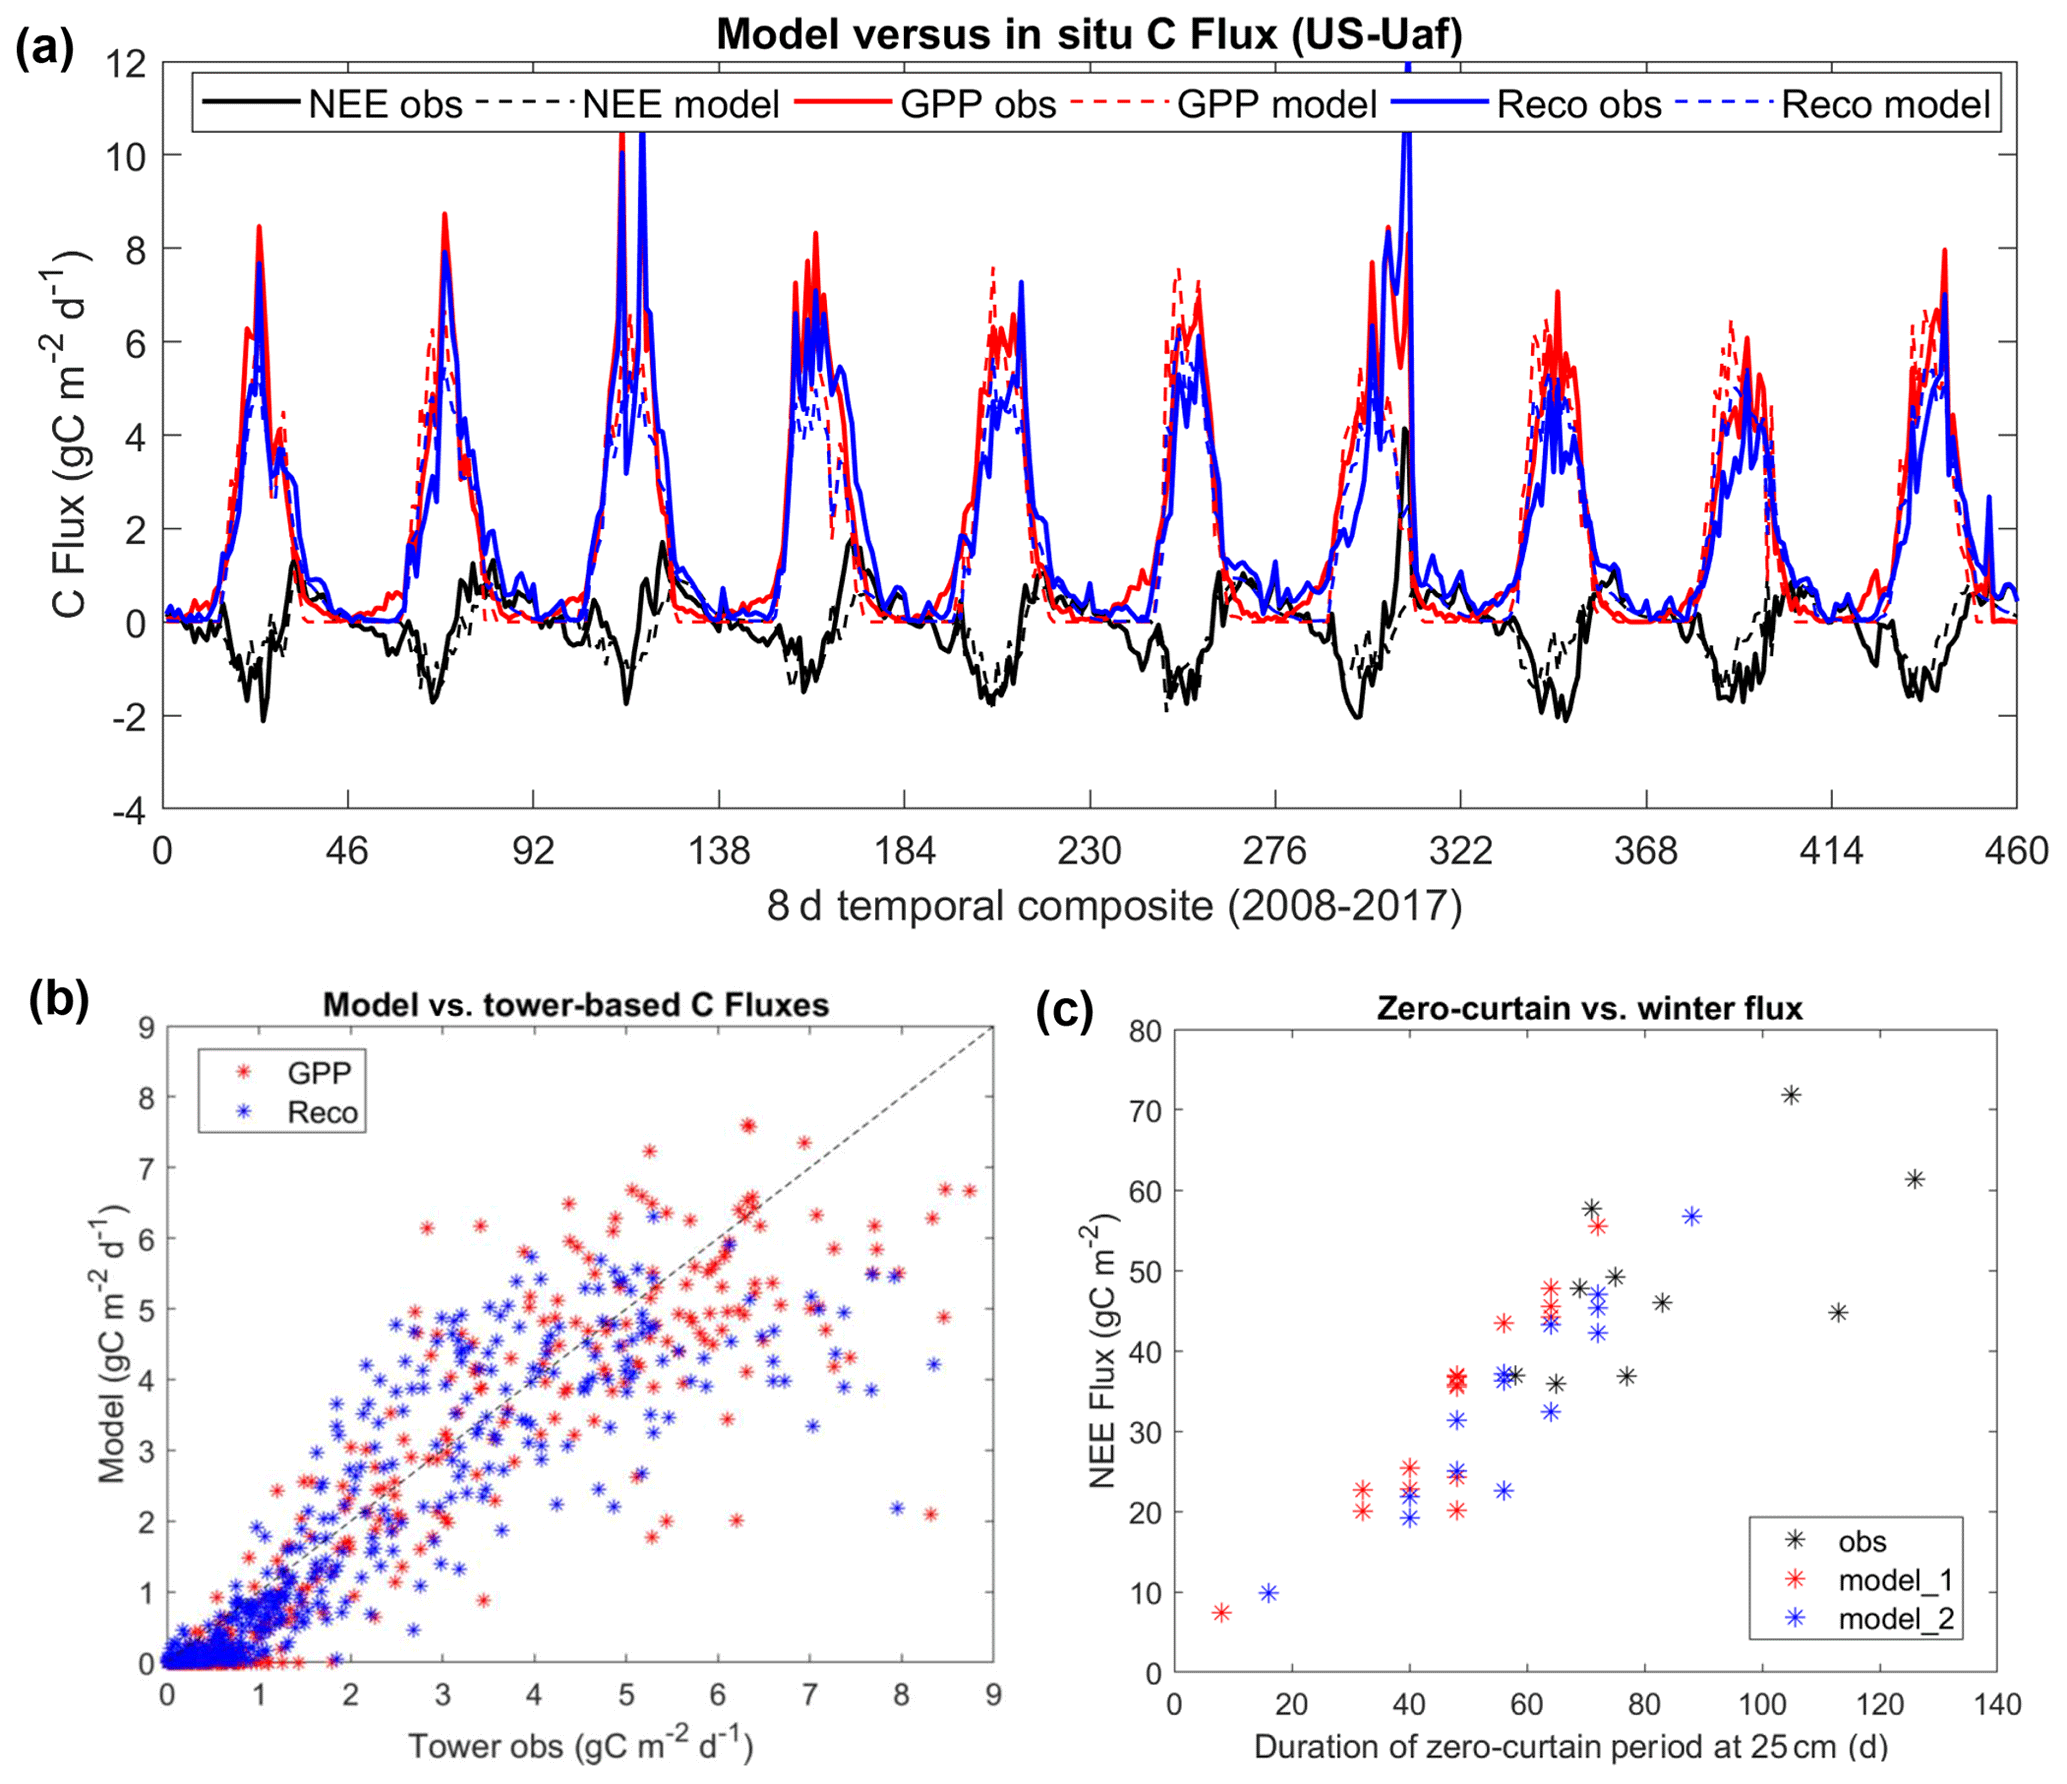
Figure 5Comparisons of model-simulated carbon fluxes with tower-based estimates (a, b), and the relations of total NEE fluxes to the zero-curtain duration at 25 cm soil depth (c). There was a significant correlation (R=0.6, p<0.1) between the zero-curtain period derived from in situ soil moisture data and the total NEE fluxes during this period. The terms “model_1” and “model_2” indicate the model simulations using different soil saturation levels, with “model_2” using a slightly higher (120 %) saturation level than “model_1”.
The model-simulated ecosystem respiration showed a broadly similar response to surface soil temperature during the cold season (October to April) relative to the in situ winter flux synthesis data from the larger Alaskan domain (Fig. 6). The temperature sensitivity of the winter flux shown here is generally similar to the temperature sensitivity curve at the two tundra sites (Figs. 4b and S2) when ecosystem respiration mainly consists of soil respiration. The model indicates a rapid decrease in soil respiration as soil temperature and unfrozen water content decrease. The in situ data collected using chambers and the diffusion method show a similar response pattern to the model; however, the EC data show large scattering in the respiration temperature response and evidence of large winter carbon fluxes when surface soil temperatures drop below −5 ∘C, especially from the open-path EC measurements (Fig. S7). At the tundra sites, model simulations showed a higher correlation with observations excluding the EC-open path measurements (R=0.49) than those using all available measurements (R=0.32). The synthesis data set does not include any Alaskan boreal forest sites using EC-closed path measurements, and all available measurements were used in the analysis. Here, the in situ data indicate a more consistent winter carbon flux temperature response among different measurement methods, which was moderately correlated (R=0.44) with the model-simulated carbon flux. The model-estimated soil temperature was also significantly correlated with the surface soil temperature reported for both tundra sites (R=0.59, p<0.01) and the two boreal forest sites (R=0.51, p<0.01). However, the model-simulated soil temperatures showed a warm bias of 1.6 ∘C at the tundra sites and a cold bias of 2.3 ∘C at the boreal forest sites.
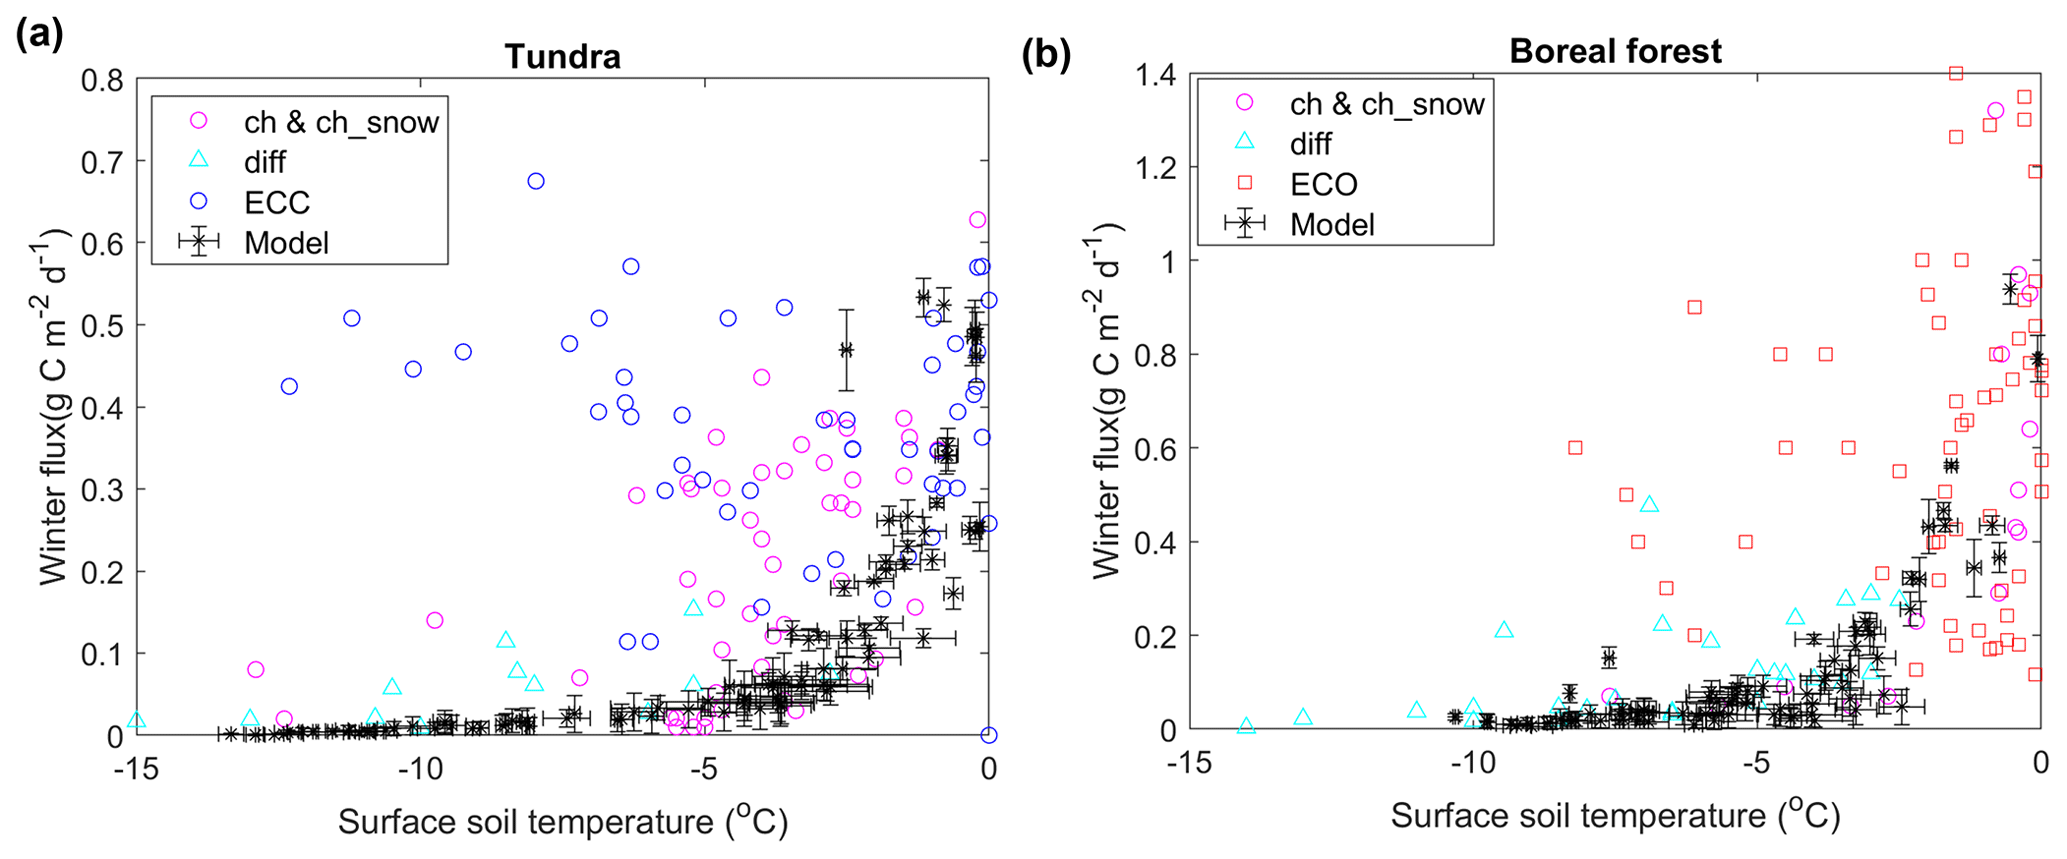
Figure 6Effects of soil temperature on CO2 fluxes during the cold season over Alaskan tundra (a) and boreal forest (b) sites indicated by model simulations (this study) and in situ observations from a winter flux synthesis data set (Natali et al., 2019b). The terms “ch&ch_snow”, “diff”, “ECC”, and “ECO” represent measurements made using chambers and chambers placed atop the snowpack, diffusion, EC-closed path, and EC-open path methods, respectively. The error bars indicate the standard deviations of model simulations using different values (0.35–0.9) for the dimensionless parameter characterizing the unfrozen water curve for most soil types (Schaefer and Jafarov, 2016).
3.2 Spatial pattern and temporal trends of carbon fluxes
3.2.1 Annual carbon fluxes
The seasonal cycle of model-simulated carbon fluxes and the soil heterotrophic respiration (Rh) from different soil depths averaged across Alaska and within different permafrost regions is shown in Fig. 7. The model simulations indicate that both GPP and Rh peak in July, while Rh persists well into the cold season. There is a notable difference in the timing of the Rh seasonal peak from different soil depths, with a longer temporal lag for deeper soil layers. Figure 7c compares the seasonality of the Rh fraction from different soil depths, averaged for regions with different permafrost probability, using an ancillary permafrost map (Pastick et al., 2015; Fig. S8). Southern Alaska has relatively low permafrost probability (≤33 %), where the upper (0–13 cm) soil layer shows an earlier seasonal onset and peak in respiration relative to deeper soil layers. The surface soil contribution to Rh gradually decreases after the seasonal peak in May as deeper soil layers progressively warm. As the surface starts to freeze in September, Rh from deeper (>13 cm depth) soil layers provides the major contribution to total soil respiration during the cold season (October–March). Other areas in Alaska show a similar pattern but with ∼1-month delay in the seasonal peak of the surface Rh contribution in the colder permafrost region (permafrost probability >67 %), compared with the more southern areas.
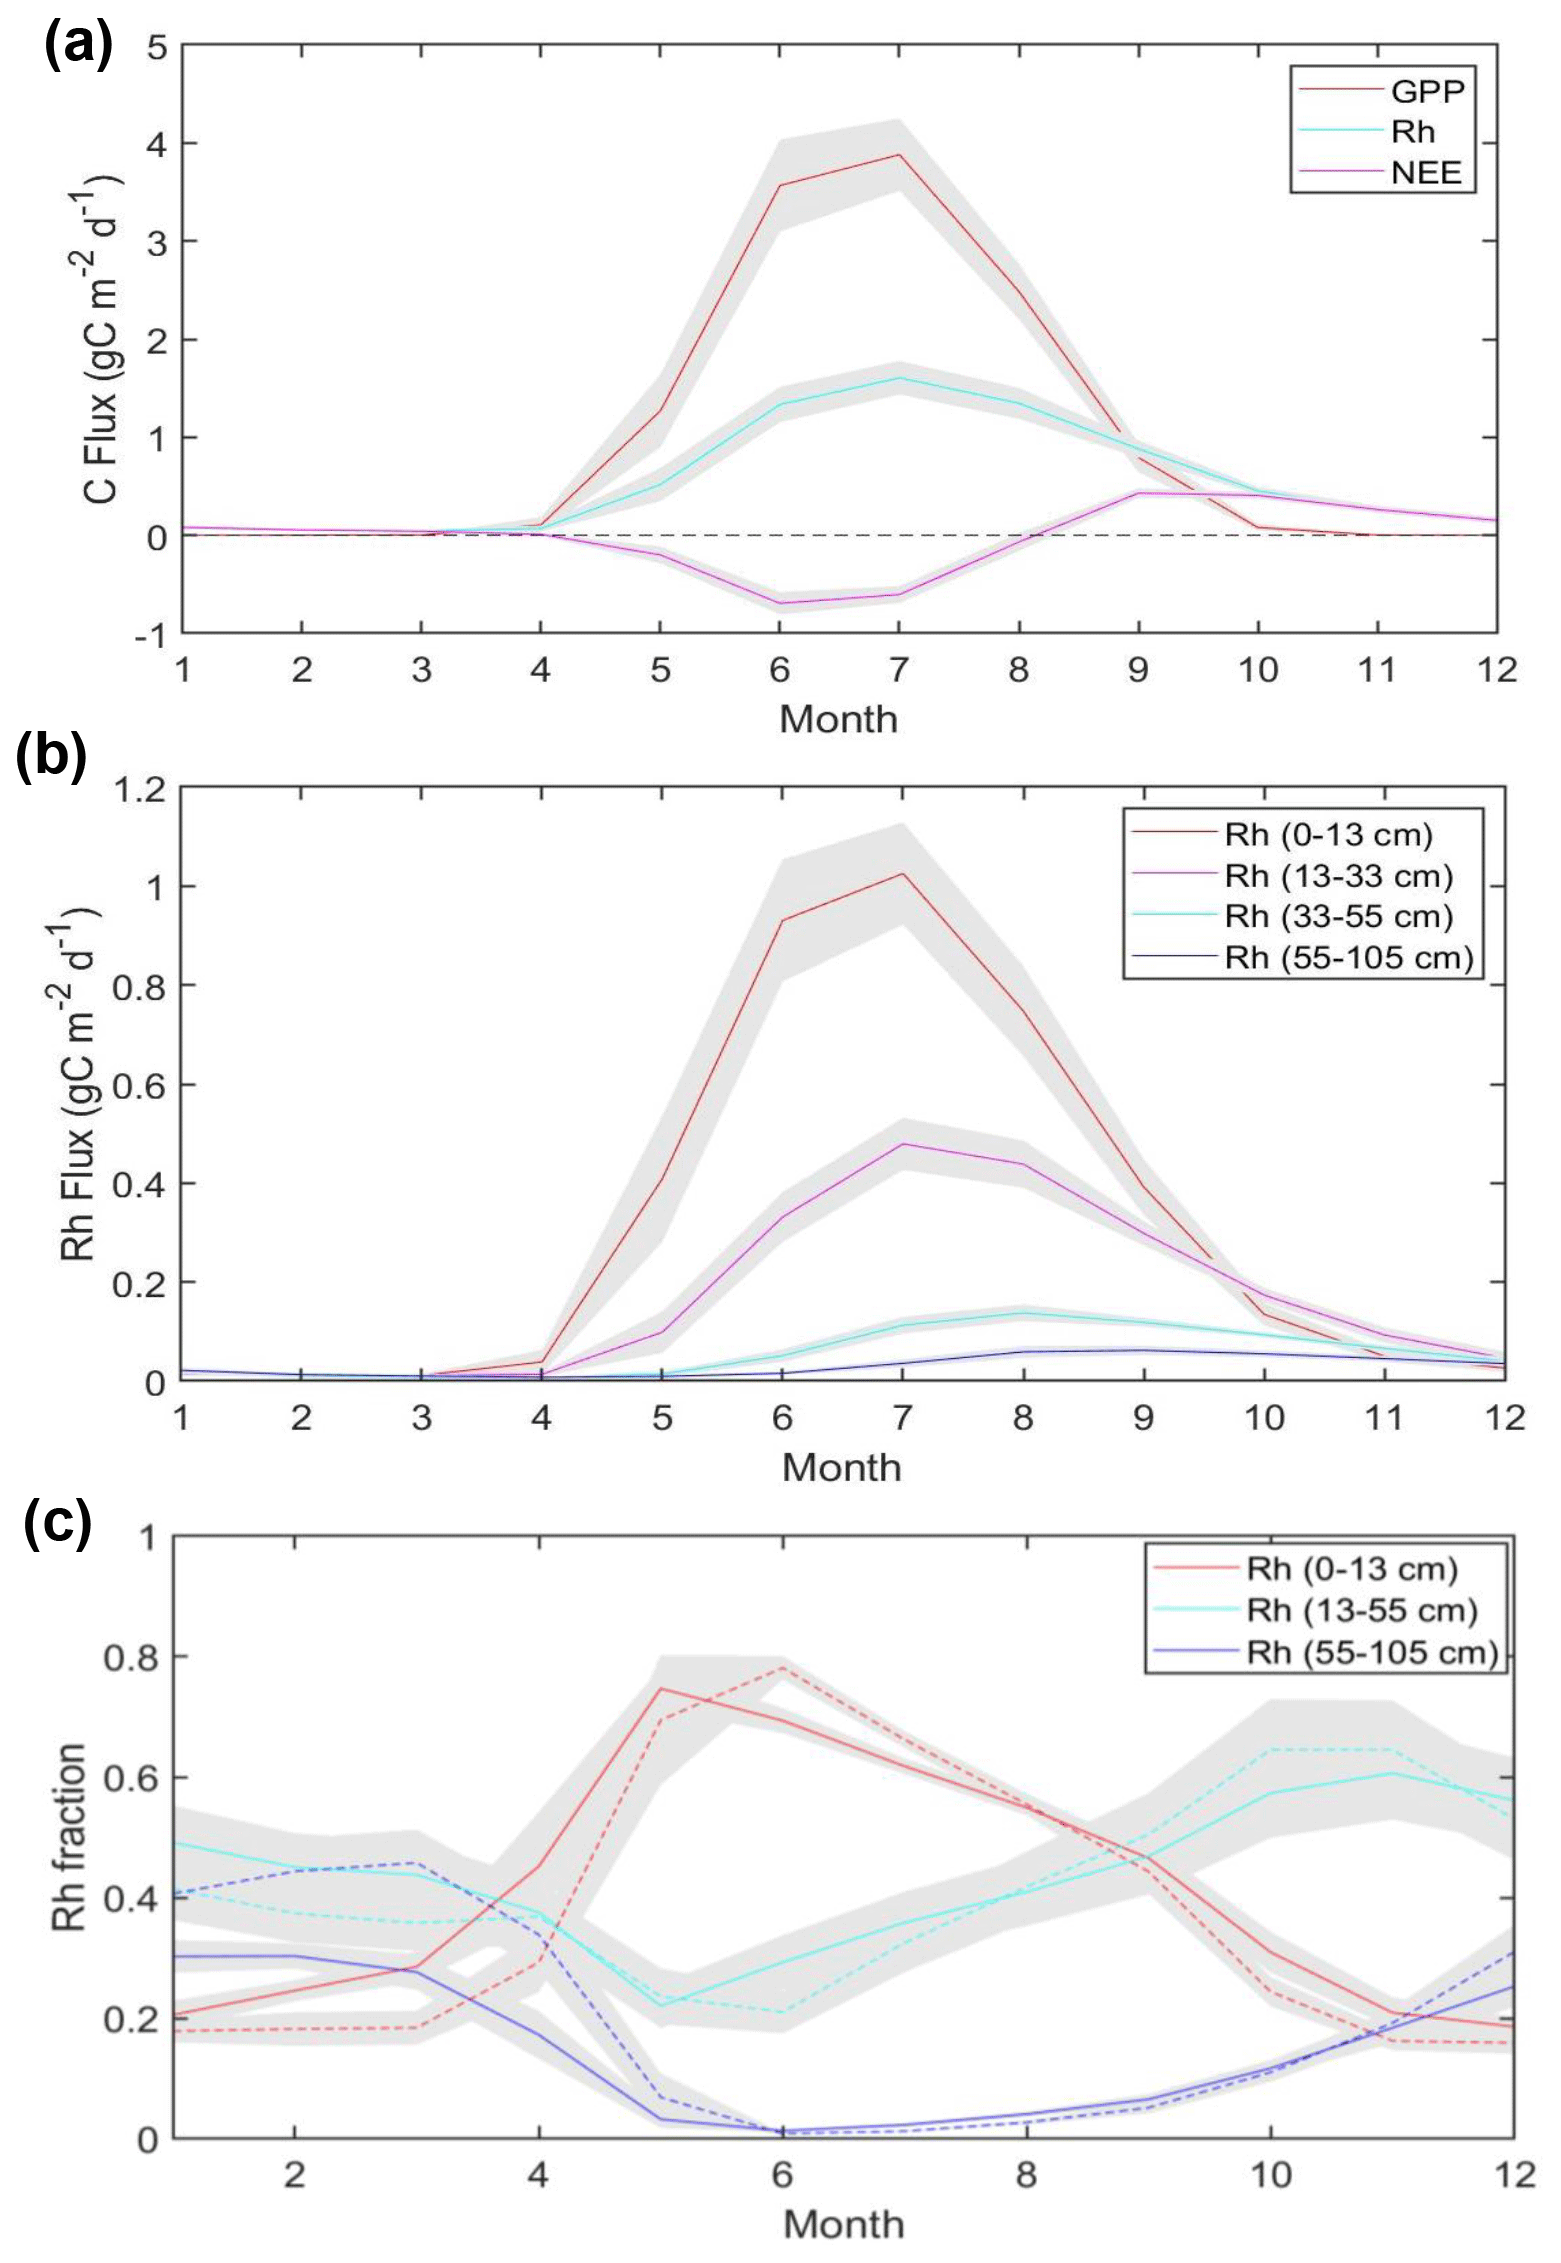
Figure 7Regional mean of model-simulated carbon fluxes (a), Rh fluxes from different soil depths (b) averaged across Alaska, and Rh contribution from different soil depths to total Rh averaged across two regions with different permafrost probability (c). In (c), solid and dashed lines represent the mean values averaged across areas with permafrost probability from 0 % to 33 % and 67 % to 100 %, respectively. Gray shading denotes the standard deviation of monthly mean fluxes from 2001 to 2017.
Across Alaska, annual GPP from 2001 to 2017 shows overall positive productivity trends mostly in western Alaska and the interior of Alaska (Fig. 8a), with 66.8 % of areas showing positive trends and 32.9 % of areas showing negative trends. However, only a very small portion of the areas show significant (p<0.1) productivity trends. The positive GPP trends are mostly explained by increasing vegetation growth and a longer growing season, indicated by the MODIS SCE and NDVI records (Fig. S9). Areas with negative GPP trends mainly occur in southern Alaska and the interior of Alaska. The areas in the interior of Alaska with negative GPP trends also show negative trends in growing-season NDVI and are likely associated with fire-induced vegetation loss (Ju and Masek, 2016). Compared with GPP, Rh shows more extensive enhancement across the region, with 88.4 % (11.5 %) of areas showing increasing (decreasing) respiration trends (Fig. 8b). Correspondingly, areas with strong a increase in ecosystem respiration but moderate or nonsignificant increase in GPP show decreases in net ecosystem carbon uptake (i.e., positive NEE trends), such as the North Slope and portions of southern Alaska, while much of the Alaskan interior shows increasing net carbon uptake (i.e., negative NEE trends) due to the generally stronger increase in GPP relative to respiration (Fig. 8c). Overall, approximately 63.1 % (36.9 %) of the Alaska domain showed decreasing (increasing) trends in net ecosystem carbon sequestration. However, only a very small portion of the land area shows significant (p<0.1) trends, with only 6.1 % (2.1 %) of areas having significant positive (negative) NEE trends. At the regional scale, the time series of estimated annual carbon fluxes showed nonsignificant (p>0.1) positive trends of 2.58, 1.86, and 0.38 Tg C yr−1 for respective GPP, Rh, and NEE fluxes (Fig. S10).
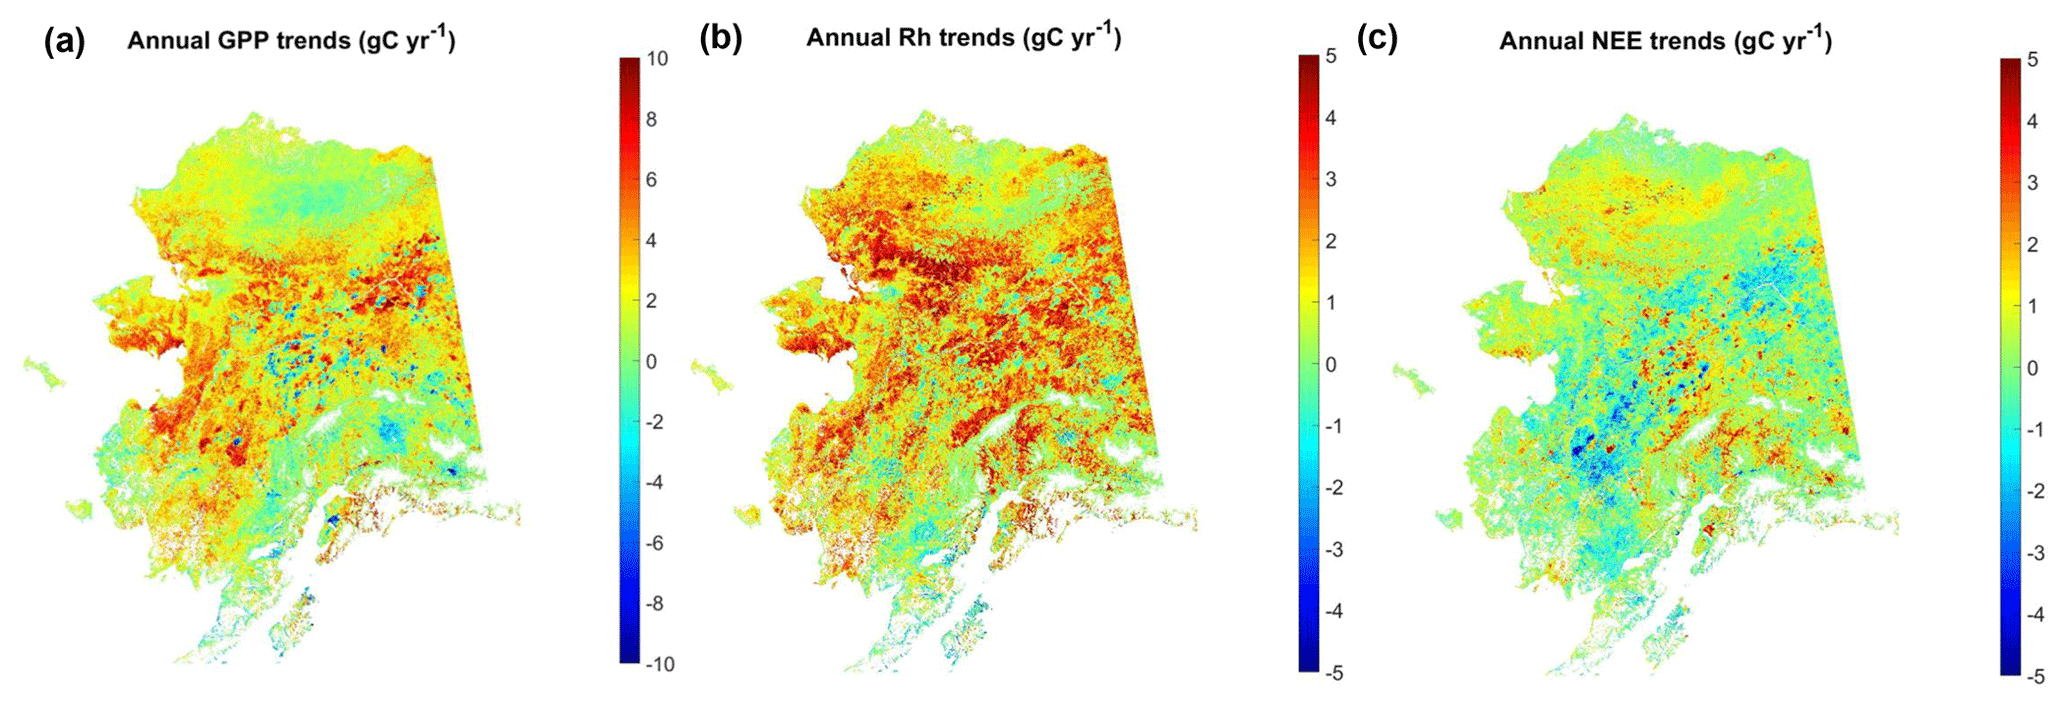
Figure 8Temporal trends of model-estimated annual carbon fluxes from 2001 to 2017. For NEE, positive trends indicate decreasing net carbon uptake activity, while negative trends indicate enhanced net ecosystem carbon uptake.
The attribution analysis results using the GBR method confirmed that NDVI and the annual thawing index are the two most important variables affecting the estimated annual carbon fluxes, which was generally consistent across different vegetation types (Fig. 9). For annual GPP flux, NDVI was the most important variable, followed by the annual thawing index and downward solar radiation, while, for annual Rh fluxes, the annual thawing index was the most important variable, followed by NDVI, with other variables playing a very minor role. Despite the importance of the annual thawing index in controlling annual GPP and Rh fluxes, the snow offset showed little importance to both fluxes. This was likely due to the low temporal resolution of the MODIS snow cover data (i.e., 8 d composite) used to calculate the snow offset, which was calculated as the center date of the 8 d composite period. The low temporal resolution of the snow offset and a strong correlation (R>0.7, p<0.1) between the annual thawing index and snow offset may limit its use in the regression model. As for annual NEE flux, NDVI, downward solar radiation, and the annual freezing index are among the most important factors. However, the effects of different variables on annual NEE flux varied throughout the period, due to their compensating effects on GPP and Rh fluxes and NEE being a small residual of these two larger carbon fluxes; therefore, none of the variables played a dominant role throughout the entire period. In addition, the GBR model also showed generally poor performance in predicting annual NEE fluxes (R≥0.7) compared with the other two fluxes (R>0.9).
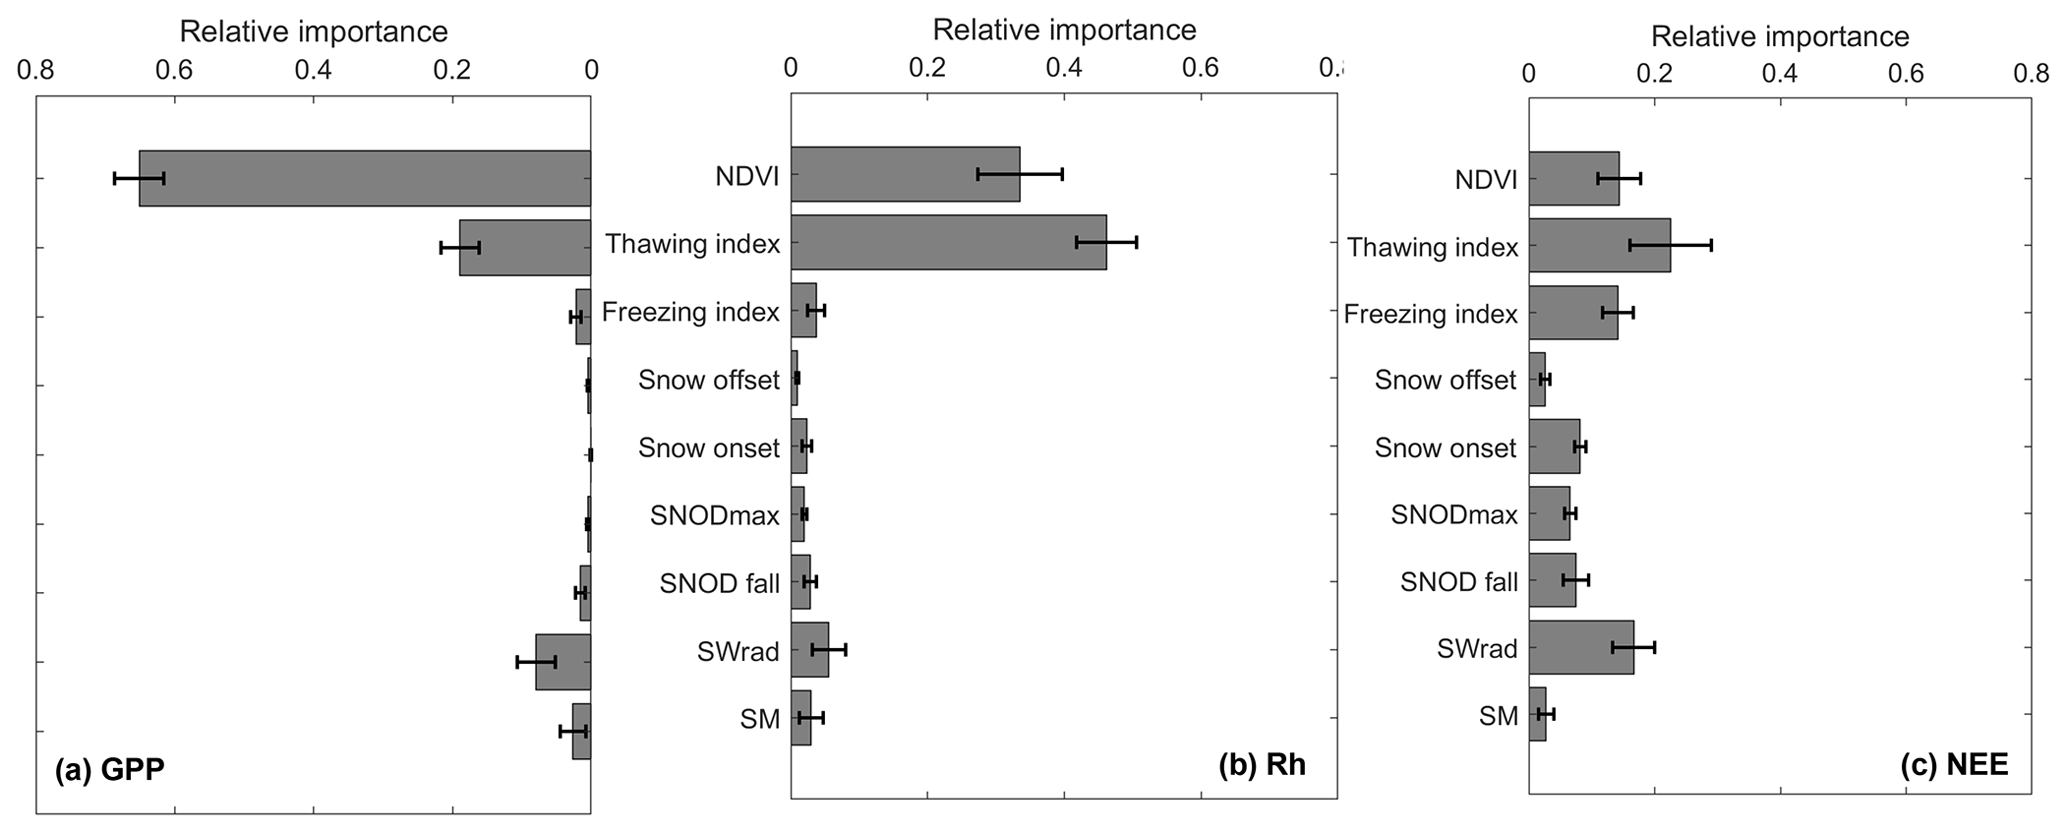
Figure 9Mean relative importance values of selected environmental variables in controlling model-estimated annual carbon fluxes in Alaska (in which (a) GPP, (b) Rh, and (c) NEE are shown). The importance values were averaged for four major vegetation types (forest, shrub, herbaceous, and wetlands; Fig. 2), and the error bar represents their standard deviation across the different vegetation types. The nine environmental variables are summer (June–August) normalized difference vegetation index (NDVI), the annual thawing and freezing indexes, snow offset and onset, mean snow depth averaged from January to March (representing annual maximum snow depth), snow depth averaged during the early snow season (from October to November), mean annual downward solar radiation, and root zone soil moisture during the thaw season. The annual thawing and freezing indexes represent the sum of MODIS land surface temperature (LST) above 0 ∘C and below 0 ∘C throughout the year, respectively.
3.2.2 Growing-season carbon fluxes
The model-simulated growing-season Rh shows overall positive trends during the study period, while the contribution of surface (≤13 cm) soils to total Rh shows opposite trends during the snow-melting period (April to May) and the summer season (June to August; Fig. 10). During the snow-melting period, the Rh trend pattern is similar to GPP, while the surface soil Rh fraction shows large positive trends in western Alaska and the North Slope. The MODIS LST record during this period shows a general surface-warming trend in western and interior Alaska during April and across the North Slope from May to June, which contributes to an advance in seasonal snowmelt in those areas (Fig. S11) and surface soil warming. From June to August, the MODIS LST data show mixed trends in interior Alaska and overall cooling trends in southern and southwestern Alaska, which contribute to the negative model GPP trends in those areas. However, Rh still shows extensive positive trends across Alaska, likely due to increasing trends in the deep soil (>13 cm) respiration contribution discussed below. Correspondingly, NEE shows negative trends (i.e., increasing net carbon uptake) in interior and southern Alaska from April to May but overall positive trends (decreasing net carbon uptake) across Alaska from June to August (Fig. S12a, b).
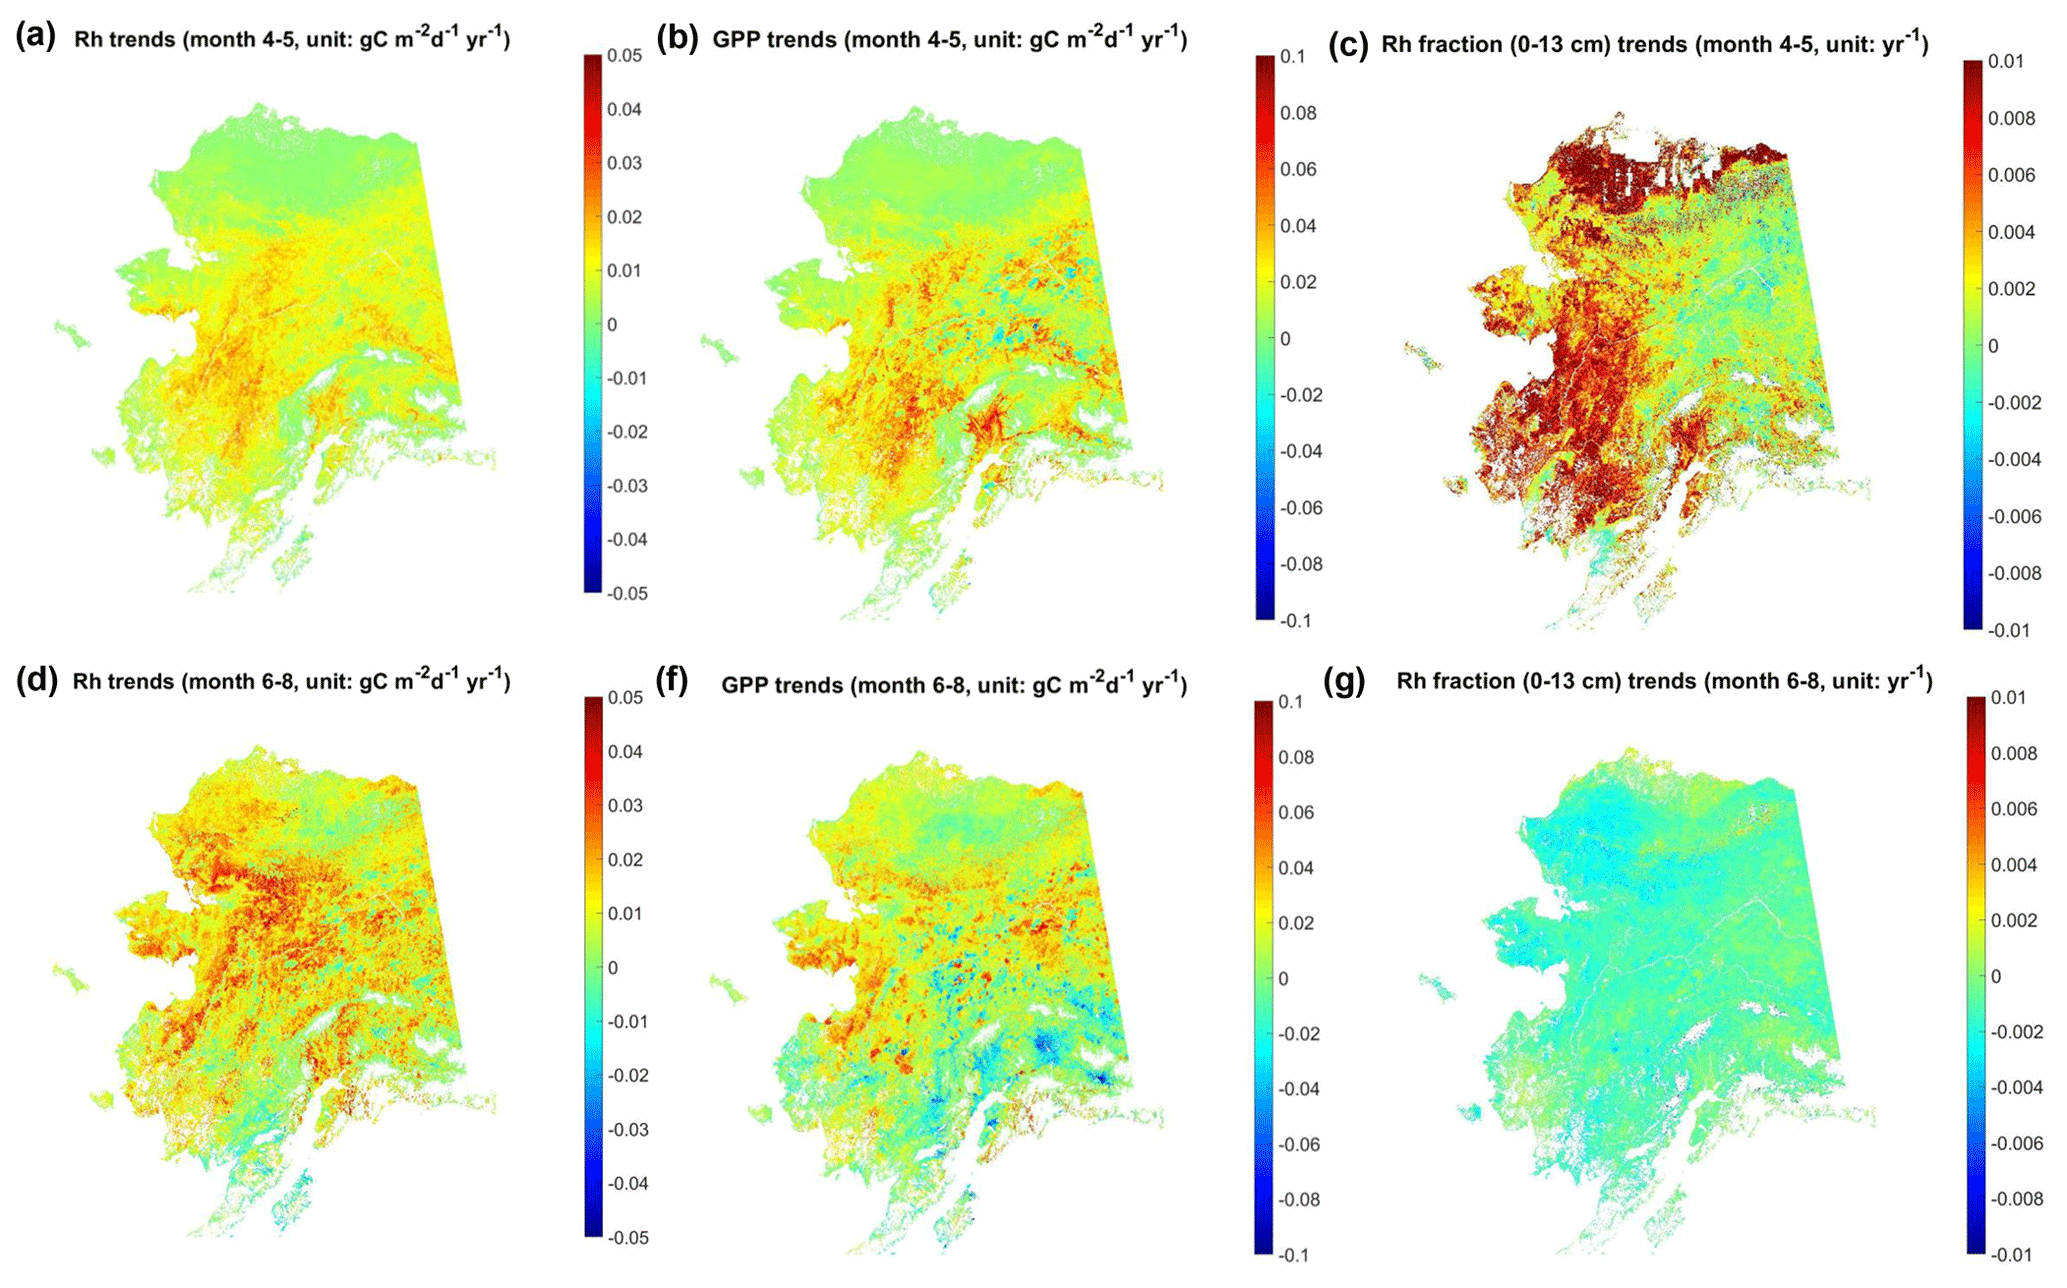
Figure 10Temporal trends of model-estimated total Rh, GPP, and surface soil contribution to Rh (Rh fraction) during the early and peak growing season from 2001 to 2017. In (c), large areas in the Alaskan North Slope were masked out (in white) due to negligible total Rh fluxes in April.
The timing of snow offset or surface thaw onset shows the highest correlation with the surface soil Rh fraction during the growing season but with opposing respiration responses during the early (April–May; ) and peak (June–August; R≥0.58) growing season (Table 2). The snow offset and spring thaw onset are highly correlated as both are mainly controlled by surface temperature (Fig. S11). Correlation analysis (Fig. S13) indicates that the Rh fraction from surface soils is more closely correlated with monthly LST in April and May in areas with low permafrost probability (≤33 %) and with LST in May and June in areas with high permafrost probability (>67 %). These periods correspond to the active snowmelt period in each region, with the mean snow offset day of year (DOY) of ∼ 136.0±14.4 in areas with low permafrost probability and ∼ DOY 148.8±8.9 in more continuous permafrost areas. Changes in the contribution of surface soils to total Rh between the early and peak growing season can be explained by a slower warming rate in deeper soils. Earlier snowmelt and reduced spring snow cover can significantly increase the thermal loading into the ground with the progressive warming of underlying soils. This can partly explain the low correlation between summer (June–August) LST and the Rh contribution from surface soils for the same period.
Table 2Regional mean correlation coefficient between the environmental variables and estimated Rh fraction of surface (0–13 cm) soils during the growing season from 2001 to 2017. Unless indicated, the variables were calculated during the same period as the Rh fraction. The thaw onset was derived from MODIS LST data, and the snow offset was derived from Modern-Era Retrospective analysis for Research and Applications, version 2 (MERRA-2), downscaled snow depth data.
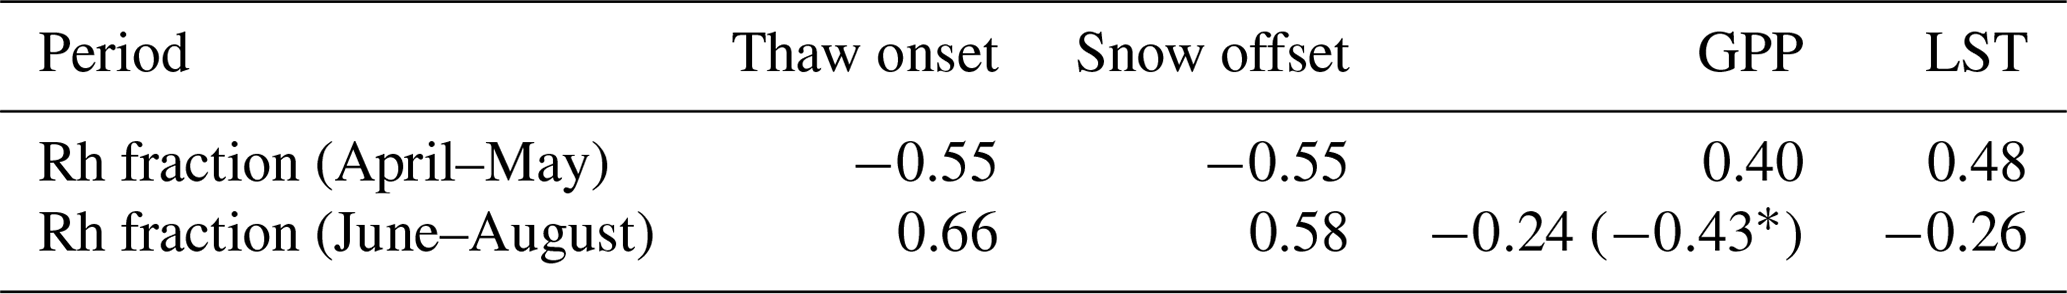
* Indicates GPP from April to August.
3.2.3 Cold-season carbon fluxes
Total Rh during the early cold season, from September to November, shows overall positive trends from 2001 to 2017, except for portions of interior and southwestern Alaska, while the Rh contribution from surface (≤13 cm) soils (hereby denoted as the Rh fraction) shows a similar trend pattern to that of total Rh (Fig. 11). The Rh trend pattern is largely explained by regional trends in the number of snow-free days after the land surface freezes (i.e., snow onset–surface freeze onset; Fig. 11c), which shows the highest correlation with both Rh and the surface soil Rh fraction (Table 3; Rh – mean ; Rh fraction – mean ) among all environmental variables examined. The number of snow-free days after the land surface freeze onset shows large positive trends in southwestern Alaska and portions of southern Alaska, while negative trends mostly occur in northern Alaska. Both total Rh and the Rh fraction of surface soils generally increase with delayed surface freeze onset but decrease with delayed snow onset, although the correlation is relatively weak (Table 3). Among the monthly snow depth data, Rh and Rh fraction show the highest correlation with snow depth during the early snow season (September–October), which supports a close correlation between snow accumulation and soil respiration.
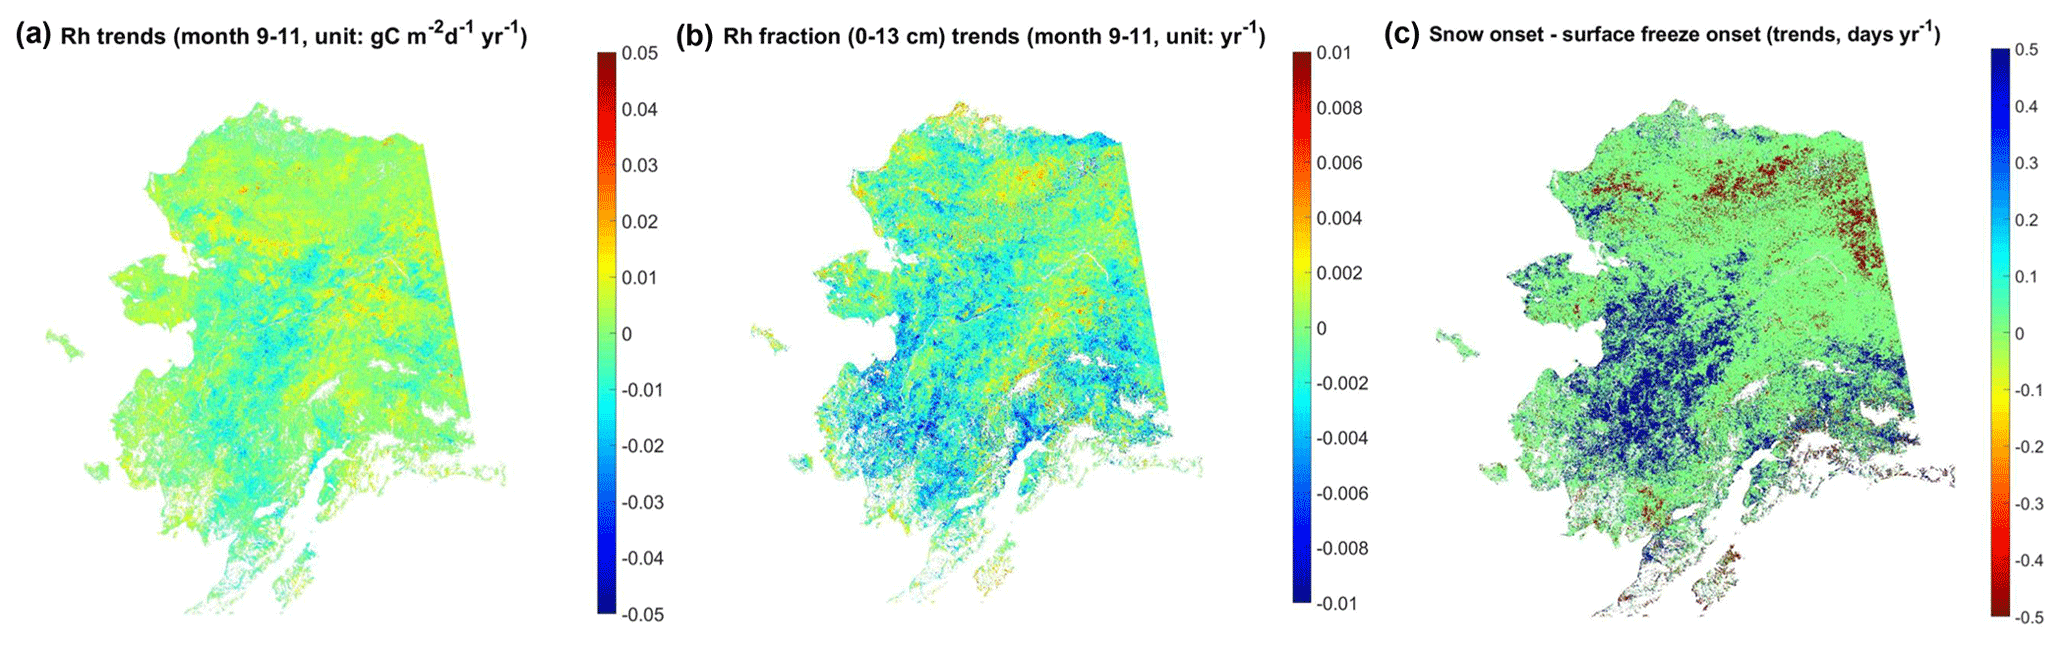
Figure 11Regional trends of total Rh (a) and its surface soil contribution (b) during the early cold season (September–November) versus regional trends of the number of snow-free days after the land surface freezes (c), which was defined as the difference between snow onset and surface freeze onset.
Table 3Regional mean correlation coefficient between the environmental variables and estimated surface (0–13 cm) soil contribution to total Rh during the early cold season (September to November). Unless indicated, the variables were calculated during the same period as the Rh fraction.
a GPP from April to November. b Snow depth (SNOD) from September to October shows strongest correlation with the Rh and Rh fraction.
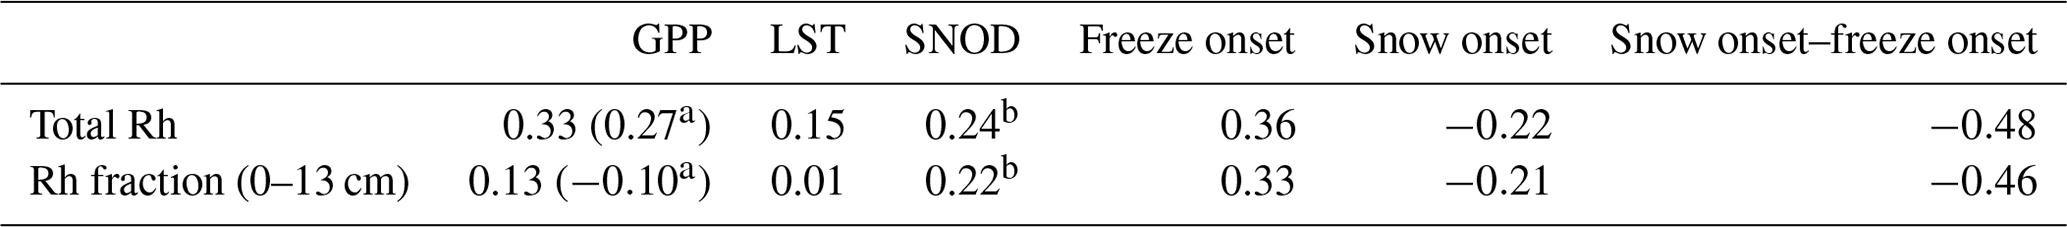
The spatial pattern in the soil respiration trends during the early cold season can be explained by the temporal lag (days) between the onset of surface freezing and freezing in deeper (23 cm) soil layers, i.e., the soil-freezing delay or the duration of the zero-curtain period in areas with permafrost occurrence (Fig. 12). The model simulations show an advance of ∼0.78 d yr−1 (p<0.1) in the regional mean soil-freezing delay at 23 cm, averaged across Alaska from 2001 to 2016, which is mainly driven by a delay in autumn snow cover onset (Fig. S11d–f). However, large variations in the timing and depth of autumn snow accumulation contribute to large interannual variability in the soil-freezing delay (Fig. 12c). The model-simulated soil-freezing delay increases with soil depth, and the soil-freezing delay at different soil depths is generally highly correlated. Soil water content is one of the major factors affecting the soil-freezing delay, which explains why northern and southern Alaska show a longer delay in soil freezing than relatively drier soil regions in interior Alaska, indicated by the SMAP L4 SM record (not shown). The trends of the soil-freezing delay at 23 cm depth are largely determined by the number of snow-free days after land surface freeze onset (regional mean ), with ∼72 % of areas showing a significant (p<0.1) correlation. Earlier snow onset over the Alaskan North Slope corresponds to an overall longer delay in soil freezing (i.e., longer zero-curtain duration), consistent with a previous study (Yi et al., 2019), while southwestern Alaska shows an overall shorter soil-freezing delay due to later snow onset (Fig. S11e–f). The soil-freezing delay at the 23 cm depth was also closely related to the snow depth during early snow season from September to October (regional mean ), with ∼85 % of areas showing a significant (p<0.1) correlation.
Figure 12Sensitivity of model-simulated soil-freezing process to snow cover changes across Alaska. The mean (a) and trends (b) of the soil-freezing delay at 23 cm soil depth relative to surface freeze onset. (c) The annual time series of the model-simulated soil-freezing delay, the number of snow-free days after land surface freezes, and MERRA-2 snow depth (SNOD) from September to October, averaged across Alaska.
3.2.4 Impact of model resolution on the CO2 seasonal cycle
Comparisons of the statistical distribution of model-simulated carbon fluxes at the 1 and 10 km resolutions show an enhanced NEE seasonal amplitude from the coarser-scale model simulations (Fig. 13). A larger difference in the distributions is seen in the model-simulated Rh fluxes, with slightly reduced Rh flux during summer and enhanced Rh flux from October to November at a 10 km resolution. The largest differences in the Rh fluxes occur in October and November, with daily mean differences of ∼0.1 gC m−2 d−1 and a total difference of 9.8 Tg C across the entire study area from October to December (or more than 20 % of the multiyear mean during the same period averaged across Alaska). This is consistent with an overall reduction in the number of days between snow onset and surface freeze onset derived from the model input data sets of LST and snow depth at a 10 km resolution (Fig. 13a). The statistical distribution of the model input snow depth data at the two resolutions also shows the largest differences in October due to more variable snow cover conditions in the early snow season, which can have a large impact on subsurface soil temperatures due to the stronger insulating effects of early snow accumulation (Fig. 3; Slater et al., 2017). The model-simulated GPP flux during the growing season shows only limited differences (<2 %) between the two spatial scales (not shown). However, the NEE simulations at a 10 km resolution show enhanced carbon uptake during the growing season, and enhanced carbon loss during the early cold season, with ∼14 % increases in the seasonal amplitude averaged over Alaska.

Figure 13Comparisons of the statistical distribution of model inputs and simulations at the 1 and 10 km resolutions across Alaska. (a) The number of snow-free days after land surface freeze onset, derived from the model input LST and snow depth data sets. (b) Model-simulated daily mean Rh flux averaged from September to November. (c) Model-simulated daily mean NEE flux averaged from June to August. (d) Model-simulated NEE amplitude, which was defined as the difference in the daily mean NEE flux between two periods (September–November vs. June–August). The lines show the fitted probability distribution function (pdf) using a normal distribution.
Based on the simulations of a newly developed 1 km permafrost carbon model, we highlight the important role of snow cover variability in controlling soil heterotrophic respiration and the CO2 seasonal cycle of boreal and Arctic ecosystems in Alaska. The large differences between model-simulated soil respiration during the early cold season and the estimated NEE seasonal amplitude at different model spatial scales also highlight potential large uncertainties in regional model simulations contributed from an inadequate representation of land surface heterogeneity.
4.1 Environmental sensitivity of boreal–Arctic CO2 seasonal cycle
Our results show that earlier snow melting, associated with spring warming, enhances soil heterotrophic respiration throughout the growing season, leading to a reduction in net carbon uptake later in the growing season in Alaska (Fig. S12). Previous studies reported that earlier snow melting generally results in enhanced vegetation productivity and carbon uptake during the early growing season, consistent with our simulations, while its impact on net ecosystem exchange during the later growing season may vary with local climate and site conditions (Aurela et al., 2004; Humphreys and Lafleur, 2011; Pulliainen et al., 2017). The variable impact of snow on the seasonal carbon cycle can be explained by the divergent responses of vegetation productivity and Rh to soil moisture and soil temperature during the later growing season. Earlier snow melting in spring can lead to depleted soil water conditions during the later growing season, resulting in a decrease in vegetation productivity and weaker net ecosystem carbon sink activity, especially in the boreal region (Buermann et al., 2013; Sulla-Menashe et al., 2018). However, our simulations indicate that deeper soil warming associated with early snow melting is mainly responsible for the enhanced ecosystem carbon loss later in the growing season. Surface warming and earlier disappearance in spring snow cover are associated with a deeper thaw depth in the permafrost region (Park et al., 2016; Yi et al., 2018). Field studies have shown that deeper permafrost thawing is associated with enhanced ecosystem respiration and, thus, reduced carbon sink activity during the later summer (Natali et al., 2011; Lund et al., 2012; Webb et al., 2016). Other studies also indicate that ecosystem respiration may dominate the NEE response to spring snow cover conditions and warming in the Arctic tundra; however, divergent responses have been observed in different tundra ecosystems (Humphreys and Lafleur, 2011; Parmentier et al., 2011; Lund et al., 2012; Darrouzet-Nardi et al., 2019).
Our simulations also indicate that the arrival of seasonal snow cover and the number of snow-free days after land surface freeze play a major role in controlling subsurface soil freeze-up and soil respiration during the early cold season. Earlier snow onset relative to surface freeze onset (i.e., a short snow-free period after surface freezing) keeps the soil warm and results in a longer soil-freezing delay and zero-curtain period in permafrost areas, with enhanced soil respiration during the early cold season (Fig. 11). Due to strong snow insulation effects, underlying soils can remain unfrozen for a substantial period long after the surface soil freezes, i.e., the zero-curtain period. Field studies have shown persistent carbon emissions during this zero-curtain period and also throughout the winter season, while the resulting cold-season soil carbon emissions may partially offset or even exceed the growing season net carbon uptake (Elberling and Brandt, 2003; Luers et al., 2014; Webb et al., 2016; Euskirchen et al., 2017). A recent study showed that Alaskan ecosystems were either a carbon source or carbon neutral during the recent observational period (2012–2014) due to a large contribution of cold-season carbon emissions, with larger emissions in the early cold season based on CO2 flux estimates optimized using data collected from the Carbon in Arctic Reservoirs Vulnerability Experiment (CARVE; Commane et al., 2017). Our simulations show a much longer soil-freezing delay and zero-curtain period in 2013 than the other 2 years for the same overlapping period (Fig. 12c), corresponding to large net CO2 fluxes during the fall in 2013 across Alaska and the North Slope region, as shown in Fig. 1 of Commane et al. (2017).
However, large uncertainties are associated with cold-season carbon emissions in our estimates and other studies based on either in situ data or atmospheric inversions. An analysis using satellite and airborne CO2 observations pointed out that the current sparse CO2 observational network is insufficient to constrain current and future estimates of cold-season carbon emissions and the annual carbon budget of Arctic ecosystems (Parazoo et al., 2016). The in situ winter flux synthesis data set (Natali et al., 2019b) also shows large scatter in the winter flux response to surface soil temperature, especially when using the eddy covariance method. The in situ data set indicated that significant carbon loss (>0.5 gC m−2 d−1) can occur even when surface soil temperature drops below −5 ∘C (Fig. S7). This large carbon loss at very low temperatures was not reproduced by our model, which showed a rapid decrease in soil respiration when surface soil temperatures (∼8 cm depth) drop below −2 or −3 ∘C. However, previous studies have highlighted the inconsistency among different measurement methods in the Arctic and uncertainties in winter flux measurements due to significant data loss under extreme weather conditions (Goodrich et al., 2016; Webb et al., 2016).
4.2 Model limitations and potential improvements
An important feature of boreal–arctic landscapes is strong surface heterogeneity, which may not be well represented in current global-scale models operating at the order of tens of kilometers or more (Koven et al., 2013b; Yi et al., 2015; Tao et al., 2019). Our comparisons between the 1 and 10 km model simulations showed a nonnegligible influence of landscape heterogeneity on the model-simulated CO2 seasonal cycle, especially during the early cold season (Fig. 13). A total difference of ∼9.8 Tg C from October to December across Alaska was found between the two simulations. Scaled to the larger pan-Arctic region (24.95×10⁶ km2), the resulting difference represents ∼194 Tg C in cold-season carbon emissions and can account for more than 10 % of the estimated total winter flux for the pan-Arctic permafrost region (Natali et al., 2019a). The resulting uncertainty partially reflects spatial heterogeneity in autumn snow cover conditions and subgrid variability in the surface energy budget (indicated by LST). The complex relationship among soil saturation, snow accumulation, and soil freezing also contributes to scale-dependent differences in the soil carbon emission estimates (Outcalt et al., 1990; Oechel et al., 1997; Zhang, 2005). These results highlight a nonlinear response of carbon fluxes to land surface heterogeneity across the different model scales (≥1 km). Moreover, a number of studies have shown that microtopography, of the order of a few meters, exerts a strong control on permafrost thaw and carbon dynamics (Kumar et al., 2016; Liljedahl et al, 2016; Grant et al., 2017a, b), which should be addressed in future model development.
Our current and previous assessment of the permafrost soil model also identified several areas in which improvements should be made to enhance model capabilities, especially in boreal forest. Comparisons with in situ measurements indicate larger discrepancies between model ALT simulations and in situ data in the boreal interior of Alaska characterized by a greater density of woody vegetation overlain with discontinuous or sporadic permafrost (Yi et al., 2018). Model-simulated soil temperatures also showed a larger bias at the boreal forest sites in relation to the in situ winter flux synthesis data (Sect. 3.1.2). The larger apparent uncertainty may reflect poor model representation of the vegetation canopy influence on thermal energy loading at the soil surface. Previous studies have shown that the MODIS vegetation index, leaf area index, and tree cover data are sensitive to boreal forest structure and postfire disturbance recovery (Mastepanov et al., 2013). These data sets can be used to account for the temperature difference between the soil surface and canopy skin temperature indicated by the MODIS LST data for different vegetation categories, either through simple empirical models or more sophisticated approaches derived from canopy radiative transfer models (Paul et al., 2004; Verhoef et al., 2007; Dolschak et al., 2015).
In addition, better understanding of the scaling behavior of environmental controls on soil moisture is needed to improve model representation of active layer conditions and carbon emissions (Mishra and Riley, 2015). Previous studies indicate that topography and soil conditions are the dominant factors affecting soil moisture variability at finer scales (Crow et al., 2012), which are not sufficiently represented by the coarse resolution (∼9 km) soil moisture observations used as model inputs for this study. For example, our model simulations indicate a much shorter zero-curtain period at an interior Alaska boreal forest site compared with the local site measurements (Fig. 5c), and there is also a shorter overall zero-curtain period in interior Alaska than in the Alaskan North Slope and southern Alaska. This pattern was closely related to the model input SMAP soil wetness data, which indicated much drier conditions in interior Alaska.
Other notable uncertainties in the model-estimated carbon fluxes include insufficient representation of the soil moisture migration with permafrost thaw and winter processes. Earlier spring thaw and snowmelt have been linked with active layer deepening and permafrost degradation, exacerbating the soil water deficit during the later growing season, especially in the southern boreal forest areas (Buermann et al., 2013; Park et al., 2016; Zhang et al., 2019). Using external soil moisture inputs, the current permafrost model was not able to fully represent this phenomenon, which requires a more complete depiction of soil water, energy and carbon processes, and linkages (Walvoord and Kuryly, 2016). On the other hand, insufficient winter process representation in our model may partly explain the inconsistency between the model-simulated and observation-based temperature response curve of the winter flux indicated by the EC tower-based measurements (Fig. 6). For example, field studies have shown that the soil CO2 flux from microbial production during fall and winter can be trapped due to the overlying snowpack or surface ice layers (Elberling and Brandt, 2003; Raz-Yaseef et al., 2017). The trapped CO2 can be rapidly released during high wind conditions or during the spring thaw period, resulting in strong transient flux events which are more likely recorded in EC measurements but not detected in closed-chamber measurements (Luers et al., 2014; Webb et al., 2016). Late-season bursts in CO2 emissions were also reported during the soil freeze-in period at a high Arctic wetland site (Mastepanov et al., 2013). However, our model currently assumes that all soil microbial respiration is released directly to the atmosphere, without the mediation of snowpack, ice, and mesoscale wind or pressure conditions on CO2 emissions.
We developed a remote-sensing-driven permafrost carbon model at an intermediate scale (∼1 km) to evaluate the sensitivity of the seasonal and annual carbon (CO2) cycle and soil respiration to snow cover changes across Alaska during the recent two decades (2001–2017). Our results indicate that earlier snowmelt onset associated with spring warming enhances soil heterotrophic respiration throughout the growing season and reduces net carbon uptake during the later growing season when carbon losses from enhanced deep soil respiration may offset or exceed ecosystem carbon gains from vegetation productivity. Soil freeze-up and early cold-season soil respiration are closely linked to the number of snow-free days after the land surface freezes, i.e., the delay in snow onset relative to surface freeze onset. Recent trends toward earlier autumn snow onset in northern Alaska promote a longer zero-curtain period and enhanced cold-season respiration. In contrast, southwestern Alaska shows a longer delay in autumn snow accumulation relative to surface freeze onset, leading to earlier soil freezing and a large reduction in cold-season soil respiration. Our results also show nonnegligible influences of subgrid variability in surface conditions on the model-simulated CO2 seasonal cycle, especially during the early cold season at a 10 km scale. These results confirm the important control of seasonal snow cover on the annual and seasonal carbon exchange of boreal–Arctic ecosystems. A nonlinear response of soil respiration to snow cover changes poses significant challenges for global Earth system models in accurately projecting the pan-Arctic carbon cycle response to climate change.
The regional model simulations will be archived and distributed for public access through the NASA ABoVE archive at the NASA ORNL DAAC. All data used in this study were obtained from free and open data repositories. The model code used in this study is available from GitHub at https://github.com/yiyh05/STM-C (Yi, 2020).
The supplement related to this article is available online at: https://doi.org/10.5194/bg-17-5861-2020-supplement.
YY, JSK, and CEM initiated the study. YY did the calculations and wrote the paper. All coauthors contributed to the data and provided feedback on the final version.
The authors declare that they have no conflict of interest.
This study was funded by the NASA Terrestrial Ecology Program as part of the Arctic Boreal Vulnerability Experiment (ABoVE). A portion of the research was carried out at the Jet Propulsion Laboratory, California Institute of Technology, under contract with NASA.
This research has been supported by the NASA Terrestrial Ecology Program (grant no. NNH18ZDA001N).
This paper was edited by Michael Weintraub and reviewed by two anonymous referees.
Arndt, K. A., Oechel, W. C., Goodrich, J. P., Bailey, B. A., Kalhori, A., Hashemi, J., Sweeney, C., and Zona, D.: Sensitivity of Methane Emissions to Later Soil Freezing in Arctic Tundra Ecosystems, J. Geophys. Res.-Biogeo., 124, 2595–2609, https://doi.org/10.1029/2019JG005242, 2019.
Aurela, M., Laurila, T., and Tuovinen, J.: The timing of snow melt controls the annual CO2 balance in a subarctic fen, Geophys. Res. Lett., 31, L16119, https://doi.org/10.1029/2004GL020315, 2004.
Bintanja, R. and Andry, O.: Towards a rain-dominated Arctic, Nat. Clim. Change, 7, 263–267, https://doi.org/10.1038/nclimate3240, 2017.
Bjerke, J. W., Tømmervik, H., Zielke, M., and Jørgensen, M.: Impacts of snow season on ground-ice accumulation, soil frost and primary productivity in a grassland of sub-Arctic Norway, Environ. Res. Lett., 10, 095007, https://doi.org/10.1088/1748-9326/10/9/095007, 2015.
Bormann, K. J., Brown, R. D., Derksen, C., and Painter, T. H.: Estimating snow-cover trends from space, Nat. Clim. Change, 8, 924–928, https://doi.org/10.1038/s41558-018-0318-3, 2018.
Brown, R. D. and Derksen, C.: Is Eurasian October snow cover extent increasing?, Environ. Res. Lett., 8, 024006, https://doi.org/10.1088/1748-9326/8/2/024006, 2013.
Buermann, W., Bikash, P. R., Jung, M., Burn, D. H., and Reichstein, M.: Earlier springs decrease peak summer productivity in North American boreal forests, Environ. Res. Lett., 8, 024027, https://doi.org/10.1088/1748-9326/8/2/024027, 2013.
Commane, R., Lindaas, J., Benmergui, J., Luus, K. A., Chang, R. Y.-W., Daube, B. C., Euskirchen, E. S., Henderson, J. M., Karion, A., Miller, J. B., Miller, S. M., Parazoo, N. C., Randerson, J. T., Sweeney, C., Tans, P., Thoning, K., Veraverbeke, S., Miller, C. E., and Wofsy, S. C.: Carbon dioxide sources from Alaska driven by increasing early winter respiration from Arctic tundra, P. Natl. Acad. Sci. USA, 114, 5361–5366, https://doi.org/10.1073/pnas.1618567114, 2017.
Connon, R., Devoie, É., Hayashi, M., Veness, T., and Quinton, W.: The Influence of Shallow Taliks on Permafrost Thaw and Active Layer Dynamics in Subarctic Canada, J. Geophys. Res.-Earth, 123, 281–297, https://doi.org/10.1002/2017JF004469, 2018.
Crow, W. T., Berg, A. A., Cosh, M. H., Loew, A., Mohanty, B. P., Panciera, R., de Rosnay, P., Ryu, D., and Walker, J. P.: Upscaling sparse ground-based soil moisture observations for the validation of coarse-resolution satellite soil moisture products, Rev. Geophys., 50, RG2002, https://doi.org/10.1029/2011RG000372, 2012.
Davidson, S. J., Sloan, V. L., Phoenix, G. K., Wagner, R., Fisher, J. P., Oechel, W. C., and Zona, D.: Vegetation Type Dominates the Spatial Variability in CH4 Emissions Across Multiple Arctic Tundra Landscapes, Ecosystems, 19, 1116–1132, https://doi.org/10.1007/s10021-016-9991-0, 2016.
Darrouzet-Nardi, A., Steltzer, H., Sullivan, P. F., Segal, A., Koltz, A. M., Livensperger, C., Schimel, J. P., and Weintraub, M. N.: Limited effects of early snowmelt on plants, decomposers, and soil nutrients in Arctic tundra soils, Ecol. Evol., 9, 1820–1844, https://doi.org/10.1002/ece3.4870, 2019.
De Lannoy, G. J. M., Koster, R. D., Reichle, R. H., Mahanama, S. P. P., and Liu, Q.: An updated treatment of soil texture and associated hydraulic properties in a global land modeling system, J. Adv. Model. Earth Sy., 6, 957–979, https://doi.org/10.1002/2014MS000330, 2014.
Dolschak, K., Gartner, K., and Berger, T. W.: A new approach to predict soil temperature under vegetated surfaces, Model. Earth Syst. Environ., 1, 32, https://doi.org/10.1007/s40808-015-0041-2, 2015.
Elberling, B. and Brandt, K. K.: Uncoupling of microbial CO2 production and release in frozen soil and its implications for field studies of arctic C cycling, Soil Biol. Biochem., 35, 263–272, https://doi.org/10.1016/S0038-0717(02)00258-4, 2003.
Elzein, A. and Balesdent, J.: Mechanistic Simulation of Vertical Distribution of Carbon Concentrations and Residence Times in Soils, Soil Sci. Soc. Am. J., 59, 1328–1335, https://doi.org/10.2136/sssaj1995.03615995005900050019x, 1995.
Euskirchen, E. S., Bret-Harte, M. S., Shaver, G. R., Edgar, C. W., and Romanovsky, V. E.: Long-Term Release of Carbon Dioxide from Arctic Tundra Ecosystems in Alaska, Ecosystems, 20, 960–974, https://doi.org/10.1007/s10021-016-0085-9, 2017.
Fisher, J. B., Sikka, M., Oechel, W. C., Huntzinger, D. N., Melton, J. R., Koven, C. D., Ahlström, A., Arain, M. A., Baker, I., Chen, J. M., Ciais, P., Davidson, C., Dietze, M., El-Masri, B., Hayes, D., Huntingford, C., Jain, A. K., Levy, P. E., Lomas, M. R., Poulter, B., Price, D., Sahoo, A. K., Schaefer, K., Tian, H., Tomelleri, E., Verbeeck, H., Viovy, N., Wania, R., Zeng, N., and Miller, C. E.: Carbon cycle uncertainty in the Alaskan Arctic, Biogeosciences, 11, 4271–4288, https://doi.org/10.5194/bg-11-4271-2014, 2014.
Forkel, M., Carvalhais, N., Rodenbeck, C., Keeling, R., Heimann, M., Thonicke, K., Zaehle, S. and Reichstein, M.: Enhanced seasonal CO2 exchange caused by amplified plant productivity in northern ecosystems, Science, 351, 696–699, https://doi.org/10.1126/science.aac4971, 2016.
Friedman, J., Hastie, T., and Tibshirani, R.: Additive Logistic Regression: A Statistical View of Boosting, Ann. Stat., 28, 337–407, 2000.
Gelaro, R., McCarty, W., Suárez, M. J., Todling, R., Molod, A., Takacs, L., Randles, C. A., Darmenov, A., Bosilovich, M. G., Reichle, R., Wargan, K., Coy, L., Cullather, R., Draper, C., Akella, S., Buchard, V., Conaty, A., da Silva, A. M., Gu, W., Kim, G.-K., Koster, R., Lucchesi, R., Merkova, D., Nielsen, J. E., Partyka, G., Pawson, S., Putman, W., Rienecker, M., Schubert, S. D., Sienkiewicz, M., and Zhao, B.: The Modern-Era Retrospective Analysis for Research and Applications, Version 2 (MERRA-2), J. Climate, 30, 5419–5454, https://doi.org/10.1175/JCLI-D-16-0758.1, 2017.
Goodrich, J. P., Oechel, W. C., Gioli, B., Moreaux, V., Murphy, P. C., Burba, G., and Zona, D.: Impact of different eddy covariance sensors, site set-up, and maintenance on the annual balance of CO2 and CH4 in the harsh Arctic environment, Agr. Forest Meteorol., 228–229, 239–251, https://doi.org/10.1016/j.agrformet.2016.07.008, 2016.
Grant, R. F., Mekonnen, Z. A., Riley, W. J., Wainwright, H. M., Graham, D., and Torn, M. S.: Mathematical Modelling of Arctic Polygonal Tundra with Ecosys: 1. Microtopography Determines How Active Layer Depths Respond to Changes in Temperature and Precipitation: Active Layer Depth in Polygonal Tundra, J. Geophys. Res.-Biogeo., 122, 3161–3173, https://doi.org/10.1002/2017JG004035, 2017a.
Grant, R. F., Mekonnen, Z. A., Riley, W. J., Arora, B., and Torn, M. S.: Mathematical Modelling of Arctic Polygonal Tundra with Ecosys: 2. Microtopography Determines How CO2 and CH4 Exchange Responds to Changes in Temperature and Precipitation: GHG Exchange in Arctic Polygonal Tundra, J. Geophys. Res.-Biogeo., 122, 3174–3187, https://doi.org/10.1002/2017JG004037, 2017b.
Graven, H. D., Keeling, R. F., Piper, S. C., Patra, P. K., Stephens, B. B., Wofsy, S. C., Welp, L. R., Sweeney, C., Tans, P. P., Kelley, J. J., Daube, B. C., Kort, E. A., Santoni, G. W., and Bent, J. D.: Enhanced Seasonal Exchange of CO2 by Northern Ecosystems Since 1960, Science, 341, 1085–1089, https://doi.org/10.1126/science.1239207, 2013.
Hall, D. K. and Riggs, G. A.: MODIS/Terra Snow Cover 8-Day L3 Global 500m Grid, Version 6, NASA National Snow and Ice Data Center Distributed Active Archive Center, Boulder, Colorado USA, https://doi.org/10.5067/MODIS/MOD10A2.006, 2016.
Hicks Pries, C. E., van Logtestijn, R. S. P., Schuur, E. A. G., Natali, S. M., Cornelissen, J. H. C., Aerts, R., and Dorrepaal, E.: Decadal warming causes a consistent and persistent shift from heterotrophic to autotrophic respiration in contrasting permafrost ecosystems, Glob. Change Biol., 21, 4508–4519, https://doi.org/10.1111/gcb.13032, 2015.
Hobbie, S. E., Schimel, J. P., Trumbore, S. E., and Randerson, J. R.: Controls over carbon storage and turnover in high-latitude soils, Glob. Change Biol., 6, 196–210, https://doi.org/10.1046/j.1365-2486.2000.06021.x, 2000.
Hori, M., Sugiura, K., Kobayashi, K., Aoki, T., Tanikawa, T., Kuchiki, K., Niwano, M., and Enomoto, H.: A 38-year (1978–2015) Northern Hemisphere daily snow cover extent product derived using consistent objective criteria from satellite-borne optical sensors, Remote Sens. Environ., 191, 402–418, https://doi.org/10.1016/j.rse.2017.01.023, 2017.
Humphreys, E. R. and Lafleur, P. M.: Does earlier snowmelt lead to greater CO2 sequestration in two low Arctic tundra ecosystems?, Geophys. Res. Lett., 38, L09703, https://doi.org/10.1029/2011GL047339, 2011.
Ikawa, H., Nakai, T., Busey, R. C., Kim, Y., Kobayashi, H., Nagai, S., Ueyama, M., Saito, K., Nagano, H., Suzuki, R., and Hinzman, L.: Understory CO2, sensible heat, and latent heat fluxes in a black spruce forest in interior Alaska, Agr. Forest Meteorol., 214–215, 80–90, https://doi.org/10.1016/j.agrformet.2015.08.247, 2015.
Jackson, R. B., Canadell, J., Ehleringer, J. R., Mooney, H. A., Sala, O. E., and Schulze, E. D.: A global analysis of root distributions for terrestrial biomes, Oecologia, 108, 389–411, https://doi.org/10.1007/BF00333714, 1996.
Jeganathan, C., Dash, J., and Atkinson, P. M.: Remotely sensed trends in the phenology of northern high latitude terrestrial vegetation, controlling for land cover change and vegetation type, Remote Sens. Environ., 143, 154–170, https://doi.org/10.1016/j.rse.2013.11.020, 2014.
Jin, S., Yang, L., Danielson, P., Homer, C., Fry, J., and Xian, G.: A comprehensive change detection method for updating the National Land Cover Database to circa 2011, Remote Sens. Environ., 132, 159–175, https://doi.org/10.1016/j.rse.2013.01.012, 2013.
Ju, J. and Masek, J. G.: The vegetation greenness trend in Canada and US Alaska from 1984–2012 Landsat data, Remote Sens. Environ., 176, 1–16, https://doi.org/10.1016/j.rse.2016.01.001, 2016.
Karjalainen, O., Luoto, M., Aalto, J., and Hjort, J.: New insights into the environmental factors controlling the ground thermal regime across the Northern Hemisphere: a comparison between permafrost and non-permafrost areas, The Cryosphere, 13, 693–707, https://doi.org/10.5194/tc-13-693-2019, 2019.
Kim, Y., Kimball, J. S., Robinson, D. A., and Derksen, C.: New satellite climate data records indicate strong coupling between recent frozen season changes and snow cover over high northern latitudes, Environ. Res. Lett., 10, 084004, https://doi.org/10.1088/1748-9326/10/8/084004, 2015.
Koven, C. D., Riley, W. J., Subin, Z. M., Tang, J. Y., Torn, M. S., Collins, W. D., Bonan, G. B., Lawrence, D. M., and Swenson, S. C.: The effect of vertically resolved soil biogeochemistry and alternate soil C and N models on C dynamics of CLM4, Biogeosciences, 10, 7109–7131, https://doi.org/10.5194/bg-10-7109-2013, 2013a.
Koven, C. D., Riley, W. J., and Stern, A.: Analysis of Permafrost Thermal Dynamics and Response to Climate Change in the CMIP5 Earth System Models, J. Climate, 26, 1877–1900, https://doi.org/10.1175/JCLI-D-12-00228.1, 2013b.
Kumar, J., Collier, N., Bisht, G., Mills, R. T., Thornton, P. E., Iversen, C. M., and Romanovsky, V.: Modeling the spatiotemporal variability in subsurface thermal regimes across a low-relief polygonal tundra landscape, The Cryosphere, 10, 2241–2274, https://doi.org/10.5194/tc-10-2241-2016, 2016.
Liljedahl, A. K., Boike, J., Daanen, R. P., Fedorov, A. N., Frost, G. V., Grosse, G., Hinzman, L. D., Iijma, Y., Jorgenson, J. C., Matveyeva, N., Necsoiu, M., Raynolds, M. K., Romanovsky, V. E., Schulla, J., Tape, K. D., Walker, D. A., Wilson, C. J., Yabuki, H., and Zona, D.: Pan-Arctic ice-wedge degradation in warming permafrost and its influence on tundra hydrology, Nat. Geosci., 9, 312–318, https://doi.org/10.1038/ngeo2674, 2016.
Lüers, J., Westermann, S., Piel, K., and Boike, J.: Annual CO2 budget and seasonal CO2 exchange signals at a high Arctic permafrost site on Spitsbergen, Svalbard archipelago, Biogeosciences, 11, 6307–6322, https://doi.org/10.5194/bg-11-6307-2014, 2014.
Lund, M., Falk, J. M., Friborg, T., Mbufong, H. N., Sigsgaard, C., Soegaard, H., and Tamstorf, M. P.: Trends in CO2 exchange in a high Arctic tundra heath, 2000–2010, J. Geophys. Res., 117, G02001, https://doi.org/10.1029/2011JG001901, 2012.
Mastepanov, M., Sigsgaard, C., Tagesson, T., Ström, L., Tamstorf, M. P., Lund, M., and Christensen, T. R.: Revisiting factors controlling methane emissions from high-Arctic tundra, Biogeosciences, 10, 5139–5158, https://doi.org/10.5194/bg-10-5139-2013, 2013.
McGuire, A. D., Koven, C., Lawrence, D. M., Clein, J. S., Xia, J., Beer, C., Burke, E., Chen, G., Chen, X., Delire, C., Jafarov, E., MacDougall, A. H., Marchenko, S., Nicolsky, D., Peng, S., Rinke, A., Saito, K., Zhang, W., Alkama, R., Bohn, T. J., Ciais, P., Decharme, B., Ekici, A., Gouttevin, I., Hajima, T., Hayes, D. J., Ji, D., Krinner, G., Lettenmaier, D. P., Luo, Y., Miller, P. A., Moore, J. C., Romanovsky, V., Schädel, C., Schaefer, K., Schuur, E. A. G., Smith, B., Sueyoshi, T., and Zhuang, Q.: Variability in the sensitivity among model simulations of permafrost and carbon dynamics in the permafrost region between 1960 and 2009, Global Biogeochem. Cy., 30, 1015–1037, https://doi.org/10.1002/2016GB005405, 2016.
Mishra, U. and Riley, W. J.: Scaling impacts on environmental controls and spatial heterogeneity of soil organic carbon stocks, Biogeosciences, 12, 3993–4004, https://doi.org/10.5194/bg-12-3993-2015, 2015.
Mishra, U., Drewniak, B., Jastrow, J. D., Matamala, R. M., and Vitharana, U. W. A.: Spatial representation of organic carbon and active-layer thickness of high latitude soils in CMIP5 earth system models, Geoderma, 300, 55–63, https://doi.org/10.1016/j.geoderma.2016.04.017, 2017.
Natali, S. M., Schuur, E. A. G., Trucco, C., Hicks Pries, C. E., Crummer, K. G., and Baron Lopez, A. F.: Effects of experimental warming of air, soil and permafrost on carbon balance in Alaskan tundra: Warming of Alaskan Tundra, Glob. Change Biol., 17, 1394–1407, https://doi.org/10.1111/j.1365-2486.2010.02303.x, 2011.
Natali, S. M., Watts, J. D., Rogers, B. M., Potter, S., Ludwig, S. M., Selbmann, A.-K., Sullivan, P. F., Abbott, B. W., Arndt, K. A., Birch, L., Björkman, M. P., Bloom, A. A., Celis, G., Christensen, T. R., Christiansen, C. T., Commane, R., Cooper, E. J., Crill, P., Czimczik, C., Davydov, S., Du, J., Egan, J. E., Elberling, B., Euskirchen, E. S., Friborg, T., Genet, H., Göckede, M., Goodrich, J. P., Grogan, P., Helbig, M., Jafarov, E. E., Jastrow, J. D., Kalhori, A. A. M., Kim, Y., Kimball, J. S., Kutzbach, L., Lara, M. J., Larsen, K. S., Lee, B.-Y., Liu, Z., Loranty, M. M., Lund, M., Lupascu, M., Madani, N., Malhotra, A., Matamala, R., McFarland, J., McGuire, A. D., Michelsen, A., Minions, C., Oechel, W. C., Olefeldt, D., Parmentier, F.-J. W., Pirk, N., Poulter, B., Quinton, W., Rezanezhad, F., Risk, D., Sachs, T., Schaefer, K., Schmidt, N. M., Schuur, E. A. G., Semenchuk, P. R., Shaver, G., Sonnentag, O., Starr, G., Treat, C. C., Waldrop, M. P., Wang, Y., Welker, J., Wille, C., Xu, X., Zhang, Z., Zhuang, Q., and Zona, D.: Large loss of CO2 in winter observed across the northern permafrost region, Nat. Clim. Change, 9, 852–857, https://doi.org/10.1038/s41558-019-0592-8, 2019a.
Natali, S., Watts, J. D., Potter, S., Rogers, B. M., Ludwig, S., Selbmann, A., Sullivan, P., Abbott, B., Arndt, K., Bloom, A. A.,Celis, G., Christensen, T., Christiansen, C., Commane, R., Cooper, E., Crill, P. M., Czimczik, C. I., Davydov, S., Du, J., Egan, J., Elberling, B., Euskirchen, S. E., Friborg, T., Genet, H., Goodrich, J., Grogan, P., Helbig, M., Jafarov, E., Jastrow, J., Kalhori, A., Kim, Y., Kimball, J. S., Kutzbach, L., Lara, M., Larsen, K., Lee, B., Liu, Z., Loranty, M. M., Lund, M., Lupascu, M., Madani, N., Malhotra, A., Matamala, R., McFarland, J., McGuire, A., Michelsen, A., Minions, C., Oechel, W., Olefeldt, D., Parmentier, F., Pirk, N., Poulter, B., Quinton, W., Rezanezhad, F., Risk, D., Sachs, T., Schaefer, K., Schmidt, N., Schuur, E., Semenchuk, P., Shaver, G., Sonnentag, O., Starr, G., Treat, C., Waldrop, M., Wang, Y., Welker, J., Wille, C., Xu, X., Zhang, Z., Zhuang, Q., and Zona D.: Synthesis of Winter In Situ Soil CO2 Flux in pan-Arctic and Boreal Regions, 1989–2017, ORNL DAAC, Oak Ridge, Tennessee, USA, https://doi.org/10.3334/ORNLDAAC/1692, 2019b.
Oechel, W. C., Vourlitis, G., and Hastings, S. J.: Cold season CO2 emission from Arctic soils, Global Biogeochem. Cy., 11, 163–172, https://doi.org/10.1029/96GB03035, 1997.
Outcalt, S. I., Nelson, F. E., and Hinkel, K. M.: The zero-curtain effect: Heat and mass transfer across an isothermal region in freezing soil, Water Res. Res., 26, 1509–1516, https://doi.org/10.1029/WR026i007p01509, 1990.
Parazoo, N. C., Commane, R., Wofsy, S. C., Koven, C. D., Sweeney, C., Lawrence, D. M., Lindaas, J., Chang, R. Y.-W., and Miller, C. E.: Detecting regional patterns of changing CO2 flux in Alaska, P. Natl. Acad. Sci. USA, 113, 7733–7738, https://doi.org/10.1073/pnas.1601085113, 2016.
Parazoo, N. C., Koven, C. D., Lawrence, D. M., Romanovsky, V., and Miller, C. E.: Detecting the permafrost carbon feedback: talik formation and increased cold-season respiration as precursors to sink-to-source transitions, The Cryosphere, 12, 123–144, https://doi.org/10.5194/tc-12-123-2018, 2018.
Park, H., Kim, Y., and Kimball, J. S.: Widespread permafrost vulnerability and soil active layer increases over the high northern latitudes inferred from satellite remote sensing and process model assessments, Remote Sens. Environ., 175, 349–358, https://doi.org/10.1016/j.rse.2015.12.046, 2016.
Parmentier, F. J. W., van der Molen, M. K., van Huissteden, J., Karsanaev, S. A., Kononov, A. V., Suzdalov, D. A., Maximov, T. C., and Dolman, A. J.: Longer growing seasons do not increase net carbon uptake in the northeastern Siberian tundra, J. Geophys. Res., 116, G04013, https://doi.org/10.1029/2011JG001653, 2011.
Pastick, N. J., Jorgenson, M. T., Wylie, B. K., Nield, S. J., Johnson, K. D., and Finley, A. O.: Distribution of near-surface permafrost in Alaska: Estimates of present and future conditions, Remote Sens. Environ., 168, 301–315, https://doi.org/10.1016/j.rse.2015.07.019, 2015.
Paul, K. I., Polglase, P. J., Smethurst, P. J., O'Connell, A. M., Carlyle, C. J., and Khanna, P. K.: Soil temperature under forests: a simple model for predicting soil temperature under a range of forest types, Agr. Forest Meteorol., 121, 167–182, https://doi.org/10.1016/j.agrformet.2003.08.030, 2004.
Phillips, C. L., Bond-Lamberty, B., Desai, A. R., Lavoie, M., Risk, D., Tang, J., Todd-Brown, K., and Vargas, R.: The value of soil respiration measurements for interpreting and modeling terrestrial carbon cycling, Plant Soil, 413, 1–25, https://doi.org/10.1007/s11104-016-3084-x, 2017.
Pulliainen, J., Aurela, M., Laurila, T., Aalto, T., Takala, M., Salminen, M., Kulmala, M., Barr, A., Heimann, M., Lindroth, A., Laaksonen, A., Derksen, C., Mäkelä, A., Markkanen, T., Lemmetyinen, J., Susiluoto, J., Dengel, S., Mammarella, I., Tuovinen, J.-P. and Vesala, T.: Early snowmelt significantly enhances boreal springtime carbon uptake, P. Natl. Acad. Sci. USA, 114, 11081–11086, https://doi.org/10.1073/pnas.1707889114, 2017.
Rawlins, M. A., Nicolsky, D. J., McDonald, K. C., and Romanovsky, V. E.: Simulating soil freeze/thaw dynamics with an improved pan-Arctic water balance model: Soil Freeze/Thaw Modeling, J. Adv. Model.-Earth, 5, 659–675, https://doi.org/10.1002/jame.20045, 2013.
Raz-Yaseef, N., Torn, M. S., Wu, Y., Billesbach, D. P., Liljedahl, A. K., Kneafsey, T. J., Romanovsky, V. E., Cook, D. R., and Wullschleger, S. D.: Large CO2 and CH4 emissions from polygonal tundra during spring thaw in northern Alaska: Spring Pulse Emission, Geophys. Res. Lett., 44, 504–513, https://doi.org/10.1002/2016GL071220, 2017.
Reichle, R. H., Draper, C. S., Liu, Q., Girotto, M., Mahanama, S. P. P., Koster, R. D., and De Lannoy, G. J. M.: Assessment of MERRA-2 Land Surface Hydrology Estimates, J. Climate, 30, 2937–2960, https://doi.org/10.1175/JCLI-D-16-0720.1, 2017.
Schaefer, K. and Jafarov, E.: A parameterization of respiration in frozen soils based on substrate availability, Biogeosciences, 13, 1991–2001, https://doi.org/10.5194/bg-13-1991-2016, 2016.
Schuur, E. A. G., McGuire, A. D., Schädel, C., Grosse, G., Harden, J. W., Hayes, D. J., Hugelius, G., Koven, C. D., Kuhry, P., Lawrence, D. M., Natali, S. M., Olefeldt, D., Romanovsky, V. E., Schaefer, K., Turetsky, M. R., Treat, C. C., and Vonk, J. E.: Climate change and the permafrost carbon feedback, Nature, 520, 171–179, https://doi.org/10.1038/nature14338, 2015.
Slater, A. G., Lawrence, D. M., and Koven, C. D.: Process-level model evaluation: a snow and heat transfer metric, The Cryosphere, 11, 989–996, https://doi.org/10.5194/tc-11-989-2017, 2017.
Sulla-Menashe, D., Woodcock, C. E., and Friedl, M. A.: Canadian boreal forest greening and browning trends: an analysis of biogeographic patterns and the relative roles of disturbance versus climate drivers, Environ. Res. Lett., 13, 014007, https://doi.org/10.1088/1748-9326/aa9b88, 2018.
Tao, J., Koster, R. D., Reichle, R. H., Forman, B. A., Xue, Y., Chen, R. H., and Moghaddam, M.: Permafrost variability over the Northern Hemisphere based on the MERRA-2 reanalysis, The Cryosphere, 13, 2087–2110, https://doi.org/10.5194/tc-13-2087-2019, 2019.
Thornton, P. E., Law, B. E., Gholz, H. L., Clark, K. L., Falge, E., Ellsworth, D. S., Goldstein, A. H., Monson, R. K., Hollinger, D., Falk, M., Chen, J., and Sparks, J. P.: Modeling and measuring the effects of disturbance history and climate on carbon and water budgets in evergreen needleleaf forests, Agr. For. Meteorol., 113, 185–222, https://doi.org/10.1016/S0168-1923(02)00108-9, 2002.
Tucker, C. L., Young, J. M., Williams, D. G., and Ogle, K.: Process-based isotope partitioning of winter soil respiration in a subalpine ecosystem reveals importance of rhizospheric respiration, Biogeochemistry, 121, 389–408, https://doi.org/10.1007/s10533-014-0008-9, 2014.
Ueyama, M., Iwata, H., and Harazono, Y.: Autumn warming reduces the CO2 sink of a black spruce forest in interior Alaska based on a nine-year eddy covariance measurement, Glob. Change Biol., 20, 1161–1173, https://doi.org/10.1111/gcb.12434, 2014.
Verhoef, W., Jia, L., Xiao, Q., and Su, Z.: Unified Optical-Thermal Four-Stream Radiative Transfer Theory for Homogeneous Vegetation Canopies, IEEE T. Geosci. Remote S., 45, 1808–1822, https://doi.org/10.1109/TGRS.2007.895844, 2007.
Walvoord, M. A. and Kurylyk, B. L.: Hydrologic Impacts of Thawing Permafrost-A Review, Vadose Zone J., 15, vzj2016.01.0010, https://doi.org/10.2136/vzj2016.01.0010, 2016.
Wan Z. S. H. and Hulley, G.: MOD11A2 MODIS/Terra Land Surface Temperature/Emissivity 8-Day L3 Global 1km SIN Grid V006, NASA EOSDIS Land Processes DAAC, https://doi.org/10.5067/MODIS/MOD11A2.006, 2015.
Webb, E. E., Schuur, E. A. G., Natali, S. M., Oken, K. L., Bracho, R., Krapek, J. P., Risk, D., and Nickerson, N. R.: Increased wintertime CO2 loss as a result of sustained tundra warming: Tundra Wintertime CO2 Loss, J. Geophys. Res.-Biogeosci., 121, 249–265, https://doi.org/10.1002/2014JG002795, 2016.
Wenzel, S., Cox, P. M., Eyring, V., and Friedlingstein, P.: Projected land photosynthesis constrained by changes in the seasonal cycle of atmospheric CO2, Nature, 538, 499–501, https://doi.org/10.1038/nature19772, 2016.
Yi, Y.: STM-C: A remote sensing driven permafrost carbon model software, GitHub, available at: https://github.com/yiyh05/STM-C, last access: 30 July 2020.
Yi, Y., Kimball, J. S., Rawlins, M. A., Moghaddam, M., and Euskirchen, E. S.: The role of snow cover affecting boreal-arctic soil freeze–thaw and carbon dynamics, Biogeosciences, 12, 5811–5829, https://doi.org/10.5194/bg-12-5811-2015, 2015.
Yi, Y., Kimball, J. S., Chen, R. H., Moghaddam, M., Reichle, R. H., Mishra, U., Zona, D., and Oechel, W. C.: Characterizing permafrost active layer dynamics and sensitivity to landscape spatial heterogeneity in Alaska, The Cryosphere, 12, 145–161, https://doi.org/10.5194/tc-12-145-2018, 2018.
Yi, Y., Kimball, J. S., Chen, R. H., Moghaddam, M., and Miller, C. E.: Sensitivity of active-layer freezing process to snow cover in Arctic Alaska, The Cryosphere, 13, 197–218, https://doi.org/10.5194/tc-13-197-2019, 2019.
Zhang, T.: Influence of the seasonal snow cover on the ground thermal regime: An overview, Rev. Geophys., 43, RG4002, https://doi.org/10.1029/2004RG000157, 2005.
Zhang, X., Manzanedo, R. D., D'Orangeville, L., Rademacher, T. T., Li, J., Bai, X., Hou, M., Chen, Z., Zou, F., Song, F., and Pederson, N.: Snowmelt and early to mid-growing season water availability augment tree growth during rapid warming in southern Asian boreal forests, Glob. Change Biol., 25, 3462–3471, https://doi.org/10.1111/gcb.14749, 2019.
Zheng, G., Yang, Y., Yang, D., Dafflon, B., Yi, Y., Zhang, S., Chen, D., Gao, B., Wang, T., Shi, R., and Wu, Q.: Remote sensing spatiotemporal patterns of frozen soil and the environmental controls over the Tibetan Plateau during 2002–2016, Remote Sens. Environ., 247, 111927, https://doi.org/10.1016/j.rse.2020.111927, 2020.
Zona, D., Lipson, D. A., Zulueta, R. C., Oberbauer, S. F., and Oechel, W. C.: Microtopographic controls on ecosystem functioning in the Arctic Coastal Plain, J. Geophys. Res., 116, G00I08, https://doi.org/10.1029/2009JG001241, 2011.
Zona, D., Gioli, B., Commane, R., Lindaas, J., Wofsy, S. C., Miller, C. E., Dinardo, S. J., Dengel, S., Sweeney, C., Karion, A., Chang, R. Y.-W., Henderson, J. M., Murphy, P. C., Goodrich, J. P., Moreaux, V., Liljedahl, A., Watts, J. D., Kimball, J. S., Lipson, D. A., and Oechel, W. C.: Cold season emissions dominate the Arctic tundra methane budget, P. Natl. Acad. Sci. USA, 113, 40–45, https://doi.org/10.1073/pnas.1516017113, 2016.