the Creative Commons Attribution 4.0 License.
the Creative Commons Attribution 4.0 License.
 | 02 Dec 2020
Biogeochemical impact of cable bacteria on coastal Black Sea sediment
Martijn Hermans
Nils Risgaard-Petersen
Filip J. R. Meysman
Caroline P. Slomp
Cable bacteria can strongly alter sediment biogeochemistry. Here, we used laboratory incubations to determine the potential impact of their activity on the cycling of iron (Fe), phosphorus (P) and sulfur (S). Microsensor depth profiles of oxygen, sulfide and pH in combination with electric potential profiling and fluorescence in situ hybridisation (FISH) analyses showed a rapid development (<5 d) of cable bacteria, followed by a long period of activity (>200 d). During most of the experiment, the current density correlated linearly with the oxygen demand. Sediment oxygen uptake was attributed to the activity of cable bacteria and the oxidation of reduced products from the anaerobic degradation of organic matter, such as ammonium. Pore water sulfide was low (< 5 µM) throughout the experiment. Sulfate reduction acted as the main source of sulfide for cable bacteria. Pore water Fe2+ reached levels of up to 1.7 mM during the incubations, due to the dissolution of FeS (30 %) and siderite, an Fe carbonate mineral (70 %). Following the upward diffusion of Fe2+, a surface enrichment of Fe oxides formed. Hence, besides FeS, siderite may act as a major source of Fe for Fe oxides in coastal surface sediments where cable bacteria are active. Using µXRF, we show that the enrichments in Fe oxides induced by cable bacteria are located in a thin subsurface layer of 0.3 mm. We show that similar subsurface layers enriched in Fe and P are also observed at field sites where cable bacteria were recently active and little bioturbation occurs. This suggests that such subsurface Fe oxide layers, which are not always visible to the naked eye, could potentially be a marker for recent activity of cable bacteria.
- Article
(4545 KB) - Full-text XML
-
Supplement
(977 KB) - BibTeX
- EndNote


Depletion of oxygen (O2) in the bottom waters (i.e. water directly above the seafloor) of coastal areas is increasing worldwide, as a consequence of eutrophication and climate change (Diaz and Rosenberg, 2008; Breitburg et al., 2018; Schmidtko et al., 2017). Low O2 can lead to the development of coastal dead zones characterised by recurrent mortality of marine life (Diaz and Rosenberg, 2008; Rabalais et al., 2002). Progressive eutrophication induces a characteristic response of coastal systems with transient and seasonal hypoxia (O2 < 63 µM) transitioning into permanent anoxia (O2 = 0 µM). In this later stage, free sulfide (H2S) may escape from the sediment and accumulate in the bottom water, a condition referred to as euxinia (Diaz and Rosenberg, 2008; Kemp et al., 2009; Rabalais et al., 2014). As H2S is highly toxic to higher fauna, the development of euxinia may aggravate the ecological consequences. However, the presence of iron (Fe) and manganese (Mn) oxides in surface sediments may delay this transition towards euxinia by removing H2S and, thus, preventing an efflux of H2S to the overlying water (Kristensen et al., 2003; Kristiansen et al., 2002; Diaz and Rosenberg, 2008).
Cable bacteria are multicellular filamentous sulfur (S)-oxidising bacteria (Pfeffer et al., 2012) that strongly enhance the formation of Fe and Mn oxides and efficiently remove H2S from surface sediments (Seitaj et al., 2015; Risgaard-Petersen et al., 2012; Sulu-Gambari et al., 2016a). Cable bacteria belong to the Desulfobulbaceae family of the Deltaproteobacteria (Trojan et al., 2016; Kjeldsen et al., 2019). Cable bacteria can spatially link the oxidation of H2S in deeper sediments to the reduction of O2 near the sediment–water interface by transporting electrons over centimetre-scale distances (Pfeffer et al., 2012) through a conductive fibre network that is embedded in the cell envelope (Meysman et al., 2019). This spatial coupling of surficial O2 reduction with H2S oxidation at a depth of several centimetres creates a suboxic zone that is devoid of any O2 and H2S, and provides cable bacteria with a competitive advantage over other S-oxidising bacteria in aquatic environments (Meysman, 2018). Cable bacteria have been documented in a range of fresh water (Risgaard-Petersen et al., 2015; Müller et al., 2016) and marine environments (Malkin et al., 2014; Burdorf et al., 2017); however, they appear to be particularly active in sediments overlain by seasonally hypoxic bottom waters (Seitaj et al., 2015; Burdorf et al., 2018).
The metabolic activity of cable bacteria establishes an electrical circuit in the sediment, which involves an electron current through the cable bacteria filaments (Bjerg et al., 2018) and an ionic current through the pore water in the opposite direction (Revil et al., 2010; Risgaard-Petersen et al., 2012; Naudet and Revil, 2005). As a consequence, an electric potential (EP) is generated in the sediment, which can be used as a reliable indicator for the activity of cable bacteria (Risgaard-Petersen et al., 2014).
Cable bacteria activity additionally generates a distinct biogeochemical signature that can be assessed by pH, O2 and H2S depth profiling (Nielsen et al., 2010). Their activity leads to the development of a suboxic zone (i.e. a zone where O2 and H2S are both absent) and also induces a pH profile that strongly changes with depth. Cathodic O2 reduction (O2 + 4H+ + 4e− → 2H2O) in the oxic zone of the sediment results in a pH maximum (∼9) due to proton consumption, whereas anodic sulfide oxidation (H2S + 4H2O → SO + 10H+ + 8e−) causes a pH minimum (< 6.5) in the anoxic zone (Fig. 1a; Nielsen et al., 2010; Meysman et al., 2015).
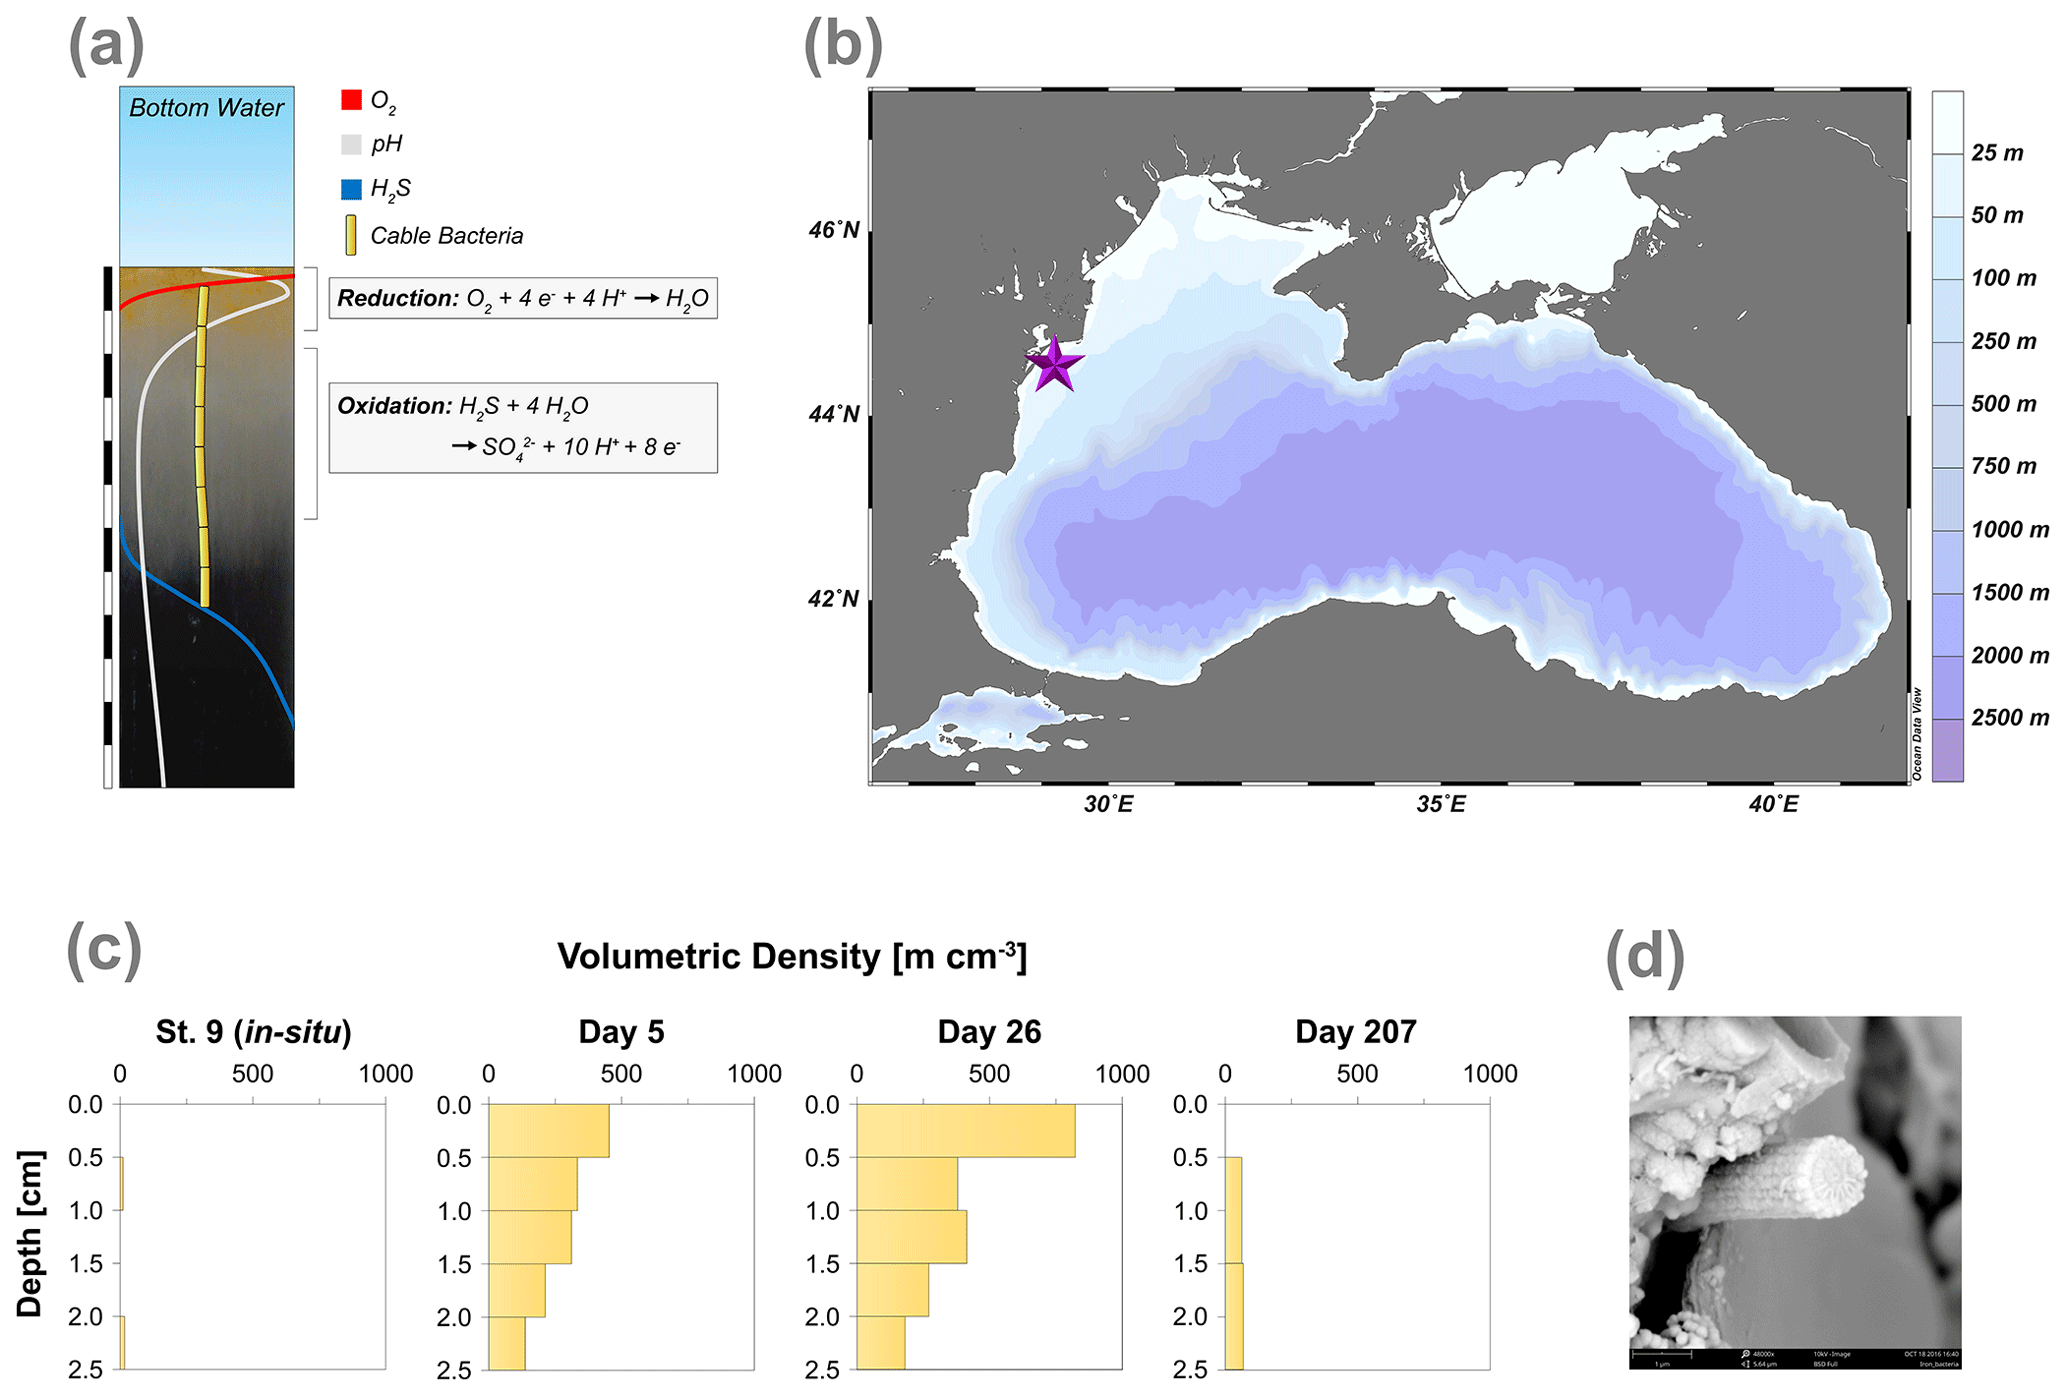
Figure 1(a) Geochemical pore water fingerprint typical for cable bacteria activity. This fingerprint is defined by a distinct pH profile (light grey line) and a sub-oxic zone that is devoid of O2 (red line) and H2S (blue line). The cable bacteria filaments are depicted in yellow. In the background, the sediment core photograph, taken 278 d after the start of the experiment, shows a distinct colour zonation where (1) the oxic zone displays an orange colour, (2) the suboxic zone has a grey colour and (3) the sulfidic zone has a black colour. The scale bar denotes a distance of 6 cm, with 0.5 cm intervals. (b) Bathymetric map of the Black Sea. The purple star indicates the location of our study site (44∘34.93′ N, 29∘11.38′ E), which was sampled with research vessel (R/V) Pelagia in September 2015. Further details are provided in Lenstra et al. (2019). (c) Volumetric density of cable bacteria (m cm−3) in the top 2.5 cm of the sediment, for in situ and for three time points during the incubation experiment. (d) Scanning electron microscopy (SEM) image of a cable bacteria filament that was extracted from the surface sediment after 40 d.
The presence of cable bacteria in sediments can strongly impact the elemental cycling of Fe, Mn, calcium (Ca) and S (Risgaard-Petersen et al., 2012; van de Velde et al., 2016; Seitaj et al., 2015; Sulu-Gambari et al., 2016a; Rao et al., 2016). Pore water acidification induced by cable bacteria activity can lead to the dissolution of calcium carbonates, Fe carbonates (siderite), Mn carbonates and FeS in the zone where the pH is low, thus generating high concentrations of Fe2+ and Mn2+ in the pore water (Rao et al., 2016; Risgaard-Petersen et al., 2012). When these dissolved species diffuse upwards, this can lead to strong enrichments of Fe and Mn oxides, upon contact with O2, or for dissolved Fe2+, also upon contact with Mn oxides (Seitaj et al., 2015; Sulu-Gambari et al., 2016a; Wang and Van Cappellen, 1996). These metal oxides are capable of efficiently buffering the benthic release of H2S and phosphate (HPO) during periods with low bottom water O2. This so-called firewall for H2S and the alteration of the timing of the HPO release linked to this buffering can play a key role in regulating water quality in seasonally hypoxic coastal systems (Seitaj et al., 2015; Hermans et al., 2019a; Sulu-Gambari et al., 2016b).
In coastal sediments, O2 typically penetrates to a depth of only several millimetres below the sediment–water interface (Glud, 2008; Rabouille et al., 2003; Rasmussen and Jørgensen, 1992). This also holds true for sediments inhabited by active cable bacteria (Pfeffer et al., 2012; Larsen et al., 2015; Nielsen et al., 2010). Hence, the oxidation of upward-diffusing Fe2+ and Mn2+ is expected to take place below, and not at, the sediment–water interface. We hypothesise that, as a consequence, in the initial stages of cable bacteria activity and in the absence of bioturbation, most Fe and Mn oxide enrichments will be restricted to a thin subsurface layer of the sediment. However, the sample resolution and timing of the collection of solid-phase data in field and laboratory studies published so far do not allow an assessment of this hypothesis.
Cable bacteria are said to thrive in coastal sediments characterised by high rates of H2S production due to high rates of organic matter mineralisation (Malkin et al., 2014; Burdorf et al., 2017; Hermans et al., 2019a). Laboratory and model studies have shown that the dissolution of FeS accounts for 12 % to 94 % of the H2S consumed by cable bacteria, while the other source is H2S production from the reduction in SO (Meysman et al., 2015; Risgaard-Petersen et al., 2012; Burdorf et al., 2018). At present, it is not known if cable bacteria activity can establish in sediments that are relatively low in FeS and dissolved H2S.
In this study, we assess whether cable bacteria activity can establish and thrive in sediments that are relatively poor in FeS. Although this will be done in a controlled incubation experiment with siderite-bearing sediments from a coastal site in the Black Sea, our findings are relevant for natural environments populated by cable bacteria. The metabolic activity of cable bacteria is monitored using microsensor profiles of pH, O2, H2S and EP. We also use sediment Fe and P speciation and µXRF of resin-embedded sediments to test whether we can find evidence for subsurface enrichments in Fe oxides and associated P. We found a rapid establishment of cable bacteria (< 5 d) and the development of an Fe oxide-rich subsurface layer, with the majority of the Fe ∼ 70 % supplied through dissolution of siderite induced by cable bacteria activity. The depth of the Fe oxide layer was directly related to the O2 penetration depth, and we propose that such subsurface enrichments in Fe, which also can contain P and Mn, can be used as a marker for recent cable bacteria activity.
2.1 Study area and experimental set-up
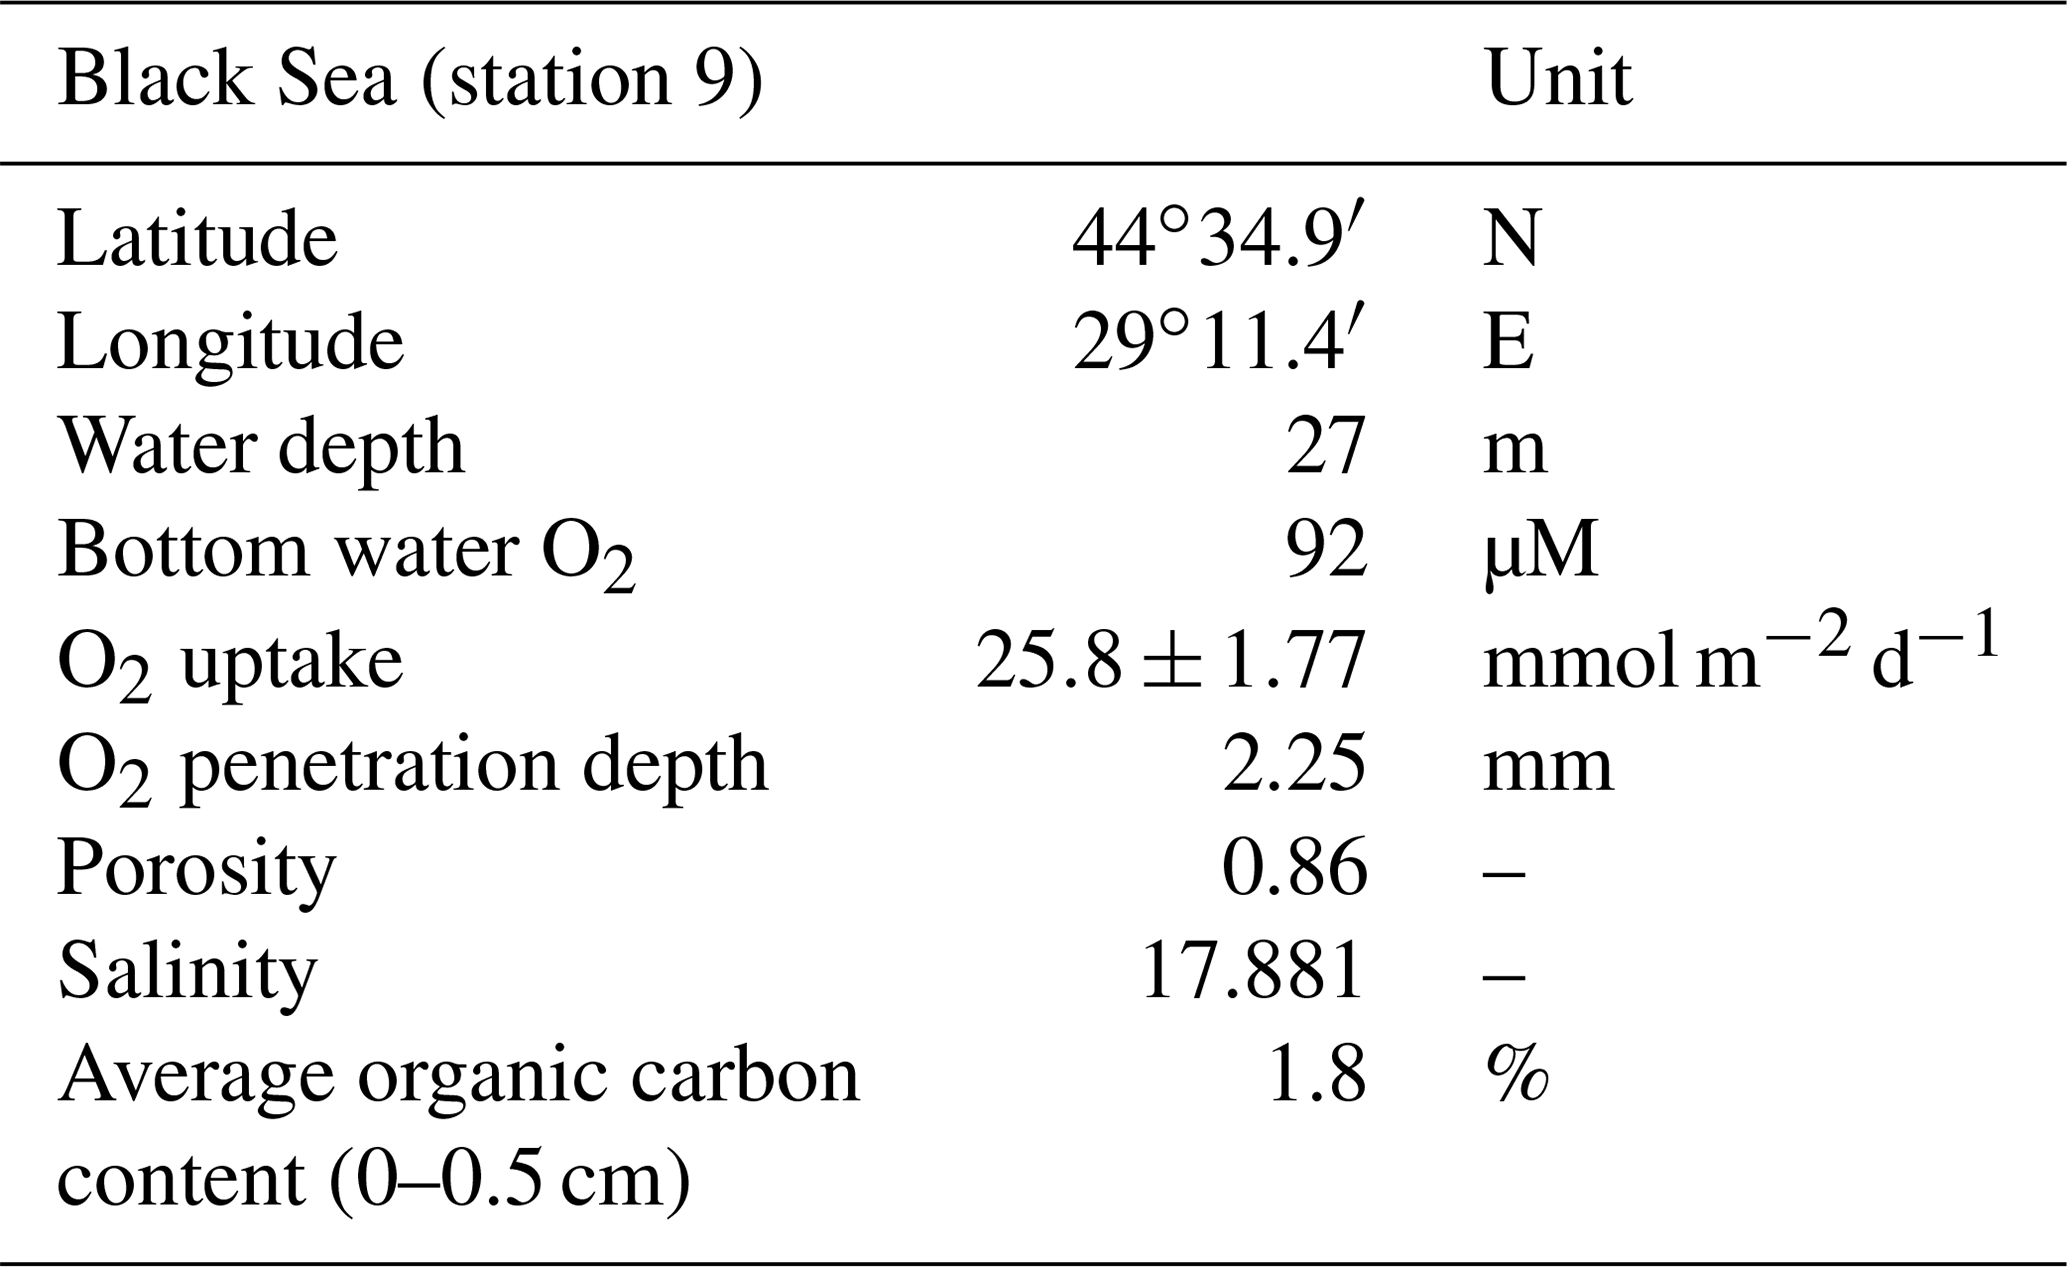
In September 2015, 16 sediment cores (ø 10 cm) were retrieved at a coastal site on the northwestern shelf of the Black Sea (27 m water depth; Fig. 1b; Table 1) using a multicorer (Oktopus GmbH, Germany) as described in Lenstra et al. (2019). The overlying water was discarded, and the upper 10 cm of the sediment was transferred into nitrogen-purged aluminium bags that were sealed and stored at 4 ∘C for several months. The anoxic storage is expected to have led to the death of all macrofauna and most meiofauna (Coull and Chandler, 2001; Riedel et al., 2012). Prior to incubation, the sediment was passed through a 4 mm sieve, to remove large debris, and homogenised. Subsequently, the sediment was transferred to 18 transparent polycarbonate cores (ø 6 cm; 20 cm length).
The bottom 15 cm of these cores was filled with sediment, and the upper 5 cm with overlying water. The cores were placed in two aquaria filled with artificial seawater (Instant Ocean sea salt and ultra high quality (UHQ) water) with a salinity of 17.9, identical to the bottom water salinity at the study site. The artificial seawater contained negligible concentrations of NH, NO, Fe, Mn and P, as described in Atkinson (1997) and Hovanec and Coshland (2004). The aquaria were kept in the dark at a constant temperature (∼ 20 ∘C), and the water was continuously aerated by two aquarium pumps. A total of 16 out of 18 cores were exposed to oxygenated overlying water in the aquaria, whereas the two remaining cores served as an anoxic control treatment. The control cores were tightly sealed with rubber stoppers to prevent the growth of cable bacteria by excluding O2 (Nielsen et al., 2010).
Table 1Key site characteristics, including latitude, longitude, water depth, bottom water O2 concentration, in situ O2 uptake, in situ O2 penetration depth in the sediment, porosity, salinity and average organic carbon content for the upper 0.5 cm of the sediment. These data were retrieved from Lenstra et al. (2019). Our study site is station 9 in Lenstra et al. (2019).
Sampling for pore water and solid-phase analyses was performed at eight time points over a total incubation period of 621 d. Each time point involved a 3 d procedure. On the first day, microsensor depth profiles of EP, O2, pH and H2S were obtained in two randomly selected oxic cores and the two anoxic control cores (O2 profiling was not performed in the anoxic cores). On the second day, solute fluxes were measured in the same oxic cores that were used for microsensor depth profiling on the previous day. On the third day, the two cores were sectioned, of which only one core was processed further for pore water and solid-phase analyses. Photographs were taken at four time points (day 12; 33; 170 and 621) from one oxic core to follow the visual development of the surface sediment during the experiment.
2.2 High-resolution microsensor depth profiling
High-resolution depth profiles of pH, O2 and H2S were obtained (50 µm depth resolution; three replicate profiles per oxic core; two replicate profiles per anoxic core) using commercial microelectrodes (Unisense A/S, Denmark). The O2 sensor was recalibrated prior to each measurement, using saturated bottom water (100 % [O2]) and the deeper sediment horizons (0 % [O2]) as calibration points. Calibrations of the pH and H2S electrodes were performed as described in Hermans et al. (2019b). The pH values are reported on the total scale. For depth profiling of EP (500 µm resolution; three replicates per core), microelectrodes were used that were custom built at Aarhus University, as described in Damgaard et al. (2014). A robust reference electrode (Ref-RM; Unisense, A/S, Denmark) was used during EP and pH measurements. To exclude turbulence-induced variations in the potential of the reference electrode during EP profiling, a silicon tube filled with foam was mounted on the tip of the reference electrode.
2.3 Solute flux measurements
Solute flux incubations were performed for NH, Fe2+, Mn2+, Ca2+, HPO and H4SiO4. At each time point, one core was placed outside the aquarium at 20 ∘C, and the isolated volume of overlying water in the core was continuously aerated. Potential stratification of the overlying water was prevented by actively bubbling it. Parafilm was wrapped on top of the cores to prevent evaporation. Water samples of 3 mL were retrieved at seven time points over 24 h. The same volume of fresh artificial seawater was added to the cores directly after taking each sample. The samples were filtered (0.45 µm), and subsamples were taken for ammonium (1 mL) and for metals (1 mL; acidified with 10 µL Suprapur® HCl (35 %) per mL sample), which were stored at −20 and 4 ∘C, respectively, until further analysis.
2.4 Pore water and sediment collection
At each time point, two cores were sectioned at 0.5–1 cm resolution with an Uwitec push-up pole in a nitrogen-purged glove bag, but only samples for one core were used for sediment and pore water collection and analyses. Bottom water samples were retrieved from the overlying water in the cores. Slices for each depth interval were centrifuged at 3500 revolutions per minute (rpm) for 20 min for pore water retrieval. Samples (1 mL) for NH were taken and stored at −20 ∘C until analysis. Samples (1 mL) for pore water S, Fe, Mn, Ca, P and Si were also collected and acidified with 10 µL Suprapur® HCl (35 %) per mL sample, which were stored at 4 ∘C until analysis. Centrifuged sediment samples were freeze-dried and ground to a fine powder in a nitrogen-purged glove box under a strictly anoxic environment to prevent oxidation (Kraal et al., 2009; Kraal and Slomp, 2014). Only the top 5 cm of the solid-phase samples were analysed in further detail. The porosity (Sect. S1.1; Table S1) was calculated from the weight loss upon freeze-drying, using a sediment density of 2.65 g cm−3 (Burdige, 2006). Salt corrections were performed on the solid-phase data using the gravimetric water content and salinity to determine the amount of salt after freeze-drying. After freeze-drying, the salt from the seawater stays behind in the solid-phase fraction. To determine the actual weight of the dry sediment, it is necessary to subtract the weight of the salt from the total weight of freeze-dried sediment.
2.5 Chemical analysis of the water and sediment
Concentrations of NH in the pore water and solute flux samples were determined using the phenol hypochlorite method (Koroleff, 1969). The total Fe, Mn, Ca, P and Si concentrations (which are assumed to represent Fe2+, Mn2+, Ca2+, HPO and H4SiO4) in the pore water and solute flux samples were determined using inductively coupled plasma–optical emission spectroscopy (ICP–OES; Spectro Arcos). Dissolved Fe and Mn are assumed to be present in the form of Fe2+ and Mn2+; however, some Mn3+ (Madison et al., 2013) or colloidal and nanoparticulate Fe and Mn might also be available (Boyd and Ellwood, 2010; Raiswell and Canfield, 2012). Concentrations of P and S are assumed to represent HPO and SO, respectively. The colourimetric detection limit for NH was 0.5 µM. The practical detection limit on the ICP–OES for Fe, Mn and P was 0.73, 0.11 and 7.30 µM, respectively.
Solid-phase Fe was fractionated into (1) labile ferric Fe (hydr)oxides and ferrous Fe (FeS + FeCO3), (2) crystalline Fe minerals, (3) magnetite and (4) pyrite (Sect. S1.2; Table S2), using a combination of two operational extraction methods (Poulton and Canfield, 2005; Claff et al., 2010) as described by Kraal et al. (2017). Concentrations of Fe in all extracts were determined using the colourimetric phenanthroline method (APHA, 2005). Solid-phase S was separated into (1) acid-volatile sulfur (AVS; representing FeS) and (2) chromium-reducible sulfur (CRS; representing FeS2; Table S2), using the method after Burton et al. (2006, 2008) as modified by Kraal et al. (2013). Sulfide released during the S extraction was trapped as ZnS in alkaline Zn acetate traps. Concentrations of S were determined by iodometric titration (APHA, 2005). Solid-phase siderite (FeCO3) was determined by subtracting AVS from the labile ferrous concentrations retrieved from the first step of the Fe extraction. Solid-phase P was fractionated into (1) exchangeable P, (2) citrate-dithionite-bicarbonate (CDB)-P, (3) authigenic P, (4) detrital P and (5) organic P (Table S2), after Ruttenberg (1992) as modified by Slomp et al. (1996). The sum of exchangeable P and CDB-P represents metal-bound P, as described in Hermans et al. (2019b). Concentrations of P in all extracts, except CDB, were measured with the molybdenum blue colourimetric method (Murphy and Riley, 1958). The P, Mn (assuming to represent Mn oxides; Hermans et al., 2019b) and Si (assuming to represent metal-oxide-bound Si; Kostka and Luther III, 1994; Rao et al., 2016) in CDB extracts were determined using ICP–OES.
2.6 Elemental mapping of Fe, Mn, P and Ca
On day 47, an undisturbed core (first 5 cm of surface sediment) was sampled for epoxy resin embedding for high-resolution elemental mapping (Jilbert et al., 2008; Jilbert and Slomp, 2013). Sediment was carefully pushed upwards from the experimental core into a shorter (7 cm length; 1 cm diameter) mini core. This mini sub-core was then transferred to an acetone bath in a argon-filled glove box and subsequently embedded with Spurr's epoxy resin, as described in Jilbert et al. (2008). After curing, the epoxy-embedded core was split vertically using a rock saw. The surface was smoothed by applying a 0.3 µm alumina powder layer. Elemental maps of Fe, Mn, P and Ca (30 µm resolution) were retrieved using a desktop EDAX Orbis µXRF analyser (Rh tube set at 30 kV, 500 µA, 300 ms dwell time, equipped with a poly-capillary lens). Similar µXRF maps for Fe, Mn and P in epoxy-embedded surface sediment were obtained for two field sites, namely (1) the Gulf of Finland (GOF5) for sediments collected in June 2016, as described by Hermans et al. (2020), and Lake Grevelingen (Den Osse basin, S1) for sediments collected in January and May 2012, as described in Sulu-Gambari et al. (2016a, 2018).
2.7 Fluorescence in situ hybridisation
Fluorescence in situ hybridisation (FISH; Pernthaler et al., 2001) was used to microscopically quantify the abundance of cable bacteria filaments, as described in Seitaj et al. (2015). FISH analysis was performed on one intact sediment core retrieved at our sampling site and the sediment cores from our incubation experiment used for pore water collection at three time points (days 5, 26 and 207). These cores were sectioned at 0.5 cm depth resolution for the first 2.5 cm. Each sediment slice was homogenised and fixed with 0.5 mL ethanol (≥ 99.8 % purity), and stored in a 2 mL Eppendorf tube at −20 ∘C. For FISH analysis, a volume of 100 µL was retrieved from the Eppendorf tubes and mixed with a 1 : 1 solution of phosphate-buffered saline (PBS) as PBS ∕ ethanol (500 µL). Then, 10 µL of this mixture was filtered through a polycarbonate membrane (type GTTP; pore size 0.2 µm; Millipore, USA). Cable bacteria were classified with a Desulfobulbaceae-specific oligonucleotide probe (DSB706; 5′-ACC CGT ATT CCT CCC GAT-3′) after counter-staining with 4′,6-diamidino-2-phenylindole (DAPI; 1 µg mL−1) under an epifluorescence microscope (Zeiss Axioplan, Germany) at 100× magnification. The abundance of cable bacteria was quantified by determining the length and diameter of all observed filaments in a field (105×141 µm) on the filter at 100× magnification (200 fields per sample). Cable bacterial abundances are expressed as filament length per volumetric unit (m cm−3) or depth integrated per unit area of sediment surface (m cm−2), consistent with previous studies (Schauer et al., 2014; Malkin et al., 2017).
2.8 Scanning electron microscopy
Cable bacteria filaments were taken from surface sediments from the oxic zone (upper 2 mm) after 40 d, using a microscope, and were transferred to a 15 mL centrifuge tube. The tube was filled to a volume of ∼ 10 mL, using ultra clean water, and was subsequently centrifuged at 2100 rpm for 2 min, after which the water was discarded. This washing step was repeated three times. The washed samples were then transferred to a sample stub, where the sediment was air-dried overnight prior to gold coating. The filaments were subsequently subjected to scanning electron microscopy (SEM) imaging on a Phenom ProX desktop SEM (Phenom-World BV, the Netherlands) to obtain high-resolution images, as described in Geerlings et al. (2019). SEM images were generated under 0.1–0.3 mbar vacuum and a high accelerating voltage (10 or 15 kV).
2.9 Data analysis and calculations
The diffusive uptake of O2 was calculated from the high-resolution O2 depth profiles using the Profile software package (Berg et al., 1998). Total H2S (ΣH2S = H2S + HS− + S2−) was calculated as a function of the recorded H2S and pH values, accounting for temperature and salinity (Millero et al., 1988; Jeroschewski et al., 1996).
The EP depth profiles were normalised by subtracting the background EP signal in the overlying water from the EP depth profiles to calculate the EP value relative to that in the overlying water (Damgaard et al., 2014). The electric field in the sediment was calculated from the linear slope of the EP depth profiles (average of triplicates) in the surface sediments (Risgaard-Petersen et al., 2014). The magnitude of the current density was subsequently calculated from the gradient in the EP, the so-called electric field, using Ohm's law as follows:
where J represents the magnitude of the current density (mA m−2), σpw is the conductivity of the sediment matrix (S m−1), and E (mV m−1) represents the electric field. The conductivity of the pore water was corrected for tortuosity and calculated as a function of the temperature and salinity using the equations provided by Fofonoff and Millard (1983).
The solute fluxes were calculated, as described in Glud (2008) and Rao et al. (2016), as follows:
where J represents the diffusive flux (mmol m−2 d−1), ΔCow represents the concentration change in the overlying water (mmol m−3), Δt is the incubation time (d), Vow is the volume in the overlying water (m3), and A is the surface area of sediment in the core (m2). In our experimental set-up, only those fluxes were measurable for NH, Fe2+, Mn2+ and HPO, that were > 0.08, > 0.06, > 0.01 and > 0.55 mmol m−2 d−1, respectively. However, for these four solutes, fluxes were always too low to be detected. Hence, only Ca2+ and H4SiO4 fluxes are presented.
Diffusive downward fluxes of SO and diffusive upward fluxes of NH, Fe2+, Mn2+ and Ca2+ were calculated from linearised pore water gradients using Fick's first law (Berner, 1980) as follows:
The molecular diffusion coefficient was calculated as a function of pressure, salinity and temperature, using the R package of marelac (Soetaert et al., 2010), and corrected for the ambient tortuosity, using the relations listed in Boudreau (1997).
3.1 Abundance of cable bacteria
Examination of the top 2.5 cm of the surface sediments using FISH showed the presence of filamentous cable bacteria (Figs. 1c and S1). The in situ cable bacterial abundance in the sediment at our field site was low (14 m cm−2). However, after 5 d of incubation in the laboratory, the abundance increased strongly (724 m cm−2). At day 26, the abundance of cable bacteria was even higher (1035 m cm−2). After 207 d, the cable bacterial abundance in the surface sediment was low again (131 m cm−2). SEM imaging confirmed that the filaments were indeed cable bacteria (Fig. 1d), as the external surface of the filament was characterised by a parallel pattern of ridges and grooves along its latitudinal axis, which is a typical feature of cable bacteria (Cornelissen et al., 2018; Geerlings et al., 2019).
3.2 High-resolution depth profiles of pH, O2, ∑ H2S and EP
High-resolution depth profiles of pH showed the development of a distinct peak near the sediment–water interface at day 5 and acidification of the pore water in the deeper sediment (Fig. 2a). The width of this pore water acidification zone increased with time and reached its maximum at day 26, followed by a decrease in the acidification. The distinct pH peak near the sediment–water interface gradually disappeared after 33 d. The depth of O2 penetration in the sediment remained constant within the first 40 d of incubation (∼ 1.1 mm) and subsequently moved downwards with time to 9.6 mm (Figs. 2a, 3 and S2). The dissolved ∑H2S concentrations remained low (< 5 µM) throughout the experiment (Fig. 2a). The ΣH2S appearance depth was initially equivalent to the O2 penetration depth, and shifted downwards within 5 d, creating a suboxic zone where O2 and ΣH2S remained below detection (Figs. 2a and 3). The width of the suboxic zone remained relatively constant with time (∼ 25 mm; Fig. 3), and only slightly decreased after 207 d.

Figure 2(a) Time series of the pore water pH (black), O2 (red) and ∑H2S (blue) signatures of the incubated sediment. (b) Development of the EP depth profile in the incubated sediment over time. The dashed line at 0 mm depth represents the sediment–water interface. The blue boxes indicate the overlying water, whereas the underlying light grey boxes represent the sediment. The EP depth profiles represent an average of three replicate measurements. The error bars indicate the minimum and maximum EP values that were observed. The orange depth profiles represent duplicate measurement performed on a different core.
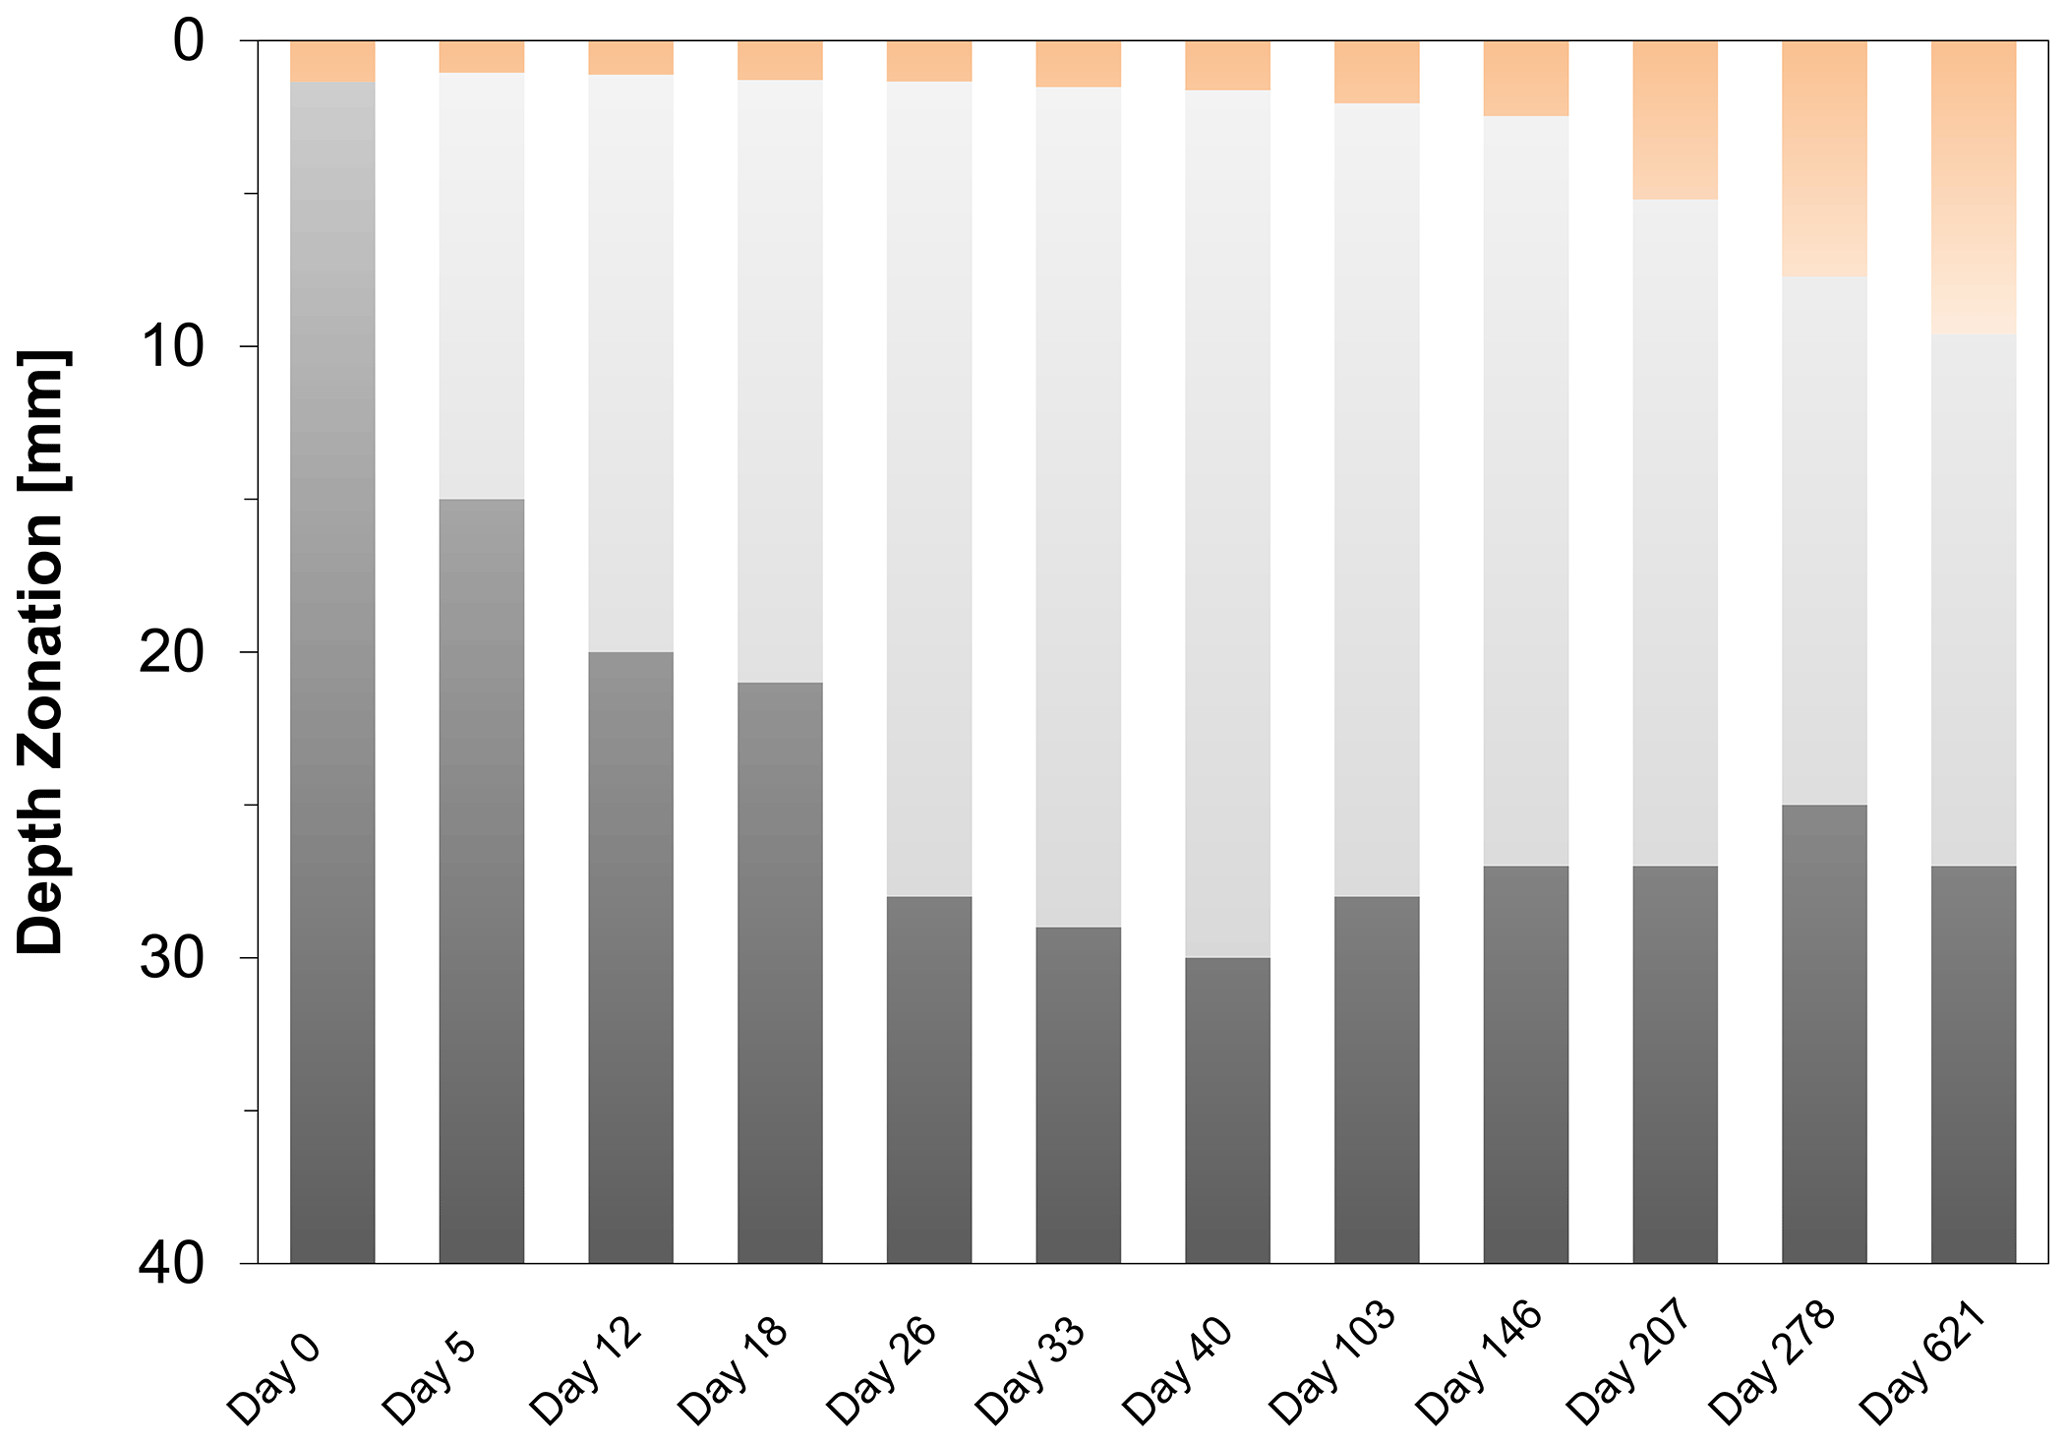
Figure 3Time series of the development of the oxic zone (orange), suboxic zone (light grey) and the anoxic/sulfidic zone (dark grey) in the sediment. These zones were calculated from three replicate microelectrode depth profiles retrieved from two different cores.
The EP depth profiles indicate a rapid establishment of an electric current after 5 d (0.4 mV; Fig. 2b). The time series of the depth profiles show that the EP increased and also accumulated over a thicker depth horizon. At day 26, the EP reached its maximum value (1.2 mV), followed by a decrease with time. Long-distance electron transport was not active in the anoxic control core (Fig. S3).
3.3 Diffusive uptake of O2 and current density
The diffusive O2 uptake of the sediment was highest after 5 d and gradually decreased with time from ∼ 30 to ∼ 3.6 mmol m−2 d−1 (Fig. 4a). The current density rapidly increased from day 0 to day 18, from 6 to 128 e− mmol m−2 d−1, and then gradually decreased with time (Fig. 4b). The duplicate measurements show the same trend for the diffusive O2 uptake and the current density, which indicates that the results are reproducible.
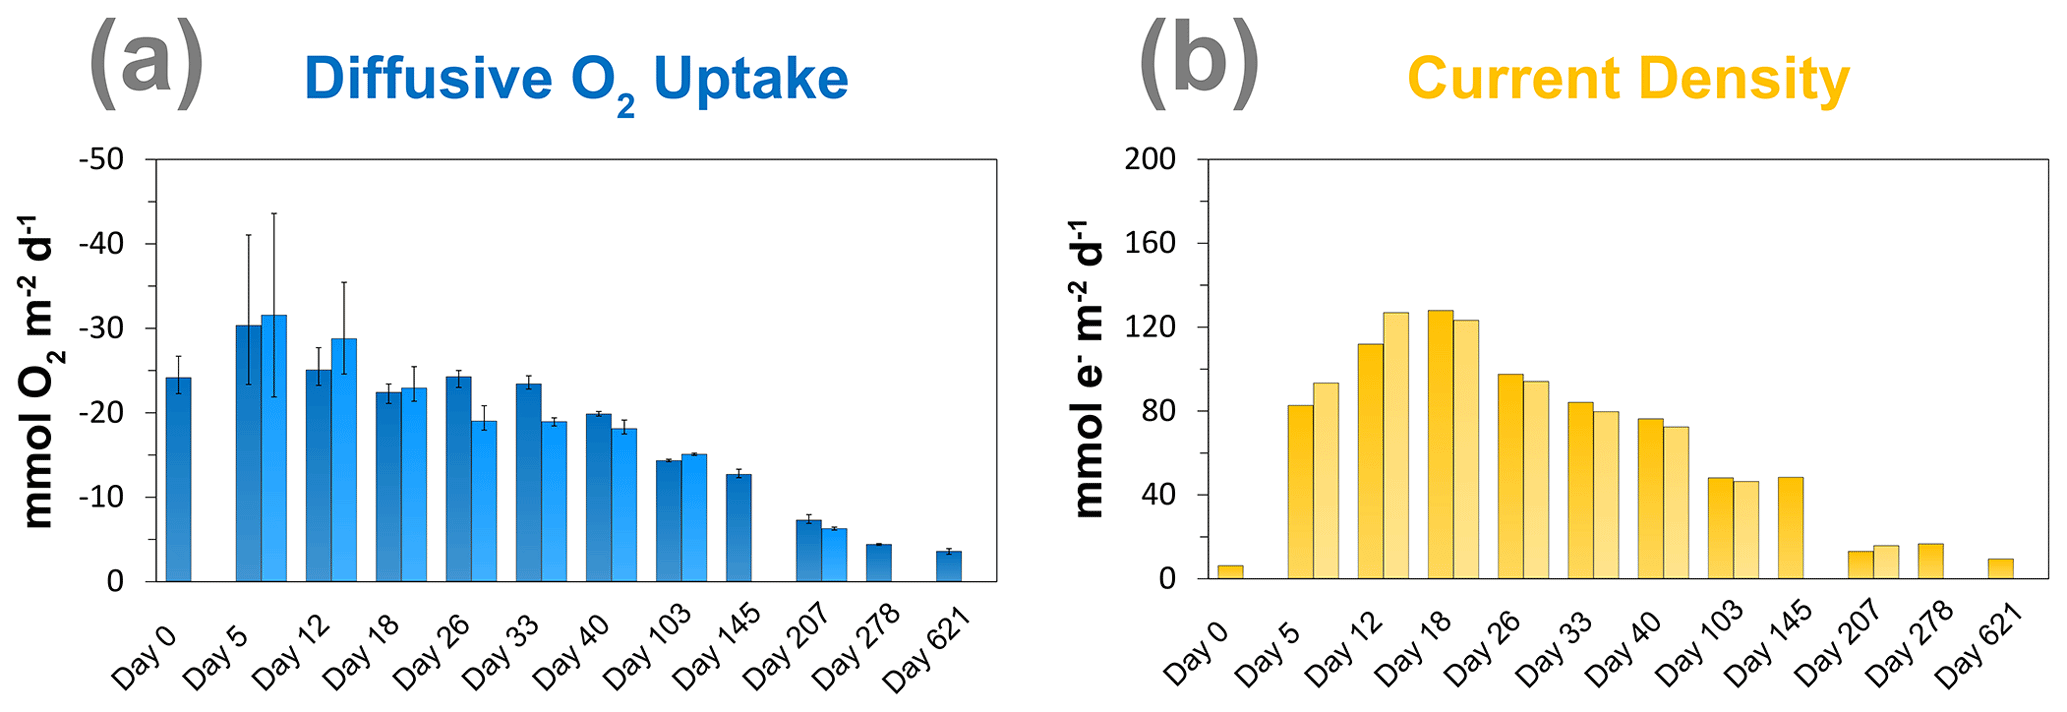
Figure 4Time series of the (a) diffusive O2 uptake in mmol O2 m−2 d−1 and (b) current density as a consequence of long-distance electron transport (e−) in mmol e− m−2 d−1 in the sediment incubation.
3.4 Pore water profiles
Concentrations of NH were low near the sediment–water interface and increased with sediment depth, reaching maximum levels of up to 1.7 mM in the sediment (Fig. 5). The time series suggest a gradual decrease in the production of dissolved NH in the sediment, leading to decreasing concentrations with time. The pore water depth profiles of dissolved SO show a decline with sediment depth at all time points. However, SO concentrations remained relatively constant within the top 2 cm of surface sediment between day 12 and 33. Dissolved Fe2+, Mn2+ and Ca2+ all show the development of distinct peaks in the pore water with time, and after 40 d those peaks disappear again. Pore water concentrations of HPO generally increased with sediment depth for all time points, and concentrations within the top 2 cm were below the detection limit, indicating removal. Dissolved H4SiO4 increased with sediment depth, reaching concentration of up to 1 mM.

Figure 5Time series of pore water depth profiles of NH (orange), SO (purple), Fe2+ (red), Mn2+ (green), Ca2+ (grey), HPO (blue) and H4SiO4 (yellow). The control core was sampled at day 621.
3.5 Diffusive fluxes
Calculated diffusive fluxes of NH into the oxic zone decreased during the incubation experiment from 4.7 to 1.8 mmol m−2 d−1 (Figs. 6a and S4; Table S3). Rates of SO reduction estimated from the linear gradient of the decrease in pore water SO in the surface sediment with depth generally also showed a decrease with time (Figs. 6b and S5; Table S3). The upward diffusive flux of Fe2+ greatly increased from day 5 to day 12 and then gradually decreased with time (Figs. 6c and S6; Table S3). The upward diffusive flux of Mn showed an increase in the initial stage of the experiment and reached its maximum at day 18, followed by a decrease with time (Figs. 6d and S7; Table S3). The upward diffusive flux of Ca2+ showed no clear trend with time; however, after 207 d, the flux became extremely low (Figs. 6e and S8). The upward diffusive flux of H4SiO4 also showed an increase in the initial stage of the experiment and reached its maximum at day 12, followed by a decrease with time (Figs. 6f and S9).

Figure 6Time series of diffusive fluxes calculated from the linear gradient of the pore water profiles of (a) NH, (b) SO, (c) Fe2+, (d) Mn2+, (e) Ca2+ and (f) H4SiO4 in mmol m−2 d−1 towards the oxic zone of the sediment, based on the linear pore water gradients (Sect. 1.6; Figs. S4–S9). Here, a positive value indicates an upward flux, whereas a negative value represents a downward flux. NA – not available. The control core was sampled at day 621.
3.6 Solid-phase profiles
The surface sediment in the oxic cores became more enriched in Fe oxides with time, with concentrations increasing from 53 to 485 µmol g−1 (Fig. 7). The deeper sediment in the oxic cores and the entire anoxic control core had low or no Fe oxides. At day 5, FeS was strongly depleted within the top 1 cm of the surface sediment and was gradually lost further with time. At day 621, most of the FeS within the top 2.5 cm of the surface sediment had been dissolved. The anoxic core did not show such a depletion in FeS in the surface sediment and even showed a slight increase in FeS. Solid-phase siderite remained rather constant with depth from day 5 to 33 but, afterwards, was gradually lost from the surface sediment. At day 621, a large proportion of the siderite was dissolved within the top 2 cm. Solid-phase siderite concentrations remained constant with depth in the anoxic control core. Solid-phase depth profiles of Mn oxides, metal-bound P and metal-oxide-bound Si all showed a gradual increase in the surface sediment with time.
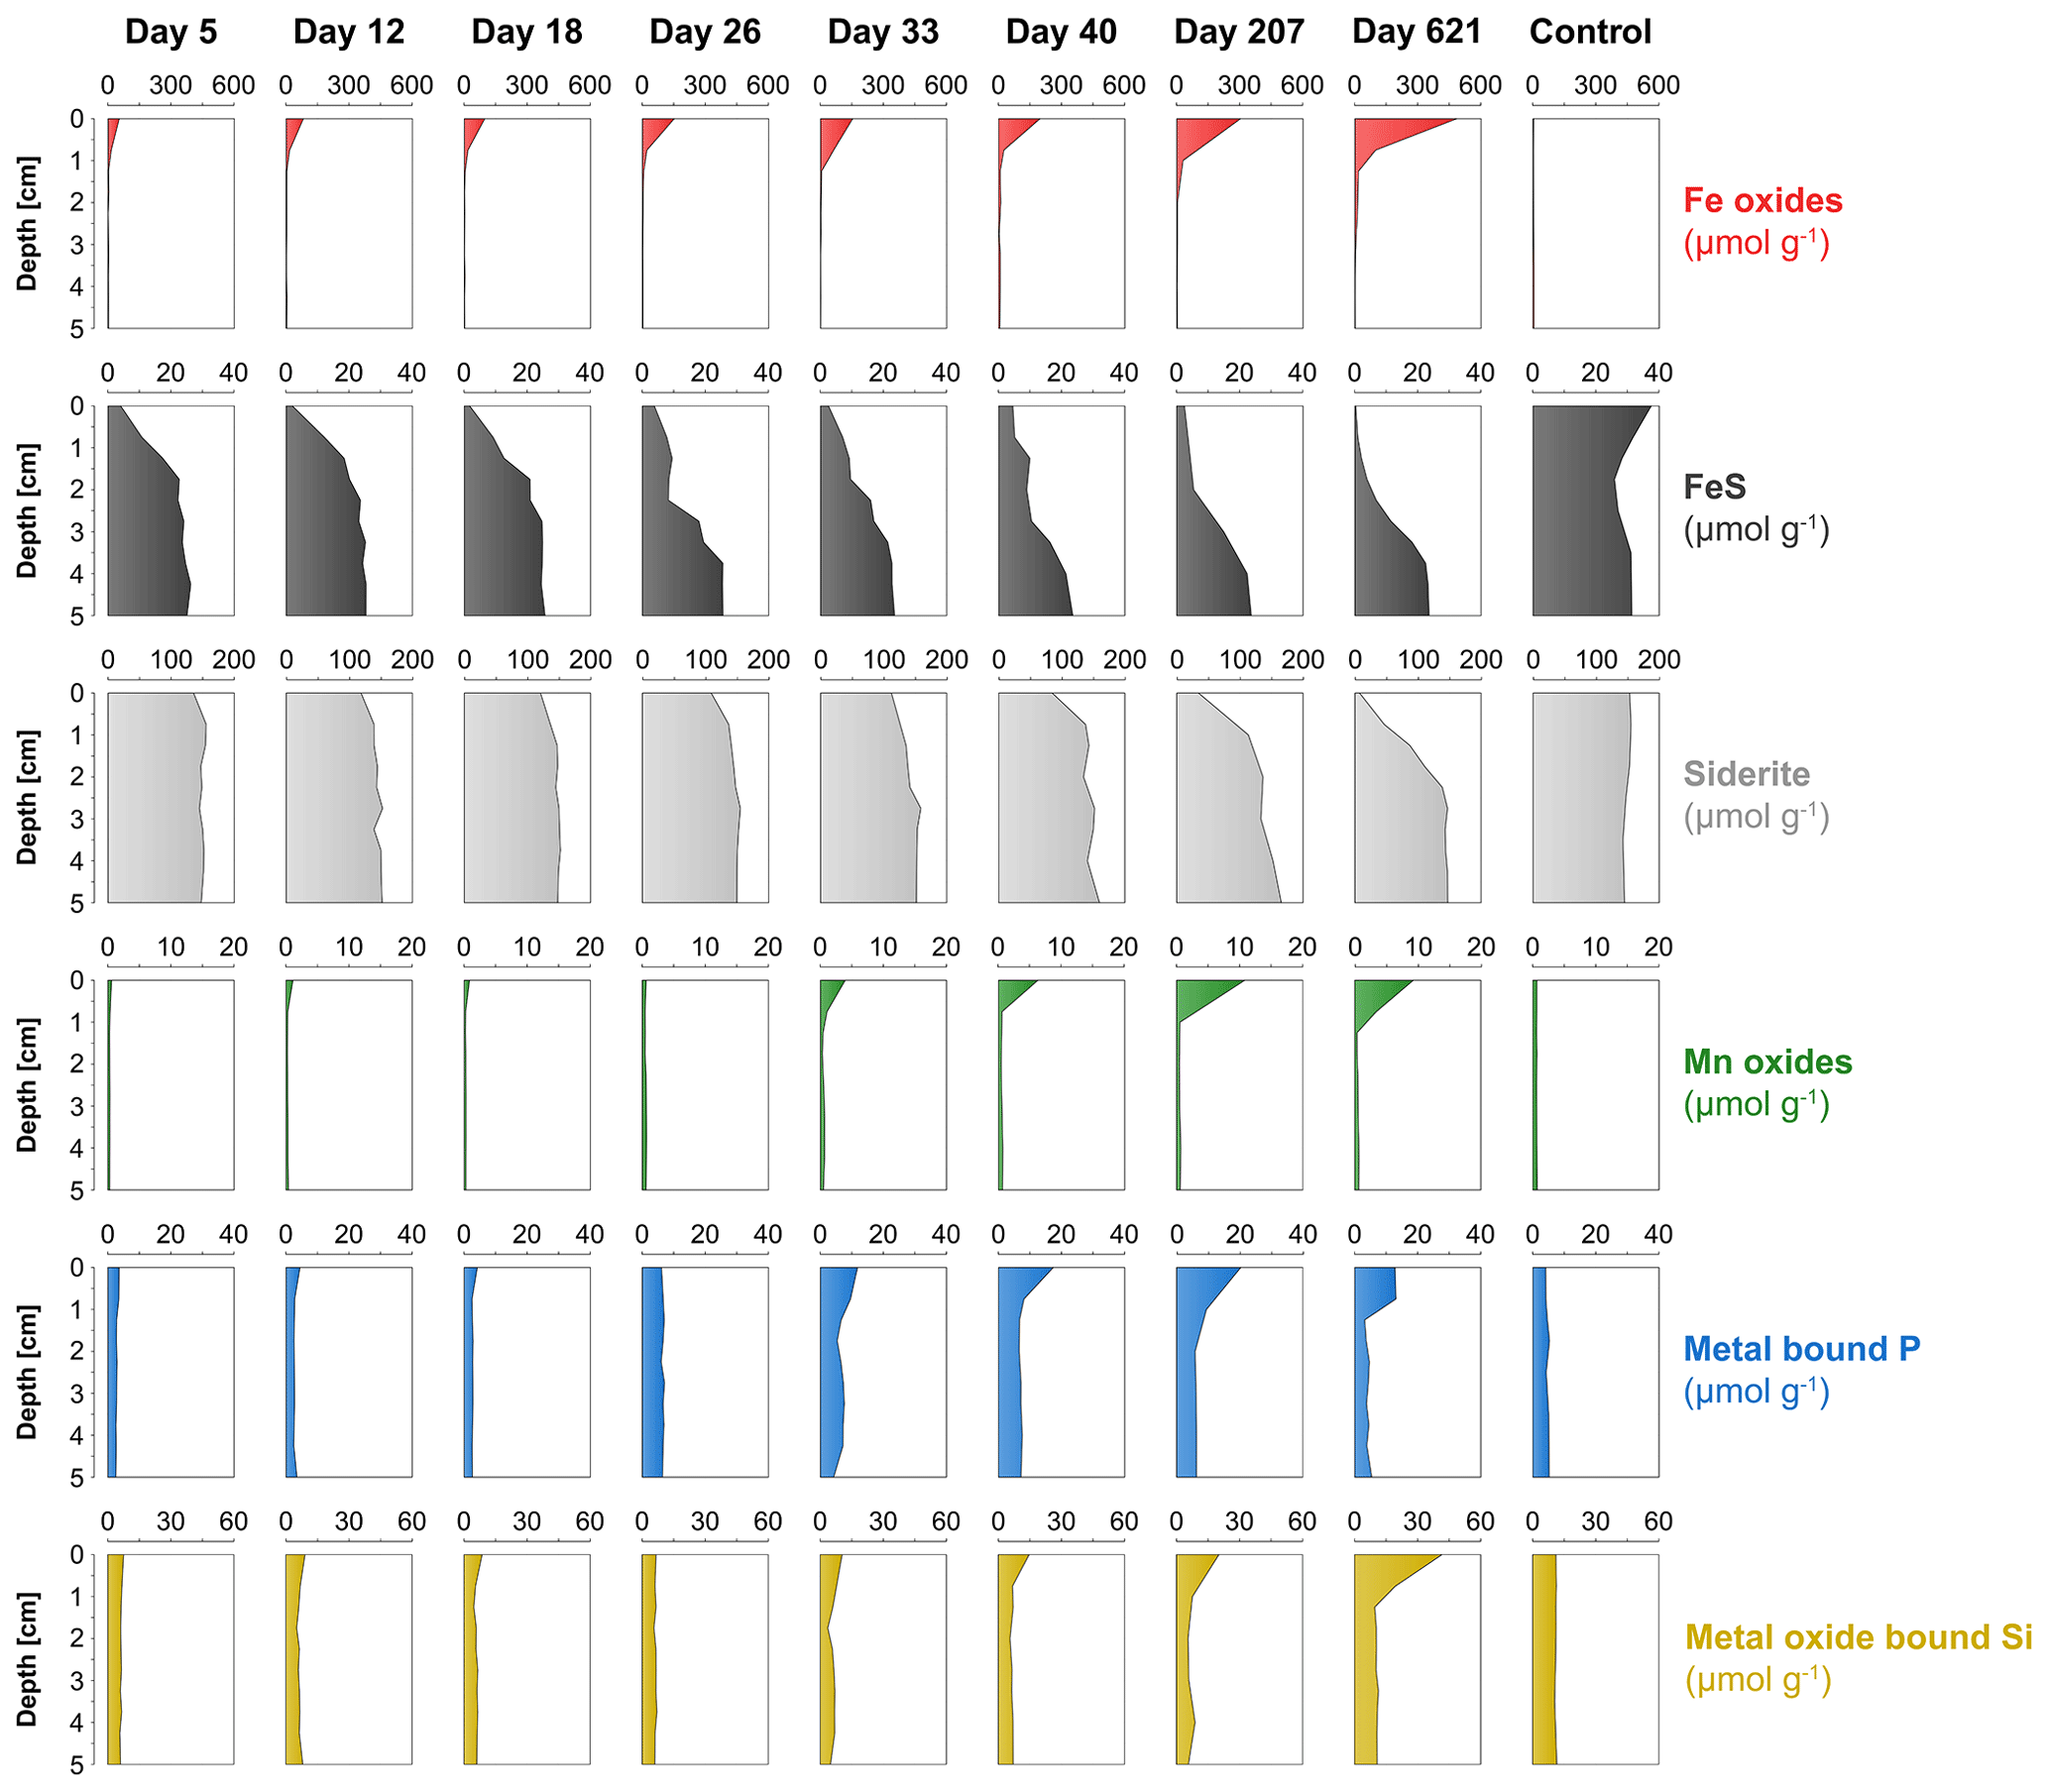
Figure 7Time series of solid-phase depth profiles of Fe oxides (red), FeS (black), siderite (grey), Mn oxides (green), metal-bound P (blue) and metal-oxide-bound Si (yellow).
3.7 High-resolution elemental mapping
High-resolution desktop µXRF mapping of Fe, Mn, P and Ca of our core after 47 d of incubations revealed a subsurface sediment layer highly enriched in Fe and P (Fig. 8a). Subsurface enrichments in Fe, P and Mn in relatively thin layers were also observed in sediments populated by cable bacteria in the Gulf of Finland and Lake Grevelingen (Fig. 8b and c). In the latter system, the layers enriched in Fe, P and Mn broadened upon recolonisation by macrofauna (Fig. 8d).
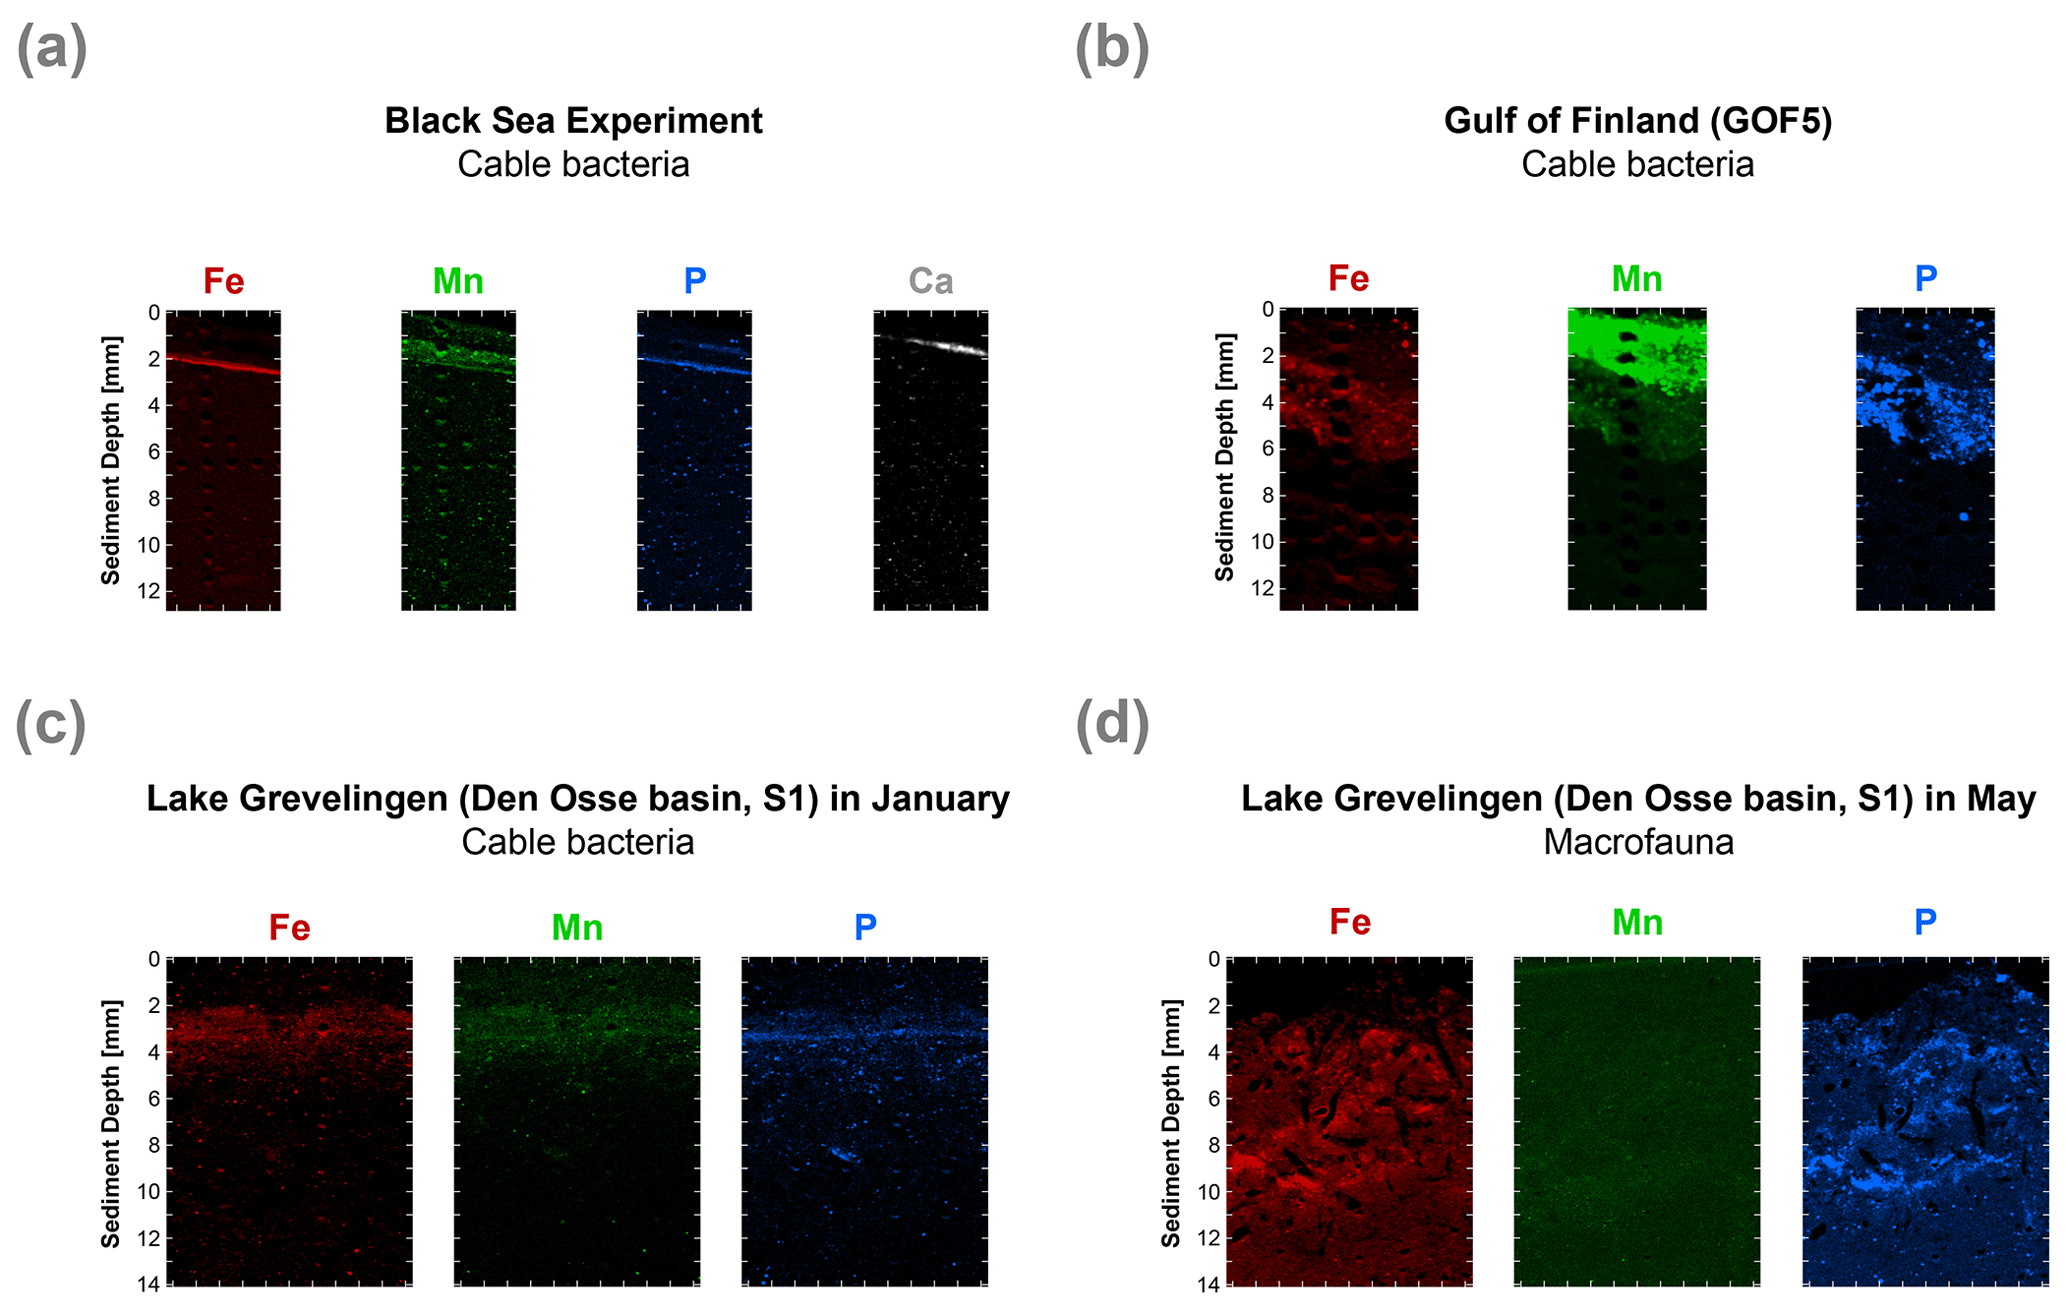
Figure 8High-resolution elemental maps of Fe (red), Mn (green), P (blue) and Ca (white) of surface sediments. These maps are shown in true vertical orientation, and the colours accentuate the relative count intensities, adjusted for brightness and contrast, to highlight the features in the sediment. The tick marks represent 1 mm intervals. µXRF maps of the surface sediment (a) from the incubation experiment, (b) from the Gulf of Finland at site GOF5 in June (Hermans et al., 2020), (c) from Lake Grevelingen (Den Osse basin, S1) in January (when cable bacteria become active) and (d) from Lake Grevelingen (Den Osse basin, S1) in May (showing the effects of bioturbation as described in Seitaj et al. (2015).
4.1 Metabolic activity of cable bacteria
Cable bacteria in our incubation experiment demonstrated a rapid growth, since their abundance greatly increased after 5 d, and reached its peak at day 26 (Fig. 1c). Such high abundances are similar to those observed in previous experiments in which FeS-rich marine sediments from Aarhus Bay and Lake Grevelingen were incubated (Schauer et al., 2014; Burdorf et al., 2018). The activity of cable bacteria exerted a strong impact on the pore water depth profiles of pH, O2 and ∑H2S, as evident from the development of a pH maximum near the sediment–water interface, the strong pore water acidification in the deeper sediment and the development of a suboxic zone (Fig. 2a). These pore water depth profiles resemble the distinct biogeochemical fingerprint typical for active cable bacteria, as observed in previous laboratory incubation experiments (Risgaard-Petersen et al., 2012; Malkin et al., 2014; Rao et al., 2016; Schauer et al., 2014; Vasquez-Cardenas et al., 2015; Burdorf et al., 2018). The widening of the suboxic zone with time (Fig. 3) is a consequence of the downward expansion of the cable bacteria filament network (Schauer et al., 2014; Vasquez-Cardenas et al., 2015).
The EP depth profiles demonstrated that long-distance electron transport by cable bacteria was already active 5 d after the start of the experiment, as indicated by the increase in EP at depth to 0.4 mV). With time, the EP signal increased to higher values and also accumulated over a thicker depth horizon (Fig. 2b), indicating that cable bacteria activity both increased and extended to deeper sediment depth, which is also a consequence of the downward expansion of cable bacteria filaments. The EP reached a maximum after 18 d (1.3 mV; Fig. 2b), which is in concert with the highest current density of ∼ 130 mmol e− m−2 d−1 (Fig. 4b). This maximum EP value and current density is similar in magnitude to those found in sediment incubations with seawater with a similar salinity (Damgaard et al., 2014). From day 18 onwards, the EP and current density flux gradually decreased with time to 13 mmol e− m−2 d−1 after 207 d (Fig. 4b), which implies a decrease in the metabolic activity of cable bacteria. The suboxic zone persisted long after the current density had decreased (Fig. 3).
To summarise, the metabolic activity of cable bacteria was likely highest between day 18 and day 26, based on the cable bacterial abundances, the extent of acidification of the pore water and the current density (Figs. 1c, 2a and 4b).
4.2 Organic matter degradation
Ammonium fluxes are assumed to reflect rates of anaerobic degradation of organic matter (Fig. 6a), and the observed decline during the experiment coincides with the decrease in the activity of cable bacteria based on the EP profiles and current density (Figs. 2b and 4b). This suggests that the availability of easily degradable organic matter plays a role in sustaining the metabolic activity of cable bacteria, most likely by controlling the rate of SO reduction (Nielsen and Risgaard-Petersen, 2015).
Rates of SO reduction estimated from the linear gradient of the decrease in pore water SO in the surface sediment with depth indeed also showed a decline during the experiment. We note, however, that a direct measurement of SO reduction rates (Fossing and Jørgensen, 1989; Kallmeyer et al., 2004) would provide a better indicator because SO estimated from pore water profiles is, in general, lower than rates estimated from tracer experiments (Sandfeld et al., 2020; Hermans et al., 2019a). Another cause for a slight underestimation of our SO reduction rates is due to the effect of the electric field imposed by cable bacteria, which is not taken into account in Fick's law. Solutes can also move with respect to the fluid by electrostatic forces (Bockris and Reddy, 2002). Given the relatively low strength of the electric field in the cores (< 0.073 V m−1 at day 18; as estimated from Fig. 2b), including the contribution of ionic drift to the sulfate flux would lead to SO reduction rates that are, at most, 10 %–20 % higher.
The metabolic activity of cable bacteria can lead to the production of SO in the suboxic zone via anodic sulfide oxidation (Rao et al., 2016; Risgaard-Petersen et al., 2012). We suspect that this also explains the lack of change in pore water SO with depth in the upper 2 cm of the sediment in our experiment between 12 and 40 d (Fig. 5). Despite relatively high SO reduction rates ranging from 5.4 to 17.6 mmol m−2 d−1 (Fig. 6b; Table S3), pore water concentrations of ΣH2S remained very low throughout the experiment (Fig. 2a). This is likely due to the direct consumption of ΣH2S through the activity of cable bacteria, preventing ΣH2S from accumulating in the pore water or, alternatively, precipitation of FeS by dissolved Fe2+ released from the dissolution of siderite.
Laboratory experiments have shown that S oxidation by cable bacteria can play a dominant role in the O2 uptake of coastal sediments (Nielsen et al., 2010; Schauer et al., 2014; Nielsen and Risgaard-Petersen, 2015), and model analysis predicts up to 93 % of the total O2 uptake (Meysman et al., 2015). When we plot the diffusive uptake of O2 against the current density (i.e. upward flux of electrons towards the oxic zone), a linear relationship – with some scatter – emerges for days 12 to 621 (Fig. 9). However, the data points for day 0 and 5 during the initial stages of our experiment do not follow this linear relationship. We explain these findings as follows: on day 0, the cable bacteria were not active yet and other processes, such as aerobic respiration and oxidation of NH and other solutes (Table 2) and solids (FeS) dominated the consumption of O2. On days 5 and 12, the activity of cable bacteria and the oxidation of reduced products from anaerobic degradation of organic matter both contributed to the consumption of O2. From day 12 onwards, both the O2 consumption and electron flux follow a downward decrease with time (Fig. 9). If cable bacteria accounted for all of the O2 consumption, a ratio between the diffusive uptake of O2 and the current density of 1 : 4 is expected (Fig. 1a; Nielsen et al., 2010). We find that, from day 12 onwards, most data points plot rather close to the line for this 1 : 4 relationship (Fig. 9), suggesting that cathodic O2 reduction by cable bacteria is responsible for nearly all O2 consumption in the sediment (in line with the model results of Meysman et al., 2015). This, however, poses a problem for the nitrogen budget because our data indicate complete removal of the NH that diffuses upward into the oxic zone (Fig. 6a), and based on the solute fluxes, there is no escape to the overlying water (see Sect. 2.4). This implies substantial O2 consumption due to nitrification (Table 2). These findings can be explained, however, if we assume that at least part of the NO that is being formed near the sediment–water interface is also used for the metabolic activity of cable bacteria. It has been shown that cable bacteria can couple the oxidation of ∑H2S to NO in the absence of O2 (Marzocchi et al., 2014). Our data suggest that this process may also occur in sediments where O2 is present in concert with NO near the sediment–water interface. However, we cannot exclude the release of NO to the water column or denitrification by other bacteria in the sediment. Another explanation is that cable bacteria might consume O2 directly above the sediment–water interface, as recently proposed by Burdorf et al. (2018). Lastly, the current density might be slightly overestimated since it ignores other sources that can create an electric potential, such as the diffusion potential (Nielsen and Risgaard-Petersen, 2015; Revil et al., 2012).
Table 2Mass balance of O2 consumption. The diffusive uptake of O2, as calculated from the O2 depth profiles (column 2), was compared to the potential O2 demand from the oxidation of NH, Fe2+ and Mn2+ (columns 3–5). The O2 consumption of the oxidation of NH, Fe2+ and Mn2+ was determined based on the stoichiometry of NH, Fe2+ and Mn2+ oxidation with O2, as described in Reed et al. (2011). The oxidation of dissolved Fe2+ and Mn2+ only played a minor role in the total O2 consumption during the experiment, contributing only 0.9 % to 3.8 % and 0.1 % to 0.4 %, respectively.
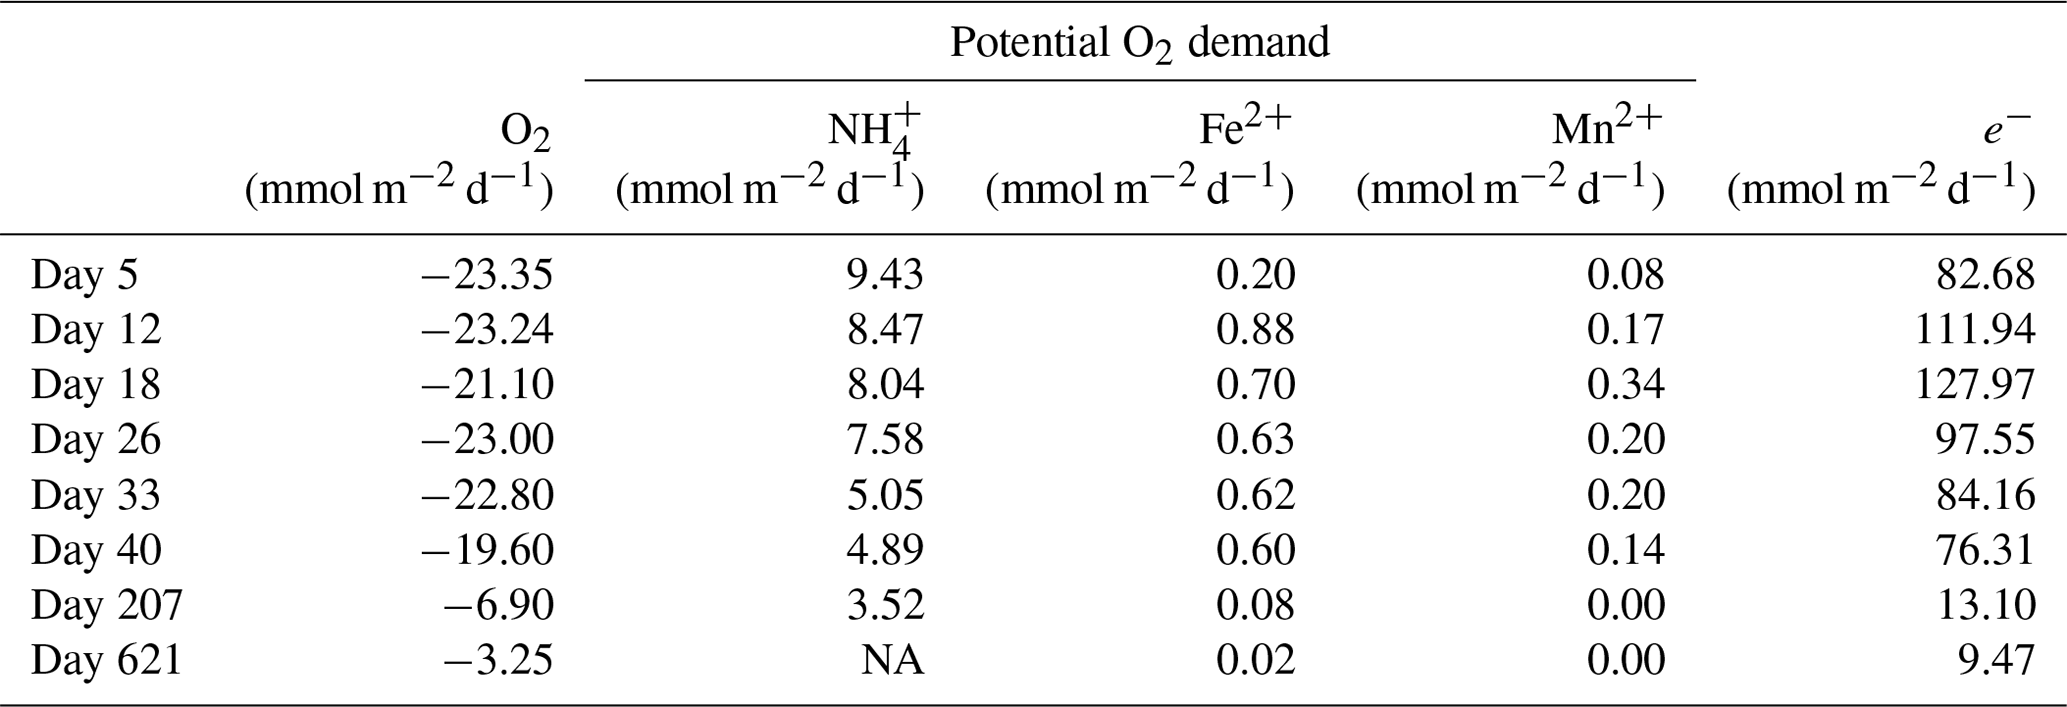
NA – not available.
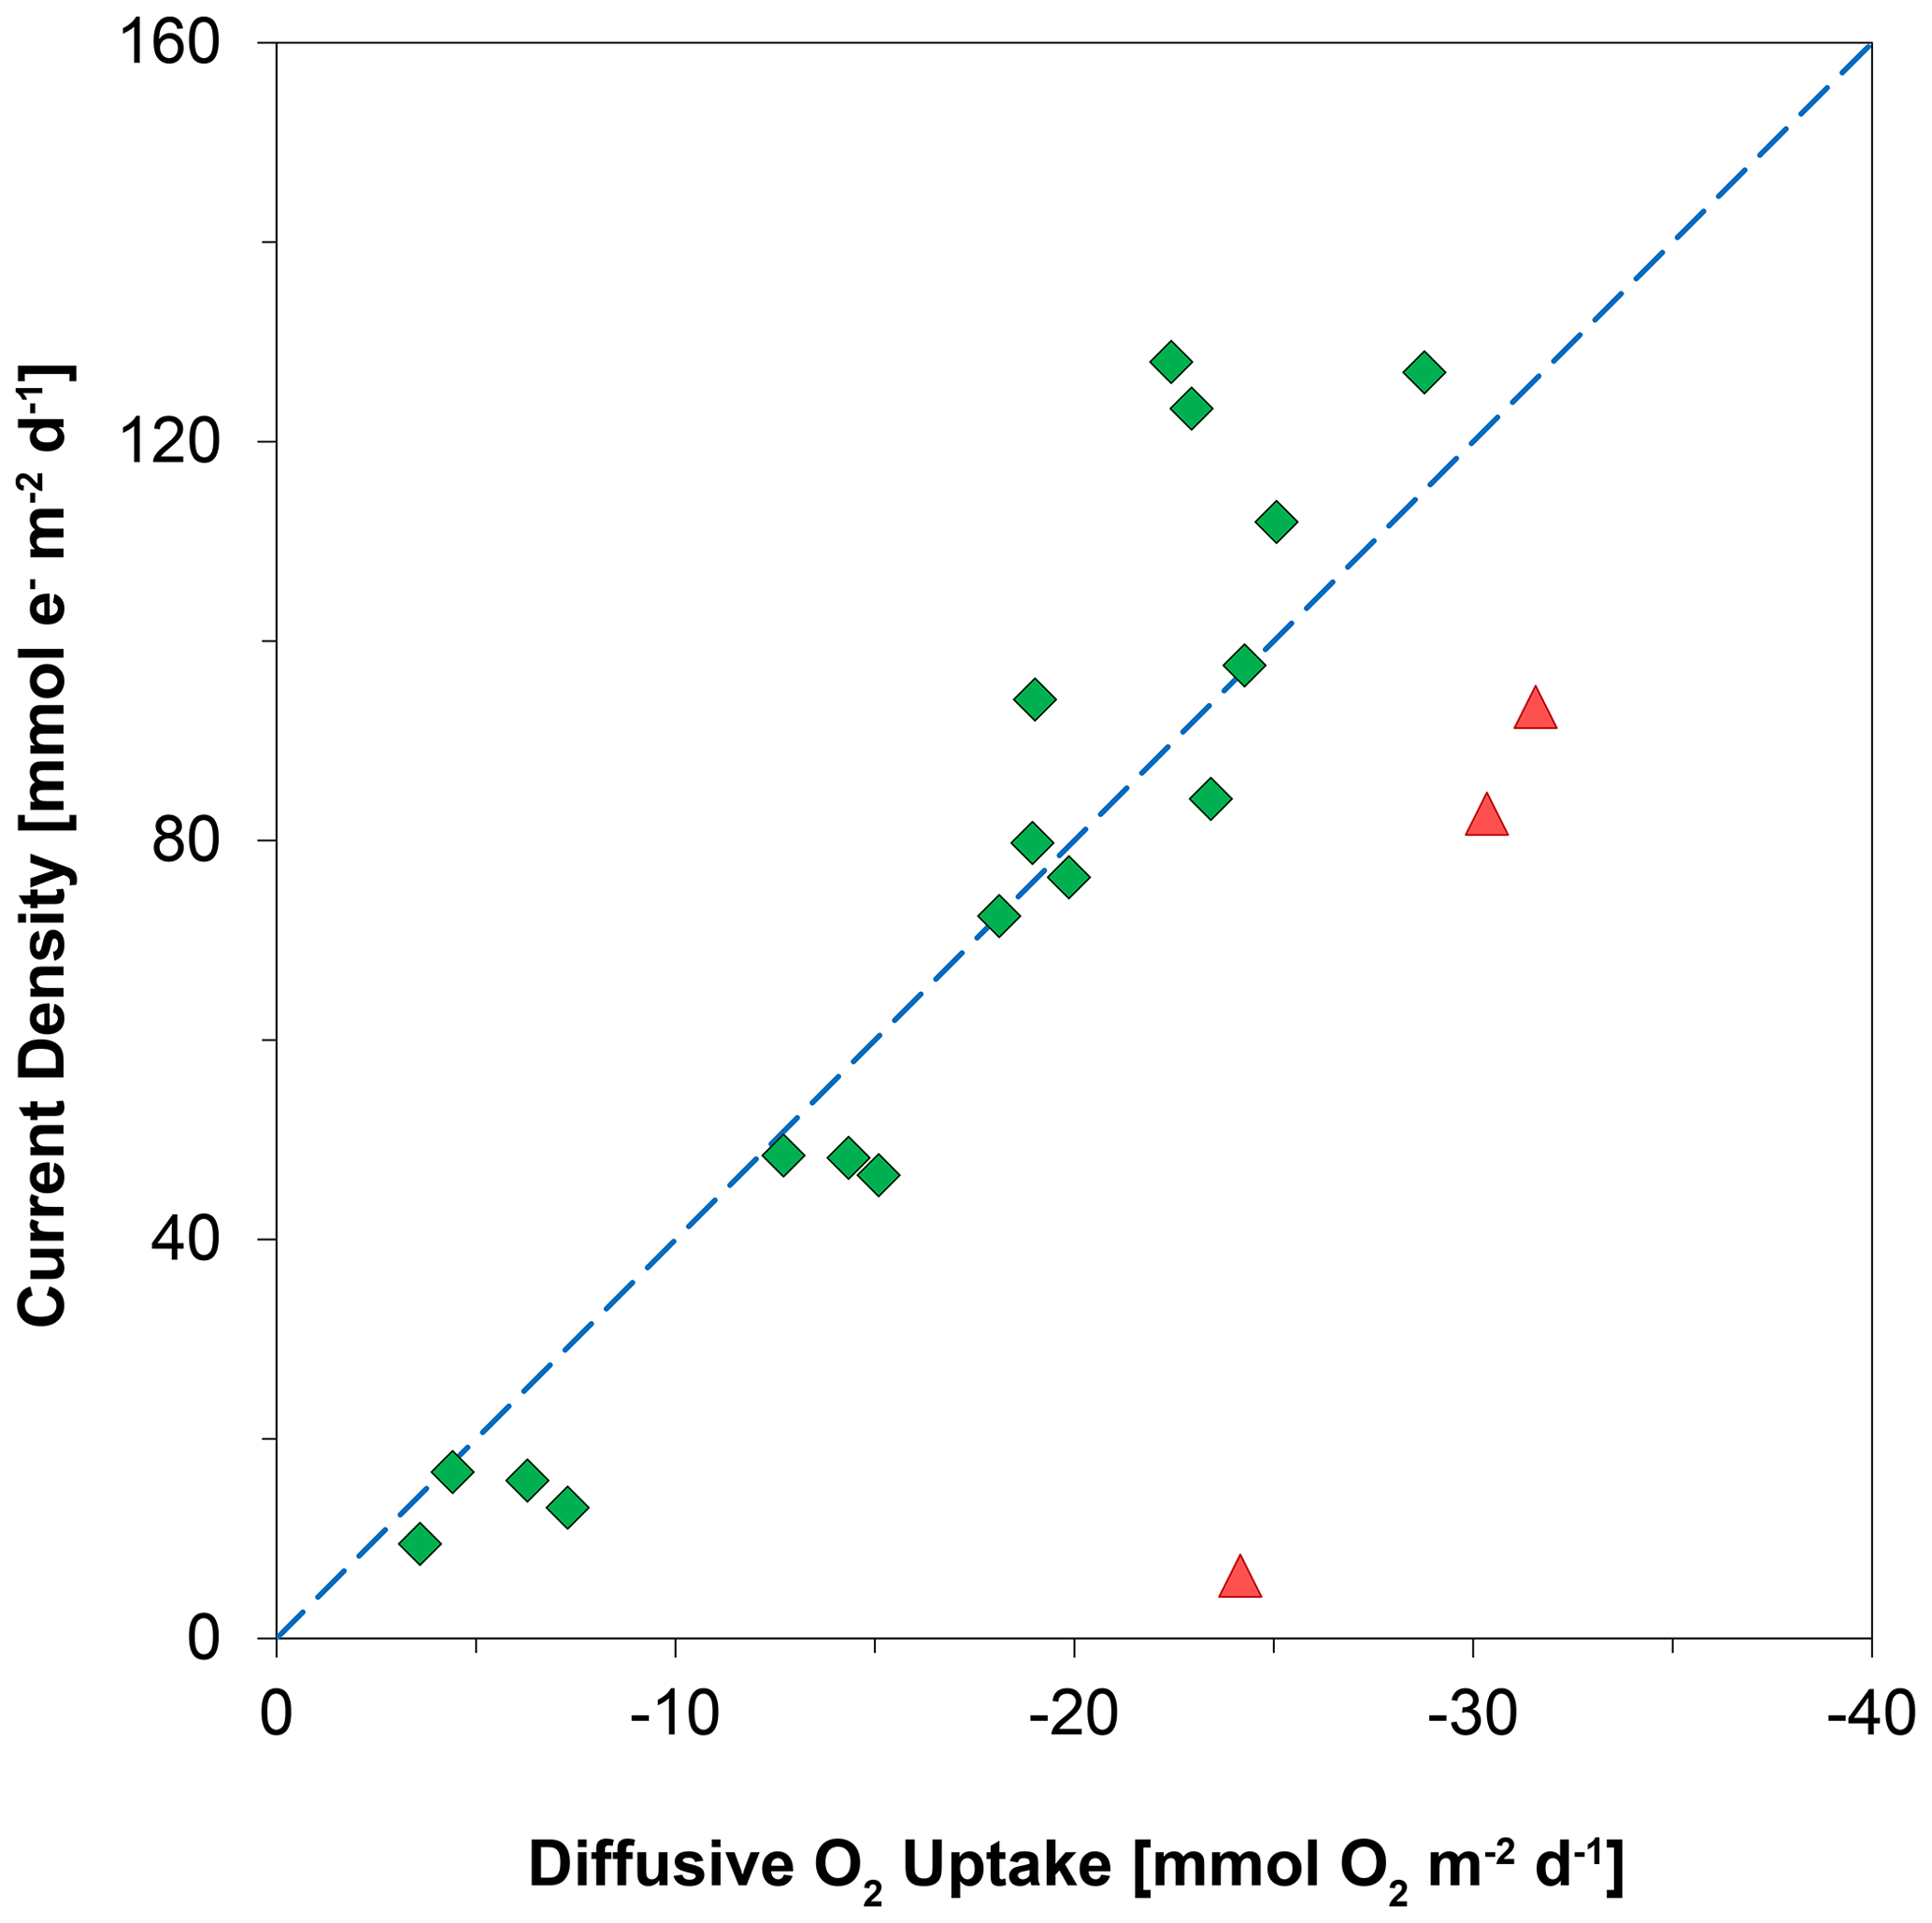
Figure 9The relationship between the diffusive uptake of O2 (mmol O2 m−2 d−1) and the current density of long-distance electron transport (mmol e− m−2 d−1). Red triangles are data for days 0 and 5. Green diamonds are data for all other time points. The blue line represents the expected correlation between the cathodic O2 consumption rate and the current density, assuming a 1 : 4 ratio (Nielsen et al., 2010). Here, a positive value indicates an upward flux, whereas a negative value represents a downward flux.
4.3 Impact of cable bacteria on Fe, Mn and S cycling
The activity of cable bacteria had a strong impact on the biogeochemistry of the surface sediment in our experiment (Fig. 7). Cable bacteria activity induced an intense acidification of the pore water in the suboxic zone (Fig. 2a), which led to the dissolution of Fe and Mn minerals in deeper sediment layers, as can be inferred from the sharp maxima in dissolved Fe2+ and Mn2+ in the pore water, reaching concentrations of up to ∼ 1700 and ∼ 80 µM, respectively (Fig. 5). The 20-fold higher dissolved Fe2+ concentrations with respect to pore water Mn2+ can be attributed to the relatively higher availability of FeS and siderite compared to the availability of Mn carbonates in the sediment that was used for incubation (Lenstra et al., 2020). The peaks in dissolved Fe2+ and Mn2+ in the pore water broadened over time, spanning a depth of > 5 cm (Figs. 5, S6 and S7).
The upward diffusive flux of dissolved Fe2+ and Mn2+ was highest after 12 d, reaching values of up to 3.16 and 0.16 mmol m−2 d−1, respectively. Fluxes subsequently gradually decreased with time (Fig. 6c and d). The continuous upward diffusion of dissolved Fe2+ and Mn2+ led to enrichments of poorly crystalline Fe and Mn oxides in the surface sediment (Fig. 7). Despite high upward fluxes of dissolved Fe2+ and Mn2+ towards the sediment–water interface, our solute flux incubations indicate there was little escape of Fe2+ and Mn2+ to the overlying water (see Sect. 2.4). This implies that all Fe2+ and Mn2+ that diffused upwards was precipitated as Fe and Mn oxides upon contact with O2 or NO (Buresh and Moraghan, 1976; Straub et al., 1996; Kuz'minskii et al., 1994). Little or no escape of dissolved Fe2+ from the sediment into the overlying water was previously suggested at a field site with active cable bacteria, based on diffusive flux calculations (Lake Grevelingen; Sulu-Gambari et al., 2016a), and was determined in flux incubations of cores during a laboratory experiment with cable bacteria (Rao et al., 2016).
At the start of the experiment, the sedimentary FeS content was (∼ 25 µmol g−1), which is not unusual for coastal sediments on the northwestern Black Sea margin (Wijsman et al., 2001) but is low compared to sediments in eutrophic coastal systems (e.g. (Morgan et al., 2012; Kraal et al., 2013; Hermans et al., 2019a). The solid-phase depth profiles reveal a gradual removal of the FeS in the surface sediment in our experiment over time (Fig. 7). At the end of our experiment (621 d), there was no longer any FeS within the top 1.5 cm of the sediment. While approximately 90 mmol m−2 of FeS was removed from the surface sediment within the first 5 d, a total of ∼ 240 mmol m−2 was removed after 621 d (Fig. 10; Table 3). Likely, part of the FeS that was removed from the surface sediment within the first 5 d was removed through oxidation upon contact with O2, rather than the metabolic activity of cable bacteria itself. The pore water acidification associated with cable bacteria activity led to a strong loss of siderite within the top 2 cm of the sediment, with a total removal of ∼ 560 mmol m−2 during the experiment (Figs. 7 and 10; Tables 3 and S5). The depletion of sedimentary FeS and siderite was directly proportional to the formation of Fe oxides near the sediment–water interface (Fig. 10) and accounted for 30 % and 70 % of the Fe oxides, respectively (Table 3).
Table 3Mass balance of Fe. Time series of the depth-integrated (0–5 cm) increase in Fe oxides and the depth-integrated (0–5 cm) depletion of FeS and FeCO3 (siderite) in mmol m−2. All values are reported in mmol Fe m−2. Negative values represent a decrease, whereas positive values indicate an increase in the mineral pools.
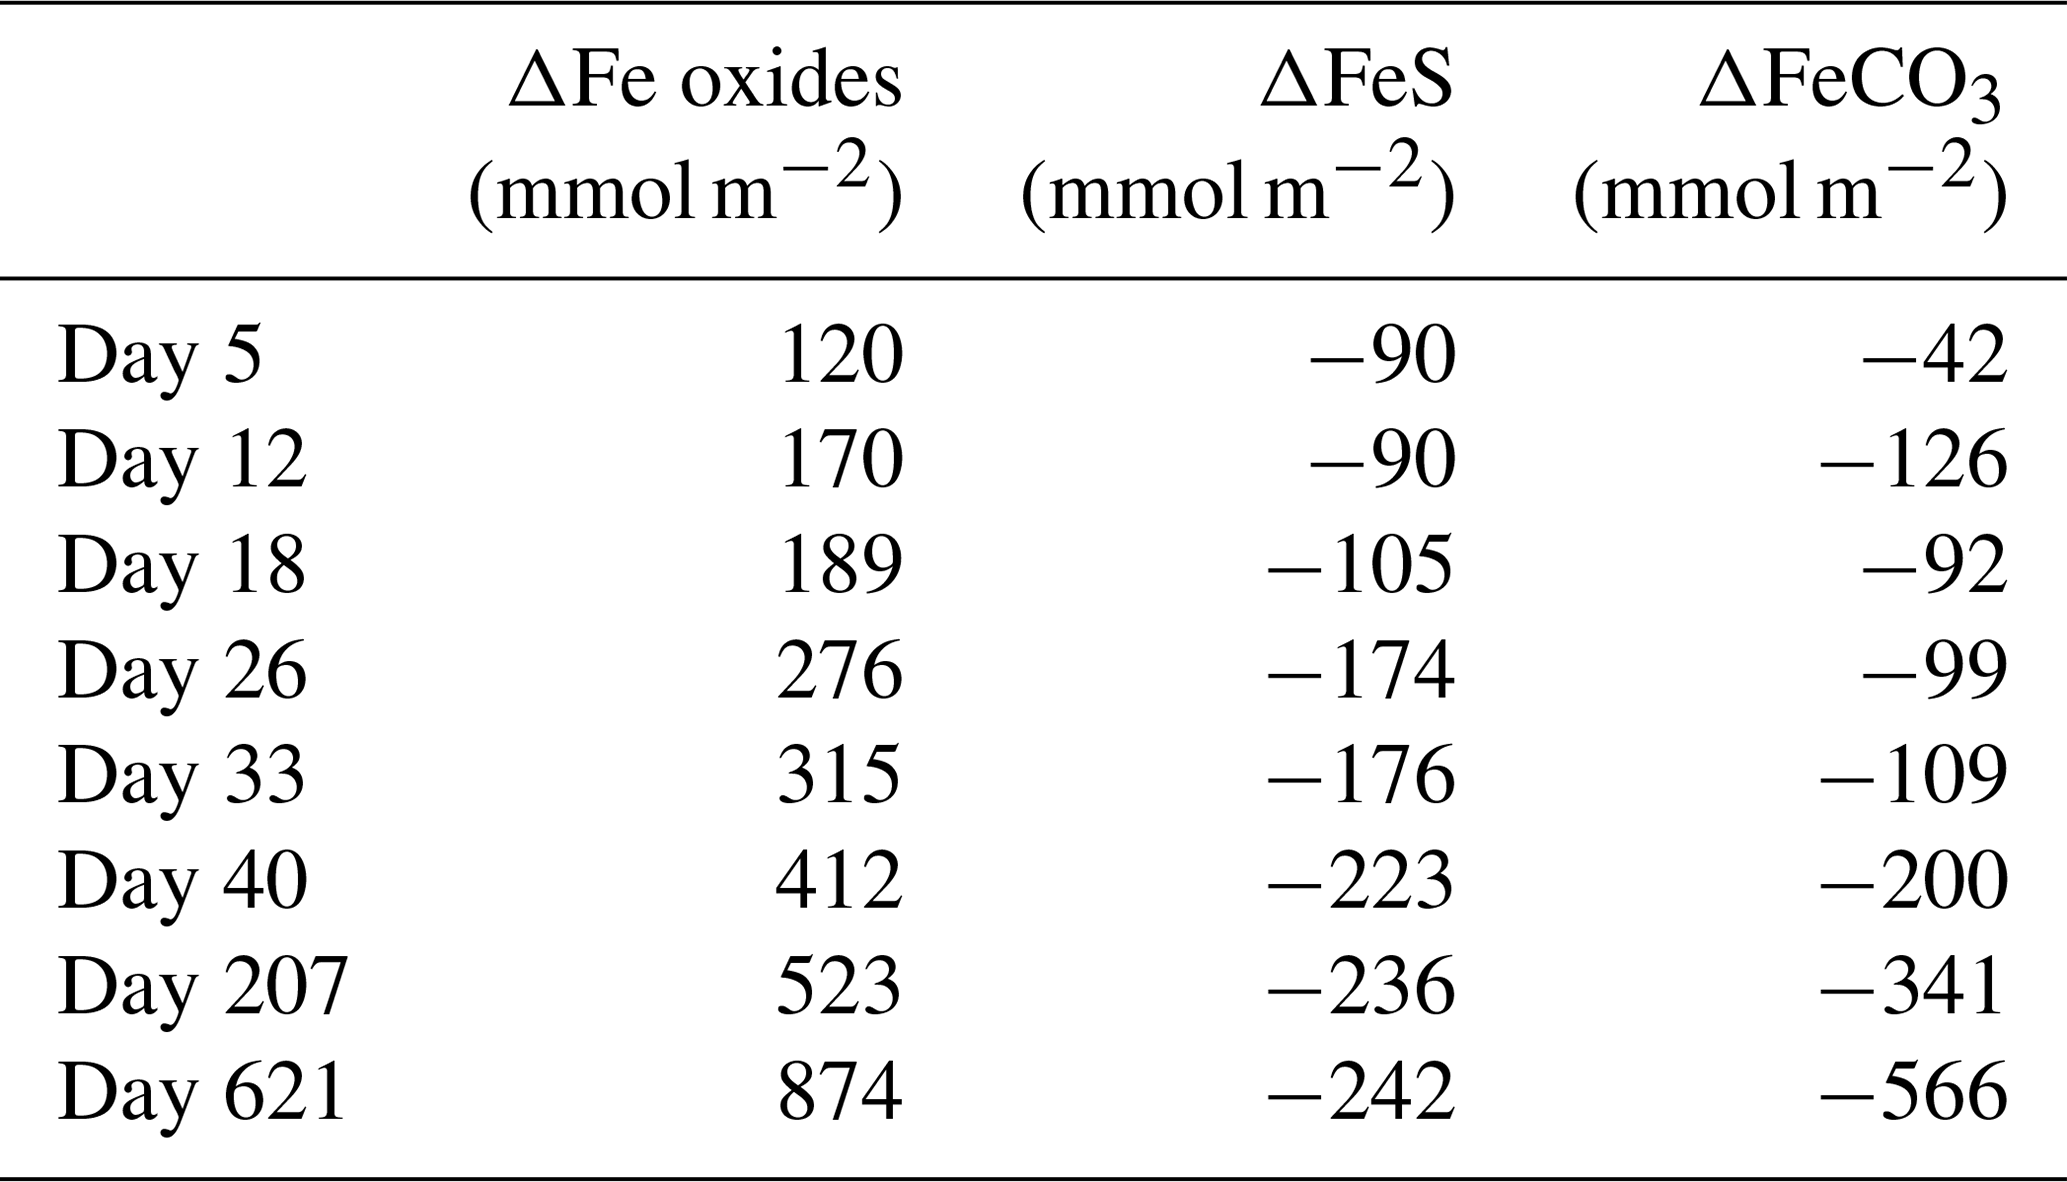
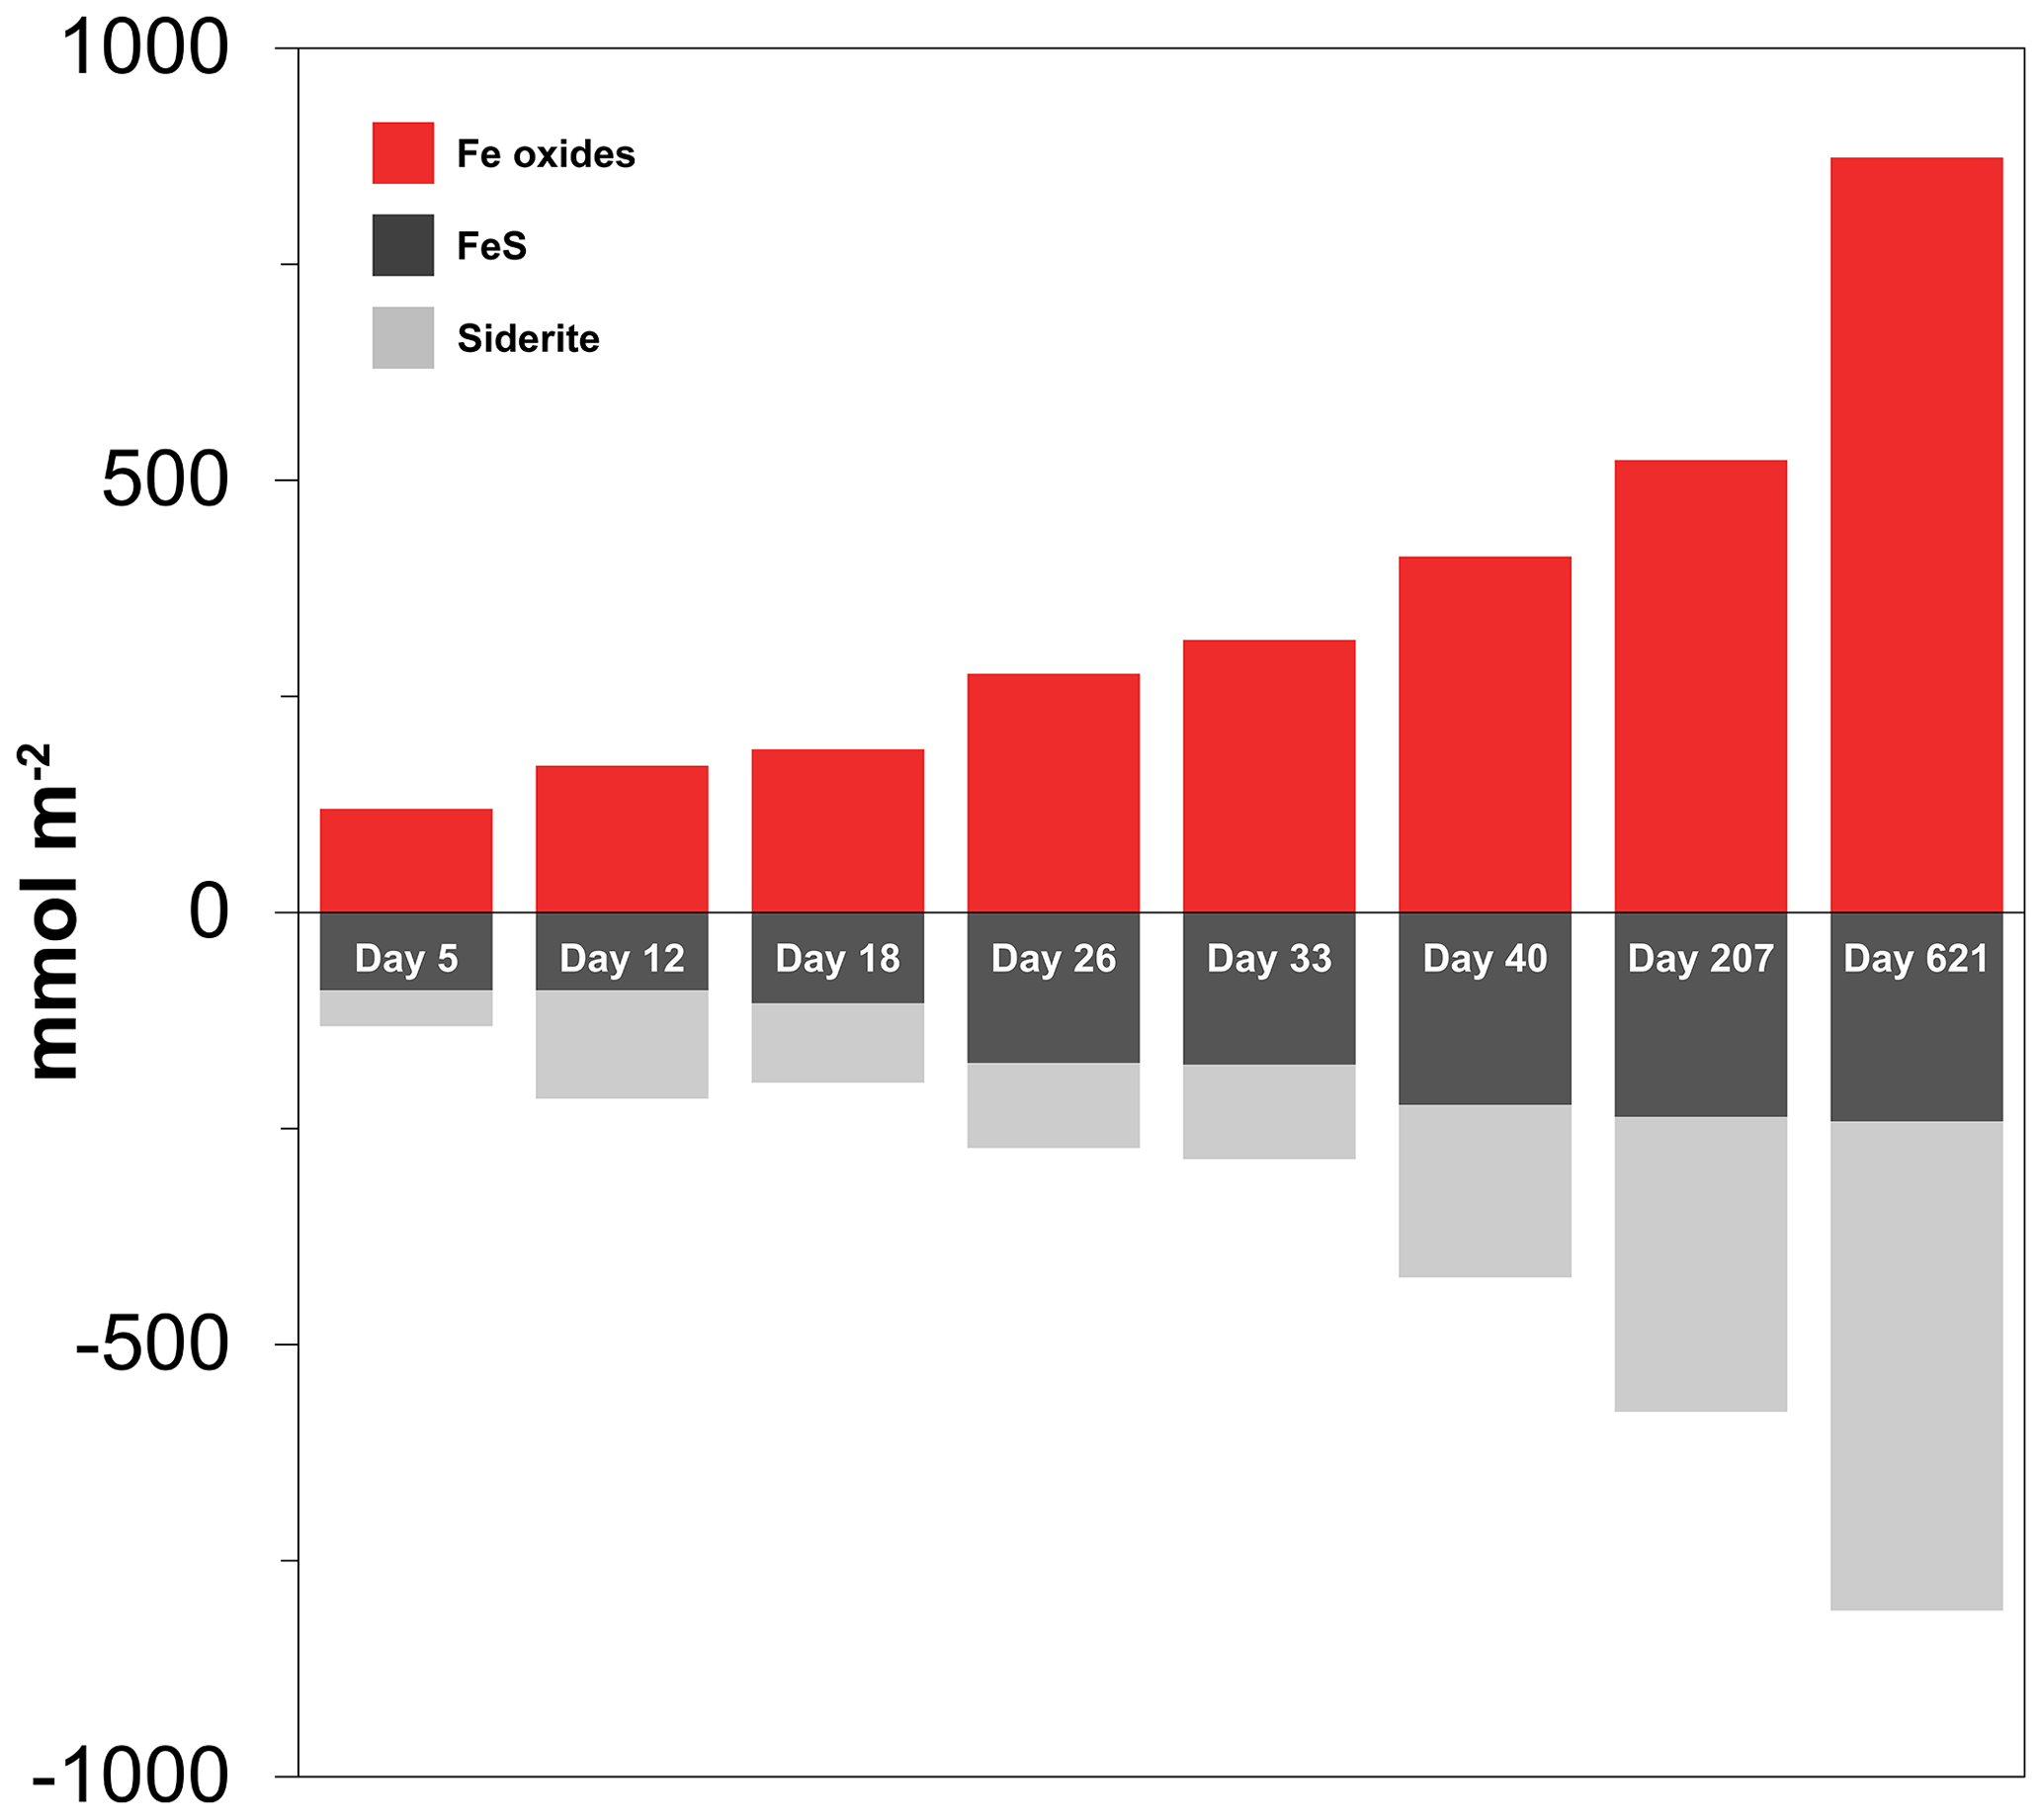
Figure 10Time series of the depth-integrated (0–5 cm) increase in Fe oxides (red) and the depletion of FeS (black) and siderite (grey) in mmol m−2. Negative values represent a decrease, whereas positive values indicate an increase in the mineral pools.
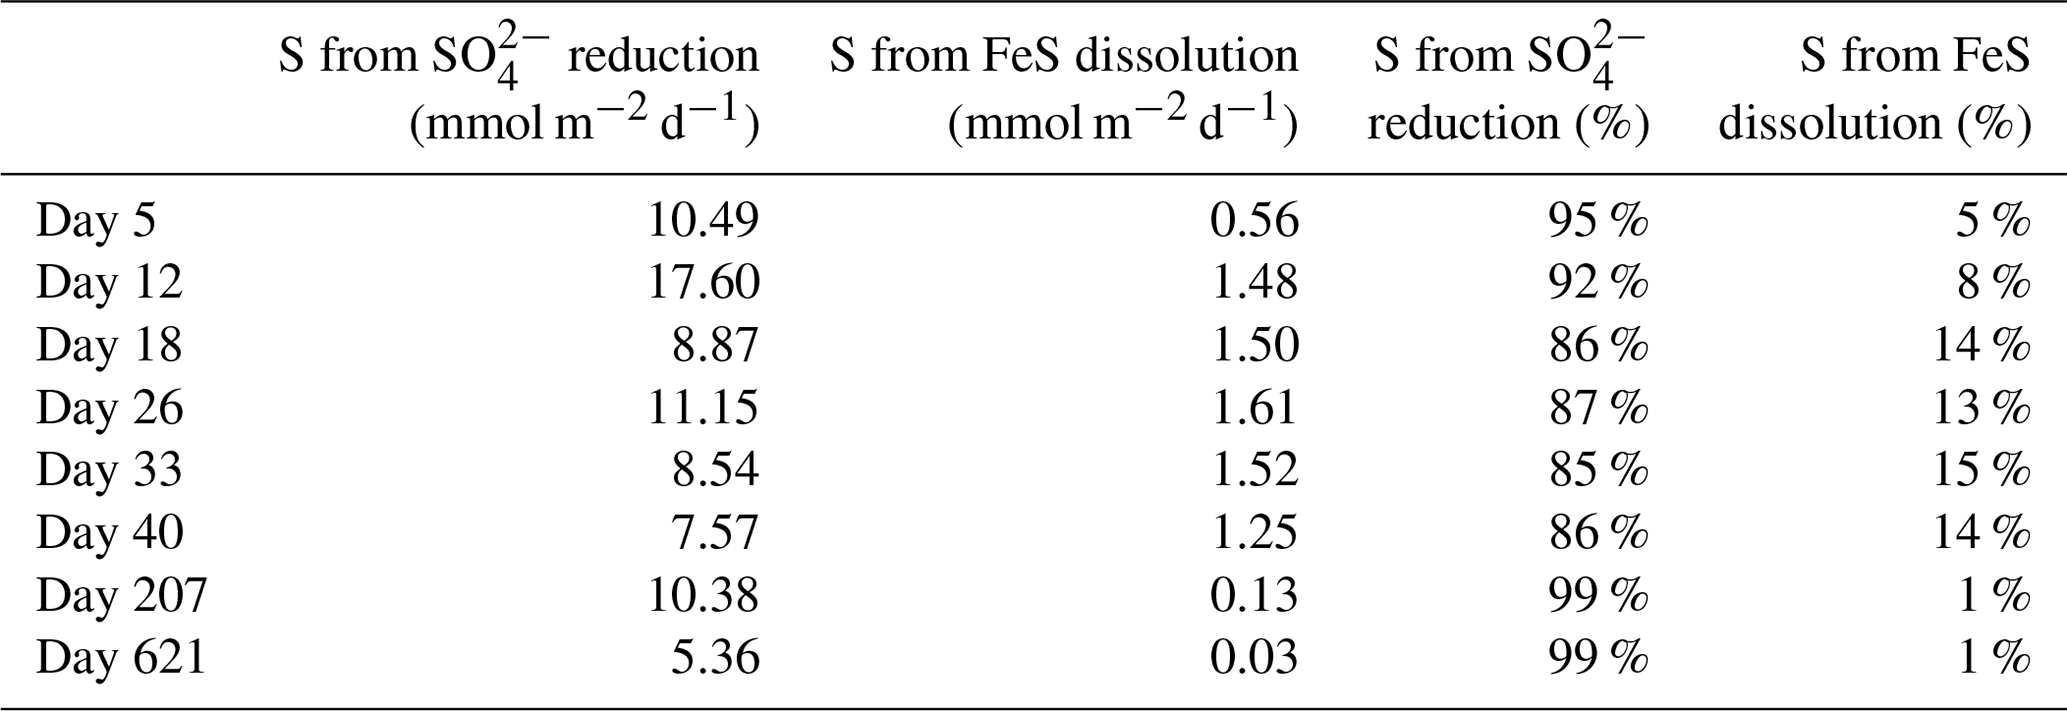
With these data we cannot accurately determine the role of the FeS versus SO reduction in supplying the ∑H2S sustaining the activity of cable bacteria throughout the experiment. This is primarily related to the variability between cores and, for this type of calculation, the low temporal resolution of sampling. However, we can make an estimation of the relative role of SO reduction and FeS dissolution in ∑H2S production, based on the pore water profiles of SO and dissolved Fe2+, and the solid-phase mass balance of FeS and siderite (Fig. 6b and c; Table 4). This estimation shows that SO was mainly responsible for ∑H2S production, accounting for 85 %–99 % (Table 4), and thus, that the dissolution of FeS only played a minor role in providing ∑H2S.
Table 4Sources of ∑H2S calculated from the reduction in SO and the dissolution of FeS. The numbers are presented either as mmol m−2 d−1 or as the relative percentage of the ∑H2S production. The amount of S from the dissolution of FeS was estimated from the upward diffusive flux of Fe2+ (Fig. 6c) and the relative fraction of FeS (FeS∕FeS+siderite), based on the mass balance calculations (Table 3).
4.4 Impact of cable bacteria on Ca, P and Si cycling
Cable bacteria activity is known to lead to the dissolution of Ca carbonates because of the strong acidification of the pore water (Risgaard-Petersen et al., 2012; Rao et al., 2016). We indeed find similar maxima in pore water Ca2+ during the experiment (Fig. 5) and a high upward flux of Ca2+ (up to ∼ 18 mmol m−2 d−1; Figs. 6e and S8), of which a substantial fraction (up to ∼ 55 %) escapes to the overlying water (Fig. S10; Table S4), which is consistent with a previous incubation experiment Rao et al. (2016).
Pore water depth profiles of HPO reveal a production at depth and the removal of all upward-diffusing HPO within the first 1–3 cm of the surface sediment (Fig. 5). A major proportion of this HPO is bound to Fe oxides (Fig. 7). Given that a large proportion of the Fe oxides in our sediment cores derive from the dissolution of siderite, this suggests that the buffer mechanism that delays the benthic release of HPO through retention of P associated with newly formed Fe oxides (Sulu-Gambari et al., 2016b) might also be active in systems that are relatively poor in sedimentary FeS.
The shape of the pore water HPO profiles suggests that some of the HPO is removed below the zone where Fe and Mn oxides are present (Figs. 5 and 7). A possible explanation could be the formation of vivianite, an Fe (II) phosphate mineral. Vivianite formation in sediments typically occurs when pore water levels of Fe2+ and HPO are high and concentrations of ΣH2S are low (Nriagu, 1972), as observed in our study. In our experiment, free ΣH2S does not accumulate in the pore water, which we attribute to removal through the activity of cable bacteria and FeS formation at depth (Figs. 2a and 7). Hence, cable bacteria may create a geochemical niche that allows the formation of vivianite in the suboxic zone. Further work with sediments with higher P concentrations would be needed to assess this with direct measurement techniques, such as X-ray spectroscopy (Kraal et al., 2017; Sulu-Gambari et al., 2018; Egger et al., 2015). Other sediment P pools, i.e. organic, authigenic and detrital P, remained constant over time, indicating that the P contents determined for discrete sediment slices using sequential extractions were not affected by pore water acidification as a result of cable bacteria activity (Table S6).
Pore water H4SiO4 profiles show a typical increase with depth as observed upon the dissolution of biogenic silica in marine sediments (Aller, 2014). Fluxes of H4SiO4 towards the sediment–water interface range up to ∼ 2.8 mmol m−2 d−1 and gradually decreased with time (Figs. 6f and S9). The results of the solute flux incubations indicate that most of this H4SiO4 escaped to the overlying water (ranging from 28 % to 92 %; Table S4; Fig. S10). The decline in the benthic release flux of H4SiO4 contrasts with results of a previous incubation experiment by Rao et al. (2016) with similar pore water concentrations of H4SiO4 that reached values up to ∼ 1 mM. In their study, the flux remained constant over time, possibly because of differences in the amount of biogenic Si in the sediment. The solid-phase metal-oxide-bound Si pool in the surface sediment increased in direct proportion to the formation of Fe oxides throughout the experiment (Fig. 7). Silica is known to absorb to Fe oxides (Sigg and Stumm, 1981; Davis et al., 2002). Hence, the results suggest that the Fe oxides formed through the activity of cable bacteria captured some of the upward-diffusing H4SiO4.
4.5 Sediment marker for cable bacteria activity
Visual observations of core photographs reveal the gradual development of an orange layer (oxic zone), up to 9 mm thick, overlying a grey layer (suboxic zone) and a black layer (sulfidic zone) during the experiment (Fig. S11). This colour zonation is typical for sediments that have been geochemically affected by cable bacteria activity, as seen both in laboratory experiments (Nielsen and Risgaard-Petersen, 2015) and at coastal field sites (Sulu-Gambari et al., 2016a). High-resolution elemental maps of our sediments reveal the development of a ∼ 0.3 mm thin subsurface layer highly enriched in Fe oxides and associated P, 47 d after the start of the incubation (Fig. 8a). While the Fe oxide layer is clearly enriched in P, we also observed a second layer enriched in P that was very close to the sediment–water interface (Fig. 8a). This layer is located above the Fe oxide layer, and in this layer, P is strongly correlated with Ca. Below, we describe the formation of this layer in more detail and explain why such subsurface enrichments, detected with µXRF, may act as an additional sediment marker for present or recent cable bacteria activity (and also in cases where visual observations are not conclusive).
During the experiment, O2 penetration varied within a narrow range and was initially fixed between 1 and 2 mm depth (Fig. 3a), with the layer highly enriched in Fe forming mostly at a depth of 2 mm (Fig. 8a). Such a range in O2 penetration is in accordance with observations in coastal sediments (e.g. Seitaj et al., 2015). The formation of the Fe-enriched layer can be explained by rapid oxidation of upward-diffusing Fe2+ upon contact with O2 (and possibly NO; Fig. 6c). Directly above the Fe oxide layer, a broader ∼ 0.8 mm thick Mn oxide layer was observed (Fig. 8a). This contrast in zonation between Fe and Mn is likely due to the slower oxidation kinetics of Mn2+ compared to Fe2+ (Burdige, 1993; Luther, 2010; Learman et al., 2011).
While the Fe oxide layer is clearly enriched in P, we also observed a second layer enriched in P close to the sediment–water interface (Fig. 8a). In this layer, P is strongly correlated with Ca. This layer likely consists of carbonate fluorapatite (CFA), a Ca-P mineral, which is typically formed in marine sediments (Van Cappellen and Berner, 1988; Ruttenberg and Berner, 1993). Possibly, the high pore water pH near the sediment–water interface (resulting from cathodic O2 reduction by cable bacteria; Fig. 2a) promoted apatite formation (Bellier et al., 2006), and the elevated Ca2+ concentrations (Fig. 5) created a biogeochemical niche for the formation of CFA.
Such focusing of Fe, Mn, P and associated elements within a thin subsurface layer, as a consequence of cable bacteria activity, also occurs in the field. This was demonstrated by Hermans et al. (2020) in a study of a coastal site in the Gulf of Finland where cable bacteria were recently active. Here, µXRF mapping of resin-embedded sediments revealed strong focusing of Fe oxides, Mn (II) phosphates and Fe-bound P within a 3 mm thick layer near the sediment–water interface (Fig. 8b). A reassessment of the µXRF data of Sulu-Gambari et al. (2016a, 2018) of surface sediments with active cable bacteria from the seasonally hypoxic marine Lake Grevelingen in January also revealed similar subsurface enrichments in Fe, Mn and P (Fig. 8c). Importantly, no visual signals for cable bacteria, based on the colour pattern of the sediment, were observed at the time.
Macrofaunal activity likely counteracts or prevents strong focusing of Fe oxides and associated P within such a thin subsurface layer at field sites. Bioturbation, i.e. mixing of the sediment, typically leads to oxidation from the sediment surface downwards (Norkko et al., 2012). Bioirrigation can efficiently pump O2 into the pore water, and thereby enhance the oxidation of dissolved Fe2+ (Kristensen et al., 2012; Norkko et al., 2012), but is not expected to lead to such a sharp oxidation front (Norkko et al., 2012; Hermans et al., 2019a). This is also evident from high-resolution elemental maps of the surface sediment from Lake Grevelingen in May, which shows the disappearance of the thin layer, highly enriched in Fe and P, formed by cable bacteria in January as a consequence of macrofaunal activity in May (Fig. 8d; Seitaj et al., 2015; Sulu-Gambari et al., 2016b).
We conclude that the focusing of Fe, Mn and associated P within a thin layer below the sediment–water interface is likely a consistent feature in sediments populated by active cable bacteria and may act as an additional sediment marker for present or recent cable bacteria activity, both in laboratory experiments and at field sites (and also in cases where visual observations are not conclusive). Focusing of Fe and Mn oxides in the surface sediment is not exclusively tied to the activity of cable bacteria, and it can also occur in the absence of cable bacteria. However, the upward fluxes of Fe2+ and Mn2+ in sediments populated by cable bacteria are higher due to the active dissolution of Fe and Mn minerals at depth (e.g. Risgaard-Petersen et al., 2012; Rao et al., 2016). Hence, within the same time frame following an environmental perturbation (such as a transition to oxic bottom waters after a period of anoxia or mixing of the sediment), more Fe2+ and Mn2+ can oxidise upon contact with O2 near the sediment–water interface, and stronger enrichments of Fe and Mn minerals will be observed. Hence, focusing of Fe and Mn oxides in subsurface sediments is likely more prominent and stronger in sediments populated by active cable bacteria compared to sediments where no cable bacteria are active under such conditions. Macrofaunal activity within natural environments likely counteracts or prevents strong focusing of Fe oxides and associated P within such a thin subsurface layer. When using standard techniques for sediment sampling (i.e. core slicing and chemical analysis of these slices), these layers may be missed due to the relatively coarse depth resolution. Hence, µXRF mapping of epoxy-embedded sediment is recommended.
4.6 Cable bacteria activity at the field site
We can only speculate about the possible in situ relevance of cable bacteria at the coastal site in the western Black Sea where the sediment for our incubation was collected. This site is in a region that is subject to seasonal hypoxia (Capet et al., 2013), where both bivalves (up to ∼ 7200 ind. m−2) and polychaetes (up to ∼ 1700 ind. m−2) were observed at the time of sampling (Lenstra et al., 2019). Macrofauna can inhibit the activity of cable bacteria through bioturbation by physically cutting and damaging the filaments, rendering them unable to transport electrons (Malkin et al., 2014). Recent work has shown, however, that, in some cases, cable bacterial communities can also thrive in sediments with macrofauna (Malkin et al., 2017; Aller et al., 2019; Burdorf et al., 2017). In a study of bivalve reefs, cable bacteria were found to efficiently remove highly toxic ΣH2S, which is beneficial for bivalves (Malkin et al., 2017). Cable bacteria can also be abundant in bioturbated deposits when associated with stable subdomains of the bioturbated zone, such as worm tubes (Aller et al., 2019). In such settings, a more complex precipitation pattern, e.g. along tube linings, is observed (Aller et al., 2019) than described here for laboratory experiments with defaunated sediments and field sediments with an impoverished macrofaunal population (Fig. 8a). Further field studies are required to assess the role of cable bacteria at our field site, preferably including an assessment of the burrow structures.
The results of our laboratory incubation (with a total duration of 621 d) show that cable bacteria can potentially strongly impact the Fe, Mn, P and S dynamics in coastal sediments. The strong acidity of the pore water associated with the activity of cable bacteria, which was monitored using microsensor profiling of the EP during the experiment, led to dissolution of FeS and siderite and the formation of Fe and Mn oxides and Ca-P in mineral form near the sediment surface. Our experimental results provide conclusive evidence for siderite dissolution driven by cable bacteria activity as a source of Fe that can form an Fe-oxide-enriched surface layer. Both FeS and SO reduction provided the ∑H2S required by cable bacteria to sustain their activity. Pore water ∑H2S was always low (< 5 µM). Using µXRF mapping of epoxy-embedded sediment, we show that the activity of cable bacteria led to the development of a thin subsurface sediment layer (0.3 mm) that was highly enriched in Fe and P. The position of this layer in the sediment was directly proportional to the O2 penetration depth during the experiment. We show that a similar layer, highly enriched in Fe and P, was also formed in sediments of field locations populated by cable bacteria (i.e. the marine Lake Grevelingen and the brackish Gulf of Finland). We suggest that such layers, which are not necessarily visible to the naked eye, may be used as a marker of cable bacteria activity in sediments with low macrofaunal activity.
All data, if not directly available from the tables and in the Supplement, will be made available in the PANGAEA database and on ResearchGate. In the meantime, data are available upon request to the main author.
The supplement related to this article is available online at: https://doi.org/10.5194/bg-17-5919-2020-supplement.
MH and CPS designed the experiment. MH carried out the experiment and analysis. All authors interpreted the data. MH and CPS wrote the paper, with comments provided by NRP and FJRM.
The authors declare that they have no conflict of interest.
We are grateful to the captain and crew of R/V Pelagia for their support during the expedition (64PE411). We thank Silvia Hidalgo-Martinez for the FISH analysis and for the SEM image of the cable bacteria filaments. We thank Fatimah Sulu-Gambari for sharing the µXRF data for the sediments from Lake Grevelingen. We also thank Nicole Geerlings, Zongyi Wang, Katrin Wunsch, Tim Hakkert, Wytze Lenstra, Niels van Helmond, Peter Kraal, Matthias Egger, Anton Tramper, Ton Zalm and Coen Mulder for their analytical support.
This research has been supported by the Netherlands Organisation for Scientific Research (NWO; grant nos. 865.13.005 and 016.VICI.170.072), the Research Foundation – Flanders (FWO; grant no. G038819N) and the Danish National Research Foundation (grant nos. DNRF104 and DNRF136).
This paper was edited by Tina Treude and reviewed by two anonymous referees.
Aller, R.: Sedimentary diagenesis, depositional environments, and benthic fluxes, Geochemistry, 2nd Edn., 8, 293–334, Elsevier, Oxford, 2014.
Aller, R. C., Aller, J. Y., Zhu, Q., Heilbrun, C., Klingensmith, I., and Kaushik, A.: Worm tubes as conduits for the electrogenic microbial grid in marine sediments, Sci. Adv., 5, eaaw3651, https://doi.org/10.1126/sciadv.aaw3651, 2019.
APHA: Standard methods for the examination of water and wastewater, American Public Health Association (APHA), Washington, DC, USA, 2005.
Atkinson, M.: Elemental composition of commercial seasalts, Journal of Aquariculture and Aquatic Sciences, 8, 39–43, 1997.
Bellier, N., Chazarenc, F., and Comeau, Y.: Phosphorus removal from wastewater by mineral apatite, Water Res., 40, 2965–2971, 2006.
Berg, P., Risgaard-Petersen, N., and Rysgaard, S.: Interpretation of measured concentration profiles in sediment pore water, Limnol. Oceanogr., 43, 1500–1510, 1998.
Berner, R. A.: Early diagenesis: a theoretical approach, Princeton University Press, New Jersey, 1980.
Bjerg, J. T., Boschker, H. T., Larsen, S., Berry, D., Schmid, M., Millo, D., Tataru, P., Meysman, F. J., Wagner, M., and Nielsen, L. P.: Long-distance electron transport in individual, living cable bacteria, P. Natl. Acad. Sci. USA, 115, 5786–5791, 2018.
Bockris, J. O. M. and Reddy, A. K.: Ion-Ion Interactions, in: Modern Electrochemistry 1, Springer, Boston, MA, https://doi.org/10.1007/0-306-46909-X_3, 2002.
Boudreau, B. P.: Diagenetic models and their implementation, Springer Berlin, 1997.
Boyd, P. and Ellwood, M.: The biogeochemical cycle of iron in the ocean, Nat. Geosci., 3, 675–682, 2010.
Breitburg, D., Levin, L. A., Oschlies, A., Grégoire, M., Chavez, F. P., Conley, D. J., Garçon, V., Gilbert, D., Gutiérrez, D., and Isensee, K.: Declining oxygen in the global ocean and coastal waters, Science, 359, eaam7240, https://doi.org/10.1126/science.aam7240, 2018.
Burdige, D. J.: The biogeochemistry of manganese and iron reduction in marine sediments, Earth Sci. Rev., 35, 249–284, 1993.
Burdige, D. J.: Geochemistry of marine sediments, Princeton University Press, New Jersey, 2006.
Burdorf, L. D. W., Tramper, A., Seitaj, D., Meire, L., Hidalgo-Martinez, S., Zetsche, E.-M., Boschker, H. T. S., and Meysman, F. J. R.: Long-distance electron transport occurs globally in marine sediments, Biogeosciences, 14, 683–701, https://doi.org/10.5194/bg-14-683-2017, 2017.
Burdorf, L. D., Malkin, S. Y., Bjerg, J. T., van Rijswijk, P., Criens, F., Tramper, A., and Meysman, F. J.: The effect of oxygen availability on long-distance electron transport in marine sediments, Limnol. Oceanog., 63, 1799–1816, 2018.
Buresh, R. J. and Moraghan, J.: Chemical Reduction of Nitrate by Ferrous Iron 1, J. Environ. Qual., 5, 320–325, 1976.
Burton, E. D., Bush, R. T., and Sullivan, L. A.: Fractionation and extractability of sulfur, iron and trace elements in sulfidic sediments, Chemosphere, 64, 1421–1428, 2006.
Burton, E. D., Sullivan, L. A., Bush, R. T., Johnston, S. G., and Keene, A. F.: A simple and inexpensive chromium-reducible sulfur method for acid-sulfate soils, Appl. Geochem., 23, 2759–2766, 2008.
Capet, A., Beckers, J.-M., and Grégoire, M.: Drivers, mechanisms and long-term variability of seasonal hypoxia on the Black Sea northwestern shelf – is there any recovery after eutrophication?, Biogeosciences, 10, 3943–3962, https://doi.org/10.5194/bg-10-3943-2013, 2013.
Claff, S. R., Sullivan, L. A., Burton, E. D., and Bush, R. T.: A sequential extraction procedure for acid sulfate soils: partitioning of iron, Geoderma, 155, 224–230, 2010.
Cornelissen, R., Bøggild, A., Thiruvallur Eachambadi, R., Koning, R. I., Kremer, A., Hidalgo-Martinez, S., Zetsche, E.-M., Damgaard, L. R., Bonné, R., and Drijkoningen, J.: The cell envelope structure of cable bacteria, Front. Microbiol., 9, 3044, https://doi.org/10.3389/fmicb.2018.03044, 2018.
Coull, B. C. and Chandler, G. T.: Meiobenthos, in Encyclopedia of Ocean Sciences, edited by: Steele, J. H., Academic Press, San Diego, 726–731, 2001.
Damgaard, L. R., Risgaard-Petersen, N., and Nielsen, L. P.: Electric potential microelectrode for studies of electrobiogeophysics, J. Geophys. Res.-Biogeosci., 119, 1906–1917, 2014.
Davis, C. C., Chen, H.-W., and Edwards, M.: Modeling silica sorption to iron hydroxide, Environ. Sci. Technol., 36, 582–587, 2002.
Diaz, R. J. and Rosenberg, R.: Spreading dead zones and consequences for marine ecosystems, Science, 321, 926–929, 2008.
Egger, M., Jilbert, T., Behrends, T., Rivard, C., and Slomp, C. P.: Vivianite is a major sink for phosphorus in methanogenic coastal surface sediments, Geochim. Cosmochim. Ac., 169, 217–235, 2015.
Fofonoff, N. P. and Millard Jr., R. C.: Algorithms for the computation of fundamental properties of seawater, Paris, France, UNESCO, 53 pp., UNESCO Technical Papers in Marine Sciences, 44, available at: http://hdl.handle.net/11329/109 (last access: 25 November 2020), 1983.
Fossing, H. and Jørgensen, B. B.: Measurement of bacterial sulfate reduction in sediments: evaluation of a single-step chromium reduction method, Biogeochemistry, 8, 205–222, 1989.
Geerlings, N. M. J., Zetsche, E.-M., Hidalgo-Martinez, S., Middelburg, J. J., and Meysman, F. J. R.: Mineral formation induced by cable bacteria performing long-distance electron transport in marine sediments, Biogeosciences, 16, 811–829, https://doi.org/10.5194/bg-16-811-2019, 2019.
Glud, R. N.: Oxygen dynamics of marine sediments, Mar. Biol. Res., 4, 243–289, 2008.
Hermans, M., Lenstra, W., Hidalgo-Martinez, S., van Helmond, N. A., Witbaard, R., Meysman, F., Gonzalez, S., and Slomp, C. P.: Abundance and Biogeochemical Impact of Cable Bacteria in Baltic Sea Sediments, Environ. Sci. Technol., 53, 7494–7503, 2019a.
Hermans, M., Lenstra, W. K., van Helmond, N. A., Behrends, T., Egger, M., Séguret, M. J., Gustafsson, E., Gustafsson, B. G., and Slomp, C. P.: Impact of natural re-oxygenation on the sediment dynamics of manganese, iron and phosphorus in a euxinic Baltic Sea basin, Geochim. Cosmochim. Ac., 246, 174–196, 2019b.
Hermans, M., Astudillo Pascual, M., Behrends, T., Lenstra, W. K., Conley, D. J., and Slomp, C. P.: Coupled dynamics of iron, manganese and phosphorus in brackish coastal sediments populated by cable bacteria, Limnol. Oceanogr., submitted, 2020.
Hovanec, T. A. and Coshland, J. L.: A chemical analysis of select trace elements in synthetic sea salts and natural seawater, Sea Scope, Aquarium Systems, 21, 1–4, 2004.
Jeroschewski, P., Steuckart, C., and Kühl, M.: An amperometric microsensor for the determination of H2S in aquatic environments, Anal. Chem., 68, 4351–4357, 1996.
Jilbert, T., de Lange, G., and Reichart, G. J.: Fluid displacive resin embedding of laminated sediments: preserving trace metals for high-resolution paleoclimate investigations, Limnol. Oceanogr.-Meth., 6, 16–22, 2008.
Jilbert, T. and Slomp, C. P.: Iron and manganese shuttles control the formation of authigenic phosphorus minerals in the euxinic basins of the Baltic Sea, Geochim. Cosmochim. Ac., 107, 155–169, 2013.
Kallmeyer, J., Ferdelman, T. G., Weber, A., Fossing, H., and Jørgensen, B. B.: A cold chromium distillation procedure for radiolabeled sulfide applied to sulfate reduction measurements, Limnol. Oceanogr.-Meth., 2, 171–180, 2004.
Kemp, W. M., Testa, J. M., Conley, D. J., Gilbert, D., and Hagy, J. D.: Temporal responses of coastal hypoxia to nutrient loading and physical controls, Biogeosciences, 6, 2985–3008, https://doi.org/10.5194/bg-6-2985-2009, 2009.
Kjeldsen, K. U., Schreiber, L., Thorup, C. A., Boesen, T., Bjerg, J. T., Yang, T., Dueholm, M. S., Larsen, S., Risgaard-Petersen, N., and Nierychlo, M.: On the evolution and physiology of cable bacteria, P. Natl. Acad. Sci., 116, 19116–19125, 2019.
Koroleff, F.: Determination of ammonia as indophenol blue, International Council for the Exploration of the Sea (ICES), 9, 1969.
Kraal, P., Slomp, C. P., Forster, A., Kuypers, M. M., and Sluijs, A.: Pyrite oxidation during sample storage determines phosphorus fractionation in carbonate-poor anoxic sediments, Geochim. Cosmochim. Ac., 73, 3277–3290, 2009.
Kraal, P., Burton, E. D., and Bush, R. T.: Iron monosulfide accumulation and pyrite formation in eutrophic estuarine sediments, Geochim. Cosmochim. Ac., 122, 75–88, 2013.
Kraal, P. and Slomp, C. P.: Rapid and extensive alteration of phosphorus speciation during oxic storage of wet sediment samples, Plos One, 9, e96859, https://doi.org/10.1371/journal.pone.0096859, 2014.
Kraal, P., Dijkstra, N., Behrends, T., and Slomp, C. P.: Phosphorus burial in sediments of the sulfidic deep Black Sea: Key roles for adsorption by calcium carbonate and apatite authigenesis, Geochim. Cosmochim. Ac., 204, 140–158, 2017.
Kristensen, E., Kristiansen, K. D., and Jensen, M. H.: Temporal behavior of manganese and iron in a sandy coastal sediment exposed to water column anoxia, Estuaries, 26, 690–699, 2003.
Kristensen, E., Penha-Lopes, G., Delefosse, M., Valdemarsen, T., Quintana, C. O., and Banta, G. T.: What is bioturbation? The need for a precise definition for fauna in aquatic sciences, Mar. Ecol. Prog. Ser., 446, 285–302, 2012.
Kristiansen, K., Kristensen, E., and Jensen, E.: The influence of water column hypoxia on the behaviour of manganese and iron in sandy coastal marine sediment, Estuarine, Coast. Shelf Sci., 55, 645–654, 2002.
Kuz'minskii, Y. V., Andriiko, A., and Nyrkova, L.: Chemical and phase composition of manganese oxides obtained by Mn (II) oxidation in nitrate solutions, J. Power Dources, 52, 49–53, 1994.
Larsen, S., Nielsen, L. P., and Schramm, A.: Cable bacteria associated with long-distance electron transport in New England salt marsh sediment, Environ. Microbiol. Rep., 7, 175–179, 2015.
Learman, D., Voelker, B., Vazquez-Rodriguez, A., and Hansel, C.: Formation of manganese oxides by bacterially generated superoxide, Nat. Geosci., 4, 95–98, https://doi.org/10.1038/NGEO1055, 2011.
Lenstra, W., Hermans, M., Séguret, M., Witbaard, R., Behrends, T., Dijkstra, N., Van Helmond, N., Kraal, P., Laan, P., and Rijkenberg, M.: The shelf-to-basin iron shuttle in the Black Sea revisited, Chem. Geol., 511, 314–341, 2019.
Lenstra, W., Séguret, M., Behrends, T., Groeneveld, R., Hermans, M., Witbaard, R., and Slomp, C.: Controls on the shuttling of manganese over the northwestern Black Sea shelf and its fate in the euxinic deep basin, Geochim. Cosmochim. Ac., 273, 177–204, 2020.
Luther, G. W.: The role of one-and two-electron transfer reactions in forming thermodynamically unstable intermediates as barriers in multi-electron redox reactions, Aquatic Geochemistry, 16, 395–420, 2010.
Madison, A. S., Tebo, B. M., Mucci, A., Sundby, B., and Luther, G. W.: Abundant porewater Mn (III) is a major component of the sedimentary redox system, Science, 341, 875–878, 2013.
Malkin, S. Y., Rao, A. M., Seitaj, D., Vasquez-Cardenas, D., Zetsche, E.-M., Hidalgo-Martinez, S., Boschker, H. T., and Meysman, F. J.: Natural occurrence of microbial sulphur oxidation by long-range electron transport in the seafloor, ISME J., 8, 1843–1854, 2014.
Malkin, S. Y., Seitaj, D., Burdorf, L. D., Nieuwhof, S., Hidalgo-Martinez, S., Tramper, A., Geeraert, N., De Stigter, H., and Meysman, F. J.: Electrogenic sulfur oxidation by cable bacteria in bivalve reef sediments, Front. Mar. Sci., 4, 1–19, https://doi.org/10.3389/fmars.2017.00028, 2017.
Marzocchi, U., Trojan, D., Larsen, S., Meyer, R. L., Revsbech, N. P., Schramm, A., Nielsen, L. P., and Risgaard-Petersen, N.: Electric coupling between distant nitrate reduction and sulfide oxidation in marine sediment, ISME J., 8, 1682–1690, 2014.
Meysman, F. J., Risgaard-Petersen, N., Malkin, S. Y., and Nielsen, L. P.: The geochemical fingerprint of microbial long-distance electron transport in the seafloor, Geochim. Cosmochim. Ac., 152, 122–142, 2015.
Meysman, F. J.: Cable bacteria take a new breath using long-distance electricity, Trends Microbiol., 26, 411–422, 2018.
Meysman, F. J., Cornelissen, R., Trashin, S., Bonné, R., Martinez, S. H., van der Veen, J., Blom, C. J., Karman, C., Hou, J.-L., and Eachambadi, R. T.: A highly conductive fibre network enables centimetre-scale electron transport in multicellular cable bacteria, Nat. Commun., 10, 1–8, 2019.
Millero, F. J., Plese, T., and Fernandez, M.: The dissociation of hydrogen sulfide in seawater 1, Limnol. Oceanogr., 33, 269–274, 1988.
Morgan, B., Burton, E. D., and Rate, A. W.: Iron monosulfide enrichment and the presence of organosulfur in eutrophic estuarine sediments, Chem. Geol., 296, 119–130, 2012.
Müller, H., Bosch, J., Griebler, C., Damgaard, L. R., Nielsen, L. P., Lueders, T., and Meckenstock, R. U.: Long-distance electron transfer by cable bacteria in aquifer sediments, ISME J., 10, 2010–2019, 2016.
Murphy, J. and Riley, J.: A single-solution method for the determination of soluble phosphate in sea water, J. Mar. Biol. Assoc. UK, 37, 9–14, 1958.
Naudet, V. and Revil, A.: A sandbox experiment to investigate bacteria-mediated redox processes on self-potential signals, Geophys. Res. Lett., 32, 1–4, https://doi.org/10.1029/2005GL022735, 2005.
Nielsen, L. P., Risgaard-Petersen, N., Fossing, H., Christensen, P. B., and Sayama, M.: Electric currents couple spatially separated biogeochemical processes in marine sediment, Nature, 463, 1071–1074, 2010.
Nielsen, L. P., and Risgaard-Petersen, N.: Rethinking sediment biogeochemistry after the discovery of electric currents, Ann. Rev. Mar. Sci., 7, 425–442, 2015.
Norkko, J., Reed, D. C., Timmermann, K., Norkko, A., Gustafsson, B. G., Bonsdorff, E., Slomp, C. P., Carstensen, J., and Conley, D. J.: A welcome can of worms? Hypoxia mitigation by an invasive species, Glob. Change Biol., 18, 422–434, 2012.
Nriagu, J. O.: Stability of vivianite and ion-pair formation in the system Fe3(PO4)2-H3PO4H3PO4-H2O, Geochim. Cosmochim. Ac., 36, 459–470, 1972.
Pernthaler, J., Glöckner, F.-O., Schönhuber, W., and Amann, R.: Fluorescence in situ hybridization (FISH) with rRNA-targeted oligonucleotide probes, Meth. Microbiol., 30, 207–226, 2001.
Pfeffer, C., Larsen, S., Song, J., Dong, M., Besenbacher, F., Meyer, R. L., Kjeldsen, K. U., Schreiber, L., Gorby, Y. A., and El-Naggar, M. Y.: Filamentous bacteria transport electrons over centimetre distances, Nature, 491, 218–221, 2012.
Poulton, S. W. and Canfield, D. E.: Development of a sequential extraction procedure for iron: implications for iron partitioning in continentally derived particulates, Chem. Geol., 214, 209–221, 2005.
Rabalais, N. N., Turner, R. E., and Wiseman Jr., W. J.: Gulf of Mexico hypoxia, aka “The dead zone”, Annual Review of ecology and Systematics, 33, 235–263, 2002.
Rabalais, N. N., Cai, W.-J., Carstensen, J., Conley, D. J., Fry, B., Hu, X., Quinones-Rivera, Z., Rosenberg, R., Slomp, C. P., and Turner, R. E.: Eutrophication-driven deoxygenation in the coastal ocean, Oceanography, 27, 172–183, 2014.
Rabouille, C., Denis, L., Dedieu, K., Stora, G., Lansard, B., and Grenz, C.: Oxygen demand in coastal marine sediments: comparing in situ microelectrodes and laboratory core incubations, J. Exp. Mar. Biol. Ecol., 285, 49–69, 2003.
Raiswell, R. and Canfield, D. E.: The iron biogeochemical cycle past and present, Geochemi. Perspect., 1, 1–2, 2012.
Rao, A. M., Malkin, S. Y., Hidalgo-Martinez, S., and Meysman, F. J.: The impact of electrogenic sulfide oxidation on elemental cycling and solute fluxes in coastal sediment, Geochim. Cosmochim. Ac., 172, 265–286, 2016.
Rasmussen, H. and Jørgensen, B. B.: Microelectrode studies of seasonal oxygen uptake in a coastal sediment: role of molecular diffusion, Mar. Ecol. Prog. Ser., 81, 289–303, 1992.
Reed, D. C., Slomp, C. P., and Gustafsson, B. G.: Sedimentary phosphorus dynamics and the evolution of bottom-water hypoxia: A coupled benthic–pelagic model of a coastal system, Limnol. Oceanogr., 56, 1075–1092, 2011.
Revil, A., Mendonça, C., Atekwana, E., Kulessa, B., Hubbard, S., and Bohlen, K.: Understanding biogeobatteries: Where geophysics meets microbiology, J. Geophys. Res.-Biogeosci., 115, 1–22, https://doi.org/10.1029/2009JG001065, 2010.
Revil, A., Karaoulis, M., Johnson, T., and Kemna, A.: Some low-frequency electrical methods for subsurface characterization and monitoring in hydrogeology, Hydrogeol. J., 20, 617–658, 2012.
Riedel, B., Zuschin, M., and Stachowitsch, M.: Tolerance of benthic macrofauna to hypoxia and anoxia in shallow coastal seas: a realistic scenario, Mar. Ecol. Prog. Ser., 458, 39–52, 2012.
Risgaard-Petersen, N., Revil, A., Meister, P., and Nielsen, L. P.: Sulfur, iron-, and calcium cycling associated with natural electric currents running through marine sediment, Geochim. Cosmochim. Ac., 92, 1–13, 2012.
Risgaard-Petersen, N., Damgaard, L. R., Revil, A., and Nielsen, L. P.: Mapping electron sources and sinks in a marine biogeobattery, J. Geophys. Res.-Biogeo., 119, 1475–1486, 2014.
Risgaard-Petersen, N., Kristiansen, M., Frederiksen, R. B., Dittmer, A. L., Bjerg, J. T., Trojan, D., Schreiber, L., Damgaard, L. R., Schramm, A., and Nielsen, L. P.: Cable bacteria in freshwater sediments, Appl. Environ. Microbiol., 81, 6003–6011, 2015.
Ruttenberg, K. C.: Development of a sequential extraction method for different forms of phosphorus in marine sediments, Limnol. Oceanogr., 37, 1460–1482, 1992.
Ruttenberg, K. C. and Berner, R. A.: Authigenic apatite formation and burial in sediments from non-upwelling, continental margin environments, Geochim. Cosmochim. Ac., 57, 991–1007, 1993.
Sandfeld, T., Marzocchi, U., Petro, C., Schramm, A., and Risgaard-Petersen, N.: Electrogenic sulfide oxidation mediated by cable bacteria stimulates sulfate reduction in freshwater sediments, ISME J., 14, 1233–1246, 2020.
Schauer, R., Risgaard-Petersen, N., Kjeldsen, K. U., Bjerg, J. J. T., Jørgensen, B. B., Schramm, A., and Nielsen, L. P.: Succession of cable bacteria and electric currents in marine sediment, ISME J., 8, 1314–1322, https://doi.org/10.1038/ismej.2013.239, 2014.
Schmidtko, S., Stramma, L., and Visbeck, M.: Decline in global oceanic oxygen content during the past five decades, Nature, 542, 335–339, https://doi.org/10.1038/nature21399, 2017.
Seitaj, D., Schauer, R., Sulu-Gambari, F., Hidalgo-Martinez, S., Malkin, S. Y., Burdorf, L. D., Slomp, C. P., and Meysman, F. J.: Cable bacteria generate a firewall against euxinia in seasonally hypoxic basins, P. Natl. Acad. Sci. USA, 112, 13278–13283, 2015.
Sigg, L. and Stumm, W.: The interaction of anions and weak acids with the hydrous goethite (α-FeOOH) surface, Colloid. Surface., 2, 101–117, 1981.
Slomp, C. P., Epping, E. H., Helder, W., and Raaphorst, W. V.: A key role for iron-bound phosphorus in authigenic apatite formation in North Atlantic continental platform sediments, J. Mar. Res., 54, 1179–1205, 1996.
Straub, K. L., Benz, M., Schink, B., and Widdel, F.: Anaerobic, nitrate-dependent microbial oxidation of ferrous iron, Appl. Environ. Microbiol., 62, 1458–1460, 1996.
Sulu-Gambari, F., Seitaj, D., Behrends, T., Banerjee, D., Meysman, F. J., and Slomp, C. P.: Impact of cable bacteria on sedimentary iron and manganese dynamics in a seasonally-hypoxic marine basin, Geochim. Cosmochim. Ac., 192, 49–69, 2016a.
Sulu-Gambari, F., Seitaj, D., Meysman, F. J., Schauer, R., Polerecky, L., and Slomp, C. P.: Cable bacteria control iron–phosphorus dynamics in sediments of a coastal hypoxic basin, Environ. Sci. Technol., 50, 1227–1233, 2016b.
Sulu-Gambari, F., Hagens, M., Behrends, T., Seitaj, D., Meysman, F. J., Middelburg, J., and Slomp, C. P.: Phosphorus cycling and burial in sediments of a seasonally hypoxic Marine Basin, Estuar. Coast., 41, 921–939, 2018.
Trojan, D., Schreiber, L., Bjerg, J. T., Bøggild, A., Yang, T., Kjeldsen, K. U., and Schramm, A.: A taxonomic framework for cable bacteria and proposal of the candidate genera Electrothrix and Electronema, Syst. Appl. Microbiol., 39, 297–306, 2016.
Van Cappellen, P., and Berner, R. A.: A mathematical model for the early diagenesis of phosphorus and fluorine in marine sediments; apatite precipitation, Am. J. Sci., 288, 289–333, 1988.
van de Velde, S., Lesven, L., Burdorf, L. D., Hidalgo-Martinez, S., Geelhoed, J. S., Van Rijswijk, P., Gao, Y., and Meysman, F. J.: The impact of electrogenic sulfur oxidation on the biogeochemistry of coastal sediments: A field study, Geochim. Cosmochim. Ac., 194, 211–232, 2016.
Vasquez-Cardenas, D., Van De Vossenberg, J., Polerecky, L., Malkin, S. Y., Schauer, R., Hidalgo-Martinez, S., Confurius, V., Middelburg, J. J., Meysman, F. J., and Boschker, H. T.: Microbial carbon metabolism associated with electrogenic sulphur oxidation in coastal sediments, ISME J., 9, 1966–1978, https://doi.org/10.1038/ismej.2015.10, 2015.
Wang, Y. and Van Cappellen, P.: A multicomponent reactive transport model of early diagenesis: Application to redox cycling in coastal marine sediments, Geochim. Cosmochim. Ac., 60, 2993–3014, 1996.
Wijsman, J. W., Middelburg, J. J., Herman, P. M., Böttcher, M. E., and Heip, C. H.: Sulfur and iron speciation in surface sediments along the northwestern margin of the Black Sea, Mar. Chem., 74, 261–278, 2001.