the Creative Commons Attribution 4.0 License.
the Creative Commons Attribution 4.0 License.
 | 03 Dec 2020
New insight to niche partitioning and ecological function of ammonia oxidizing archaea in subtropical estuarine ecosystem
Yanhong Lu
Shunyan Cheung
Ling Chen
Shuh-Ji Kao
Xiaomin Xia
Jianping Gan
Minhan Dai
Nitrification plays a central role in the estuarine nitrogen cycle. Previous studies in estuary mainly focused on the niche partition between ammonia-oxidizing archaea (AOA) and bacteria (AOB), while the diversity, activity, biogeography, and ecophysiology of different AOA groups remained unclear. Here, we for the first time report on niche partitioning and differentially distributed active populations among diverse AOA (inferred from amoA gene) in a typical subtropical estuary – Pearl River estuary (PRE). In the water column of the PRE, the AOA communities mainly consisted of water column A (WCA) and SCM1-like (Nitrosopumilus maritimus-like) sublineages. Surprisingly, we observed a strong disagreement in AOA communities at DNA and RNA levels. In DNA samples, WCA generally dominated the AOA community, and the distributional pattern indicated that WCA I and WCA II sublineages preferred oceanic and coastal conditions, respectively. In contrast, diverse SCM1-like sublineages were identified, and outnumbered WCA at RNA level, in which SCM1-like-III was limited to freshwater, while the rest of the sublineages were widely distributed in the estuary. The SCM1-like sublineages strongly correlated with nitrification rate, which indicated their important contribution to ammonia oxidation. Furthermore, intense nitrification contributed significantly to hypoxia conditions (nitrification contributed averaged 12.18 % of oxygen consumption) in the estuary. These results revealed different ammonia-oxidizing activities and niche partitioning among different AOA sublineages in estuarine water, which was unexplored in previous DNA and clone library-based studies. The ecological significance and functioning of the diverse AOA should be further explored in the marine ecosystem.
- Article
(8291 KB) - Full-text XML
-
Supplement
(921 KB) - BibTeX
- EndNote


Nitrification is a microbial mediated oxidation process of ammonia to nitrate, interconnects the source (N fixation) and sink (N loss), and plays a central role in the marine nitrogen cycling (Ward, 1996). Particularly in the estuarine ecosystem, nitrification significantly impacts the N source for primary production and oxygen levels in the water column (Yool et al., 2007; Erguder et al., 2009; Campbell et al., 2019). Regarding the biogeochemical significance of ammonia oxidation (i.e., the first and rate-determining step of nitrification) in the estuarine ecosystem, the physiology and ecological function of ammonia oxidizers (i.e., ammonia-oxidizing archaea, AOA, and bacteria, AOB) have been of major interest for understanding the estuarine N transformation (Bernhard and Bollmann, 2010). Previous studies were mostly conducted in the sediment of estuarine ecosystems (summarized in Table S1; Damashek et al., 2016). These studies mainly focused on the niche partition between AOA and AOB, inferred from amoA gene abundance, and collectively showed that AOA outnumbered AOB in the estuarine ecosystem (Caffrey et al., 2007; Abell et al., 2010; Bernhard et al., 2010). However, the biogeography, niche partition, and ecological function of different AOA groups were analyzed very little (Table S1).
Based on the amoA gene (ammonia monooxygenase subunit A), the marine AOA was recognized as consisting of three major groups, namely water column A (WCA; shallow water ecotype dominating in epipelagic and upper mesopelagic water), water column B (WCB; deep water ecotype dominating in mesopelagic and bathypelagic water) and SCM1-like (affiliated to the first isolated AOA–Nitrosopumilus maritimus SCM1), corresponding to the group NP ϵ, NP α and NP γ, respectively, in the global synthesis of Alves et al. (2018; Cheung et al., 2019). The distribution and abundance of WCA and WCB were much more studied than the SCM1-like ecotype in the field observations (Francis et al., 2005; Hallam et al., 2006; Beman et al., 2008, 2012). Recently, highly diverse sublineages of WCA and WCB were revealed in the global ocean in which sublineage within each ecotype displayed varied distributional patterns and environmental determinants (Cheung et al., 2019). Since most of the marine AOA remained uncultivated, our understanding of the ecophysiology of most of the AOA (especially WCA and WCB) in marine ecosystems relied heavily on field observations (Alves et al., 2018). For example, niche partitioning between WCB sublineages has been recently observed in the oxygen minimum zone off the Costa Rica Thermal Dome, and potential anoxic adapted phylotypes were widely detected between the geographically distant oxygen minimum zones (OMZs; Lu et al., 2019).
As mentioned, population dynamics and ecological function of different AOA were rarely studied in the estuarine water compared to the relatively well-characterized AOA populations in oceanic waters and sediment and soil environments (Bernhard and Bollmann, 2010; Damashek et al., 2016). Previous studies of marine AOA relied mainly on clone library analyses (summarized in Table S1), which were insufficient to recover the diversity and biogeography of AOA. Moreover, studies relying on DNA surveys do not provide information of active AOA communities. Recently, Wu et al. (2017), reported differentially transcriptional activities of terrestrial AOA communities inferred from DNA and RNA extracts, suggesting that studies using DNA may have underestimated the importance of some active AOA groups in the natural environments (Wu et al., 2017). In this study, we have conducted a comprehensive study about ammonia oxidizers in a typical subtropical estuary – the Pearl River estuary (PRE) – characterized by its salt wedge structure resulting from a large amount of freshwater discharge during the wet season (Harrison et al., 2008). Recently, the recurrence of bottom water hypoxia at the lower estuary of PRE has caused increasing concerns about its ecological impact on the estuarine ecosystem (Qian et al., 2018; Zhao et al., 2020). The steep natural gradients of salinity, nutrients, oxygen concentration, and turbidity make the Pearl River estuary an ideal environment to study the diversity and ecological function of ammonia oxidizers. By revealing the AOA community structure (dominant ammonia oxidizer) at DNA and RNA levels using high throughput sequencing and fine-scale phylogenetic classification, along with a quantification of AOA and AOB and a nitrification rate measurement, we aim to (1) identify the major and active AOA in the estuarine ecosystem, (2) reveal niche partitioning between different AOA sublineages based on environmental determinants, and (3) determine the potential contribution of nitrification to hypoxia formation in PRE.
2.1 Sample collection
The cruise was conducted from 11 July to 1 August 2017 on research vessel (R/V) Hai Ke 68. In the first leg, 83 stations were designed within the 10–50 m isobaths, covering areas from the upper estuary to the continental shelf (Fig. S1). Water samples were collected using Niskin bottles equipped with a conductivity, temperature, and depth (CTD) sensor (Sea-Bird SBE 917plus). Temperature, salinity, and depth data were acquired through the CTD sensor. The dissolved oxygen concentrations were measured onboard using the Winkler spectrophotometric and titration method (Pai et al., 2001; Dai et al., 2006; Zhao et al., 2020). Dissolved inorganic nutrient samples were filtered through preacid washed cellulose acetate fiber membranes and stored in −20∘ until analysis in a land-based laboratory at Xiamen University (Qian et al., 2018). Ammonium concentration was measured onboard using the indophenol blue spectrophotometric method (Pai et al., 2001). Chlorophyll a samples (250 to 500 mL) were filtered onto GF/F glass microfiber filters (Whatman, USA) and stored in foil bags in liquid nitrogen. The chlorophyll a concentration was measured with a Turner fluorometer (Welschmeyer, 1994) after being extracted with 90 % acetone for 14 h at −20∘. The microbial abundances were quantified by a Becton Dickinson FACSCalibur flow cytometer (Vaulot et al., 1989). Seawater for microbial abundance quantification was prefiltered through a 20 µm mesh, fixed with final concentration of 0.5 % seawater-buffed paraformaldehyde in cryotubes, and stored in liquid nitrogen until the flow cytometric analysis (Liu et al., 2014). At each sampling depth, 0.5–2 L of seawater were sequentially filtrated onto 3 and 0.2 µm polycarbonate membranes (GVS, USA) for particle-attached and free-living microbes. DNA and RNA samples were immersed in 500 µL RNAlater (Ambion, Austin, TX, USA) before being stored in liquid nitrogen.
2.2 Rates measurement
Community respiration rates (CR) were estimated by measuring the oxygen consumption in triplicate 60 mL biological oxygen demand (BOD) bottles without headspace after a 24 h dark incubation in which the bottles were submerged in seawater continuously pumped from sea surface. Nitrification was measured by incubating 15NH amended (less than 10 % of ambient concentration) seawater in duplicate 200 mL high-density polyethylene (HDPE) bottles in the dark for 6–12 h, with the temperature controlled by running seawater. After incubation, filtrate (0.2 µm syringe filtered) was collected and stored in −20∘ for downstream 15NO (15NONO) analysis (Sigman et al., 2001).
The nitrification rates were calculated using the following equation:
In Eq. (1), AOb is the bulk nitrification rate. Rt0NO and Rt NO are the ratios (in percent) of 15N in the NO pool measured at the outset (t0) and termination (t) of the incubation. [NO]t0 and [NO]t are the concentrations of NO at the outset and termination of the incubation, respectively. [14NH] is the ambient NH concentration. [15NH] is the final ammonium concentration after the addition of the stable isotope tracer (15NH). The NO was completely converted to N2O by a single strain of denitrifying bacteria (Pseudomonas aureofaciens; ATCC no. 13985) which lacks N2O-reductase activity (Sigman et al., 2001). The converted N2O was further analyzed using an isotope ratio mass spectrometer (IRMS; Thermo Fisher Scientific DELTA V Plus) to calculate the isotopic composition of NO (Sigman et al., 2001; Casciotti et al., 2002; Knapp et al., 2005). We analyzed the correlation between nitrification rates and AOA sublineages. Equation (2) was generally considered as the oxidation of ammonia to nitrite. Once inferred from the nitrification rates, we estimated the nitrification oxygen demand (NOD) based on Eq. (2). We used the NOD ∕ CR ratio (percent) to evaluate the potential contribution of nitrification to total oxygen consumption in the field.
2.3 DNA and RNA extraction and cDNA synthesis
The sample filters immersed in RNAlater were thawed on ice. RNAlater was removed following the procedure described in Xu et al. (2013). For the DNA extraction, filters were cut into pieces and carefully collected into the 2 mL lysing matrix E tubes with the addition of 978 µL sodium phosphate buffer and 122 µL MT buffer provided in the FastDNA™ SPIN kit for soil (MP Biomedicals; Solon, OH, USA). The lysing matrix was homogenized by a Mini-Beadbeater-24 (BioSpec Products; Bartlesville, OK, USA), at 3500 oscillations per minute for 60 s. The subsequent procedures of DNA extraction were performed according to the FastDNA SPIN kit for soil manufacture's instructions and preserved at −80∘. For the RNA extraction, sample filters were incubated in 1 mL TRIzol for 5 min at room temperature in 2 mL sterile microcentrifuge tubes. After the incubation, 200 µL chloroform was added into the tubes and mixed vigorously by hand until the membrane fully dissolved. After room temperature incubation for 3 min, the samples were centrifuged at 12 000× g and 4∘ for 15 min. The supernatant was carefully transferred into a new 2 mL microcentrifuge and mixed with an equal volume of 70 % ethanol. The purification and elution procedures were performed according to the manufacture's instructions for the PureLink RNA minikit (Life Technologies; Carlsbad, CA, USA). RNA samples were immediately treated with deoxyribonuclease (DNase) at 37∘ for 30 min, using the TURBO DNA-free kit to eliminate DNA contamination. After incubation, the DNase was inactivated following the manufacturer's instructions. The DNA-free RNA samples were reversely transcribed into cDNA with random primers, using the SuperScript III first-strand synthesis system (Life Technologies; Carlsbad, CA, USA). The synthesized cDNA was further treated with RNase H at 37∘ for 20 min to remove the residual RNA.
2.4 Polymerase chain reaction (PCR) amplification and high throughput sequencing
The DNA and cDNA were used as templates in the polymerase chain reaction (PCR) amplification. The archaeal amoA gene fragments were amplified using the bar coded primers Arch-amoAF (5′ adaptor + bar code + GAT + STAATGGTCTGGCTTAGACG 3′) and Arch-amoAR (5′ adaptor + bar code + GAT + GCGGCCATCCATCTGTATGT 3′; Francis et al., 2005). Triplicated PCR reactions were performed in a 12.5 µL mixture containing a 1× PCR buffer, 2 mM MgCl2, a 0.2 mM deoxynucleotide (dNTP) mix, a 0.4 µM of respective primers, 2 U Invitrogen Platinum Taq DNA polymerase (Life Technologies, Carlsbad, CA, USA), and 1 µL template. The PCR thermal cycle consisted of a 5 min initial denaturation at 95∘ and was followed by 33 cycles of 95∘ for 30 s, 53∘ for 45 s, 72∘ for 60 s, and 10 min of the final extension step at 72∘. The triplicated PCR products of each sample were pooled together and sequenced on the Ion GeneStudio S5 system (Thermo Fisher Scientific, USA) which could generate around 600 bp high quality reads.
2.5 Standard curve construction and quantitative PCR
The amoA gene of AOA and β-AOB amoA was amplified by the primer pair of Arch-amoAF-amoAR (Francis et al., 2005) and amoA-1F and amo-2R (Rotthauwe et al., 1997), respectively, using the DNA mixture from A-transect samples. The PCR products were purified using the illustra GFX PCR DNA and gel band purification kit (Cytiva, UK) and ligated into T vector pMD19 at 4∘ for 12 h (Takara Bio, Japan). The ligated vectors solution was mixed with a freshly prepared E. coli BL21 competent cell and incubated on ice for 30 min. Heat-shock treatments at 42∘ were performed for the mixture for 90 s, and they were incubated on ice for 5 min. After 5 min incubation, 200 µL of liquid lysogeny broth was added and incubated at 37∘ for 1 h in an incubator shaker (250 revolutions per minute – rpm). The culture was soon spread onto ampicillin-containing plates (100 mg L−1) and incubated at 37∘ for 12 h. The white clone was selected and confirmed with the respective PCR amplification. The clones were expanded with an ampicillin (100 mg L−1) lysogeny broth and sequenced in BGI (BGI Group; Shenzhen, China). The sequence of the selected plasmid was confirmed as an archaeal amoA gene by a blast against the National Center for Biotechnology Information (NCBI) database. The plasmid of the selected clone was extracted and purified by the TIANprep miniplasmid kit (TIANGEN, China). The extracted plasmid was linearized by EcoRI (New England Biolabs) at 37∘ for 12 h and purified by electrophoresis on 1.2 % agarose gel. The linearized plasmid DNA concentration was determined via a double-stranded DNA (dsDNA) high sensitivity (HS) assay on the Qubit fluorometer v3.0 (Thermo Fisher Scientific, Singapore). Series dilution of the linearized plasmids was amplified as standard curves, together with the field samples, on the 384 well plates on a Roche LightCycler 480.
Triplicated quantitative PCR (qPCR) was performed in a 10 µL mixture containing 1× LightCycler® 480 SYBR® Green I Master, 0.5 µM primers pairs and DNA templates. The thermal cycle of the qPCR that targeted the archaeal amoA gene consisted of a 5 min denaturation at 95∘, followed by 45 cycles each at 95∘ for 30 s, 53∘ (60∘ for β-AOB), and for 45 s, 72∘ for 60 s, with single signal acquisition at the end of each cycle. Amplification specificity was confirmed via the melting curve and gel electrophoresis. In both particle-attached (> 3 µm) and free-living (0.2–3 µm) DNA (and RNA), the AOA and β-AOB were quantified based on the amoA gene abundance through the qPCR (Table S2).
2.6 Bioinformatic analysis
The archaeal amoA gene sequencing data of 76 samples (containing 2523 reads per sample) were analyzed using the microbial ecology community software program of Mothur (Schloss et al., 2009). The sequencing output was split according to corresponding bar code sequences in the forward primer. Quality control was performed by discarding the reads with low quality (average quality score < 20), incorrect length (no shorter than 300 bp and no longer than 630 bp), ambiguous bases, or homopolymers longer than 8 bp. The chimeric sequences were identified and discarded by the chimera.uchime package in Mothur. The remaining high-quality sequences were aligned with the reference amoA sequences from the NCBI database, using Mothur (Agarwala et al., 2018), and were clustered into operational taxonomic units (OTUs) at 95 % DNA similarity. The singletons and doubletons were discarded from the OTU table before downstream analyses. The representative sequences of the top OTUs were randomly selected through getotu.rep in Mothur and searched against the NCBI database using blastn. The top OTUs were selected based on relative abundance ≥ 0.1 % (Logares et al., 2014). The maximum likelihood (ML) phylogenetic tree was constructed in MEGA 7 with the recommended model (T92 + G + I) after the best model selection. The ML tree was further edited with the interactive tree of life (iTOL; Letunic and Bork, 2016). The Bray–Curtis dissimilarities among the AOA communities were calculated with the vegdist function of the vegan package in R. Nonmetric multidimensional scaling (NMDS) analysis was performed based on the Bray–Curtis dissimilarities with the vegan package and visualized with ggplot2 package in R (Oksanen, et al., 2019; Wickham, 2016).
Considering the strong stratification and steep variation in environmental factors that are associated with the freshwater discharge in the PRE, a Spearman correlation analysis was performed to determine the relationship between the AOA sublineages and environmental factors in surface DNA, surface RNA, bottom DNA, and bottom RNA samples, respectively. In addition, a Spearman correlation analysis was performed between nitrification rates and amoA gene (AOA and β-AOB) abundances retrieved from particle-attached (> 3 µm) and free-living (3–0.2 µm) samples.
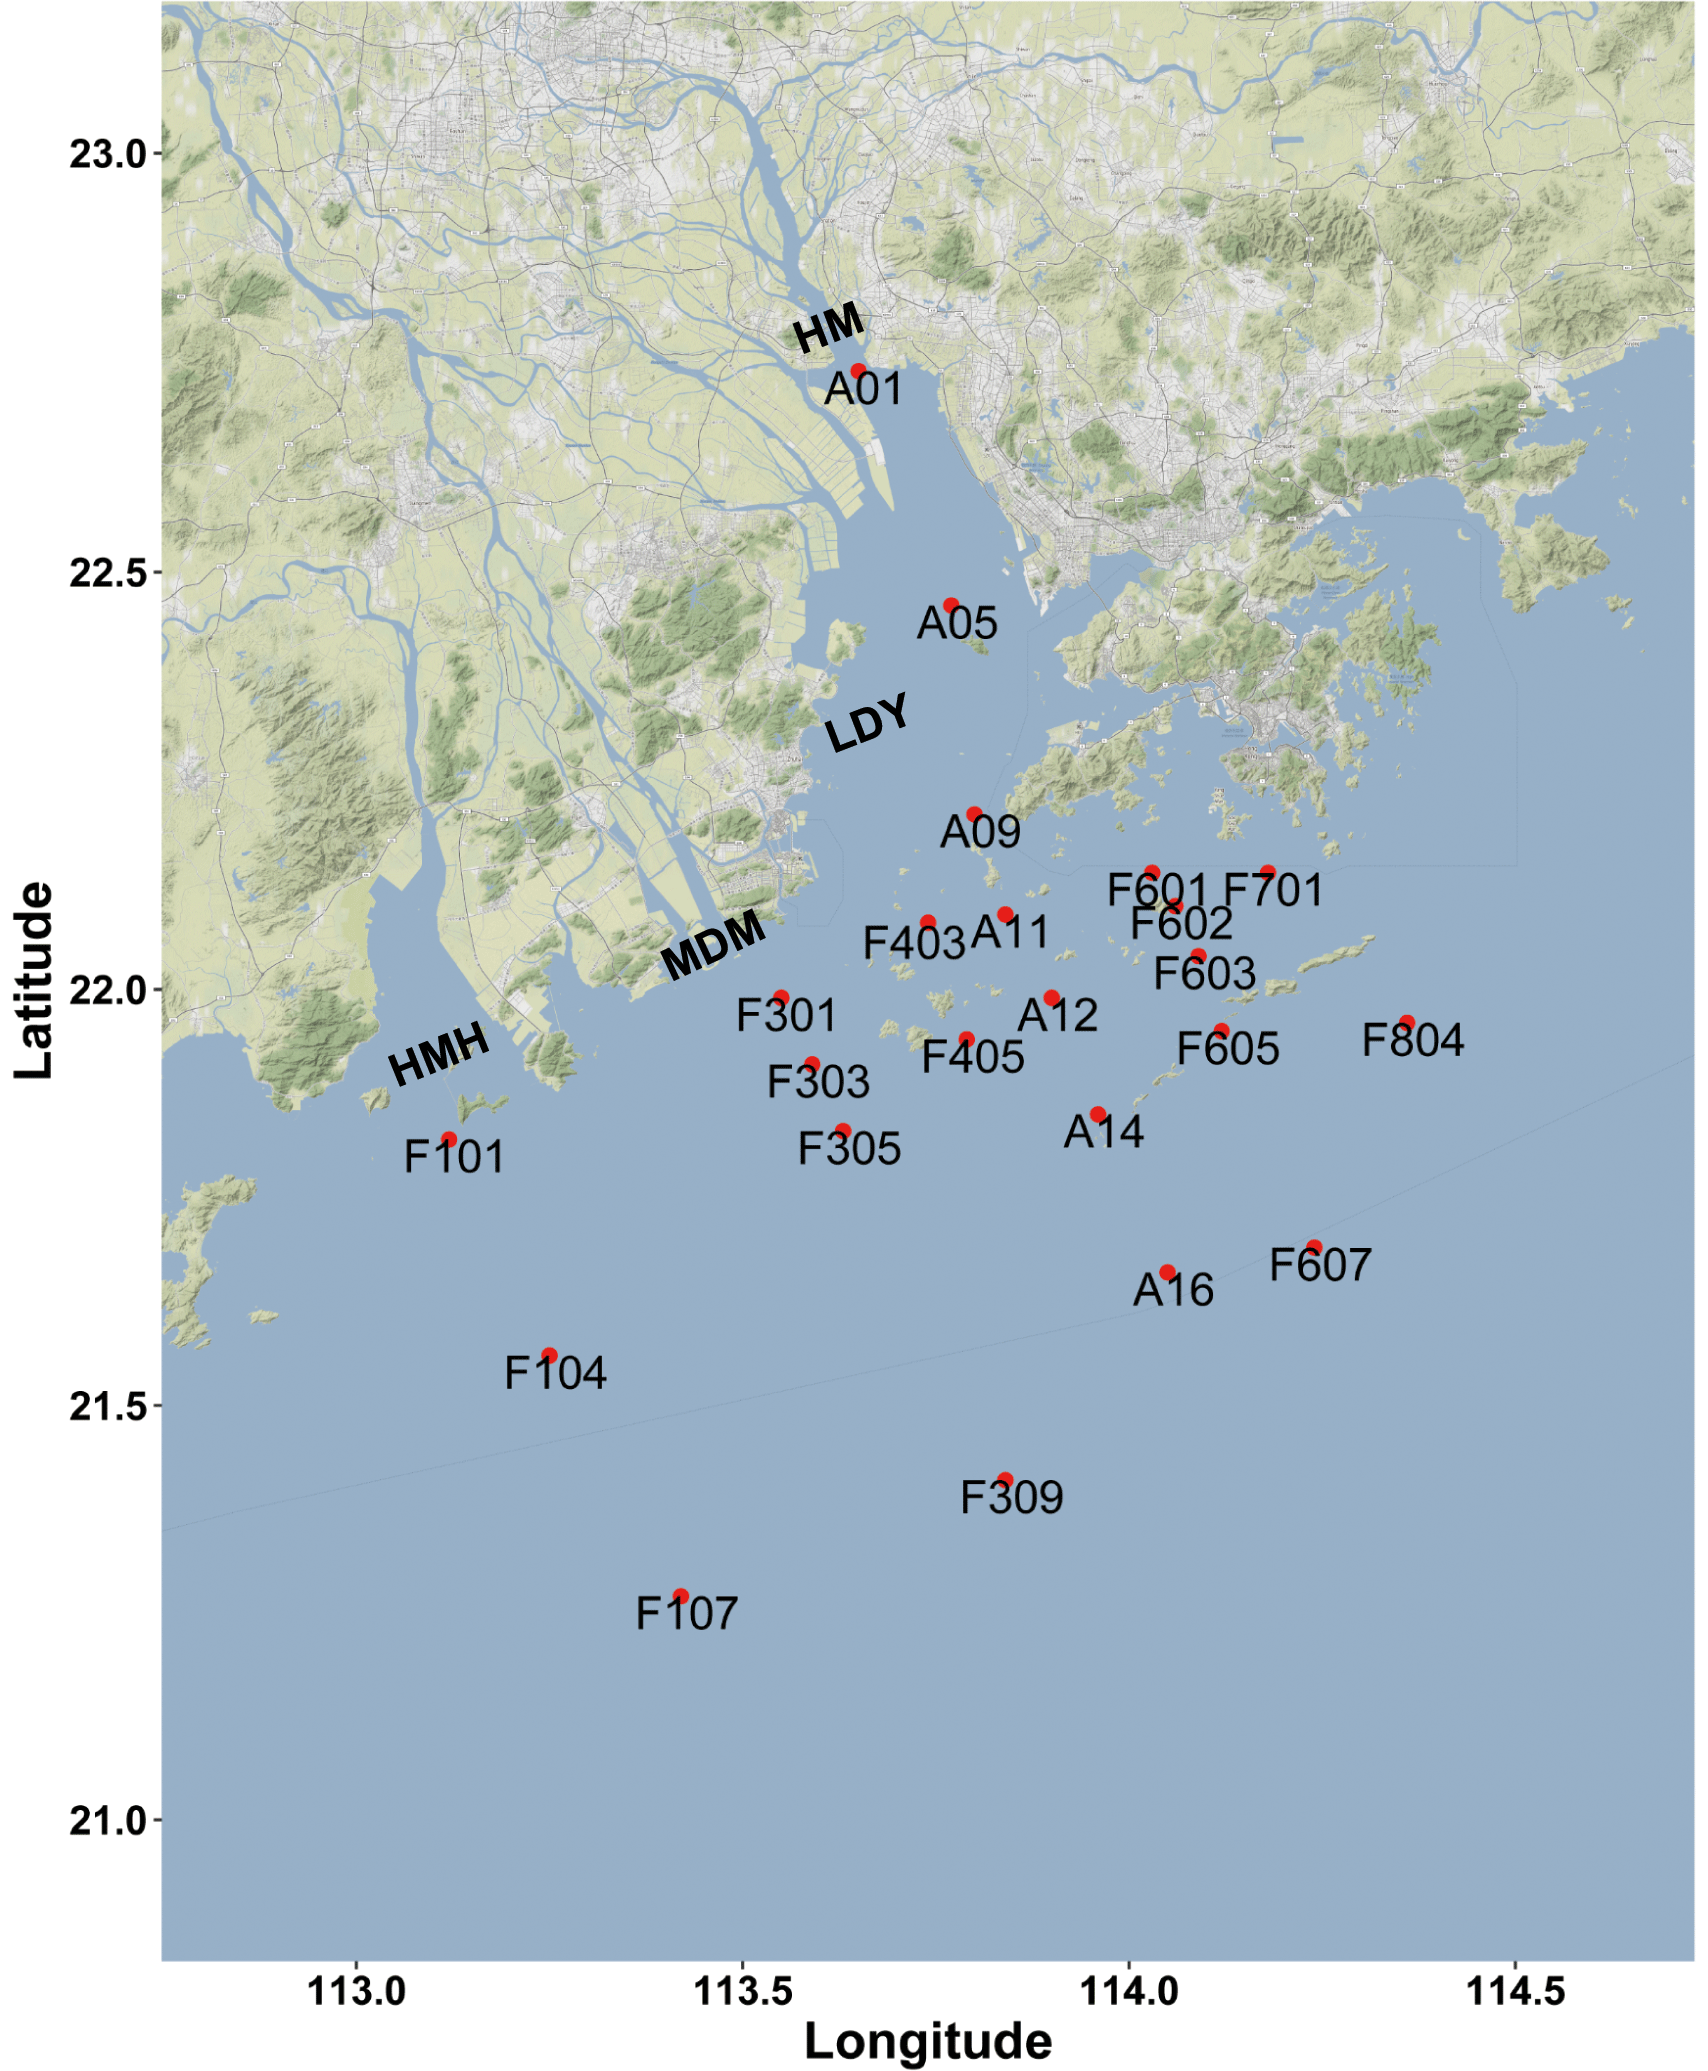
Figure 1Sampling and rates measurement location during the Pearl River estuary cruise in summer 2017 (HMH – Huangmaohai; MDM – Modaomen; HM – Humen; LDY – Lingdingyang). The sampling location information was overlaid on a Google Maps (© Google Maps) image using ggmap with ggplot2 in R (Kahle and Wickham, 2013).
3.1 Hydrographic characteristics of the Pearl River estuary
The Pearl River estuary consists of three major subestuaries, namely Lingdingyang, Modaomen, and Huangmaohai (Fig. 1), which contribute 55 %, 28 %, and 13 % of the annual mean of freshwater discharge, respectively (Zhao, 1990). This investigation was conducted in the wet season when high freshwater discharge formed a large plume extending southwestward (Fig. 2a and d). Associated with the plume, an excessive phytoplankton bloom was observed in the lower estuary, with chlorophyll a concentrations peaking (28.4 µg L−1) at station F202 (Fig. 2b and e). Furthermore, widespread bottom water hypoxia (dissolved oxygen – DO < 2 mg L−1) was observed in the lower reach of the Pearl River estuary, extending from Huangmaohai to the southern water of Hong Kong island (Fig. 2f). Our study area covered a full range of salinity from 0.1 to 34.7. The variation in nitrate concentration followed the salinity gradient (Fig. S3a and d). High concentrations of nitrate were detected in low-salinity waters near the outlets of subestuaries, with the highest value (> 115 µmol L−1) being observed in the surface water of Lingdingyang (station A01-03). Similar to nitrate, the concentrations of nitrite in the surface layer were also high near the estuary outlets and peaked at station A01 (9.5 µmol L−1) but remained relatively constant (< 2 µmol L−1) in the bottom layer (Fig. S3c and f). The ammonium concentration displayed a different spatial pattern compared to nitrate and nitrite, with the maximum concentration occurring at station A06 (2.5 and 3.2 µmol L−1 in the surface and bottom layer, respectively), possibly influenced by local sewage discharges. A patch of relatively high-ammonium water (> 1 µmol L−1) was observed in the southern water of Hong Kong, spreading eastward at the stations along the south borderline of Hong Kong water (Fig. S3c).

Figure 2Spatial distribution of (a, d) salinity, (b, e) chlorophyll a, and (c, f) dissolved oxygen concentration at the surface and bottom layer during the 2017 summer cruise in the Pearl River estuary. These figures were generated using Ocean Data View v. 5.0.0 (http://odv.awi.de, last access: 19 August 2020).
3.2 The spatial pattern of nitrification rates and their oxygen consumption
The nitrification rates were generally higher in bottom water than in surface water, except stations A01 and F601 (Fig. 3). At the surface layer, high nitrification rates were detected in the outlet of Humen and Modaomen (stations A01 and F301) and in the southern water of Hong Kong (station F601 and F701; Table S2). At the bottom layer, high nitrification rates were detected in the Humen outlet and the lower estuary from Huangmaohai to the southern water of Hong Kong (Fig. 3a). Based on Eq. (2), the NOD were estimated as ranging from 0.0001 to 0.1092 mg O2 L−1 d−1 (Fig. 3). The CR was higher at the surface layer than the corresponding bottom layer in all stations (Fig. 3; Table S3). The CR at the surface layer ranged from 0.22 to 1.68 mg O2 L−1 d−1, and the bottom layer ranged from 0.002 to 0.82 mg O2 L−1 d−1 (Fig. S4). Based on the ratio between NOD and CR, nitrification contributed 0.01 %–17.82 % and 0.009 %–181.91 % of total oxygen consumption at the surface and bottom layer, respectively (Fig. 3). It is noteworthy that nitrification contributed substantially to the total oxygen consumption in the upper estuary and bottom hypoxic water. For the upper estuary in Lingdingyang, nitrification potentially contributed 6.18 % and 9.45 % of the total oxygen consumption at station A01 and A05, respectively. As for the bottom hypoxic water, nitrification accounted for 28.14 % at F101, 11.28 % at F301, 8.15 % at F303, 4.53 % at A09, 64.89 % at F305, and 181.91 % at F701 of the total oxygen consumption.
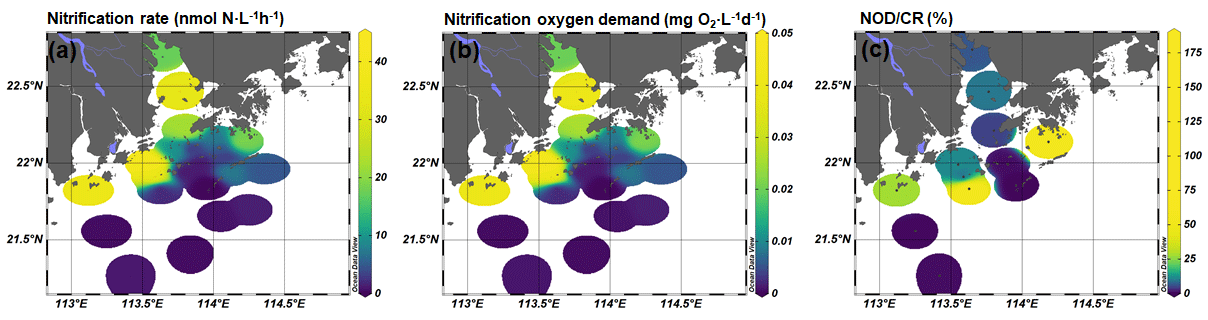
Figure 3(a) Nitrification rates (nmol N L−1 h−1), (b) nitrification oxygen demand (NOD; mg O2 L−1 d−1), and (c) nitrification oxygen demand and community respiration (NOD ∕ CR) ratio (percent) at the bottom layer.
3.3 Spatial patterns of the abundance of AOA and β-AOB
As inferred from the amoA gene copy number, AOA were 2–3 orders of magnitude more abundant than β-AOB (Fig. 4; Table S2). The archaeal amoA gene was more abundant at the bottom layer than at the surface layer (Fig. 5). The abundance of the archaeal amoA gene ranged from 6.27 × 10⁴ to 3.63 × 10⁷ copy L−1 at the surface layer and 3.59 × 10⁵ to 4.98 × 10⁸ copy L−1 at the bottom layer, with the maximum abundance occurring at the bottom layer of station F405. The archaeal amoA gene abundance showed a generally decreasing trend from the upper estuary to the continental shelf at the surface layer (Figs. 4 and 5; Table S2). It is noteworthy that the archaeal amoA gene was highly abundant in the hypoxic water located in the lower reach of the estuary. The abundance of the β-proteobacteria amoA gene at the surface layer ranged from 2.03 × 10² to 1.07 × 10⁵ copy L−1, while it ranged from 1.91 × 10³ to 2.44 × 10⁵ copy L−1 at the bottom layer (Fig. 5; Table S2). The β-proteobacteria amoA gene abundance peaked at the surface layer of station A01 in the upper estuary of Lingdingyang with 1.07 × 10⁵ copy L−1, while the lowest abundance was detected at the surface layer of station A12 with 2.03 × 10² copy L−1. In general, the spatial pattern of the β-proteobacteria amoA gene at the surface layer was more abundant at the upper estuary of Lingdingyang (stations A01 and A05) and Modaomen (station F303), while the abundance decreased seaward at the bottom layer. Overall, the AOA showed higher abundance in the free-living fraction, while AOB was more abundant in the particle-attached fraction (Fig. 5; Table S2). At RNA level, the archaeal amoA gene ranged from 6.03 × 10² to 3.21 × 10⁶ copy L−1, while the β-proteobacteria amoA gene were under the detection limit (Table S4). The nitrification rate showed a positive correlation with the total abundance of β-AOB (rs=0.38, P<0.05) at DNA level. At the particle-attached fraction, the nitrification rate displayed positive correlations with the abundance of AOA (rs=0.38, P<0.05) and β-AOB(rs=0.33, P<0.05), respectively.
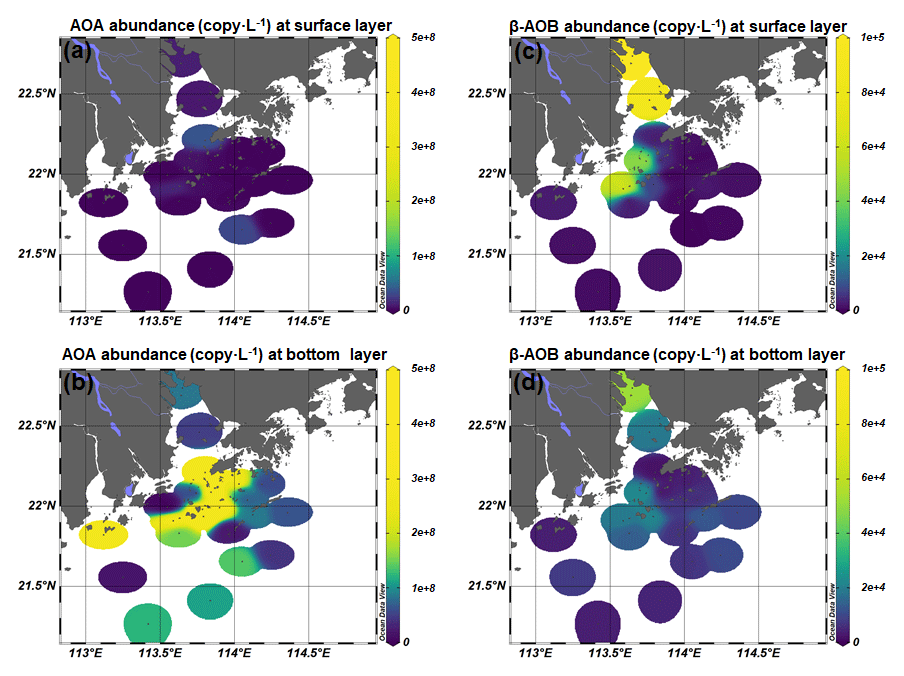
Figure 4Spatial distribution of (a, b) AOA and (c, d) β-AOB abundance at the surface and the bottom layer at DNA level.
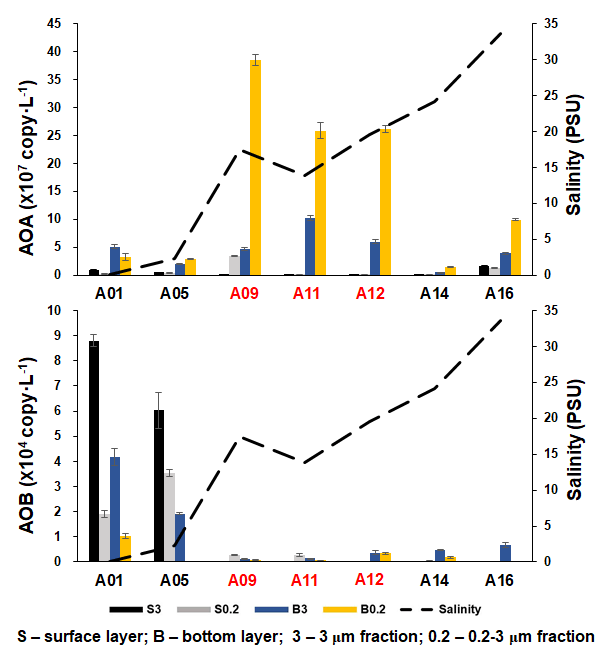
Figure 5The abundance of AOA and β-AOB at DNA level, estimated by the qPCR of the amoA gene along the salinity gradient of the A transect in the Pearl River estuary. Size fractionation was performed with 3 µm (particle attached) and 0.2 µm (free living), and the hypoxic stations (bottom dissolved oxygen – DO < 2 mg L−1) are labeled in red.
3.4 Phylogenetic diversity of AOA
Given that the AOA were the dominant ammonia oxidizers throughout the estuary, we further investigated the phylogenetic diversity of AOA at DNA and RNA levels at 13 stations covering the upper estuarine to the shelf environments (Figs. 6, 7, and 8). In total, 191 748 high-quality amoA sequences were retrieved from 76 samples from the 13 stations (Table S5). OTUs were detected at 95 % DNA similarity after the removal of singletons and doubletons. Top OTUs (i.e., OTUs with a mean relative abundance of ≥ 0.1 % among all samples) were focused in this study. The maximum likelihood (ML) phylogenetic tree showed that the top 85 OTUs affiliated to WCA sublineages and SCM1-like clade, according to the reference sequences in Jing et al. (2017) and Cheung et al. (2019). More than half of the top OTUs were affiliated to the two WCA sublineages, namely WCA I (13 OTUs) and WCA II (32 OTUs). Besides, diverse OTUs that affiliated to the SCM1-like clade, which showed > 90 % DNA similarity with the amoA sequences of Nitrosopumilis maritimus SCM1, were recovered. These SCM1-like OTUs were grouped into four sublineages according to the topology of the ML tree, including SCM1-like-I (10 OTUs), SCM1-like-II (16 OTUs), SCM1-like-III (6 OTUs), and SCM-like-IV (8 OTUs; Figs. 6 and 7). The SCM1-like-III were also phylogenetically close to Nitrosoarchaeum limnia (Figs. 6, 7, and S2).
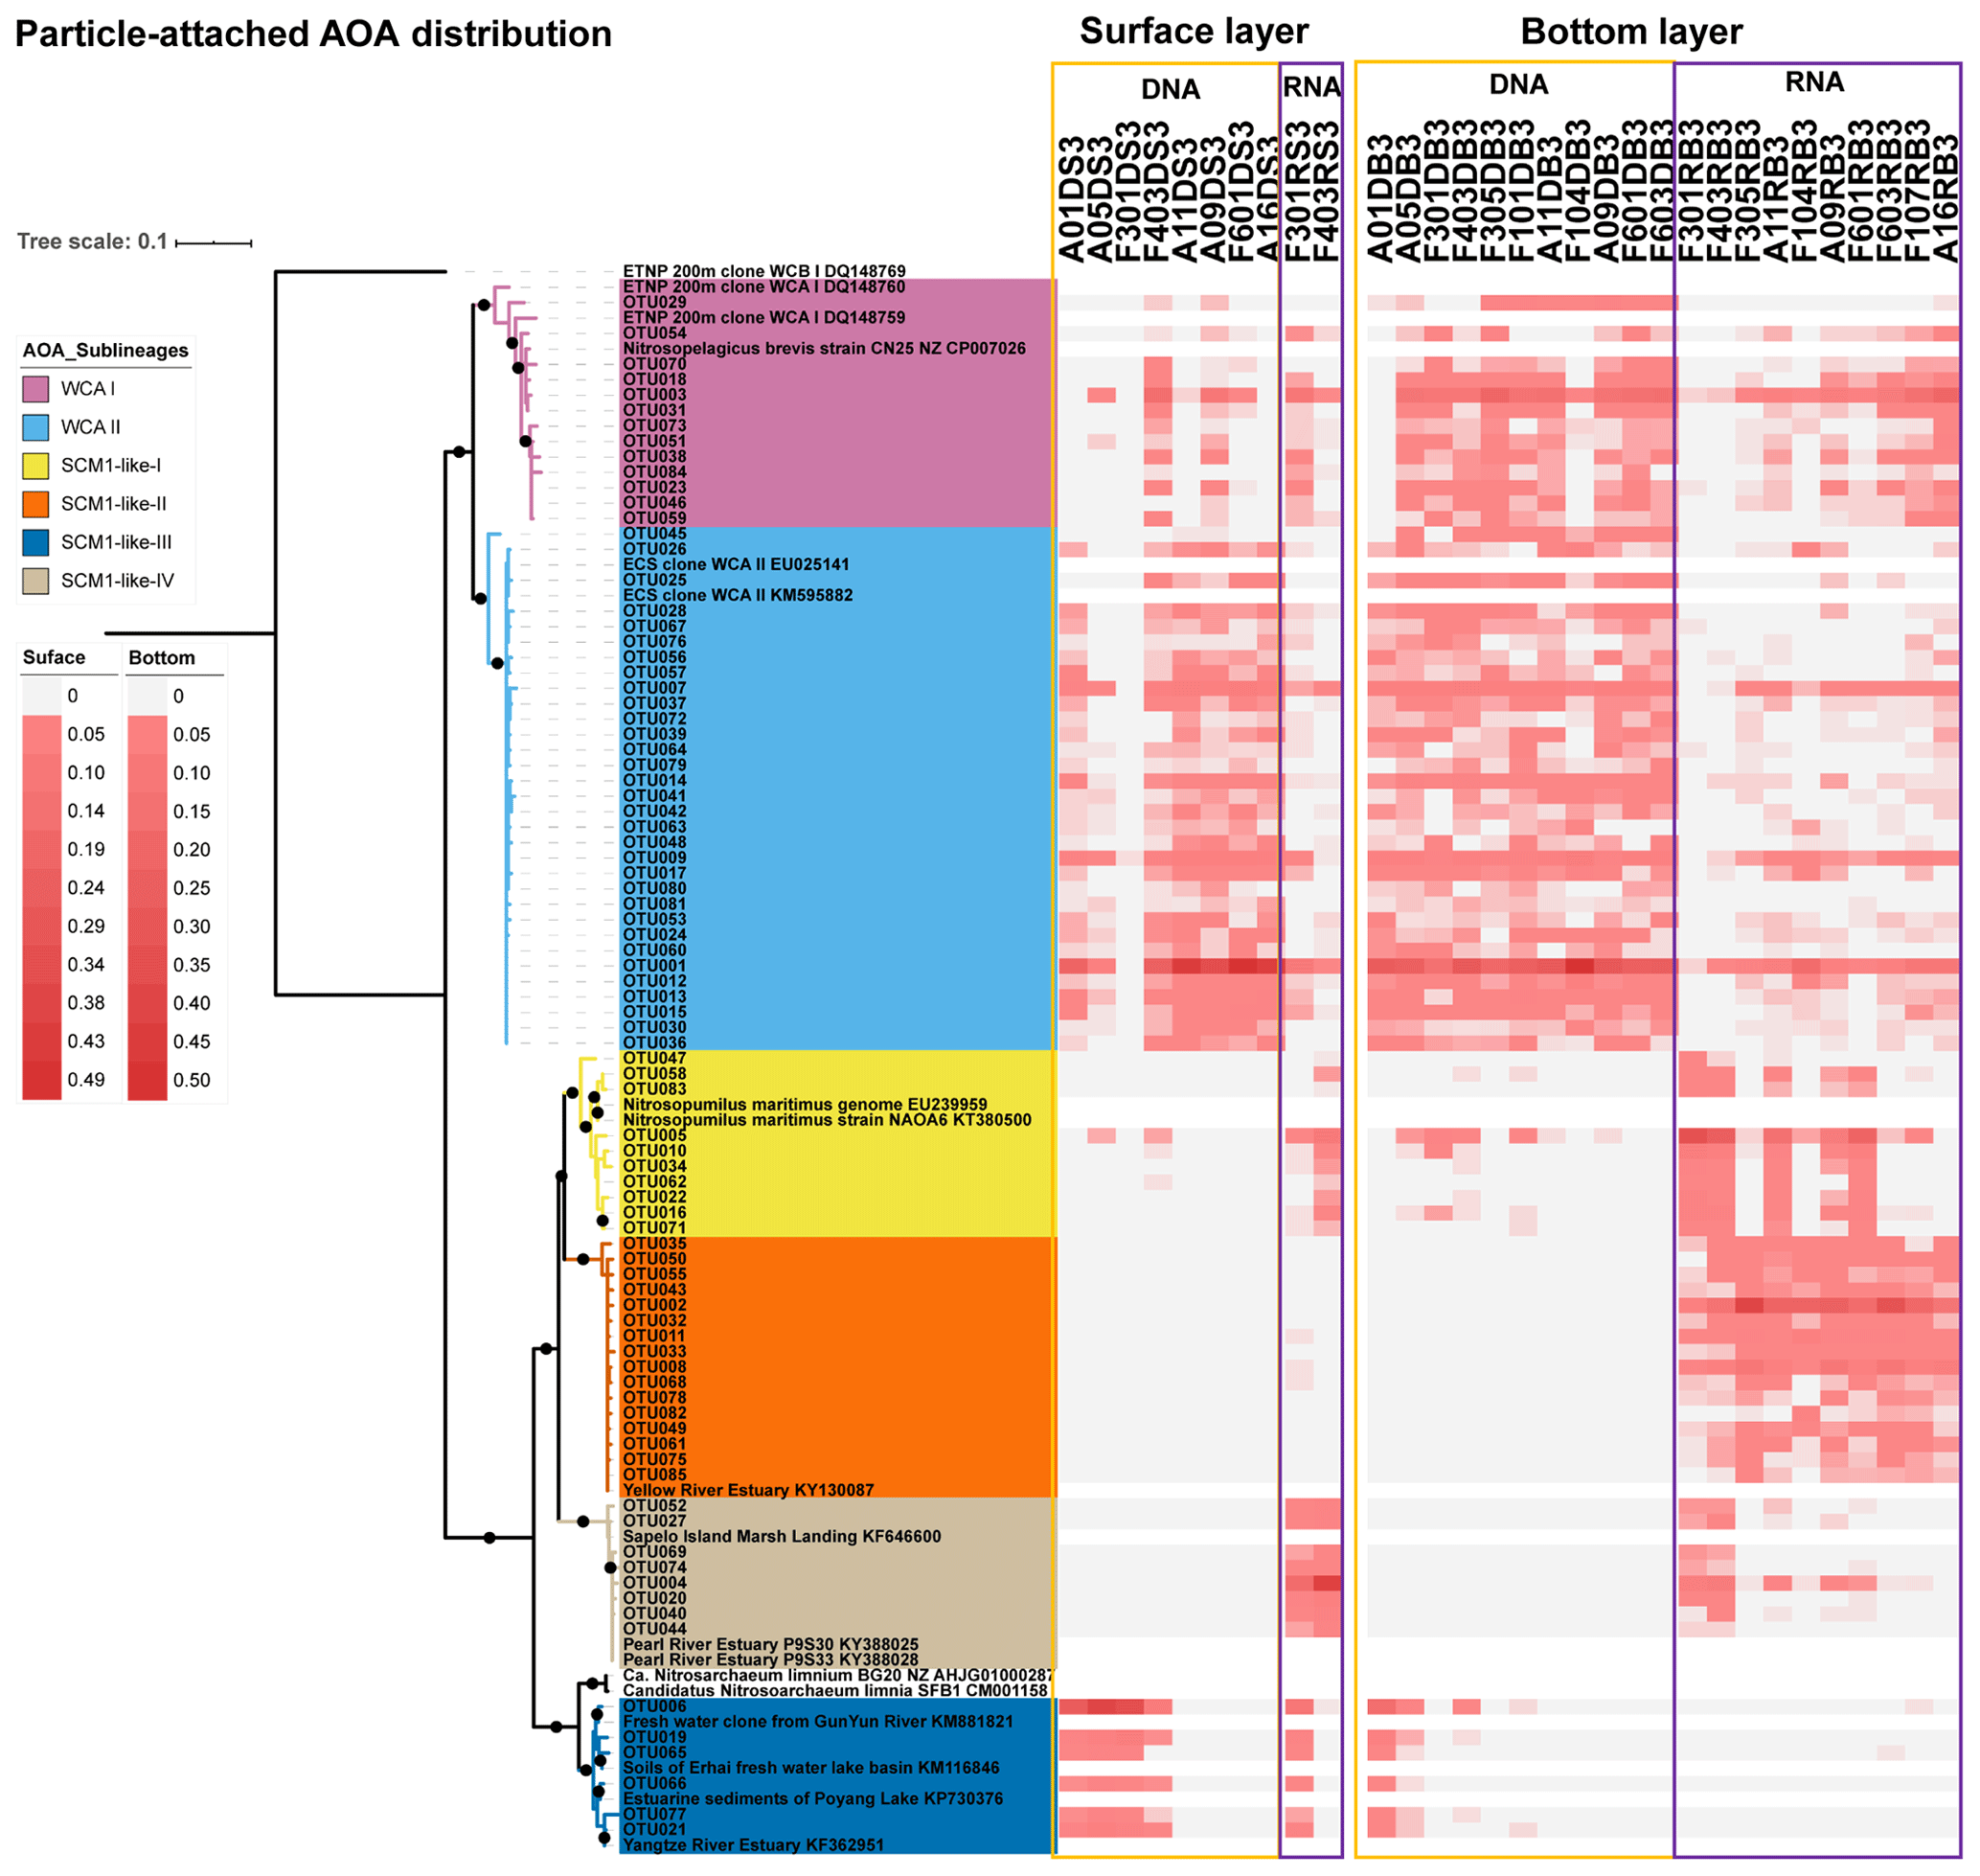
Figure 6Maximum likelihood phylogenetic tree of top 85 OTUs based on amoA gene sequences using the T92 + G + I model with 1000 bootstrapping. The associated heat map is generated based on the relative abundance of top OTUs in the particle-attached samples. Samples are listed from left to right along the ascending salinity gradient.
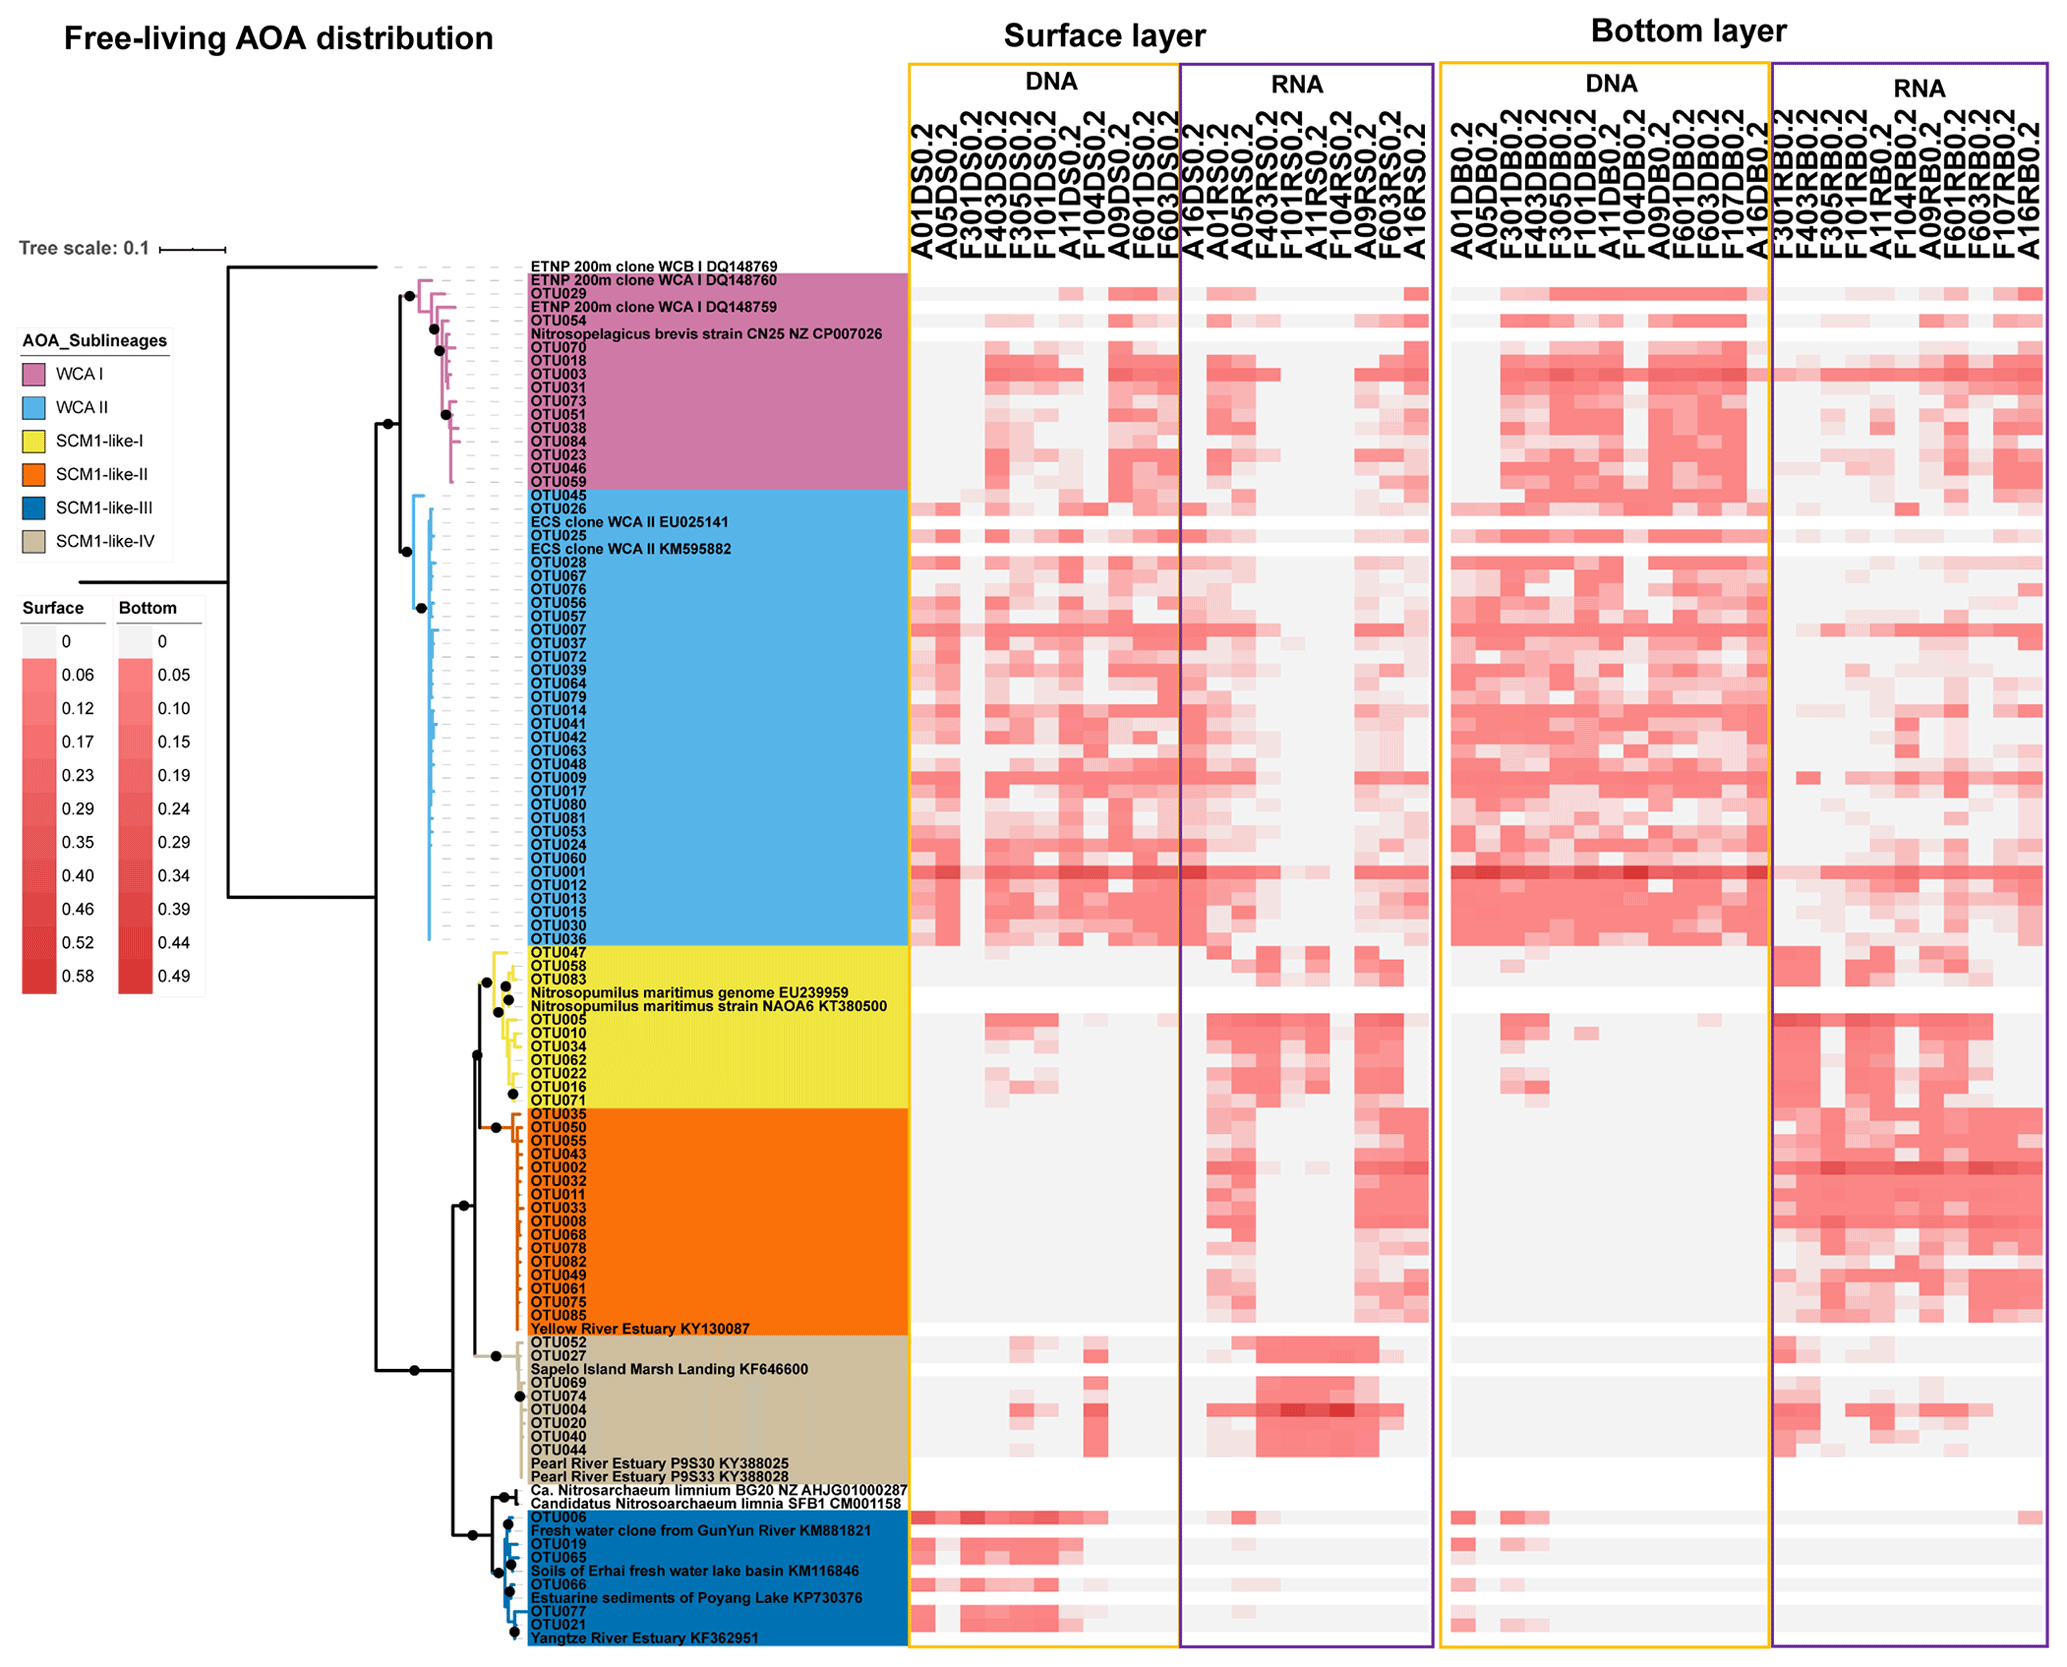
Figure 7Maximum likelihood phylogenetic tree of the top 85 OTUs based on amoA gene sequences using the T92 + G + I model with 1000 bootstrapping. The associated heat map is generated based on the relative abundance of top OTUs in the free-living samples. Samples are listed from left to right along the ascending salinity gradient.
3.5 Differential distribution of AOA sublineages at DNA and RNA level
As revealed by the NMDS plot, a strong dissimilarity between DNA and RNA communities were observed (Fig. 8). Different AOA sublineages showed distinct distributional patterns (Figs. 6, 7, and 8). WCA I was mainly distributed in the bottom layers, except for the upper reach of Lingdingyang. At the surface layer, WCA I was generally a minor component of the AOA community, though it was dominant occasionally in the plume area with intermediate salinity. At RNA level, WCA I showed low relative abundance in the surface layer with mid salinity and an increasing trend seaward (Figs. 6, 7, and 8).
The AOA community at DNA level was dominated by WCA II, which showed a ubiquitous distribution across the whole salinity range of 0.1–34.7. Exceptionally, WCA II was outnumbered by SCM1-like-III at the surface layer at station F301 near Modaomen and Huangmaohai, close to freshwater discharge. At RNA level, WCA II showed similar distributional patterns and relative abundance, with WCA I sharing an increasing proportion of the active AOA community from the upper estuary to the continental shelf (Figs. 6, 7, and 8).
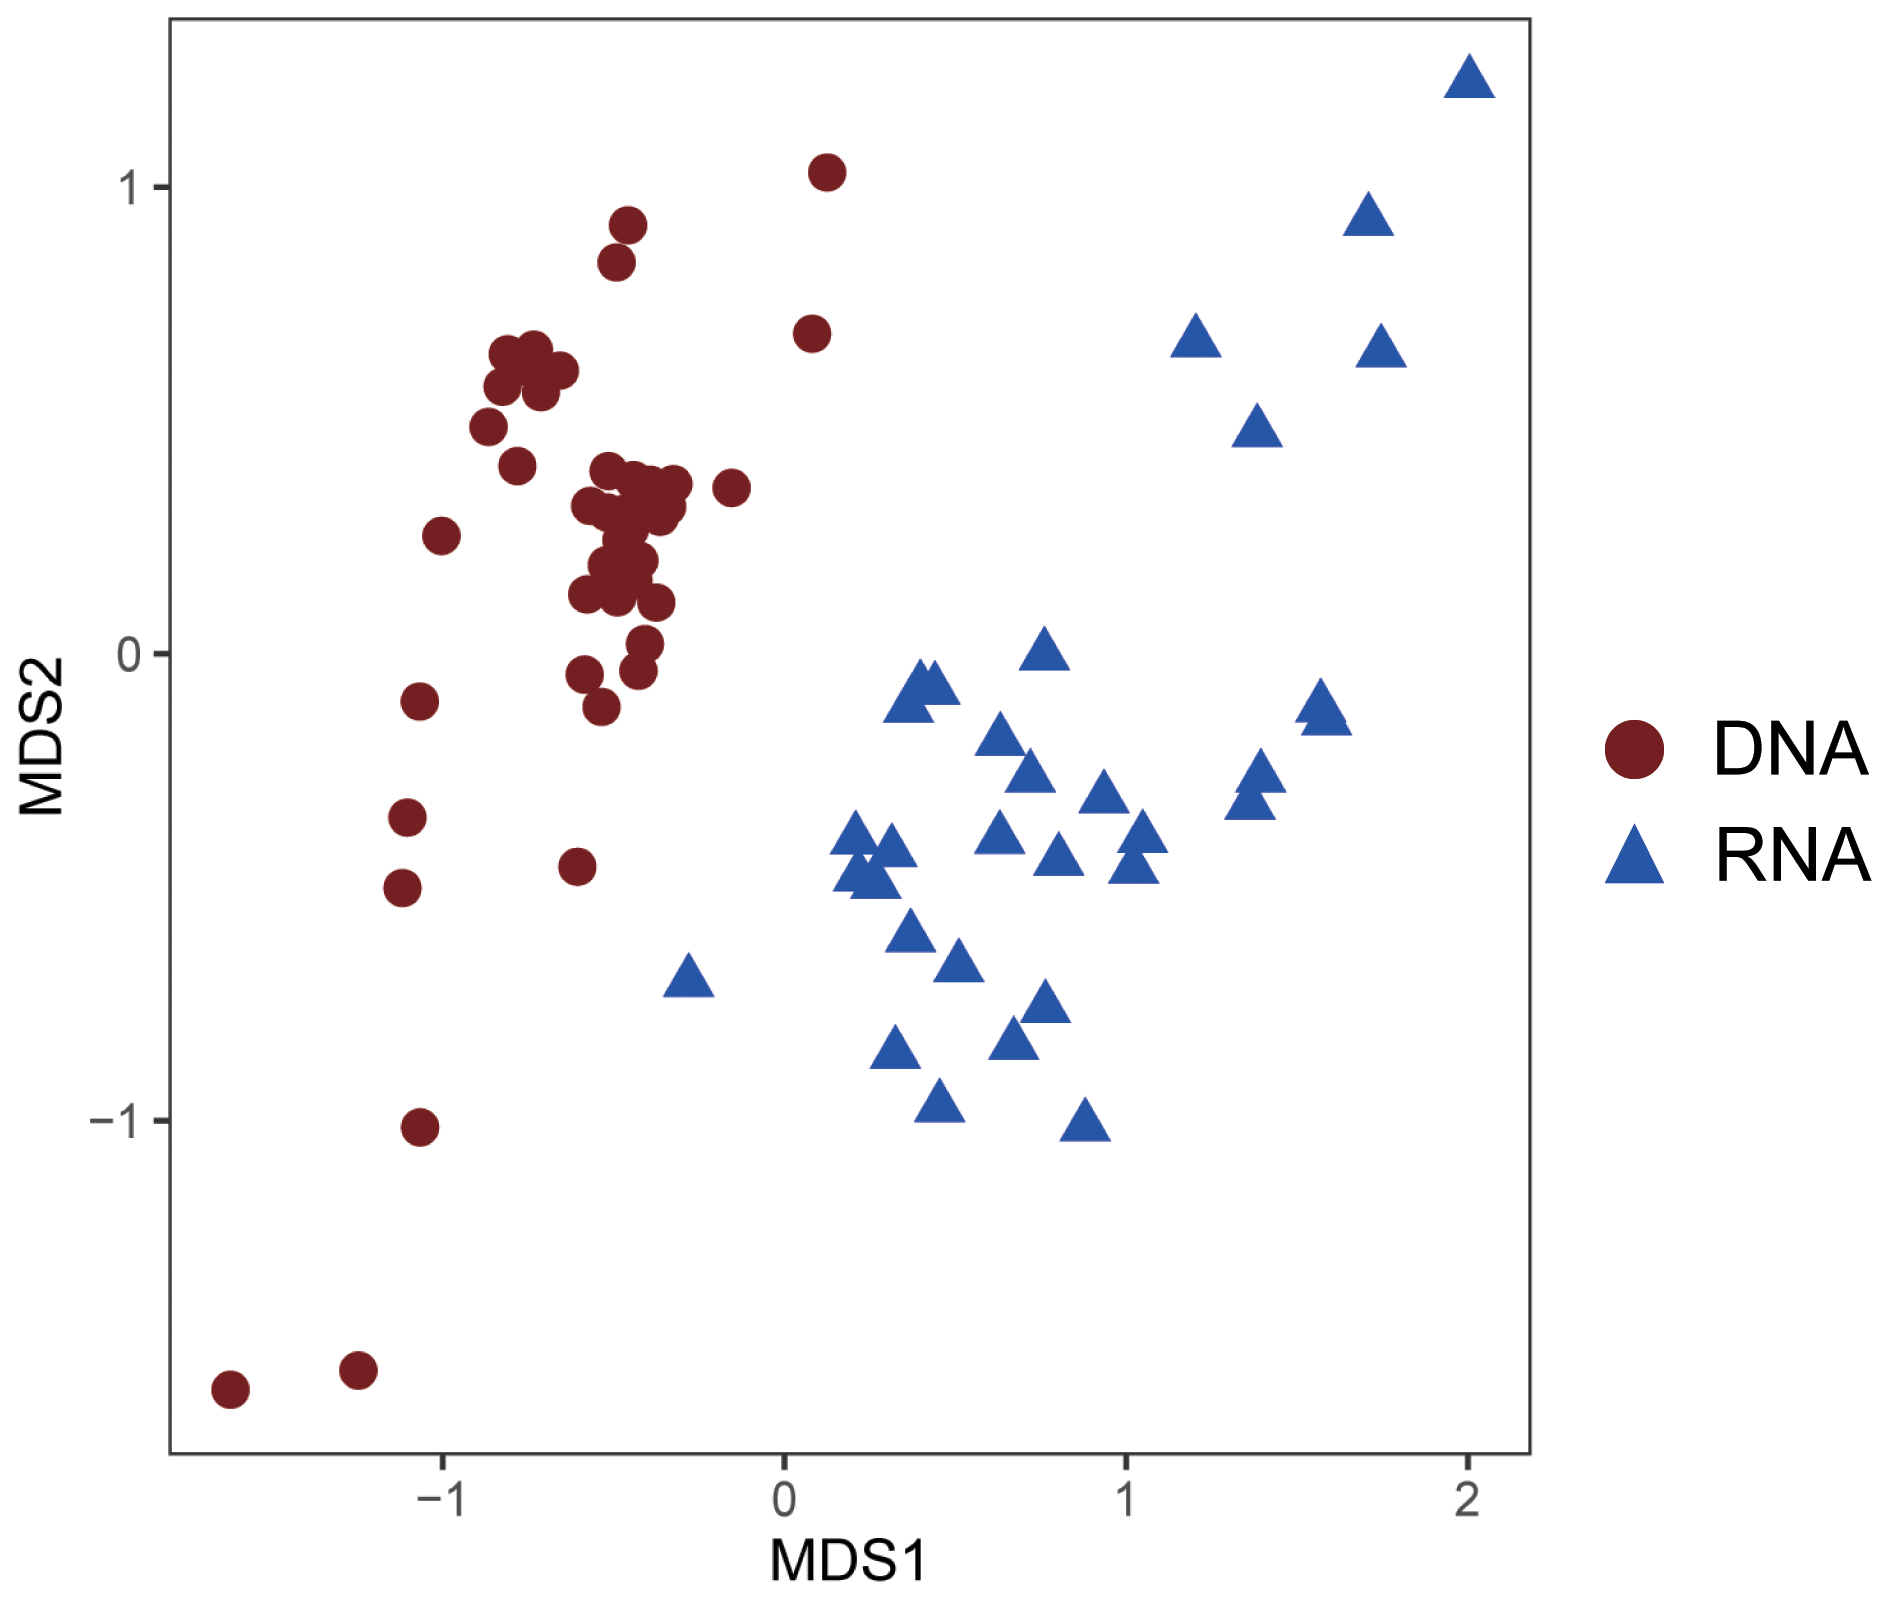
Figure 8Nonmetric multidimensional scaling (NMDS) plot of AOA community similarity at DNA and RNA level.
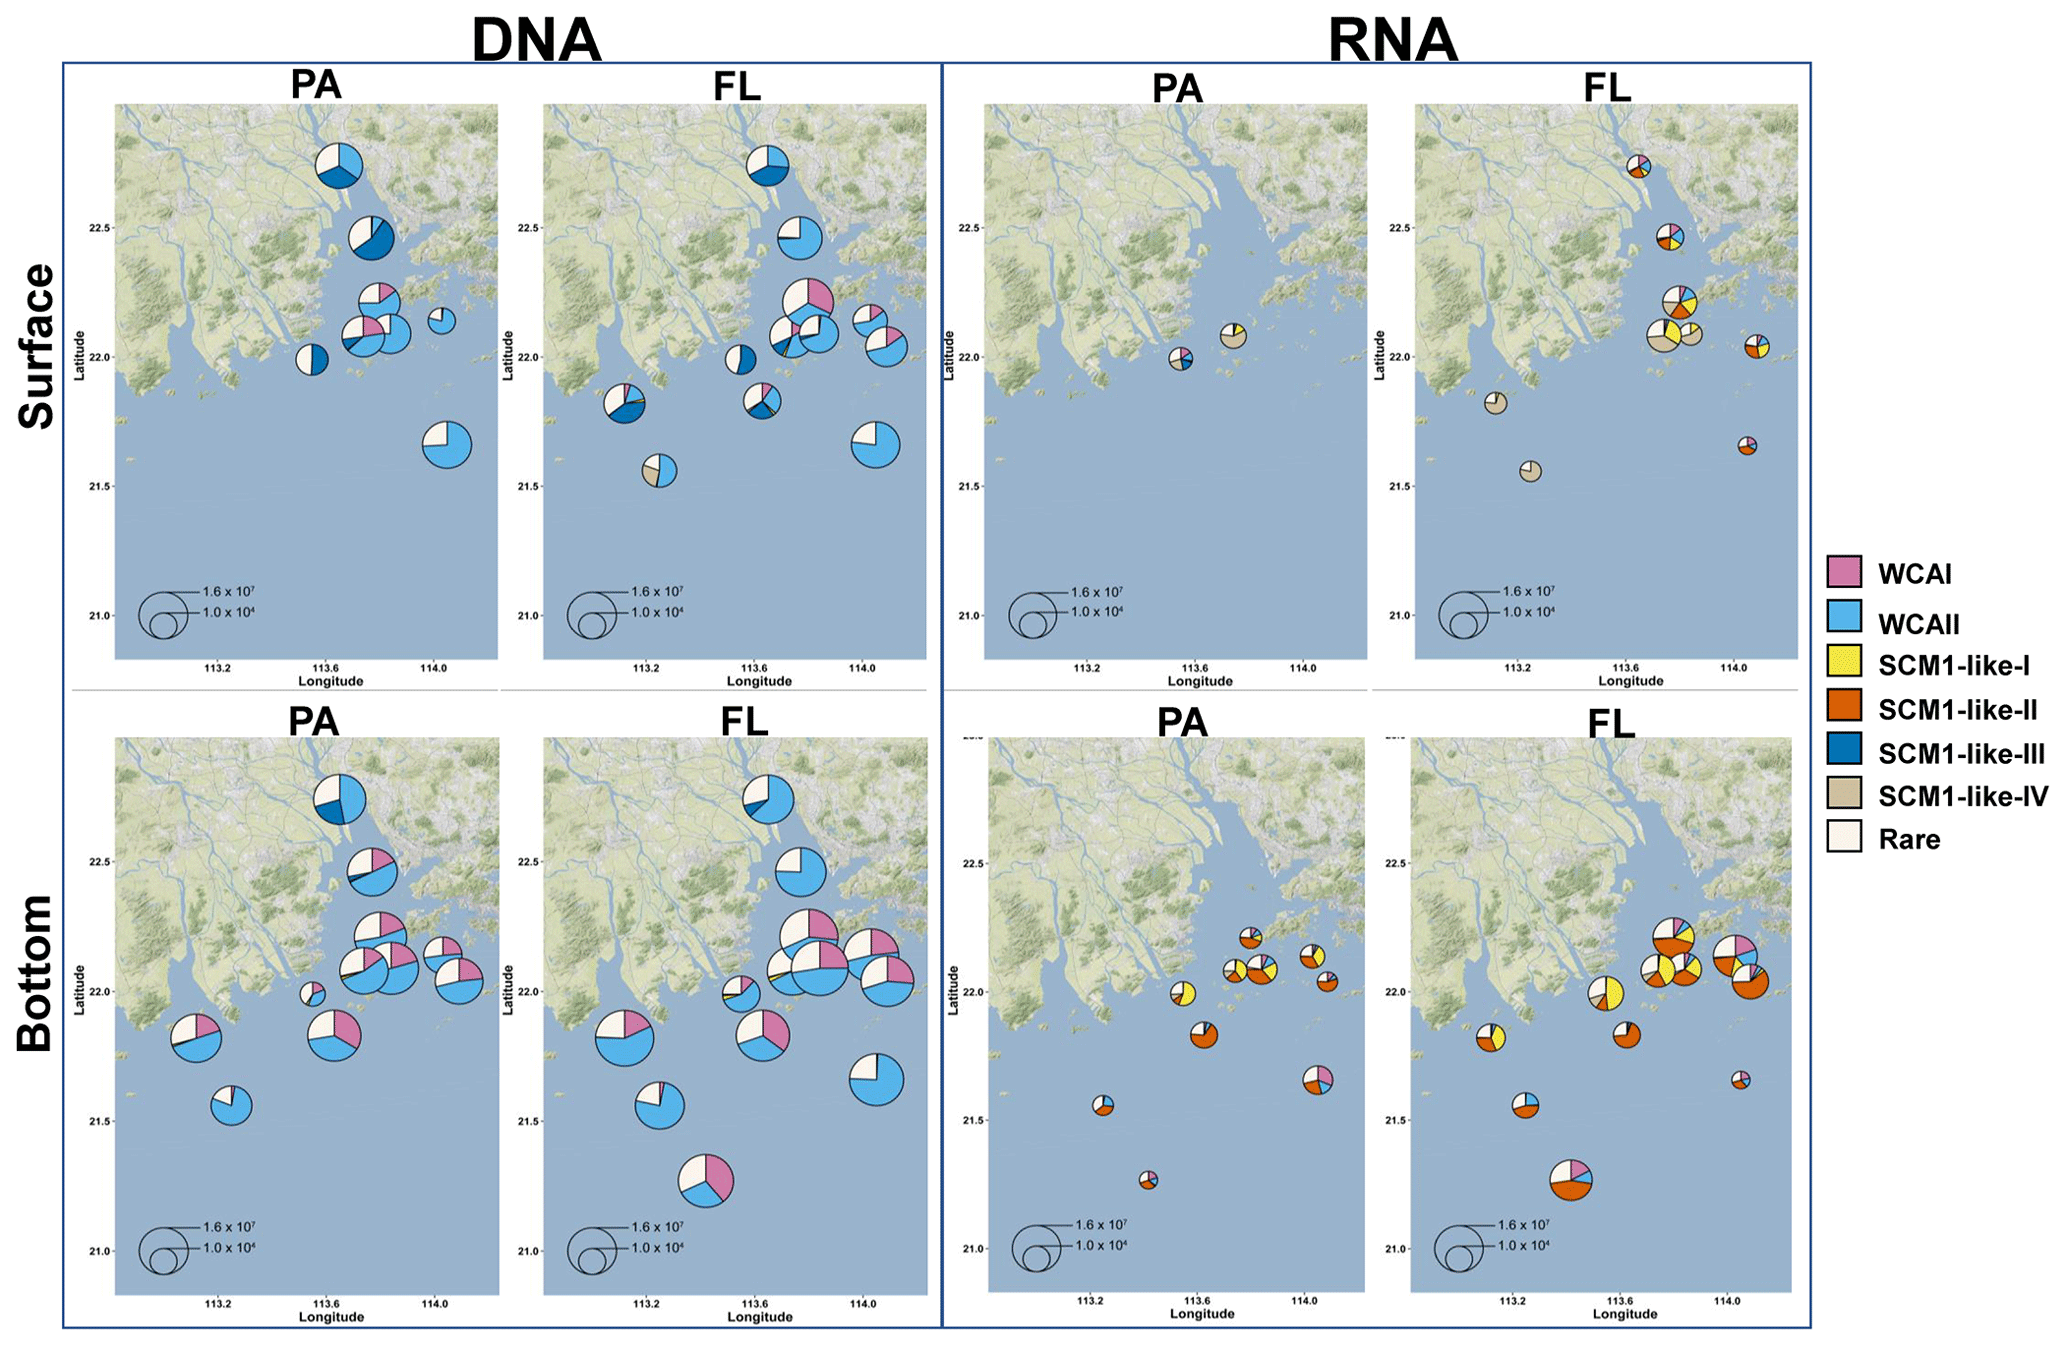
Figure 9Free-living (FL) and particle-attached (PA) AOA community composition and distribution in the Pearl River estuary. The size of the pie charts represents the archaeal amoA gene abundance quantified by qPCR. For a clear display of the AOA community composition, the minimum size of the pie charts is set as 500 copies L−1. The charts were overlaid on Google Maps (© Google Maps) images using ggmap with ggplot2 in R (Kahle and Wickham, 2013).
SCM1-like sublineages surprisingly dominated the active AOA communities at RNA level, except for SCM1-like III which was dominating at stations near river outlets. Among the SCM1-like sublineages, the SCM1-like-III was the most abundant at DNA level. Their distribution was limited to the surface water of the Pearl River and freshwater plume (salinity < 14; Figs. 6, 7, and 8). The distribution of SCM1-like-III at RNA level was limited to the freshwater regions (Figs. 6 and 7), similar to its distribution pattern shown at DNA level. In addition, SCM1-like-III was the least abundant among the SCM1-like sublineages at RNA level. SCM1-like-I distributed mainly at the lower reach of the estuary. The SCM1-like-II dominated the active AOA communities in the Pearl River and its lower reach at the bottom layer, while the SCM1-like-IV showed high relative abundance at the surface layer (Fig. 8). The SCM1-like-I was less abundant than SCM1-like-II at RNA level at the bottom layer, and its spatial pattern was similar to SCM1-like-II.
3.6 Correlation between AOA sublineages and environmental factors
To reveal the connections between the relative abundance of AOA sublineages and environmental factors, correlations between the different sublineages and environmental factors were examined using Spearman correlation coefficients. The AOA communities were separated into four parts, namely surface DNA, surface RNA, bottom DNA, and bottom RNA levels, and were analyzed with the corresponding environmental factors. Generally, the relative abundance of AOA sublineages showed a more significant correlation with environmental factors both at DNA and RNA levels at the bottom layer compared to the surface layer (Fig. 10). Among the nine environmental factors, salinity was the most significant factor affecting the distribution of AOA sublineage.
The sublineages of WCA showed a strong positive correlation with salinity, while SCM1-like sublineages showed a negative correlation with salinity. At RNA level in the bottom layer, SCM1-like-I and IV were positively correlated with nutrient concentration and non-phototropic prokaryotic cell abundance, while negatively correlated with salinity and dissolved oxygen concentration. SCM1-like-III showed a strong negative correlation with salinity at both surface and bottom layers. In general, WCA sublineages were negatively correlated with nutrient concentration, while SCM1-like sublineages were positively correlated with nutrient concentration. Ammonium showed no significant correlation with AOA sublineages.
The Spearman correlation between nitrification rates and the relative abundance of AOA sublineages in RNA-based communities were also tested (Fig. 10). SCM1-like-III showed a positive correlation (rs=0.72, P<0.05) with the nitrification rate at surface water, while SCM1-like-I (rs=0.81, P<0.05) and SCM1-like-IV (rs=0.73, P<0.05) sublineages showed positive correlations with nitrification rates at the bottom layer. Besides, WCA I showed a positive correlation with nitrification rates (rs=0.75, P<0.05) at the surface layer only, while WCA II showed a negative correlation (, P<0.05) with nitrification rates at the bottom layer.
4.1 Nitrification and its oxygen consumption in the hypoxia zone
We observed a widespread hypoxia zone at the lower estuary of the Pearl River, extending from Huangmaohai to the south of Hong Kong, which was a result of both physical and biogeochemical conditions (Fig. 2f). During the 2017 summer cruise, river discharge was high, as indicated by the salinity at the surface layer (Fig. 2a), which is the typical wet season pattern of the Pearl River estuary (Harrison et al., 2008). The continuous river discharge sustained a strong water column stratification at the lower estuary which prevents the efficient supply of oxygen to the bottom water. Furthermore, a high concentration of nutrients associated with the freshwater from three subestuaries sustained high phytoplankton biomass in the lower reach of the estuary (Fig. 2b). The massive locally generated and riverine organic matter sunk down to the bottom layer, and they were rapidly degraded by heterotrophic prokaryotes, resulting in high oxygen consumption (Harrison et al., 2008; Lu et al., 2018).
Our results suggest that nitrification could contribute a large proportion of oxygen consumption in the hypoxia zone (Table S3). Despite limited data with large variation, our estimate falls, in general, in the ranges of previous reports. In the eutrophic Delaware River estuary, nitrification accounted for over 20 % of the river's oxygen consumption downstream (Lipschultz et al., 1986). Intensive nitrification was observed at intermediate salinities, and it accounted for 20 % to over 50 % of oxygen consumption in the Mississippi River plume (Pakulski et al., 1995). Downstream of the Pearl River (from Guangzhou to Humen), nitrification could contribute to one-third of the total oxygen consumption (Dai et al., 2008). In our study, high community respiration rates and nitrification rates were observed at the lower reach of the Pearl River estuary, corresponding to the hypoxia zone at the bottom layer (Fig. 2f). It is well known that ammonia, the substrate of nitrification, was produced during the organic matter degradation (respiration; Ward, 1996). Thus, a high rate of nitrification was supported not only by riverine ammonia but also by rapid organic matter degradation. We observed the high nitrification rate associated with the upper estuary and hypoxia zone (Fig. 3). Respiration and nitrification are both important and coupled oxygen-consuming processes. When comparing our data with the community respiration, we found that nitrification contributed a substantial proportion (averaged 12.18 %, excluding the unusual number of 181.91 % from F701) to the total oxygen consumption at the bottom layer. We found that the NOD exceeded CR at the bottom layer of station F701, which might be caused by the underestimation of CR in oxygen depleted condition using the traditional incubation and titration method. Sampou and Kemp (1994) have found that oxygen concentration is one of the limiting factors of CR. In their study, CR was found to decrease when dissolved oxygen (DO) was lower than 0.8 mg L−1 (Sampou and Kemp, 1994). Nitrification can remain active under a nanomolar range of oxygen (< 10 nM; Bristow et al., 2016). During the cruise, the lowest oxygen concentration was 0.54 mg L−1 (16.88 µM), which would not limit the nitrification activities (Bristow et al., 2016). Hence, in the Pearl River estuary, nitrification could substantially draw down the oxygen concentration and sustain the hypoxia formation at the lower estuary. It should be mentioned that excess of potential NOD over the total oxygen consumption was also found in the Changjiang estuary by Hsiao et al. (2014), and they speculated that other oxidants (Fe and Mn) could oxidize ammonia.
4.2 Relative distribution of AOA and AOB in the Pearl River estuary
Both AOA and AOB are present in estuarine environments; however, their corresponding contribution to nitrification activities remain underexplored. It has been well identified that AOA outnumber AOB by orders of magnitude in pelagic waters, whereas, in the estuarine environments, the ratios of AOA and AOB were rather variable. Based on the qPCR of the amoA gene, AOB were more abundant than AOA in many coastal and estuarine sediments (Caffrey et al., 2007; Mosier and Francis, 2008; Santoro et al., 2008; Magalhaes et al., 2009; Wankel et al., 2011), while AOA were orders of magnitude more abundant than AOB in other estuaries and coastal environments (Caffrey et al., 2007; Moin et al., 2009; Abell et al., 2010; Bernhard et al., 2010; Mosier and Francis, 2011). The variance and relative importance of AOA and AOB, as well as the nitrification rates in estuarine environments, were shown to be related to physicochemical parameters such as salinity, dissolved oxygen, ammonia, and pH (Bernhard and Bollmann, 2010; Mosier and Francis, 2011). When comparing to the previous estuarine studies based on DNA surveys, we conducted a comprehensive quantification of AOA and β-AOB abundance at both DNA and RNA levels, in association with in situ nitrification rate measurements in the Pearl River estuary. In the Pearl River estuary, AOA outnumbered AOB throughout the estuarine ecosystems at DNA level. At RNA level, AOA was detectable, but AOB was not, suggesting that AOA were the active ammonia oxidizers in the Pearl River estuary. Moreover, a size-fractionated study revealed that AOA were mainly distributed in the free-living fraction, while AOB were associated with the particles near the upper estuary (Fig. 5; Table S2), which may be explained by the higher substrate (ammonia) concentration requirement of AOB than AOA (Martens-Habbena et al., 2009).
4.3 Nonnegligible disagreement of the AOA community at DNA and RNA level
In our study, the positive correlations between nitrification rates and different AOA sublineages suggested the divergence in nitrification activities among the AOA community in the dynamic estuarine ecosystems (Fig. 10). Given that AOA plays a central role in the nitrogen cycle, the physiological characteristics of the highly diverse AOA are an essential basis for understanding the nitrogen cycle in the current and future ocean. With the limitation of underrepresented cultures and genomes, numerous AOA-related studies in the ocean were based on amplicon sequencing and qPCR targeting archaeal amoA (Beman et al., 2008; Bernhard and Bollmann, 2010; Peng et al., 2013; Santoro et al., 2017; Alves et al., 2018). However, it should be noted that almost all of these studies were based on DNA samples. In our study, the obvious disagreement between the AOA communities at DNA and RNA levels (Fig. 8) indicated that different AOA sublineages may have functional differences. Coincidentally, a similar phenomenon has also been recently reported in a terrestrial ecosystem, where Nitrososphaera and its sister groups were more active than Nitrosotalea in acidic forest soils (Wu et al., 2017). In the Baltic Sea, a distinct AOA community was retrieved from the RNA level, and a few phylotypes related to Nitrosomarinus showed widespread expression in the coastal region (Happel et al., 2018). As reported in a previous study in the Pacific Ocean, the amoA gene abundance of WCA and WCB have no correlation with the nitrification rates throughout the water column, indicating that the active functional group of AOA might be underrepresented in DNA-based studies (Smith et al., 2016). In light of our findings, the abundant AOA sublineages (WCA) can be much fewer active ammonia oxidizers than the rare sublineages (SCM1-like; Figs. 8 and 9), which suggests that the DNA-based observations were insufficient to unravel the major ammonia oxidizers in the ocean. Furthermore, given that highly diverse sublineages of WCA and WCB have recently been reported in the oceanic waters (Cheung et al., 2019; Lu et al., 2019), the nitrification activity of different AOA sublineages should be further verified in future field studies.
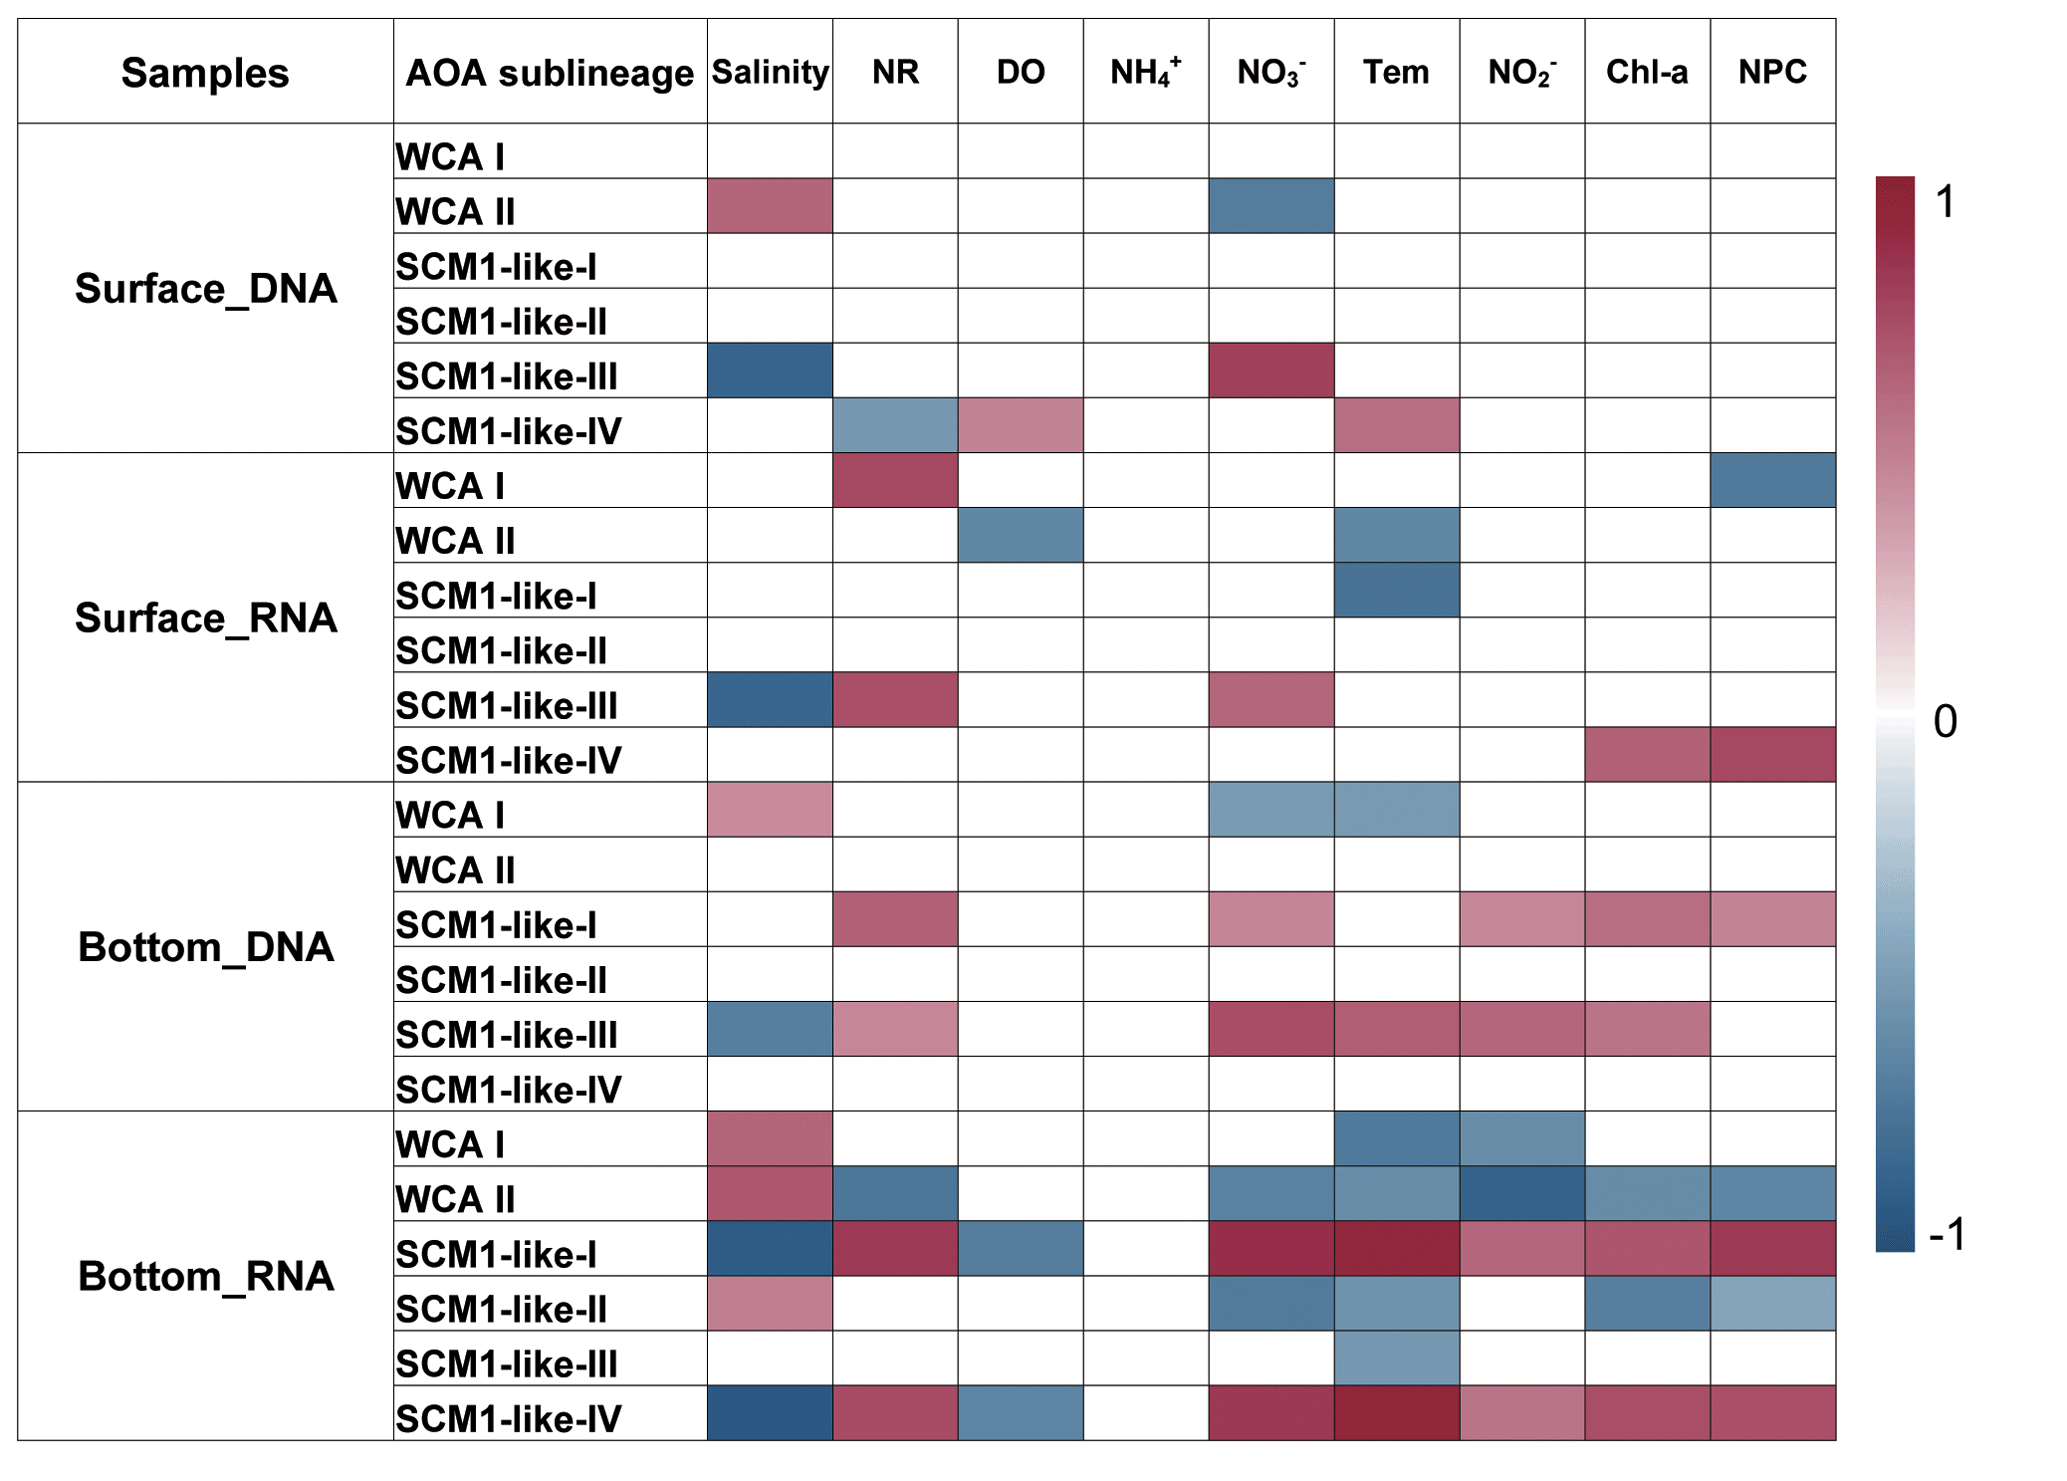
Figure 10Spearman correlation between AOA sublineages (relative abundance at DNA and RNA levels) and environmental factors in the surface and bottom layers of the water columns in the Pearl River estuary during summer 2017. Only the significant correlations (P<0.05) are displayed (NR – nitrification rates; DO – dissolved oxygen; Tem – temperature; NPC – nonphototrophic prokaryotic cells).
4.4 AOA sublineages and their potential niche in the estuarine ecosystem
The ammonia-oxidizing archaea in estuarine water were less studied compared to those in estuarine sediments, oceanic waters, and soils since the discovery of AOA (Damashek et al., 2016). In the sediment of San Francisco Bay, Mosier and Francis (2008) proposed a cluster of AOA phylotypes potentially adapted to the low-salinity environment (Mosier and Francis, 2008). However, these phylotypes were then also observed in a salt marsh (Moin et al., 2009), which leads to questioning of the low-salinity adaption assumption (Bernhard and Bollmann, 2010). On the other hand, exploration of the diversity and biogeography of different AOA were limited by the low-coverage clone library method and the underrepresented active population at RNA level. Furthermore, in most cases, relatively weak or no correlations were found between nitrification rates and archaeal amoA gene abundances (Bernhard and Bollmann, 2010) indicating diverse physiological characteristics among ammonia oxidizers. The abovementioned scenarios raise the necessity for studying key and active ammonia oxidizers in the community to understand their contribution in nitrification activities in the field.
In our study, we found niche partitioning among AOA sublineages in the dynamic PRE ecosystem in which the AOA community mainly consists of WCA and SCM1-like sublineages, while WCB is not detected. This pattern is consistent with the previous studies that show that WCA and SCM1-like are mainly distributed in surface water, and WCB is limited to deep mesopelagic waters (Francis et al., 2005; Beman et al., 2008). In a recent study based on the Tara Oceans data set, WCA I dominated the surface water AOA communities throughout the global oceans (Cheung et al., 2019). In this study, WCA I was generally minor in the estuary, except for the high-salinity bottom water that intruded from the South China Sea (Fig. 8), which indicated that WCA I prefer the conditions of oceanic waters. As revealed by the genomic and proteomic information of its representative culture (Candidatus Nitrosopelagicus brevis or CN25), the WCA I have a streamlined genome with a high coding density and are ubiquitously distributed in the oligotrophic surface ocean (Santoro et al., 2015). In contrast, WCA II was dominant in the AOA communities throughout our studied region at DNA level (Fig. 8), which agrees with the previous study that its relative abundance was generally higher in marginal seas (the Gulf of Mexico, the Red Sea, and the Arabian Sea) than in oceanic waters (Cheung et al., 2019). The present study showed that WCA II outnumbered WCA I in the estuarine ecosystem, which strongly indicated a niche partitioning between WCA I (oceanic water preferred) and WCA II (coastal water preferred). Nevertheless, these two WCA sublineages only contributed a small portion of the archaeal amoA gene transcripts and did not show a significant correlation with the nitrification rate (Fig. 10), which indicated that they were not the major ammonia oxidizers in the estuarine ecosystem. Hence, the ecological function of these abundant WCA sublineages in the estuarine ecosystem should be further explored in future studies.
Regarding the active populations in the RNA level, highly diverse SCM1-like OTUs that are highly similar to the amoA gene of Nitrosopumilus maritimus SCM1 were recovered in this study (Figs. 6 and 7; Konneke et al., 2005). In particular, the four SCM1-like sublineages defined in this study displayed the following distinct distributional patterns: SCM1-like-I and II mainly distributed in the lower reach of the river, SCM1-like-IV was mainly active at the surface layer in the estuary, and SCM1-like-III was limited to freshwater, implying distinct niche partitioning of the SCM1-like sublineages (Fig. 8). As inferred from the correlation analysis result, SCM1-like-I was the major active ammonia oxidizer in the PRE water column. The earlier view presumed that AOA are chemolithoautotrophs that largely rely on ammonia oxidation for energy acquisition. However, increasing evidence suggested that marine AOA (i.e., N. maritimus strains) can utilize organic nitrogen (i.e., urea and cyanate) as the substrates of nitrification or utilize organic nutrients (Qin et al., 2014; Kitzinger et al., 2019). Using the stable isotope probing technology, the utilization of organic matter provided evidence of heterotrophy of AOA in the salt marsh sediment and oceanic environment (Seyler et al., 2014, 2018, 2019). Hence, it may explain that the high-nitrification activities of the SCM1-like sublineages were facilitated by the enriched and diverse nitrogen sources in estuarine water. Recent culture-based studies found that the physiology of N. maritimus was not significantly influenced by salinity changes in the growth medium (Elling et al., 2015; Qin et al., 2015), which indicated that SCM1-like can tolerant to a wide salinity range. Furthermore, SCM1-like-I showed a positive correlation with nonphototropic prokaryotic cell abundance, which, together with high abundances of AOA and nonphototropic prokaryotic cells in the hypoxic zone, suggest the potential interaction and coupling between organic matter degradation and nitrification activities. On the other hand, SCM1-like-I and II were the major ammonia oxidizers in the hypoxic waters (Fig. 10), where nitrification contributed significantly to the total oxygen consumption (Fig. 4). Consistently, N. maritimus can actively oxidize ammonia and grow under low-oxygen conditions (Qin et al., 2017).
The spatial distribution of SCM1-like-III and the negative correlation with salinity indicated that SCM1-like-III is associated with freshwater discharge. The SCM1-like-III was closely related to the amoA gene fragment of Nitrosoarchaeum limnia, which is a low-salinity adapted species (Fig. S2). The functional potential of the low-salinity adaptation of N. limnia was further evidenced by genomic information from an enrichment culture (estuarine sediment from San Francisco Bay – SFB; Blainey et al., 2011). The genome of N. limnia SFB1 possessed numerous motility- and chemotaxis-associated genes that might facilitate their adaptation to the fluctuating estuarine environment (Blainey et al., 2011). Further genomic and metabolic studies are needed to understand the ecological role of SCM1-like-III in the freshwater discharge.
The amoA gene abundance at DNA level from 23 stations, along with nitrification rates, are listed in Table S2. Nitrification and community respiration and nitrification oxygen demand are listed in Table S3. The amoA abundance at RNA (cDNA) level from 13 stations are listed in Table S4. The complete sequencing data set is available at the National Center for Biotechnology Information (NCBI) under the BioProject no. PRJNA610708. Data will be released once the paper is published. The information of the sequencing samples is listed in Table S5.
The supplement related to this article is available online at: https://doi.org/10.5194/bg-17-6017-2020-supplement.
HL conceived the project and revised the paper. YL performed the experiments, analyzed the data, interpreted the data, and wrote the paper. SC interpreted the data and wrote the paper. XX edited the paper. LC and SJK provided the nitrification rates data. JG provided the physical profiles of the project. MD provided the nutrient and dissolved oxygen profiles of the project. All the authors provided critical feedback and helped shape the research, analysis, and the final version of the paper.
The authors declare that they have no conflict of interest.
This work has been supported by the Research Grants Council (Hong Kong RGC) Theme-based Research Scheme (grant no. T21-602/16-R), the RGC/NSFC Joint Research Scheme (grant no. HKUST609/15), and the GRF grants (grant nos. 16128416 and 16101318). This study was also supported by the Hong Kong Branch of Southern Marine Science and Engineering Guangdong Laboratory (Guangzhou; grant no. SMSEGL20SC01).
This research has been supported by the Research Grants Council (Hong Kong RGC) Theme-Based Research Scheme (grant no. T21-602/16-R), the RGC/NSFC Joint Research Scheme (grant no. HKUST609/15), and the GRF grants (grant nos. 16128416 and 16101318).
This paper was edited by Carolin Löscher and reviewed by two anonymous referees.
Abell, G. C. J., Revill, A. T., Smith, C., Bissett, A. P., Volkman, J. K., and Robert, S. S.: Archaeal ammonia oxidizers and nirS-type denitrifiers dominate sediment nitrifying and denitrifying populations in a subtropical macrotidal estuary, ISME J., 4, 286–300, https://doi.org/10.1038/ismej.2009.105, 2010.
Agarwala, R., Barrett, T., Beck, J., Benson, D. A., Bollin, C., Bolton, E., Bourexis, D., Brister, J. R., Bryant, S. H., Canese, K., Cavanaugh, M., Charowhas, C., Clark, K., Dondoshansky, I., Feolo, M., Fitzpatrick, L., Funk, K., Geer, L. Y., Gorelenkov, V., Graeff, A., Hlavina, W., Holmes, B., Johnson, M., Kattman, B., Khotomlianski, V., Kimchi, A., Kimelman, M., Kimura, M., Kitts, P., Klimke, W., Kotliarov, A., Krasnov, S., Kuznetsov, A., Landrum, M. J., Landsman, D., Lathrop, S., Lee, J. M., Leubsdorf, C., Lu, Z. Y., Madden, T. L., Marchler-Bauer, A., Malheiro, A., Meric, P., Karsch-Mizrachi, I., Mnev, A., Murphy, T., Orris, R., Ostell, J., O'Sullivan, C., Palanigobu, V., Panchenko, A. R., Phan, L., Pierov, B., Pruitt, K. D., Rodarmer, K., Sayers, E. W., Schneider, V., Schoch, C. L., Schuler, G. D., Sherry, S. T., Siyan, K., Soboleva, A., Soussov, V., Starchenko, G., Tatusova, T. A., Thibaud-Nissen, F., Todorov, K., Trawick, B. W., Vakatov, D., Ward, M., Yaschenko, E., Zasypkin, A., and Zbicz, K.: Database resources of the National Center for Biotechnology Information, Nucl. Acids Res., 46, 8–13, https://doi.org/10.1093/nar/gkx1095, 2018.
Alves, R. J. E., Minh, B. Q., Urich, T., von Haeseler, A., and Schleper, C.: Unifying the global phylogeny and environmental distribution of ammonia-oxidising archaea based on amoA genes, Nat. Commun., 9, 1517, https://doi.org/10.1038/s41467-018-03861-1, 2018.
Beman, J. M., Popp, B. N., and Francis, C. A.: Molecular and biogeochemical evidence for ammonia oxidation by marine Crenarchaeota in the Gulf of California, ISME J., 2, 429–441, https://doi.org/10.1038/ismej.2007.118, 2008.
Beman, J. M., Popp, B. N., and Alford, S. E.: Quantification of ammonia oxidation rates and ammonia-oxidizing archaea and bacteria at high resolution in the Gulf of California and eastern tropical North Pacific Ocean, Limnol. Oceanogr., 57, 711–726, https://doi.org/10.4319/lo.2012.57.3.0711, 2012.
Bernhard, A. E. and Bollmann, A.: Estuarine nitrifiers: New players, patterns and processes, Estuar. Coast. Shelf Sci., 88, 1–11, https://doi.org/10.1016/j.ecss.2010.01.023, 2010.
Bernhard, A. E., Landry, Z. C., Blevins, A., de la Torre, J. R., Giblin, A. E., and Stahl, D. A.: Abundance of ammonia-oxidizing archaea and bacteria along an estuarine salinity gradient in relation to potential nitrification rates, Appl. Environ. Microbiol., 76, 1285–1289, https://doi.org/10.1128/Aem.02018-09, 2010.
Blainey, P. C., Mosier, A. C., Potanina, A., Francis, C. A., and Quake, S. R.: Genome of a Low-salinity ammonia-oxidizing archaeon determined by single-cell and metagenomic analysis, PLoS One, 6, e16626, https://doi.org/10.1371/journal.pone.0016626, 2011.
Bristow, L. A., Dalsgaard, T., Tiano, L., Mills, D. B., Bertagnolli, A. D., Wright, J. J., Hallam, S. J., Ulloa, O., Canfield, D. E., Revsbech, N. P., and Thamdrup, B.: Ammonium and nitrite oxidation at nanomolar oxygen concentrations in oxygen minimum zone waters, P. Natl. Acad. Sci. USA, 113, 10601–10606, https://doi.org/10.1073/pnas.1600359113, 2016.
Caffrey, J. M., Bano, N., Kalanetra, K., and Hollibaugh, J. T.: Ammonia oxidation and ammonia-oxidizing bacteria and archaea from estuaries with differing histories of hypoxia, ISME J., 1, 660–662, https://doi.org/10.1038/ismej.2007.79, 2007.
Campbell, L. G., Thrash, J. C., Rabalais, N. N., and Mason, O. U.: Extent of the annual Gulf of Mexico hypoxic zone influences microbial community structure, PLoS One, 14, e0209055, https://doi.org/10.1371/journal.pone.0209055, 2019.
Casciotti, K. L., Sigman, D. M., Hastings, M. G., Bohlke, J. K., and Hilkert, A.: Measurement of the oxygen isotopic composition of nitrate in seawater and freshwater using the denitrifier method, Anal. Chem., 74, 4905–4912, https://doi.org/10.1021/ac020113w, 2002.
Cheung, S., Mak, W., Xia, X. M., Lu, Y. H., Cheung, Y. Y., and Liu, H. B.: Overlooked genetic diversity of ammonia oxidizing archaea lineages in the global oceans, J. Geophys. Res.-Biogeo., 124, 1799–1811, https://doi.org/10.1029/2018jg004636, 2019.
Dai, M. Guo, H., Zhai, W., Yuan, L., Wang, B., Wang, L., Cai, P., Tang, T., and Cai, W.-J.: Oxygen depletion in the upper reach of the Pearl River estuary during a winter drought, Mar. Chem., 102, 159–169, https://doi.org/10.1016/j.marchem.2005.09.020, 2006.
Dai, M., Wang, L., Guo, X., Zhai, W., Li, Q., He, B., and Kao, S.-J.: Nitrification and inorganic nitrogen distribution in a large perturbed river/estuarine system: the Pearl River Estuary, China, Biogeosciences, 5, 1227–1244, https://doi.org/10.5194/bg-5-1227-2008, 2008.
Damashek, J., Casciotti, K. L., and Francis, C. A.: Variable nitrification rates across environmental gradients in turbid, nutrient-rich estuary waters of San Francisco Bay, Estuar. Coast., 39, 1050–1071, https://doi.org/10.1007/s12237-016-0071-7, 2016.
Elling, F. J., Konneke, M., Mussmann, M., Greve, A., and Hinrichs, K. U.: Influence of temperature, pH, and salinity on membrane lipid composition and TEX86 of marine planktonic thaumarchaeal isolates, Geochim. Cosmochim. Ac., 171, 238–255, https://doi.org/10.1016/j.gca.2015.09.004, 2015.
Erguder, T. H., Boon, N., Wittebolle, L., Marzorati, M., and Verstraete, W. : Environmental factors shaping the ecological niches of ammonia-oxidizing archaea, FEMS Microbiol Rev., 33, 855–869, https://doi.org/10.1111/j.1574-6976.2009.00179.x, 2009.
Francis, C. A., Roberts, K. J., Beman, J. M., Santoro, A. E., and Oakley, B. B.: Ubiquity and diversity of ammonia-oxidizing archaea in water columns and sediments of the ocean, P. Natl. Acad. Sci. USA, 102, 14683–14688, https://doi.org/10.1073/pnas.0506625102, 2005.
Hallam, S. J., Mincer, T. J., Schleper, C., Preston, C. M., Roberts, K., Richardson, P. M., and DeLong, E. F.: Pathways of carbon assimilation and ammonia oxidation suggested by environmental genomic analyses of marine Crenarchaeota, PLoS Biol., 4, 520–536, https://doi.org/10.1371/journal.pbio.0040095, 2006.
Happel, E. Bartl, I., Voss, M., and Riemann, L.: Extensive nitrification and active ammonia oxidizers in two contrasting coastal systems of the Baltic Sea, Environ. Microbiol., 20, 2913–2926, https://doi.org/10.1111/1462-2920.14293, 2018.
Harrison, P. J., Yin, K. D., Lee, J. H. W., Gan, J. P., and Liu, H. B.: Physical-biological coupling in the Pearl River Estuary, Cont. Shelf Res., 28, 1405–1415, https://doi.org/10.1016/j.csr.2007.02.011, 2008.
Hsiao, S. S.-Y., Hsu, T.-C., Liu, J.-w., Xie, X., Zhang, Y., Lin, J., Wang, H., Yang, J.-Y. T., Hsu, S.-C., Dai, M., and Kao, S.-J.: Nitrification and its oxygen consumption along the turbid Chang Jiang River plume, Biogeosciences, 11, 2083–2098, https://doi.org/10.5194/bg-11-2083-2014, 2014.
Jing, H. M., Cheung, S. Y., Xia, X. M., Suzuki, K., Nishioka, J., and Liu, H. B.: Geographic distribution of ammonia-oxidizing archaea along the Kuril Islands in the western subarctic Pacific, Front. Microbiol., 8, 1247, https://doi.org/10.3389/fmicb.2017.01247, 2017.
Kahle, D. and Wickham, H.: ggmap: Spatial Visualization with ggplot2, The R J., 51, 144–161, 2013.
Kitzinger, K., Padilla, C. C., Marchant, H. K., Hach, P. F., Herbold, C. W., Kidane, A. T., Konneke, M., Littmann, S., Mooshammer, M., Niggemann, J., Petrov, S., Richter, A., Stewart, F., Wagner, M., Kuypers, M. M. M., and Bristow, L. A.: Cyanate and urea are substrates for nitrification by Thaumarchaeota in the marine environment, Nat. Microbiol., 4, 234–243, https://doi.org/10.1038/s41564-018-0316-2, 2019.
Knapp, A. N., Sigman, D. M., and Lipschultz, F.: N isotopic composition of dissolved organic nitrogen and nitrate at the Bermuda Atlantic time-series study site, Global Biogeochem. Cy., 19, GB1018, https://doi.org/10.1029/2004gb002320, 2005.
Konneke, M., Bernhard, A. E., de la Torre, J. R., Walker, C. B., Waterbury, J. B., and Stahl, D. A.: Isolation of an autotrophic ammonia-oxidizing marine archaeon, Nature, 437, 543–546, https://doi.org/10.1038/nature03911, 2005.
Letunic, I. and Bork, P.: Interactive tree of life (iTOL) v3: an online tool for the display and annotation of phylogenetic and other trees, Nucleic Acids Res., 44, 242–245, https://doi.org/10.1093/nar/gkw290, 2016.
Lipschultz, F., Wofsy, S. C., and Fox, L. E.: Nitrogen-metabolism of the eutrophic Delaware River ecosystem, Limnol. Oceanogr., 31, 701–716, https://doi.org/10.4319/lo.1986.31.4.0701, 1986.
Liu, H. B., Jing, H. M., Wong, T. H. C., and Chen, B. Z.: Co-occurrence of phycocyanin- and phycoerythrin-rich Synechococcus in subtropical estuarine and coastal waters of Hong Kong, Environ. Microbiol. Rep., 6, 90–99, https://doi.org/10.1111/1758-2229.12111, 2014.
Logares, R., Audic, S., Bass, D., Bittner, L., Boutte, C., Christen, R., Claverie, J. M., Decelle, J., Dolan, J. R., Dunthorn, M., Edvardsen, B., Gobet, A., Kooistra, W. H. C. F., Mahe, F., Not, F., Ogata, H., Pawlowski, J., Pernice, M., C., Romac, S., Shalchian-Tabrizi, K., Simon, N., Stoeck, T., Santini, S., Siano, R., Wincker, P., Zingone, A., Richards, T. A., de Vargas, C., and Massana, R.: Patterns of rare and abundant marine microbial eukaryotes, Curr. Biol., 24, 813–821, https://doi.org/10.1016/j.cub.2014.02.050, 2014.
Lu, Y. H., Xia, X. M., Cheung, S. Y., Jing, H. M., and Liu, H. B.: Differential distribution and determinants of ammonia oxidizing archaea sublineages in the oxygen minimum zone off Costa Rica, Microorganisms, 7, 453, https://doi.org/10.3390/microorganisms7100453, 2019.
Lu, Z. M., Gan, J. P., Dai, M. H., Liu, H. B., and Zhao, X. Z.: Joint effects of extrinsic biophysical fluxes and intrinsic hydrodynamics on the formation of hypoxia west off the Pearl River Estuary, J. Geophys. Res.-Ocean, 123, 6241–6259, https://doi.org/10.1029/2018jc014199, 2018.
Magalhaes, C. M., Machado, A., and Bordalo, A. A.: Temporal variability in the abundance of ammonia-oxidizing bacteria vs. archaea in sandy sediments of the Douro River estuary, Portugal, Aquat. Microb. Ecol., 56, 13–23, https://doi.org/10.3354/ame01313, 2009.
Martens-Habbena, W., Berube, P. M., Urakawa, H., de la Torre, J. R., and Stahl, D. A.: Ammonia oxidation kinetics determine niche separation of nitrifying Archaea and Bacteria, Nature, 461, 976–979, https://doi.org/10.1038/nature08465, 2009.
Moin, N. S., Nelson, K. A., Bush, A., and Bernhard, A. E.: Distribution and diversity of archaeal and bacterial ammonia oxidizers in salt marsh sediments, Appl. Environ. Microbiol., 75, 7461–7468, https://doi.org/10.1128/Aem.01001-09, 2009.
Mosier, A. C. and Francis, C. A.: Relative abundance and diversity of ammonia-oxidizing archaea and bacteria in the San Francisco Bay estuary, Environ. Microbiol., 10, 3002–3016, https://doi.org/10.1111/j.1462-2920.2008.01764.x, 2008.
Mosier, A. C. and Francis C. A.: Determining the distribution of marine and coastal ammonia-oxidizing archaea and bacteria using a quantitative approach, Meth. Enzymol., 486, 205–221, https://doi.org/10.1016/S0076-6879(11)86009-X, 2011.
Oksanen, J., Blanchet, F. G., Friendly, Kindt, M. R., Legendre, P., McGlinn, D., Minchin, P. R., O'Hara, R. B., Simpson, G. L., Solymos, P. M., Stevens, H. H., Szoecs E., and Wagner, H.: vegan: Community Ecology Package, R package version 2.5-6, availabe at: https://CRAN.R-project.org/package (last access: 19 September 2020), 2019.
Pai, S. C., Tsau, Y. J., and Yang, T. I.: pH and buffering capacity problems involved in the determination of ammonia in saline water using the indophenol blue spectrophotometric method, Anal. Chim. Ac., 434, 209–216, https://doi.org/10.1016/S0003-2670(01)00851-0, 2001.
Pakulski, J. D., Benner, R., Amon, R., Eadie, B., and Whitledge, T.: Community metabolism and nutrient cycling in the Mississippi River Plume – Evidence for intense nitrification at intermediate salinities, Mar. Ecol. Prog. Ser., 117, 207–218, https://doi.org/10.3354/meps117207, 1995.
Peng, X. F., Jayakumar, A., and Ward, B. B.: Community composition of ammonia-oxidizing archaea from surface and anoxic depths of oceanic oxygen minimum zones, Front. Microbiol., 4, 177, https://doi.org/10.3389/fmicb.2013.00177, 2013.
Qian, W., Gan, J. P., Liu, J. W., He, B. Y., Lu, Z. M., Guo, X. H., Wang, D. L., Guo, L. G., Huang, T., and Dai, M. H.: Current status of emerging hypoxia in a eutrophic estuary: The lower reach of the Pearl River Estuary, China, Estuar. Coast. Shelf S., 205, 58–67, https://doi.org/10.1016/j.ecss.2018.03.004, 2018.
Qin, W., Amin, S. A., Martens-Habbena, W., Walker, C. B., Urakawa, H., Devol, A. H., Ingalls, A. E., Moffett, J. W., Armbrust, E. V., and Stahl, D. A.: Marine ammonia-oxidizing archaeal isolates display obligate mixotrophy and wide ecotypic variation, P. Natl. Acad. Sci. USA, 111, 12504–12509. https://doi.org/10.1073/pnas.1324115111, 2014.
Qin, W., Carlson, L. T., Armbrust, E. V., Devol, A. H., Moffett, J. W., Stahl, D. A., and Ingalls, A. E.: Confounding effects of oxygen and temperature on the TEX86 signature of marine Thaumarchaeota, P. Natl. Acad. Sci. USA, 112, 10979–10984, https://doi.org/10.1073/pnas.1501568112, 2015.
Qin, W., Meinhardt, K. A., Moffett, J. W., Devol, A. H., Armbrust, E. V., Ingalls, A. E., and Stahl, D. A.: Influence of oxygen availability on the activities of ammonia-oxidizing archaea, Environ. Microbiol. Rep., 9, 250–256, https://doi.org/10.1111/1758-2229.12525, 2017.
Rotthauwe, J. H., Witzel, K. P., and Liesack, W.: The ammonia monooxygenase structural gene amoA as a functional marker: Molecular fine-scale analysis of natural ammonia-oxidizing populations, Appl. Environ. Microbiol., 63, 4704–4712, 1997.
Sampou, P. and Kemp, W. N.: Factors regulating phytoplankton community respiration in Chesapeake Bay, Mar. Ecol. Prog. Ser., 110, 249–258, https://doi.org/10.3354/meps110249, 1994.
Santoro, A. E., Francis, C. A., de Sieyes, N. R., and Boehm, A. B.: Shifts in the relative abundance of ammonia-oxidizing bacteria and archaea across physicochemical gradients in a subterranean estuary, Environ. Microbiol., 10, 1068–1079, https://doi.org/10.1111/j.1462-2920.2007.01547.x, 2008.
Santoro, A. E., Dupont, C. L., Richter, R. A., Craig, M. T., Carini, P., McIlvin, M. R., Yang, Y., Orsi, W. D., Moran, D. M., and Saito, M. A.: Genomic and proteomic characterization of Candidatus Nitrosopelagicus brevis: An ammonia-oxidizing archaeon from the open ocean, P. Natl. Acad. Sci. USA, 112, 1173–1178, https://doi.org/10.1073/pnas.1416223112, 2015.
Santoro, A. E., Saito, M. A., Goepfert, T. J., Lamborg, C. H., Dupont, C. L., and DiTullio, G. R.: Thaumarchaeal ecotype distributions across the equatorial Pacific Ocean and their potential roles in nitrification and sinking flux attenuation, Limnol. Oceanogr., 62, 1984–2003, https://doi.org/10.1002/lno.10547, 2017.
Schloss, P. D., Westcott, S. L., Ryabin, T., Hall, J. R., Hartmann, M., Hollister, E. B., Lesniewski, R. A., Oakley, B. B., Parks, D. H., Robinson, C. J., Sahl, J. W., Stres, B., Thallinger, G. G., Van Horn, D. J., and Weber, C. F.: Introducing mothur: Open-Source, Platform-Independent, Community-Supported Software for describing and comparing microbial communities, Appl. Environ. Microbiol., 75, 7537–7541, https://doi.org/10.1128/Aem.01541-09, 2009.
Seyler, L. M., McGuinness, L. M., and Kerkhof, L. J.: Crenarchaeal heterotrophy in salt marsh sediments, ISME J., 8, 1534–1543, https://doi.org/10.1038/ismej.2014.15, 2014.
Seyler, L. M., McGuinness, L. R., Gilbert, J. A., Biddle, J. F., Gong, D. L., and Kerkhof, L. J.: Discerning autotrophy, mixotrophy and heterotrophy in marine TACK archaea from the North Atlantic, FEMS Microbiol. Ecol., 94, fiy014, https://doi.org/10.1093/femsec/fiy014, 2018.
Seyler, L. M., Tuorto, S., McGuinness, L. R., Gong, D. L., and Kerkhof, L. J.: Bacterial and archaeal specific-predation in the North Atlantic Basin, Front. Mar. Sci., 6, 555, https://doi.org/10.3389/fmars.2019.00555, 2019.
Sigman, D. M., Casciotti, K. L., Andreani, M., Barford, C., Galanter, M., and Bohlke, J. K.: A bacterial method for the nitrogen isotopic analysis of nitrate in seawater and freshwater, Anal. Chem., 73, 4145–4153, https://doi.org/10.1021/ac010088e, 2001.
Smith, J. M., Damashek, J., Chavez, F. P., and Francis, C. A.: Factors influencing nitrification rates and the abundance and transcriptional activity of ammonia-oxidizing microorganisms in the dark northeast Pacific Ocean, Limnol. Oceanogr., 61, 596–609, https://doi.org/10.1002/lno.10235, 2016.
Vaulot, D., Courties, C., and Partensky, F.: A simple method to preserve oceanic phytoplankton for Flow Cytometric Analyses, Cytometry, 10, 629–635, https://doi.org/10.1002/cyto.990100519, 1989.
Wankel, S. D., Mosier, A. C., Hansel, C. M., Paytan, A., and Francis, C. A.: Spatial variability in nitrification rates and ammonia-oxidizing microbial communities in the agriculturally impacted Elkhorn Slough Estuary, California, Appl. Environ. Microbiol., 77, 269–280, https://doi.org/10.1128/Aem.01318-10, 2011.
Ward, B. B.: Nitrification and ammonification in aquatic systems, Life Support Biosph. Sci., 3, 25–29, 1996.
Welschmeyer, N. A.: Fluorometric analysis of Chlorophyll-a in the presence of Chlorophyll-B and pheopigments, Limnol. Oceanogr., 39, 1985–1992, https://doi.org/10.4319/lo.1994.39.8.1985, 1994.
Wickham, H.: ggplot2: Elegant graphics for data analysis, Springer-Verlag New York, USA, 2016.
Wu, R. N., Meng, H., Wang, Y. F., Lan, W. S., and Gu, J. D.: A more comprehensive community of ammonia-oxidizing archaea (AOA) revealed by genomic DNA and RNA analyses of amoA gene in subtropical acidic Forest Soils, Microbiol. Ecol., 74, 910–922, https://doi.org/10.1007/s00248-017-1045-4, 2017.
Xu, J., Jing, H. M., Kong, L. L., Sun, M. M., Harrison, P. J., and Liu, H. B.: Effect of seawater-sewage cross-transplants on bacterial metabolism and diversity, Microbiol. Ecol., 66, 60–72, https://doi.org/10.1007/s00248-013-0207-2, 2013.
Yool, A., Martin, A. P., Fernandez, C., and Clark, D. R.: The significance of nitrification for oceanic new production, Nature, 447, 999–1002, https://doi.org/10.1038/nature05885, 2007.
Zhao, H. T.: Evolution of the Pearl River Estuary, China Ocean Press, Beijing, China, 1990 (in Chinese).
Zhao, Y. Y., Liu, J., Uthaipan, K., Song, X., Xu, Y., He, B. Y., Liu, H., Gan, J. P., and Dai, M. H.: Dynamics of inorganic carbon and pH in a large subtropical continental shelf system: Interaction between eutrophication, hypoxia, and ocean acidification, Limnol. Oceanogr., 65, 1359–1379, https:/.doi.org/10.1002/lmo.11393, 2020.