the Creative Commons Attribution 4.0 License.
the Creative Commons Attribution 4.0 License.
 | 04 Dec 2020
Microbial functional signature in the atmospheric boundary layer
Romie Tignat-Perrier
Aurélien Dommergue
Alban Thollot
Olivier Magand
Timothy M. Vogel
Catherine Larose
Microorganisms are ubiquitous in the atmosphere, and some airborne microbial cells were shown to be particularly resistant to atmospheric physical and chemical conditions (e.g., ultraviolet – UV – radiation, desiccation and the presence of radicals). In addition to surviving, some cultivable microorganisms of airborne origin were shown to be able to grow on atmospheric chemicals in laboratory experiments. Metagenomic investigations have been used to identify specific signatures of microbial functional potential in different ecosystems. We conducted a comparative metagenomic study on the overall microbial functional potential and specific metabolic and stress-related microbial functions of atmospheric microorganisms in order to determine whether airborne microbial communities possess an atmosphere-specific functional potential signature as compared to other ecosystems (i.e., soil, sediment, snow, feces, surface seawater etc.). In the absence of a specific atmospheric signature, the atmospheric samples collected at nine sites around the world were similar to their underlying ecosystems. In addition, atmospheric samples were characterized by a relatively high proportion of fungi. The higher proportion of sequences annotated as genes involved in stress-related functions (i.e., functions related to the response to desiccation, UV radiation, oxidative stress etc.) resulted in part from the high concentrations of fungi that might resist and survive atmospheric physical stress better than bacteria.
- Article
(2354 KB) - Full-text XML
-
Supplement
(1006 KB) - BibTeX
- EndNote


Microorganisms are ubiquitous in the atmosphere and reach concentrations of up to 106 microbial cells per cubic meter of air (Tignat-Perrier et al., 2019). Due to their important roles in public health and meteorological processes (Ariya et al., 2009; Aylor, 2003; Brown and Hovmøller, 2002; Delort et al., 2010; Griffin, 2007), understanding how airborne microbial communities are distributed over time and space is critical. While the concentration and taxonomic diversity of airborne microbial communities in the planetary boundary layer have recently been described (Els et al., 2019; Innocente et al., 2017; Tignat-Perrier et al., 2019), the functional potential of airborne microbial communities remains unknown. Most studies have focused on laboratory cultivation to identify possible metabolic functions of microbial strains of atmospheric origin, mainly from cloud water (Amato et al., 2007; Ariya et al., 2002; Hill et al., 2007; Vaïtilingom et al., 2010, 2013). Given that cultivable organisms represent about 1 % of the entire microbial community (Vartoukian et al., 2010), culture-independent techniques and especially metagenomic studies applied to atmospheric microbiology have the potential to provide additional information on the selection and genetic adaptation of airborne microorganisms. However, to our knowledge, only five metagenomic studies on airborne microbial communities at one or two specific sites per study exist (Aalismail et al., 2019; Amato et al., 2019; Cao et al., 2014; Gusareva et al., 2019; Yooseph et al., 2013). Metagenomic investigations of complex microbial communities in many ecosystems (for example, soil, seawater, lakes, feces and sludge) have provided evidence that microorganism functional signatures reflect the abiotic conditions of their environment, with different relative abundances of specific microbial functional classes (Delmont et al., 2011; Li et al., 2019; Tringe et al., 2005; Xie et al., 2011). This observed correlation of microbial-community functional potential and the physical and chemical characteristics of their environments could have resulted from genetic modifications (microbial adaptation; Brune et al., 2000; Hindré et al., 2012; Rey et al., 2016; Yooseph et al., 2010) and/or physical selection. The latter refers to the death of sensitive cells and the survival of resistant or previously adapted cells. This physical selection can occur when microorganisms are exposed to physiologically adverse conditions.
The presence of a specific microbial functional signature in the atmosphere has not been investigated yet. Microbial strains of airborne origin have been shown to survive and develop under conditions typically found in cloud water (i.e., high concentrations of H2O2, typical cloud carbonaceous sources, ultraviolet – UV – radiation etc.; Amato et al., 2007; Joly et al., 2015; Vaïtilingom et al., 2013). While atmospheric chemicals might lead to some microbial adaptation, physical and unfavorable conditions of the atmosphere such as UV radiation, low water content and cold temperatures might select which microorganisms can survive in the atmosphere. From the pool of microbial cells being aerosolized from Earth's surfaces, these adverse conditions might act as a filter in selecting cells already resistant to unfavorable physical conditions. Fungal cells and especially fungal spores might be particularly adapted to survive in the atmosphere due to their innate resistance (Huang and Hull, 2017) and might behave differently than bacterial cells. Still, the proportion and nature (i.e., fungi versus bacteria) of microbial cells that are resistant to the harsh atmospheric conditions within airborne microbial communities are unknown.
Our objective was to determine whether airborne microorganisms in the planetary boundary layer possess a specific functional signature as compared to other ecosystems, since this might indicate that microorganisms with specific functions tend to be more aerosolized and/or undergo a higher survival in this environment. Our previous study showed that airborne microbial taxonomy mainly depends on the underlying ecosystems, indicating that the local environments are the main source of airborne microorganisms (Tignat-Perrier et al., 2019). Still, we do not know if airborne microbial communities result from random or specific aerosolization of the underlying ecosystems' microorganisms. We used a metagenomic approach to compare the differences and similarities of both the overall functional potential and specific microbial functions (metabolic and stress-related functions) between microbial communities from the atmosphere and other ecosystems (soil, sediment, surface seawater, river water, snow, human feces, phyllosphere and hydrothermal vent). We sampled airborne microbial communities at nine different locations around the world during several weeks to get a global-scale view and to capture the between and within-site variability in atmospheric microbial functional potential.
2.1 Sites and sampling
Air samples were collected at nine sites in 2016 and 2017. Sites were characterized by different latitudes (from the Arctic to sub-Antarctica; Fig. 1), elevations from sea level (from 59 to 5230 m; Fig. 1) and environment type (marine for Amsterdam Island or AMS; coastal for Cape Point or CAP; polar for Station Nord or STN; and terrestrial for Grenoble or GRE, Chacaltaya or CHC, Puy de Dôme or PDD, Pic du Midi or PDM, Storm Peak or STP, and Namco or NAM; Table S1). The number of samples collected per site varied from 7 to 16 (Table S1). We collected particulate matter smaller than 10 µm (PM10) on quartz fiber filters (5.9 round filter and 8 × 10 rectangular types) using high-volume air samplers installed on rooftops or terraces (roughly 10 m a.g.l.). A Tisch TE-5170V sampler, Digitel DA77 and DA80 sampler, Chinese 2131 Laowin sampler or custom-made sampler (i.e., high-volume pump connected to a Digitel PM10 head and airflow meter) was used depending on the site (Table S1). To avoid contamination, quartz fiber filters as well as all the material in contact with the filters (i.e., filter holders, aluminum foils and plastic bags in which the filters were transported) were sterilized using strong heating (500 ∘C for 8 h) and UV radiation, respectively, as detailed in Dommergue et al. (2019). The collection time per sample lasted 1 week, and the collected volumes ranged from 2000 to 10 000 m3 after standardization using SATP standards (standard ambient pressure and temperature). Detailed sampling protocols including negative control filters are presented in Dommergue et al. (2019). The MODIS (Moderate Resolution Imaging Spectroradiometer) land cover approach (5′ × 5′ resolution; Friedl et al., 2002; Shannan et al., 2014) was used to quantify landscapes in the 50 km diameter area of our nine sampling sites (Fig. S1).
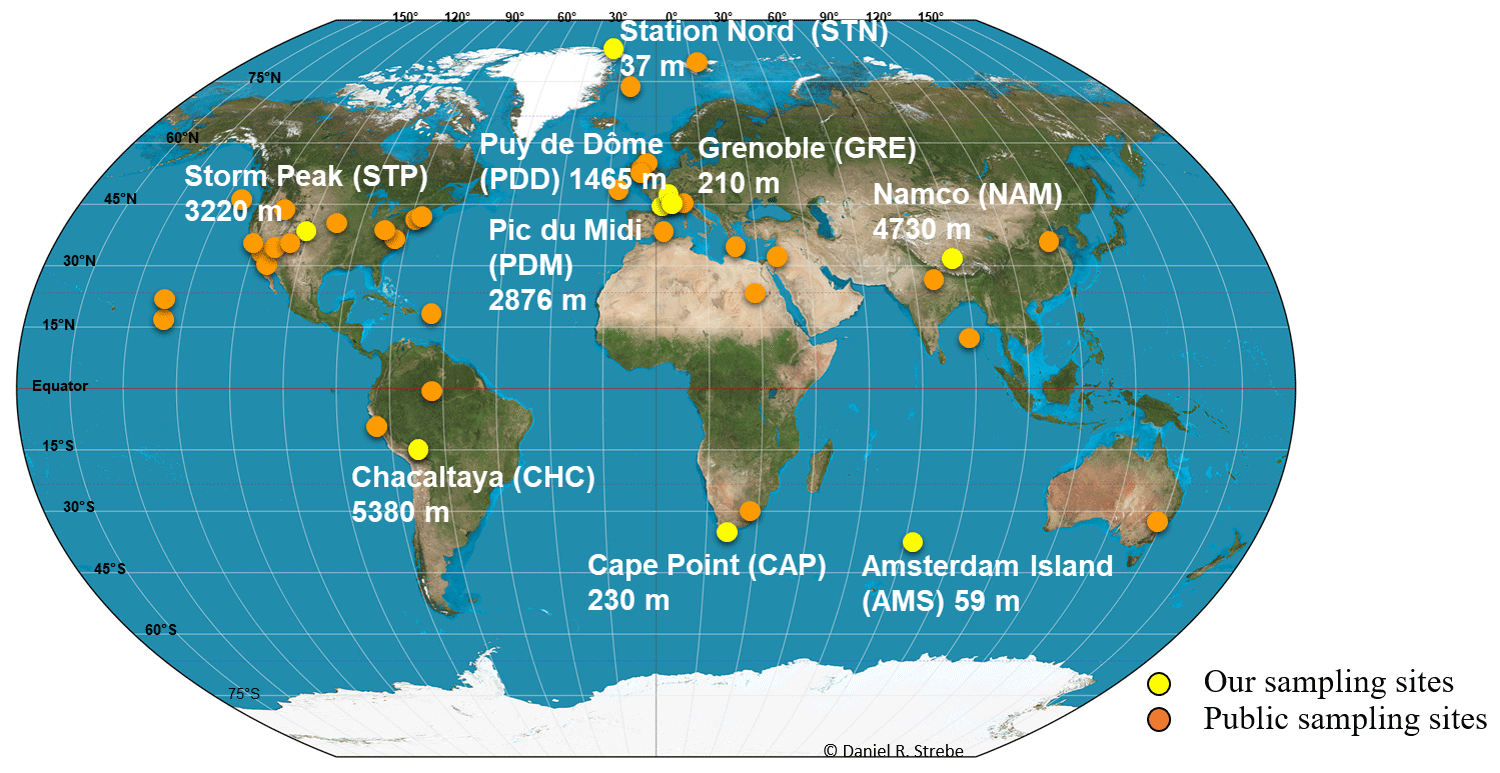
Figure 1Sample collection locations. Map showing the geographical location and elevation from sea level of our nine sampling sites (in yellow) and the geographical position where public metagenomes originate (in orange). Abbreviations of our nine sampling sites are indicated in parentheses.
2.2 Molecular biology analyses
2.2.1 DNA extraction
DNA was extracted from three circular pieces (punches) from the quartz fiber filters (diameter of one punch: 38 mm) using the DNeasy PowerWater kit with some modifications as detailed in Dommergue et al. (2019). During cell lysis, the PowerBead tube containing the three punches and the pre-heated lysis solution were heated at 65 ∘C for 1 h after a 10 min vortex treatment at maximum speed. We then separated the filter debris from the lysate by centrifugation at 1000 rcf (relative centrifugal force) for 4 min. From this step on, we followed the DNeasy PowerWater protocol. We conducted additional extractions on French agricultural soil samples collected at La Côte-Saint-André (that is part of the sample collection locations). We used 250 mg of soil on which the same DNA extraction methodology as for air samples was applied. DNA concentration eluted in 100 µL of buffer was measured using the Qubit Fluorometric Quantification kit (Thermo Fisher Scientific). DNA was stored at −20 ∘C.
2.2.2 16S and 18S rRNA gene qPCR (quantitative polymerase chain reaction) analyses
The 16S and 18S rRNA gene copy numbers were calculated per cubic meter of air (for air samples) and per gram of soil (for soil samples). Standards, primers and methodology are presented in Tignat-Perrier et al. (2019).
2.2.3 MiSeq Illumina metagenomic sequencing
Metagenomic library preparation. Metagenomic libraries were prepared from 1 ng of DNA using the Nextera XT Library Prep Kit and indexes following the protocol in Illumina's reference guide for the Nextera XT DNA Library Prep Kit with some modifications for samples with DNA concentrations below 1 ng as follows. The tagmented DNA was amplified over 13 PCR cycles instead of 12 PCR cycles, and the libraries (after indexing) were resuspended in 30 µL of RSB (resuspension buffer) buffer instead of 52.5 µL. Metagenomic sequencing was performed using the MiSeq and V2 technology of Illumina with 2 × 250 cycles. At the end of the sequencing, the adapter sequences were removed by internal Illumina software.
Reads quality filtering. Reads 1 and 2 per sample were not paired but merged in a common file before filtering them based on read quality using the tool FASTX-Toolkit (http://hannonlab.cshl.edu/fastx_toolkit/, last access: April 2020) using a minimum read quality of Q20, minimum read length of 120 bp (base pairs) and one maximum number of N per read. Samples with less than 6000 filtered sequences were removed from the dataset.
2.2.4 Downloading of public metagenomes
Public metagenomes were downloaded from the MGRAST (Metagenomic Rapid Annotations using Subsystems Technology; Keegan et al., 2016) and SRA (Sequence Read Archive; Leinonen et al., 2011; NCBI Resource Coordinators, 2018) databases as quality-filtered read-containing FASTA files and raw read-containing FASTQ files, respectively. The FASTQ files containing raw reads underwent the same quality filtering as our metagenomes (as discussed above). The list of the metagenomes, type of ecosystem, number of sequences and sequencing technology (i.e., MiSeq, HiSeq or 454) are summarized in Table S2. The sampling sites are positioned on the map in Fig. 1.
2.3 Data analyses
All graphical and multivariate statistical analyses were carried out using the “vegan” (Oksanen et al., 2019), “ggplot2” (Hadley and Winston, 2019) and “reshape2” (Wickham, 2017) packages in the R environment (version 3.5.1).
2.3.1 Annotation of the metagenomic reads
Firstly, to access the overall functional potential of each sample, all the filtered sequences per sample were functionally annotated using DIAMOND (Buchfink et al., 2015) and the nr (non-redundant) database; then the gene-annotated sequences were grouped in the different SEED functional classes (around 7000 functional classes, referred simply to as functions) using MEGAN6 (Metagenome Analyzer; Huson et al., 2016). Functional classes that were present ≤ 2 times in a sample were removed from this sample. In parallel, the Kraken software (Wood and Salzberg, 2014) was used to retrieve the bacterial and fungal sequences separately from the filtered sequences using the Kraken bacterial database and FindFungi (Donovan et al., 2018) fungal database (both databases included complete genomes), respectively (and using two different runs of Kraken). Separately, both the bacterial and fungal sequences were also functionally annotated using DIAMOND and MEGAN6 (number of sequences functionally annotated in Table S3).
Secondly, for specific metabolic and stress-related functions, we annotated the sequences using eggNOG-Mapper version 1 (DIAMOND option; Huerta-Cepas et al., 2017), then examined specific GO (Gene Ontology; Gene Ontology Consortium, 2019) terms chosen based on their importance for microbial resistance to atmospheric-like conditions. The different GO terms used were the following: GO:0042744 (hydrogen peroxide catabolic activity) and GO:0015049 (methane monooxygenase activity) as specific metabolic functions and GO:0043934 (sporulation), GO:0009650 (response to UV), GO:0034599 (cell response to oxidative stress) and GO:0009269 (response to desiccation) as stress-related functions. The number of hits of each GO term was normalized per 10 000 annotated sequences and calculated from all sequences, bacterial sequences and fungal sequences for each sample. The ratio was given per 10 000 annotated sequences and not 100 annotated sequences to get hit numbers superior to 1. The number of sequences annotated by eggNOG-Mapper was also evaluated (Table S3). The putative concentration of a specific function or functional class in the samples is determined as the concentration of sequences annotated as one of the functional proteins associated with this function (or functional class).
2.3.2 Statistical analyses
Observed functional richness and evenness were calculated per sample after rarefaction on all sequences (rarefaction at 2000 sequences), bacterial sequences (rarefaction at 500 sequences) and fungal sequences (rarefaction at 500 sequences). Rarefaction was used only for the purpose of calculating the diversity metrics (richness and evenness). For the following analyses, no rarefaction was applied on the number of reads per sample. The distribution of the samples was analyzed based on the SEED functional classes (using all sequences). PCoA (principle coordinate analysis) and hierarchical clustering analysis (average method) were carried out on the Bray–Curtis dissimilarity matrix based on the relative abundances of the different SEED functional classes. SIMPER (similarity percentages) analyses were used to identify the functions responsible for the clustering of samples in groups. Because of the non-normality of the data, Kruskal–Wallis analyses (non-parametric version of ANOVA) and Dunn's post hoc tests were used to test the difference between the percentage of fungal sequences as well as the number of hits of each Gene Ontology term (normalized per 10 000 annotated sequences) among the different sites and the different ecosystems.
3.1 Percentage of fungal sequences
The percentage of sequences annotated as belonging to fungal genomes (or fungal sequences, as opposed to bacterial sequences) was on average higher in air samples compared to soil (P < 10−5), snow (), seawater (P=0.03) and sediment samples (; Fig. 2 and Table S4). Among the air samples, NAM (19 %), STN (24 %) and CHC (27 %) showed the lowest percentages of fungal sequences on average, while STP (88 %), GRE (79 %), AMS (71 %) and PDD (62 %) showed the highest percentages. For the ecosystems that were only represented by one sample and therefore were not evaluated by the Kruskal–Wallis test, we observed average percentages of fungal reads of 3 % in feces, 9 % in hydrothermal vents, 19 % in river water samples and 37 % in the phyllosphere. Some samples from soil, sediments and seawater such as French agricultural soil (61 %), Peruvian sediments (53 %) and Celtic seawater (53 %) had relatively high percentages of fungal sequences, while other samples had less than 50 %. The approximated number of fungal and bacterial cells in air and soil was also estimated using 16S rRNA and 18S rRNA gene copy numbers per cubic meter of air and gram of soil, respectively. Air samples showed ratios between 16S and 18S rRNA gene copy numbers from around 4.5 times up to 160 times lower than soil samples (Table S4; some qPCR data have already been published in Tignat-Perrier et al., 2020). The qPCR data were used to see if similar results or the same trend of the estimated ratio between fungi and bacteria in air compared to the planetary-bound ecosystems could be obtained from metagenomic data and qPCR.
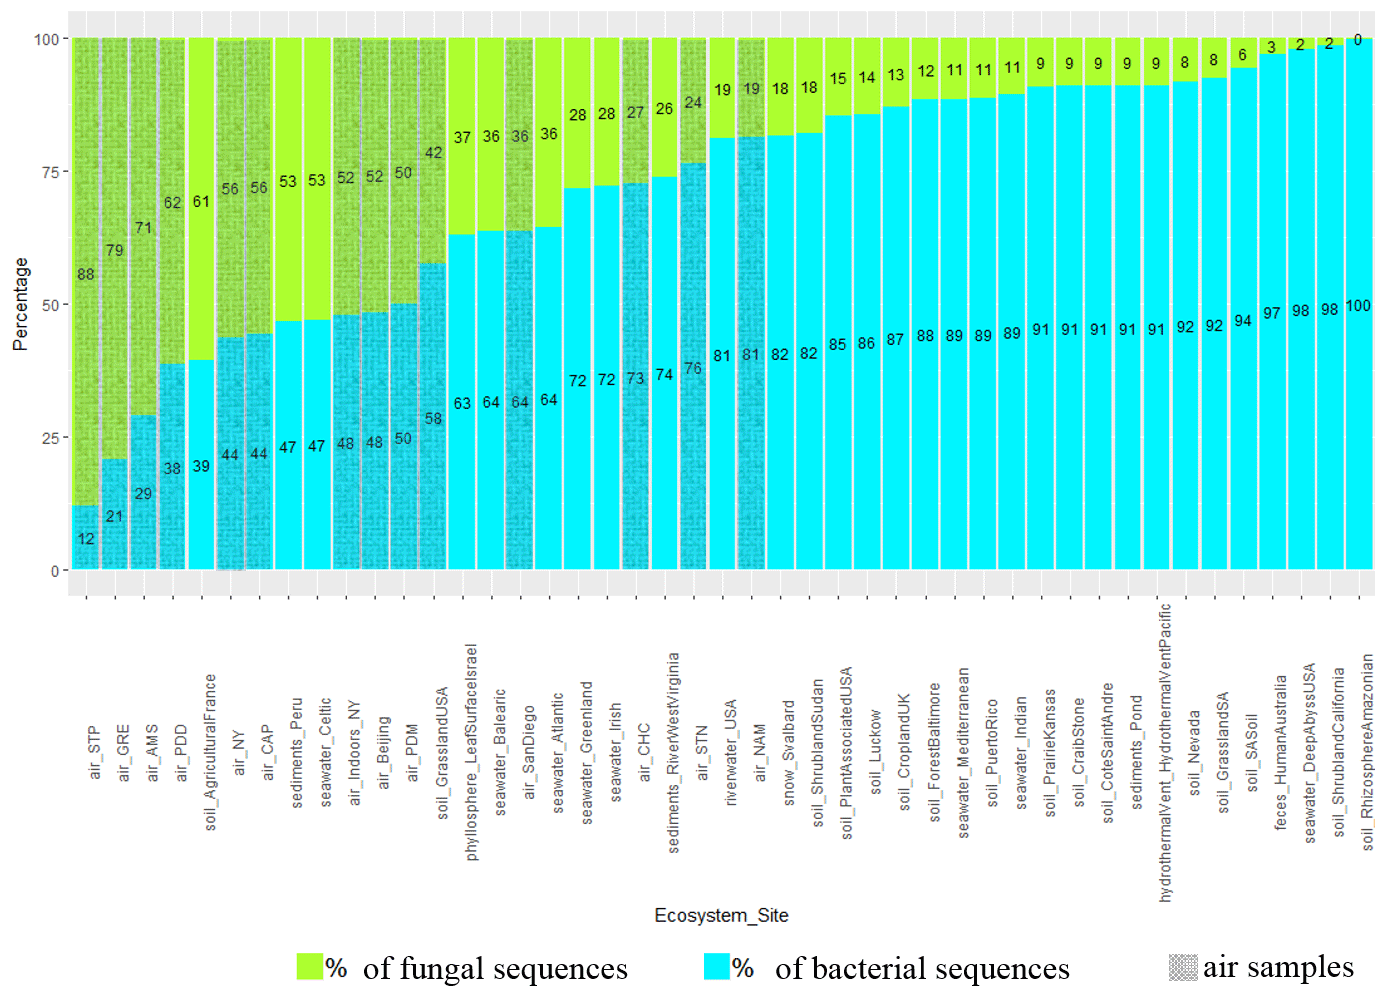
Figure 2Percentage of fungal and bacterial sequences in the metagenomes. The percentages are established as the number of sequences annotated as belonging to fungal and bacterial genomes over the sum of bacterial and fungal sequences in the metagenomes. The mean was calculated for the sampling sites including several metagenomes. Air sites (i.e., our nine sites along with five sites where public air metagenomes originate) are distinguished by grey hatching lines. NY: New York. SA: San Diego.
3.2 Airborne microbial functional profiles
The 50 most abundant SEED functional classes represented in atmospheric samples are listed in Table S5. The 5-FCL-like (5-formyltetrahydrofolate cyclo-ligase) protein, the long-chain fatty acid CoA (coenzyme A) ligase and the TonB-dependent receptor were the top three functions based on number of annotated reads observed when including all the sequences (Table S5). The atmospheric microbial functional profiles based on the SEED functions were compared between samples from the different weeks of sampling and between different locations. The profiles were graphed using PCo (principal coordinate) multivariate analysis to visualize differences and similarities. The different samples (sampled during sequential weeks) from the same site did not cluster tightly together on the PCo multivariate analysis. In order to incorporate weekly variation when comparing sites, we used the microbial functional profile averaged per site in the subsequent multivariate analyses performed with the data from other ecosystems (Fig. 3). The PCo multivariate analysis showed that terrestrial atmospheric sites (GRE, NAM, STP, PDD, PDM, CHC and New York) grouped with the soil, sediment and snow samples, while the marine and coastal atmospheric sites (AMS, CAP and San Diego) were situated between the datasets from soil, seawater and river water (Fig. 3). The polar site STN did not group with the other sites. When considering only the bacterial sequences (i.e., excluding the fungal sequences), the distribution of the terrestrial atmospheric sites did not change, while the marine Amsterdam Island, coastal Cape Point and polar Station Nord atmospheric sites were further from the seawater and river water datasets than when the fungal sequences were included (Fig. S2). The distribution of the different datasets underwent further changes when considering only the fungal sequences. We observed an absence of a clear separation between soil and seawater, since they (for the majority) grouped closely together, and terrestrial atmospheric datasets did not group with the other non-atmospheric datasets from soil, sediment and snow (Fig. S2).

Figure 3Distribution of the samples based on the microbial functional profile. The PCo analysis of the Bray–Curtis dissimilarity matrix is based on the functional potential structure of each site. For the site including several metagenomes, the average profile was calculated. Colors indicate the ecosystems to which the sites belong. The percentages (17.7 % and 12.9 %) indicate the part of the variance explained by the first and second axis, respectively.
3.3 Airborne microbial functional richness and evenness
Functional richness and evenness were evaluated using the relative abundance of sequences in the different SEED categories. The average richness in SEED functional classes (or functions) in the planetary boundary layer (PBL) was lower than the average functional-class richness in soil, surface seawater, hydrothermal vents, river water, phyllosphere and feces (P < 0.05) (Table S3). Among the different atmospheric samples, the functional-class richness was highest in Beijing (4060 ± 112 functional classes) and New York indoor air samples (3302 ± 299 functional classes) (P < 0.05) and lowest in Station Nord (956 ± 547 functional classes). When looking at the bacteria-annotated sequences, almost the same trend was observed; i.e., the functional-class richness in air was lower than in soil, hydrothermal vents, river water, phyllosphere and feces and not different from the other ecosystems (P < 0.05 and > 0.05, respectively) (Table S3). The functional-class richness was higher in Beijing (2835 ± 59 functional classes) and New York indoor air samples (2183 ± 387 functional classes) compared to the other air samples, whose values ranged between 270 ± 197 functional classes in Amsterdam Island and 1142 ± 461 functional classes in Chacaltaya. For fungal sequences, the functional-class richness in the atmosphere was lower than the functional-class richness in soil, surface seawater, feces, hydrothermal vents, river water and phyllosphere (P < 0.05; Table S3). Within air samples, the functional-class richness based on fungal sequences was higher in Beijing (1129 ± 92 functional classes) and New York indoor air samples (687 ± 206 functional classes) than in the other air sites (P < 10−5), whose values ranged from 66 ± 58 functional classes in Amsterdam Island to 392 ± 131 functional classes in Storm Peak (Table S3). The functional-class evenness in air was on average higher than in soil (P=0.03), and not different to the functional-class evenness observed in the other ecosystems (sediment, seawater and snow). When looking at the bacterial and fungal sequences separately, the functional-class evenness in air was on average higher than in soil, feces, phyllosphere and river water (P < 0.05; Table S3).
3.4 Concentration of specific microbial functions that might play a role under atmospheric conditions
Two metabolic functions associated with abundant atmospheric chemicals (H2O2 and CH4) were examined, hydrogen catabolism and methane monooxygenase activity. The concentration of sequences annotated as hydrogen-peroxide-catabolic-related functional proteins per 10 000 sequences varied between air sites (), with the highest values for Amsterdam Island (27 ± 1) and Grenoble (27 ± 1; Fig. S3). It was on average higher in air compared to soil () and surface seawater (). The French agricultural soil showed the highest relative abundance (133 ± 4). When considering the fungal and bacterial sequences separately, this concentration was not different between air and the other ecosystems (P> 0.05; Fig. S3). The number of sequences annotated as methane-monooxygenase-related functional proteins per 10 000 sequences was only detectable when considering all the sequences (i.e., bacterial and fungal sequences). The number of sequences annotated as methane-monooxygenase-related functional proteins did not vary between air sites (P> 0.05), while we observed a high variability between sampling periods within sites, but on average it was not different from the ecosystems (P> 0.05).
Different stress response functions (sporulation, UV response, oxidative stress cell response, desiccation response, chromosome plasmid partitioning protein ParA and lipoate synthase) were examined. The concentration of sequences annotated as sporulation-related functional proteins per 10 000 annotated sequences largely varied between air sites (), with the lowest values observed for Station Nord (7 ± 9), San Diego (9 ± 6), Namco (17 ± 15) and Chacaltaya (26 ± 13) and the highest values observed for Storm Peak (120 ± 18), Beijing (126 ± 22), Grenoble (131 ± 21) and New York (141 ± 98; Fig. 4). It was on average higher in air compared to soil (P < 10−5), sediments (P < 10−5) and surface seawater (), although the Celtic seawater sample presented a very high concentration (127). Snow showed a relatively high average concentration (i.e., 36) which was not different from air concentration (P > 0.05). For the ecosystems including one value (i.e., one sample, so not integrated in the Kruskal–Wallis tests), feces showed a relatively high concentration of sequences annotated as sporulation-related functional proteins (i.e., 41), while the hydrothermal vent, phyllosphere and river water showed relatively low concentrations compared to air (< 10). When considering the fungal sequences separately from the bacterial sequences, the same trend was observed; i.e., the concentration of sequences annotated as sporulation-related functional proteins in air was on average higher compared to soil (P < 10−5), sediments (P < 10−5) and surface seawater () as well as the phyllosphere, hydrothermal vent and river water. The concentration was relatively high in the Celtic seawater (186) and the snow samples (163 ± 47). We also observed a large variability within air sites (). When considering the bacterial sequences only, this concentration in air was on average higher compared to soil (P=0.02), sediments () and snow (P=0.01) and showed a smaller variability between air sites. Two samples, the phyllosphere (i.e., 35) and the shrubland soil from Sudan (i.e., 32), showed high numbers of sequences annotated as sporulation-related functional proteins per 10 000 annotated sequences (Fig. 4).

Figure 4Proportion of sequences annotated as sporulation-related functional proteins in the metagenomes. Average number of sequences annotated as proteins implicated in sporulation per 10 000 annotated sequences from (a) all sequences, (b) fungal sequences and (c) bacterial sequences per site. Colors indicate the ecosystems to which the sites belong. For the sites including several metagenomes, the standard deviation was added.
The concentration of sequences annotated as UV-response-related functional proteins per 10 000 annotated sequences varied between air sites (), with values ranging from 16 ± 2 in Namco and 19 ± 4 in STN to 29 ± 3 in Storm Peak and 36 ± 6 in Amsterdam Island (Fig. S4). The concentration was on average higher in air compared to sediments (P < 10−5) and soil (P < 10−5) and comparable to snow and surface seawater (P> 0.05). The other ecosystems showed lower ratios (feces and phyllosphere) or comparable concentrations (hydrothermal vent and river water) compared to air. Within the soil samples, the French agricultural soil samples showed a high average concentration (56 ± 8), which increased the average ratio observed in soil samples. When considering fungal sequences separately, the concentration of sequences annotated as UV-response-related functional proteins was higher in air compared to soil () and comparable to the other ecosystems (P> 0.05). When considering the bacterial sequences only, this concentration in air was on average higher compared to seawater () and sediments ().
The concentration of sequences annotated as oxidative-stress-cell-response-related functional proteins per 10 000 annotated sequences varied largely between air sites (), with the lowest values observed for Station Nord (23 ± 5), San Diego (11 ± 3) and Namco (28 ± 10) and the highest values observed for Storm Peak (105 ± 16), Amsterdam Island (108 ± 16) and Grenoble (119 ± 19; Fig. 5). The concentration was on average higher in air compared to soil (P < 10−5), sediments (P < 10−5) and surface seawater (). Snow showed a relatively high average value (46 ± 11), not different from air (P> 0.05). The other ecosystems (feces, river water, hydrothermal vent and phyllosphere) showed lower ratios compared to air. When considering fungal sequences separately, the concentration of sequences annotated as oxidative-stress-related functional proteins per 10 000 sequences was on average higher in air compared to soil (P < 10−5), sediments (P < 10−5) and surface seawater (). Feces showed a very high average value (2237). When considering bacterial sequences separately, this concentration was not different between air and the other ecosystems (P> 0.05). When considering both fungal and bacterial sequences separately, the variability in the concentration of sequences annotated as oxidative-stress-cell-response-related functional proteins between air sites diminished, and their difference was not detected anymore (P> 0.05).
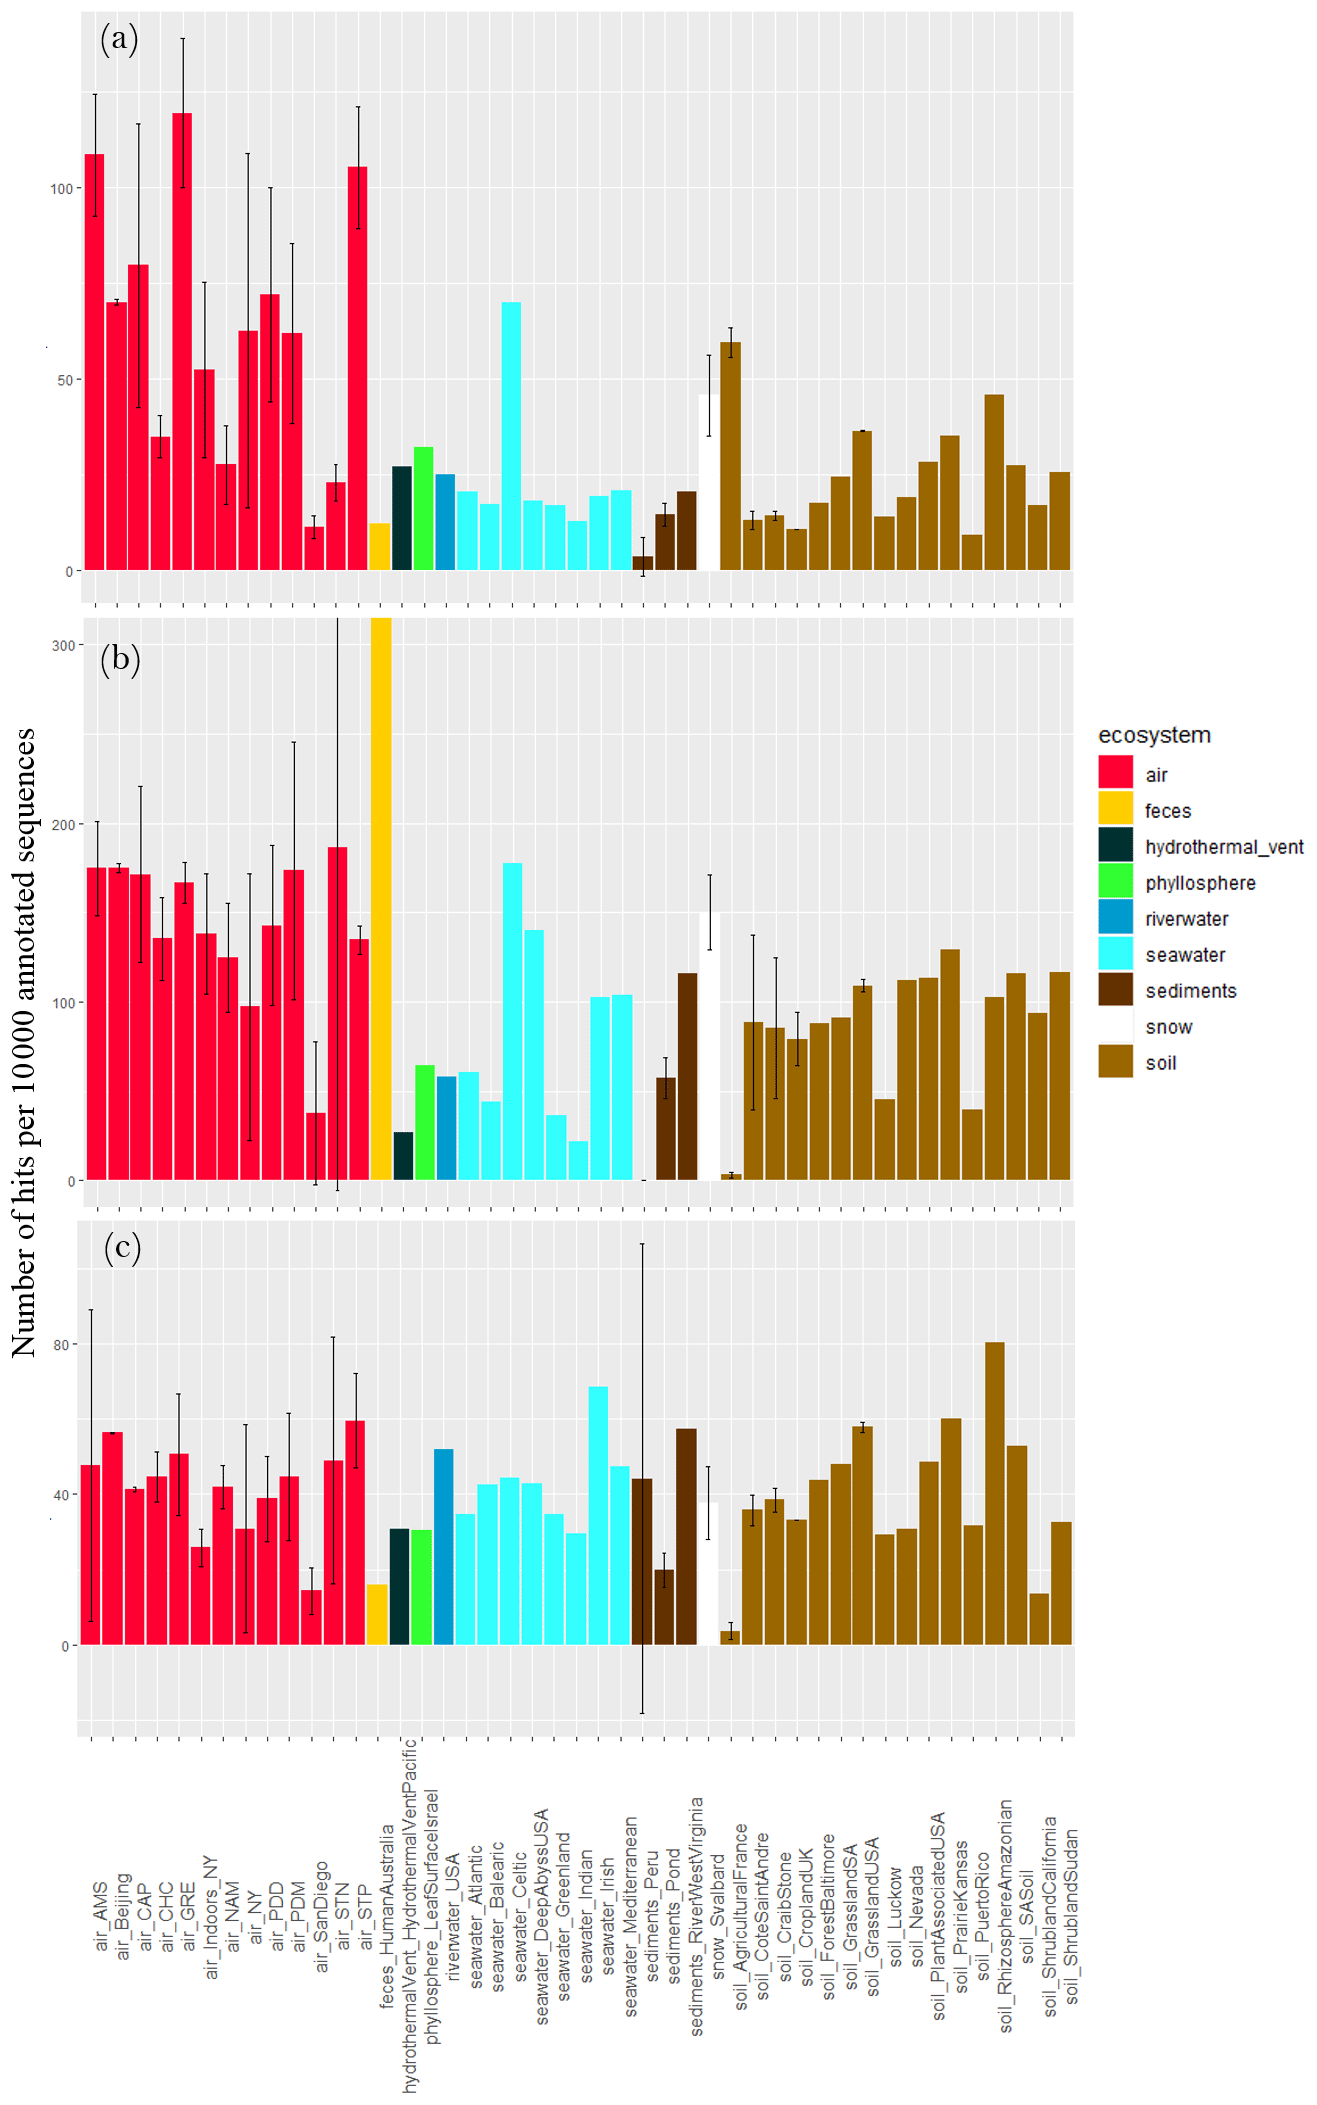
Figure 5Proportion of sequences as oxidative-stress-cell-response-related functional proteins in the metagenomes. Average number of sequences annotated as proteins implicated in oxidative stress cell response per 10 000 annotated sequences from (a) all sequences, (b) fungal sequences and (c) bacterial sequences per site. Colors indicate the ecosystems in which the sites belong to. For the sites including several metagenomes, the standard deviation was added.
The concentration of sequences annotated as desiccation-response-related functional proteins per 10 000 sequences varied between air sites (), with the highest values in Grenoble (4 ± 1), Storm Peak (4 ± 1) and Amsterdam Island (3 ± 3) and the lowest values in Station Nord (0.5 ± 1) and San Diego (0.1 ± 0.1; Fig. S4). It was on average higher in air compared to the other ecosystems (). Still Svalbard snow and French agricultural soil showed high values (2 ± 1 and 3 ± 1, respectively; Fig. S4). When considering fungal sequences only, the concentration in air was higher compared to soil (P> 10−5), sediments (P> 10−5) and surface seawater (). No difference between the ecosystems was observed when considering bacterial sequences separately (P=0.62).
Two proteins (lipoate synthase and chromosome plasmid partitioning protein ParA) related to stress response showed high relative concentrations in bacterial sequences of a few air samples compared to the other ecosystems (Fig. S3), although the number of sequences related to these proteins was on average not higher in the atmosphere than other ecosystems (P> 0.05).
Metagenomic investigations of different ecosystems revealed a specific functional potential signature of their associated microbial communities (Delmont et al., 2011; Tringe et al., 2005). These specific signatures are thought to result from microbial adaptation and/or physical selection to the environmental abiotic conditions (Hindré et al., 2012; Li et al., 2019; Rey et al., 2016) and are a reflection of the high relative abundances of genes coding for specific functions essential for microorganisms to survive and develop in these environments. For example, microbial metagenomes of human feces were characterized by high relative abundances of sequences annotated as beta-glucosidases that are associated with high intestinal concentrations of complex glycosides, and microbial metagenomes of oceans were enriched in sequences annotated as enzymes catalyzing DMSP (dimethylsulfoniopropionate), i.e., an organosulfur compound produced by phytoplankton (Delmont et al., 2011). Our results showed a clear separation between surface seawater, river water, human feces and almost all the soil samples (which grouped with the sediment and snow samples at the scale used here) on the PCo analysis based on the microbial functional potential (Fig. 3). For air microbiomes, the PCo analyses showed that the individual air samples did not group for each site and that they did not form a cluster separated from the other ecosystems based on the overall microbial functional potential averaged per site (Fig. 3). Air samples seemed to group with their underlying ecosystems (Fig. S1). While terrestrial air samples (GRE, NAM, CHC, STP, PDD and PDM) grouped with snow, soil and sediment samples, the marine (Amsterdam Island), coastal (Cape Point) and Arctic (Station Nord) air samples were closer to surface seawater and river water samples. Airborne microbial functional potential (and especially metabolic functional potential as SEED functional classes included mainly metabolic functions and few stress-response-related functions) might be dependent on the ecosystems from which microorganisms are aerosolized. Moreover, it seems that bacterial sequences are mainly responsible for the distribution of the samples on the PCo analysis (as observed when comparing the PCoA to that carried out with the fungal sequences only), although they were in smaller numbers compared to fungal sequences for many of the air samples (i.e., STP, GRE, AMS, PDD, CAP, Beijing etc.). The low statistical weight of fungal sequences relative to the overall sequences might be related to their low richness in terms of functional genes that might have resulted in the spreading of the samples on the PCoA based on the fungal sequences (Table S3).
Metagenomes extracted from atmospheric samples taken around the planet were characterized by a relatively high percentage of fungal sequences as compared to other ecosystems, even though bacterial sequences still dominated. This percentage varied across the different sites with a higher percentage at terrestrial sites whose surrounding landscapes were vegetated like Grenoble (GRE), Puy de Dôme (PDD) and Pic du Midi (PDM) (surrounding landscapes in Fig. S1). This percentage was also relatively high at the marine site Amsterdam Island (AMS), where fungi might come from the ocean and/or the vegetated surfaces of the small island. A high percentage of fungal sequences was also reported for air samples from Beijing, New York and San Diego and validates our DNA extraction method setup specifically for quartz fiber filters (Dommergue et al., 2019). Similarly, the sequencing technology (Illumina MiSeq) could not have been responsible for the larger percentage of fungal sequences observed in our datasets, as the Beijing, New York and San Diego air sample datasets originated from Illumina HiSeq and 454 sequencing technology, respectively. qPCR results on the 16S rRNA gene (bacterial-cell concentration estimation) and on the 18S rRNA gene (fungal-cell concentration estimation) on our air samples in comparison to agricultural soil samples evidenced that the ratio between fungal and bacterial cell number might be much higher (from 4.5 to 160 times higher for the most vegetated site, Grenoble) in air than in soil (Table S4; see Tignat-Perrier et al., 2020, for more qPCR data on air samples). The ratio between fungal and bacterial cell number might be higher in the planetary boundary layer (PBL) than in other environments like soil (Malik et al., 2016) and thus would explain the relatively higher percentage of fungal sequences observed in air metagenomes. High-throughput sequencing allows for the sequencing of a small part of the metagenomic DNA (with large fungal genomes likely to be sequenced first) and might explain why the values of the ratio between 16S and 18S rRNA gene copy numbers obtained by qPCR do not match exactly those obtained by the metagenomic sequencing approach, while they show the same trend. Our study is one of the very few metagenomic investigations of the air environment existing so far. Further studies are needed to confirm our results based on a limited number of sequences per sample.
Fungi in the atmosphere are expected to be found mostly as fungal spores. While some spore and hyphae concentrations have been measured in air (Després et al., 2012), the relative concentration of fungal spores and fungal hyphae fragments and their temporal dynamics at the same site remain unknown. Our results showed that the number of sporulation-related functions was higher in air than the other ecosystems (with the exception of snow and phyllosphere). While fungal hyphae are not expected to be particularly resistant to extreme conditions such as UV radiation, fungal spores are specifically produced to resist and survive overall adverse atmospheric conditions (Huang and Hull, 2017). Their thick membrane and dehydrated nature make them particularly resistant to abiotic atmospheric conditions such as UV radiation, oxidative stress, desiccation and osmotic stress. Figure 6 presents a conceptual model that could explain the higher ratio between fungi and bacteria observed in air. During aerosolization and aerial transport, bacteria and fungi might be under stress and might undergo a physical selection with the survival of the most resistant cells to the adverse atmospheric conditions (i.e., UV radiation, desiccation etc.) and the death of non-resistant cells. As fungi (and especially fungal spores) might be naturally more resistant and adapted to atmospheric conditions than bacteria, we expect a larger decline of bacterial cells compared to fungal cells and spores in air. This might have as a consequence an increase in the ratio between fungi and bacteria compared to their non-atmospheric origins (i.e., the surrounding ecosystems; Fig. 6).
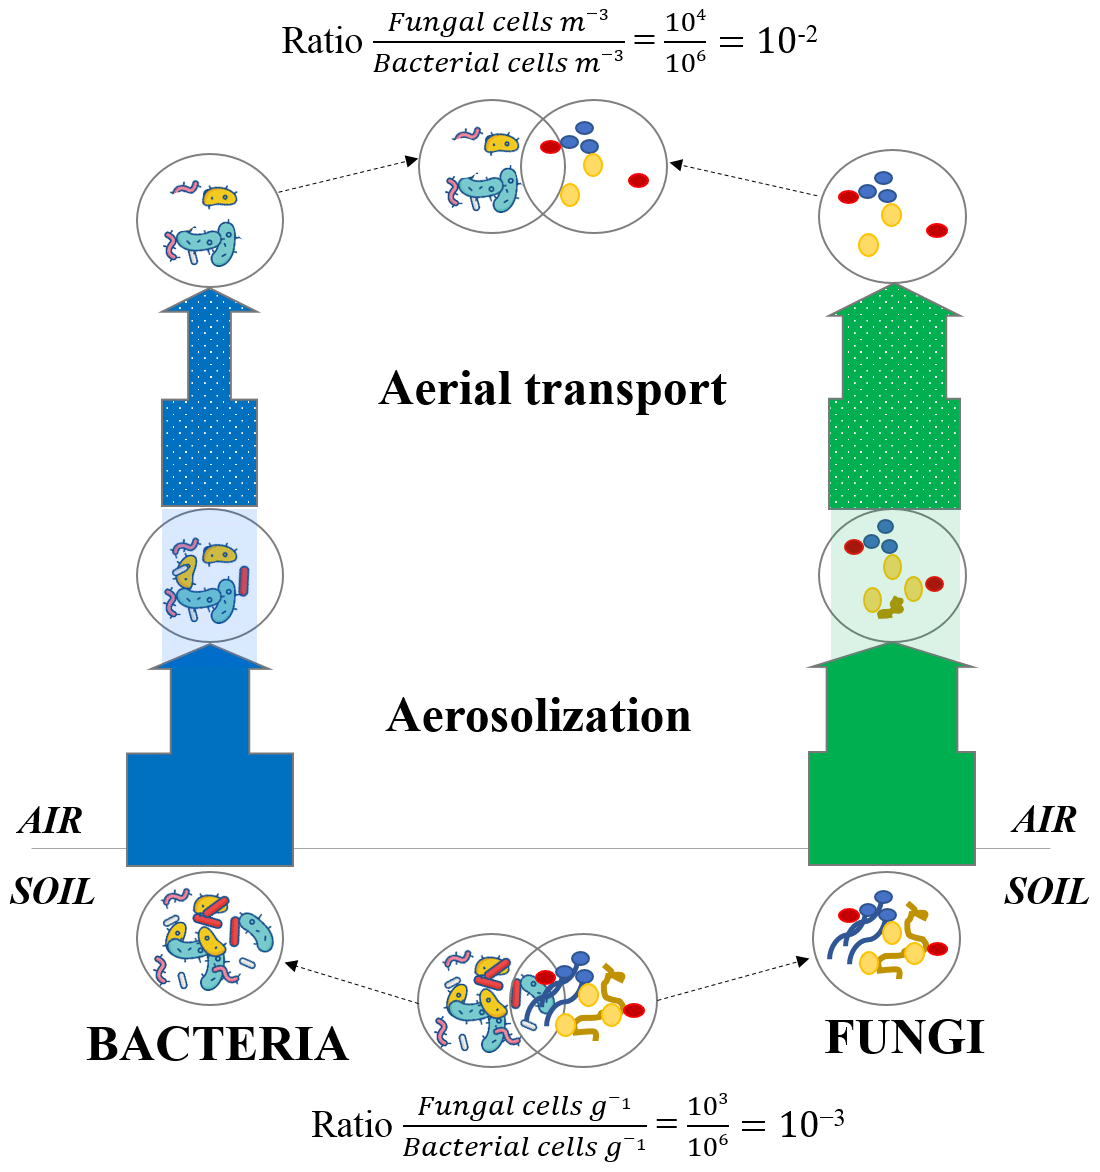
Figure 6Microbial cell loss due to atmospheric physical stress. Conceptual model of the microbial cell loss occurring during the aerosolization and aerial transport steps due to physical selection. The thickness of the arrows represents the impact of the physical selection on both bacterial and fungal cell loss (the more microbial cells survive the physical selection, the thicker the arrow becomes). Approximate ratios are indicative and result from 16S rRNA and 18S rRNA gene qPCR data on La Côte-Saint-André soil samples (crop soil, France) and Puy de Dôme air samples (France; Puy de Dôme landscape is mainly composed of croplands as shown in Fig. S1).
The high variability between the air sites and between air samples of the same site could be explained by the variability in the inputs from the different surrounding landscapes. Our previous paper showed that local inputs were the main sources of microorganisms in the planetary boundary layer and that local meteorology (especially the wind direction) had a major impact on the temporal variability of airborne microbial communities by affecting which of the different local sources were upwind (Tignat-Perrier et al., 2019). Our results did not show a specific (metabolic) functional potential signature for the atmosphere, which was rather mainly driven by the surrounding landscapes. Our results are consistent with both a pre-metabolic adaptation of airborne microorganisms to the chemicals of the sources (i.e., surrounding landscapes) and a potential metabolic adaptation to these chemicals in the atmosphere.
Atmospheric chemistry is dependent on the underlying ecosystem chemistry, since the main sources of atmospheric chemicals are Earth surface emissions. Yet, the oxidizing conditions of the atmosphere might lead to rapid transformations of atmospheric chemicals by photochemical reactions. These specific atmospheric chemical reactions (i.e., photochemical) produce species which, with the gases like CH4, characterize the atmosphere (O3, H2O2, OH etc.). Although some microbial strains of cloud water origin have been shown to metabolize and grow on culture medium in the presence of H2O2 (Vaïtilingom et al., 2013), radical species and their precursors are reactive compounds and might not easily serve as energy and carbon sources for microorganisms (Imlay, 2013). Our results on specific metabolic-related functions showed that functions related to methane monooxygenase activity (CH4 degradation) and hydrogen peroxide catabolism (H2O2 degradation) were present in air but not in higher proportion than in other ecosystems (Fig. S3). Reactive compounds can cause oxidative stress to airborne microorganisms. In association with adverse physical conditions like UV radiation and desiccation, oxidative compounds might create more of a physical stress than provide a new metabolic source for airborne microorganisms. Laboratory investigations of cultivable microorganisms of an airborne origin showed the presence of particularly resistant strains under stressful conditions similar to the atmospheric ones (i.e., similar UV radiation levels and different oxidative conditions; Joly et al., 2015; Yang et al., 2008). However, no study has shown whether these apparently adapted cells represented the majority of airborne microorganisms. Since the overall SEED functional classes included mainly metabolic functions, specific stress-related functions using GO (Gene Ontology) terms were also evaluated. We observed that on average, air showed more stress-related functions (UV response, desiccation and oxidative-stress-response-related functions) than the other ecosystems due to the higher concentration of fungi (relative to bacteria) in air. Thus, when the annotated sequences were separated between sequences belonging to fungal and bacterial genomes, the bacterial and fungal sequences from air samples did not show a significantly higher concentration of stress-related functions compared to the samples coming from other ecosystems (Figs. 4, 5 and S4).
Fungal genomes are expected to carry genes associated with global stress-related functions (i.e., UV radiation, desiccation and oxidative stress) because of the innate resistance of fungi especially fungal spores. These genes associated with global stress-related functions are likely acquired during sporulation formation and certainly do not result from adaptation of fungi in air. When studying genes coding more specific proteins that are not associated with spore resistance, such as lipoate synthase and chromosome plasmid partitioning protein ParA, which might play a role in oxidative stress (Allary et al., 2007; Bunik, 2003) and are more generally found in stress resistance and adaptability of microorganisms (Shoeb et al., 2012; Zhang et al., 2018), they were occasionally found in relatively high concentrations in air samples (Fig. S3). The detection of metagenomic sequences annotated as genes coding specific proteins in air samples remains difficult because of the low microbial biomass recovered. That is why we examined the presence and concentration of global functions (i.e., UV-protection-related functions, oxidative-stress-response-related functions etc.) rather than specific functional genes.
The constant and large input of microbial cells to the planetary boundary layer and their relatively short residence time (a few hours to a few days based on a model assuming that microbial cells behave like non-biological aerosols; Jaenicke, 1980) might have hindered the observation of the potential adaptation (physical selection and/or microbial adaptation) of airborne microorganisms to the stressful atmospheric conditions and to the atmospheric chemicals as discussed above. This issue might be addressed by investigating microbial functional potential in the free troposphere (preferentially high enough above the ground so as not to be influenced by the surface) where the microbial fluxes are smaller than in the planetary boundary layer and where microbial airborne residence time might last much longer than in the planetary boundary layer. This troposphere approach might help in determining the role of stress in the atmosphere and validate our conceptual model on the physical stress of microbial cells taking place during aerosolization and aerial transport selecting the resistant cells (Fig. 6). Another explanation might be due to the metagenomic approach that allows for sampling both living and dead cells. Aerosolization has been shown to be particularly stressful and even lethal for microorganisms (Alsved et al., 2018; Thomas et al., 2011). The functional potential from the dead cells in air might have a greater weight on the overall functional potential observed and lead to the dilution of the functional potential of the actual living cells that have adapted to atmospheric conditions. This might apply for both the overall functional potential discussed previously and the stress-related functions.
We conducted the first global comparative metagenomic analysis to characterize the microbial functional potential signature in the planetary boundary layer. Air samples showed no specific signature of microbial functional potential which was mainly correlated to the surrounding landscapes. However, air samples were characterized by a relatively high percentage of fungal sequences compared to the source ecosystems (soil, surface seawater etc.). The relatively higher concentrations of fungi in air drove the higher proportions of stress-related functions observed in air metagenomes. Fungal cells and specifically fungal spores are innately resistant entities well adapted to atmospheric conditions and which might survive better aerosolization and aerial transport than bacterial cells. Stress-related functions were present in airborne bacteria but rarely in higher concentrations compared to the bacterial communities in other ecosystems. However, the constant flux of microbial cells to the planetary boundary layer might have complicated the determination of a physical selection and/or microbial adaptation of airborne microorganisms, especially bacterial communities. Meta-omics investigations on air with a deeper sequencing are needed to confirm our results and explore the functionality of atmospheric microorganisms further.
Sequences reported in this paper have been deposited in ftp://ftp-adn.ec-lyon.fr/Tignat-Perrier_2020_air_metagen_INHALE/, last access: 30 November 2020. A file has been attached explaining the correspondence between filenames and samples.
The supplement related to this article is available online at: https://doi.org/10.5194/bg-17-6081-2020-supplement.
AD, CL and TMV designed the experiment. RTP, AD, AT and OM conducted the sampling field campaign. RTP did the molecular biology, bioinformatics and statistical analyses. RTP, AD, CL and TMV analyzed the results. RTP, TM, AD and CL wrote the paper. All authors reviewed the paper.
The authors declare that they have no conflict of interest.
The chemical analyses were performed on the IGE AirOSol platform. This work was hosted by the following stations: Chacaltaya, Namco, Puy de Dôme, Cape Point, Pic du Midi, Amsterdam Island, Storm Peak and Villum Research Station. We thank I. Jouvie, G. Hallar, I. McCubbin, B. Jensen, A. Nicosia, M. Ribeiro, L. Besaury, L. Bouvier, M. Joly, I. Moreno, M. Rocca and F. Velarde for sampling and station management. We thank our project partners: K. Sellegri, P. Amato, M. Andrade, Q. Zhang, C. Labuschagne, L. Martin and J. Sonke. We thank R. Edwards, J. Schauer and C. Worley for lending their high-volume sampler. We thank L. Pouilloux for computing assistance and maintenance of the Newton server.
This work was supported by the Agence Nationale de la Recherche (grant no. ANR-15-CE01-0002–03 INHALE), Région Auvergne-Rhône-Alpes (grant no. ARC3 2016), Campus France (grant for program XU GUANGQI) and the French Polar Institute (IPEV; program no. 1028; grant no. 399).
This paper was edited by Denise Akob and reviewed by two anonymous referees.
Aalismail, N. A., Ngugi, D. K., Díaz-Rúa, R., Alam, I., Cusack, M., and Duarte, C. M.: Functional metagenomic analysis of dust-associated microbiomes above the Red Sea, Sci. Rep.-UK, 9, 1–12, https://doi.org/10.1038/s41598-019-50194-0, 2019.
Allary, M., Lu, J. Z., Zhu, L., and Prigge, S. T.: Scavenging of the cofactor lipoate is essential for the survival of the malaria parasite Plasmodium falciparum, Mol. Microbiol., 63, 1331–1344, https://doi.org/10.1111/j.1365-2958.2007.05592.x, 2007.
Alsved, M., Holm, S., Christiansen, S., Smidt, M., Ling, M., Boesen, T., Finster, K., Bilde, M., Löndahl, J., and Šantl-Temkiv, T.: Effect of Aerosolization and Drying on the Viability of Pseudomonas syringae Cells, Front. Microbiol., 9, 3086, https://doi.org/10.3389/fmicb.2018.03086, 2018.
Amato, P., Demeer, F., Melaouhi, A., Fontanella, S., Martin-Biesse, A.-S., Sancelme, M., Laj, P., and Delort, A.-M.: A fate for organic acids, formaldehyde and methanol in cloud water: their biotransformation by micro-organisms, Atmos. Chem. Phys., 7, 4159–4169, https://doi.org/10.5194/acp-7-4159-2007, 2007.
Amato, P., Besaury, L., Joly, M., Penaud, B., Deguillaume, L., and Delort, A.-M.: Metatranscriptomic exploration of microbial functioning in clouds, Sci. Rep.-UK, 9, 1–12, https://doi.org/10.1038/s41598-019-41032-4, 2019.
Ariya, P. A., Nepotchatykh, O., Ignatova, O., and Amyot, M.: Microbiological degradation of atmospheric organic compounds, Geophys. Res. Lett., 29, 2077, https://doi.org/10.1029/2002GL015637, 2002.
Ariya, P. A., Sun, J., Eltouny, N., Hudson, E., Hayes, C., and Kos, G.: Physical and chemical characterization of bioaerosols – Implications for nucleation processes, Int. Rev. Phys. Chem., 28, 1–32, https://doi.org/10.1080/01442350802597438, 2009.
Aylor, D. E.: Spread of Plant Disease on a Continental Scale: Role of Aerial Dispersal of Pathogens, Ecology, 84, 1989–1997, 2003.
Brown, J. K. M. and Hovmøller, M. S.: Aerial dispersal of pathogens on the global and continental scales and its impact on plant disease, Science, 297, 537–541, https://doi.org/10.1126/science.1072678, 2002.
Brune, A., Frenzel, P., and Cypionka, H.: Life at the oxic-anoxic interface: microbial activities and adaptations, FEMS Microbiol. Rev., 24, 691–710, https://doi.org/10.1111/j.1574-6976.2000.tb00567.x, 2000.
Buchfink, B., Xie, C., and Huson, D. H.: Fast and sensitive protein alignment using DIAMOND, Nat. Methods, 12, 59–60, https://doi.org/10.1038/nmeth.3176, 2015.
Bunik, V. I.: 2-Oxo acid dehydrogenase complexes in redox regulation, Eur. J. Biochem., 270, 1036–1042, https://doi.org/10.1046/j.1432-1033.2003.03470.x, 2003.
Cao, C., Jiang, W., Wang, B., Fang, J., Lang, J., Tian, G., Jiang, J., and Zhu, T. F.: Inhalable Microorganisms in Beijing's PM2.5 and PM10 Pollutants during a Severe Smog Event, Environ. Sci. Technol., 48, 1499–1507, https://doi.org/10.1021/es4048472, 2014.
Delmont, T. O., Malandain, C., Prestat, E., Larose, C., Monier, J.-M., Simonet, P., and Vogel, T. M.: Metagenomic mining for microbiologists, ISME J., 5, 1837–1843, https://doi.org/10.1038/ismej.2011.61, 2011.
Delort, A.-M., Vaïtilingom, M., Amato, P., Sancelme, M., Parazols, M., Mailhot, G., Laj, P., and Deguillaume, L.: A short overview of the microbial population in clouds: Potential roles in atmospheric chemistry and nucleation processes, Atmos. Res., 98, 249–260, https://doi.org/10.1016/j.atmosres.2010.07.004, 2010.
Després, V., Huffman, J. A., Burrows, S. M., Hoose, C., Safatov, A., Buryak, G., Fröhlich-Nowoisky, J., Elbert, W., Andreae, M., Pöschl, U., and Jaenicke, R.: Primary biological aerosol particles in the atmosphere: a review, Tellus B, 64, 15598, https://doi.org/10.3402/tellusb.v64i0.15598, 2012.
Dommergue, A., Amato, P., Tignat-Perrier, R., Magand, O., Thollot, A., Joly, M., Bouvier, L., Sellegri, K., Vogel, T., Sonke, J. E., Jaffrezo, J.-L., Andrade, M., Moreno, I., Labuschagne, C., Martin, L., Zhang, Q., and Larose, C.: Methods to investigate the global atmospheric microbiome, Front. Microbiol., 10, 243, https://doi.org/10.3389/fmicb.2019.00243, 2019.
Donovan, P. D., Gonzalez, G., Higgins, D. G., Butler, G., and Ito, K.: Identification of fungi in shotgun metagenomics datasets, PLOS ONE, 13, e0192898, https://doi.org/10.1371/journal.pone.0192898, 2018.
Els, N., Larose, C., Baumann-Stanzer, K., Tignat-Perrier, R., Keuschnig, C., Vogel, T. M., and Sattler, B.: Microbial composition in seasonal time series of free tropospheric air and precipitation reveals community separation, Aerobiologia, 35, 671–701, https://doi.org/10.1007/s10453-019-09606-x, 2019.
Friedl, M. A., McIver, D. K., Hodges, J. C. F., Zhang, X. Y., Muchoney, D., Strahler, A. H., Woodcock, C. E., Gopal, S., Schneider, A., Cooper, A., Baccini, A., Gao, F., and Schaaf, C.: Global land cover mapping from MODIS: algorithms and early results, Remote Sens. Environ., 83, 287–302, https://doi.org/10.1016/S0034-4257(02)00078-0, 2002.
Griffin, D. W.: Atmospheric Movement of Microorganisms in Clouds of Desert Dust and Implications for Human Health, Clin. Microbiol. Rev., 20, 459–477, https://doi.org/10.1128/CMR.00039-06, 2007.
Gusareva, E. S., Acerbi, E., Lau, K. J. X., Luhung, I., Premkrishnan, B. N. V., Kolundžija, S., Purbojati, R. W., Wong, A., Houghton, J. N. I., Miller, D., Gaultier, N. E., Heinle, C. E., Clare, M. E., Vettath, V. K., Kee, C., Lim, S. B. Y., Chénard, C., Phung, W. J., Kushwaha, K. K., Nee, A. P., Putra, A., Panicker, D., Yanqing, K., Hwee, Y. Z., Lohar, S. R., Kuwata, M., Kim, H. L., Yang, L., Uchida, A., Drautz-Moses, D. I., Junqueira, A. C. M., and Schuster, S. C.: Microbial communities in the tropical air ecosystem follow a precise diel cycle, P. Natl. Acad. Sci. USA, 116, 23299–23308, https://doi.org/10.1073/pnas.1908493116, 2019.
Hadley, W. and Winston, C.: Create Elegant Data Visualisations Using the Grammar of Graphics, available at: https://cran.r-project.org/web/packages/ggplot2/ggplot2.pdf (last access: April 2020), 2019.
Hill, K. A., Shepson, P. B., Galbavy, E. S., Anastasio, C., Kourtev, P. S., Konopka, A., and Stirm, B. H.: Processing of atmospheric nitrogen by clouds above a forest environment, J. Geophys. Res.-Atmos., 112, D11301, https://doi.org/10.1029/2006JD008002, 2007.
Hindré, T., Knibbe, C., Beslon, G., and Schneider, D.: New insights into bacterial adaptation through in vivo and in silico experimental evolution, Nat. Rev. Microbiol., 10, 352–365, https://doi.org/10.1038/nrmicro2750, 2012.
Huang, M. and Hull, C. M.: Sporulation: How to survive on planet Earth (and beyond), Curr. Genet., 63, 831–838, https://doi.org/10.1007/s00294-017-0694-7, 2017.
Huerta-Cepas, J., Forslund, K., Coelho, L. P., Szklarczyk, D., Jensen, L. J., von Mering, C., and Bork, P.: Fast Genome-Wide Functional Annotation through Orthology Assignment by eggNOG-Mapper, Mol. Biol. Evol., 34, 2115–2122, https://doi.org/10.1093/molbev/msx148, 2017.
Huson, D. H., Beier, S., Flade, I., Górska, A., El-Hadidi, M., Mitra, S., Ruscheweyh, H.-J., and Tappu, R.: MEGAN Community Edition – Interactive Exploration and Analysis of Large-Scale Microbiome Sequencing Data, PLoS Comput. Biol., 12, e1004957, https://doi.org/10.1371/journal.pcbi.1004957, 2016.
Imlay, J. A.: The molecular mechanisms and physiological consequences of oxidative stress: lessons from a model bacterium, Nat. Rev. Microbiol., 11, 443–454, https://doi.org/10.1038/nrmicro3032, 2013.
Innocente, E., Squizzato, S., Visin, F., Facca, C., Rampazzo, G., Bertolini, V., Gandolfi, I., Franzetti, A., Ambrosini, R., and Bestetti, G.: Influence of seasonality, air mass origin and particulate matter chemical composition on airborne bacterial community structure in the Po Valley, Italy, Sci. Total Environ., 593/594, 677–687, https://doi.org/10.1016/j.scitotenv.2017.03.199, 2017.
Jaenicke, R.: Atmospheric aerosols and global climate, J. Aerosol Sci., 11, 577–588, https://doi.org/10.1016/0021-8502(80)90131-7, 1980.
Joly, M., Amato, P., Sancelme, M., Vinatier, V., Abrantes, M., Deguillaume, L., and Delort, A.-M.: Survival of microbial isolates from clouds toward simulated atmospheric stress factors, Atmos. Environ., 117, 92–98, https://doi.org/10.1016/j.atmosenv.2015.07.009, 2015.
Keegan, K. P., Glass, E. M., Meyer, F.: MG-RAST, a Metagenomics Service for Analysis of Microbial Community Structure and Function, edited by: Martin, F. and Uroz, S., Microbial Environmental Genomics (MEG), Methods in Molecular Biology, Humana Press, New York, 1399, 207–233, https://doi.org/10.1007/978-1-4939-3369-3_13, 2016.
Leinonen, R., Sugawara, H., and Shumway, M.: The Sequence Read Archive, Nucleic Acids Res., 39, D19–D21, https://doi.org/10.1093/nar/gkq1019, 2011.
Li, Y., Zheng, L., Zhang, Y., Liu, H., and Jing, H.: Comparative metagenomics study reveals pollution induced changes of microbial genes in mangrove sediments, Sci. Rep., 9, 5739, https://doi.org/10.1038/s41598-019-42260-4, 2019.
Malik, A. A., Chowdhury, S., Schlager, V., Oliver, A., Puissant, J., Vazquez, P. G. M., Jehmlich, N., von Bergen, M., Griffiths, R. I., and Gleixner, G.: Soil Fungal:Bacterial Ratios Are Linked to Altered Carbon Cycling, Front. Microbiol., 7, 1247, https://doi.org/10.3389/fmicb.2016.01247, 2016.
NCBI Resource Coordinators: Database resources of the National Center for Biotechnology Information, Nucleic Acids Res., 46, D8–D13, https://doi.org/10.1093/nar/gkx1095, 2018.
Oksanen, J., Guillaume Blanchet, F., Friendly, M., Kindt, R., Legendre, P., McGlinn, D., Minchin, P. R., O'Hara, R. B., Simpson, G. L., Solymos, P., Stevens, M. H. H., Szoecs, E., and Wagner, H.: Community Ecology Package, available at: https://github.com/vegandevs/vegan (last access: April 2020), 2019.
Rey, O., Danchin, E., Mirouze, M., Loot, C., and Blanchet, S.: Adaptation to Global Change: A Transposable Element – Epigenetics Perspective, Trends Ecol. Evol., 31, 514–526, https://doi.org/10.1016/j.tree.2016.03.013, 2016.
Shannan, S., Collins, K., and Emanuel, W. R.: Global mosaics of the standard MODIS land cover type data, University of Maryland and the Pacific Northwest National Laboratory, College Park, Maryland, USA, 2014.
Shoeb, E., Badar, U., Akhter, J., Shams, H., Sultana, M., and Ansari, M. A.: Horizontal gene transfer of stress resistance genes through plasmid transport, World J. Microbiol. Biotechnol., 28, 1021–1025, https://doi.org/10.1007/s11274-011-0900-6, 2012.
The Gene Ontology Consortium: The Gene Ontology Resource: 20 years and still GOing strong, Nucleic Acids Res., 47, D330–D338, https://doi.org/10.1093/nar/gky1055, 2019.
Thomas, R. J., Webber, D., Hopkins, R., Frost, A., Laws, T., Jayasekera, P. N., and Atkins, T.: The Cell Membrane as a Major Site of Damage during Aerosolization of Escherichia coli, Appl. Environ. Microbiol., 77, 920–925, https://doi.org/10.1128/AEM.01116-10, 2011.
Tignat-Perrier, R., Dommergue, A., Thollot, A., Keuschnig, C., Magand, O., Vogel, T. M., and Larose, C.: Global airborne microbial communities controlled by surrounding landscapes and wind conditions, Sci. Rep.-UK, 9, 1–11, https://doi.org/10.1038/s41598-019-51073-4, 2019.
Tignat-Perrier, R., Dommergue, A., Thollot, A., Magand, O., Amato, P., Joly, M., Sellegri, K., Vogel, T. M., and Larose, C.: Seasonal shift in airborne microbial communities, Sci. Total Environ., 716, 137129, https://doi.org/10.1016/j.scitotenv.2020.137129, 2020.
Tringe, S. G., von Mering, C., Kobayashi, A., Salamov, A. A., Chen, K., Chang, H. W., Podar, M., Short, J. M., Mathur, E. J., Detter, J. C., Bork, P., Hugenholtz, P., and Rubin, E. M.: Comparative metagenomics of microbial communities, Science, 308, 554–557, https://doi.org/10.1126/science.1107851, 2005.
Vaïtilingom, M., Amato, P., Sancelme, M., Laj, P., Leriche, M., and Delort, A.-M.: Contribution of Microbial Activity to Carbon Chemistry in Clouds, Appl. Environ. Microbiol., 76, 23–29, https://doi.org/10.1128/AEM.01127-09, 2010.
Vaïtilingom, M., Deguillaume, L., Vinatier, V., Sancelme, M., Amato, P., Chaumerliac, N., and Delort, A.-M.: Potential impact of microbial activity on the oxidant capacity and organic carbon budget in clouds, P. Natl. Acad. Sci. USA, 110, 559–564, https://doi.org/10.1073/pnas.1205743110, 2013.
Vartoukian, S. R., Palmer, R. M., and Wade, W. G.: Strategies for culture of “unculturable” bacteria, FEMS Microbiol. Lett., 309, 1–7, https://doi.org/10.1111/j.1574-6968.2010.02000.x, 2010.
Wickham, H.: Flexibly Reshape Data: A Reboot of the Reshape Packa, available at: https://cran.r-project.org/web/packages/reshape2/reshape2.pdf, 2017.
Wood, D. E. and Salzberg, S. L.: Kraken: ultrafast metagenomic sequence classification using exact alignments, Genome Biol., 15, R46, https://doi.org/10.1186/gb-2014-15-3-r46, 2014.
Xie, W., Wang, F., Guo, L., Chen, Z., Sievert, S. M., Meng, J., Huang, G., Li, Y., Yan, Q., Wu, S., Wang, X., Chen, S., He, G., Xiao, X., and Xu, A.: Comparative metagenomics of microbial communities inhabiting deep-sea hydrothermal vent chimneys with contrasting chemistries, ISME J., 5, 414–426, https://doi.org/10.1038/ismej.2010.144, 2011.
Yang, Y., Yokobori, S., and Yamagishi, A.: UV-resistant bacteria isolated from upper troposphere and lower stratosphere, Biol. Sci. Space, 22, 18–25, https://doi.org/10.2187/bss.22.18, 2008.
Yooseph, S., Nealson, K. H., Rusch, D. B., McCrow, J. P., Dupont, C. L., Kim, M., Johnson, J., Montgomery, R., Ferriera, S., Beeson, K., Williamson, S. J., Tovchigrechko, A., Allen, A. E., Zeigler, L. A., Sutton, G., Eisenstadt, E., Rogers, Y.-H., Friedman, R., Frazier, M., and Venter, J. C.: Genomic and functional adaptation in surface ocean planktonic prokaryotes, Nature, 468, 60–66, https://doi.org/10.1038/nature09530, 2010.
Yooseph, S., Andrews-Pfannkoch, C., Tenney, A., McQuaid, J., Williamson, S., Thiagarajan, M., Brami, D., Zeigler-Allen, L., Hoffman, J., Goll, J. B., Fadrosh, D., Glass, J., Adams, M. D., Friedman, R., and Venter, J. C.: A Metagenomic Framework for the Study of Airborne Microbial Communities, PLOS ONE, 8, e81862, https://doi.org/10.1371/journal.pone.0081862, 2013.
Zhang, H., Hu, Y., Zhou, C., Yang, Z., Wu, L., Zhu, M., Bao, H., Zhou, Y., Pang, M., Wang, R., and Zhou, X.: Stress resistance, motility and biofilm formation mediated by a 25kb plasmid pLMSZ08 in Listeria monocytogenes, Food Control, 94, 345–352, https://doi.org/10.1016/j.foodcont.2018.07.002, 2018.