the Creative Commons Attribution 4.0 License.
the Creative Commons Attribution 4.0 License.
 | 09 Dec 2020
Seasonality, drivers, and isotopic composition of soil CO2 fluxes from tropical forests of the Congo Basin
Simon Baumgartner
Matti Barthel
Travis William Drake
Marijn Bauters
Isaac Ahanamungu Makelele
John Kalume Mugula
Laura Summerauer
Nora Gallarotti
Landry Cizungu Ntaboba
Kristof Van Oost
Pascal Boeckx
Sebastian Doetterl
Roland Anton Werner
Johan Six
Soil respiration is an important carbon flux and key process determining the net ecosystem production of terrestrial ecosystems. To address the lack of quantification and understanding of seasonality in soil respiration of tropical forests in the Congo Basin, soil CO2 fluxes and potential controlling factors were measured annually in two dominant forest types (lowland and montane) of the Congo Basin over 2 years at varying temporal resolution. Soil CO2 fluxes from the Congo Basin resulted in 3.45 ± 1.14 and 3.13 ± 1.22 µmol CO2 m−2 s−1 for lowland and montane forests, respectively. Soil CO2 fluxes in montane forest soils showed a clear seasonality with decreasing flux rates during the dry season. Montane forest soil CO2 fluxes were positively correlated with soil moisture, while CO2 fluxes in the lowland forest were not. Smaller differences of δ13C values of leaf litter, soil organic carbon (SOC), and soil CO2 indicated that SOC in lowland forests is more decomposed than in montane forests, suggesting that respiration is controlled by C availability rather than environmental factors. In general, C in montane forests was more enriched in 13C throughout the whole cascade of carbon intake via photosynthesis, litterfall, SOC, and soil CO2 compared to lowland forests, pointing to a more open system. Even though soil CO2 fluxes are similarly high in lowland and montane forests of the Congo Basin, the drivers of them seem to be different, i.e., soil moisture for montane forest and C availability for lowland forest.
- Article
(3125 KB) - Full-text XML
-
Supplement
(357 KB) - BibTeX
- EndNote


Soil basal respiration, the sum of carbon dioxide (CO2) produced both autotrophically by roots and heterotrophically by bacterial and fungal respiration, represents the biggest natural transfer of carbon (C) from the terrestrial biosphere to the atmosphere (Raich and Schlesinger, 1992). Globally, soil respiration is the second largest terrestrial C flux after photosynthesis, emitting 120 Pg C yr−1 as CO2 (Friedlingstein et al., 2019). As such, the flux of CO2 from soils represents a significant component of net ecosystem production (NEP). Research into the abiotic and biotic controls of this flux are thus critical for understanding the overall C balance of ecosystems.
There are a number of different parameters that can influence soil CO2 efflux, with soil temperature and soil moisture being the most important drivers (Rustad et al., 2000; Ruehr et al., 2010). Soil temperature affects biological activity, whereas soil moisture affects the diffusion of C substrate, atmospheric oxygen, and respired CO2 through soil pores (Janssens et al., 1998; Doff Sotta et al., 2004; Sousa Neto et al., 2011; Courtois et al., 2018). Furthermore, soil pH (Courtois et al., 2018), through its effects on microbial communities, and root density can also affect soil CO2 production (Janssens et al., 1998). Another particularly important driver is photosynthetic activity, as it describes the rate of carbohydrate supply from leaves to roots, where both root and rhizomicrobial respiration occur (Ekblad and Högberg, 2001). While the magnitude of soil CO2 fluxes can vary significantly between and within different ecosystems, soil CO2 fluxes from tropical forests are generally higher than from any other vegetation type, due to high soil temperature, high soil moisture (Raich et al., 2002), and weak C stabilization (Doetterl et al., 2018). Although tropical forests experience high soil CO2 fluxes and high production, as a whole, the tropical terrestrial biosphere acts as a net C sink by production outbalancing the high soil respiration (Melillo et al., 1993; Pan et al., 2011; Palmer et al., 2019).
Despite the importance of tropical forests for the global C cycle, there is a lack of research into CO2 fluxes from soils in these ecosystems. The Congo Basin in central Africa hosts the second largest tropical forest on Earth, but it has been particularly neglected in biogeochemical research and only one study from 1962 reporting soil CO2 fluxes from these forests is available (Maldague and Hilger, 1962). Hence, while many studies model soil and ecosystem respiration in the Congo, there are almost no empirical data on soil CO2 fluxes to validate the models. Eddy covariance towers are the most common methods to measure CO2 fluxes over different ecosystems and larger areas. However, continuous measurements of soil CO2 fluxes close to the surface are needed to assess temporal trends of processes controlling soil CO2 production (Ogle, 2018). This is particular important in light of recent data that show that the ratio of soil respiration to primary production has increased over time (Bond-Lamperty et al., 2018). In particular, heterotrophic respiration has increased as soil microbes became more active in response to increasing temperatures (Bond-Lamperty et al., 2018). If this process proceeds such that ecosystem respiration exceeds primary production, terrestrial ecosystems could be transformed from sinks to sources of C. Thus, understanding baseline rates of soil respiration and the role of environmental drivers is crucial to assess future responses to climate change. This is especially important in the Congo Basin, as a recent study showed that the length of dry seasons have increased by 6.4–10.4 d per decade since 1988 (Jiang et al., 2019). These changes in precipitation and temperature could trigger an ecosystem response, including shifts in soil respiration. Furthermore, short-term events, such as extreme rain or prolonged dry periods, are predicted to occur more frequently with climate change and will most likely impact soil respiration rates (Hopkins and Del Prado, 2007; Borken and Matzner, 2009).
It is well known that soil respiration and canopy processes are linked in forests (Ekblad and Högberg, 2001). Carbohydrates produced by photosynthesis are subsequently transported to the roots and rhizosphere, where they are respired by root or microbial respiration (Ruehr et al., 2009). Thus, the isotopic signature of soil-derived CO2 is mostly governed by isotope fractionation processes that occur at the leaf scale, since a significant portion of soil-respired CO2 is supplied by recent photoassimilates (Högberg et al., 2001; Brüggemann et al., 2011; Barthel et al., 2011). Generally, all environmental parameters affecting photosynthesis and thus CO2 discrimination are likely to influence the δ13C signal of soil respiration (e.g., precipitation, vapor pressure deficit) (Bowling et al., 2002). Furthermore, the differences of the stable isotope signatures between different C compartments (litter, soil C, soil CO2, stream-dissolved CO2) can give information about the openness of a system. We refer to an “open system” if the system experiences a continuous supply of substrate while products are lost from the system, whereas a “closed system” lacks new inputs of substrate. The fractionation between compartments is higher in a more open system (Fry, 2006).
In light of these issues, the objectives of this study were to (1) provide the first empirical quantification of annual soil CO2 fluxes from forests of the Congo Basin, (2) gauge variability between two dominant forest types within the basin, and (3) assess whether and to what extent soil temperature and moisture influence CO2 fluxes. We hypothesized higher soil CO2 fluxes in the lowland forest due to higher temperature and soil moisture regimes compared to the montane forest. Soil CO2 fluxes were measured weekly to assess the role of seasonality and environmental drivers of soil CO2 fluxes. Additionally, stable C isotopic signatures (δ13C) of leaf-litter, soil organic carbon (SOC), soil-respired CO2, and dissolved stream water CO2 were measured to give us more information about sources and fate of soil-respired CO2.
2.1 Study sites
Old-growth forest sites in the Democratic Republic of Congo (DRC), contrasting in altitude, were selected to conduct long-term static manual chamber CO2 flux measurements. The first site (KB) is situated in the Kahuzi-Biéga National Park (02.215∘ S, 28.759∘ E) northwest of the city of Bukavu in the South Kivu province and represents a montane tropical mixed forest at an altitude of 2120 m a.s.l. with an mean annual temperature of 15 ∘C and an mean annual rainfall of 1500 mm (Bauters et al., 2019). Species composition of this forest is well described in Imani et al. (2016) and the main species are Maesa lanceolata, Lindackeria kivuensis, and Allophylus kiwuensis. Rainfall peaks in both April and October, with a dry season from June to September in between (Alsdorf et al., 2016). The soils in KB are broadly classified as Umbric Ferralsols (Jones et al., 2013) with a sandy loam (upper 15 cm) to silt loam (15–30 cm) texture. The second site (YO) is situated in the Yoko Forest Reserve, south of the city of Kisangani in the Tshopo province (0.294∘ N, 25.302∘ E) with a mean annual temperature of 24.2 ∘C and a mean annual rainfall of 1800 mm (Bauters et al., 2019). The YO site consists of two dominant forest types, a lowland tropical mixed forest and a mono-dominant forest, where more than 60 % of the basal area consists of the species Gilbertiodendron dewevrei. The mixed forest plot is a classic African lowland rainforest with about 70 species per hectare, a canopy height up to 40 m, and a basal area of 34 m2 ha−1 (Doetterl et al., 2015; Kearsley et al., 2017). Like KB, there are two wet seasons, a short one from March to May and a longer one from August to November. The soils in YO are deeply weathered and nutrient-poor Xanthic Ferralsols (Jones et al., 2013) with a loamy sand texture (0–30 cm). Because lowland forests are the main forest type within the Congo Basin, two additional lowland forest sites (Djolu and Yangambi) were selected to conduct short-term campaigns, assessing spatial robustness of the results (Fig. 1). Yangambi is a UNESCO biosphere reserve and lies at the river bank of the Congo river about 100 km west of the city of Kisangani (Fig. 1). Djolu is a territory just north of the Equator roughly 300 km west of the city of Kisangani, in the northeast of Tshuapa province where measurements were conducted in protected forest areas (Fig. 1). In KB, one plot (40 by 40 m) in a mixed forest was installed. In Yoko and Yangambi, two plots for each site were installed: one in a mixed forest and one in a mono-dominant forest. In Djolu, measurements were conducted in one plot in an old-growth mixed forest site.
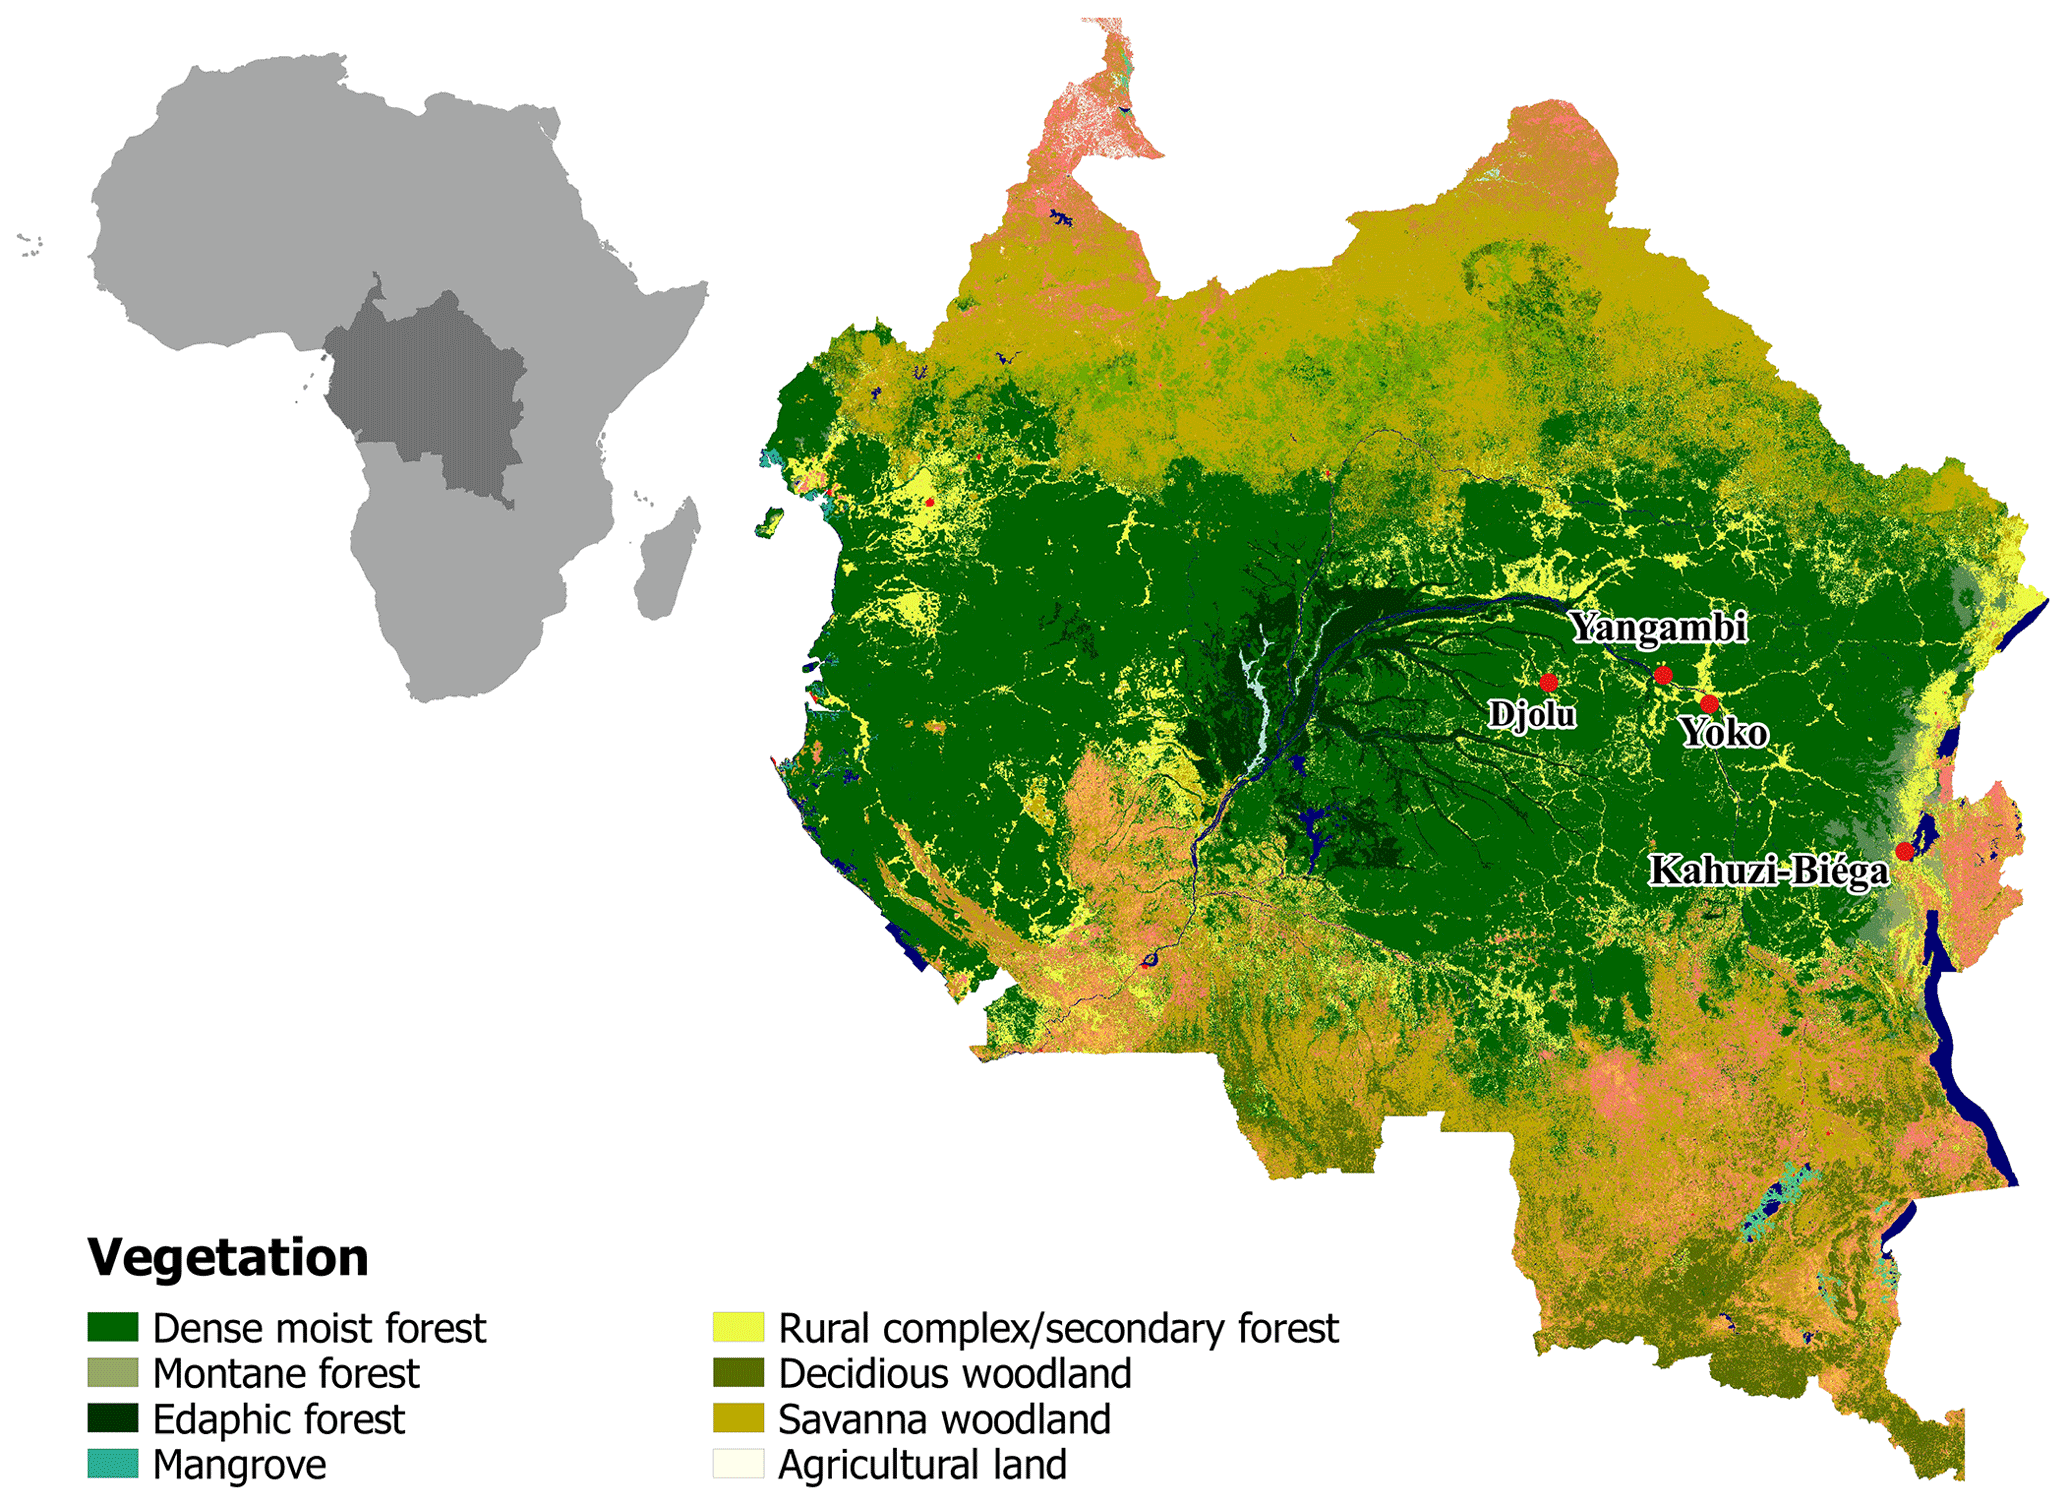
Figure 1Map of part of the Congo Basin with the different vegetation types. Red dots indicate sampling locations. Lowland: Djolu, Yangambi, and Yoko. Montane: Kahuzi-Biéga. Map modified based on Verhegghen et al. (2012).
2.2 Soil CO2 flux measurements
Flux chamber measurements were carried out at different time intervals during 2016–2019. Weekly to fortnightly sampling in YO was conducted from November 2016 to March 2019 and in KB from April 2017 to March 2019. In addition, several 2-week sampling campaigns with daily and subdaily sampling were conducted to rule out diurnal soil respiration cycles (Fig. S3 in the Supplement). These short-term sampling campaigns were conducted in KB (September 2016, April 2017), YO (October 2016, Mai 2017), Yangambi (September 2016), and in Djolu (May 2016). Sampling was done using the static manual chamber method, as described in Hutchinson and Mosier (1981). In the montane sampling plot, seven chambers were installed for the short-term campaigns. Due to material and logistical constrains, we started the first year of long-term measurements with three chambers and increased the number of chambers to five in the second year of long-term sampling in the montane forest. In YO, short-term campaigns were conducted with four chambers in the mixed forest plot and three chambers in the mono-dominant plot. We then started the long-term campaign in YO with four chambers in the mixed forest and two chambers in the mono-dominant forest, and after 1 year, we proceeded with five chambers in the mixed forest while we stopped the sampling in the mono-dominant plot. Fluxes in Djolu were measured with four chambers. In every plot the chambers were randomly placed between trees and we avoided hills and depressions. PVC chambers with a diameter of 0.3 m, a height of 0.3 m, an airtight lid, and a vent tube to avoid pressure disturbances were installed. A thermocouple (Type T, Omega Engineering, Deckenpfronn, Germany) was inserted through a gastight cable gland to measure temperature in the chambers at each sampling time point. Following established methods, the chambers were inserted into the forest floor at least 12 h prior to taking the first sample to avoid altered results due to soil disturbance. The chambers remained in place throughout the measurement campaign. For each flux measurement, the lids of the chambers were closed for 1 h and 20 mL headspace gas samples were withdrawn every 20 min (t0, t20, t40, and t60) with a 20 mL syringe. Gas samples were stored in pre-evacuated 12 mL vials with airtight septa (Exetainer; Labco Ltd, High Wycombe, UK). To avoid gas leakage issues as described by Knohl et al. (2004), the septa were additionally sealed with a thin layer of silicon. To ensure that the headspace was well mixed and that there was no static concentration gradient inside the chamber, the syringe was flushed with air from the chamber headspace and reinjected into the chamber prior to sample withdrawal. The chambers were only closed for the duration of the measurements. Soil moisture probes (ECH2O-5, Meter Environment, Pullman, USA) and air temperature data loggers (iButton, Maxim Integrated, San Jose, USA) were installed at each chamber cluster. Soil temperature was measured during each sampling event at 20 cm depth using a thermocouple (Type T, Omega Engineering, Deckenpfronn, Germany). To standardize soil moisture data between sites and soil types, the water-filled pore space (WFPS) was calculated for each volumetric water content measurement using bulk soil density data provided from Bauters et al. (2019) and particle density of soil minerals of 2.65 g cm−2.
Gas samples were analyzed for concentrations of CO2 at ETH Zurich (Zurich, Switzerland) using gas chromatography (Bruker, 456-GC, Scion Instruments, Livingstone, UK). Soil gas fluxes were calculated using the linear increase of the gas concentration in the headspace of the chambers over time, corrected for pressure and temperature according to the ideal gas law, divided by chamber area (Hutchinson and Mosier, 1981). Using the micrometeorological convention, a flux from the soil to the atmosphere is denoted as positive flux.
2.3 δ13C-CO2 of streams and soil respiration
After concentration measurements, the remaining gas was analyzed for δ13C of CO2 for 1 week of each month and site to derive a representative δ13C signature of the monthly soil-derived CO2 via the Keeling plot approach (Keeling, 1958). All Keeling plots yielded an r2>0.99 (Fig. S1). Post-run offline calculation and drift correction for assigning the final δ13C values on the V-PDB (Vienna Pee Dee Belemnite) scale were done following the “IT principle” as described by Werner and Brand (2001). The δ13C values of the laboratory air standards were determined at the Max Planck Institute for Biogeochemistry (Jena, Germany) according to Werner et al. (2001). Briefly, linking measured δ13C values of CO2 gas isolated from standard air samples relative to the carbonate V-PDB scale was done via the Jena Reference Air Standard (JRAS), perfectly suited to serve as a primary scale anchor for CO2-in-air measurements. The measurement of the aliquots of the laboratory standards is routinely better than 0.15 ‰. In addition to soil CO2, dissolved CO2 samples of six pristine headwater streams near the chamber sites were taken in April (wet season) and September 2018 (dry season) using the headspace equilibration technique. At each stream site, 20 mL of unfiltered water sampled from the thalweg was injected into 110 mL N2-flushed (Alphagaz 2, Carbagas, Gümlingen, Switzerland) serum crimp vials containing 50 µL of 50 % ZnCl. From the headspace of the crimp vials, three analytical replicates were subsampled into evacuated 12 mL Exetainer vials (Labco Limited, High Wycombe, UK) following Bastviken et al. (2008). To avoid under-pressure problems when withdrawing samples from the 110 mL vials, a Luer stopcock between syringe and needle was used. After withdrawal of 25 mL of sample headspace, the Luer stopcock valve was closed and the syringe was removed from the headspace. After, the plunger was pushed to 20 mL before opening the valve and injecting the subsample to the new vial. The precision of the three analytical replicates was excellent, with a maximum standard deviation of 0.25 ‰. According to Szaran (1998) only 1.03 ‰ fractionation occurs between dissolved and gas phase; thus, δ13C of headspace CO2 can be used as a representative measure for dissolved δ13C of CO2. All CO2 samples were analyzed for δ13C of CO2 with a modified Gasbench II periphery (Finnigan MAT, Bremen, Germany) coupled to an isotope ratio mass spectrometer (IRMS; DeltaplusXP; Finnigan MAT; modification as described by Zeeman et al., 2008) (see the Supplement).
2.4 δ13C of litter and soil
Litterfall collected fortnightly between 2015 and 2016 from traps installed at the same sites was used to determine δ13C of leaves. Eight litterfall traps were installed per plot and arranged in two rows of four with a distance of eight meters between traps. At each site, the leaves were combined into monthly samples which were subsequently dried, homogenized, and ground (Bauters et al., 2019). Soil samples were taken at the montane and the lowland forest plots at 0–30 cm depth and three random positions and subsequently air dried, sieved, and milled. Litter and soil samples were analyzed using an elemental analyzer (automated nitrogen carbon analyzer; ANCA-SL, SerCon, UK) interfaced with an isotope ratio mass spectrometer (IRMS; 20-20, SerCon, UK).
2.5 Statistical analyses
In total 1108 single flux measurements have been conducted (398 in the montane forest and 710 in the lowland forests, respectively). As the campaigns from the different sites were spread over several years, all data were compiled and averaged into weekly bins prior to plotting time series of the data assuming little year-to-year variability. In that way, yearly site averages were not weighed by periods of intensive sampling as each single week had an assigned median value regardless of measurement frequency. This compiling was only conducted for easier representation of the data. For statistical analysis of the effects of soil temperature and WFPS on the soil CO2 flux, we used the individual fluxes with the actual soil temperature and WFPS conditions during each flux measurement. Effects of soil temperature and WFPS on the soil CO2 flux from each forest type were quantified using linear mixed effect models, including all fluxes that were measured, and controlling for the soil chamber via a random intercept. Because a full model was not converging for soil CO2 flux, including all interaction terms between the predictors, interaction between WFPS and soil temperature were omitted. Likewise, two models, one for the wet season and one for the dry season, were fitted to explain effects of ecosystem compartment (litter, soil CO2 flux, and stream CO2) on δ13C values in the lowland and montane forests, including sample spot (litterfall trap, soil flux chamber, and sampled stream) as a random effect. Models were fitted using maximum likelihood methods via the lmerTest package (Kuznetsova et al., 2017). P values of the fixed effects – elevation, transect, and their interaction – were determined based on the denominator degrees of freedom calculated with the Satterthwaite approximation. Marginal (m) and conditional (c) are proxies for the variation explained by the fixed effects, and both the random and fixed effects, respectively, were calculated following Nakagawa and Schielzeth (2013), via the MuMIn package (Barton, 2019). For all statistical analyses, the R software was used (R Development Core Team, 2019). All model fits were validated by checking normality and homoscedasticity of the residuals. QGIS version 2.18 was used to compile the map of the Congo Basin.
3.1 Temperatures and soil moisture
Weekly mean soil and air temperatures were both stable throughout the year in both forest types (Fig. 2a). Mean soil temperatures were 24.0 in the lowland forest sites and 15.3 ∘C in the montane forest. Air temperatures were slightly lower in both lowland and montane sites, averaging 23.5 and 14.7 ∘C, respectively. The WFPS at 30 cm depth in the lowland forest was quite constant. However, a decrease in WFPS was observed during dry season in the montane forest (Fig. 2b). Mean annual WFPS in the montane forest was higher (51.4 %) than in the lowland (29.6 %).
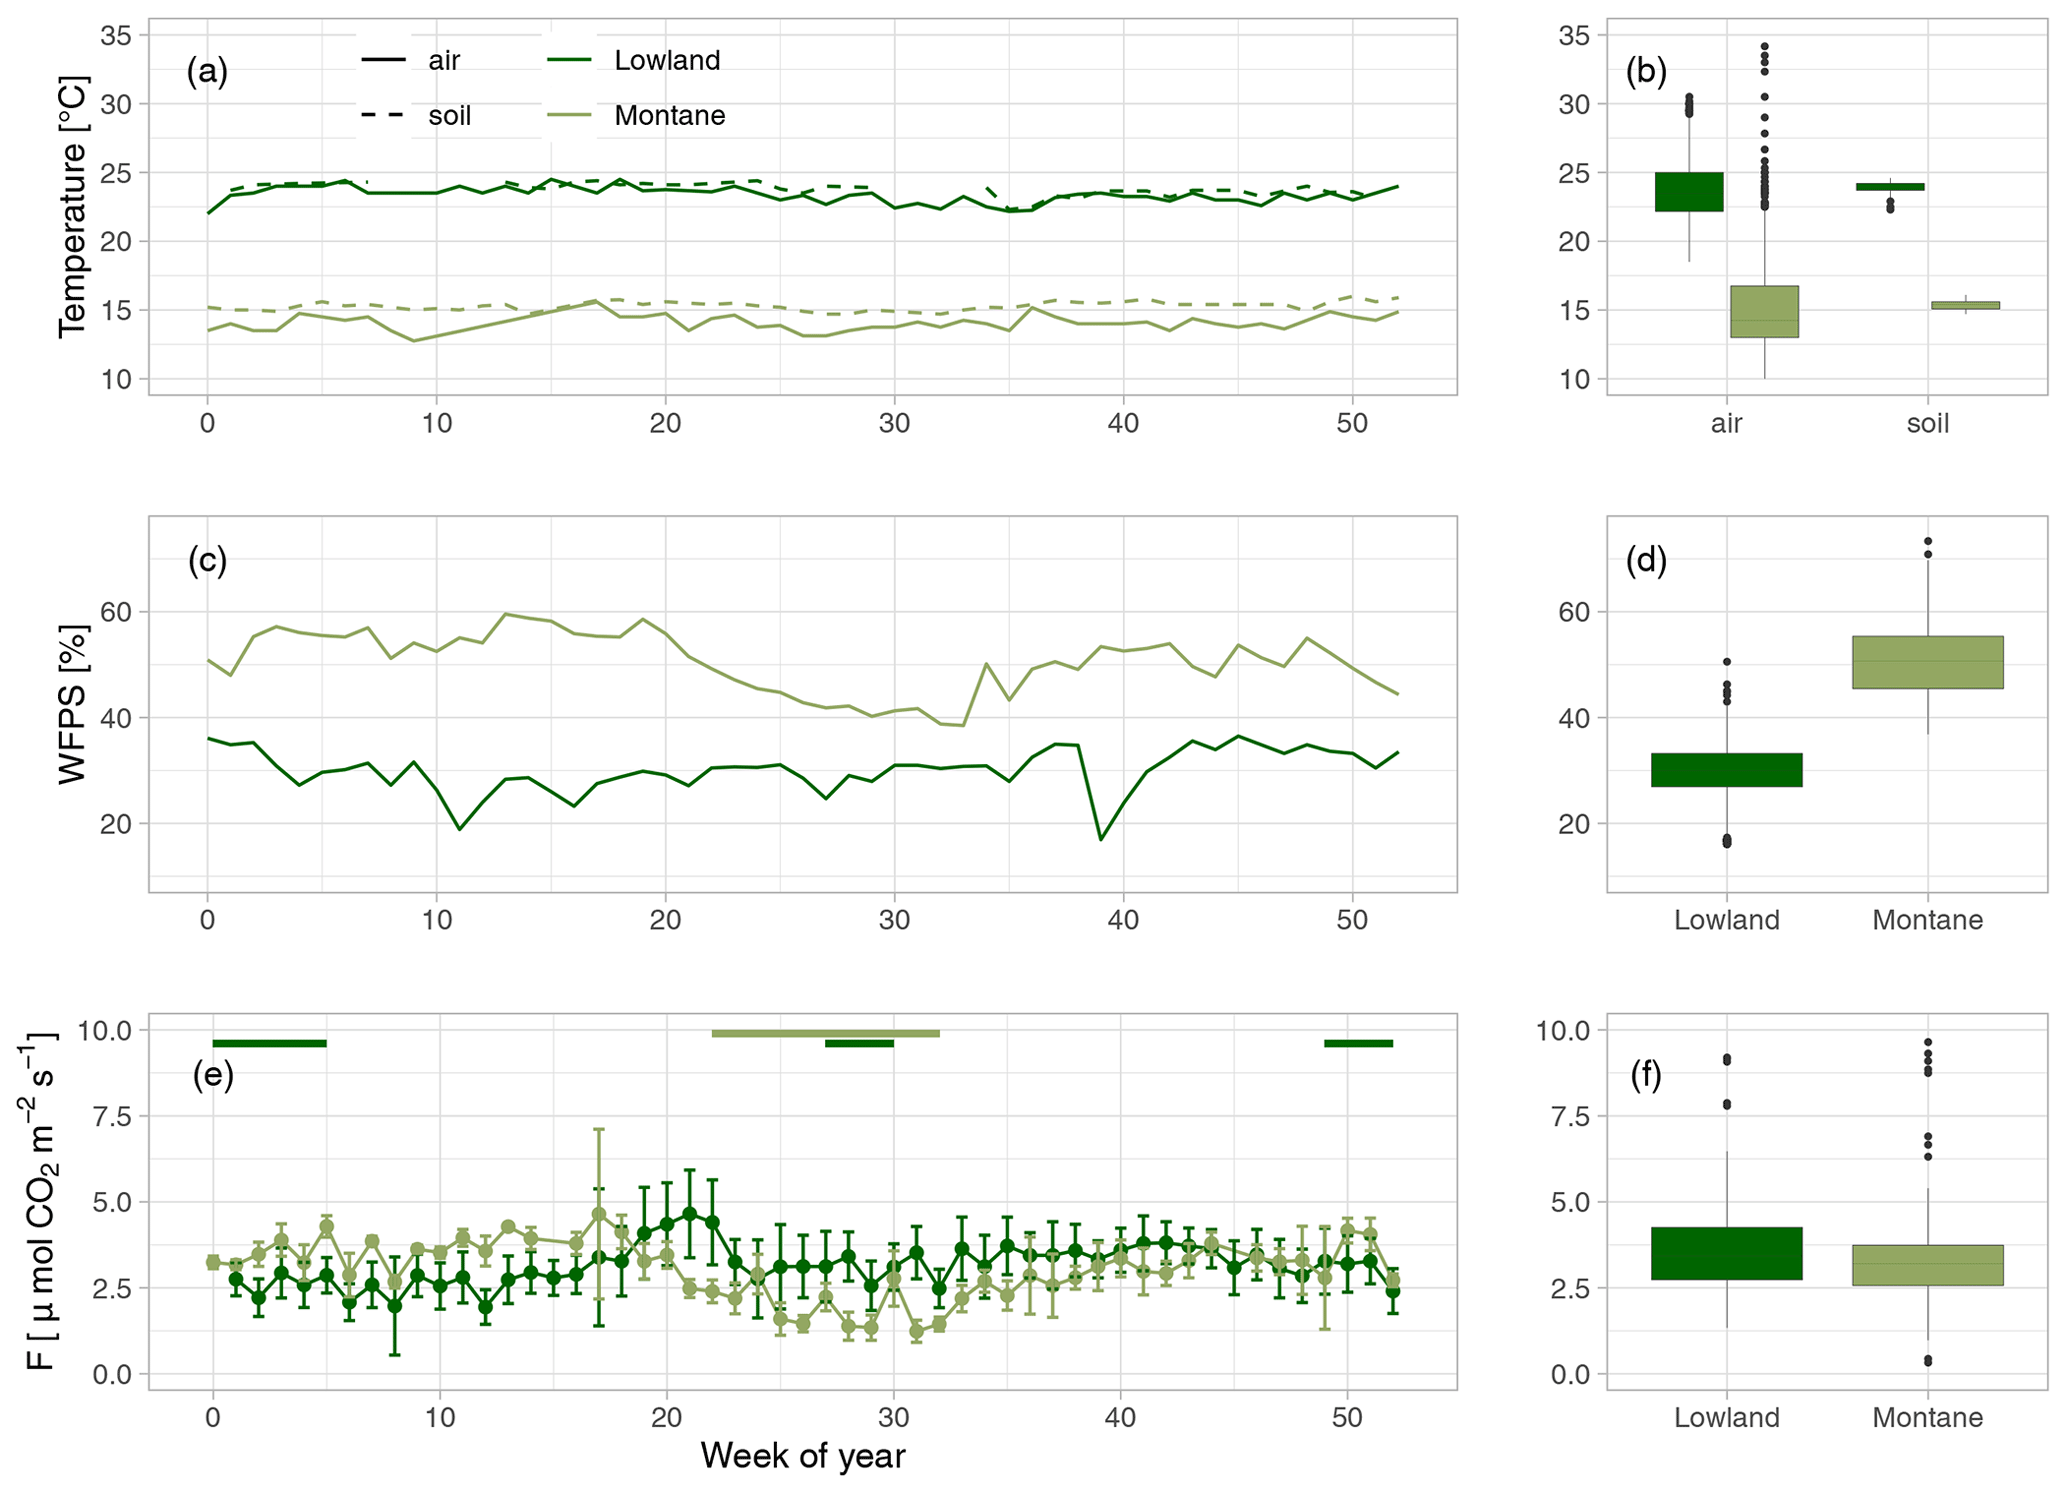
Figure 2(a) Mean weekly air (solid line) and soil temperature at 20 cm depth (dashed line) in the lowland (dark green) and montane (light green) forest sites. (b) Yearly median air and soil temperatures. (c) Mean weekly water-filled pore space (WFPS) [%] in the lowland and montane forest soils at 30 cm depth. (d) Median WFPS in the lowland and montane forest. (e) Weekly median soil CO2 fluxes (F) with error bars indicating the standard deviation. Green horizontal bars on top of (c) indicate the dry seasons in the lowland and in the montane forests, respectively. (f) Median soil CO2 fluxes in the lowland and montane forests.
3.2 Soil CO2 fluxes
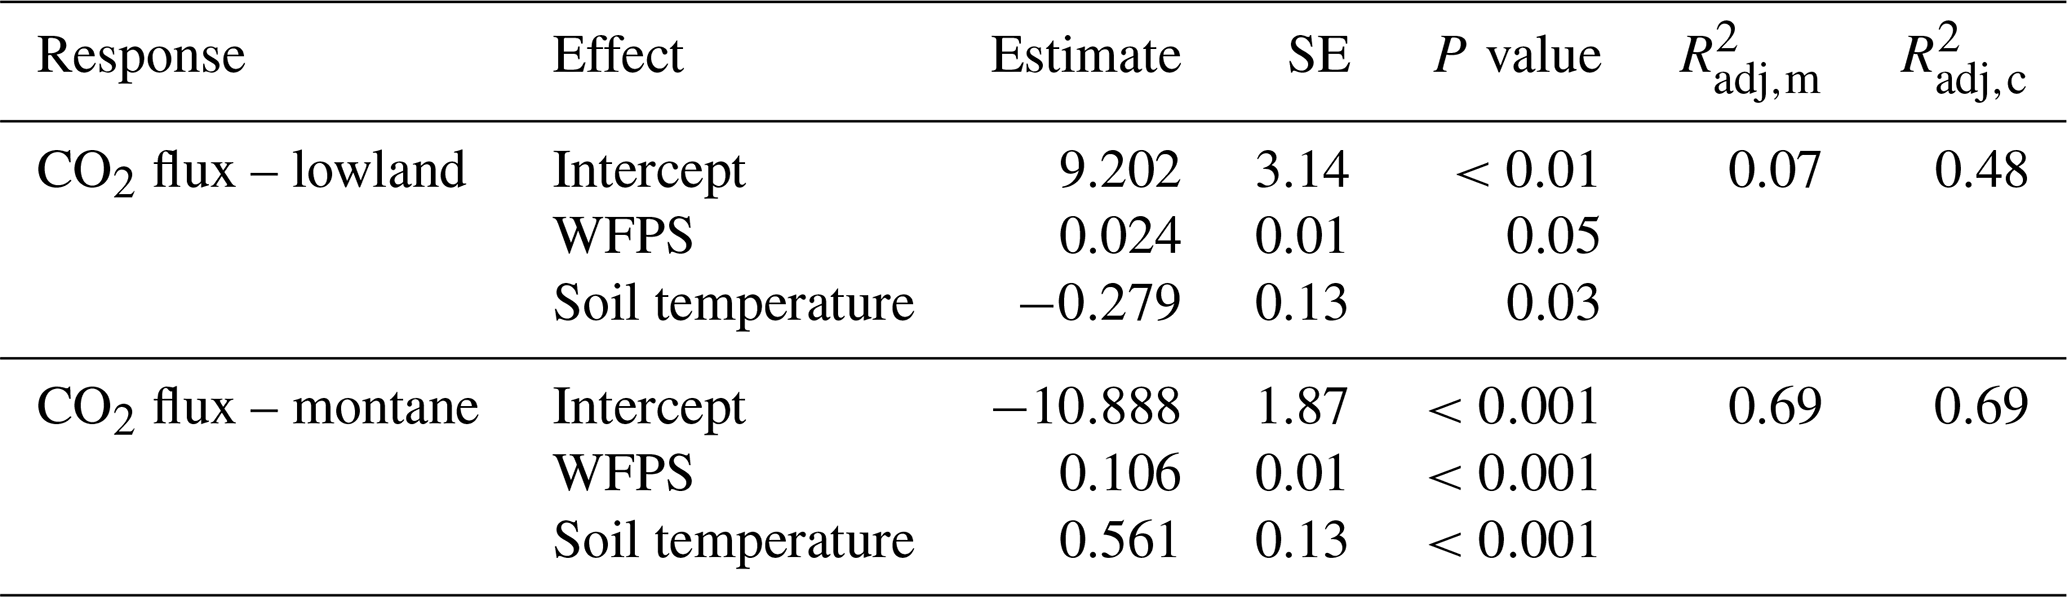
Mean annual soil CO2 fluxes were (mean ± SD) 3.45 ± 1.14 µmol m−2 s−1 for the lowland forests and 3.13 ± 1.22 µmol m−2 s−1 for the montane forest. Soil CO2 fluxes in the montane forests were lowest during the dry season from June to September (2.42 ± 0.87 µmol m−2 s−1) and highest during the wet season from October to May (3.71 ± 1.16 µmol m−2 s−1) (Fig. 2c). Lowland fluxes were more stable throughout the year, with only a small increase at the end of the wet season in June (3.50 ± 1.15 µmol m−2 s−1) (Fig. 2c). The results from the intense sampling campaigns showed that there is not a large variability in soil CO2 fluxes between chambers within a site (lowland: CV = 24 %, montane: CV = 18 %) or also between the different lowland forest sites (Fig. S3b, CV = 28 %) and that fluxes are stable within a site and throughout a day (Fig. S3d). The linear mixed effect model for soil CO2 flux in the lowland explained 48 % of the overall variability, whereas the model for the montane soil CO2 fluxes explained 69 %, all allocated to fixed effects (forest type, soil temperature, and WFPS) (Table 1). The linear mixed effect model showed a negative effect of soil temperature on soil CO2 flux in the lowlands (P value = 0.03) but a positive effect in the montane forest (P value < 0.001). In the montane and lowland forest, a positive effect of WFPS on soil CO2 flux (P value < 0.05) was observed (Table 1).
Table 1Fixed effect estimates for CO2 fluxes in the lowland and montane forests, including water-filled pore space (WFPS in %) and soil temperature (in ∘C) as predictors for the soil CO2 efflux (in µmol m−2 s−1). For each effect, estimated standard error and estimated P values are given, along with the estimated marginal (m) and conditional (c) (Nakagawa and Schielzeth, 2013).
3.3 δ13C values of leaf, litter, soil-respired CO2, and dissolved CO2 in headwater streams
For each category (litter, soil, soil CO2, stream CO2), the δ13C values in the lowland sites were always more negative than in the montane forest (Fig. 3). The most negative values were found in leaf litter (−29.91 ± 0.94 ‰ for the lowland forest and −28.56 ± 0.85 ‰ for the montane forest). The highest values were found in stream-dissolved CO2, with −22.74 ± 2.34 ‰ in lowland streams and −16.68 ± 0.95 ‰ in montane streams. In both forest types, the δ13C values increased from litter via SOC and soil-respired CO2 to dissolved CO2 in streams. Only soil δ13C-CO2 in the montane forest showed a small decrease relative to soil C (Fig. 3). Monthly leaf litter δ13C did not show temporal variability (Fig. S2d). The mean δ13C value of soil-respired CO2 was −28.35 ± 0.58 ‰ in the lowland forest and −26.39 ± 1.03 ‰ in montane forests. The linear mixed model showed a statistical difference in the δ13C values of soil CO2 in the montane forest between the wet and dry season; however, no difference was found in the lowland forest. Both lowland and montane forests showed significant differences in 13C values of dissolved CO2 between wet and dry season in streams, where the δ13C-CO2 signature is more depleted in the wet season compared to the dry season (Fig. S4).
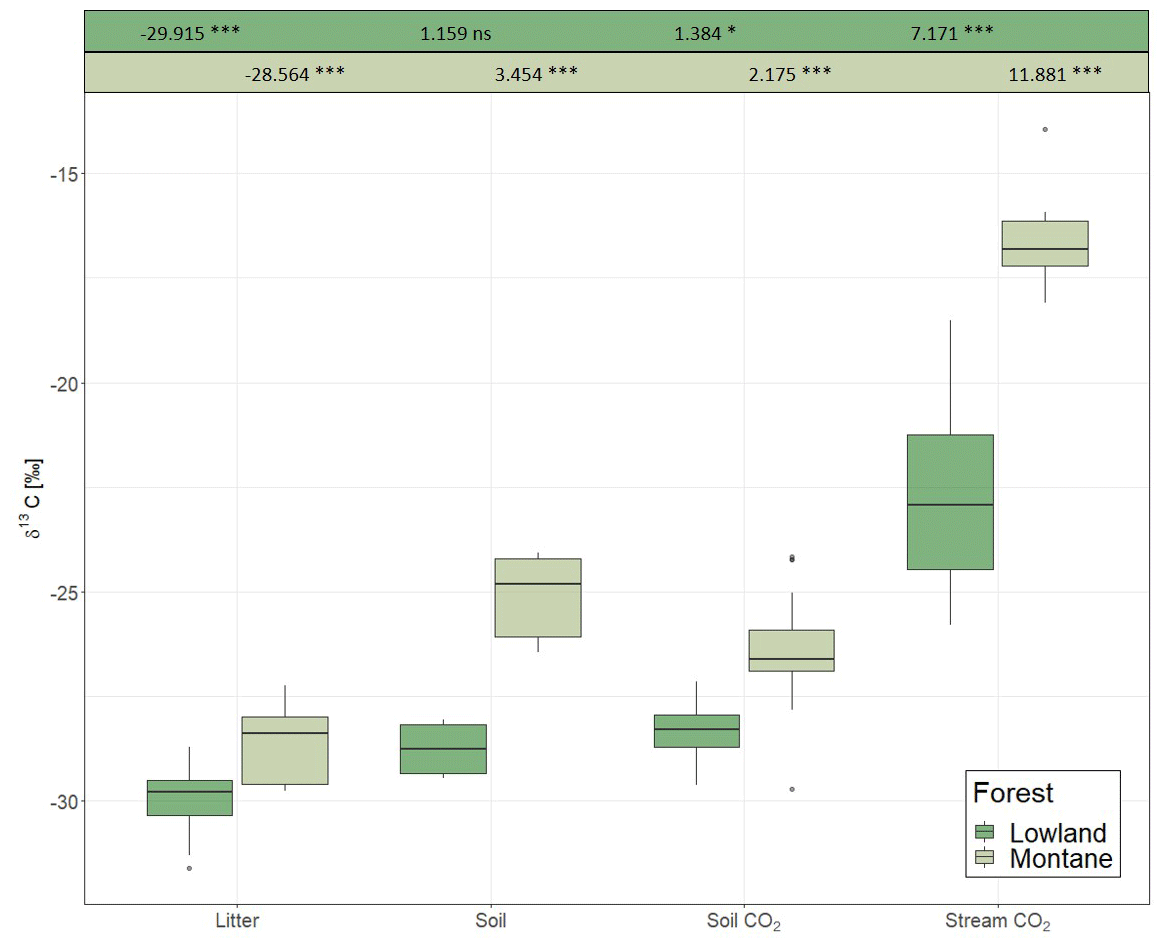
Figure 3δ13C values of litter, soil organic carbon, soil-respired CO2, and dissolved CO2 in headwater streams adjacent to the monitoring sites in the lowland and montane forests. Numbers on top are indicating the effect sizes of the two separate (lowland and montane) linear mixed effect models. Numbers for litter are intercept, all subsequent numbers – soil, soil CO2, and stream CO2 – are effect estimates relative to the litter.
4.1 Soil CO2 fluxes
Long-term studies of soil CO2 fluxes in tropical forests are scarce, especially in the Congo Basin. Here we present high temporal resolution data with 1108 individual soil CO2 flux measurements over a period of more than 2 years. The mean annual values from forests of the Congo Basin reported in this study, which are 3.13 ± 1.22 µmol m−2 s−1 for the montane forest and 3.45 ± 1.14 µmol m−2 s−1 for lowland forests, are within the range of reported values from other tropical forests. It has been reported that mean soil CO2 fluxes from South American and Central American tropical forests were 2.30 to 5.30 µmol m−2 s−1 for French Guiana (Buchmann et al., 1997; Janssens et al., 1998; Bréchet et al., 2011; Epron et al., 2013; Courtois et al., 2018), 2.64 to 4.30 µmol m−2 s−1 for Brazil (Davidson et al., 2004; Doff Sotta et al., 2004; Sousa Neto et al., 2011; Sotta et al., 2007; Garcia-Montiel et al., 2004), and 5.20 µmol m−2 s−1 for Panama (Pendall et al., 2010). To our knowledge, the only reported soil CO2 fluxes from a tropical forest in Africa in recent years are from Kenya (Arias‐Navarro et al., 2017; Werner et al., 2007), and they were rather low compared to our flux rates (i.e., between 1.04 and 1.66 µmol m−2 s−1). Higher fluxes were reported in tropical forests in Hawaii (6.96 µmol m−2 s−1; Townsend et al., 1995) and Thailand (9.76 µmol m−2 s−2; Hashimoto et al., 2004). The data presented here are the first from tropical forests within the Congo Basin since Maldague and Hilger (1962) reported soil CO2 fluxes from lowland forests in the DRC of 3 to 4 µmol m−2 s−1. These values from the year 1962 lie exactly within the range of the values measured in this study, although it is important to note that the 1962 fluxes were derived from only four observations.
4.2 Seasonality of CO2 fluxes
Fluxes in the montane forest showed marked seasonality, with a 34 % decrease during the dry season, whereas fluxes in the lowland forests did not show any seasonality (Fig. 2c). Courtois et al. (2018) have shown a similar trend of decreased fluxes during the dry season (15.7 % decrease) in tropical forests in French Guiana; however, the decrease they found was not as pronounced as in the montane forests we sampled. One possible reason for the seasonal difference between montane and lowland forests is that the lowland dry season is not as distinct as in the montane regions. Rainfall events during the “dry season” in the lowlands are not uncommon (Fig. S2). A model study by Raich et al. (2002) concluded that in seasonally dry biomes, soil CO2 emissions positively correlate with precipitation. Precipitation was also identified as the main driver of maximum C assimilation rates in 11 sub-Saharan ecosystems, which in turn was an ultimate driver of soil CO2 fluxes (Merbold et al., 2009). Thus, given the results of the present study and the projected increase in dry season length in the Congo Basin, as recently reported by Jiang et al. (2019), one would expect a future decrease of C fluxes in the montane forests while little to no effect might be expected in the lowland forests. However, a change in rainfall patterns can also lead to more extreme drying–rewetting events and this might affect soil CO2 fluxes, as potential CO2 pulses after rewetting compensate for the possible reduced soil respiration (Waring and Powers, 2016).
4.3 Temperature and soil moisture controls
Despite the markedly different temperature regimes between the lowland and montane forests, yearly averaged soil CO2 fluxes were almost identical (Fig. 2f). Such intersite temperature independence of soil CO2 flux is unique compared to other tropical (e.g., Brazil; Doff Sotta et al., 2004; Sousa Neto et al., 2011) or temperate forests (e.g., Switzerland; Ruehr et al., 2010), where strong correlations between soil CO2 fluxes and soil temperature were found. However, in addition to temperature, soil geochemistry can play a crucial role in controlling soil CO2 fluxes, particularly via soil C stabilization processes and their rates (Doetterl et al., 2018). Short-term changes in C fluxes are mostly related to respiration of nonprotected soil C (plant residues, root exudates, rhizodeposition), while the majority of stored C in soils is stabilized within the mineral matrix (Doetterl et al., 2018). Thus, a potential increase in CO2 efflux due to change in soil temperatures in the lowland might be counteracted by higher C protection due to soil geochemistry. Within sites, a statistically significant correlation between soil temperature and CO2 flux was found; however, montane and lowland forest displayed opposite relationships with soil temperature (Table 1). The negative relationship with soil temperature in the lowland forest indicates that soil temperatures are already too high for an optimal microbial activity. Nevertheless, it is important to note that the soil temperatures within different forest types of the Congo Basin are relatively stable throughout the year (Fig. 2a), with standard deviations of 0.34 and 0.42 ∘C for montane and lowland soil temperature, respectively. Thus, given the lack of variability in soil temperatures, the accuracy of detected relationships could be questioned, and extrapolations of the CO2 flux responses found here beyond the soil temperature ranges observed in this study should be handled with care. For better understanding of temperature dependencies of soil respiration in these forest soils, warming experiments (incubation or field) are needed.
Despite the higher total annual rainfall in the lowlands (Fig. S2), the montane forest soils exhibited higher WFPS (Fig. 2b). The lower relative WFPS in the lowlands was likely due to the sandier soil texture leading to faster drainage. Moreover, the montane forest site showed a clear positive relationship between soil CO2 and WFPS, whereas in the lowland site the effect size of WFPS on soil CO2 flux was a lot smaller (Table 1). Soil moisture can influence soil respiration physically and biologically. Physically, soil moisture can limit the transport of C substrate to soil microorganisms (at low soil moisture conditions) and the diffusion of gases through soils, including both oxygen required for aerobic respiration and respiratory CO2 (in high soil moisture conditions) (Manzoni et al., 2016; Moyano et al., 2012, 2013). Biologically, soil moisture can affect the activity of heterotrophic respiration, where low soil moisture conditions stress soil microbial communities and autotrophic respiration (Xu and Qi, 2001; Rey et al., 2002). The latter is linked to canopy processes, where water limitation can lead to stomatal closure, limiting plant photosynthesis and thus also belowground respiratory processes (see also Sect. 4.4). One possible explanation for why the lowland soil CO2 flux did not vary with WFPS is that the soil respiration is potentially limited by soil C availability, indicated by the similar isotope composition of litter, SOC, and soil-emitted CO2 in the lowland forests (see also Sect. 4.4). Therefore, if soil respiration in lowland forests is indeed likely substrate limited, then environmental factors such as soil moisture or temperature may have less control on soil respiration (Davidson and Janssens, 2006). While soil respiration in lowland forests is most likely C limited, respiration in montane forests seems to be more sensitive to environmental conditions and could represent a potentially large C source with climate change.
4.4 Isotopic source indicators
In this study, the link between C assimilation and soil CO2 is evident through the distinctively different δ13C signatures between lowland and montane forests along the whole cascade of carbon intake via photosynthesis, litterfall, SOC, soil CO2, and stream-dissolved CO2. This difference holds throughout most of the year for leaf litter and soil-respired CO2 between the lowland and the montane site (Fig. S2). The strongest 13C enrichment of soil CO2 was observed at the end of the dry season (September) in the montane site, likely caused by lower photosynthetic 13C-CO2 discrimination conveyed to soil respiration (Fig. S2c). Indeed, the enrichment of 13C of autotrophic soil respiration resulting from stomatal closure during periods of drought has been widely documented (Ekblad and Högberg, 2001; McDowell et al., 2004; Blessing et al., 2016; Salmon et al., 2019). Such distinct enrichment was presumably not detected in the lowland sites due to the absence of a prolonged dry season (Fig. S2a). A study by Ometto et al. (2002) found similar seasonal dependencies of two tropical forest of the Amazon Basin, with one site (Santarém forest) showing a distinct seasonality of δ13C signal of soil CO2 fluxes in response to large variation in rainfall, whereas the other (Manaus forest) had only little variation in rainfall and thus also little variation in δ13C signal of soil CO2 fluxes.
The δ13C value of various ecosystem components (leaf litter, SOC, soil-respired CO2, and riverine CO2) were generally enriched in the montane compared to lowland forests (Fig. 3). Increased foliar δ13C values at higher altitudes are a commonly reported tendency (Körner et al., 1988; Hultine and Marshall, 2000; Chen et al., 2014). This observation is generally explained by the decrease in atmospheric pressure (and thus decreasing partial pressure of O2 and CO2) and decreasing temperature and its effect on partial stomatal closure and lower ci∕ca (ratio of intercellular to ambient CO2) (Roderick and Berry, 2001). While the decrease of O2 partial pressure and temperature are increasing the carboxylation efficiency of the Rubisco molecule and thus declining ci∕ca, declining temperature also effects the viscosity of water and alters the flux of water into the plants, resulting in stomatal closure and decreasing ci∕ca (Roderick and Berry, 2001). A decline in ci∕ca will increase the foliar δ13C value (Farquhar and Richards, 1984). Similar isotopic enrichment with altitude has been shown even within small-scale gradients in Amazonian forests (de Araújo et al., 2008). In the Amazonian study, the relatively enriched values of leaf and ecosystem respiration in the high elevation sites was explained by increased leaf-level photosynthetic capacity (higher leaf nitrogen content and leaf mass per unit area (LMA)), which is decreasing intercellular CO2 concentrations and reducing leaf discrimination, resulting in increasing 13C concentrations in the leaves (de Araújo et al., 2008). However, Bauters et al. (2017) reported decreasing leaf nitrogen content and LMA with higher elevations in tropical forests of the Congo Basin. It is more likely that the higher δ13C values in the montane forest are linked to canopy processes (photosynthesis and stomatal conductance) resulted from lower atmospheric pressure and lower temperatures. Furthermore, a shift in microbial communities due to temperature changes has been found to impact fractionation of the C isotope in heterotrophic soil respiration (enrichment of 13C at lower temperatures) (Andrews et al., 2000). Overall, different δ13C values in the studied ecosystem components between the two forest types might be due to a combination of different effects including temperature, canopy processes, and open vs. closed system isotope dynamics.
As C is respired and transferred down the cascade from photosynthesis to stream-dissolved CO2, it becomes more enriched with heavier isotopes when transiting from one pool to the next due to isotope fractionation (as 12C tends to be preferentially consumed). This is generally a feature of “open systems” in which reactions occur with a continuous supply of substrate, while the residual substrate and products are lost from the system. In contrast, a “closed system” is characterized by the absence of new inputs and results in less fractionation between substrate and product (Fry, 2006). The different enrichment gradients observed between lowland and montane tropical forests indicate more closed vs. more open system dynamics, respectively. In particular, the similar isotopic signatures of litter, SOC, and emitted soil CO2 at the lowland site indicated a more complete decomposition of the C input into the different compartments and thus relatively closed system isotope dynamics (Fig. 3). However, it needs to be stated that this interpretation is somewhat speculative, as contributions of CO2 from root respiration can vary with forest types which may confound intersite comparison. Additional research would be needed to test for the hypothesis of the lowland forests being closed C systems. Moreover, in both systems, the highest enrichment occurs in the last step from soil- to stream-dissolved CO2. A similar enrichment of stream CO2 relative to soil-respired CO2 has also been found in the Amazon by Quay et al. (1989). However, since stream CO2 is governed by a multitude of factors (enrichment factors, such as aquatic photosynthesis, equilibration with atmosphere, outgassing, and weathering of carbonate/silicate minerals (depends on CO2 source for SiO2), and depletion factors, such as respiration of organic C and possibly photodegradation), it remains difficult to isolate a single factor causing the different isotope effects between soil CO2 and stream-dissolved CO2 for lowland and montane forest.
Although the lowland and montane forests of the Congo Basin differed in terms of vegetation composition, climate, and edaphic conditions, there was no significant difference in annual mean soil CO2 flux observed in this study. However, in contrast to the lowland forest, the montane forest site exhibited strong seasonality of soil CO2 efflux, primarily driven by WFPS during the dry season. The nearly identical C isotopic signatures of soil-derived CO2, litter, and SOC in the lowland forest indicate that respiration is likely substrate limited. Substrate limitation in the lowlands would also limit the influence of environmental factors such as WFPS on the CO2 flux rate, which corresponds well to the observed lack of correlation between soil moisture or temperature with soil CO2 fluxes. However, this hypothesis of substrate limitation in the lowlands is highly speculative and further research would be needed to test it. Furthermore, we cannot rule out changes in soil CO2 fluxes with changing environmental conditions given the low range in variation observed over the study period. Overall, these results fill a critical knowledge gap for soil respiration rates of major tropical forests, provide baseline flux magnitudes to better parameterize earth system models, and highlight how soil respiration in montane tropical forest soils of the Congo Basin are relatively sensitive to environmental changes; changes in the C balance might happen in response to more erratic rainfalls and weather extremes. Further monitoring in the Congo Basin is necessary (e.g., eddy covariance flux towers) to set these results in the context of total NEP in these ecosystems.
All data used in this study were published at Zenodo and are available under https://doi.org/10.5281/zenodo.3757768 (Baumgartner et al., 2020).
The supplement related to this article is available online at: https://doi.org/10.5194/bg-17-6207-2020-supplement.
SB, MBar, and JS were responsible for study design. Fieldwork was conducted by SB, MBar, IAM, JKM, LS, and NG. Lab work was conducted by MBar and RAW. Data interpretation was performed by SB, MBar, TWD, and MBau and was supported by KVO, PB, and JS. The article was written by SB with contributions from all co-authors.
The authors declare that they have no conflict of interest.
We want to thank Héritier Ololo Fundji and Montfort Bagalwa Rukeza for administrative and logistic support during the field campaigns in the DRC; the park authorities of Kahuzi-Biéga National Park and INERA (Institut National des Etudes et Recherches Agronomique) in Yangambi for hosting our study; and the park guards for security.
The study was financed by core funding of ETH Zurich and the Swiss National Science Foundation (SNSF). Simon Baumgartner is currently financed by core funding of ETH Zurich and the Fonds National de la Recherche Scientifique (FNRS).
This paper was edited by Aninda Mazumdar and reviewed by two anonymous referees.
Alsdorf, D., Beighley, E., Laraque, A., Lee, H., Tshimanga, R., O'Loughlin, F., Mahé, G., Dinga, B., Moukandi, G., and Spencer, R. G. M.: Opportunities for hydrologic research in the Congo Basin, Rev. Geophys., 54, 378–409, https://doi.org/10.1002/2016RG000517, 2016. a
Andrews, J. A., Matamala, R., Westover, K. M., and Schlesinger, W. H.: Temperature effects on the diversity of soil heterotrophs and the δ13C of soil-respired CO2, Soil Biol. Biochem., 32, 699–706, https://doi.org/10.1016/S0038-0717(99)00206-0, 2000. a
Arias‐Navarro, C., Díaz‐Pinés, E., Klatt, S., Brandt, P., Rufino, M. C., Butterbach‐Bahl, K., and Verchot, L. V.: Spatial variability of soil N2O and CO2 fluxes in different topographic positions in a tropical montane forest in Kenya, J. Geophys. Res.-Biogeo., 122, 514–527, https://doi.org/10.1002/2016JG003667, 2017. a
Barthel, M., Hammerle, A., Sturm, P., Baur, T., Gentsch, L., and Knohl, A.: The diel imprint of leaf metabolism on the δ13C signal of soil respiration under control and drought conditions, New Phytol., 192, 925–938, https://doi.org/10.1111/j.1469-8137.2011.03848.x, 2011. a
Barton, K.: MuMin: Multi-Model Inference, r package version 1.43.6, available at: https://CRAN.R-project.org/package=MuMIn (last access: 14 April 2020), 2019. a
Bastviken, D., Cole, J. J., Pace, M. L., and Van de Bogert, M. C.: Fates of methane from different lake habitats: Connecting whole-lake budgets and CH4 emissions, J. Geophys. Res.-Biogeo., 113, G02024, https://doi.org/10.1029/2007JG000608, 2008. a
Baumgartner, S., Barthel, M., Drake, T. W., Makelele, I. A., Mugula, J. K., Summerauer, L., Gallarotti, N., Ntaboba, L. C., Van Oost, K., Boeckx, P., Doetterl, S., Werner, R. A., and Six, J.: Dataset: Seasonality, drivers, and isotopic composition of soil CO2 fluxes from tropical forests of the Congo Basin, Zenodo, https://doi.org/10.5281/zenodo.3757768, 2020. a
Bauters, M., Verbeeck, H., Demol, M., Bruneel, S., Taveirne, C., Van der Heyden, D., Cizungu, L., and Boeckx, P.: Parallel functional and stoichiometric trait shifts in South American and African forest communities with elevation, Biogeosciences, 14, 5313–5321, https://doi.org/10.5194/bg-14-5313-2017, 2017. a
Bauters, M., Verbeeck, H., Rütting, T., Barthel, M., Bazirake Mujinya, B., Bamba, F., Bodé, S., Boyemba, F., Bulonza, E., Carlsson, E., Eriksson, L., Makelele, I., Six, J., Cizungu Ntaboba, L., and Boeckx, P.: Contrasting nitrogen fluxes in African tropical forests of the Congo Basin, Ecol. Monogr., 89, e01342, https://doi.org/10.1002/ecm.1342, 2019. a, b, c, d
Blessing, C., Barthel, M., and Buchmann, N.: Strong Coupling of Shoot Assimilation and Soil Respiration during Drought and Recovery Periods in Beech As Indicated by Natural Abundance δ13C Measurements, Front. Plant Sci., 7, 1710, https://doi.org/10.3389/fpls.2016.01710, 2016. a
Bond-Lamperty, B., Bailey, V. L., Chen, M., Gough, C. M., and Vargas, R.: Globally rising soil heterotrophic respiration over recent decades, Nature, 560, 80–83, https://doi.org/10.1038/s41586-018-0358-x, 2018. a, b
Borken, W. and Matzner, E.: Reappraisal of drying and wetting effects on C and N mineralization and fluxes in soils, Glob. Change Biol., 15, 808–824, https://doi.org/10.1111/j.1365-2486.2008.01681.x, 2009. a
Bowling, D. R., McDowell, N. G., Bond, B. J., Law, B. E., and Ehleringer, J. R.: 13C content of ecosystem respiration is linked to precipitation and vapor pressure deficit, Oecologia, 131, 113–124, https://doi.org/10.1007/s00442-001-0851-y, 2002. a
Bréchet, L., Ponton, S., Alméras, T., Bonal, D., and Epron, D.: Does spatial distribution of tree size account for spatial variation in soil respiration in a tropical forest?, Plant Soil, 347, 293–303, https://doi.org/10.1007/s11104-011-0848-1, 2011. a
Brüggemann, N., Gessler, A., Kayler, Z., Keel, S. G., Badeck, F., Barthel, M., Boeckx, P., Buchmann, N., Brugnoli, E., Esperschütz, J., Gavrichkova, O., Ghashghaie, J., Gomez-Casanovas, N., Keitel, C., Knohl, A., Kuptz, D., Palacio, S., Salmon, Y., Uchida, Y., and Bahn, M.: Carbon allocation and carbon isotope fluxes in the plant-soil-atmosphere continuum: a review, Biogeosciences, 8, 3457–3489, https://doi.org/10.5194/bg-8-3457-2011, 2011. a
Buchmann, N., Guehl, J.-M., Barigah, T. S., and Ehleringer, J. R.: Interseasonal comparison of CO2 concentrations, isotopic composition, and carbon dynamics in an Amazonian rainforest (French Guiana), Oecologia, 110, 120–131, https://doi.org/10.1007/s004420050140, 1997. a
Chen, L., Flynn, D. F. B., Zhang, X., Gao, X., Lin, L., Luo, J., and Zhao, C.: Divergent patterns of foliar δ13C and δ15N in Quercus aquifolioides with an altitudinal transect on the Tibetan Plateau: an integrated study based on multiple key leaf functional traits, J. Plant Ecol., 8, 303–312, https://doi.org/10.1093/jpe/rtu020, 2014. a
Courtois, E. A., Stahl, C., Van den Berge, J., Bréchet, L., Van Langenhove, L., Richter, A., Urbina, I., Soong, J. L., Peñuelas, J., and Janssens, I. A.: Spatial Variation of Soil CO2, CH4 and N2O Fluxes Across Topographical Positions in Tropical Forests of the Guiana Shield, Ecosystems, 22, 228–228, https://doi.org/10.1007/s10021-018-0281-x, 2018. a, b, c, d
Davidson, E. A. and Janssens, I. A.: Temperature sensitivity of soil carbon decomposition and feedbacks to climate change, Nature, 440, 165–173, https://doi.org/10.1038/nature04514, 2006. a
Davidson, E. A., Ishida, F. Y., and Nepstad, D. C.: Effects of an experimental drought on soil emissions of carbon dioxide, methane, nitrous oxide, and nitric oxide in a moist tropical forest, Glob. Change Biol., 10, 718–730, https://doi.org/10.1111/j.1365-2486.2004.00762.x, 2004. a
de Araújo, A. C., Ometto, J. P. H. B., Dolman, A. J., Kruijt, B., Waterloo, M. J., and Ehleringer, J. R.: Implications of CO2 pooling on δ13C of ecosystem respiration and leaves in Amazonian forest, Biogeosciences, 5, 779–795, https://doi.org/10.5194/bg-5-779-2008, 2008. a, b
Doetterl, S., Kearsley, E., Bauters, M., Hufkens, K., Lisingo, J., Baert, G., Verbeeck, H., and Boeckx, P.: Aboveground vs. Belowground Carbon Stocks in African Tropical Lowland Rainforest: Drivers and Implications, PLOS ONE, 10, 1–14, https://doi.org/10.1371/journal.pone.0143209, 2015. a
Doetterl, S., Berhe, A. A., Arnold, C., Bodé, S., Fiener, P., Finke, P., Fuchslueger, L., Griepentrog, M., Harden, J. W., Nadeu, E., Schnecker, J., Six, J., Trumbore, S., Van Oost, K., Vogel, C., and Boeckx, P.: Links among warming, carbon and microbial dynamics mediated by soil mineral weathering, Nat. Geosci., 11, 589–593, https://doi.org/10.1038/s41561-018-0168-7, 2018. a, b, c
Doff Sotta, E., Meir, P., Malhi, Y., Donato nobre, A., Hodnett, M., and Grace, J.: Soil CO2 efflux in a tropical forest in the central Amazon, Glob. Change Biol., 10, 601–617, https://doi.org/10.1111/j.1529-8817.2003.00761.x, 2004. a, b, c
Ekblad, A. and Högberg, P.: Natural abundance of 13C in CO2 respired from forest soils reveals speed of link between tree photosynthesis and root respiration, Oecologia, 127, 305–308, https://doi.org/10.1007/s004420100667, 2001. a, b, c
Epron, D., Nouvellon, Y., Mareschal, L., e Moreira, R. M., Koutika, L.-S., Geneste, B., Delgado-Rojas, J. S., Laclau, J.-P., Sola, G., de Moraes Gonçalves, J. L., and Bouillet, J.-P.: Partitioning of net primary production in Eucalyptus and Acacia stands and in mixed-species plantations: Two case-studies in contrasting tropical environments, Forest Ecol. Manage., 301, 102–111, https://doi.org/10.1016/j.foreco.2012.10.034, 2013. a
Farquhar, G. D. and Richards, R. A.: Isotopic Composition of Plant Carbon Correlates With Water-Use Efficiency of Wheat Genotypes, Funct. Plant Biol., 11, 539–552, https://doi.org/10.1071/PP9840539, 1984. a
Friedlingstein, P., Jones, M. W., O'Sullivan, M., Andrew, R. M., Hauck, J., Peters, G. P., Peters, W., Pongratz, J., Sitch, S., Le Quéré, C., Bakker, D. C. E., Canadell, J. G., Ciais, P., Jackson, R. B., Anthoni, P., Barbero, L., Bastos, A., Bastrikov, V., Becker, M., Bopp, L., Buitenhuis, E., Chandra, N., Chevallier, F., Chini, L. P., Currie, K. I., Feely, R. A., Gehlen, M., Gilfillan, D., Gkritzalis, T., Goll, D. S., Gruber, N., Gutekunst, S., Harris, I., Haverd, V., Houghton, R. A., Hurtt, G., Ilyina, T., Jain, A. K., Joetzjer, E., Kaplan, J. O., Kato, E., Klein Goldewijk, K., Korsbakken, J. I., Landschützer, P., Lauvset, S. K., Lefèvre, N., Lenton, A., Lienert, S., Lombardozzi, D., Marland, G., McGuire, P. C., Melton, J. R., Metzl, N., Munro, D. R., Nabel, J. E. M. S., Nakaoka, S.-I., Neill, C., Omar, A. M., Ono, T., Peregon, A., Pierrot, D., Poulter, B., Rehder, G., Resplandy, L., Robertson, E., Rödenbeck, C., Séférian, R., Schwinger, J., Smith, N., Tans, P. P., Tian, H., Tilbrook, B., Tubiello, F. N., van der Werf, G. R., Wiltshire, A. J., and Zaehle, S.: Global Carbon Budget 2019, Earth Syst. Sci. Data, 11, 1783–1838, https://doi.org/10.5194/essd-11-1783-2019, 2019. a
Fry, B.: Stable Isotope Ecology, Springer, New York, 2006. a, b
Garcia-Montiel, D. C., Melillo, J. M., Steudler, P. A., Tian, H., Neill, C., Kicklighter, D. W., Feigl, B., Piccolo, M., and Cerri, C. C.: Emissions of N2O and CO2 from terra firme forests in Rondonia, Brazil, Ecol. Appl., 14, 214–220, https://doi.org/10.1890/01-6023, 2004. a
Hashimoto, S., Tanaka, N., Suzuki, M., Inoue, A., Takizawa, H., Kosaka, I., Tanaka, K., Tantasirin, C., and Tangtham, N.: Soil respiration and soil CO2 concentration in a tropical forest, Thailand, J. Forest Res., 9, 75–79, https://doi.org/10.1007/s10310-003-0046-y, 2004. a
Hopkins, A. and Del Prado, A.: Implications of climate change for grassland in Europe: impacts, adaptations and mitigation options: a review, Grass Forage Sci., 62, 118–126, https://doi.org/10.1111/j.1365-2494.2007.00575.x, 2007. a
Hultine, K. R. and Marshall, J. D.: Altitude trends in conifer leaf morphology and stable carbon isotope composition, Oecologia, 123, 32–40, https://doi.org/10.1007/s004420050986, 2000. a
Hutchinson, G. L. and Mosier, A. R.: Improved Soil Cover Method for Field Measurement of Nitrous Oxide Fluxes, Soil. Sci. Soc. Am. J., 45, 311–316, https://doi.org/10.2136/sssaj1981.03615995004500020017x, 1981. a, b
Högberg, P., Nordgren, A., Buchmann, N., Taylor, A., Ekblad, A., Högberg, M., Nyberg, G., Ottosson-Löfvenius, M., and Read, D.: Large-scale forest girdling shows that current photosynthesis drives soil respiration, Nature, 411, 789–92, https://doi.org/10.1038/35081058, 2001. a
Imani, G., Zapfack, L., Kalume, J., Riera, B., Cirimwami, L., and Boyemba, F.: Woody vegetation groups and diversity along the altitudinal gradient in mountain forest: case study of Kahuzi-Biega National Park and its surroundings, RD Congo, Journal of Biodiversity and Environmental Sciences, 8, 134–150, 2016. a
Janssens, I. A., Barigah, S. T., and Ceulemans, R.: Soil CO2 efflux rates in different tropical vegetation types in French Guiana, Ann. Sci. Forest., 55, 671–680, https://doi.org/10.1051/forest:19980603, 1998. a, b, c
Jiang, Y., Zhou, L., Tucker, C. J., Raghavendra, A., Hua, W., Liu, Y. Y., and Joiner, J.: Widespread increase of boreal summer dry season length over the Congo rainforest, Nat. Clim. Change, 9, 617–622, https://doi.org/10.1038/s41558-019-0512-y, 2019. a, b
Jones, A., Breuning-Madsen, H., Brossard, M., Dampha, A., Deckers, J., Dewitte, O., Gallali, T., Hallett, S., Jones, R., Kilasara, M., Le Roux, P., Micheli, E., Montanarella, L., Spaargaren, O., Thiobiano, L., Van Ranst, E., Yemefack, M., and Zougmoré, R.: Soil Atlas of Africa, European Commission, Publication Office of the European Union, Luxembourg, 2013. a, b
Kearsley, E., Verbeeck, H., Hufkens, K., Van de Perre, F., Doetterl, S., Baert, G., Beeckman, H., Boeckx, P., and Huygens, D.: Functional community structure of African monodominant Gilbertiodendron dewevrei forest influenced by local environmental filtering, Ecol. Evol., 7, 295–304, https://doi.org/10.1002/ece3.2589, 2017. a
Keeling, C. D.: The concentration and isotopic abundances of atmospheric carbon dioxide in rural areas, Geochim. Cosmochim. Ac., 13, 322–334, https://doi.org/10.1016/0016-7037(58)90033-4, 1958. a
Knohl, A., Werner, R., Geilmann, H., and Brand, W.: Kel-F (TM) discs improve storage time of canopy air samples in 10-mL vials for CO2-delta C-13 analysis, Rapid Commun. Mass Sp., 18, 1663–1665, https://doi.org/10.1002/rcm.1528, 2004. a
Körner, C., Farquhar, G. D., and Roksandic, Z.: A global survey of carbon isotope discrimination in plants from high altitude, Oecologia, 74, 623–632, https://doi.org/10.1007/BF00380063, 1988. a
Kuznetsova, A., Brockhoff, P. B., and Christensen, R. H. B.: lmerTest Package: Tests in Linear Mixed Effects Models, J. Stat. Softw., 82, 1–26, https://doi.org/10.18637/jss.v082.i13, 2017. a
Maldague, M. E. and Hilger, F.: Observations Faunastiques et Microbiologiques Dans Quelques Biotopes Forestiers Equatoriaux, in: Soil Organisms: Proceedings of the colloquium on soil fauna, soil microflora and their relationships, Oosterbeek, the Netherlands, 10–16 September 1962, 368–374, 1962. a, b
Manzoni, S., Moyano, F., Kätterer, T., and Schimel, J.: Modeling coupled enzymatic and solute transport controls on decomposition in drying soils, Soil Biol. Biochem., 95, 275–287, https://doi.org/10.1016/j.soilbio.2016.01.006, 2016. a
McDowell, N. G., Bowling, D. R., Bond, B. J., Irvine, J. R., Law, B. E., Anthoni, P., and Ehleringer, J. R.: Response of the carbon isotopic content of ecosystem, leaf, and soil respiration to meteorological and physiological driving factors in a Pinus ponderosa ecosystem, Global Biogeochem. Cy., 18, GB1013, https://doi.org/10.1029/2003GB002049, 2004. a
Melillo, J. M., McGuire, D. A., Kicklighter, D. W., Moore, Berrien, M. I., Vorosmarty, C. J., and Schloss, A. L.: Global Climate-Change and Terrestrial Net Primary Production, Nature, 363, 234–240, https://doi.org/10.1038/363234a0, 1993. a
Merbold, L., Ardö, J., Arneth, A., Scholes, R. J., Nouvellon, Y., de Grandcourt, A., Archibald, S., Bonnefond, J. M., Boulain, N., Brueggemann, N., Bruemmer, C., Cappelaere, B., Ceschia, E., El-Khidir, H. A. M., El-Tahir, B. A., Falk, U., Lloyd, J., Kergoat, L., Le Dantec, V., Mougin, E., Muchinda, M., Mukelabai, M. M., Ramier, D., Roupsard, O., Timouk, F., Veenendaal, E. M., and Kutsch, W. L.: Precipitation as driver of carbon fluxes in 11 African ecosystems, Biogeosciences, 6, 1027–1041, https://doi.org/10.5194/bg-6-1027-2009, 2009. a
Moyano, F. E., Vasilyeva, N., Bouckaert, L., Cook, F., Craine, J., Curiel Yuste, J., Don, A., Epron, D., Formanek, P., Franzluebbers, A., Ilstedt, U., Kätterer, T., Orchard, V., Reichstein, M., Rey, A., Ruamps, L., Subke, J.-A., Thomsen, I. K., and Chenu, C.: The moisture response of soil heterotrophic respiration: interaction with soil properties, Biogeosciences, 9, 1173–1182, https://doi.org/10.5194/bg-9-1173-2012, 2012. a
Moyano, F. E., Manzoni, S., and Chenu, C.: Responses of soil heterotrophic respiration to moisture availability: An exploration of processes and models, Soil Biol. Biochem., 59, 72–85, https://doi.org/10.1016/j.soilbio.2013.01.002, 2013. a
Nakagawa, S. and Schielzeth, H.: A general and simple method for obtaining R2 from generalized linear mixed-effects models, Methods Ecol. Evol., 4, 133–142, https://doi.org/10.1111/j.2041-210x.2012.00261.x, 2013. a, b
Ogle, K.: Microbes weaken soil carbon sink, Nature, 560, 32–33, https://doi.org/10.1038/d41586-018-05842-2, 2018. a
Ometto, J. P. H. B., Flanagan, L. B., Martinelli, L. A., Moreira, M. Z., Higuchi, N., and Ehleringer, J. R.: Carbon isotope discrimination in forest and pasture ecosystems of the Amazon Basin, Brazil, Global Biogeochem. Cy., 16, 56-1–56-10, https://doi.org/10.1029/2001GB001462, 2002. a
Palmer, P. I., Feng, L., Baker, D., Chevallier, F., Bösch, H., and Somkut, P.: Net carbon emissions from African biosphere dominate pan-tropical atmospheric CO2 signal, Nat. Commun., 10, 3344, https://doi.org/10.1038/s41467-019-11097-w, 2019. a
Pan, Y., Birdsey, R., Fang, J., Houghton, R., Kauppi, P., Kurz, W., Phillips, O., Shvidenko, A., Lewis, S., Canadell, J., Ciais, P., Jackson, R., Pacala, S., McGuire, A., Piao, S., Rautiainen, A., Sitch, S., and Hayes, D.: A Large and Persistent Carbon Sink in the World's Forests, Science, 333, 988–993, https://doi.org/10.1126/science.1201609, 2011. a
Pendall, E., Schwendemann, L., Rahn, T., Miller, J. B., Tans, P. P., and White, J. W. C.: Land use and season affect fluxes of CO2, CH4, CO, N2O, H2 and isotopic source signatures in Panama: evidence from nocturnal boundary layer profiles, Glob. Change Biol., 16, 2721–2736, https://doi.org/10.1111/j.1365-2486.2010.02199.x, 2010. a
Quay, P., King, S., Wilbur, D., Wofsy, S., and Rickey, J.: 13C ∕ 12C of atmospheric CO2 in the Amazon Basin: Forest and river sources, J. Geophys. Res.-Atmos., 94, 18327–18336, https://doi.org/10.1029/JD094iD15p18327, 1989. a
Raich, J. W. and Schlesinger, W. H.: The global carbon dioxide flux in soil respiration and its relationship to vegetation and climate, Tellus B, 44, 81–99, https://doi.org/10.1034/j.1600-0889.1992.t01-1-00001.x, 1992. a
Raich, J. W., Potter, C. S., and Bhagawati, D.: Interannual variability in global soil respiration, 1980–94, Glob. Change Biol., 8, 800–812, https://doi.org/10.1046/j.1365-2486.2002.00511.x, 2002. a, b
R Development Core Team: R: A Language and Environment for Statistical Computing, R Foundation for Statistical Computing, Vienna, Austria, available at: http://www.R-project.org (last access: 14 April 2020), 2019. a
Rey, A., Pegoraro, E., Tedeschi, V., De Parri, I., Jarvis, P. G., and Valentini, R.: Annual variation in soil respiration and its components in a coppice oak forest in Central Italy, Glob. Change Biol., 8, 851–866, https://doi.org/10.1046/j.1365-2486.2002.00521.x, 2002. a
Roderick, M. L. and Berry, S. L.: Linking wood density with tree growth and environment: a theoretical analysis based on the motion of water, New Phytol., 149, 473–485, https://doi.org/10.1046/j.1469-8137.2001.00054.x, 2001. a, b
Ruehr, N. K., Offermann, C. A., Gessler, A., Winkler, J. B., Ferrio, J. P., Buchmann, N., and Barnard, R. L.: Drought effects on allocation of recent carbon: from beech leaves to soil CO2 efflux, New Phytol., 184, 950–961, https://doi.org/10.1111/j.1469-8137.2009.03044.x, 2009. a
Ruehr, N. K., Knohl, A., and Buchmann, N.: Environmental variables controlling soil respiration on diurnal, seasonal and annual time-scales in a mixed mountain forest in Switzerland, Biogeochemistry, 98, 153–170, https://doi.org/10.1007/s10533-009-9383-z, 2010. a, b
Rustad, L. E., Huntington, T. G., and Boone, R. D.: Controls on Soil Respiration: Implications for Climate Change, Biogeochemistry, 48, 1–6, 2000. a
Salmon, Y., Dietrich, L., Sevanto, S., Hölttä, T., Dannoura, M., and Epron, D.: Drought impacts on tree phloem: from cell-level responses to ecological significance, Tree Physiol., 39, 173–191, https://doi.org/10.1093/treephys/tpy153, 2019. a
Sotta, E. D., Veldkamp, E., Schwendemann, L., Guimaraes, B. R., Paixao, R. K., Ruivo, M. d. L. P., Lola da Costa, A. C., and Meir, P.: Effects of an induced drought on soil carbon dioxide (CO2) efflux and soil CO2 production in an Eastern Amazonian rainforest, Brazil, Glob. Change Biol., 13, 2218–2229, https://doi.org/10.1111/j.1365-2486.2007.01416.x, 2007. a
Sousa Neto, E., Carmo, J. B., Keller, M., Martins, S. C., Alves, L. F., Vieira, S. A., Piccolo, M. C., Camargo, P., Couto, H. T. Z., Joly, C. A., and Martinelli, L. A.: Soil-atmosphere exchange of nitrous oxide, methane and carbon dioxide in a gradient of elevation in the coastal Brazilian Atlantic forest, Biogeosciences, 8, 733–742, https://doi.org/10.5194/bg-8-733-2011, 2011. a, b, c
Szaran, J.: Carbon isotope fractionation between dissolved and gaseous carbon dioxide, Chem. Geol., 150, 331–337, https://doi.org/10.1016/S0009-2541(98)00114-4, 1998. a
Townsend, A. R., Vitousek, P. M., and Trumbore, S. E.: Soil Organic Matter Dynamics Along Gradients in Temperature and Land Use on the Island of Hawaii, Ecology, 76, 721–733, https://doi.org/10.2307/1939339, 1995. a
Verhegghen, A., Mayaux, P., de Wasseige, C., and Defourny, P.: Mapping Congo Basin vegetation types from 300 m and 1 km multi-sensor time series for carbon stocks and forest areas estimation, Biogeosciences, 9, 5061–5079, https://doi.org/10.5194/bg-9-5061-2012, 2012. a
Waring, B. G. and Powers, J. S.: Unraveling the mechanisms underlying pulse dynamics of soil respiration in tropical dry forests, Environ. Res. Lett., 11, 105005, https://doi.org/10.1088/1748-9326/11/10/105005, 2016. a
Werner, C., Kiese, R., and Butterbach-Bahl, K.: Soil-atmosphere exchange of N2O, CH4, and CO2 and controlling environmental factors for tropical rain forest sites in western Kenya, J. Geophys. Res., 112, D03308, https://doi.org/10.1029/2006JD007388, 2007. a
Werner, R. A. and Brand, W. A.: Referencing strategies and techniques in stable isotope ratio analysis, Rapid Commun. Mass Sp., 15, 501–519, https://doi.org/10.1002/rcm.258, 2001. a
Werner, R. A., Rothe, M., and Brand, W. A.: Extraction of CO2 from air samples for isotopic analysis and limits to ultra high precision δ18O determination in CO2 gas, Rapid Commun. Mass S., 15, 2152–2167, https://doi.org/10.1002/rcm.487, 2001. a
Xu, M. and Qi, Y.: Soil-surface CO2 efflux and its spatial and temporal variations in a young ponderosa pine plantation in northern California, Glob. Change Biol., 7, 667–677, https://doi.org/10.1046/j.1354-1013.2001.00435.x, 2001. a
Zeeman, M., Werner, R., Eugster, W., Siegwolf, R., Wehrle, G., Mohn, J., and Buchmann, N.: Optimization of automated gas sample collection and isotope ratio mass spectrometric analysis of δ13C of CO2 in air, Rapid Commun. Mass Sp., 22, 3883–3892, https://doi.org/10.1002/rcm.3772, 2008. a