the Creative Commons Attribution 4.0 License.
the Creative Commons Attribution 4.0 License.
 | 10 Dec 2020
Water flow controls the spatial variability of methane emissions in a northern valley fen ecosystem
Eeva-Stiina Tuittila
Aino Korrensalo
Aleksi Räsänen
Tarmo Virtanen
Mika Aurela
Timo Penttilä
Tuomas Laurila
Stephanie Gerin
Viivi Lindholm
Annalea Lohila
Northern peatlands are projected to be crucial in future atmospheric methane (CH4) budgets and have a positive feedback on global warming. Fens receive nutrients from catchments via inflowing water and are more sensitive than bogs to variations in their ecohydrology. Yet, due to a lack of data detailing the impacts of moving water on microhabitats and CH4 fluxes in fens, large uncertainties remain with respect to predicting CH4 emissions from these sites under climate changes. We measured CH4 fluxes with manual chambers over three growing seasons (2017–2019) at a northern boreal fen. To address the spatial variation at the site where a stream flows through the long and narrow valley fen, we established sample plots at varying distances from the stream. To link the variations in CH4 emissions to environmental controls, we quantified water levels, peat temperature, dissolved oxygen concentration, vegetation composition, and leaf area index in combination with flux measurements during the growing season in 2019. We found that due to the flowing water, there was a higher water level, cooler peat temperatures, and more oxygen in the peat close to the stream, which also had the highest total leaf area and gross primary production (GPP) values but the lowest CH4 emissions. CH4 emissions were highest at an intermediate distance from the stream where the oxygen concentration in the surface peat was low but GPP was still high. Further from the stream, the conditions were drier and produced low CH4 emissions. Our results emphasize the key role of ecohydrology in CH4 dynamics in fens and, for the first time, show how a stream controls CH4 emissions in a flow-through fen. As valley fens are common peatland ecosystems from the Arctic to the temperate zones, future projections of global CH4 budgets need to take flowing water features into account.
- Article
(12013 KB) - Full-text XML
- BibTeX
- EndNote


Northern peatlands, which cover approximately 15 % of the boreal and Arctic regions, are long-term sources of the greenhouse gas methane (CH4) (Korhola et al., 2010; MacDonald et al., 2006), partly counteracting the cooling impact of related long-term carbon dioxide (CO2) uptake. The response of northern peatlands to global warming has partly contributed to the recent increase in atmospheric CH4 concentrations (Bousquet et al., 2011; Ciais et al., 2014; Kirschke et al., 2013), and modelling projections have suggested that, globally, wetland CH4 emissions will continue to increase during the 21st century and will have a positive feedback on global warming (Zhang et al., 2017). However, large uncertainties remain in the global CH4 budget models due to limited knowledge of the relative contribution of the various environmental drivers that control CH4 fluxes (Riley et al., 2011). To upscale observed CH4 fluxes and produce realistic scenarios for future projections of atmospheric CH4 concentrations, it is crucial to understand and quantify the correlations between peatland CH4 emissions and their environmental drivers.
In peatlands, CH4 is produced in wet and anoxic conditions below the water level by methanogens and then released from the peat to the atmosphere. During the transport process, part of the produced CH4 is consumed by methanotrophs. The processes of CH4 production, consumption, transport, and final release to the atmosphere are affected by several environmental factors, such as water level, organic substrates, and temperature (Abdalla et al., 2016; Bellisario et al., 1999; Larmola et al., 2010). There is also evidence that peatland vascular plant functional types can affect CH4 emissions by altering microbial community structure (Robroek et al., 2015). Sedge-dominated fens are CH4 emission hotspots due to greater methanogenic activity (Juottonen et al., 2005) and faster litter degradation rates (Aerts et al., 1999). Also, the greater abundance of sedges (Carex spp.) in fens provides both a direct route for CH4 movement to the atmosphere through aerenchyma tissue, thereby avoiding the oxidation of CH4, and high-quality litter into the soil, which promotes CH4 production (Noyce et al., 2014).
Fens, unlike bogs, are fed by mineral-rich water as seepage from the mineral soil below (soligenous fens) or from surface water flow from the catchment (topogenous fens) (Wheeler and Proctor, 2000). Valley fens that are located in water-collecting depressions can receive water from both sources. Valley fens are widespread in shallow water bodies in river or stream valleys with a slow flow of mineral-rich water (e.g. the Everglades, USA; Biebrza, Poland), or in pools, lakes, or other landscape depressions receiving a slow flow of discharging groundwater and/or surface water (e.g. rich fens in Norfolk Broads, UK; Weerribben-Wieden, the Netherlands) (Lamers et al., 2015). In addition, in boreal permafrost peatlands in Siberia and north America, the running water-controlled systems are probably common due to the difficulty involved with water penetration into the soil. However, it is difficult to define the percentage of peatlands globally that may be classified as valley fens, due to the complex spatial structure and gradients between different peatland types as well as the differences in terminology. The spatial variation in the quantity and quality of incoming water creates spatial patterns in vegetation and microbial communities (e.g. methanogens and methanotrophs) and, thus, CH4 production and oxidation, transportation, and, ultimately, emissions to the atmosphere (Andersen et al., 2011; Juottonen et al., 2015; Kokkonen et al., 2019; Robroek et al., 2015). Several studies have focused on the interactions of CH4 with vertical water level fluctuations; for example, long-term lowering of the water level has been associated with a decreased abundance of Sphagnum mosses and aerenchymous plants, decreased CH4 emissions, and decreased CH4 production potential (Yrjälä et al., 2011). However, due to the heterogeneity of peatlands, inconsistent patterns can also be found. For instance, several studies have indicated that greater CH4 emissions occur when the water level is close to the surface of the peatland (Bubier et al., 2005; Pelletier et al., 2007), whereas other studies have found that maximum fluxes occurred at intermediate water levels (Turetsky et al., 2014) or have found no connection between CH4 emissions and water level (Euskirchen et al., 2019; Korrensalo et al., 2018). Nevertheless, water level has been suggested to be a more important forcing factor on CH4 cycling in fens than either temperature or vegetation composition alone (Laine et al., 2019; Mäkiranta et al., 2018; Riutta et al., 2020). In addition to vertical water level changes, the lateral flow of water in fens can be even more important in driving the processes that underpin CH4 emissions, because flowing water not only ensures a water supply for the vegetation but also transports nutrients, which benefit vegetation and microbial communities (Laitinen et al., 2007). At the same time, flowing water is likely to transport more oxygen (Ingram, 1983), thereby enhancing CH4 oxidation and suppressing production. While fens are typically the highest CH4 emitters of all peatlands (Turetsky et al., 2014), the influence of lateral water flow on fen CH4 emissions has not been studied to date.
At a global scale, climate warming is projected to continue in the decades ahead, while changes in precipitation patterns are projected to be more regional (Collins et al., 2013). Phase 5 of the Coupled Model Intercomparison Project (CMIP5), under a RCP8.5 scenario, predicts a warmer and wetter climate for Fennoscandia (Collins et al., 2013). As peatland hydrology is driven by several processes, such as precipitation, lateral water fluxes, transpiration, and evaporation, climate model predictions cannot be directly applied to infer peatland hydrological conditions (Helbig et al., 2020; Tuittila et al., 2007; Wu et al., 2010; Zhang et al., 2018), especially in minerotrophic fens. Nevertheless, peatland habitats can be impacted under both warming-dry and warming-wet scenarios (Bjorkman et al., 2018; Strack et al., 2006). In addition, fens may be more sensitive to water level changes than bogs; in particular, their plant communities have been shown to experience clear species turnover under drier conditions (Kokkonen et al., 2019). Aside from the vertical fluctuations in the water level, climate change is also likely to affect the water that enters fens, as it will control the hydrological conditions within the catchments, e.g. the temperature sum in spring strongly controls the timing and amount of snowmelt water that enters the fen. This type of change in catchment conditions is likely to impact factors such as plant phenology and biomass production (Mäkiranta et al., 2018). This will, in turn, impact carbon (C) cycling between the peatland and the atmosphere, due to different photosynthesis, decomposition, and gas transportation rates, as well as other factors at the plant functional type and even at the species levels (Hajek et al., 2009; Laine et al., 2011; Turetsky et al., 2008). Hence, a full insight into the complex climate–peatland–ecohydrology–CH4 relationship is needed to predict the impact of changing catchment hydrology on fen CH4 emissions under climate change scenarios. Prior to importing peatland-scale CH4 emissions into global circulation models, we first need to bridge the gap in understanding as to how water flows control fen microhabitats and CH4 emissions.
In this study, we aimed to assess the role of flowing water in regulating spatial variations in valley fen vegetation and CH4 emissions. More specifically, we asked the following research questions:
-
How does a flowing stream within a valley fen impact microhabitat conditions, vegetation composition and biomass production?
-
Does the distance to a stream modify CH4 fluxes?
-
How does vegetation composition and stream-related variables control CH4 emissions?
We also made the following hypotheses: (H1) the water table, temperature, oxygen concentration, vegetation structure, and biomass are related to the proximity of the stream; (H2) the spatial variation in CH4 fluxes is related to the distance from the stream; (H3) the regulation of CH4 fluxes by the stream is mediated by the vegetation and by environmental variables, such as the oxygen concentration.
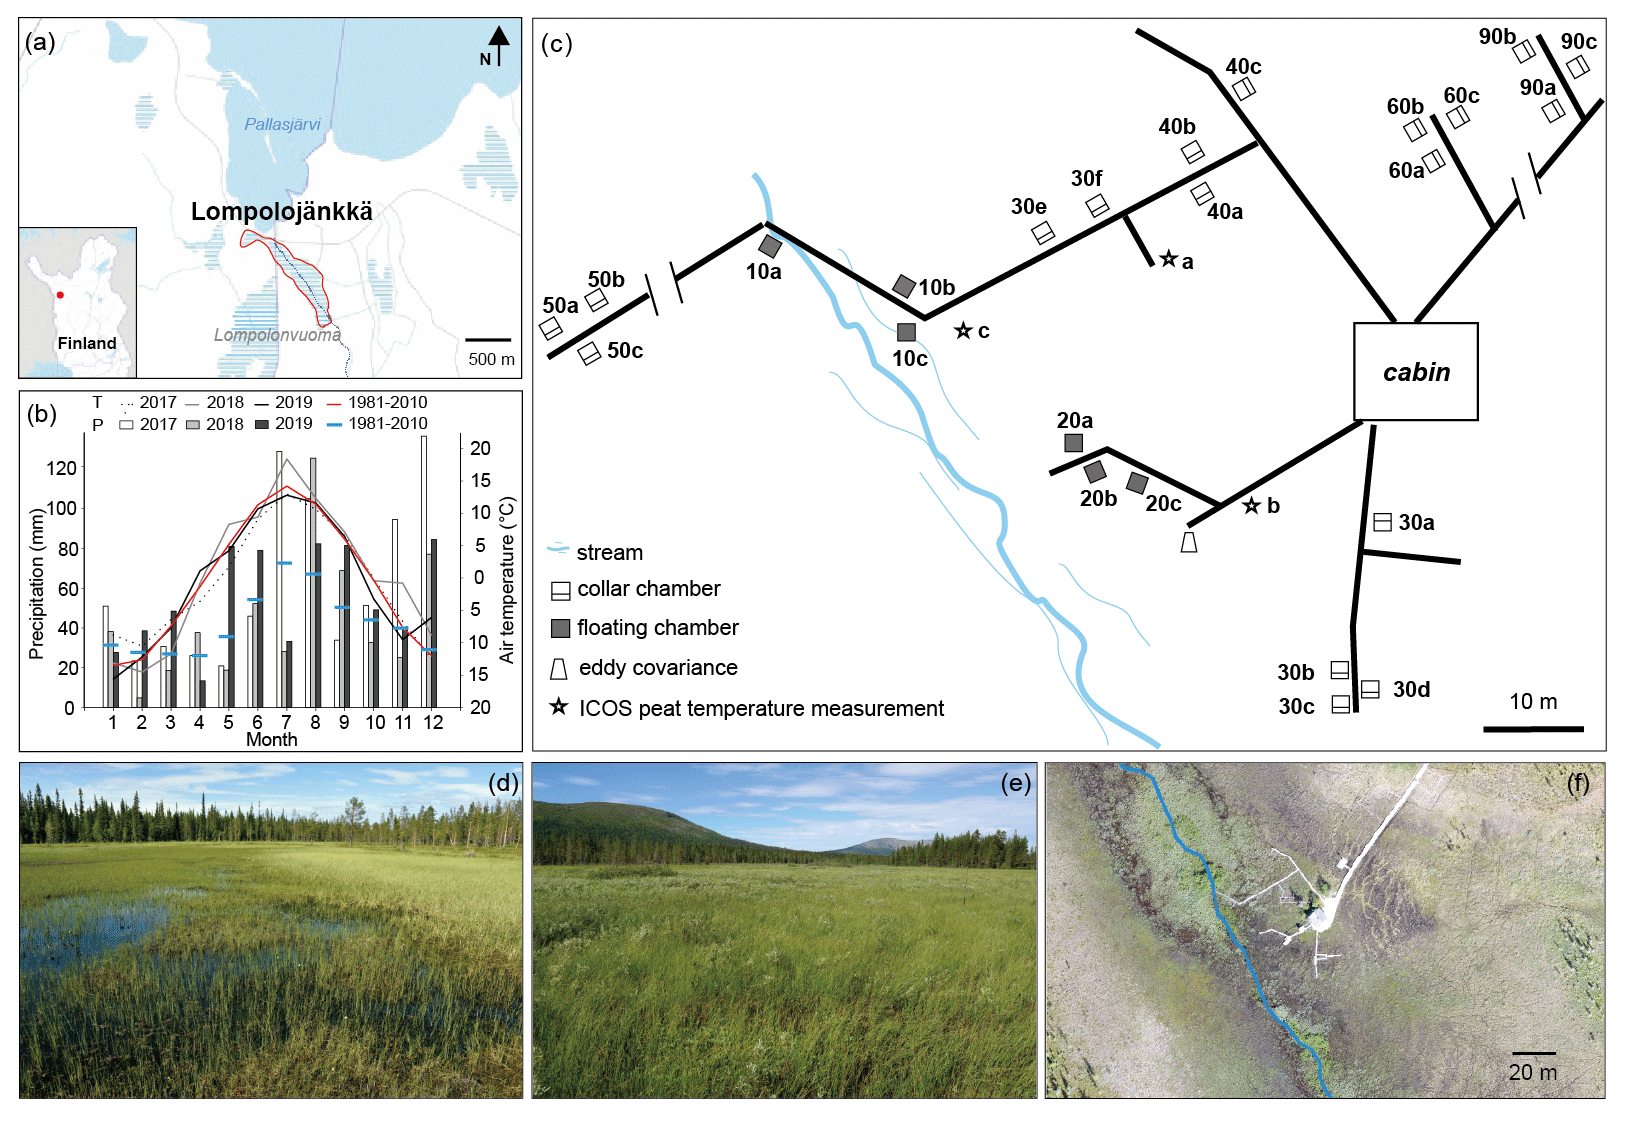
Figure 1(a) Location of the Lompolojänkkä study site outlined in red, with the stream marked in blue. The base map was downloaded from the National Land Survey of Finland dataset under a Creative Commons Attribution 4.0 open-source licence. (b) Monthly air temperature (T) and precipitation (P) during the 2017–2019 period, and the long-term mean T and P values (1981–2010; Kittilä Pokka meteorological station https://en.ilmatieteenlaitos.fi/statistics-from-1961-onwards, last access: 1 July 2020). The data for the 2017–2019 period were obtained from the nearest meteorological stations: Lompolonvuoma (for temperature) and Kenttärova (for precipitation) (https://en.ilmatieteenlaitos.fi/download-observations-questions, last access: 1 July 2020). (c) Schematic illustration of the field measurement set-up. Note that some parts may not be scaled accurately. (d, e) Photos of the study site. (f) Drone image of the field measurement area on 20 August 2018 with the stream marked in blue.
2.1 Study site
Lompolojänkkä (67.997∘ N, 24.210∘ E; 269 m a.s.l.) is one of the Finnish Integrated Carbon Observation System (ICOS) sites. It is an open, mesotrophic sedge fen that is located in a valley in the hilly Pallas region of northern Finland (Fig. 1). Based on the 30-year average (1981–2010; Kittilä Pokka meteorological station), the annual average temperature and total precipitation are −1.3∘ C and 547 mm respectively (Pirinen et al., 2012).
During the three flux measurement years (2017–2019), the summer of 2018 was exceptionally warm, up to 5∘ C warmer than the long-term average (Fig. 1b). Based on the ICOS continuous peat profile temperature measurements (at 5, 10, 20, 30, 50, and 100 cm; Fig. 1c) in 2018, peat temperature at Lompolojänkkä varied with depth as well as for different locations of the site (Fig. A1). During summer, the peat temperature decreased from the surface to the deeper layers, and the pattern was reversed for the other seasons. Peat temperatures were warmer in the drier parts of the study site compared with the wetter parts (closer to the stream) at all measured depths, and there were also larger temperature variations between the different depths in the drier parts.
Peat accumulation at Lompolojänkkä began around 10 000 cal BP (calibrated years before the present, where the present is defined as 1950 AD), and the maximum peat depth is approximately 2.5 m (Mathijssen et al., 2014). The peat thickness of the sampled area ranges from ca. 1 to 2.5 m (Mathijssen et al., 2014). The site currently spans an area of ca. 14 ha and is surrounded by boreal forests. Almost the whole peatland is water saturated throughout the year. The relatively dense vegetation layer is dominated by different sedges (e.g. C. rostrata and C. chordorrhiza) in the wet areas and various deciduous shrubs (e.g. Betula nana and Salix phylicifolia) in the dry areas. Moss cover (e.g. Sphagnum spp.) is patchy with 57 % cover (Aurela et al., 2009). A small stream flows through the long and narrow valley fen (outlined in Fig. 1a) and empties into the nearby Pallasjärvi lake. Thus, the special catchment feature creates both vertical and lateral water movement in the fen. However, the whole site clearly has different water transfer mechanisms operating in different areas of the site a well as during different periods of the year. For example, lateral water movement mainly occurs in the centre of the site which is close to the stream. The flow and size of the stream varies seasonally: it is largest in spring after snowmelt in the catchment. During summer, the stream water level in many locations is below the vegetation surface and may not be visible (Fig. 1d). For more detailed descriptions of Lompolojänkkä, see Aurela et al. (2009) and Lohila et al. (2010).
The catchment area of the stream is 5.1 km2 and drains to Pallasjärvi lake a few hundred metres after leaving the fen. The lowest and highest points of the catchment area range from 268 to 375 m a.s.l. (metres above sea level). The soils mainly consist of glacial till, and the land cover in the catchment consists of coniferous and mixed coniferous–deciduous forests (ca. 80 %) and forested and open peatlands (ca. 20 %). Dominant tree species include Norway spruce (Picea abies), Scots pine (Pinus sylvestris), and downy birch (B. pubescens). Coniferous forests dominate in the catchment. Furthermore, some of the peatlands in the eastern part were drained for forestry purposes during the same period. In such valley mires with streams, the watercourse is small compared with those with features such as large rivers, and streams do not provide significant amounts of water through overbank flooding. However, a complex mosaic of habitats can form around streams with small catchments; for example, at our site, the central stream with a limited floodplain has developed a riparian strip characterized by species such as Equisetum fluviatile, C. limosa, and S. lapponum. The impact of flowing water on a particular site also depends on the shape of the site; compared with other sites, the long narrow shape of Lompolojänkkä undergoes stronger effects from the stream than many other sites.
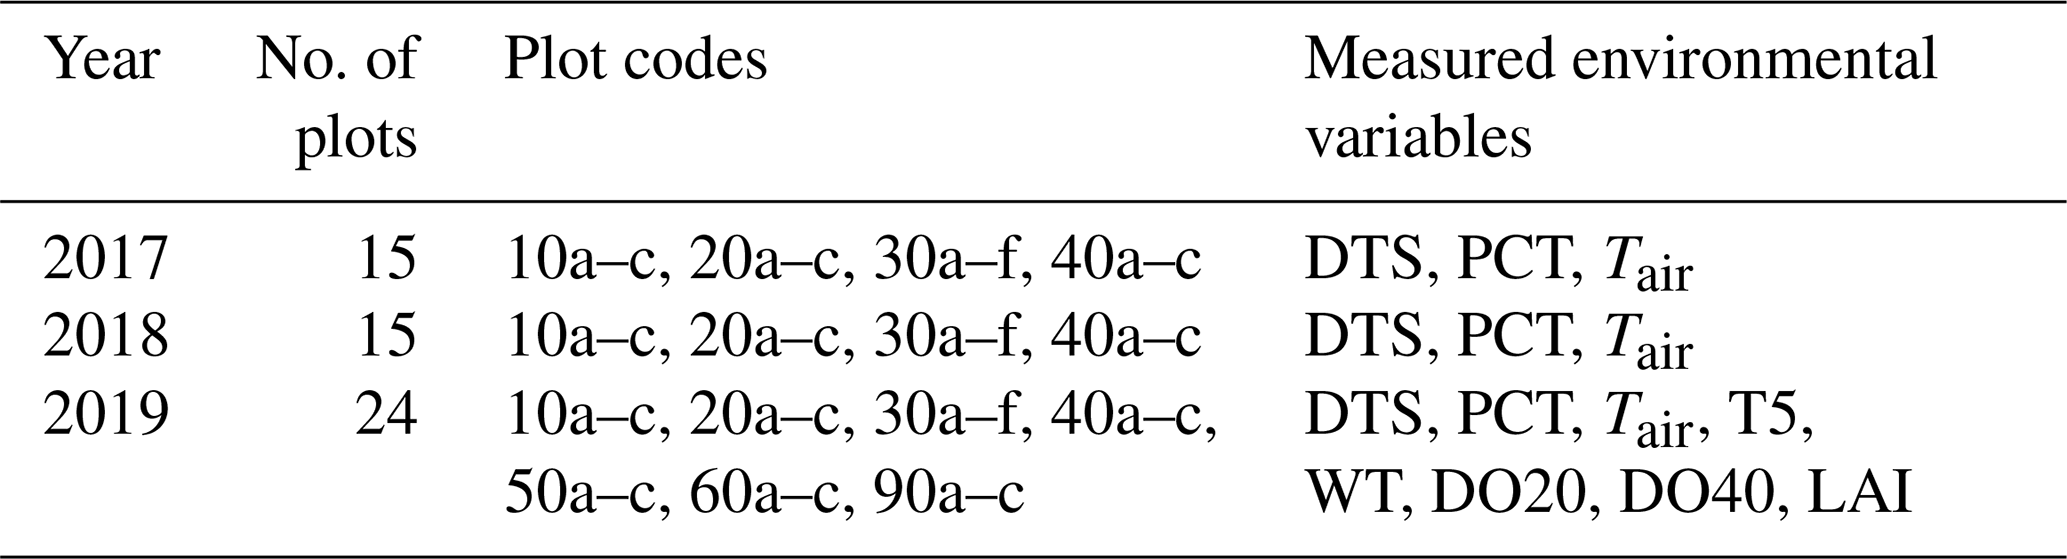
Table 1The methane (CH4) flux sample plot set-up and measured variables at Lompolojänkkä. DTS: distance to stream; PCT: plant community type; Tair: air temperature; T5: peat temperature at 5 cm depth below the moss surface; WT: water table; DO20 and DO40: dissolved oxygen concentration at 20 and 40 cm below the peat surface respectively; LAI: leaf area index.
2.2 Sampling and sample plot set-up
To quantify the spatial variability in CH4 fluxes in the valley fen, we installed 15 permanent sample plots 60 cm × 60 cm (width × length) at varying distances from the stream in 2017 (Table 1). The sample plots were set up as sets of three to six plots that were typically located within a metre of one another. Initially, the closest set from the stream was located within a distance of 10 m, and the furthermost was located at a distance of 40 m. In 2019, we sought a better mechanistic understanding of the controls on CH4 fluxes; thus, we added nine more sample plots, located in three sets at 50, 60, and 90 m from the stream (Table 1).
In total, 24 permanent gas flux measurement plots were established (Table 1, Fig. 1c). The sample plots are coded according to their distance to the stream or to visible flowing water as 10a–c (a set within 10 m of the stream with three replicates a–c), 20a–c, 30a–f, 40a–c, 50a–c, 60a–c, and 90a–c. The location of each plot was measured with a Trimble R8 GPS device with ± 5 cm accuracy, and the distance to the stream from each sample plot was calculated based on the National Land Survey of Finland topographic database.
2.3 CH4 and CO2 flux measurements
Seasonal CH4 and CO2 (dark respiration) fluxes were measured for 3 years (2017–2019) in sample plot sets 10–40, and for 1 year (2019) in sets 50–90. Measurements in sets 10–40 were conducted 8 times in 2017 (between 13 June and 29 September), 11 times in 2018 (between 30 May and 11 October), and 15 times in 2019 (between 20 May and 11 September). In sets 50 and 90, measurements were conducted 11 times in 2019, and 21 measurements were performed in set 60. In total, these measurements yielded 126, 163, and 330 CH4 flux records for 2017, 2018, and 2019 respectively.
For determining fluxes, the closed chamber method with fixed collars was used for sets 30–90, and a floating chamber method without collars was employed for sets 10 and 20 (Alm et al., 2007). The size of the opaque aluminium chamber was 60 cm × 60 cm × 40 cm (width × length × height) and each chamber was equipped with a fan. The sample gas was sucked from the chamber at a flow rate of 200–200 mL min−1 using 50 m long tubing (d=6 mm) into a LGR gas analyser (LGR GCA-24p-EP, model 911-0011-0004, Los Gatos Research Inc., Ca, USA) located in a temperature-controlled cabin. The duration of one measurement was approximately 5 min. The floating chamber (60 cm × 60 cm × 30 cm) was used at plots with permanently high, flowing water. In addition, gross primary production (GPP) was measured in sets 10–40 using a transparent chamber on 24–25 July 2019 at the time of peak growing season. The same gas analyser as described above was used. Photosynthetically active radiation in the chamber was measured using a Kipp & Zonen PQS1 PAR quantum sensor (Kipp & Zonen B.V., Delft, the Netherlands). In order to fit a light-response curve to the net CO2 exchange (NEE) data, NEE was first measured in full light, after which the chamber was covered with fabrics to create four different light levels (white shade, black shade, double black shade, and double black with green shade). In addition, one measurement with full shading to capture dark respiration was performed.
The CH4 and CO2 fluxes from each measurement were calculated from the linear slope (R2 > 99 % for over 90 % measurements and R2 > 90 % for other measurements) in gas concentration over time, taking chamber volume, chamber air temperature, and air pressure at the measuring point into account. The volume in the chamber during each measurement was specified according to the instant ambient water level. The air temperature and air pressure data were derived from the nearest meteorological station, and air pressure was calibrated for each chamber, taking the altitude of the plot into account. We determined the GPP–light response curve for each sample plot (based on the NEE measurements with the transparent chamber), and we derived sample-plot-specific GPPmax values at a photosynthetic photon flux density level of 800 µmol m−2 s−1.
2.4 Environmental data collection
To reach a mechanistic understanding of the spatial pattern of CH4 fluxes, we collected data on the potential environmental factors that control emissions in combination with each flux measurement conducted in 2019. These factors were air and peat temperature, water table, dissolved oxygen concentration, leaf area index, and plant community cluster (Table 1).
Air temperature was either measured using a temperature sensor fixed inside the chamber or it was measured at 2 m height at the site (Lompolonvuoma meteorological station of the Finnish Meteorological Institute, FMI). Peat temperature was measured at 5 cm below the moss surface (T5) using a Pt100 thermometer (Omega HH376, Omega Engineering Inc., CT, USA). The water table relative to the moss surface (WT) was measured from a plastic tube installed in the peat next to each sample plot. Dissolved oxygen concentrations (percent of air saturation) at 20 (DO20) and 40 cm (DO40) below the surface (except for set 60) were measured using a YSI Professional Series digital handheld meter.
The leaf area index (LAI) of four vascular plant functional types (PFTs; deciduous shrub, evergreen shrub, forb, and graminoid), and moss cover were estimated. The estimation of the LAI followed Juutinen et al. (2017). First, we selected 31 square plots (50 cm × 50 cm) located within the fen and surrounding areas in July–August 2019, estimated green projection cover (%), and measured the mean height for each PFT in the plots. Second, to measure the LAI of the samples, we harvested the above-ground parts of the vascular plant species, scanned them with an A4 scanner, and calculated the proportion of green pixels in GIMP 2.8 (The GIMP Team, https://www.gimp.org/, last access: 1 November 2019). Third, we constructed empirical relationships between cover or plant volume (cover × height) and the LAI with ordinary least squares (OLS) regressions for four PFTs found at the site. We chose the optimal predictor (cover or volume) by minimizing the root mean square error value; in the final models, the adjusted coefficient of determination (Adj. R2) varied between 0.73 and 0.89 (Table A1). Fourth, we used the equations from the OLS regressions to model seasonal LAI development curves for each CH4 sample plot in which we had measured green projection cover and height for the four PFTs throughout the summer of 2019. Finally, we derived LAI values for each flux measurement time from the seasonal LAI development curves. We also calculated LAI values for the aerenchymous plants in each plot, which included C. aquatilis, C. canescens, C. chordorrhiza, C. lasiocarpa, C. limosa, C. rostrata, Comarum palustre, E. fluviatile, Eriophorum vaginatum, and Menyanthes trifoliata. The calculation of aerenchymous LAI was carried out by applying the same OLS regression equations used for forb and graminoid PFTs to datasets that included only aerenchymous plant species.
In addition, we delineated four plant community types or clusters for the CH4 sample plots as follows. First, we calculated the Bray–Curtis distance matrix of the plant species projection cover data from the sample plots in addition to 200 systematically sampled vegetation plots that were inventoried in the fen in 2018. Second, we derived four non-metric multidimensional scaling ordination (NMDS) axes from the distance matrix. Third, we delineated four plant community clusters from the NMDS axes with the partitioning around medoids (PAM) method. The clustering was conducted in R using the “vegan” (Oksanen et al., 2019) and “cluster” (Mächler et al., 2019) packages. A map showing the location of the vegetation community clusters at the study site can be found in Fig. A2.
2.5 Data analysis
NMDS was used to explore the linkages between peak season vegetation composition, distance to the stream, biomass production, and flowing water. Peak season total LAI was used as a proxy for biomass production, and early summer DO20 and DO40 were used as proxies for flowing water and nutrient availability. For a robust analysis, plant species with an occurrence lower than 3 % were excluded from the analysis.
Linear mixed-effect models were applied to the CH4 flux and environmental data to identify the potential drivers of CH4 flux using two different approaches. First, we explored the spatial variation in CH4 fluxes by constructing a model with CH4 data from all 3 measured years. Here, potential fixed predictors for CH4 flux were distance to the stream, air temperature, and the factorial plant community cluster. To account for repeated measurements, we included the nested random effects of year, month, and measurement plot. Second, to gain a more mechanistic understanding of the controls on CH4 fluxes, we used a dataset with additional variables gathered during 2019. Here, potential fixed predictors were DO20; DO40; T5; air temperature; WT; GPPmax; LAI of all vascular, aerenchymous, and ericoid plants; moss cover (% coverage); CO2 dark respiration; distance to the stream; and the factorial plant community cluster. To account for repeated measurements from the plots over the growing season, we included the crossed random effects of measurement day and plot.
In building the models, we manually added the potential fixed predictors one by one and tested whether the resultant, more complex model was significantly better than the model without the added predictor, using a conditional F test and the Akaike information criterion (AIC). To account for the nonlinear relationship between CH4 flux and some environmental variables (such as temperature), we tested several response shapes for the fixed predictors: (i) linear response; (ii) quadratic response; (iii) linear response above or below a certain threshold value but constant otherwise; and (iv) quadratic response above or below a certain threshold value but constant otherwise. In cases (iii) and (iv), the response type and threshold value were determined visually by plotting the residuals of the previous model against the fixed predictor to be added. The final response shape and threshold value were selected based on the conditional F test and AIC values. Furthermore, we tested the interactions between all fixed predictors in the final models and only included those predictors that led to a significant improvement in model performance. The first explorative model was fitted with the “lme” function from the “nlme” package, and the second, more complex and mechanistical model was fitted with “lmer” function from the “lme4” package in R.
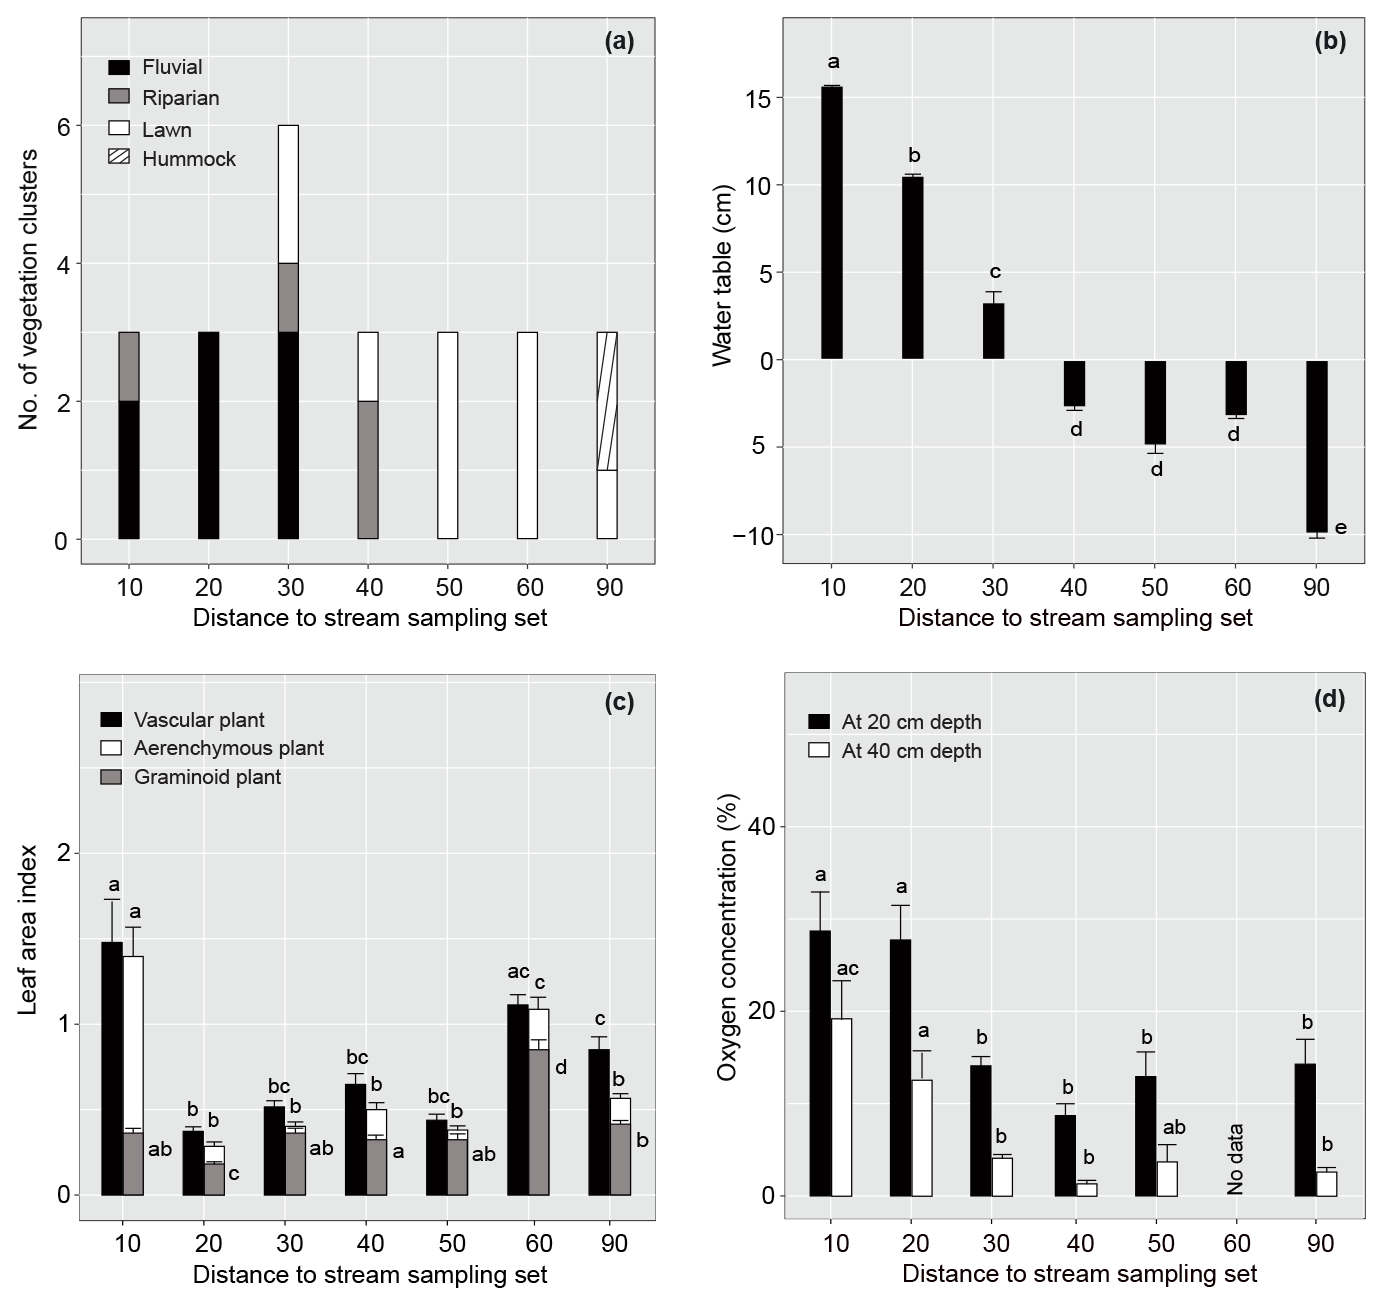
Figure 2Spatial variation in vegetation and environmental factors in relation to the distance of the sample plot set from the stream in summer 2019. (a) Occurrence of different plant community types, (b) mean (± standard error) water table relative to peat surface (cm), (c) vascular, aerenchymous and graminoid plant leaf area index, and (d) dissolved oxygen concentration at 20 and 40 cm below the peat surface for each sample plot set. Note that dissolved oxygen concentration was not measured in set 60. Different letters above the bars indicate significant differences (p<0.05) between the sample plot sets calculated using Tukey's honest significant difference method. For species composition in the different plant community types, see Fig. 3 and Table A2.
3.1 Variations in vegetation and environmental factors
The studied valley fen exhibited clear but distinctive patterns in vegetation composition, WT, LAI, and DO concentrations related to the distance from the stream (Figs. 2 and A2–5). Moreover, the temporal patterns in WT and the DO concentration showed distinct variations at locations further away from and closer to the stream respectively (Fig. A4).
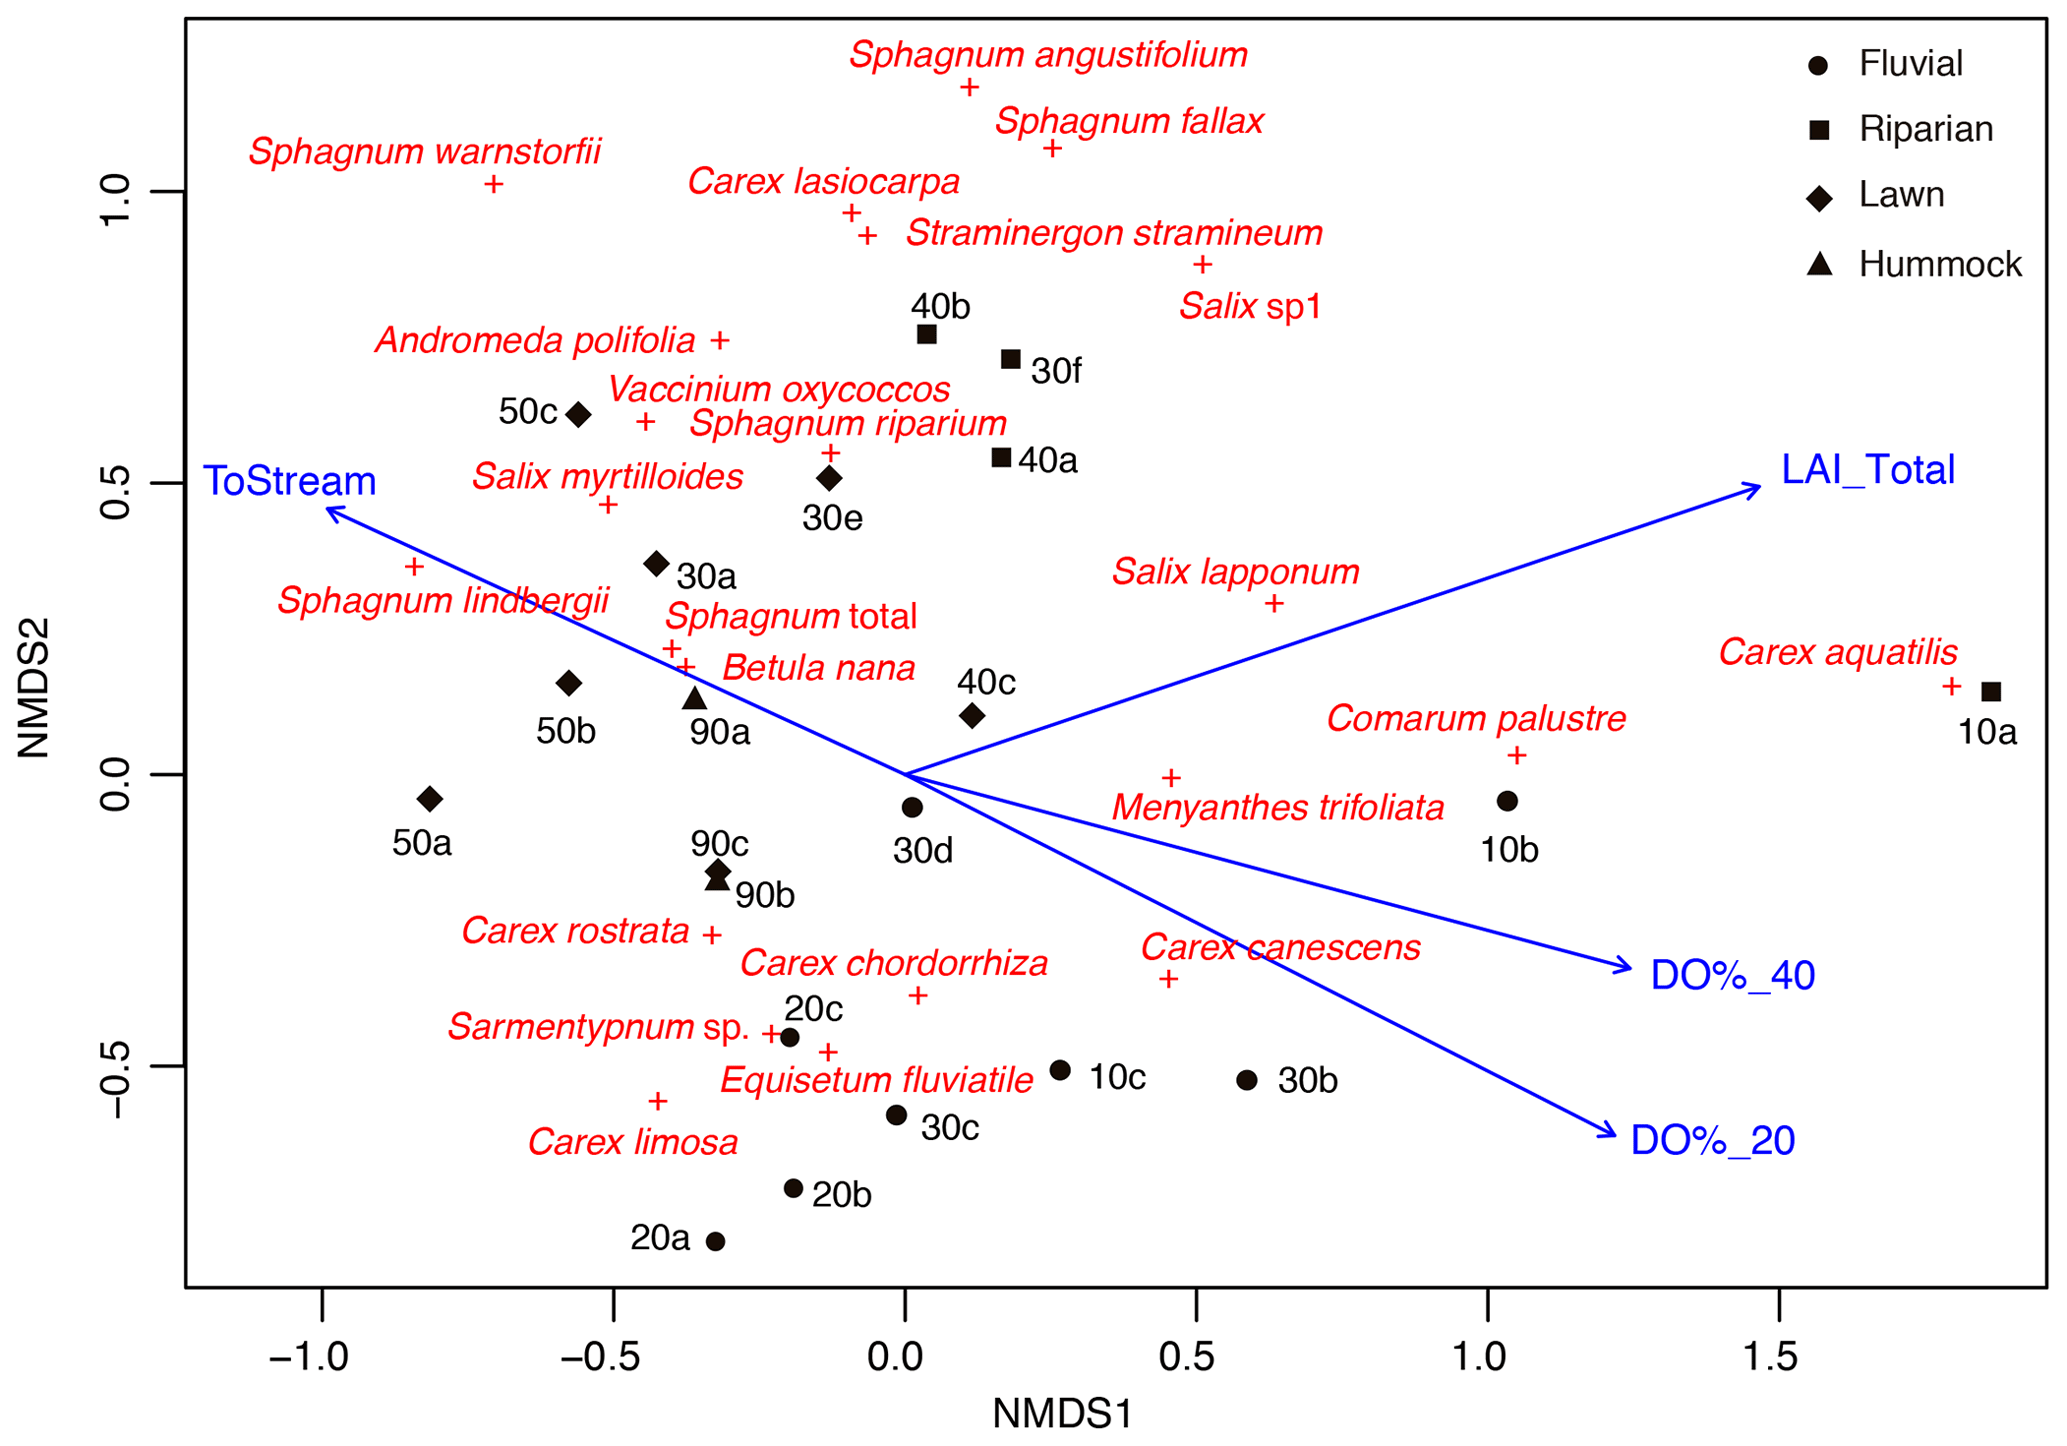
Figure 3Non-metric multidimensional scaling (NMDS; stress 0.15) ordination showing the peak season (late July) vegetation structure in the sample plots, including distance to stream (ToStream, p=0.042), peak season (early summer) dissolved oxygen concentration at 20 cm (DO%_20, p=0.006) and 40 cm depths (DO%_40, p=0.015), and peak season (late July) total vascular plant leaf area index (LAI_Total, p=0.003) as fitted environmental variables. Four plant community types that were derived from the regional vegetation data are indicated using different symbols.
In total, four plant community types were identified (Fig. 3, Table A2). Community type (1) “fluvial”, which was found in the wetter parts of the fen, was dominated by E. fluviatile and C. limosa. Community type (2) “riparian” represented riparian vegetation that was taller, such as C. aquatilis, S. lapponum, S. phylicifolia, and Comarum palustre. Community type (3) “lawn”, and community type (4) “hummock” contained vegetation typical of drier fen conditions, with the hummock type found in the driest areas. The dominant species in these community types included S. riparium, Vaccinium oxycoccos, and C. livida (lawn), and S. russowii, V. uliginosum, B. nana, and Rubus chamaemorus (hummock). The overriding pattern was related to the distance to the stream (Fig. 2a and A2), i.e. fluvial and riparian community types were recorded in the locations closest to the stream, whereas lawn and hummock types were located at the plots furthest from the stream. In addition, the plant communities in the sample plots were suggestive of a spatially heterogeneous structure in the fen, i.e. different types were recorded within a short distance (Figs. 2a, 3). The NMDS ordination (Fig. 3) revealed that the main pattern in vegetation structure related to the distance to the stream was correlated strongly with, and was better explained by, the peak season oxygen concentration. Total LAI increased with the peak season oxygen concentration, which was negatively correlated with distance. Aquatic species, such as C. aquatilis and species that typically benefit from moving water, such as S. lapponum, C. palustre, and M. trifoliata, exhibited relatively high positive values on the first NMDS axis, revealing a strong relationship between the stream and some specific plant species. Species adapted to drier surfaces, such as S. warnstorfii, were located at the other end of the axis. As peak season GPP data were only available for sets 10–40, they were not included in the NMDS analysis, but they were analysed separately against oxygen concentration and total vascular LAI data (Fig. A6). GPP was clearly higher closer to the stream (> 0.45 mg CO2 m−2 s−1) than further from the stream (< 0.35 mg CO2 m−2 s−1). In addition, GPP was strongly related to the total vascular LAI, at least when the LAI < 2. In the only sampling point with an LAI value > 2, GPP did not increase any further.
The WT pattern at the sample plots was strongly linked to their distance to the stream, i.e. the WT was higher closer to the stream (Fig. 2b). At sample sets 10 and 20, close to the stream, there was approximately 10 cm of water above the peat surface, whereas in set 90, furthest from the stream, the WT was approximately 10 cm below the surface. The other sets displayed intermediate WT values. In general, the lowest (deepest) WT levels were measured at all sample plots during late July, when precipitation was low and the air temperature had reached the seasonal peak (Figs. A4, A7).
The sample plots located next to the stream (set 10) showed significantly larger mean seasonal vascular LAI values (mean 1.5) but were similar to set 60 (with lawn vegetation) (Fig. 2a, c). Sets 10 and 60 both showed significantly higher aerenchymous LAI values than the other sets (∼ 0.5), although set 10 (mean 1.4) had a significantly higher value than set 60 (mean 1.1) (Fig. 2c). Plot 10a appeared to be an outlier with higher total and aerenchymous LAI values (∼ 4) than the other plots (>2), which was attributed to the presence of the abundant forb C. palustre in that plot (Fig. A3). Graminoid LAI values (that excluded C. palustre and two other occasionally recorded species: M. trifoliata and E. fluviatile) were significantly higher in set 60 (mean 0.8) than in the other sets (< 0.5). The development of the LAI showed a clear seasonal pattern (Fig. A5), with the peak occurring around late July.
Dissolved oxygen concentrations at both 20 and 40 cm depths showed a similar spatial pattern, with higher concentrations recorded close to the stream (in sets 10 and 20) (Fig. 2d). However, large temporal variations existed in DO values at both the 20 and 40 cm depths, which generally peaked in early summer during a high flow of water (Fig. A4). Also, DO concentrations showed a similar temporal pattern to precipitation, with higher concentrations recorded during periods with higher precipitation (Figs. A4, A7).
The proximity of the stream reduced the temporal variation in the peat temperature measured at 5 cm depth in 2019 (Fig. A4); while the temperature at sample plots further away from the stream (sets 50–90) varied between 3 and 23∘ C, and the temperature at sample plots close to the stream (sets 10–40) stayed between 7 and 15∘ C.
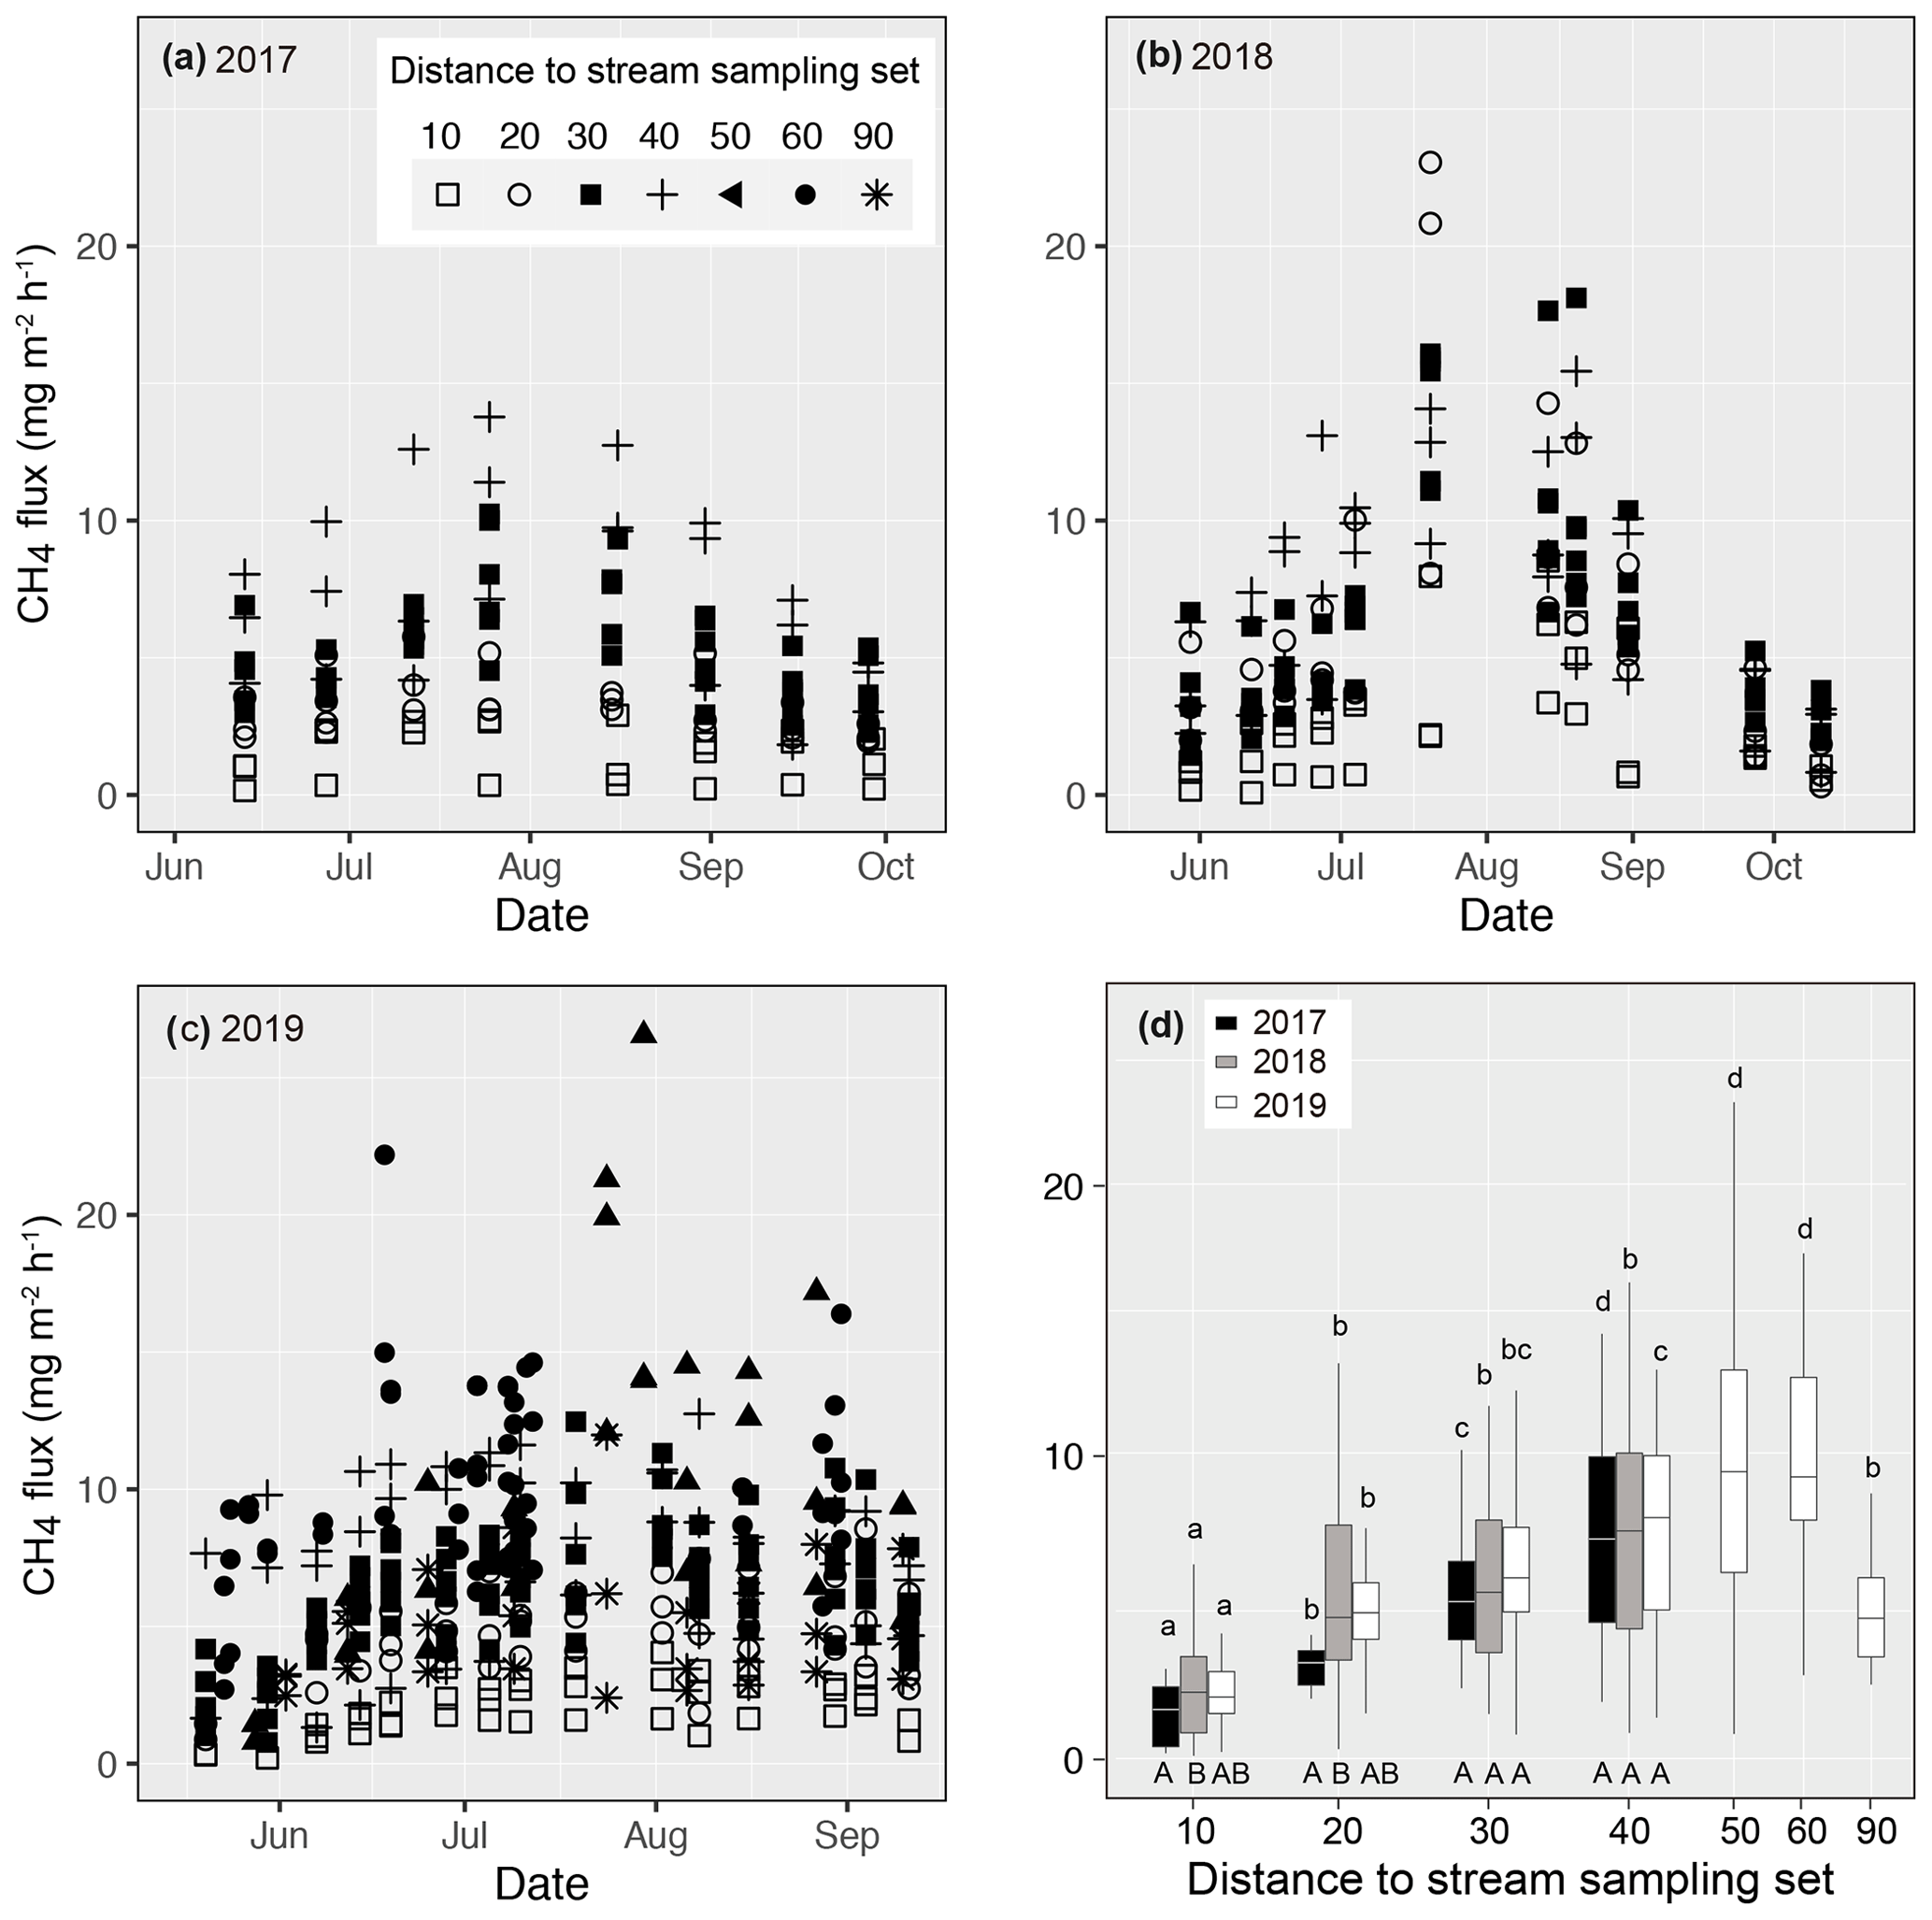
Figure 4Measured methane (CH4) fluxes during the growing season in (a) 2017, (b) 2018, and (c) 2019 at Lompolojänkkä. The distance from the sample plot sets to the stream are indicated by different symbols. (d) Box plots of CH4 fluxes for each measurement set in 2017, 2018, and 2019. The different letters on top of the box plots indicate significant differences (p<0.05) between the sets for each year, calculated using Tukey's honest significant difference method, and the different letters below the box plots indicate significant differences (p<0.05) between the studied years for each set.
3.2 Variations in CH4 fluxes
Measured CH4 fluxes ranged from 0.16 to 13.78, from 0.08 to 23.05, and from 0.21 to 26.55 mg m−2 h−1 in 2017, 2018, and 2019 respectively (Fig. 4). In all 3 years, CH4 fluxes increased gradually from the early summer, peaking in early August, after which the fluxes decreased. In 2018 and 2019, higher fluxes (> 20 mg m−2 h−1) were observed in the middle of the growing season compared with 2017 (< 15 mg m−2 h−1).
Even though there were variations in CH4 fluxes within each of the replicated sample plots for each sample set, clear spatial patterns related to their distance to the stream were also evident (Fig. 4). In all 3 years, CH4 fluxes next to the stream (set 10) were the lowest. In 2019, when additional sample plots were established (see Sect. 2), fluxes peaked at a distance of 50 m from the stream. In the previous 2 years, when sampling only took place to a distance of 40 m from the stream, there was an increasing trend in fluxes with distance. In 2017, CH4 fluxes measured from the various sample plot sets were significantly different from one another. In 2018, CH4 fluxes from sets 20–40 were similar, but they were significantly higher than the sets located next to the stream (set 10).
Close to the stream, CH4 emissions differed between years; emissions from sets 10 and 20 were significantly lower in 2017 than in 2018, while emissions in 2019 were intermediate and did not differ from the previous 2 years. At the intermediate distance (sets 30 and 40), CH4 emissions were at the same level in all 3 years.
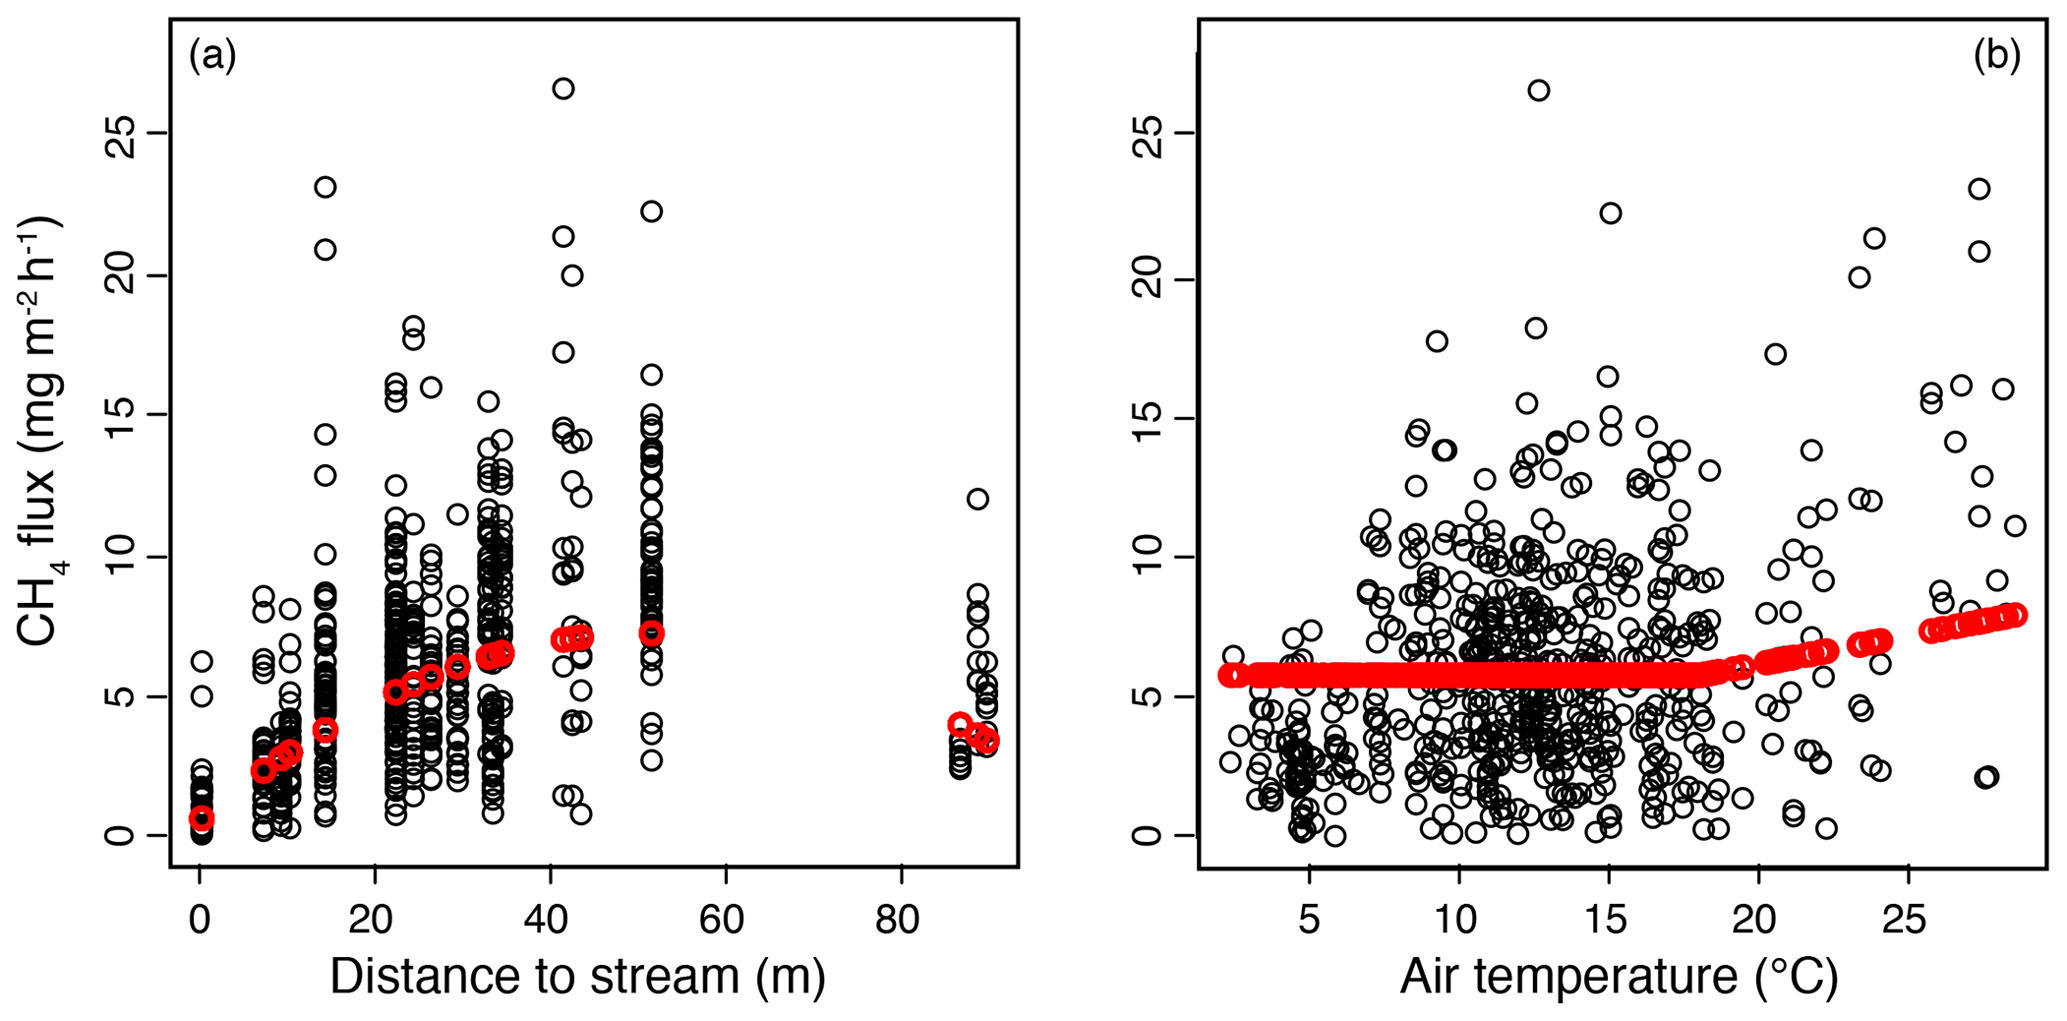
Figure 5Results of the mixed-effect model constructed to examine the spatial variation in methane (CH4) fluxes in the valley fen using a 3-year dataset. Response curves (in red) of CH4 flux to (a) distance to stream, with the air temperature kept constant at 18∘ C, and (b) air temperature, with the distance to stream kept constant at 27 m (mean value of the dataset).
3.3 Response of CH4 fluxes to environmental forcing
In the mixed-effect model (3-year dataset), which was constructed to examine spatial variability, CH4 fluxes were controlled by the distance to the stream and by air temperature (fixed predictors), whereas plant community type was not a significant predictor when distance to the stream was included (Table A3a). There was a quadratic relationship between CH4 fluxes and distance to the stream, with the highest fluxes observed at an intermediate distance (Fig. 5a). There was a positive linear correlation between air temperature and CH4 fluxes only at temperatures above a threshold value of 18∘ C. Below that threshold, CH4 fluxes remained unaffected (Fig. 5).
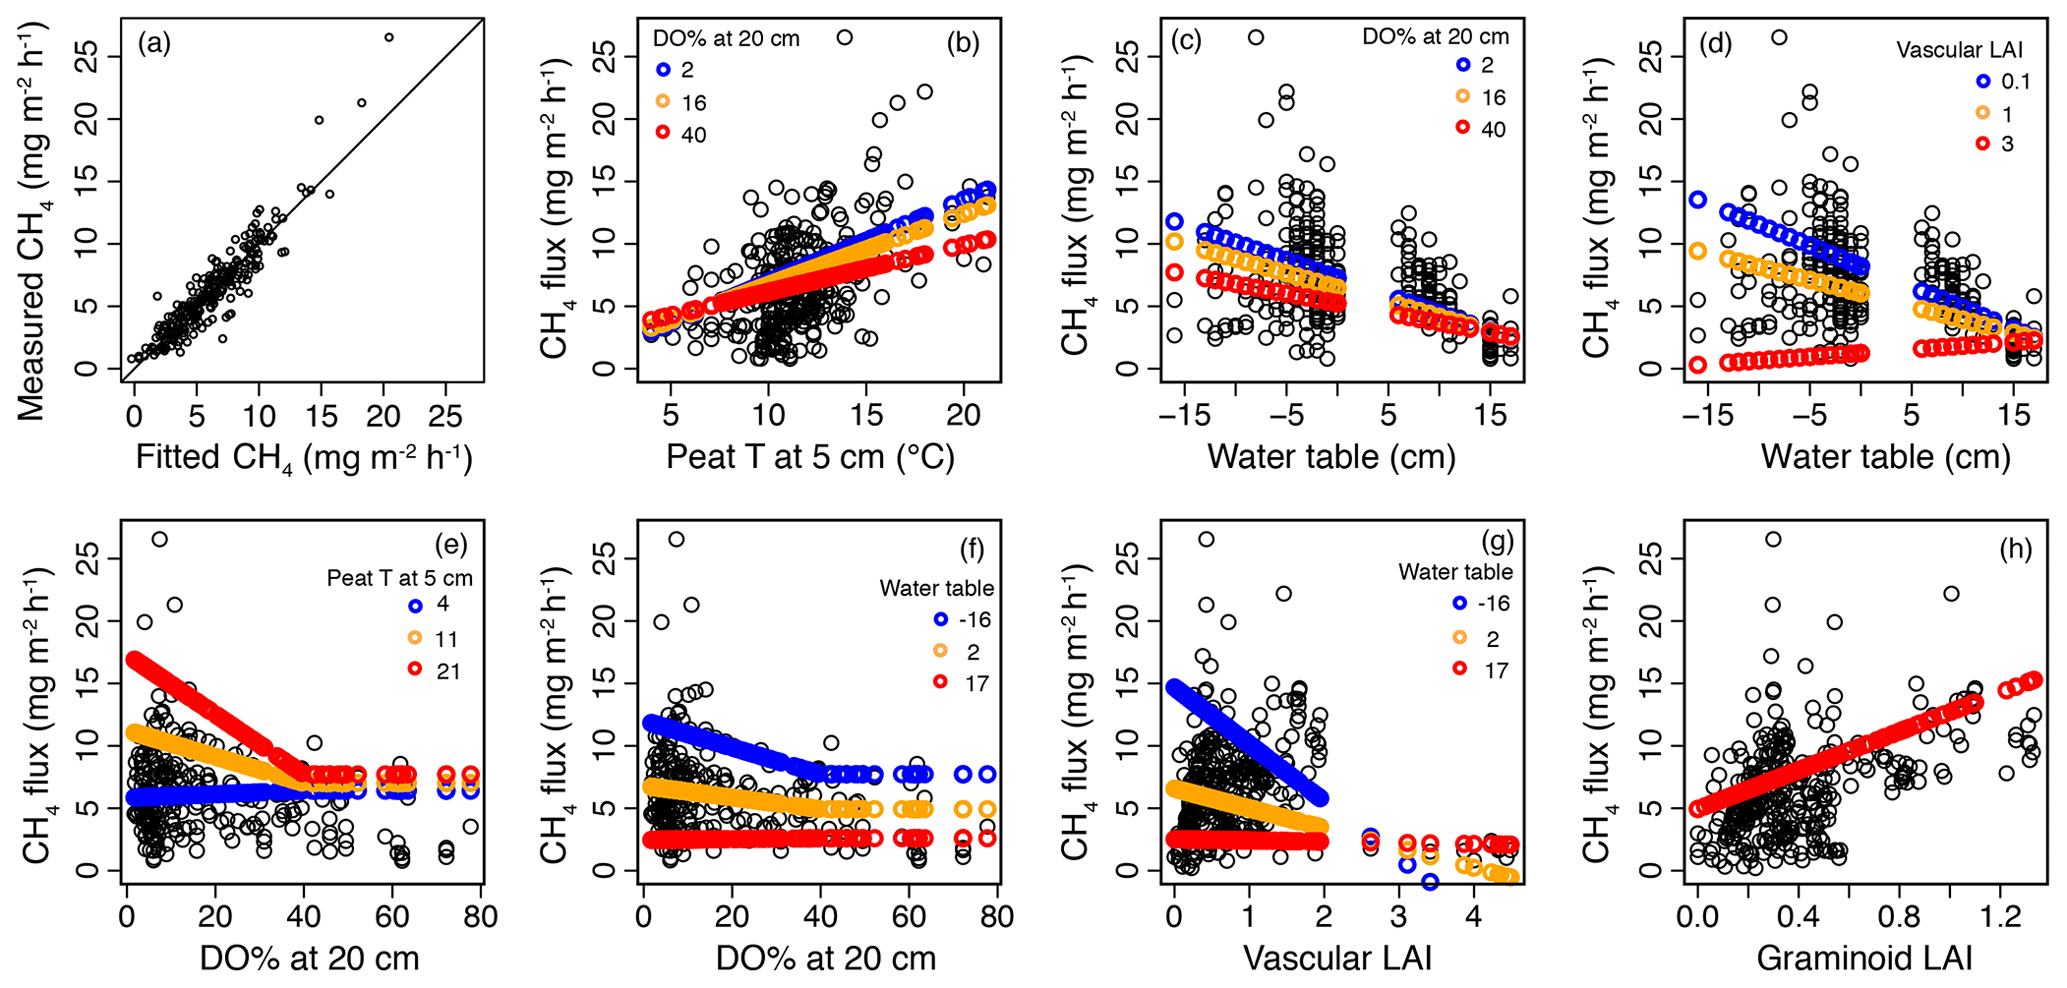
Figure 6Results of the mixed-effect model, which was constructed to provide a robust mechanistic understanding of the controls of methane (CH4) flux in the valley fen using the 2019 dataset. (a) Measured CH4 flux values plotted against fitted values of the mixed-effect model. (b–h) Response curves of CH4 flux to (b) peat temperature (T) at 5 cm below the surface, (c, d) water table, (e, f) dissolved oxygen concentration (DO %) at 20 cm below the surface, (g) vascular plant leaf area index (LAI), and (h) graminoid plant LAI with the interactive variable adjusted at three different levels (rounded minimum, average, and maximum values of the observed dataset; indicated by three different colours) and the other variables kept constant. When setting variables as constant, the median values of the dataset were chosen, i.e. 11∘ C for peat T at 5 cm, −11 (response to DO % at 20 cm) and −1 cm (other responses) for water table, 7 for DO % at 20 cm (when < 40 %), 0.6 for vascular LAI, and 0.3 for graminoid LAI.
In the second model (2019 dataset), which was constructed to provide a robust mechanistic understanding of CH4 dynamics in the fen, the temporal and spatial variation in CH4 flux were found to be best explained by peat temperature at 5 cm (T5), WT, DO concentration at 20 cm below the surface (DO20), graminoid LAI, and vascular LAI as fixed predictors (Fig. 6, Table A3b). When DO20 was included, the distance to the stream and plant community type were not significant predictors. Of these predictors, DO20 linearly decreased the flux until a threshold value of 40 % was reached, above which it remained constant, whereas there was a linear relationship between CH4 fluxes and the other predictors (Fig. 6). Both T5 and graminoid LAI were observed to linearly increase CH4 fluxes, whereas fluxes were negatively correlated with WT and vascular LAI (i.e. fluxes were lower at higher water levels and greater vascular LAI values). DO20 interacted with T5 and WT (Fig. 6e, f), so that DO20 decreased the CH4 flux more steeply at higher T5 and lower WT values. Also, T5 and WT responses were steeper at low DO20 values. Furthermore, vascular LAI had less impact on CH4 flux at high WT levels.
4.1 The role of the stream in driving fen vegetation and biomass production
As hypothesized, (H1) the spatial heterogeneity in environmental variables in this valley fen site was highly related to the distance from the stream. Peatlands typically have spatially heterogeneous microhabitats due to wide variations in hydrology and nutrient availability (Rydin and Jeglum, 2013), which impact microbial activities and subsequent CH4 emissions (Juottonen et al., 2005, 2015; Noyce et al., 2014; Ström et al., 2003). The water table level is one of the most important influences on plant occurrence and growth in peatlands (Rydin and Jeglum, 2013); in this study, it was highest closer to the stream. As a result, hydrophilic species, such as C. aquatilis, S. lapponum, C. palustre, and M. trifoliata, were abundant in places close to the stream. Even though we did not measure the chemical composition of the water, the abundance of these species implies a minerogenic supply established by water flow (Wassen et al., 1990).
The observed positive link between early summer oxygen concentrations (a proxy for flowing water) and total LAI further confirmed that flowing water likely delivers more nutrients and better supply plant growth and photosynthesis and, therefore, provides more C substrates for microbial activities (Bellisario et al., 1999). In addition, GPP, the key driver of the peatland C cycle (Whiting and Chanton, 1993), which influences peatland vegetation composition and abiotic factors such as air temperature and water level (Peichl et al., 2018), was consistently higher in plots located nearer the stream. Similarly, dissolved oxygen concentrations that acted as a proxy for the mineral–nutrient-rich water were also higher in those plots. It has been shown that increased water supply alone can cause substantial increases in biomass on nutrient-rich soils, while fertilization and nutrient addition has little effect (Eskelinen and Harrison, 2015). As such, the forbs and mosses that dominate such wet fens might benefit from higher water tables for biomass production (Mäkiranta et al., 2018). In this study, as the stream can bring both water and nutrients to the site at the same time, we are not able to distinguish whether the impact of the stream on the vegetation at our site was caused by the water, by the nutrient supply, or by both. Nevertheless, our results suggest that flowing water acted as a decisive factor in peatland vegetation composition and biomass production via the addition of either water or nutrients. Therefore, the stream is likely to play a key role in regulating peatland CH4 emission patterns.
4.2 The role of stream-induced microhabitats in driving CH4 emissions
Consistent with our second hypothesis, (H2) the overall pattern of CH4 fluxes showed clear spatial variations in relation to the distance from the stream. The impact of the stream was greater than the influence of vegetation community types, which represent general microform conditions and have been commonly reported to regulate CH4 emissions (e.g. Riutta et al., 2007). Specifically, as expected in the third hypothesis (H3), factors such as peat temperature at 5 cm depth (T5), WT, DO20, and LAI, which were to some extent shaped by the stream, were all significant factors in driving CH4 emissions at this site.
Our data suggest that CH4 emissions increased with higher T5 values, in a similar fashion to many previous studies (e.g. Korrensalo et al., 2018; Rinne et al., 2018). Rising temperature is known to increase the activity of CH4-producing microbes and to enhance CH4 transport through aerenchymous plants (Dunfield et al., 1993; Grosse, 1996; Kolton et al., 2019). Higher DO20 values were found to decrease temperature sensitivity. This pattern implies that, in the fertile conditions next to the stream, higher oxygen concentrations in the cool water limits emissions by suppressing CH4 production or by enhancing oxidation and that warming of the water removes this limitation. Similar to the CH4 response to T5, higher DO20 values also reduced the impact of the WT position on CH4 emissions. Both responses highlight the importance of oxidation when considering how CH4 emissions respond to environmental changes (Song et al., 2020). The patterns might also indicate higher CH4 production under warmer conditions within the catchment and, consequently, higher CH4 concentrations in the flowing water (Juutinen et al., 2013). However, in this study, we were not able to determine the origin of the emitted CH4.
In our sampling campaign, WT levels were observed both above and below the soil surface, and CH4 emissions were found to generally decrease with rising WT levels. This decrease is in contradiction to many other studies that mainly cover sites with WT levels below the soil surface (Bubier et al., 2005; Pelletier et al., 2007; Turetsky et al., 2008). However, low emissions were also observed in the drier parts of the fen, which is in agreement with previous studies, in addition to very low emissions observed close to the stream. The lower emissions and a generally unimodal response to the WT level were overridden in the whole dataset by the much stronger pattern captured close to the stream. Two plausible explanations for the observed WT–CH4 emission pattern are as follows: (1) the potential CH4 production zone is smaller and the potential CH4 oxidation zone is larger under drier conditions (Lai, 2009), and (2) under wet conditions, where there is moving water, lower CH4 emissions can be attributed to enhanced CH4 oxidation in the oxygen-rich water column and a lower CH4 production rate due to the presence of oxygen (Bubier, 1995). Also, cooler peat temperatures due to the higher water table and flowing water likely contribute to a lower CH4 production rate.
In our study, vascular LAI was found to have a negative linear correlation with CH4 emissions. Plots nearest the stream had the highest vascular LAI values but the lowest CH4 fluxes, i.e. the impact of the stream was again predominant over the impact of LAI. Studies have shown that shrubs can hinder CH4 production because of their poor-quality substrate for methanogenesis (Riutta et al., 2020; Yavitt et al., 2019), although the cover of shrubs at our study site was very small. Therefore, low CH4 emissions at high vascular LAI values are likely due to in situ lower peat temperature and the higher oxygen concentrations caused by the moving water. As aerenchymous LAI showed a very similar pattern to vascular LAI, it was not included in the mechanistic model. Instead, graminoid LAI, which was not impacted by the stream, showed a positive link with CH4 emissions, which is in line with several previous studies (e.g. Bhullar et al., 2013a, b). The exceptionally high CH4 fluxes measured in set 50 where the graminoid LAI was low is potentially linked to one aerenchymous species growing in the set, i.e. E. vaginatum, which can enhance CH4 release and increase C substrate input to methanogens (Greenup et al., 2000).
In general, CH4 emissions in stream-dominated fens are likely to show a quadratic response pattern with regard to their distance to the stream, with low emissions occurring at both the closest and farthest locations from the stream, mainly due to high oxygen concentrations and water depletion respectively. The highest CH4 emissions were found in places at intermediate distances to the stream, which benefit from both sufficient water and nutrient supply but have inherently low soil oxygen concentrations. However, we acknowledge the challenge of defining the stream at our site due to the seasonal variation in catchment hydrological conditions. Hence, this study only demonstrates the stream–CH4 emission pattern, rather than providing quantitative information for projections.
4.3 Future peatland CH4 emission trajectories under climate change
Projection of global peatland CH4 emissions under different climate change scenarios is a major challenge due to the reported variabilities in emissions and also because of the interactions between the various environmental predictors (Strack and Waddington, 2007; Strack et al., 2004; Weltzin et al., 2000; Zhang et al., 2002). Our study further highlights that the impacts of climate change on CH4 emissions in flow-through peatland systems are even more complicated due to the additional effects of the flowing water, which poses a challenge for accurate predictions of the global CH4 budget. Nevertheless, despite the complexity, clear patterns emerged that are informative in placing current peatland habitat-based CH4 emission measurements into a broader context and supplement the current understanding of peatland CH4 emissions (Fig. 7).
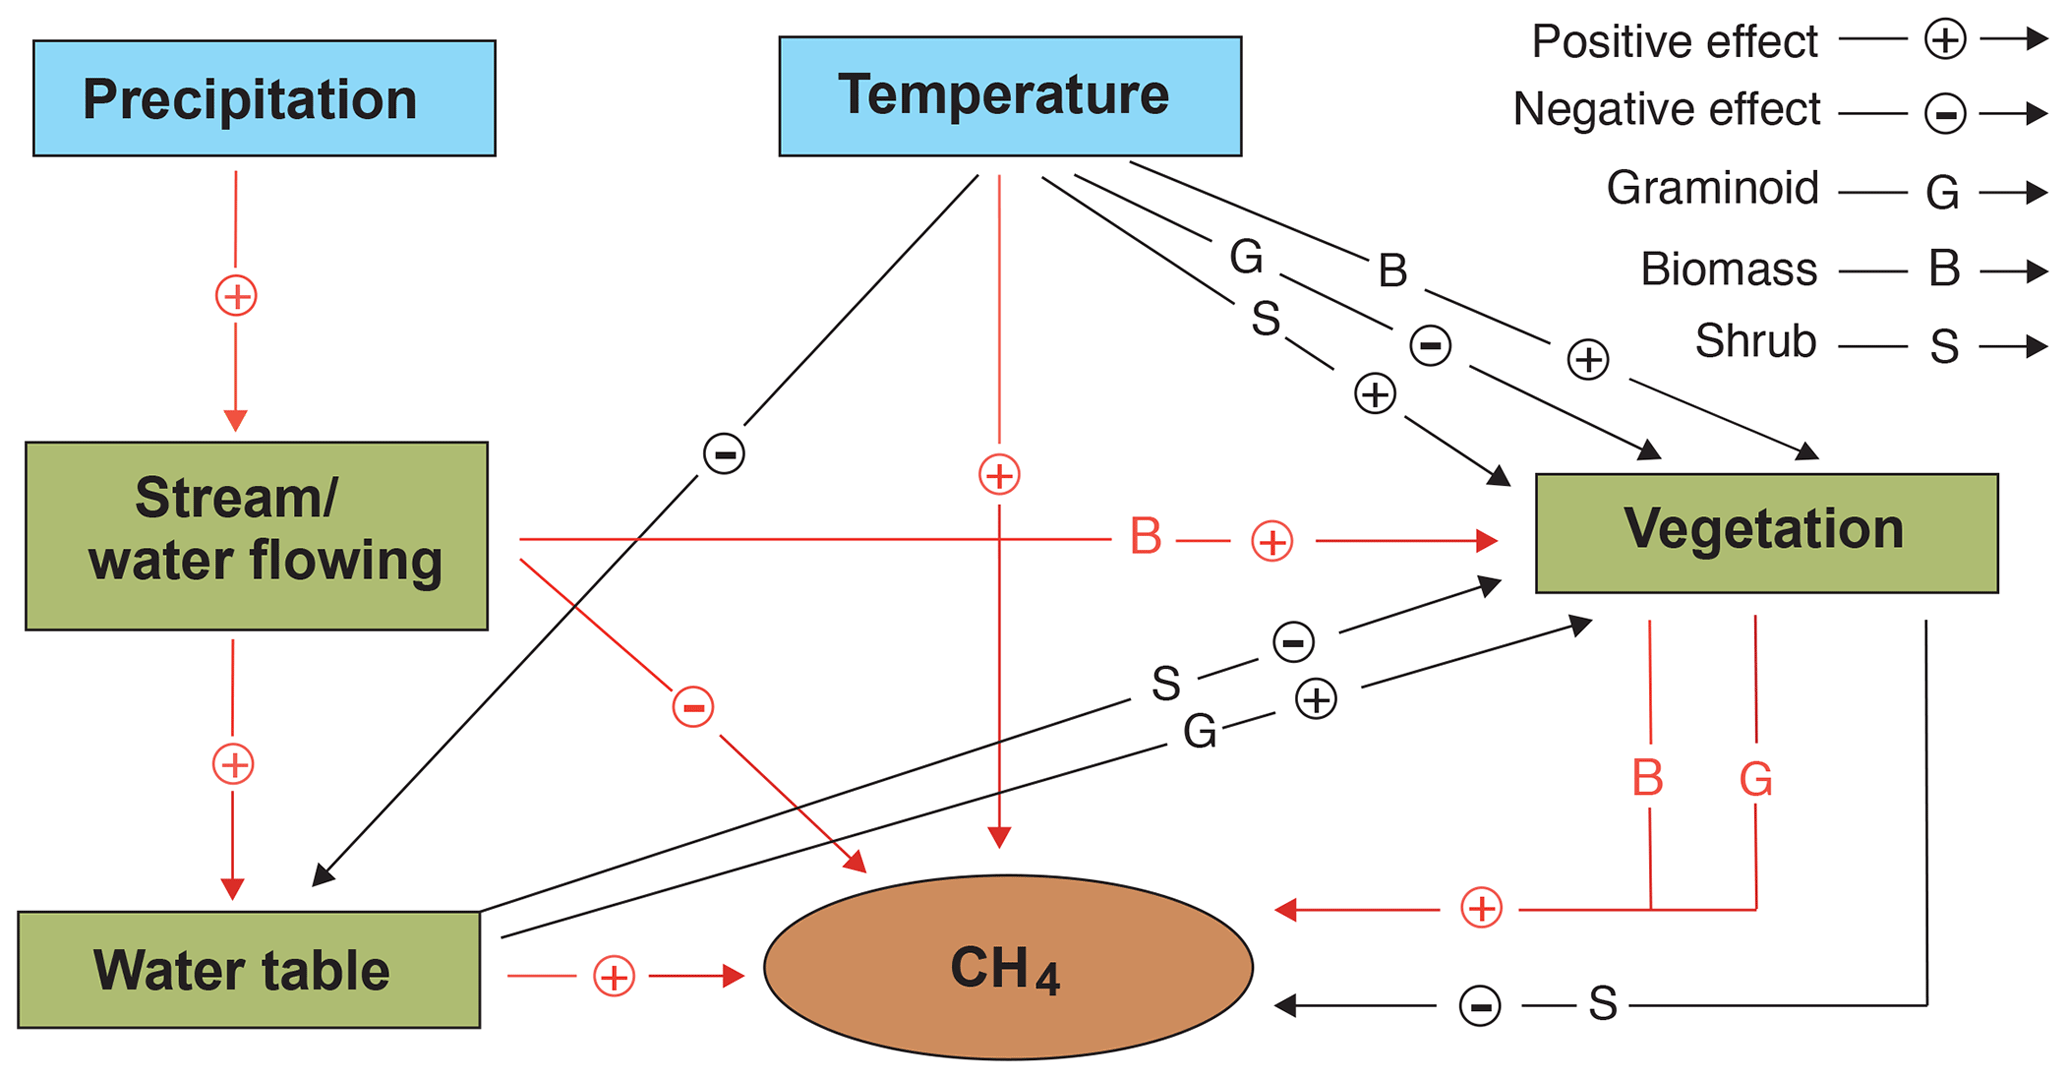
Figure 7Schematic illustration showing the potential independent and interactive impacts of precipitation, temperature, vegetation, and hydrology on methane (CH4) fluxes in northern peatlands. Arrows in red and black are derived from this study and previous studies respectively (e.g. Mäkiranta et al., 2018; Roulet et al., 1992; Yavitt et al., 2019).
The majority of peatlands are located in northern high latitudes where the climate is currently experiencing a greater rate of change than in other regions (Collins et al., 2013). Climate warming is expected to promote microbial activity and, therefore, faster C cycling. However, warming in tandem with drying has been shown to decrease the methanogenic archaea populations (Peltoniemi et al., 2015). In our study, vegetation composition, as such, was not a significant controller of CH4 emissions, although biomass production (GPP and LAI), influenced by the stream, was a very important controller as it likely provides substrates for methanogens. However, this is in contradiction to the suggestion that vegetation mainly influences CH4 emissions at minerotrophic sites by facilitating transportation, whereas at ombrotrophic sites it is through substrate-based interactions regulated by plant photosynthetic activity (Öquist and Svensson, 2002). Climate warming and/or peat surface drying can alter vegetation composition and affect the contribution of the biomass that is produced. For example, shrubs can benefit from these environmental changes, whereas forbs and mosses may suffer (Kokkonen et al., 2019; Mäkiranta et al., 2018; Strack et al., 2006). Even though such hydroclimatic impacts on vegetation might be modified by nitrogen availability (Luan et al., 2019), high latitudes generally experience little nitrogen deposition (Du et al., 2020). The abundance and functional types of the plants, especially graminoid plants, regulate CH4 fluxes, but such impacts might be overruled if the water table level drops substantially (Riutta et al., 2020). In addition, there is some evidence of microtopographic differences in peatland nutrient dynamics in response to drying (Macrae et al., 2013), whereas flowing water will benefit the nutrient supply at a specific site. Furthermore, the expansion of shrubs, in response to drying, might potentially decrease peat temperatures due to increased shading and the evaporative cooling effect (Strakova et al., 2012), thereby reducing CH4 emissions.
Flowing water also tends to keep the peat temperature lower, even though fens with moving water warm up earlier than other peatlands in the spring and early summer (Rydin and Jeglum, 2013). In contrast to temperature predictions, predicting precipitation remains more uncertain, although, in general, it is expected to increase in several regions (Collins et al., 2013). Even though peatland hydrological processes are not directly impacted by precipitation due to functions such as evapotranspiration and runoff, it has been shown that precipitation can decrease CO2 uptake and GPP due to cloudiness and the associated reduced light availability (Nijp et al., 2015), thereby influencing CH4 emissions. Precipitation can also increase water dynamics and decrease CH4 emissions by providing more oxygen for CH4 oxidation (Mitchell and Branfireun, 2005; Radu and Duval, 2018), which can be further accelerated under a warmer and drier peat surface scenario.
Our data from a flow-through valley fen demonstrates that hydrology in northern fen systems has a dual role in controlling CH4 emissions, depending on the presence or absence of a stream. Flowing water not only enhances nutrient transportation and oxygen availability but also decreases peat temperature, all of which are significant direct or indirect controllers of CH4 emissions. At places close to the stream there were higher water levels, lower peat temperatures, and greater oxygen concentrations; these supported the highest total leaf area and gross primary production rates but resulted in the lowest CH4 emissions. Further from the stream, the conditions were drier and CH4 emissions were also low. CH4 emissions were highest at the intermediate distance from the stream where the oxygen concentration in the surface peat was low but gross primary production was still high. Our results show how a stream controls CH4 emissions in a flow-through fen, which is a common peatland ecosystem type from the Arctic to the temperate zones. Therefore, future projections of the global CH4 budget need to take flowing water features in fen systems into account.

Figure A1Continuous peat temperature (at 5, 10, 20, 30, 50, and 100 cm depth below the surface) in 2018 at Lompolojänkkä at measuring points, (a) far from the stream, (b) an intermediate distance from the stream, and (c) in the stream. A detailed description of the locations of the sample points can be found in Fig. 1.
Table A1Equations for calculating the leaf area index (LAI) for four plant functional types (PFTs) based on percentage cover (c; %) and height (h; cm) data.
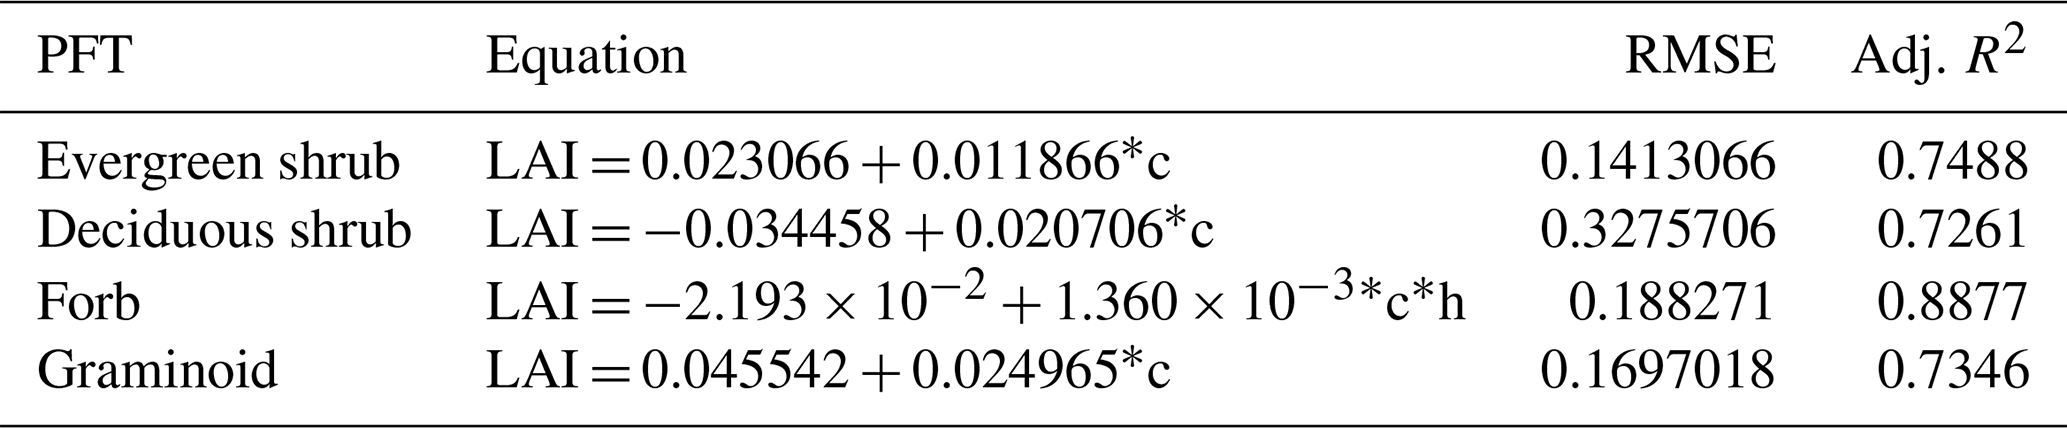
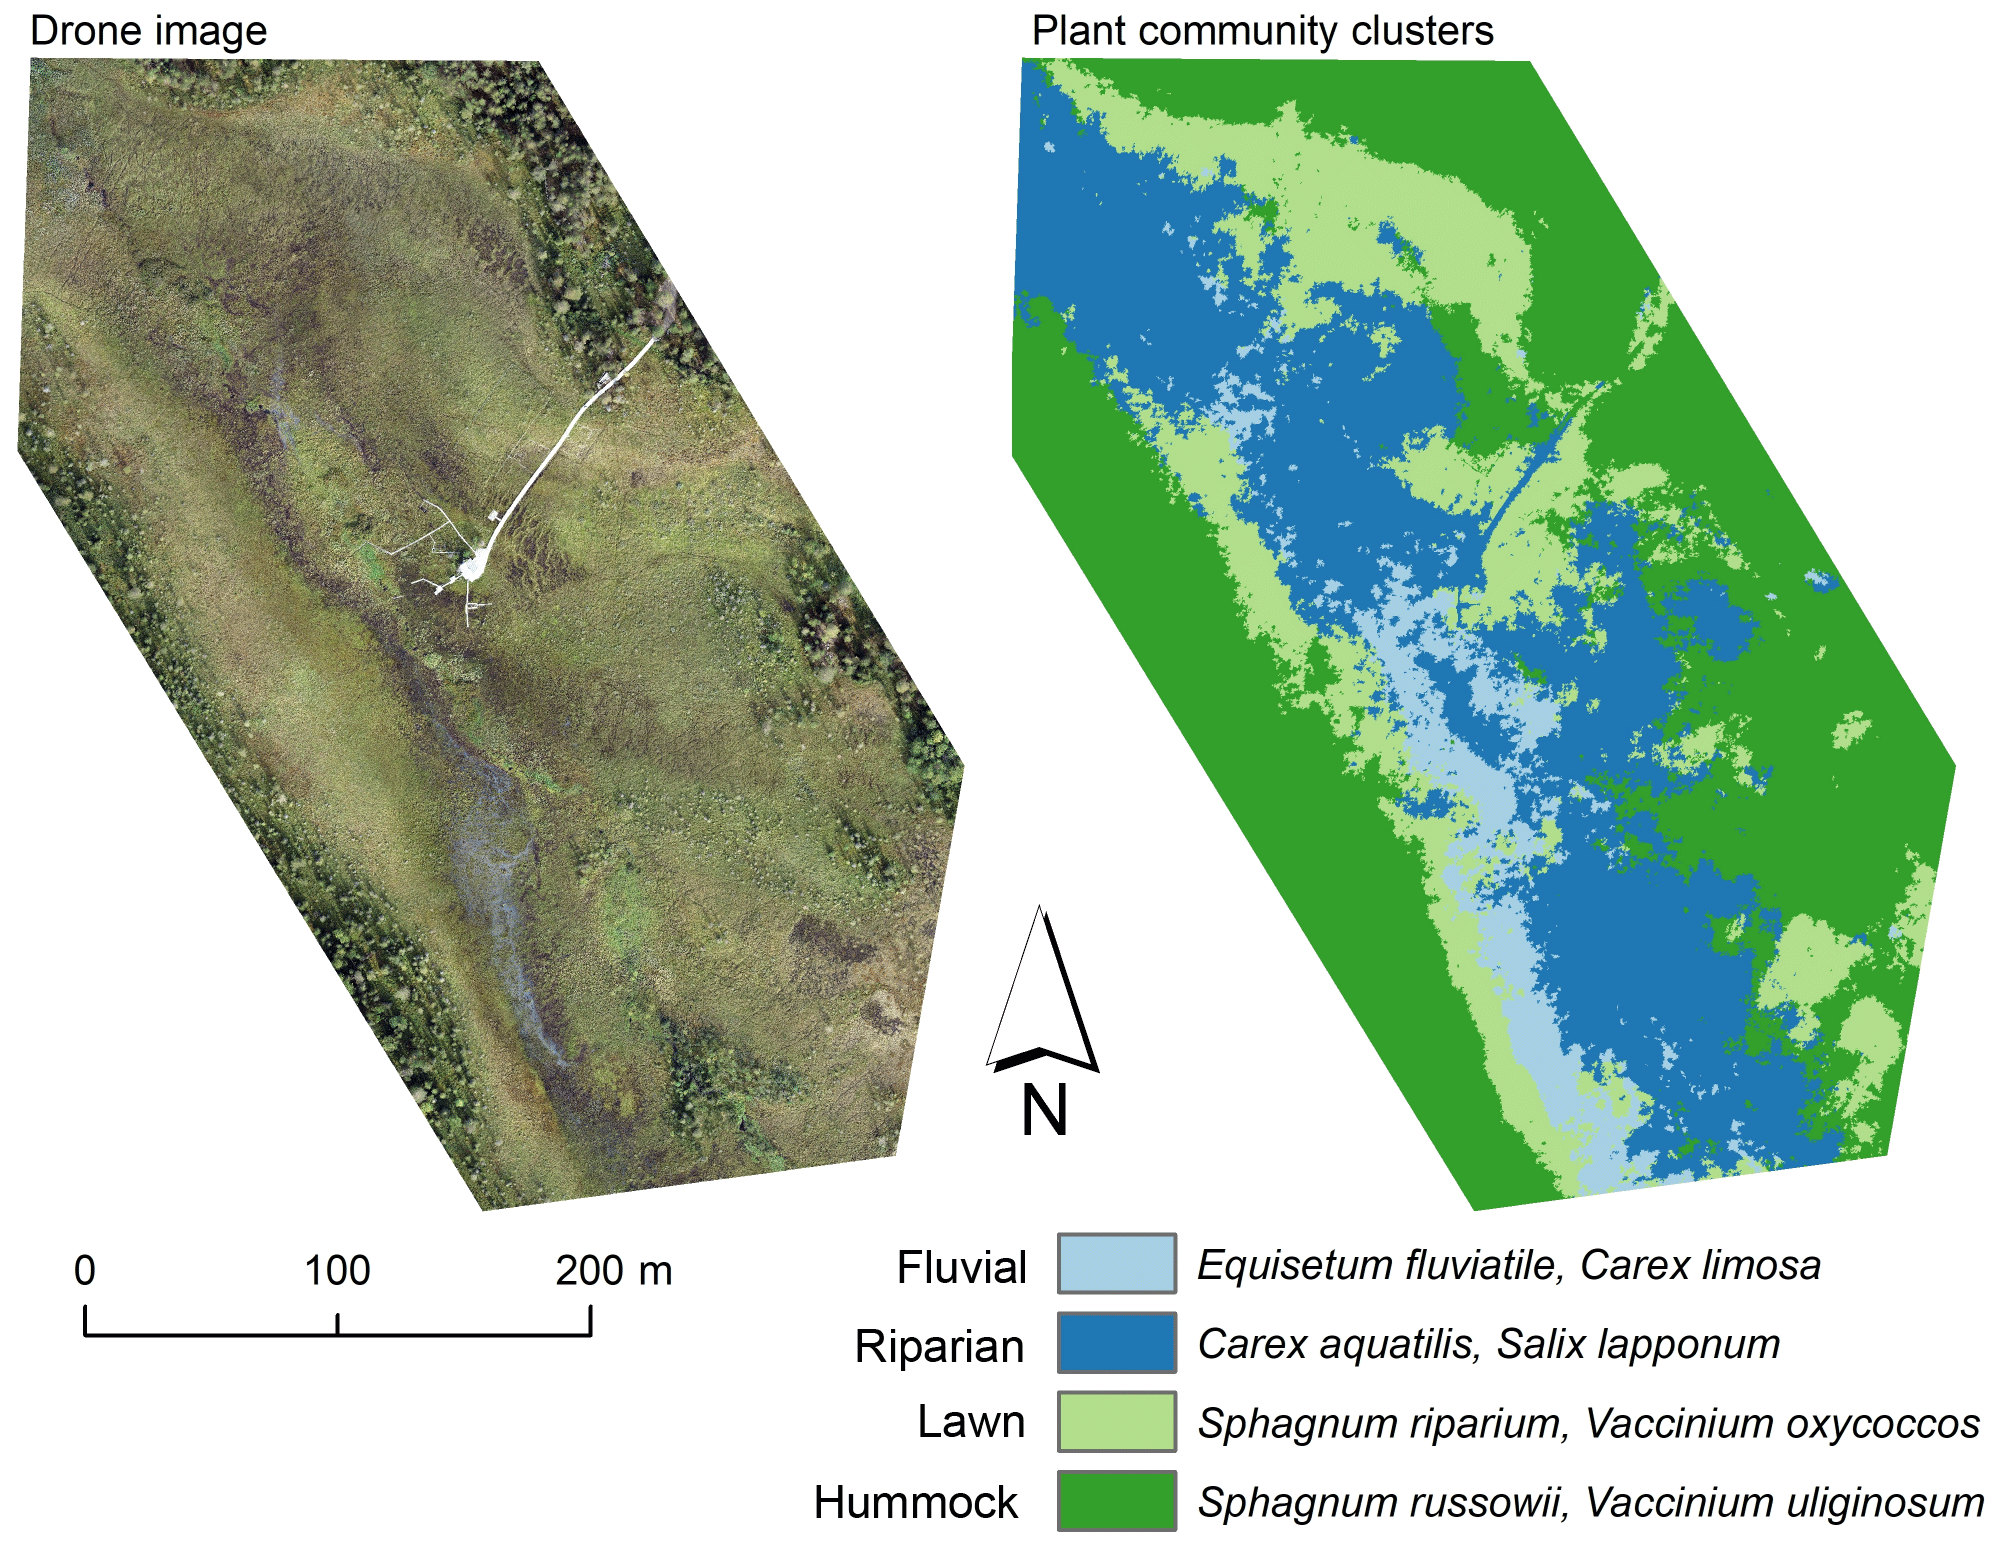
Figure A2Drone image and a map of plant community clusters over the study area. The cluster map was produced with the multi-source remote sensing data listed in Räsänen et al. (2020). We calculated remote sensing features for the vegetation plots and vegetation patches delineated from the drone image with mean-shift segmentation in Orfeo ToolBox (Grizonnet et al., 2017). We trained a random forest classification (Breiman, 2001) with the vegetation plot data and predicted the classification for the vegetation patches. Classification accuracy (random forest out-of-bag estimate) was 61 %.
Table A2Indicator plant species of plant community clusters of the methane (CH4) flux sample plots derived from non-metric multidimensional scaling (NMDS) analysis.
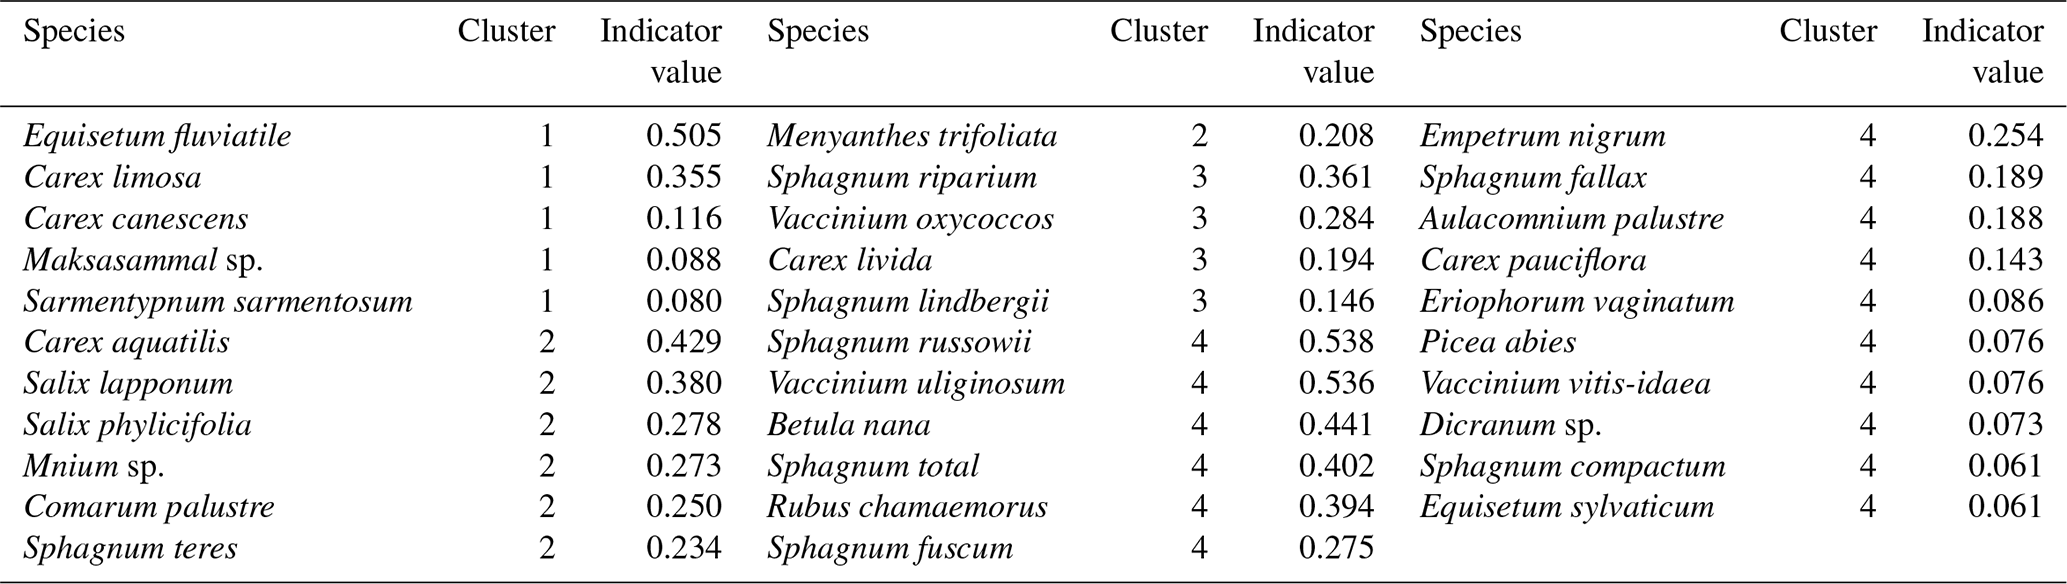
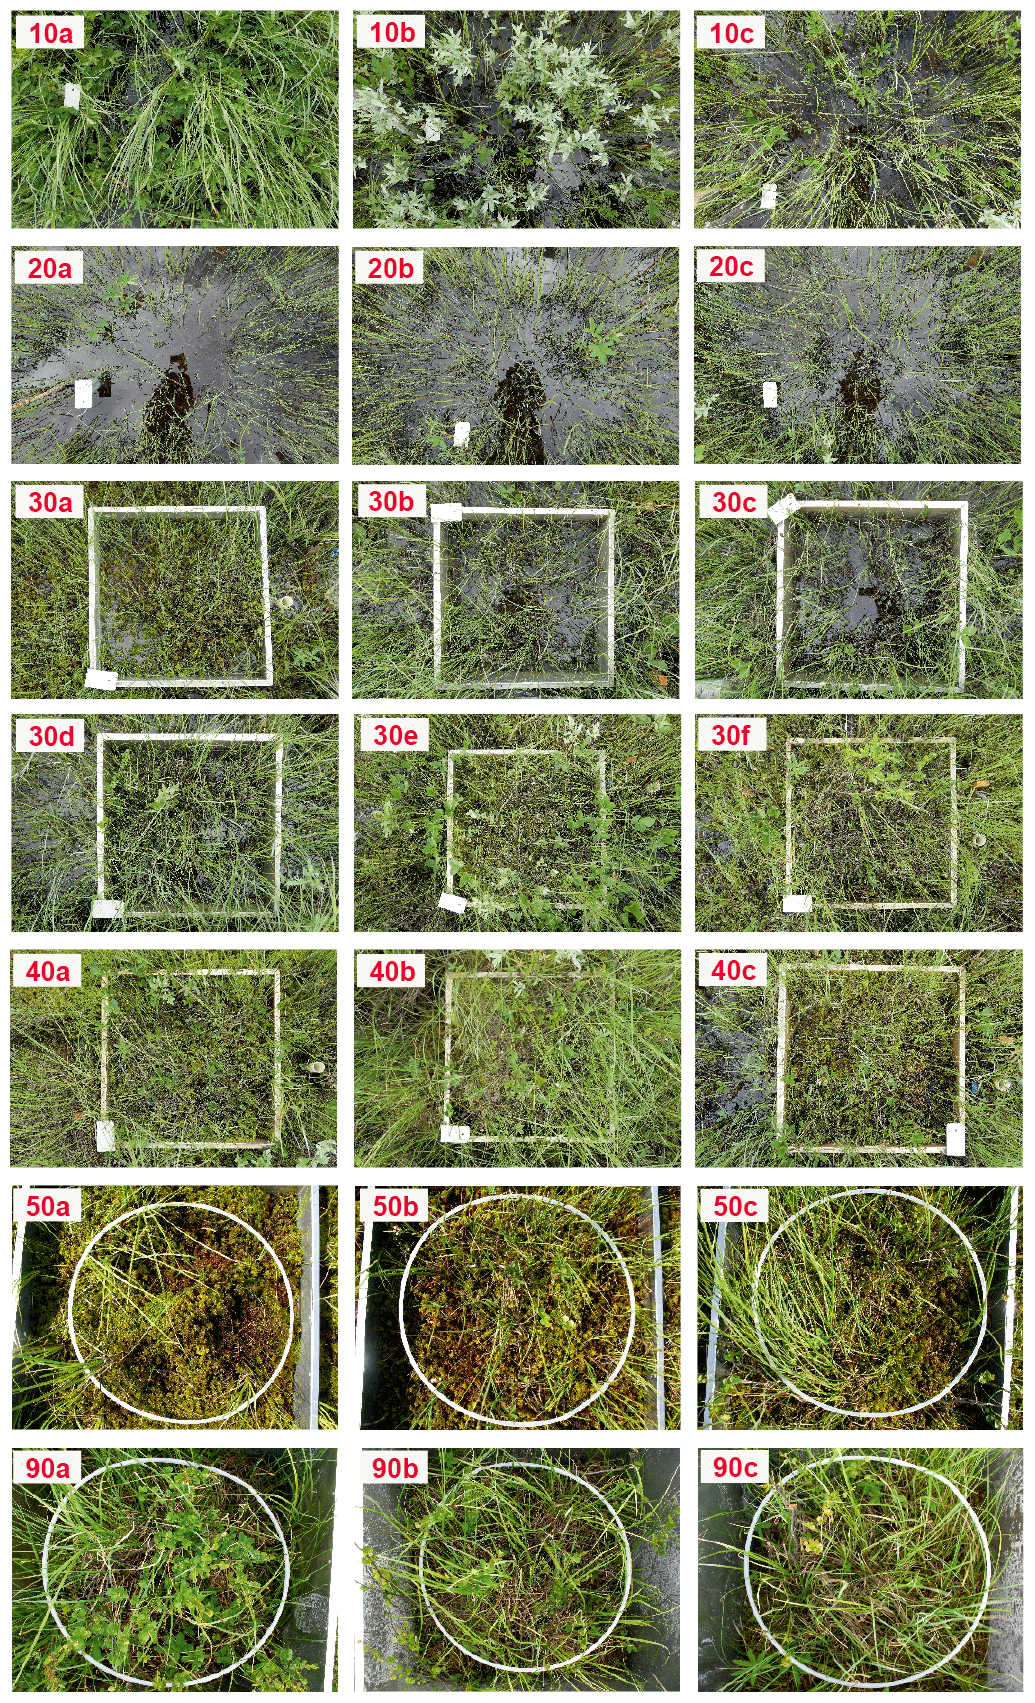
Figure A3Photos of the methane (CH4) flux sample plots at Lompolojänkkä taken on 1 July 2019 (sets 10 to 40) and 28 June 2019 (sets 50 and 90). Photos were not taken for set 60.
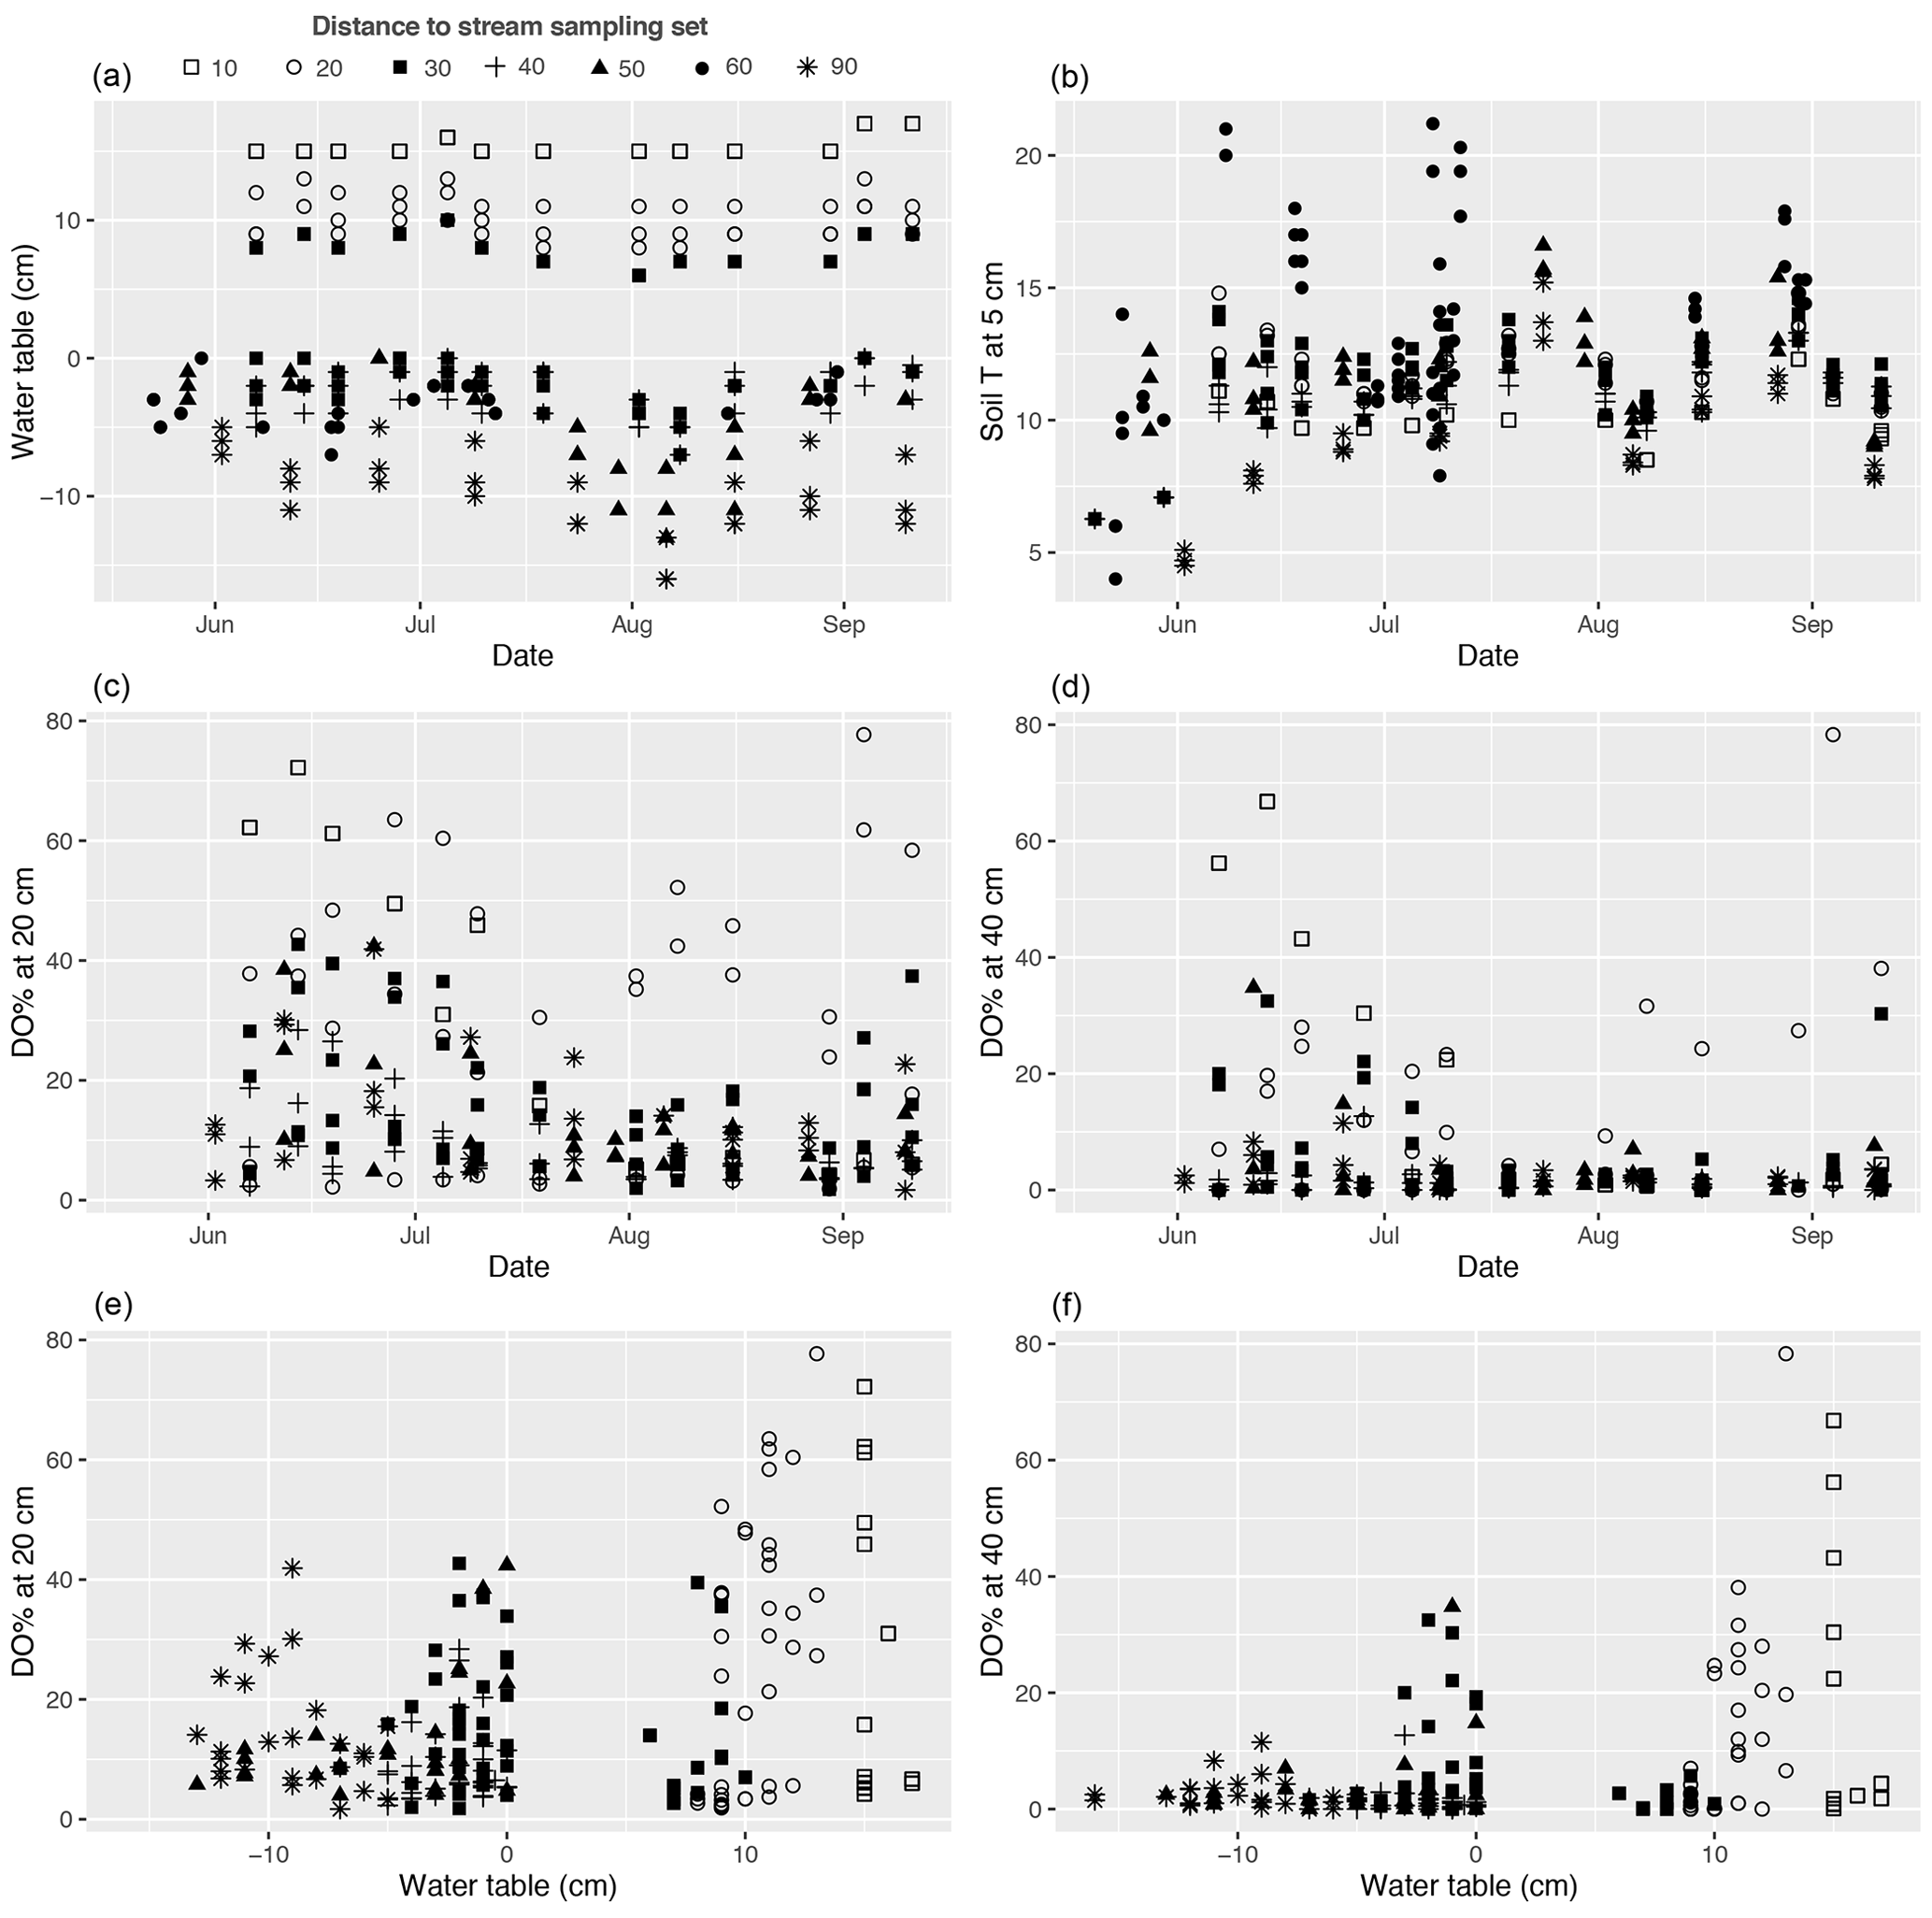
Figure A4(a, b) Temporal variations in the water table, soil temperature (T) at 5 cm below the peat surface, and (c, d) dissolved oxygen concentration (DO %) at 20 and 40 cm below the surface during the 2019 growing season at each methane (CH4) flux sample plot. (e, f) DO % at 20 and 40 cm plotted against water table. Plots in the same set are labelled using the same symbol.

Figure A5Temporal development of the leaf area index (LAI) for total vascular, aerenchymous, deciduous, evergreen, forb, and graminoid plants, as well as moss cover (%) in each methane (CH4) flux sample plot. Plots in the same set are labelled using the same symbol.

Figure A6Gross primary production (GPP) at a photosynthetic photon flux density level of 800 µmol m−2 s−1 in the methane (CH4) flux sample plots in sets 10–40 plotted against peak season (early summer) dissolved oxygen concentration (DO %) at 20 and 40 cm below the surface, and the peak season (late July) total vascular leaf area index (LAI_total). Plots in the same set are labelled using the same symbol.
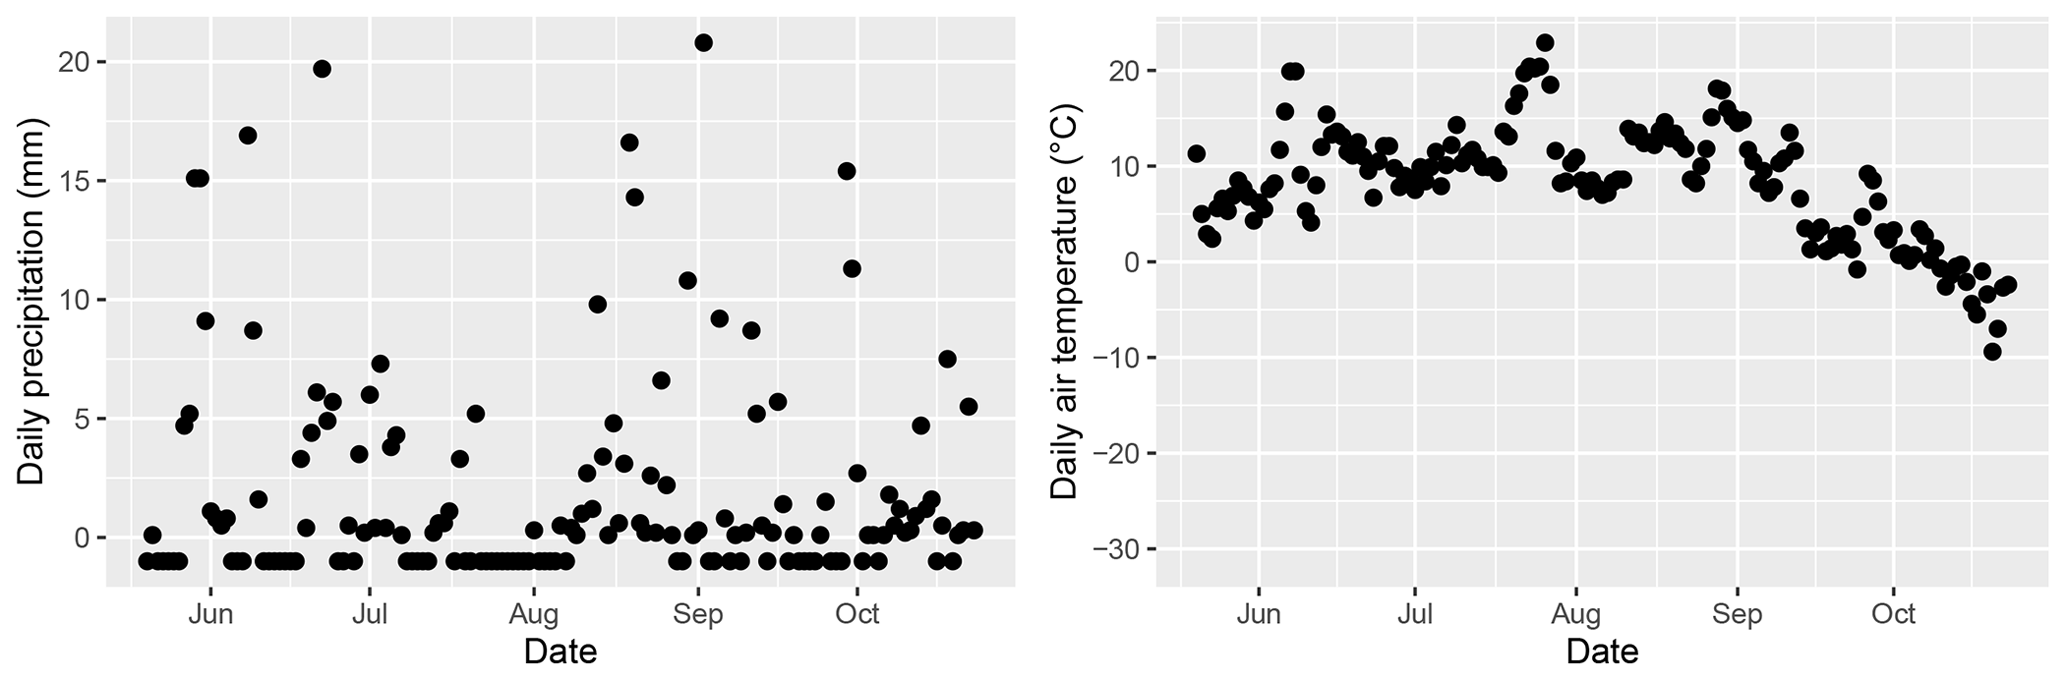
Figure A7Daily precipitation and air temperature at Lompolojänkkä during summer 2019. Data originated from the nearest weather stations: Lompolonvuoma (for temperature) and Kenttärova (for precipitation).
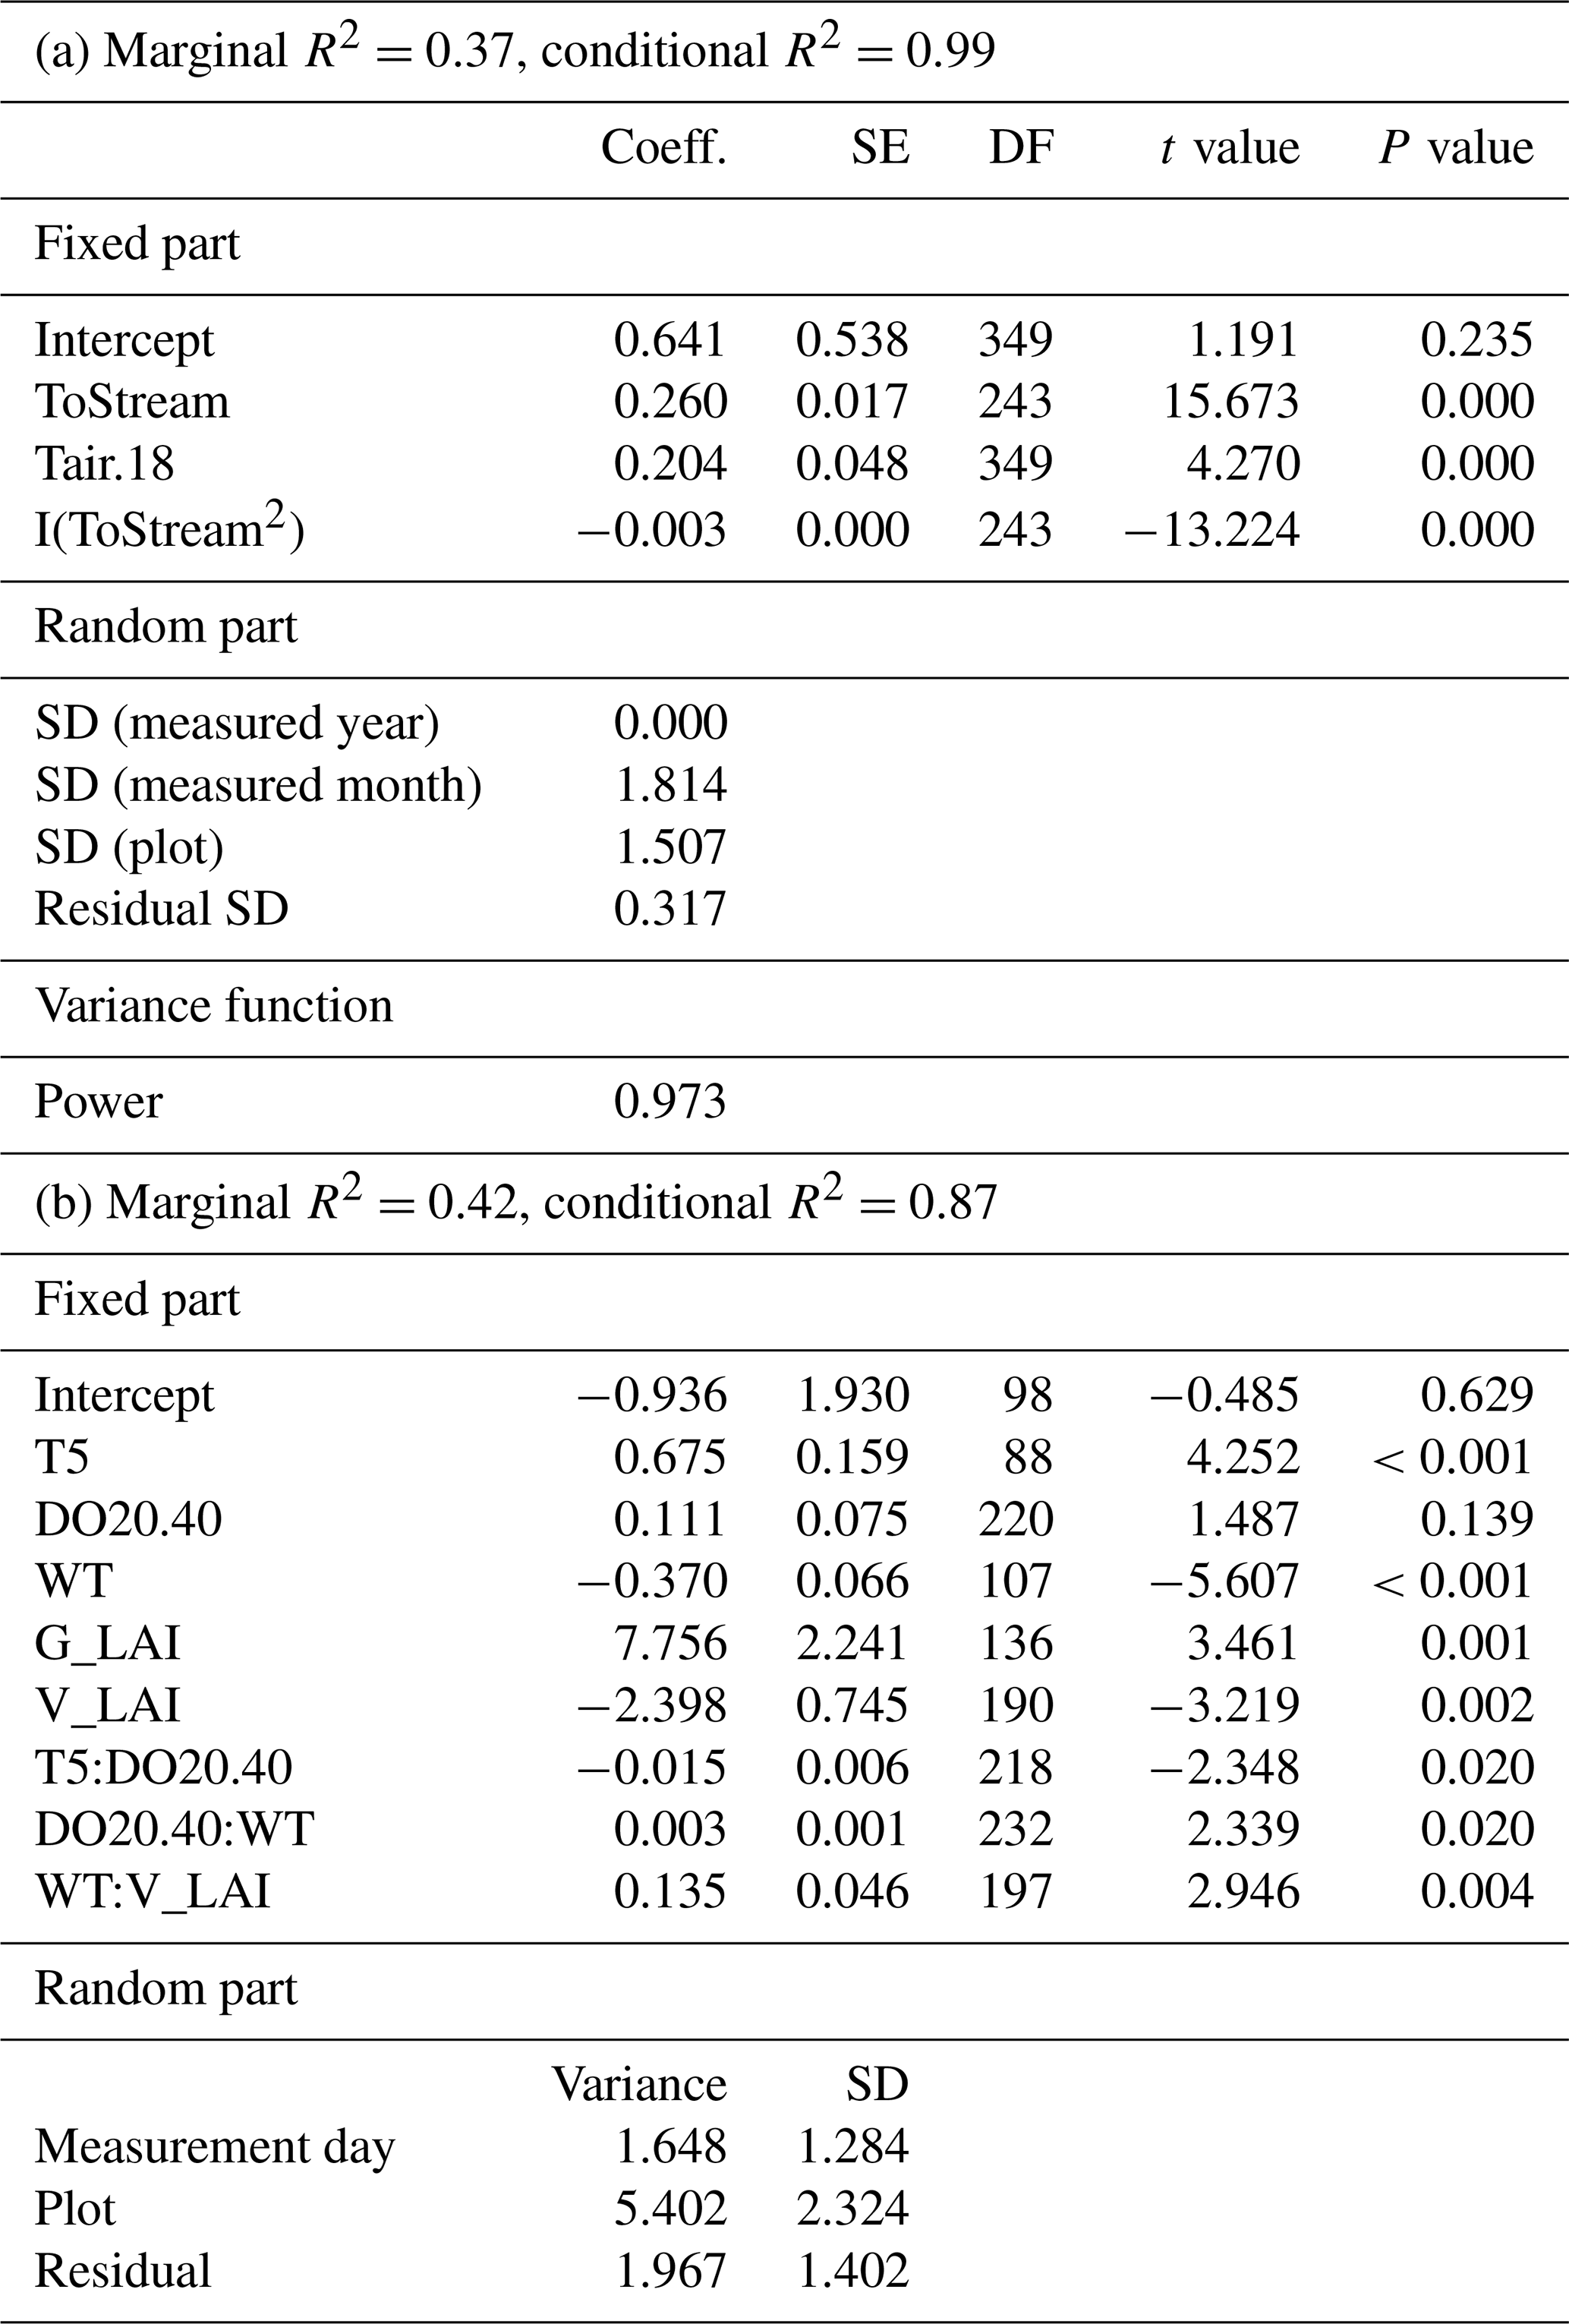
Table A3Parameter estimates of the linear mixed-effect models describing the response of methane (CH4) fluxes to environmental variables in the (a) 2017–2019 and (b) 2019 datasets. ToStream: the distance from the plot to the stream; Tair.18: air temperature greater than the threshold value of 18∘ C; T5: peat temperature at 5 cm depth below the surface; DO20.40: dissolved oxygen concentration at 20 cm depth below the surface which is lower than the threshold value of 40 %; WT: water level relative to the moss surface; G_LAI: graminoid LAI; V_LAI: vascular LAI.
The chamber methane flux and environmental data used in this study are available at https://doi.org/10.6084/m9.figshare.12581423 (last access: 25 November 2020; Zhang, 2020).
AL designed the experiments with the help from TL. SG, VL, and HZ contributed to the field measurements. HZ, EST, AK, and AR analysed the data. HZ prepared the paper with contributions from all co-authors.
The authors declare that they have no conflict of interest.
We thank Mika Korkiakoski, Petri Salovaara, and Valtteri Hyöky for help with field measurements and Kari Mäenpää for conducting the drone flight. We are grateful to Tim Moore and one anonymous referee for their constructive comments.
This research has been supported by the Ministry of Transport and Communication through ICOS-Finland and the Academy of Finland (grant nos. 287039 and 308511).
Open access funding provided by Helsinki University Library.
This paper was edited by Michael Weintraub and reviewed by Tim Moore and one anonymous referee.
Abdalla, M., Hastings, A., Truu, J., Espenberg, M., Mander, U., and Smith, P.: Emissions of methane from northern peatlands: a review of management impacts and implications for future management options, Ecol. Evol., 6, 7080–7102, https://doi.org/10.1002/ece3.2469, 2016.
Aerts, R., Verhoeven, J. T. A., and Whigham, D. F.: Plant-mediated controls on nutrient cycling in temperate fens and bogs, Ecology, 80, 2170–2181, https://doi.org/10.1890/0012-9658(1999)080[2170:Pmconc]2.0.Co;2, 1999.
Alm, J., Shurpali, N. J., Tuittila, E.-S., Laurila, T., Maljanen, M., Saarnio, S., and Minkkinen, K.: Methods for determining emission factors for the use of peat and peatlands – flux measurements and modelling, Boreal Environ. Res., 12, 85–100, 2007.
Andersen, R., Poulin, M., Borcard, D., Laiho, R., Laine, J., Vasander, H., and Tuittila, E.-T.: Environmental control and spatial structures in peatland vegetation, J. Veg. Sci., 22, 878–890, https://doi.org/10.1111/j.1654-1103.2011.01295.x, 2011.
Aurela, M., Lohila, A., Tuovinen, J. P., Hatakka, J., Riutta, T., and Laurila, T.: Carbon dioxide exchange on a northern boreal fen, Boreal Environ. Res., 14, 699–710, 2009.
Bellisario, L. M., Bubier, J. L., Moore, T. R., and Chanton, J. P.: Controls on CH4 emissions from a northern peatland, Global Biogeochem. Cy., 13, 81–91, https://doi.org/10.1029/1998gb900021, 1999.
Bhullar, G. S., Edwards, P. J., and Venterink, H. O.: Variation in the plant-mediated methane transport and its importance for methane emission from intact wetland peat mesocosms, J. Plant. Ecol., 6, 298–304, https://doi.org/10.1093/jpe/rts045, 2013a.
Bhullar, G. S., Iravani, M., Edwards, P. J., and Venterink, H. O.: Methane transport and emissions from soil as affected by water table and vascular plants, Bmc Ecol., 13, 32, https://doi.org/10.1186/1472-6785-13-32, 2013b.
Bjorkman, A. D., Myers-Smith, I. H., Elmendorf, S. C., Normand, S., Ruger, N., Beck, P. S. A., Blach-Overgaard, A., Blok, D., Cornelissen, J. H. C., Forbes, B. C., Georges, D., Goetz, S. J., Guay, K. C., Henry, G. H. R., HilleRisLambers, J., Hollister, R. D., Karger, D. N., Kattge, J., Manning, P., Prevey, J. S., Rixen, C., Schaepman-Strub, G., Thomas, H. J. D., Vellend, M., Wilmking, M., Wipf, S., Carbognani, M., Hermanutz, L., Levesque, E., Molau, U., Petraglia, A., Soudzilovskaia, N. A., Spasojevic, M. J., Tomaselli, M., Vowles, T., Alatalo, J. M., Alexander, H. D., Anadon-Rosell, A., Angers-Blondin, S., te Beest, M., Berner, L., Bjork, R. G., Buchwal, A., Buras, A., Christie, K., Cooper, E. J., Dullinger, S., Elberling, B., Eskelinen, A., Frei, E. R., Grau, O., Grogan, P., Hallinger, M., Harper, K. A., Heijmans, M. M. P. D., Hudson, J., Hulber, K., Iturrate-Garcia, M., Iversen, C. M., Jaroszynska, F., Johnstone, J. F., Jorgensen, R. H., Kaarlejarvi, E., Klady, R., Kuleza, S., Kulonen, A., Lamarque, L. J., Lantz, T., Little, C. J., Speed, J. D. M., Michelsen, A., Milbau, A., Nabe-Nielsen, J., Nielsen, S. S., Ninot, J. M., Oberbauer, S. F., Olofsson, J., Onipchenko, V. G., Rumpf, S. B., Semenchuk, P., Shetti, R., Collier, L. S., Street, L. E., Suding, K. N., Tape, K. D., Trant, A., Treier, U. A., Tremblay, J. P., Tremblay, M., Venn, S., Weijers, S., Zamin, T., Boulanger-Lapointe, N., Gould, W. A., Hik, D. S., Hofgaard, A., Jonsdottir, I. S., Jorgenson, J., Klein, J., Magnusson, B., Tweedie, C., Wookey, P. A., Bahn, M., Blonder, B., van Bodegom, P. M., Bond-Lamberty, B., Campetella, G., Cerabolini, B. E. L., Chapin, F. S., Cornwell, W. K., Craine, J., Dainese, M., de Vries, F. T., Diaz, S., Enquist, B. J., Green, W., Milla, R., Niinemets, U., Onoda, Y., Ordonez, J. C., Ozinga, W. A., Penuelas, J., Poorter, H., Poschlod, P., Reich, P. B., Sande, B., Schamp, B., Sheremetev, S., Weiher, E.: Plant functional trait change across a warming tundra biome, Nature, 562, 57–62, https://doi.org/10.1038/s41586-018-0563-7, 2018.
Bousquet, P., Ringeval, B., Pison, I., Dlugokencky, E. J., Brunke, E.-G., Carouge, C., Chevallier, F., Fortems-Cheiney, A., Frankenberg, C., Hauglustaine, D. A., Krummel, P. B., Langenfelds, R. L., Ramonet, M., Schmidt, M., Steele, L. P., Szopa, S., Yver, C., Viovy, N., and Ciais, P.: Source attribution of the changes in atmospheric methane for 2006–2008, Atmos. Chem. Phys., 11, 3689–3700, https://doi.org/10.5194/acp-11-3689-2011, 2011.
Breiman, L.: Random Forests, Machine Learning, 45, 5–32, 2001.
Bubier, J., Moore, T., Savage, K., and Crill, P.: A comparison of methane flux in a boreal landscape between a dry and a wet year, Global Biogeochem. Cy., 19, https://doi.org/10.1029/2004gb002351, 2005.
Bubier, J. L.: The relationship of vegetation to methane emission and hydrochemical gradients in northern peatlands, J. Ecol., 83, 403–420, https://doi.org/10.2307/2261594, 1995.
Ciais, P., Sabine, C., Bala, G., Bopp, L., Brovkin, V., Canadell, J., Chhabra, A., DeFries, R., Galloway, J., Heimann, M., Jones, C., Le Quere, C., Myneni, R. B., Piao, S., and Thornton, P.: Carbon and other biogeochemical cycles, Climate Change 2013: The Physical Science Basis, 465–570, 2014.
Collins, M., R. Knutti, J. Arblaster, J.-L. Dufresne, T. Fichefet, P. F., X. Gao, Gutowski, W.J., Johns, T., Krinner, G., Shongwe, M., Tebaldi, C., Weaver, A. J., and Wehner, M.: Long-term Climate Change: Projections, Commitments and Irreversibility, in: Climate Change 2013: The Physical Science Basis, Contribution of Working Group I to the Fifth Assessment Report of the Intergovernmental Panel on Climate Change, edited by: Stocker, T. F., Qin, D., Plattner, G.-K., Tignor, M., Allen, S. K., Boschung, J., Nauels, A., Xia, Y., Bex, V., and Midgley, P. M., Cambridge University Press, Cambridge, United Kingdom and New York, NY, USA, 108 pp., 2013.
Du, E. Z., Terrer, C., Pellegrini, A. F. A., Ahlstrom, A., van Lissa, C. J., Zhao, X., Xia, N., Wu, X., and Jackson, R. B.: Global patterns of terrestrial nitrogen and phosphorus limitation, Nat. Geosci., 13, 221–226, https://doi.org/10.1038/s41561-019-0530-4, 2020.
Dunfield, P., Knowles, R., Dumont, R., and Moore, T. R.: Methane production and consumption in temperate and sub-arctic peat soils – Response to temperature and pH, Soil. Biol. Biochem., 25, 321–326, https://doi.org/10.1016/0038-0717(93)90130-4, 1993.
Eskelinen, A. and Harrison, S. P.: Resource colimitation governs plant community responses to altered precipitation, P. Natl. Acad. Sci. USA, 112, 13009–13014, https://doi.org/10.1073/pnas.1508170112, 2015.
Euskirchen, E. S., Kane, E.S., and Turetsky, M. R.: When the source of flooding matters: divergent responses in carbon fluxes in an alaskan rich fen to two types of inundation, Ecosystems, 23, 1138–1153, https://doi.org/10.1007/s10021-019-00460-z, 2019.
Greenup, A. L., Bradford, M. A., McNamara, N. P., Ineson, P., and Lee, J. A.: The role of Eriophorum vaginatum in CH4 flux from an ombrotrophic peatland, Plant Soil, 227, 265–272, https://doi.org/10.1023/A:1026573727311, 2000.
Grizonnet, M., Michel, J., Poughon, V., Inglada, J., Savinaud, M., and Cresson, R.: Orfeo ToolBox: open source processing of remote sensing images, Open Geospatial Data, Software and Standards, 2, 15, https://doi.org/10.1186/s40965-017-0031-6, 2017.
Grosse, W.: The mechanism of thermal transpiration (equals thermal osmosis). Aquat. Bot., 54, 101–110, https://doi.org/10.1016/0304-3770(96)01038-8, 1996.
Hajek, T., Tuittila, E.-S., Ilomets, M., and Laiho, R.: Light responses of mire mosses – a key to survival after water-level drawdown?, Oikos, 118, 240–250, https://doi.org/10.1111/j.1600-0706.2008.16528.x, 2009.
Helbig, M., Waddington, J. M., Alekseychik, P., D.Amiro, B., Aurela, M., Barr, A. G., Black, T. A., Blanken, P. D., Carey, S. K., Chen, J. Q., Chi, J. S., Desai, A. R., Dunn, A., Euskirchen, E. S., Flanagan, L. B., Forbrich, I., Friborg, T., Grelle, A., Harder, S., Heliasz, M., Humphreys, E. R., Ikawa, H., Isabelle, P. E., Iwata, H., Jassal, R., Korkiakoski, M., Kurbatova, J., Kutzbach, L., Lindroth, A., Lofvenius, M. O., Lohila, A., Mammarella, I., Marsh, P., Maximov, T., Melton, J. R., Moore, P. A., Nadeau, D. F., Nicholls, E. M., Nilsson, M. B., Ohta, T., Peichl, M., Petrone, R. M., Petrov, R., Prokushkin, A., Quinton, W. L., Reed, D. E., Roulet, N. T., Runkle, B. R. K., Sonnentag, O., Strachan, I. B., Taillardat, P., Tuittila, E.-S., Tuovinen, J. P., Turner, J., Ueyama, M., Varlagin, A., Wilmking, M., Wofsy, S. C., and Zyrianov, V.: Increasing contribution of peatlands to boreal evapotranspiration in a warming climate., Nat. Clim. Change, 10, 555–560, https://doi.org/10.1038/s41558-020-0763-7, 2020.
Ingram, H. A. P.: Hydrology, in: Ecosystems of the world, edited by: Gore, A. J. P., 4A. Mires: Swamp, bog, fen and moor, Elsevier, Amsterdam, Oxford, New York, 67–158, 1983.
Juottonen, H., Galand, P. E., Tuittila, E.-S., Laine, J., Fritze, H., and Yrjala, K.: Methanogen communities and bacteria along an ecohydrological gradient in a northern raised bog complex, Environ. Microbiol., 7, 1547–1557, https://doi.org/10.1111/j.1462-2920.2005.00838.x, 2005.
Juottonen, H., Kotiaho, M., Robinson, D., Merila, P., Fritze, H., and Tuittila, E.-S.: Microform-related community patterns of methane-cycling microbes in boreal Sphagnum bogs are site specific, Fems. Microbiol. Ecol., 91, fiv094, https://doi.org/10.1093/femsec/fiv094, 2015.
Juutinen, S., Väliranta, M., Kuutti, V., Laine, A.M., Virtanen, T., Seppä, H., Weckstrom, J., and Tuittila, E.-S.: Short-term and long-term carbon dynamics in a northern peatland-stream-lake continuum: A catchment approach, J. Geophys. Res.-Biogeo, 118, 171–183, doi:10.1002-jgrg.20028, 2013.
Juutinen, S., Virtanen, T., Kondratyev, V., Laurila, T., Linkosalmi, M., Mikola, J., Nyman, J., Rasanen, A., Tuovinen, J.-P., and Aurela, M.: Spatial variation and seasonal dynamics of leaf-area index in the arctic tundra-implications for linking ground observations and satellite images. Environ. Res. Lett., 12, 095002, https://doi.org/10.1088/1748-9326/aa7f85, 2017.
Kirschke, S., Bousquet, P., Ciais, P., Saunois, M., Canadell, J. G., Dlugokencky, E. J., Bergamaschi, P., Bergmann, D., Blake, D. R., Bruhwiler, L., Cameron-Smith, P., Castaldi, S., Chevallier, F., Feng, L., Fraser, A., Heimann, M., Hodson, E. L., Houweling, S., Josse, B., Fraser, P. J., Krummel, P. B., Lamarque, J. F., Langenfelds, R. L., Le Quere, C., Naik, V., O'Doherty, S., Palmer, P. I., Pison, I., Plummer, D., Poulter, B., Prinn, R. G., Rigby, M., Ringeval, B., Santini, M., Schmidt, M., Shindell, D. T., Simpson, I. J., Spahni, R., Steele, L. P., Strode, S. A., Sudo, K., Szopa, S., van der Werf, G. R., Voulgarakis, A., van Weele, M., Weiss, R. F., Williams, J. E., and Zeng, G.: Three decades of global methane sources and sinks, Nat. Geosci., 6, 813–823, https://doi.org/10.1038/Ngeo1955, 2013.
Kokkonen, N. A. K., Laine, A. M., Laine, J., Vasander, H., Kurki, K., Gong, J. N., and Tuittila, E.-S.: Responses of peatland vegetation to 15-year water level drawdown as mediated by fertility level, J. Veg. Sci., 30, 1206–1216, https://doi.org/10.1111/jvs.12794, 2019.
Kolton, M., Marks, A., Wilson, R. M., Chanton, J. P., and Kostka, J. E.: Impact of warming on greenhouse gas production and microbial diversity in anoxic peat from a Sphagnum-dominated bog (Grand Rapids, Minnesota, United States), Front. Microbiol., 10, 870, https://doi.org/10.3389/fmicb.2019.00870, 2019.
Korhola, A., Ruppel, M., Seppä, H., Väliranta, M., Virtanen, T., and Weckström, J.: The importance of northern peatland expansion to the late-Holocene rise of atmospheric methane, Quat. Sci. Rev., 29, 611–617, https://doi.org/10.1016/j.quascirev.2009.12.010, 2010.
Korrensalo, A., Männistö, E., Alekseychik, P., Mammarella, I., Rinne, J., Vesala, T., and Tuittila, E.-S.: Small spatial variability in methane emission measured from a wet patterned boreal bog, Biogeosciences, 15, 1749–1761, https://doi.org/10.5194/bg-15-1749-2018, 2018.
Lai, D. Y. F.: Methane dynamics in northern peatlands: a review, Pedosphere, 19, 409–421, https://doi.org/10.1016/S1002-0160(09)00003-4, 2009.
Laine, A. M., Juurola, E., Hajek, T., and Tuittila, E.-S.: Sphagnum growth and ecophysiology during mire succession, Oecologia, 167, 1115–1125, https://doi.org/10.1007/s00442-011-2039-4, 2011.
Laine, A. M., Mäkiranta, P., Laiho, R., Mehtätalo, L., Penttilä, T., Korrensalo, A., Minkkinen, K., Fritze, H., and Tuittila, E.-S.: Warming impacts on boreal fen CO2 exchange under wet and dry conditions, Global Change Biol., 25, 1995–2008, https://doi.org/10.1111/gcb.14617, 2019.
Laitinen, J., Rehell, S., Huttunen, A., Tahvanainen, T., Heikkila, R., and Lindholm, T.: Mire systems in Finland – special view to aapa mires and their water-flow pattern, Suoseura – Finnish Peatland Society, 56, 1–26, 2007.
Lamers, L. P. M., Vile, M. A., Grootjans, A. P., Acreman, M. C., van Diggelen, R., Evans, M. G., Richardson, C. J., Rochefort, L., Kooijman, A. M., Roelofs, J. G. M., and Smolders, A. J. P.: Ecological restoration of rich fens in Europe and Northern America: from trial and error to an evidence-based approach, Biol. Rev., 90, 182–203, https://doi.org/10.1111/brv.12102, 2015.
Larmola, T., Tuittila, E.-S., Tiirola, M., Nykanen, H., Martikainen, P. J., Yrjala, K., Tuomivirta, T., and Fritze, H.: The role of Sphagnum mosses in the methane cycling of a boreal mire, Ecology, 91, 2356–2365, https://doi.org/10.1890/09-1343.1, 2010.
Lohila, A., Aurela, M., Hatakka, J., Pihlatie, M., Minkkinen, K., Penttila, T., and Laurila, T.: Responses of N2O fluxes to temperature, water table and N deposition in a northern boreal fen, Eur. J. Soil. Sci., 61, 651–661, https://doi.org/10.1111/j.1365-2389.2010.01265.x, 2010.
Luan, J. W., Wu, J. H., Liu, S. R., Roulet, N., and Wang, M.: Soil nitrogen determines greenhouse gas emissions from northern peatlands under concurrent warming and vegetation shifting, Commun. Biol., 2, 132, https://doi.org/10.1038/s42003-019-0370-1, 2019.
MacDonald, G. M., Beilman, D. W., Kremenetski, K. V., Sheng, Y. W., Smith, L. C., and Velichko, A. A.: Rapid early development of circumarctic peatlands and atmospheric CH4 and CO2 variations, Science, 314, 285–288, https://doi.org/10.1126/science.1131722, 2006.
Macrae, M. L., Devito, K. J., Strack, M., and Waddington, J. M.: Effect of water table drawdown on peatland nutrient dynamics: implications for climate change, Biogeochemistry, 112, 661–676, https://doi.org/10.1007/s10533-012-9730-3, 2013.
Mächler, M., Rousseeuw, P., Struyf, A., Hubert, M., and Hornik, K.: cluster Analysis Basics and Extensions, R package version 2.1.0, 2019.
Mäkiranta, P., Laiho, R., Mehtötalo, L., Strakova, P., Sormunen, J., Minkkinen, K., Penttila, T., Fritze, H., and Tuittila, E.-S.: Responses of phenology and biomass production of boreal fens to climate warming under different water-table level regimes, Global Change Biol., 24, 944–956, https://doi.org/10.1111/gcb. 13934, 2018.
Mathijssen, P., Tuovinen, J-P., Lohila, A., Aurela, M., Juutinen, S., L, Tuomas., Niemela, E., Tuittila, E.-S., and Väliranta, M.: Development, carbon accumulation, and radiative forcing of a subarctic fen over the Holocene, Holocene, Special issue: Holocene peatland carbon dynamics in the circum-Arctic region, 1–11, https://doi.org/10.1177/0959683614538072, 2014.
Mitchell, C. P. J. and Branfireun, B. A.: Hydrogeomorphic controls on reduction-oxidation conditions across boreal upland-peatland interfaces, Ecosystems, 8, 731–747, https://doi.org/10.1007/s10021-005-1792-9, 2005.
Nijp, J. J., Limpens, J., Metselaar, K., Peichl, M., Nilsson, M. B., van der Zee, S. E. A. T. M., and Berendse, F.: Rain events decrease boreal peatland net CO2 uptake through reduced light availability, Global Change Biol., 21, 2309–2320. https://doi.org/10.1111/gcb.12864, 2015.
Noyce, G. L., Varner, R. K., Bubier, J. L., and Frolking, S.: Effect of Carex rostrata on seasonal and interannual variability in peatland methane emissions, J. Geophys Res.-Biogeo., 119, 24–34, https://doi.org/10.1002/2013jg002474, 2014.
Oksanen, J., Blanchet, F. G., Friendly, M., Kindt, R., Legendre, P., McGlinn, D., Minchin, P. R., O'Hara, R. B., Simpson, G. L., Solymos, P., Stevens, M. H. H., Szoecs, E., and Wagner, H.: vegan: Community Ecology Package, R package version 2.5-6, 2019.
Öquist, M. G. and Svensson, B. H.: Vascular plants as regulators of methane emissions from a subarctic mire ecosystem, J. Geophys. Res.-Atmos, 107, 10, https://doi.org/10.1029/2001jd001030, 2002.
Peichl, M., Gazovic, M., Vermeij, I., de Goede, E., Sonnentag, O., Limpens, J., and Nilsson, M. B.: Peatland vegetation composition and phenology drive the seasonal trajectory of maximum gross primary production, Sci. Rep., 8, 8012, https://doi.org/10.1038/s41598-018-26147-4, 2018.
Pelletier, L., Moore, T. R., Roulet, N. T., Garneau, M., and Beaulieu-Audy, V.: Methane fluxes from three peatlands in the La Grande Riviere watershed, James Bay lowland, Canada, J. Geophys. Res.-Biogeo., 112, G01018, https://doi.org/10.1029/2006jg000216, 2007.
Peltoniemi, K., Laiho, R., Juottonen, H., Kiikkila, O., Makiranta, P., Minkkinen, K., Pennanen, T., Penttila, T., Sarjala, T., Tuittila, E-S., Tuomivirta, T., and Fritze, H.: Microbial ecology in a future climate: effects of temperature and moisture on microbial communities of two boreal fens, Fems Microbiol. Ecol., 91, fiv062, https://doi.org/10.1093/femsec/fiv062, 2015.
Pirinen, P., Simola, H., Aalto, J., Kaukoranta, J. P., Karlsson, P., and Ruuhela, R.: Tilastoja Suomen ilmastosta 1981–2010 (Climatological Statistics of Finland 1981–2010). Finnish Meteorological Institute Reports, 2012:1, Finnish Meteorological Institute, Helsinki (in Finnish with English abstract), 2012.
Radu, D. D. and Duval, T. P.: Impacts of rainfall regime on methane flux from a cool temprate fen depends on vegetation cover, Ecol. Eng., 114, 76–87, https://doi.org/10.1016/j.ecoleng.20 17.06.047, 2018.
Räsänen, A., Aurela, M., Juutinen, S., Kumpula, T., Lohila, A., Penttilä, T., and Virtanen, T.: Detecting northern peatland vegetation patterns at ultra-high spatial resolution, Remote Sens. Ecol. Con. https://doi.org/10.1002/rse2.140, 2020.
Riley, W. J., Subin, Z. M., Lawrence, D. M., Swenson, S. C., Torn, M. S., Meng, L., Mahowald, N. M., and Hess, P.: Barriers to predicting changes in global terrestrial methane fluxes: analyses using CLM4Me, a methane biogeochemistry model integrated in CESM, Biogeosciences, 8, 1925–1953, https://doi.org/10.5194/bg-8-1925-2011, 2011.
Rinne, J., Tuittila, E.-S., Peltola, O., Li, X. F., Raivonen, M., Alekseychik, P., Haapanala, S., Pihlatie, M., Aurela, M., Mammarella, I., and Vesala, T.: Temporal variation of ecosystem scale methane emission from a boreal fen in relation to temperature, water table position, and carbon dioxide fluxes, Global Biogeochem. Cy., 32, 1087–1106, https://doi.org/10.1029/2017gb005747, 2018.
Riutta, T., Korrensalo, A., Laine, A. M., Laine, J., and Tuittila, E.-S.: Interacting effects of vegetation components and water level on methane dynamics in a boreal fen, Biogeosciences, 17, 727–740, https://doi.org/10.5194/bg-17-727-2020, 2020.
Riutta, T., Laine, J., Aurela, M., Rinne, J., Vesala, T., Laurila, T., Haapanala, S., Pihlatie, M., and Tuittila, E-S.: Spatial variation in plant community functions regulates carbon gas dynamics in a boreal fen ecosystem, Tellus B, 59, 838–852, https://doi.org/10.1111/j.1600-0889.2007.00302.x, 2007.
Robroek, B. J. M., Jassey, V. E. J., Kox, M. A. R., Berendsen, R. L., Mills, R. T. E., Cécillon, L., Puissant, J., Meima-Franke, M., Bakker, P. A. H. M., and Bodelier, P. L. E.: Peatland vascular plant functional types affect methane dynamics by altering microbial community structure, J. Ecol., 103, 925–934, https://doi.org/10.1111/1365-2745.12413, 2015.
Roulet, N., Moore, T., Bubier, J., and Lafleur, P.: Northern fens: methane flux and climatic change, Tellus B, 44, 100–105, 1992.
Rydin, H. and Jeglum, J. K.: The biology of peatlands, United Kingdom: Oxford University Press, 398 pp., 2013.
Song, C., Luan, J., Xu, X., Ma, M., Aurela, M., Lohila, A., Mammarella, I., Alekseychik, P., Tuittila, E-S., Gong, W., Chen, X, Meng, X., and Yuan, W.: A microbial functional group-based CH4 model integrated into a terrestrial ecosystem model: model structure, site-level evaluation and sensitivity analysis, J. Adv. Model. Earth Sy., 12, e2019MS001867, https://doi.org/10.1029/2019ms001867, 2020.
Strack, M. and Waddington, J. M.: Response of peatland carbon dioxide and methane fluxes to a water table drawdown experiment, Global Biogeochem. Cy., 21, GB1007, https://doi.org/10.1029/2006gb002715, 2007.
Strack, M., Waddington, J. M., Rochefort, L., and Tuittila, E.-S.: Response of vegetation and net ecosystem carbon dioxide exchange at different peatland microforms following water table drawdown, J. Geophys. Res.-Biogeo., 111, G02006, https://doi.org/10.1029/2005jg000145, 2006.
Strack, M., Waddington, J. M., and Tuittila, E.-S.: Effect of water table drawdown on northern peatland methane dynamics: Implications for climate change, Global Biogeochem. Cy., 18, GB4003, https://doi.org/10.1029/2003gb002209, 2004.
Strakova, P., Penttila, T., Laine, J., and Laiho, R.: Disentangling direct and indirect effects of water table drawdown on above- and belowground plant litter decomposition: consequences for accumulation of organic matter in boreal peatlands, Global Change Biol., 18, 322–335, https://doi.org/10.1111/j.1365-2486.2011.02503.x, 2012.
Ström, L., Ekberg, A., Mastepanov, M., and Christensen, T. R.: The effect of vascular plants on carbon turnover and methane emissions from a tundra wetland, Global Change Biol., 9, 1185–1192, https://doi.org/10.1046/j.1365-2486.2003.00655.x, 2003.
Tuittila, E.-S., Väliranta, M., Laine, J., and Korhola, A.: Quantifying patterns and controls of mire vegetation succession in a southern boreal bog in Finland using partial ordinations, J. Veg. Sci., 18, 891–902, 2007.
Turetsky, M. R., Crow, S. E., Evans, R. J., Vitt, D. H., and Wieder, R. K.: Trade-offs in resource allocation among moss species control decomposition in boreal peatlands, J. Ecol., 96, 1297–1305, https://doi.org/10.1111/j.1365-2745.2008.01438.x, 2008.
Turetsky, M. R., Kotowska, A., Bubier, J., Dise, N. B., Crill, P., Hornibrook, E. R. C., Minkkinen, K., Moore, T. R., Myers-Smith, I. H., Nykanen, H., Olefeldt, D., Rinne, J., Saarnio, S., Shurpali, N., Tuittila, E.-S., Waddington, J. M., White, J. R., Wickland, K. P., and Wilmking, M.: A synthesis of methane emissions from 71 northern, temperate, and subtropical wetlands, Global Change Biol., 20, 2183–2197, https://doi.org/10.1111/gcb.12580, 2014.
Turetsky, M. R., Treat, C. C., Waldrop, M. P., Waddington, J. M., Harden, J. W., and McGuire, A. D.: Short-term response of methane fluxes and methanogen activity to water table and soil warming manipulations in an Alaskan peatland, J. Geophys. Res.-Biogeo., 113, G00A10, https://doi.org/10.1029/2007jg000496, 2008.
Wassen, M. J., Barendregt, A., Palczynski, A., Desmidt, J. T., and Demars, H.: The relationship between fen vegetation gradients, groundwater-flow and flooding in an undrained valley mire at Biebrza, Poland, J. Ecol., 78, 1106–112, https://doi.org/10.2307/2260955, 1990.
Weltzin, J. F., Pastor, J., Harth, C., Bridgham, S. D., Updegraff, K., and Chapin, C. T.: Response of bog and fen plant communities to warming and water-table manipulations, Ecology, 81, 3464–3478, https://doi.org/10.1890/0012-9658(2000)081[3464:Robafp]2.0.Co;2, 2000.
Wheeler, B. D. and Proctor, M. C. F.: Ecological gradients, subdivisions and terminology of north-west European mires, J. Ecol., 88, 187–203, https://doi.org/10.1046/j.1365-2745.2000.00455.x, 2000.
Whiting, G. J. and Chanton, J. P.: Primary production control of methane emission from wetlands, Nature, 364, 794–795, https://doi.org/10.1038/364794a0, 1993.
Wu, J., Kutzbach, L., Jager, D., Wille, C., and Wilmking, M.: Evapotranspiration dynamics in a boreal peatland and its impact on the water and energy balance, J. Geophys. Res., 115, G04038, https://doi.org/10.1029/2009JG001075, 2010.
Yavitt, J. B., Kryczka, A. K., Huber, M. E., Pipes, G. T., and Rodriguez, A. M.: Inferring methane production by decomposing tree, shrub, and grass leaf litter in bog and rich fen peatlands, Front. Environ. Sci., 7, 182, https://doi.org/10.3389/fenvs.2019.00182, 2019.
Yrjälä, K. I. M., Tuomivirta, T., Juottonen, H., Putkinen, A., Lappi, K., Tuittila, E.-S., Penttila, T., Minkkinen, K., Laine, J., Peltoniemi, K., and Fritze, H.: CH4 production and oxidation processes in a boreal fen ecosystem after long-term water table drawdown, Global Change Biol., 17, 1311–1320, https://doi.org/10.1111/j.1365-2486.2010.02290.x, 2011.
Zhang, H., Piilo, S. R., Amesbury, M. J., Charman, D. J., Gallego-Sala, A. V., and Väliranta, M. M.: The role of climate change in regulating Arctic permafrost peatland hydrological and vegetation change over the last millennium, Quat. Sci. Rev., 182, 121–130, https://doi.org/10.1016/j.quascirev.2018.01.003, 2018.
Zhang, Y., Li, C. S., Trettin, C. C., Li, H., and Sun, G.: An integrated model of soil, hydrology, and vegetation for carbon dynamics in wetland ecosystems, Global Biogeochem. Cy., 16, 1061, https://doi.org/10.1029/2001gb001838, 2002.
Zhang, Z., Zimmermann, N. E., Stenke, A., Li, X., Hodson, E. L., Zhu, G. F., Huang, C. L., and Poulter, B.: Emerging role of wetland methane emissions in driving 21st century climate change, P. Natl. Acad. Sci. USA, 114, 9647–9652, https://doi.org/10.1073/pnas.1618765114, 2017.