the Creative Commons Attribution 4.0 License.
the Creative Commons Attribution 4.0 License.
 | 15 Dec 2020
The relative importance of photodegradation and biodegradation of terrestrially derived dissolved organic carbon across four lakes of differing trophic status
Christopher M. Dempsey
Jennifer A. Brentrup
Sarah Magyan
Lesley B. Knoll
Hilary M. Swain
Evelyn E. Gaiser
Donald P. Morris
Michael T. Ganger
Craig E. Williamson
Outgassing of carbon dioxide (CO2) from freshwater ecosystems comprises 12 %–25 % of the total carbon flux from soils and bedrock. This CO2 is largely derived from both biodegradation and photodegradation of terrestrial dissolved organic carbon (DOC) entering lakes from wetlands and soils in the watersheds of lakes. In spite of the significance of these two processes in regulating rates of CO2 outgassing, their relative importance remains poorly understood in lake ecosystems. In this study, we used groundwater from the watersheds of one subtropical and three temperate lakes of differing trophic status to simulate the effects of increases in terrestrial DOC from storm events. We assessed the relative importance of biodegradation and photodegradation in oxidizing DOC to CO2. We measured changes in DOC concentration, colored dissolved organic carbon (specific ultraviolet absorbance – SUVA320; spectral slope ratio – Sr), dissolved oxygen, and dissolved inorganic carbon (DIC) in short-term experiments from May–August 2016. In all lakes, photodegradation led to larger changes in DOC and DIC concentrations and optical characteristics than biodegradation. A descriptive discriminant analysis showed that, in brown-water lakes, photodegradation led to the largest declines in DOC concentration. In these brown-water systems, ∼ 30 % of the DOC was processed by sunlight, and a minimum of 1 % was photomineralized. In addition to documenting the importance of photodegradation in lakes, these results also highlight how lakes in the future may respond to changes in DOC inputs.
- Article
(828 KB) - Full-text XML
-
Supplement
(343 KB) - BibTeX
- EndNote


Lakes are closely linked to their surrounding terrestrial ecosystems. As the lowest point in the landscape, they receive a significant influx of terrestrially derived dissolved organic carbon (DOC) and nutrients (Williamson et al., 2009; Wilkinson et al., 2013). Climate and land use changes are altering the link between lakes and their surrounding landscapes by strengthening the flow of material during extreme rain events and large wildfires or weakening it during extended periods of drought (Strock et al., 2016; Williamson et al., 2016). Long-term changes in DOC concentrations are variable and appear to be regionally controlled. In northeastern North American and western European lakes, there has been as much as a doubling of DOC concentrations due to recovery from anthropogenic acidification and climate change (Monteith et al., 2007; Williamson et al., 2015; de Wit et al., 2016). However, DOC concentrations in Greenland lakes (Saros et al., 2015) and the Mississippi River (Duan et al., 2017) have been decreasing. A long-term study of the Florida Everglades showed that some study sites were decreasing in DOC concentration, but the majority of sites were not changing (Julian et al., 2017). As DOC inputs into aquatic ecosystems have increased, stabilized, or decreased, long-term studies have focused on understanding the mechanisms behind the change, but less research has addressed the fate of DOC once it enters a lake.
By attenuating light in the water column and also providing a source of energy, DOC serves an important role in lakes by regulating the balance between photosynthesis and respiration (Williamson et al., 1999) and, thus, the flux of CO2 to the atmosphere (Cole et al., 1994). Previous studies indicated that most lakes are net heterotrophic, where the breakdown of organic carbon exceeds production (Kling et al., 1991; Cole et al., 1994). Estimates suggest that lakes respire about half of the annual 2 Gt flux of carbon to the oceans each year as CO2 (Cole et al., 1994; Tranvik et al., 2009; Tranvik, 2014). The traditional paradigm has been that the dominant mechanism causing the release of excess CO2 from lakes is the bacterial respiration of DOC (biodegradation), with photomineralization (conversion of DOC to CO2) accounting for only 10 % of bacterial rates (Granéli et al., 1996; del Giorgio et al., 1997; Jonsson et al., 2001). However, research on over 200 Arctic lakes, rivers, and streams revealed that sunlight dominated the processing of DOC, and photomineralization rates were, on average, 5× greater than dark bacterial respiration rates (Cory et al., 2014). In addition, the source of inland water CO2 remains uncertain, due in large part to a lack of measurements (Raymond et al., 2013; Lapierre et al., 2013; Weyhenmeyer et al., 2015), and predicting DOC reactivity has been challenging (Evans et al., 2017). Quantifying the dominant degradation pathways for terrestrial DOC from a range of lakes will improve estimates of carbon fluxes, particularly for mineralization rates that currently have a high degree of uncertainty (Hanson et al., 2014).
Many past studies have focused on testing the effects of photodegradation and biodegradation on DOC quantity individually, but they have not simultaneously evaluated how these two processes alter the colored dissolved organic carbon (CDOM; Granéli et al., 1996; Koehler et al., 2014; Vachon et al., 2016a). CDOM is the fraction of dissolved organic matter that is capable of absorbing light. The effects of sunlight on DOC are not isolated to only increasing mineralization rates. Photodegradation can also decrease the color and molecular weight of DOC, which can increase light availability and the subsequent bacterial respiration of DOC (Bertilsson and Tranvik, 2000; Amado et al., 2003; Chen and Jaffé, 2016). Cory et al. (2014) found the dominant degradation process for Arctic lakes to be partial photodegradation, suggesting that, in lakes, sunlight-driven changes in CDOM, without undergoing complete mineralization, may dominate DOC processing.
Since light attenuation varies so strongly among lakes of differing trophic status, testing the relative importance of DOC processing via photodegradation or biodegradation with mechanistic experiments is needed. Previous research on DOC degradation has primarily occurred in high DOC lakes, but in clear-water lakes, 1 % of surface UVA and photosynthetically active radiation (PAR), which are the primary wavelengths active in photodegradation (Osburn et al., 2001), can reach significant depths. In some oligotrophic lakes, UVA may reach up to 7 m for UVA and 14 m for PAR. In some of the clearest lakes in the world, such as Lake Tahoe, PAR can reach depths > 45 m (Rose et al., 2009a, b). Geographic location and time of year influence the amount of solar radiation lakes receive. In the subtropics, PAR and UV light have high intensity across the spectrum all year round, whereas in temperate regions those wavelengths are strongest during the summer months.
Watershed land use and lake trophic status have also been shown to influence DOC composition and reactivity (Lu et al., 2013; Hosen et al., 2014; Larson et al., 2014; Evans et al., 2017). DOC from forested systems was more reactive and had different CDOM properties when compared to disturbed environments (Lu et al., 2013; Williams et al., 2016; Evans et al., 2017). Studies examining how terrestrial DOC inputs are processed in lakes are needed, especially with the increasing frequency of extreme rain events (Rahmstorf and Coumou, 2011; Westra et al., 2014; Fischer and Knutti, 2015). Future climate change projections suggest that, for northern ecosystems, a 10 % increase in precipitation could lead to a 30 % increase in the mobilization of soil organic matter (de Wit et al., 2016). Extreme rain events deliver fresh DOC not exposed to prior sunlight into lakes, which can lead to significant reductions in light availability and increases in thermal stability and lake heterotrophy (Jennings et al., 2012; Klug et al., 2012; de Eyto et al., 2016; Zwart et al., 2016). As DOC concentrations change globally, understanding the processes that determine the fate of DOC will help predict the systems most likely to release more CO2.
Here our aim was to (1) determine the relative importance of photodegradation and biodegradation for altering terrestrial DOC quantity and CDOM from lakes of varying trophic status; (2) quantify the percentage of the initial DOC pool that was photomineralized, partially photodegraded, biodegraded or remained unprocessed; and (3) compare the effects of photodegradation on DOC quantity and CDOM across four lakes to understand differences in how terrestrial DOC from the watersheds of different lake types responds to photodegradation. Since lakes are closely linked to their surrounding landscape (i.e., soils and vegetation), we collected terrestrial DOC from the watershed of three temperate lakes and one subtropical lake, all varying in trophic status. This soil organic matter represents the current and future inputs of organic material. We studied changes in the concentration of DOC, dissolved inorganic carbon (DIC), and dissolved oxygen (DO) and measured changes in CDOM. We hypothesized that photodegradation would be more important than biodegradation in all lakes, but the strongest responses to sunlight would be observed in the brown-water lakes.
2.1 Study sites and samplers
Groundwater samples were collected from the watersheds immediately adjacent to four lakes used in this study (Table 1). All of the lakes are small, with a surface area ≤ 0.48 km2 and a maximum depth ranging from 12.5 m at Lake Waynewood to 24 m at Lake Giles. The three temperate lakes (Giles – oligotrophic; Lacawac – brown water; Waynewood – eutrophic) are in close proximity, located on the Pocono Plateau in northeastern Pennsylvania. Lake Annie (brown water) is a subtropical, sinkhole lake located on the Lake Wales Ridge in south-central Florida. These lakes were selected because of their variability in the dominant vegetation types in their watersheds that lead to differences in DOC concentration and quality (Table 1). Annie, Giles, and Lacawac are all seepage lakes within protected watersheds, and there have been no significant changes in land use or land cover over the past 30 years. The watersheds of Giles and Lacawac have > 90 % cover of mixed and northern hardwood–conifer forests, with oak trees dominating the watershed at Giles, while hemlocks represent the highest proportion of Lacawac's watershed (Moeller et al., 1995). Annie is surrounded by well-drained sandy soils and the major vegetation types include a mixed scrub community, pinelands, and oak forests (Gaiser, 2009). Both Annie and Lacawac are brown-water lakes, with moderate DOC concentrations and lower transparency (Table 1). A higher percentage of wetlands (7 % for Annie and 25 % for Lacawac) in their watersheds likely contribute to their darker color compared to the other lakes (Moeller et al., 1995; Hilary Swain, unpublished data). Waynewood is the most eutrophic lake and has the largest watershed with runoff, from dairy farms upstream, that feeds into the lake through an inlet stream. The forest surrounding Waynewood is similarly dominated by oak and hemlock trees, but there is overall less total forest cover in the watershed than at Lacawac and Giles, and there are more homes adjacent to the lake (Moeller et al., 1995). Detailed information about lake residence time calculations and annual precipitation trends can be found for the Pocono lakes (Moeller et al, 1995) and Lake Annie (Swain, 1998; Sacks et al, 1998).
Table 1Summary characteristics of the four study lakes in May–August 2013–2016 (mean ± SD). Abbreviations: SD – standard deviation; Chl a – chlorophyll a; DOC – dissolved organic carbon; GW DOC – initial groundwater DOC; PAR – photosynthetically active radiation (400–700 nm); UVA – ultraviolet A radiation (380 nm); UVB – ultraviolet B radiation (320 nm); RT – residence time.
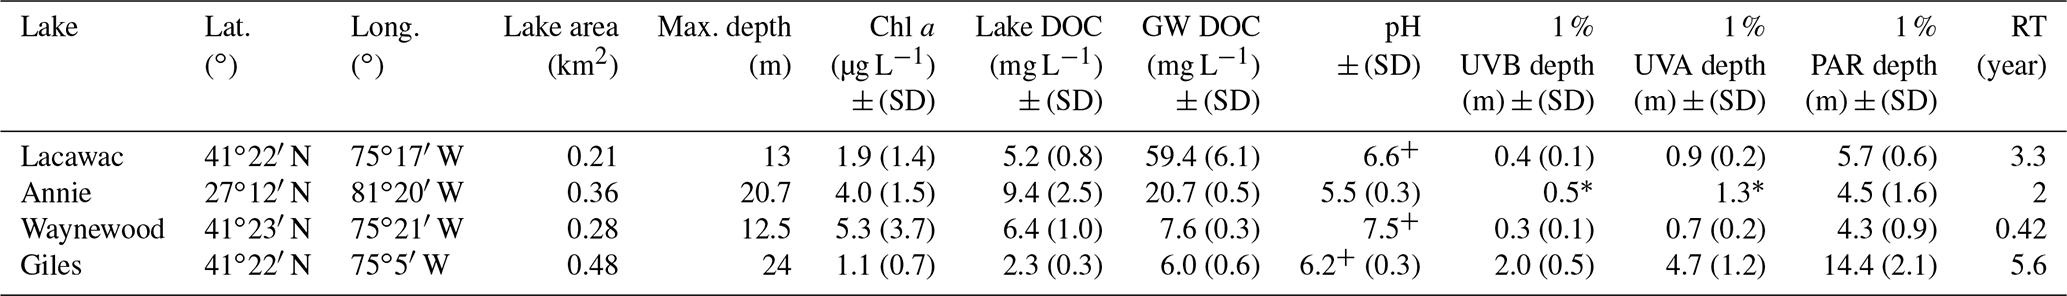
* Indicates estimates from a single profile in March 2012. +pH data in Lacawac and Waynewood are from 2015 only and from 2015–2016 in Giles.
Samplers were used to collect groundwater as a proxy for terrestrial DOC runoff entering the lakes. Storm events have been shown to mobilize DOC from shallow groundwater pools into aquatic ecosystems (Boyer et al., 1997). The samplers were installed in close proximity to the Pocono lakes near small inlet streams in sandy or bog areas on 6 July 2015 (∼ 1 year prior to experiments). The groundwater sampler consisted of 1 m sections of 7.6 cm diameter PVC pipe installed to a depth of 60–81 cm belowground. Holes of 0.5 cm were drilled in the sides, with a fine mesh covering the holes to let shallow groundwater in but exclude large particulates. At Lake Annie, a groundwater sampler was installed on 17 March 2016 on the southern side of the lake near a small, intermittent inlet stream. The groundwater sampler near Lake Annie was a 3 m section of PVC pipe installed slightly deeper (2 m belowground) to allow continuous access to groundwater during the dry season.
On 7 May 2016, 10 L of water was collected using a peristaltic pump from the groundwater samplers at all of the Pocono lakes in acid-washed 18 L bottles. Groundwater samples from Annie were collected from the sampler monthly (25 April, 31 May, 27 June, and 1 August 2016) prior to starting the experiments and shipped overnight, on ice to Pennsylvania. All groundwater samples were kept cold (4 ∘C) and dark until filtered to avoid sunlight exposure prior to the start of the experiments. Samples for the May experiments were filtered on 8 May 2016 through precombusted (450 ∘C) 0.7 µm Whatman GF/F glass microfiber filters. The remaining 8 L of groundwater for the June, July, and August experiments for each Pocono lake were filtered in a similar manner over the next 14 d. Samples were kept cold and dark until the experiments started. Samples for June, July, and August were refiltered with a precombusted 0.7 µm Whatman GF/F filter prior to the start of those experiments. The initial DOC concentration of the groundwater for each lake varied at the start of each experiment, but it was always higher than the in-lake DOC concentration (Table 1).
2.2 Sampling design and variables analyzed
To determine the relative importance of photodegradation and biodegradation for the processing of DOC, we designed three treatments in a manner similar to Cory et al. (2014), namely (1) photodegradation only, (2) biodegradation only, and (3) control. From each treatment, five different variables were measured, including DOC concentration, DIC concentration, DO concentration, specific ultraviolet absorbance (SUVA320), and spectral slope ratio (Sr). The different variables measured in each treatment required the use of different containers for the sample water. Samples for DOC analysis (concentration and CDOM) were deployed in acid-washed, muffled 35 mL quartz tubes sealed with silicone stoppers. Each quartz tube was filled to a total volume of 30 mL. The quartz tubes had an average transmittance of 96 % of solar UVA and 87 % of solar UVB, which allowed for an accurate representation of in situ solar radiation levels (Fig. S1; Morris and Hargreaves, 1997). However, the quartz tubes were not gas tight, so samples for dissolved inorganic carbon (DIC) and dissolved oxygen (DO) analysis were deployed in gas-tight borosilicate exetainer vials (138W; Labco, Ceredigion, UK). The borosilicate vials had a volume of 12 mL but were filled to 10 mL (i.e., 2 mL of headspace) due to safety concerns with mercury chloride (i.e., corrosive and acute toxicity). A clean 10 mL pipette was used to carefully transfer water into the borosilicate vials. Borosilicate glass has a sharp cut-off at 320 nm and transmits < 5 % UVB, but it transmits an average of 63 % of UVA radiation and 90 % of PAR (Fig. S1; Reche et al., 1999). The field station at Lacawac is a mixed use facility that is open to the public and supports researchers from a variety of disciplines.
Water samples for all of the treatments were initially filtered through precombusted 0.7 µm Whatman GF/F filters 1 d prior to the start of each monthly experiment. For the photodegradation and control treatments detailed below, samples for DO and DIC analysis were treated with 0.35 mL of 1 % mercury chloride (HgCl2) to kill the microbial community. HgCl2 was added with a pipette. All preparatory work for the samples occurred in the laboratory. Samples for DOC concentration and CDOM analysis (SUVA320 and Sr) for the same treatments were sterile filtered with a 0.2 µm membrane filter (Sterivex MilliporeSigma, Burlington, MA, USA) prerinsed with 100 mL of deionized (DI) water and 50 mL of sample water instead of using HgCl2 because adding HgCl2 altered the optical scans. Absorbance scans conducted prior to this experiment using water from Lacawac and Annie showed increased absorbance in samples spiked with 1 % HgCl2 (compared to non-spiked samples). There was a slight increase in absorbance from 800 to 350 nm and then a notable increase in absorbance from 350 to 200 nm. Sterile filtering has previously been shown to remove the majority of microbes present, and water samples remained sterile for 1 week following this procedure (Moran et al., 2000; Fasching and Battin, 2011). For the biodegradation treatment, water samples were inoculated with 100 µL of unfiltered groundwater that was collected 1 d prior to the start of each monthly experiment. By adding a fresh inoculum of groundwater each month, we aimed to restimulate the microbial community and assess the short-term response of biodegradation. In the biodegradation treatments, we did not correct for differences in vial size (i.e., 100 µL was added to both the 12 mL vials and the 35 mL tubes). Treatments were deployed in triplicate for each lake (i.e., three DOC quartz tubes, three DO borosilicate vials, and three DIC borosilicate vials for each treatment). Here, we include a summary of the three experimental treatments that were designed, as follows:
- a.
Photodegradation only. Water for the DOC concentration and CDOM analysis (SUVA320 and Sr) was sterile filtered and stored in quartz tubes (n=3 replicates; 30 mL total volume). Water for DIC and DO analysis was treated with 1 % HgCl2 and stored in borosilicate vials (n=6 replicates; three replicates for DIC and three replicates for DO analysis).
- b.
Biodegradation only. Water for all analyses was inoculated with 100 µL of unfiltered groundwater. Water samples for the DOC concentration and CDOM analysis were stored in quartz tubes (n=3 replicates). Water samples for the DIC and DO analysis were stored in borosilicate vials (n=6 replicates; three replicates for DIC and three replicates for DO analysis). Both the quartz tubes and borosilicate vials were wrapped with multiple layers of aluminum foil to eliminate light exposure.
- c.
Control. Water for the DOC concentration and CDOM analysis was sterile filtered and stored in quartz tubes (n=3 replicates). Water for the DIC and DO analysis was treated with 1 % HgCl2 and stored in borosilicate vials (n=6 replicates; three replicates for DIC and three replicates for DO analysis). All samples were wrapped in aluminum foil (dark).
The experimental treatments for each lake were deployed for 7 d at the surface of Lake Lacawac in May, June, July, and August 2016 (for exact sampling dates, see Table S1). Mean surface lake temperatures for each experiment are reported in Table S1. Samples were kept at the lake surface using floating racks, and samples from each lake were randomly distributed across the racks. The deployment design ensured that samples stayed at the surface and dipped no deeper than 2 cm in the water column. After the 1-week exposure, racks were collected from the surface of Lake Lacawac, and samples were immediately transferred into coolers and returned to the laboratory. We assessed the response of terrestrially derived DOC to photodegradation and biodegradation by measuring changes in the concentrations of DOC, DIC, DO, and the absorbance properties (SUVA320 and Sr) of the CDOM. All samples were analyzed within 72 h of collection.
Dissolved organic carbon concentrations and standards were analyzed using a Shimadzu TOC-VCPH total organic carbon (TOC) analyzer with an ASI-V autosampler. External acidification was used for each sample, and triplicate measurements were performed following the methods of Sharp et al. (1993). Diluted 50 ppm DOC standards (Aqua Solutions, Inc.) were used to calibrate the TOC analyzer, and standards were regularly analyzed with the samples. Dissolved inorganic carbon concentrations (as CO2) were measured with a Shimadzu GC-8A gas chromatograph, using helium as the carrier gas. Samples were acidified using 0.1 N H2SO4 and then stripped with nitrogen gas prior to injection. Dissolved oxygen was measured using a modified Winkler titration (Parson et al., 1984). Samples for gas measurements (DO and DIC) were kept in a 21 ∘C water bath for 30 min prior to analysis. These samples were well mixed just prior to analysis. The absorbance properties of CDOM were analyzed using a Shimadzu UV 1800 scanning spectrophotometer at 25 ∘C. Raw absorbance scans were generated from 800 to 200 nm, using a 1 cm cuvette, and were blank corrected with ultra-pure DI water. From the absorbance scans, the spectral slope ratio (Sr; nm) was calculated following Helms et al. (2008). The DOC-specific ultraviolet absorbance at 320 nm (SUVA320) was calculated following methods in Williamson et al. (2014). Sr can be used as a proxy for the molecular weight of the DOC, while SUVA320 can be used as a proxy for DOC color and aromatic carbon content (Helms et al., 2008; Williamson et al., 2014).
Due to differences between the borosilicate vials and quartz tubes, the DIC and DO samples were spectrally corrected for the amount of light they received (Fig. S1). Total cumulative energy exposure over the monthly incubations was calculated from a BSI GUV-521 model (Biospherical Instruments, San Diego, CA) radiometer with cosine irradiance sensors that have a nominal bandwidth of 8 nm for 305, 320, 340, 380, and 400–700 nm (PAR). Daily irradiance for UVB, UVA, and PAR were calculated using 15 min averages of 1 s readings from a GUV radiometer, located near Lake Lacawac, over the 7 d experiments. The area under the curve was calculated by multiplying the measurement frequency (900 s) by the average of two adjacent time step readings. These values were then summed over the exposure period to calculate the total cumulative energy exposure for each sample. Readings from a profiling BIC sensor (Biospherical Instruments, San Diego, CA) were then used to calculate the percent of the deck cell at the surface rack incubation depth (0.02 m) in Lake Lacawac.
2.3 Explanation of calculations and statistical analysis
To determine the fate of terrestrial DOC in the four lakes, we used the measured changes (i.e., final – control) in DOC and DIC concentrations to identify four pools of DOC, namely photomineralized, partially photodegraded, biodegraded, and unprocessed. The amount of carbon photomineralized (converted to CO2) was calculated as the concentration of DIC produced by sunlight (i.e., carbon that was completely oxidized by sunlight). The amount of carbon partially photodegraded represents the remainder of the carbon pool that was processed by sunlight (but not completely oxidized to CO2) and was calculated as the total DOC processed by sunlight minus the amount photomineralized (Eq. 1).
The amount of carbon biodegraded was calculated as the concentration of DOC lost in the biodegradation treatments. The unprocessed carbon was calculated as the fraction of the carbon pool that was not processed by either sunlight or microbes, as shown in Eq. (2) as follows:
Each process was determined for each lake and each month. Here we report the average response across all 4 months for each DOC pool.
While we carried out monthly experiments (May–August), here we report the average response across the open-water season (i.e., all 4 months) to provide a more complete picture of DOC processing. The downside of this approach is that it potentially increases variation in variables associated with DOC processing, since such processing may vary across the season. However, there was not a strong seasonal response to photodegradation or biodegradation in all of our study variables (Fig. S3). Furthermore, the majority of the terrestrial DOC was collected on a single date and time (except for Lake Annie).
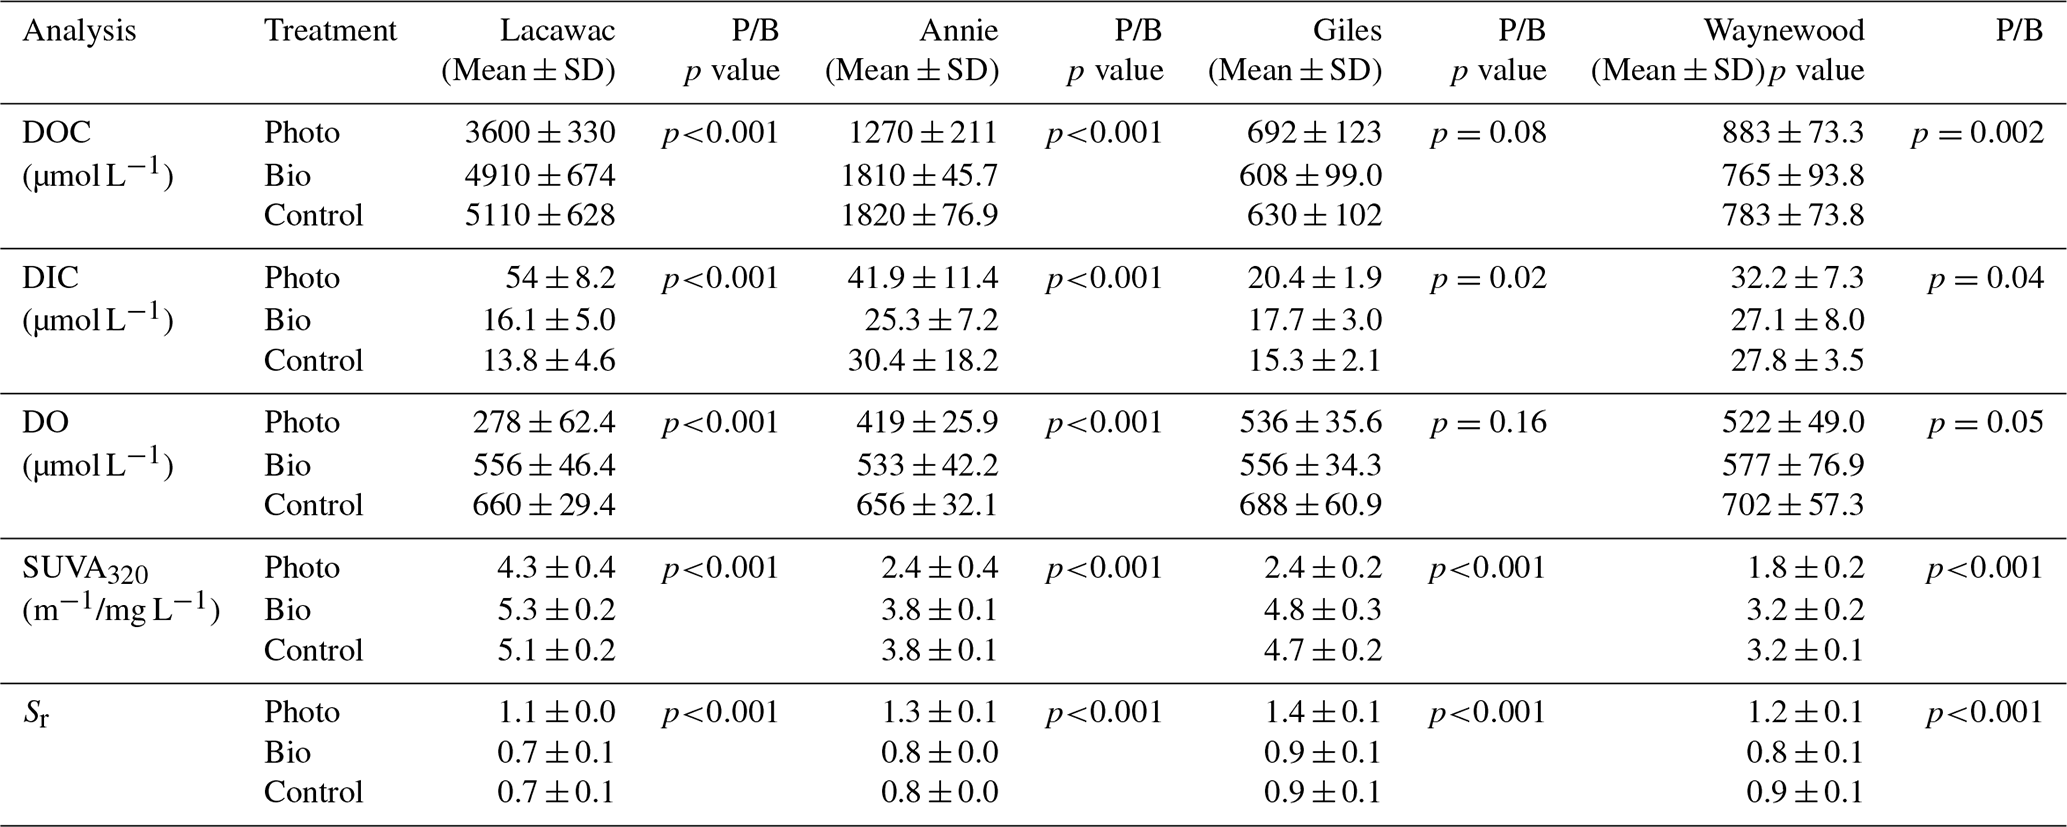
Final treatments were compared relative to the dark and killed (1 % HgCl2) control treatments, as those samples were deployed at the surface of the lake with the photodegradation and biodegradation treatments. We used a t test to determine whether the photodegradation samples for all of the variables were significantly different from the biodegradation samples (n=12 for each treatment) in each lake (Table 2). Photodegradation and biodegradation samples were analyzed separately, using a one-way analysis of variance (ANOVA) to assess differences between lakes. A post hoc Tukey's multiple comparison test (SigmaPlot 14.0) was used to determine if there were significant differences in the response variables between the lakes to the photodegradation and biodegradation treatments (Fig. 1). A descriptive discriminant analysis (DDA) was used to classify the four lakes based on changes in DOC, DIC, DO, SUVA320, and Sr measurements due to photodegradation (Fig. 3). Since these five measures are likely to be highly correlated with one another, DDA is a good choice since it considers these relationships simultaneously in the analysis (Sherry, 2006). In this case, DDA works by producing linear combinations of the five measured variables (DOC, DIC, DO, SUVA320, and Sr). The first linear combination provides the best separation of the four lakes, followed by subsequent linear combinations for axes that are orthogonal (Sherry, 2006). Linear combinations are weighted more heavily by variables that are better able to discriminate between the lakes. In the figures and tables below, we report these data as either average measured changes (i.e., concentrations) or average percent changes and have indicated where appropriate. Data for this experiment were analyzed in either SigmaPlot 14.0 (Fig. 1; Table 2) or SYSTAT version 10.2 (Fig. 4).
Throughout the results and discussion, the use of the lake names is done to present the data in a meaningful manner, but it is important to recognize that the actual water samples originated from groundwater samples adjacent to each lake.
3.1 Photodegradation and biodegradation responses in each lake
Photodegradation altered DOC quantity and CDOM significantly more than biodegradation for terrestrial DOC from the watersheds of all four lakes (Table 2; Fig. 1). For the photodegradation-only treatments, exposure to sunlight resulted in a significant production of DIC and increases in Sr and significant decreases in DO, DOC, and SUVA320 relative to the biodegradation treatments. The only significant effect of biodegradation on terrestrial DOC was a reduction in DO concentrations compared to the dark control (Fig. 1c). In all other cases, the biodegradation treatments were not significantly different to the control, and the average percent change was close to zero.
The terrestrial DOC from the brown-water lakes (Lacawac and Annie) typically followed similar patterns to each other, while the terrestrial DOC from the oligotrophic and eutrophic lakes (Giles and Waynewood) responded more similarly to each other. In the brown-water lakes, we observed a stronger response in DOC quantity (i.e., DOC, DIC, and DO), while the changes in DOC quantity were much more muted in the oligotrophic and eutrophic lakes. The responses of Sr changes in each lake due to sunlight did not differ significantly. All four lakes showed a strong response to changes in terrestrial CDOM (i.e., SUVA320 and Sr).
Table 2A summary of the mean (± SD), final concentration of DOC, DIC, DO, SUVA320, and Sr in photodegradation (Photo), biodegradation (Bio), and control experimental treatments in groundwater samples from the watersheds of lakes Lacawac, Annie, Giles, and Waynewood. The mean (± SD) initial concentration for each variable is also depicted. The P/B column lists the results of a t test to determine whether photodegradation (P) samples were significantly different from the biodegradation (B) samples (n=12 for each treatment for the 4 months). Bolded values indicate the Photo treatments that were statistically different from the Bio treatments (p<0.05).
Sunlight caused average (± SD) DOC losses relative to the control treatments of 30.5 ± 11.5 % and 28.9 ± 8.3 % in Lacawac and Annie, respectively (Fig. 1a). In Giles and Waynewood, we observed an average increase of 9.6 ± 6.5 % and 13.4 ± 6.2 % in DOC concentration, respectively, following exposure to sunlight. When we compared lakes within each treatment, there were no significant differences in DOC concentration due to sunlight in Giles vs. Waynewood, whereas Annie and Lacawac were significantly different from the prior two lakes and from each other (ANOVA – , p<0.001).
Decreases in DOC concentration due to photodegradation could lead to mineralization (i.e., DIC production; Fig. 1b) and, therefore oxidation (i.e., DO consumption; Fig. 1c). We observed the production of DIC due to sunlight in all of our lakes (Fig. 1b). In Lacawac and Annie, the average (± SD) percent increases in DIC relative to the control treatments were 350 ± 160 % and 96.0 ± 79.0 %, respectively. The average percent increases relative to controls in Giles and Waynewood were 40.7 ± 19.4 % and 23.2 ± 12.7 %, respectively. The DIC percent change was similar between Giles and Waynewood, and both were statistically different from Annie and Lacawac. The percent DIC change in Lacawac was significantly higher than Annie (ANOVA – , p<0.001).
In all lakes, both photodegradation and biodegradation led to decreases in DO concentrations (Fig. 1c). Average DO losses due to biodegradation for all four lakes ranged from 15 % to 18 %. DO losses due to photodegradation were more variable. The average DO loss from sunlight in Lacawac and Annie was 58.2 ± 7.8 % and 35.9 ± 5.4 %, respectively. In Giles and Waynewood, we observed average DO losses of 21.6 ± 7.9 % and 25.6 ± 4.7 %, respectively. While the largest losses of DO due to sunlight were observed in Annie and Lacawac, there was no significant difference between Annie and Waynewood. Giles and Lacawac were significantly different from the other two lakes and from each other (ANOVA – , p<0.001).
Changes in CDOM due to biodegradation were minimal in all of the lakes (Fig. 1d and e). In contrast, photodegradation caused significant changes in all of the lakes, but the magnitude of the change varied by lake. SUVA320 decreased in all lakes due to sunlight, but the largest changes were observed in the oligotrophic and eutrophic lakes (Fig. 1d). Average SUVA320 values decreased between 16.8 % in Lacawac and 48.9 % in Giles. The response in Annie and Waynewood was similar, whereas Lacawac and Giles were significantly different from the prior two lakes and each other (ANOVA – F, p<0.001). In all lakes, Sr increased due to sunlight (Fig. 1e). Average percent increases for the lakes ranged from 46.4 % in Waynewood to 65.1 % in Lacawac. For Sr, the response between Lacawac and Waynewood was significantly different, but those lakes were no different compared to the remaining lakes (ANOVA – , p=0.04).
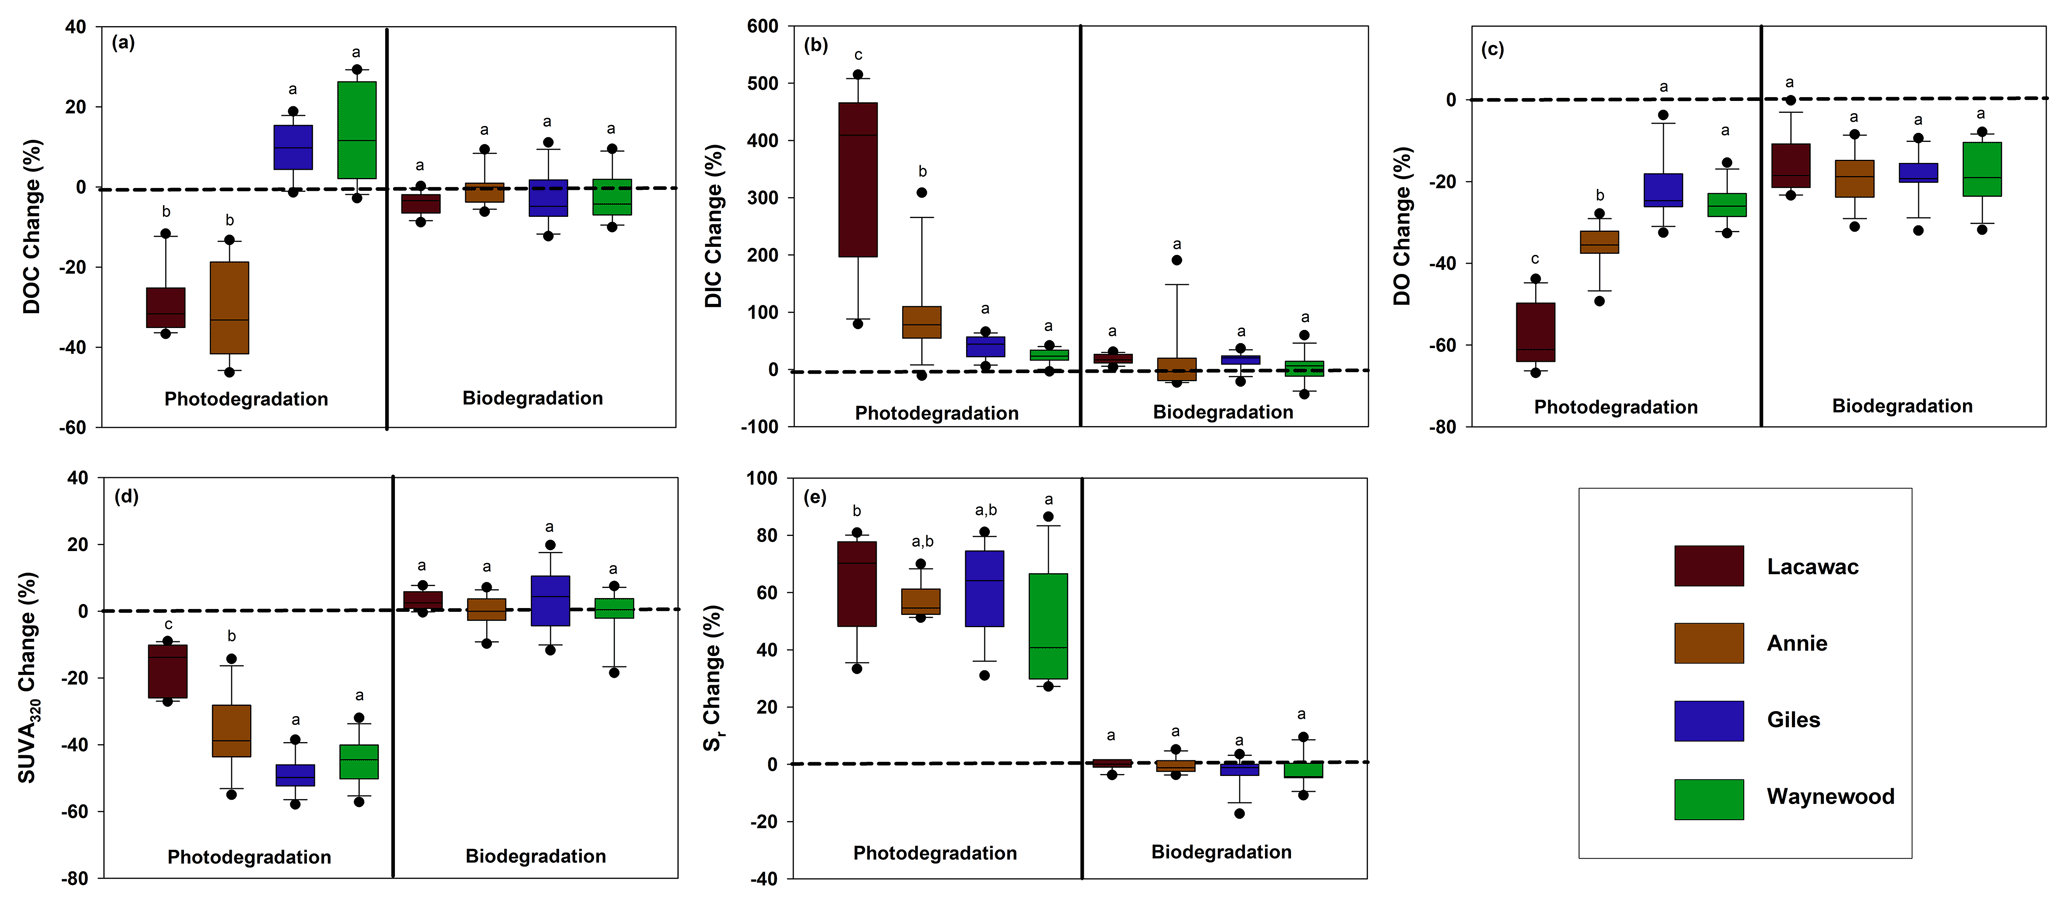
Figure 1The monthly average percent change from the dark and killed control treatments (dashed line) in each lake for photodegradation (left) and biodegradation (right) for (a) DOC, (b) DIC, (c) DO, (d) SUVA320, and (e) Sr. Statistical differences (p<0.05) between the lakes are indicated by different letters above each box plot. For each box plot, n=12 replicates.
3.2 Fate of DOC
Of the four pools of carbon we identified in the groundwater samples entering our study lakes, we found that the average amount of carbon processed by sunlight ranged from 0.6 % to ∼ 30 % (Fig. 2). Carbon in Giles and Waynewood (<1 %) showed little response to sunlight, whereas the response in Annie and Lacawac (∼ 30 %) was much higher over the 7 d experiments. The dominant pathway through which sunlight interacted with DOC was through partial photodegradation in these latter two lakes. About 1 % of the carbon pool was photomineralized in the brown-water lakes. The amount of carbon processed via biodegradation was minimal in all lakes (ranging from 0.2 % to 4 %). The fraction of the unprocessed carbon pool ranged from a low of 66 % for Lacawac to a high of 97 % for Waynewood. An average of 2.6 %–33 % of the carbon pool was processed in 1 week. The photomineralization data represents a minima value for each lake due to some of the DIC partitioning into the headspace of each vial.
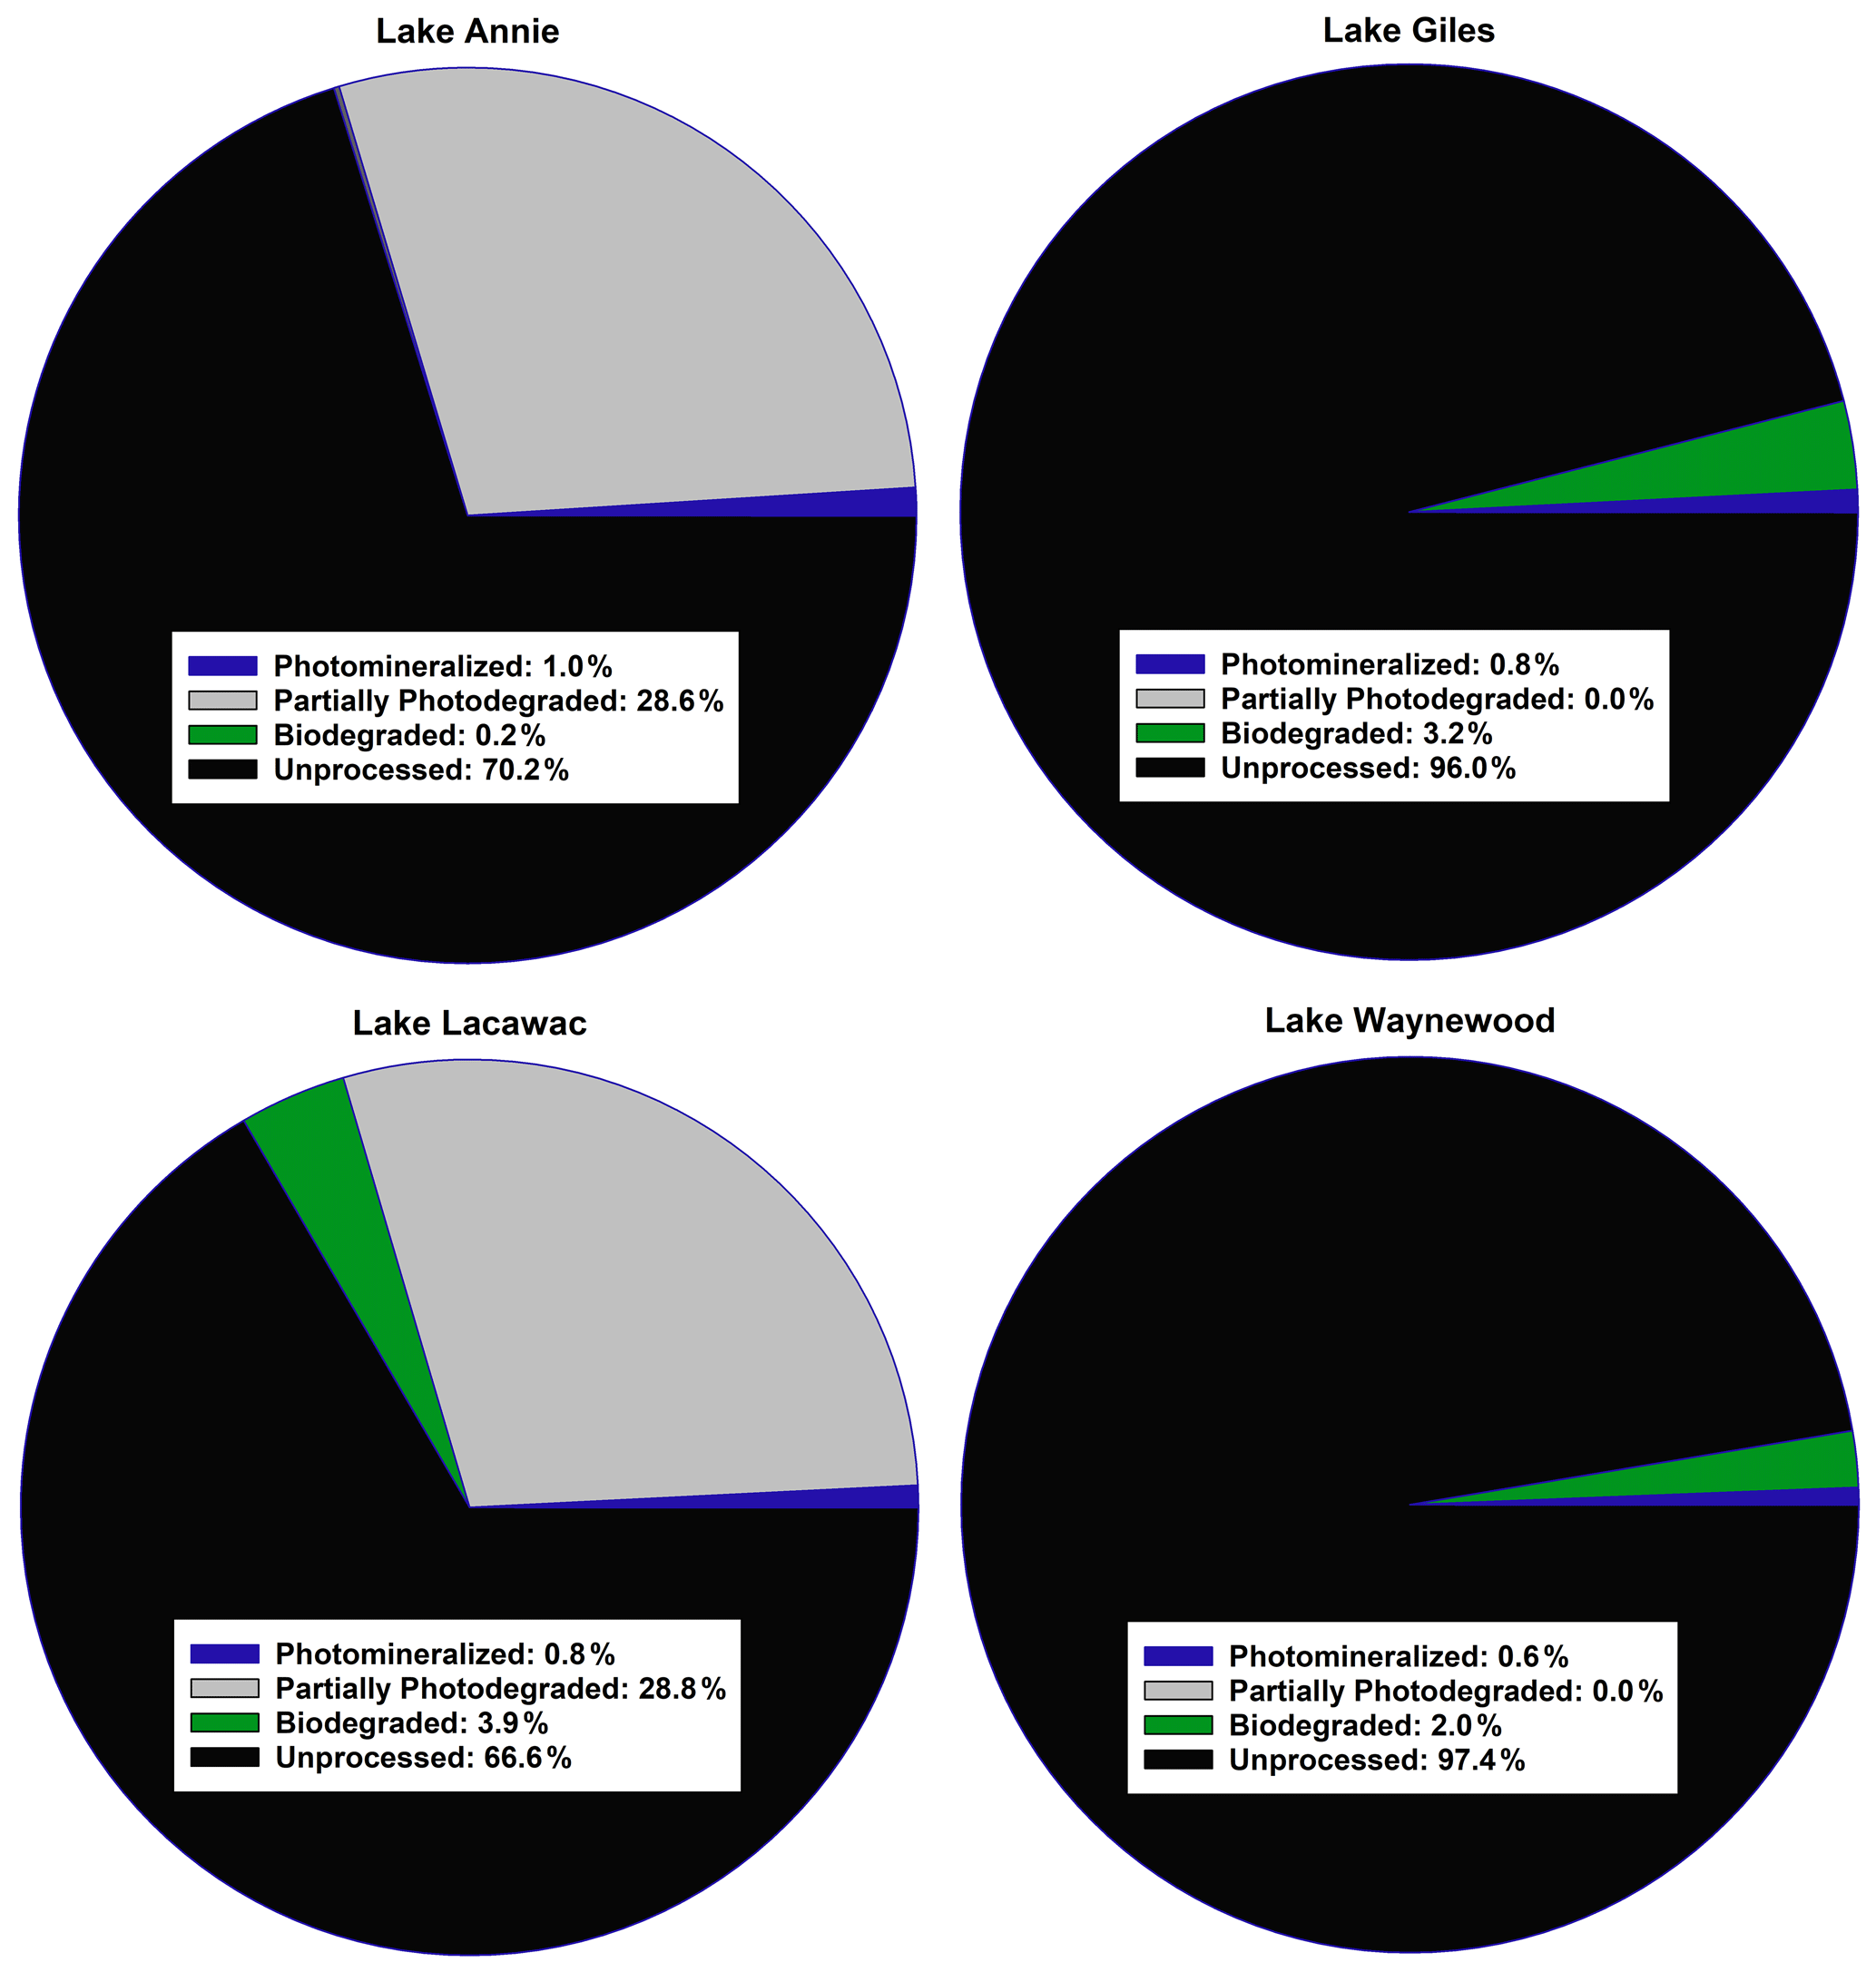
Figure 2A summary of the average fate of carbon in the groundwater samples from our study lakes (see Sect. 2 for an explanation of the calculations). All terms were converted to a carbon basis. Photomineralized describes the amount of carbon completely mineralized to CO2 by sunlight. Partially photodegraded describes the amount of carbon processed by sunlight minus the amount photomineralized. Biodegraded describes the amount of carbon lost through biodegradation. Unprocessed carbon describes the remaining carbon that was not processed by photodegradation or biodegradation.
3.3 DOC response by lake trophic status
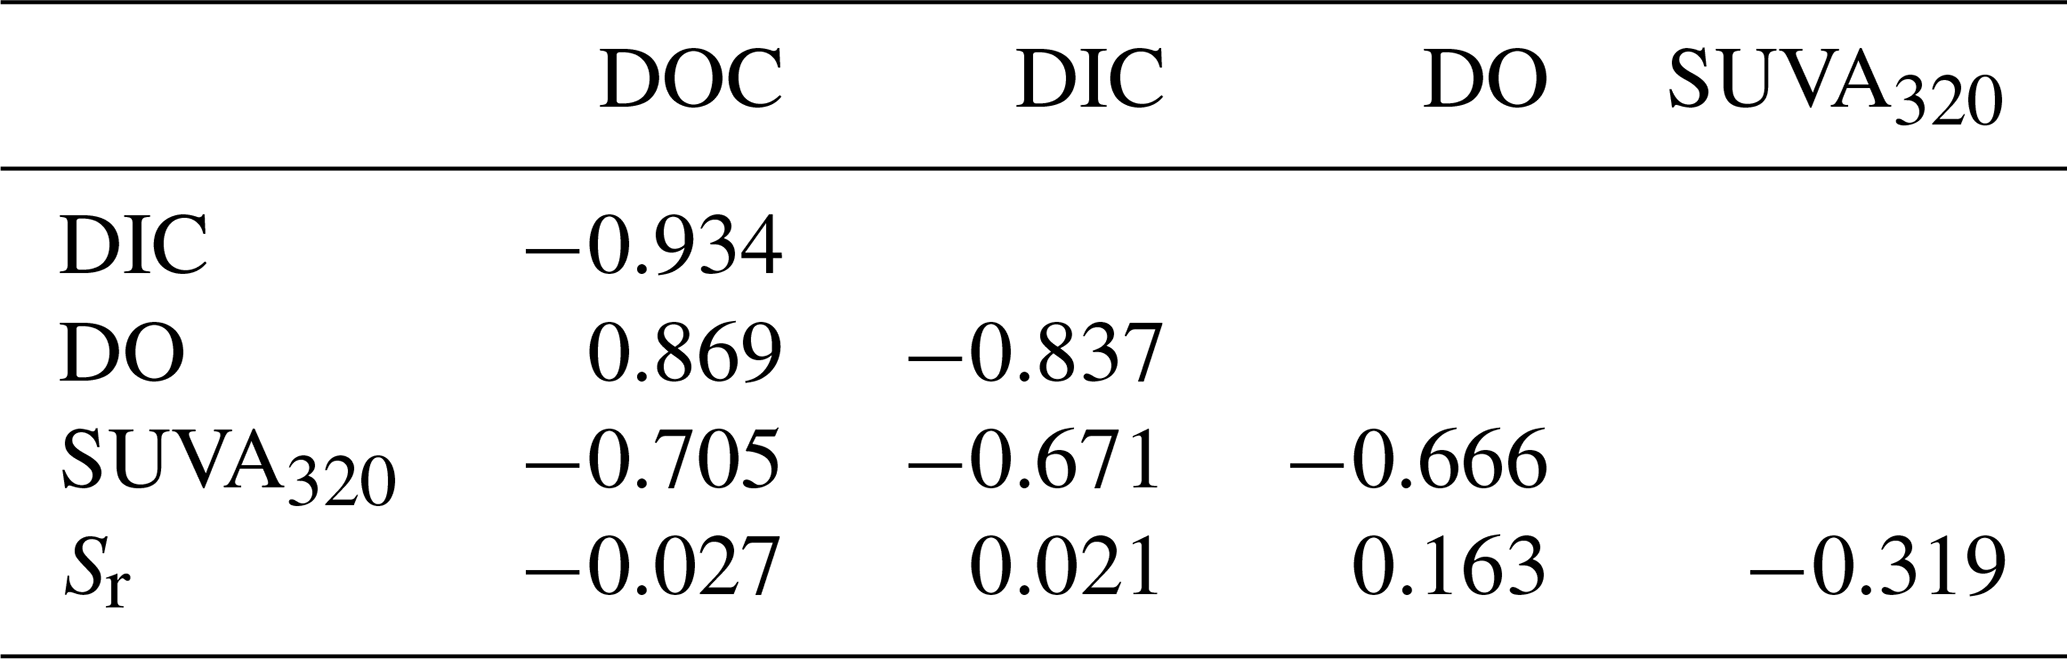
For the descriptive discriminant analysis (DDA) used to classify the lakes, we found that the five metrics were strongly correlated with one another (Table 3). In general, the changes in DOC, DIC, and DO were more strongly correlated with one another than with SUVA320 and Sr and vice versa (Table 3). We will refer to the changes in DOC, DIC, and DO as DOC quantity and the changes in SUVA320 and Sr as CDOM for brevity.
Table 3Pearson correlations between the measured changes in the five metrics, namely DOC, DIC, DO, SUVA320, and Sr.
DDA produced three functions (axes) with canonical correlations of 0.961, 0.753, and 0.181 (Fig. 3). Collectively, the entire model was significant (Wilks' λ=0.032; ; p<0.001). Effect size was calculated following Sherry and Henson (2010) as 1 (Wilks' λ), and therefore, the overall model explains 96.8 % of the variation among lakes. Functions 1 through 3 and 2 through 3 were significant (p<0.001 for both). Function 3 was not significant (p=0.710) and, therefore, is not discussed further. Functions 1 through 3 collectively explain 92.4 % of the shared variance, while functions 2 through 3 collectively explain 56.7 % of the shared variance.
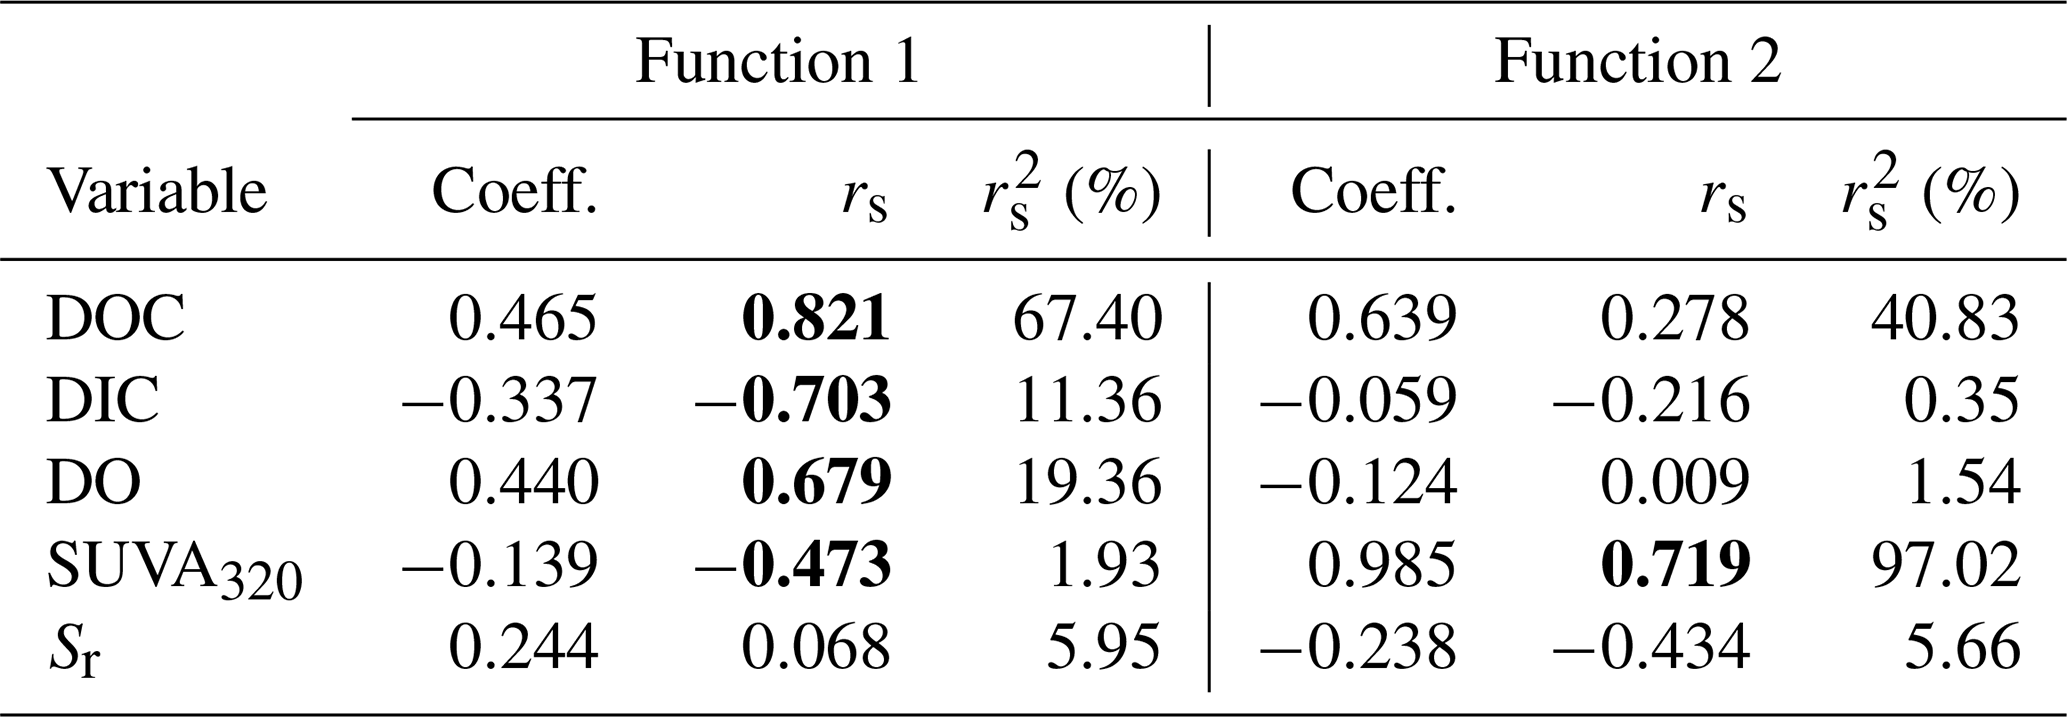
Function 1 represents a new variate that is a linear combination of the changes in the five variables that best discriminates the lakes from one another. This new variate is composed mainly of DOC, with a function coefficient of 0.465 and a structure coefficient of 0.821 (Table 4). Of note are also DIC, DO, and SUVA320, which had smaller function coefficients (< 0.45) but had large structure coefficients (> 0.45). This result suggests that function 1 is mainly related to DOC quantity. Function 2, also a new variate that is a linear combination of the five measured changes, is composed mainly of SUVA320 (function coefficient – 0.985; structure coefficient – 0.719; Table 4). Function 2 is orthogonal to function 1, and together, they discriminate the four lakes (Fig. 3).
Table 4The solution for changes in measured independent variables that predict the dependent variable of the lake. Structure coefficients (rs) and communality coefficients greater than |0.45| are indicated in bold. Note: Coeff. – standardized canonical function coefficient; rs – structure coefficient; – squared structure coefficient.
DDA correctly classified 89.4 % of the samples to their collection site (Fig. 3). One sample from Annie was incorrectly assigned to Waynewood, two samples from Giles were incorrectly assigned to Waynewood, and two samples from Lacawac were incorrectly assigned to Annie. All of the Waynewood samples were correctly classified.
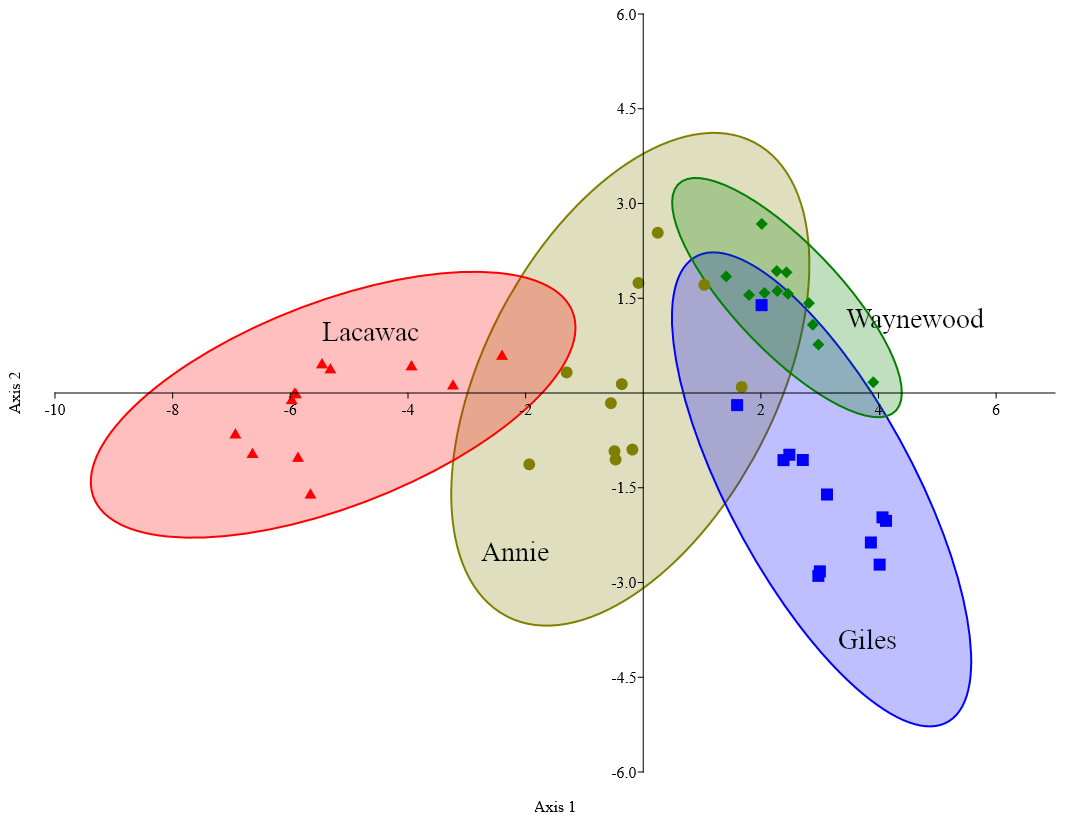
Figure 3Canonical plot scores and 95 % confidence ellipses from descriptive discriminant analysis of the measured changes (i.e.,, treatment minus control) in the five variables (DOC, DIC, DO, SUVA320, and Sr) and four lakes, namely Annie (olive circles), Giles (blue squares), Lacawac (red triangles), and Waynewood (green diamonds). Only photodegradation samples were included in this analysis.
4.1 Comparing the relative importance of photodegradation and biodegradation
Despite a large number of studies examining the effects of either photodegradation or biodegradation on DOC processing, very few have conducted simultaneous in situ experiments of the relative importance of both processes for transforming DOC from the watersheds of a range of different lakes. Our results indicate that sunlight was the primary process in the surface waters responsible for degrading terrestrial DOC from the watershed of all four lakes. Biodegradation played a minimal role in changing the DOC quantity and CDOM. We observed decreases in DOC, DO, and SUVA320 due to sunlight and saw increases in DIC and Sr. The loss of DOC and a shift to more photobleached and lower molecular weight organic material is consistent with prior studies on these lakes that only evaluated the effects of sunlight (Morris and Hargreaves, 1997). Exceptions to DOC loss due to photodegradation occurred in Giles and Waynewood. In these lakes, we observed an increase in average DOC concentrations. In Giles, there was significant production of DOC in June and July. In Waynewood, significant production occurred in May and July. We speculate that this production may be due to the lysing of any microbes remaining in solution. Increases may also be attributed to interactions with iron. We have no measurable evidence, but a number of samples from Giles and Waynewood contained a red precipitate at the conclusion of the 1-week experiments. Iron-bound DOC could have been released back into the water. Subsequent photodegradation experiments using water from Giles and Waynewood have also indicated DOC production (Dempsey, unpublished).
Dissolved oxygen was the lone variable where biodegradation led to decreases relative to the controls, but the differences between lakes were not significant. We attributed the changes in DO to the sloppy feeding of bacteria, where they produce DOC through exudates and then assimilate it (Evans et al., 2017). The above results are similar to observations in Arctic and tropical waters in that photodegradation was more important than biodegradation on short timescales (Cory et al., 2014; Chen and Jaffé, 2014; Amado et al., 2003). Interestingly, we found that terrestrial DOC from the watersheds of lakes of different trophic status was processed differently, resulting in DIC production and DOC degradation for the brown-water lakes (Lacawac and Annie), but greater changes in SUVA320 for the oligotrophic and eutrophic lakes (Giles and Waynewood). This highlights the need to account for lake trophic status in predicting DOC processing and CO2 emissions from lakes.
4.2 Dominant degradation process
Based on our study design, we were able to identify four pools of carbon, namely photomineralized, partially photodegraded, biodegraded, and unprocessed. The dominant degradation pathway across all lakes was partial photodegradation (i.e., loss of DOC but no mineralization), although the size of each carbon pool varied by lake. In the brown-water lakes, ∼ 28 % of the total carbon pool was partially photodegraded and ∼ 1 % was photomineralized. In the oligotrophic and eutrophic lakes, ∼ 0.7 % of the carbon was photomineralized and none of the carbon was partially photodegraded. The values reported here for photomineralization are underestimates. Actual values are likely to be higher since we did not account for DIC that partitioned into the headspace of the exetainer vials. If we assume a 1:1 (O2 : CO2) respiration quotient (RQ; Cory et al., 2014) and use our DO data in the Fig. 2 calculations, photomineralization in Annie and Lacawac could be as high as 13 % and 7.5 % of the carbon pool, respectively. Use of the oxygen data is less than ideal since several authors have reported RQ values different than 1:1 (Allesson et al., 2016; Xie et al., 2004).
Observations in Toolik Lake showed 70 % of the total carbon pool being processed by sunlight during the open water period (∼ 3 months; Cory et al., 2014). Other estimates have found that photomineralization of DOC accounts for only 8 %–14 % of total water column CO2 production (Granéli et al., 1996; Jonsson et al., 2001; Koehler et al., 2014; Vachon et al., 2016b). We observed ∼ 30 % of the carbon pool being processed by sunlight within 1 week in our lakes, and this was restricted to the brown-water lakes. Similar to Toolik Lake, the dominant degradation process was partial photodegradation. Partial photodegradation can alter CDOM and stimulate subsequent bacterial respiration. Degradation of CDOM can have important effects for downstream ecosystems if it can be further processed and released as CO2 or instead be buried or exported downstream (Weyhenmeyer et al., 2012; Catalan et al., 2016; Chen and Jaffé, 2014; Biddanda and Cotner, 2003). It is thus important to include all sunlight-driven degradation processes to fully account for its relative importance.
Differences between the responses observed in the Arctic and our temperate and subtropical lakes are most likely explained by the initial concentration and quality of terrestrially derived DOC and time. In the Arctic, glacial meltwater can be highly photolabile and dominated by seasonal inputs of DOC from shallow or deep soils (Cory et al., 2014; Spencer et al., 2014; and Kaiser et al., 2017). In temperate regions, DOC tends to contain more humic and fulvic acids derived from soils, which may be less photolabile than Arctic DOC. Additionally, we did not integrate our results over the entire water column because the samples were analyzed on the surface of a single lake. Over the entire water column, photodegradation could have processed additional carbon. In clear-water lakes, DOC may be photodegraded down to the 1 % UVA attenuation depth (Osburn et al., 2001), which ranged from 0.7 to 4.7 m in our study lakes (Table 1).
4.3 Response of lakes to photodegradation
With an increase in extreme precipitation events, terrestrial DOC inputs are likely to increase in many aquatic ecosystems (Rahmstorf and Coumou, 2011; Westra et al., 2014). By using groundwater as a proxy of terrestrial inputs from the watersheds of different types of lakes, we simulated the effects of storm events and compared the sensitivity of different terrestrial DOC sources to photodegradation. Interestingly, we found that DOC from the watersheds of oligotrophic and eutrophic lakes showed stronger changes in CDOM compared to DOC from the watersheds of the brown-water lakes that showed significantly larger changes in DOC quantity. This difference may be due to the more allochthonous nature of the brown-water DOC, which is highly photolabile, resulting in greater changes in DOC quantity due to its ability to absorb UV radiation (Bertilsson and Tranvik, 2000). The less allochthonous and more microbially derived DOC from the watersheds of the eutrophic and oligotrophic lakes may be less photolabile with fewer UV-absorbing chromophores. Results of the DDA may be helpful in predicting changes in other lakes based on their trophic status. SUVA320 is the variable most likely to change due to photodegradation in eutrophic and oligotrophic lakes. In contrast, DOC concentration is the variable most likely to change in brown-water lakes due to photodegradation. Both results (DOC and SUVA320) highlight how lakes of varying trophic status respond to photodegradation. These results can be used to predict how lakes not included in this study will respond to increased DOC concentrations (i.e., browning).
Across our study lakes, changes in DIC production scaled linearly with initial groundwater DOC concentration. Lacawac had the highest initial DOC concentration (59.4 ± 6.1 mg L−1) and the highest average DIC production, while Giles had the lowest initial DOC concentration (6.0 ± 0.6 mg L−1) and the lowest average DIC production. This suggests that the initial DOC concentration plays a critical role in determining the fate of DOC (Leech et al., 2014; Lapierre et al., 2013). Lake temperature can also influence photodegradation. In this study, average lake temperature increased from May through July (Table S1). Porcal et al. (2015) showed that the largest loss in DOC occurred in warmer (i.e., 25 ∘C) waters due to photodegradation. Additionally, DIC production was higher in those waters compared to colder water (9 ∘C; Porcal et al., 2015) Recent research has also reported that residence time controls organic carbon decomposition across a wide range of freshwater ecosystems (Catalan et al., 2016; Evans et al., 2017). However, extreme precipitation events may shorten the residence time of lakes, effectively flushing out fresh DOC and preventing significant in-lake degradation from occurring (de Wit et al., 2018). For the terrestrial DOC from the oligotrophic and eutrophic lakes, a significant fraction was not degraded, which may mean that terrestrial inputs from these watersheds undergo less immediate in-lake processing and instead are exported downstream. Our results indicate that differences in the fate and processing of DOC from the watersheds of a range of lake types have important implications for determining which lakes may release more CO2 versus export DOC downstream (Weyhenmeyer et al., 2012; Zwart et al., 2016; Weyhenmeyer and Conley, 2017).
Even though we observed similar responses to photodegradation in the brown-water lakes (Fig. 1), the magnitude of the response varied and may have been related to the initial DOC concentration. Initial concentrations (mg L−1) of terrestrial DOC from Lacawac (59.4 ± 6.1) were almost 3× higher than Annie (20.7 ± 0.5). Average DOC losses for both lakes due to photodegradation were ∼ 30 %. The main difference between Lacawac and Annie was the DIC percent change due to photodegradation (Fig. 1b). Average percent increases in DIC for Lacawac were close to 400 %, whereas in Annie it was ∼ 85 %. Despite the fact that both Annie and Lacawac are brown-water lakes, their different DIC production rates indicate that certain types of terrestrial DOC may be more photolabile than others and capable of outgassing large amounts of CO2. The DDA analysis also picked out the separation between Lacawac and Annie, primarily on axis 1 (DOC). The responses in Annie shared similarities with the other three lakes, while Lacawac only overlapped with Annie. When put in the context of the entire DOC pool for each lake, photomineralization accounted for 1 % of the carbon loss. We anticipated that terrestrial DOC from subtropical lakes would undergo additional microbial processing due to the higher temperatures year round. In a comparison between boreal Swedish and tropical Brazilian lakes, Graneli et al. (1998) also found strong similarities in the changes in DOC concentrations and DIC production between lakes from the different latitudes. A weak yet significant correlation between DOC concentration and DIC production has also been observed in Amazon clear-water systems (Amado et al., 2003)
Here we showed that photodegradation can be more important than biodegradation in processing watershed inputs of terrestrial DOC on short timescales in the surface waters of a lake. The responses that we observed varied with lake trophic status. Quantitative changes in DOC, DIC, and DO were strongest in the terrestrial DOC from the watersheds of the brown-water lakes, whereas the largest changes in SUVA320 were observed in the terrestrial DOC from the watersheds of the eutrophic and oligotrophic lakes. Consistent with prior studies, we found that sunlight can impact not only changes in the concentration but also CDOM characteristics. We observed a range of 2.6 %–33 % of the carbon pool processed in 1 week. As DOC concentrations increase in some aquatic ecosystems, the potential for increased CO2 outgassing due to photomineralization also increases. On short timescales, sunlight had important impacts on our study lakes. Future studies should focus on additional lakes, longer timescales, and integrating DIC production throughout the water column.
Over the next century, DOC concentrations in northern boreal lakes are projected to increase by 65 % (Larsen et al., 2011). Thus, understanding the fate of terrestrial sourced organic material will be essential for predicting the ecological consequences for lakes and downstream ecosystems (Solomon et al., 2015; Williamson et al., 2015; Finstad et al., 2016). Improving estimates of organic carbon processing in lakes will be an important component of creating more complete carbon budgets (Hanson et al., 2004, 2014), and global estimates of CO2 emissions can be more accurately scaled to reflect the ability of lakes to act as CO2 sinks or sources as browning continues (Lapierre et al., 2013; Evans et al., 2017).
Data and metadata are available through the Environmental Data Initiative at https://doi.org/10.6073/pasta/f786154967693a6e86c9b63fd9e30091 (Dempsey et al., 2020).
The supplement related to this article is available online at: https://doi.org/10.5194/bg-17-6327-2020-supplement.
CMD, JAB, and CEW designed the study with help from LBK, EEG, and HMS. CMD, JAB, SM, and HMS collected the water samples and ran the experiments. DPM provided the analytical equipment for measuring DIC and DOC. CMD and JAB analyzed the data, and CMD and MTG conducted the statistical and DDA analyses. CMD and JAB wrote the paper with contributions from all of the authors.
The authors declare that they have no conflict of interest.
We would like to thank Kevin Main, for assistance in collecting Lake Annie water samples, and Erin Overholt, for assistance in the laboratory and logistical support. Additional support was provided by the Robert Estabrook Moeller Research Fellow Award (for CMD and JAB) and the Isabel and Arthur Watres Student Research Award (SM). The authors would like to thank the four anonymous reviewers for their assistance in improving the paper.
This research has been supported by the National Science Foundation Directorate for Biological Sciences (grant nos. DBI-1318747, DBI-1542085, and DEB 1754276).
This paper was edited by Anja Engel and reviewed by two anonymous referees.
Allesson, L., Ström, L., and Berggren, M.: Impact of photochemical processing of DOC on the bacterioplankton respiratory quotient in aquatic ecosystems, Geophys. Res. Lett., 43, 7538–7545, 2016.
Amado, A. M., Farjalla, V. F., Esteves, F. A., and Bozelli, R. L.: DOC photo-oxidation in clear water Amazonian aquatic ecosystems, Amazonia, 17, 513–523, 2003.
Bertilsson, S. and Tranvik, L. J.: Photochemical transformation of dissolved organic matter in lakes, Limnol. Oceanogr., 45, 753–762, https://doi.org/10.4319/lo.2000.45.4.0753, 2000.
Biddanda, B. A. and Cotner, J. B.: Enhancement of Dissolved Organic Matter Bioavailability by Sunlight and Its Role in the Carbon Cycle of Lakes Superior and Michigan, J. Great Lakes Res., 29, 228–241, 2003.
Catalan, N., Marcé, R., Kothawala, D. N., and Tranvik, L. J.: Organic carbon decomposition rates controlled by water retention time across inland waters, Nat. Geosci., 9, 501–504, https://doi.org/10.1038/ngeo2720, 2016.
Chen, M. and Jaffé, R.: Photo- and bio-reactivity patterns of dissolved organic matter from biomass and soil leachates and surface waters in a subtropical wetland, Water Res., 61, 181–190, https://doi.org/10.1016/j.watres.2014.03.075, 2014.
Chen, M. and Jaffé, R.: Quantitative assessment of photo- and bio-reactivity of chromophoric and fluorescent dissolved organic matter from biomass and soil leachates and from surface waters in a subtropical wetland, Biogeochemistry, 129, 273–289, https://doi.org/10.1007/s10533-016-0231-7, 2016.
Cole, J. J., Caraco, N. F., Kling, G. W., and Kratz, T. W.: Carbon dioxide supersaturation in the surface waters of lakes, Science, 265, 1568–1570, 1994.
Cory, R. M., Ward, C. P., Crump, B. C., and Kling, G. W.: Sunlight controls water column processing of carbon in arctic fresh waters, Science, 345, 925–928, https://doi.org/10.1126/science.1253119, 2014.
de Eyto, E., Jennings, E., Ryder, E., Sparber, K., Dillane, M., Dalton, C., and Poole, R.: Response of a humic lake ecosystem to an extreme precipitation event: physical, chemical, and biological implications, Inland Waters, 6, 483–498, 2016.
del Giorgio, P. A., Cole, J. J., and Cimbleris, A.: Respiration rates in bacteria exceed phytoplankton production in unproductive aquatic systems, Nature, 385, 148–151, 1997.
Dempsey, C. M., Brentrup, J. A., Magyan, S., Knoll, L. B., Swain, H. M., Gaiser, E. E., Morris, D. P., Ganger, M. T., and Williamson, C. E.: Photodegradation and biodegradation of dissolved organic carbon from four lakes of varying trophic status in Pennsylvania and Florida in 2016, Environmental Data Initiative, https://doi.org/10.6073/pasta/f786154967693a6e86c9b63fd9e30091, 2020.
de Wit, H. A., Valinia, S., Weyhenmeyer, G. A., Futter, M.N., Kortelainen, P., Austnes, K., Hessen, D.O., Räïke, A., Laudon, H., and Vuorenmaa, J.: Current Browning of Surface Waters Will Be Further Promoted by Wetter Climate, Environ. Sci. Technol. Lett., 3, 430–435, https://doi.org/10.1021/acs.estlett.6b00396, 2016.
de Wit, H. A., Couture, R. M., Jackson-Blake, L., Futter, M. N., Valinia, S., Austnes, K., Guerrero, J., and Lin, Y.: Pipes or chimneys? For carbon cycling in small boreal lakes, precipitation matters most, Limnol. Oceanogr. Lett., 3, 275–284, 2018.
Duan, S., He, Y., Kaushai, S. S., Bianchi, T. S., Ward, N. D., and Guo, L.: Impact of wetland decline on decreasing dissolved organic carbon concentrations along the Mississippi River continuum, Front. Mar. Sci., 3, 280–292, https://doi.org/10.3389/fmars.2016.00280, 2017.
Evans, C. D., Futter, M. N., Moldan, F., Valinia, S., Frogbrook, Z., and Kothawala, D. N.: Variability in organic carbon reactivity across lake residence time and trophic gradients, Nat. Geosci., 3, 832–837, https://doi.org/10.1038/NGEO3051, 2017.
Fasching, C. and Battin, T. J.: Exposure of dissolved organic matter to UV-radiation increases bacterial growth efficiency in a clear-water Alpine stream and its adjacent groundwater, Aquat. Sci., 74, 143–153, https://doi.org/10.1007/s00027-011-0205-8, 2011.
Finstad, A. G., Andersen, T., Larsen, S., Tominaga, K., Blumentrath, S., de Wit, H. A., Tømmervik, H., and Hessen, D. O.: From greening to browning: Catchment vegetation development and reduced S-deposition promote organic carbon load on decadal time scales in Nordic lakes, Sci. Rep., 6, 31944–31949, https://doi.org/10.1038/srep31944, 2016.
Fischer, E. M. and Knutti, R.: Anthropogenic contribution to global occurrence of heavy precipitation and high-temperature extremes, Nat. Clim. Change, 5, 560–564, https://doi.org/10.1038/nclimate2617, 2015.
Gaiser, E. E., Deyrup, N. D., Bachmann, R. W., Battoe, L. E., and Swain, H. M.: Effects of climate variability on transparency and thermal structure in subtropical, monomictic Lake Annie, Florida, Fund. Appl. Limnol., 175, 217–230, 2009.
Granéli, W., Lindell, M., and Tranvik, L.: Photo-oxidative production of dissolved inorganic carbon in lakes of different humic content, Limnol. Oceanogr., 41, 698–706, https://doi.org/10.4319/lo.1996.41.4.0698, 1996.
Granéli, W., Lindell, M., de Faria, B. M., and de Assis Esteves, F.: Photoproduction of dissolved inorganic carbon in temperate and tropical lakes – dependence on wavelength band and dissolved organic carbon concentration, Biogeochemistry, 43, 175–195, 1998.
Hanson, P. C., Pollard, A. I., Bade, D. L., Predick, K., Carpenter, S. R., and Foley, J. A.: A model of carbon evasion and sedimentation in temperate lakes, Glob. Change Biol., 10, 1285–1298, https://doi.org/10.1111/j.1529-8817.2003.00805.x, 2004.
Hanson, P. C., Pace, M. L, Carpenter, S. R., Cole, J. J., and Stanley, E. H.: Integrating Landscape Carbon Cycling: Research Needs for Resolving Organic Carbon Budgets of Lakes, Ecosystems, 18, 363–375, https://doi.org/10.1007/s10021-014-9826-9, 2014.
Helms, J. R., Stubbins, A., Ritchie, J. D., Minor, E. C., Kieber, D. J., and Mopper, K.: Absorption spectral slopes and slope ratios as indicators of molecular weight, source, and photobleaching of chromophoric dissolved organic matter, Limnol. Oceanogr., 53, 955–969, 2008.
Hosen, J. D., McDonough, O. T., Febria, C. M., and Palmer, M. A.: Altered stream dissolved organic matter composition and bioavailability with urbanization, Environ. Sci. Technol., 48, 7817–7824, 2014.
Jennings, E., Jones, S., Arvola, L., Staehr, P. A., Gaiser, E., Jones, I. D., Weathers, K. C., Weyhenmeyer, G. A., Chiu, C., and De Eyto, E.: Effects of weather-related episodic events in lakes: an analysis based on high-frequency data, Freshwater Biol., 57, 589–601, https://doi.org/10.1111/j.1365-2427.2011.02729.x, 2012.
Jonsson, A., Meili, M., Bergström, A. K., and Jansson, M.: Whole-lake mineralization of allochthonous and autochthonous organic carbon in a large humic lake (Oertraesket, N. Sweden), Limnol. Oceanogr., 46, 1691–1700, 2001.
Julian II, P., Gerber, S., Wright, A. L., Gu, B., and Osborne, T. Z.: Carbon pool trends and dynamics within a subtropical peatland during long-term restoration, Ecol. Process., 6, 43, https://doi.org/10.1186/s13717-017-0110-8, 2017.
Kaiser, K., Candedo-Oropeza, M., McMahon, R., and Amon, R. M.: Origins and transformations of dissolved organic matter in large Arctic rivers, Sci. Rep., 7, 13064, https://doi.org/10.1038/s41598-017-12729-1, 2017.
Kling, G. W., Kipphut, G. W., and Miller, M. C.: Arctic lakes and rivers as gas conduits to the atmosphere: implications for tundra carbon budgets, Science, 251, 298–301, 1991.
Klug, J. L., Richardson, D. C., Ewing, H. A., Hargreaves, B.R., Samal, N.R., Vachon, D., Pierson, D. C., Lindsey, A. M., O'Donnell, D. M., Effler, S. W., and Weathers, K. C.: Ecosystem Effects of a Tropical Cyclone on a Network of Lakes in Northeastern North America, Environ. Sci. Technol., 46, 11693–11701, https://doi.org/10.1021/es302063v, 2012.
Koehler, B., Landelius, T., Weyhenmeyer, G. A., Machida, N., and Tranvik, L. J.: Sunlight-induced carbon dioxide emissions from inland waters, Global Biogeochem. Cy., 28, 696–711, https://doi.org/10.1002/2014GB004850, 2014.
Lapierre, J. F., Guillemette, F., Berggren, M., and del Giorgio, P. A.: Increases in terrestrially derived carbon stimulate organic carbon processing and CO2 emissions in boreal aquatic ecosystems, Nat. Commun., 4, 2972, https://doi.org/10.1038/ncomms3972, 2013.
Larsen, S., Andersen, T., and Hessen, D. O.: Climate change predicted to cause severe increase of organic carbon in lakes, Glob. Change Biol., 17, 1186–1192, https://doi.org/10.1111/j.1365-2486.2010.02257.x, 2011.
Larson, J., Frost, P., Xenopoulos, M., Williams, C., Morales-Williams, A., Vallazza, J., Nelson, J., and Richardson, W.: Relationships Between Land Cover and Dissolved Organic Matter Change Along the River to Lake Transition, Ecosystems, 17, 1413–1425, https://doi.org/10.1007/s10021-014-9804-2, 2014.
Leech, D., Snyder, M., and Wetzel, R.: Alterations in the photomineralization of allochthonous DOM related to elevated atmospheric CO2, Inland Waters, 4, 147–156, https://doi.org/10.5268/IW-4.2.626, 2014.
Lu, Y. H., Bauer, J. E., Canuel, E. A., Yamashita, Y., Chambers, Y. M., and Jaffé, R.: Photochemical and microbial alteration of dissolved organic matter in temperate headwater streams associated with different land use, J. Geophys. Res.-Biogeo., 118, 566–580, https://doi.org/10.1002/jgrg.20048, 2013.
Madronich, S.: UV radiation in the natural and perturbed atmosphere, in: Environmental effects of UV (ultraviolet) radiation, edited by: Tevini, M., Lewis Publisher, Boca Raton, Florida, 17–69, 1993.
Moeller, R. E., Williamson, C. E., Hargreaves, B. R., and Morris, D. P.: Limnology of lakes Lacawac, Giles, and Waynewood 1989–1993: An introduction to the core lakes of the Pocono Comparative Lakes Program, available from Lehigh University Library by Interlibrary Loan System, Bethlehem, PA, USA 18015, 1995.
Monteith, D. T., Stoddard, J. L, Evans, C. D., de Wit, H. A., Forsius, M., Høgåsen, T., Wilander, A., Skjelkvåle, B. L., Jeffries, D. S., Vuorenmaa, J., Keller, B., Kopácek, J., and Vesely, J.: Dissolved organic carbon trends resulting from changes in atmospheric deposition chemistry, Nature, 450, 537–540, https://doi.org/10.1038/nature06316, 2007.
Moran, M. A., Sheldon Jr., W. M. and Zepp, R. G.: Carbon loss and optical property changes during long-term photochemical and biological degradation of estuarine dissolved organic matter, Limnol. Oceanogr., 45, 1254–1264, https://doi.org/10.4319/lo.2000.45.6.1254, 2000.
Morris, D. P. and Hargreaves, B. R.: The role of photochemical degradation of dissolved organic carbon in regulating the UV transparency of three lakes on the Pocono Plateau, Limnol. Oceanogr., 42, 239–249, 1997.
Osburn, C. L., Zagarese, H. E., Morris, D. P., Hargreaves, B. R., and Cravero, W. E.: Calculation of spectral weighting functions for the solar photobleaching of chromophoric dissolved organic matter in temperate lakes, Limnol. Oceanogr., 46, 1455–1467, https://doi.org/10.4319/lo.2001.46.6.1455, 2001.
Parsons, T. R., Maita, Y., and Lalli, C. M.: A manual for chemical and biological methods for seawater analysis, Pergamon Press, 1984.
Porcal, P., Dillon, P. J., and Molot, L. A.: Temperature Dependence of Photodegradation of Dissolved Organic Matter to Dissolved Inorganic Carbon and Particulate Organic Carbon, PLoS ONE, 10, e0128884, https://doi.org/10.1371/journal.pone.0128884, 2015.
Rahmstorf, S. and Coumou, D.: Increase of extreme events in a warming world, P. Natl. Acad. Sci. USA, 108, 17905–17909, https://doi.org/10.1073/pnas.1101766108, 2011.
Raymond, P. A., Hartmann, D. L., Lauerwald, R., Sobek, S., McDonald, C., Hoover, M., Butman, D., Striegl, R., Mayorga, E., Humborg, C., Kortelainen, P., Dürr, H., Meybeck, M., Ciais, P., and Guth, P.: Global carbon dioxide emissions from inland waters, Nature, 503, 355–359, https://doi.org/10.1038/nature12760, 2013.
Reche, I., Pace, M. L., and Cole, J. J.: Relationship of trophic and chemical conditions to photobleaching of dissolved organic matter in lake ecosystems, Biogeochemistry, 44, 259–280, 1999.
Rose, K. C., Williamson, C. E., Saros, J. E., Sommaruga, R., and Fisher, J. M.: Differences in UV transparency and thermal structure between alpine and subalpine lakes: implications for organisms, Photochem. Photobiol. Sci., 8, 1244–1256, 2009a.
Rose, K. C., Williamson, C. E., Schladow, S. G., Winder, M., and Oris, J. T.: Patterns of spatial and temporal variability of UV transparency in Lake Tahoe, California-Nevada, J. Geophys. Res.-Biogeo., 114, G00D03, https://doi.org/10.1029/2008JG000816, 2009b.
Sacks, L. A., Swancar, A., and Lee, T. M.: Estimating ground-water exchange with lakes using water-budget and chemical mass-balance approaches for ten lakes in ridge areas of Polk and Highlands Counties, Florida, U.S. Geological Survey, Water-Resources Investigations Report, 98-4133, 1998.
Saros, J. E., Osburn, C. L., Northington, R. M., Birkel, S. D., Auger, J. D., Stedmon, C. A., and Anderson, N. J.: Recent decrease in DOC concentrations in Arctic lakes of southwest Greenland, Geophys. Res. Lett., 42, 6703–6709, https://doi.org/10.1002/2015GL065075, 2015.
Sharp, J. H., Peltzer, E. T., Alperin, M. J., Cauwet, G., Farrington, J. W., Fry, B., Karl, D. M., Martin, J. H., Spitzy, A., Tugrul, S., and Carlson, C. A.: Procedures subgroup report, Mar. Chem., 41, 37–49, 1993.
Sherry, A.: Discriminant analysis in counseling psychology research, The Counseling Psychologist, 34, 661–683, 2006.
Sherry, A. and Henson, R. K.: Conducting and interpreting canonical correlation analysis in personality research: A user-friendly primer, J. Personal. Assess., 84, 37–48, 2010.
Solomon, C. T., Jones, S. E. Weidel, B. C., Buffam, I., Fork, M. L., Karlsson, J., Larsen, S., Lennon, J. T., Read, J. S., Sadro, S., and Saros, J. E.: Ecosystem Consequences of Changing Inputs of Terrestrial Dissolved Organic Matter to Lakes: Current Knowledge and Future Challenges, Ecosystems, 18, 376–389, https://doi.org/10.1007/s10021-015-9848-y, 2015.
Spencer, R. G. M., Guo, W., Raymond, P. A., Dittmar, T., Hood, E., Fellman, J., and Stubbins, A.: Source and biolability of ancient dissolved organic matter in glacier and lake ecosystems on the Tibetan Plateau, Geochem. Cosmochim. Ac., 142, 64–74, 2014.
Strock, K. E., Saros, J. E., Nelson, S. J., Birkel, S. D., Kahl, J. S., and McDowell, W. H.: Extreme weather years drive episodic changes in lake chemistry: implications for recovery from sulfate deposition and long-term trends in dissolved organic carbon, Biogeochemistry, 127, 353–365, https://doi.org/10.1007/s10533-016-0185-9, 2016.
Swain, H.: Archbold Biological Station and the Macarthur Agro-Ecology Research Center, B. Ecol. Soc. Am., 79, 114–120, 1998.
Tranvik, L.: Carbon cycling in the Arctic, Science, 345, p. 870, https://doi.org/10.1126/science.1258235, 2014.
Tranvik, L. J., Downing, J. A., Cotner, J. B., Loiselle, S. A., Striegl, R. G., Ballatore, T. J., Dillon, P., Finlay, K., Fortino, K., Knoll, L. B., Kortelainen, P. L., Kutser, T., Larsen, S., Laurion, I., Leech, D. M., McCallister, S. L., McKnight, D. M., Melack, J. M., Overholt, E., Porter, J. A., Prairie, Y., Renwick, W. H., Roland, F., Sherman, B. S., Schinlder, D. W., Sobek, S., Tremblay, A., Vanni, M. J., Verschoor, A. M., von Wachenfeldt, E., and Weyhenmeyer, G. A.: Lakes and reservoirs as regulators of carbon cycling and climate, Limnol. Oceanogr., 54, 2298–2314, 2009.
Vachon, D., Solomon, C. T., and del Giorgio, P. A.: Reconstructing the seasonal dynamics and relative contribution of the major processes sustaining CO2 emissions in northern lakes, Limnol. Oceanog., 62, 706–722, https://doi.org/10.1002/lno.10454, 2016a.
Vachon, D., Lapierre, J. F., and del Giorgio, P. A.: Seasonality of photochemical dissolved organic carbon mineralization and its relative contribution to pelagic CO2 production in northern lakes, J. Geophys. Res.-Biogeo., 121, 864–878, https://doi.org/10.1002/2015JG003244, 2016b.
Westra, S., Fowler, H. J., Evans, J. P., Alexander, L. V., Berg, P., Johnson, F., Kendon, E. J., Lenderink, G., and Roberts, N. M.: Future changes to the intensity and frequency of short-duration extreme rainfall, Rev. Geophys., 52, 522–555, https://doi.org/10.1002/2014RG000464, 2014.
Weyhenmeyer, G. A., Fröberg, M., Karltun, E., Khalil, M., Kothawala, D., Temnerud, J., and Tranvik, L. J.: Selective decay of terrestrial organic carbon during transport from land to sea, Glob. Change Biol., 18, 349–355, 2012.
Weyhenmeyer, G. A., Kosten, S., Wallin, M. B., Tranvik, L. J., Jeppesen, E., and Roland, F.: Significant fraction of CO2 emissions from boreal lakes derived from hydrologic inorganic carbon inputs, Nat. Geosci., 8, 933–936, https://doi.org/10.1038/ngeo2582, 2015.
Weyhenmeyer, G. A. and Conley, D. J.: Large differences between carbon and nutrient loss rates along the land to ocean aquatic continuum-implications for energy : nutrient ratios at downstream sites, Limnol. Oceanogr., 10, 141–11, https://doi.org/10.1002/lno.10589, 2017.
Wilkinson, G. M., Pace, M. L., and Cole, J. J.: Terrestrial dominance of organic matter in north temperate lakes, Global Biogeochem. Cy., 27, 43–51, https://doi.org/10.1029/2012GB004453, 2013.
Williams, C. J., Frost, P. C., Morales-Williams, A. M., Larson, J. H., Richardson, W. B., Chiandet, A. S., and Xenopoulos, M. A.: Human activities cause distinct dissolved organic matter composition across freshwater ecosystems, Glob. Change Biol., 22, 613–626, https://doi.org/10.1111/gcb.13094, 2016.
Williamson, C. E., Morris, D. P., Pace, M. L., and Olson, O. G.: Dissolved organic carbon and nutrients as regulators of lake ecosystems: Resurrection of a more integrated paradigm, Limnol. Oceanogr., 44, 795–803, 1999.
Williamson, C. E., Saros, J. E., Vincent, W. F., and Smol, J. P.: Lakes and reservoirs as sentinels, integrators, and regulators of climate change, Limnol. Oceanogr., 54, 2273–2282, 2009.
Williamson, C. E., Brentrup, J. A., Zhang, J., Renwick, W. H., Hargreaves, B. R., Knoll, L. B., Overholt, E. P., and Rose, K. C.: Lakes as sensors in the landscape: Optical metrics as scalable sentinel responses to climate change, Limnol. Oceanogr., 59, 840–850, 2014.
Williamson, C. E., Overholt, E. P., Pilla, R. M., Leach, T. H., Brentrup, J. A., Knoll, L. B., Mette, E. M., and Moeller, R. E.: Ecological consequences of longterm browning in lakes, Sci. Rep., 5, 18666, https://doi.org/10.1038/srep18666, 2015.
Williamson, C. E., Overholt, E. P, Brentrup, J. A., Pilla, R. M., Leach, T. H., Schladow, S. G., Warren, J. D., Urmy, S. S., Sadro, S., Chandra, S., and Neale, P. J.: Sentinel responses to droughts, wildfires, and floods: effects of UV radiation on lakes and their ecosystem services, Front. Ecol. Environ., 14, 102–109, https://doi.org/10.1002/fee.1228, 2016.
Xie, H., Zafiriou, O. C., Cai, W.-J., Zepp, R. G., and Wang, Y.: Photooxidation and Its Effects on the Carboxyl Content of Dissolved Organic Matter in Two Coastal Rivers in the Southeastern United States, Environ. Sci. Technol., 38, 4113–4119, 2004.
Zwart, J. A., Craig, N., Kelly, P. T., Sebestyen, S. D., Solomon, C. T., Weidel, B. C., and Jones, S. E.: Metabolic and physiochemical responses to a whole-lake experimental increase in dissolved organic carbon in a north-temperate lake, Limnol. Oceanogr., 61, 723–734, https://doi.org/10.1002/lno.10248, 2016.