the Creative Commons Attribution 4.0 License.
the Creative Commons Attribution 4.0 License.
 | 23 Dec 2020
The suspended small-particle layer in the oxygen-poor Black Sea: a proxy for delineating the effective N2-yielding section
Rafael Rasse
Hervé Claustre
Antoine Poteau
The shallower oxygen-poor water masses of the ocean confine a majority of the microbial communities that can produce up to 90 % of oceanic N2. This effective N2-yielding section encloses a suspended small-particle layer, inferred from particle backscattering (bbp) measurements. It is thus hypothesized that this layer (hereafter, the bbp-layer) is linked to microbial communities involved in N2 yielding such as nitrate-reducing SAR11 as well as sulfur-oxidizing, anammox, and denitrifying bacteria – a hypothesis yet to be evaluated. Here, data collected by three BGC-Argo floats deployed in the Black Sea are used to investigate the origin of this bbp-layer. To this end, we evaluate how the key drivers of N2-yielding bacteria dynamics impact the vertical distribution of bbp and the thickness of the bbp-layer. In conjunction with published data on N2 excess, our results suggest that the bbp-layer is at least partially composed of the bacteria driving N2 yielding for three main reasons: (1) strong correlations are recorded between bbp and nitrate; (2) the top location of the bbp-layer is driven by the ventilation of oxygen-rich subsurface waters, while its thickness is modulated by the amount of nitrate available to produce N2; and (3) the maxima of both bbp and N2 excess coincide at the same isopycnals where bacteria involved in N2 yielding coexist. We thus advance that bbp and O2 can be exploited as a combined proxy to delineate the N2-yielding section of the Black Sea. This proxy can potentially contribute to refining delineation of the effective N2-yielding section of oxygen-deficient zones via data from the growing BGC-Argo float network.
- Article
(10548 KB) - Full-text XML
- BibTeX
- EndNote


Oxygen-poor water masses (O2 < 3 µM) host the microbial communities that produce between 20 % and 40 % of oceanic N2 mainly via heterotrophic denitrification and anaerobic oxidation of ammonium (Gruber and Sarmiento, 1997; DeVries et al., 2013; Ward, 2013). The shallower oxygen-poor water masses (∼ 50–200 m) are the most effective N2-producing section because this is where the microbial communities that condition the process mainly develop and generate up to 90 % of the N2 (Ward et al., 2009; Dalsgaard et al., 2012; Babbin et al., 2014). These microbial communities include nitrate-reducing SAR11 and anammox, denitrifying, and sulfur-oxidizing bacteria (e.g., Canfield et al., 2010; Ulloa et al., 2012; Ward, 2013; Tsementzi et al., 2016; Callbeck et al., 2018). It is thus important to unravel the biogeochemical parameters that trigger the accumulation of such bacteria in the ocean's oxygen-poor water masses. This information is crucial for understanding and quantifying how bacterial biomass and related N2-yielding bacteria can respond to the ongoing expansion of oceanic regions with low oxygen (Keeling and Garcia, 2002; Stramma et al., 2008; Helm et al., 2011; Schmidtko et al., 2017). Ultimately, greater accuracy in this domain can contribute to improving mechanistic predictions on how such expansion will affect the oceans' role in driving the Earth's climate by sequestering atmospheric carbon dioxide (e.g., Oschlies et al., 2018).
In oxygen-poor water masses, the biogeochemical factors that can affect the abundance of denitrifying and anammox bacteria are the levels of O2, organic matter (OM), nitrate (NO), ammonium (NH), and hydrogen sulfide (H2S) (Murray et al., 1995; Ward et al., 2008; Dalsgaard et al., 2014; Bristow et al., 2016). Therefore, to elucidate what triggers the confinement of such bacteria, we need to investigate how the above biogeochemical factors drive their vertical distribution, with high temporal and vertical resolution. To this end, we should develop multidisciplinary approaches that allow us to permanently monitor the full range of biogeochemical variables of interest in oxygen-poor water masses.
Optical proxies of tiny particles can be applied as an alternative approach to assess the vertical distribution of N2-yielding microbial communities in oxygen-poor water masses (Naqvi et al., 1993). For instance, nitrate-reducing SAR11 and anammox, denitrifying, and sulfur-oxidizing bacteria are found as free-living bacteria (0.2–2 µm) and can be associated with small suspended (> 2–30 µm) and large sinking (> 30 µm) particles (Fuchsman et al., 2011, 2012a, 2017; Ganesh et al., 2014, 2015). Therefore, particle backscattering (bbp), a proxy for particles in the ∼ 0.2–20 µm size range (Stramski et al., 1999, 2004; Organelli et al., 2018), can serve to detect the presence of these free-living bacteria and those associated with small suspended particles.
Time series of bbp acquired by biogeochemical Argo (BGC-Argo) floats highlight the presence of a permanent layer of suspended small particles in shallower oxygen-poor water masses (bbp-layer) (Whitmire et al., 2009; Wojtasiewicz et al., 2020). It has been hypothesized that this bbp-layer is linked to N2-yielding microbial communities such as nitrate-reducing SAR11 and denitrifying, anammox, and sulfur-oxidizing bacteria. However, this hypothesis has not yet been clearly demonstrated. To address this, the first step is to evaluate (1) potential correlations between the biogeochemical factors that control the presence of the bbp-layer and such arrays of bacteria (O2, NO, OM, H2S; Murray et al., 1995; Ward et al., 2008; Fuchsman et al., 2011; Ulloa et al., 2012; Dalsgaard et al., 2014; Bristow et al., 2016) and (2) the possible relationship between the bbp-layer and N2 produced by microbial communities.
This first step is thus essential for identifying the origin of the bbp-layer and, ultimately, determining whether BGC-Argo observations of bbp can be implemented to delineate the oxygen-poor water masses where such bacteria are confined. The Black Sea appears a suitable area for probing into the origin of the bbp-layer in low-oxygen waters in this way. It is indeed a semi-enclosed basin with permanently low O2 levels where N2 production and related nitrate-reducing SAR11 and denitrifying and anammox bacteria are mainly confined within a well-defined oxygen-poor zone (Kuypers et al., 2003; Konovalov et al., 2005; Kirkpatrick et al., 2012). In addition, a permanent bbp-layer is a typical characteristic of this region, which is linked to such microbial communities and inorganic particles (Stanev et al., 2017, 2018; see details in Sect. 2).
The goal of our study is therefore to investigate the origin of the bbp-layer in the oxygen-poor waters of the Black Sea using data collected by BGC-Argo floats. More specifically, we aim to evaluate, within the oxygen-poor zone, how (1) two of the main factors (O2 and NO) that drive the dynamics of denitrifying and anammox bacteria impact the location and thickness of the bbp-layer, (2) NO controls the vertical distribution of bbp within this layer, (3) temperature drives the formation of the bbp-layer and consumption rates of NO, and (4) particle content inferred from bbp and N2 produced by microbial communities can be at least qualitatively correlated. Ultimately, our findings allow us to infer that bbp can potentially be used to detect the presence of the microbial communities that drive N2 production in oxygen-poor water masses – including nitrate-reducing SAR11 and sulfur-oxidizing, denitrifying, and anammox bacteria.
The oxygen-poor water masses of the Black Sea are characterized by a permanent layer of suspended small particles constituted of organic and inorganic particles (Murray et al., 1995; Kuypers et al., 2003; Konovalov et al., 2005; Kirkpatrick et al., 2012). In the oxygen-poor (O2 < 3 µM) section with detectable NO and undetectable H2S levels, organic particles are mainly linked to microbial communities involved in the production of N2, and these include nitrate-reducing SAR11 and anammox, denitrifying, and sulfur-oxidizing bacteria (Kuypers et al., 2003; Lam et al., 2007; Yakushev et al., 2007; Fuchsman et al., 2011; Kirkpatrick et al., 2012). The first group listed, SAR11, provides NO for N2 yielding and makes the largest contribution (20 %–60 %) to N2-yielding bacteria biomass (Fuchsman et al., 2011, 2017; Tsementzi et al., 2016). Meanwhile, the second and third groups of bacteria make a smaller contribution to microbial biomass (∼10 %; e.g., Fuchsman et al., 2011, 2017) but dominate N2 yielding via anammox () and heterotrophic denitrification () (Murray et al., 2005; Kirkpatrick et al., 2012; DeVries et al., 2013; Ward, 2013). The last group can potentially produce N2 via autotrophic denitrification (e.g., ; Sorokin, 2002; Konovalov et al., 2003; Yakushev et al., 2007). Finally, Epsilonproteobacteria are the major chemoautotrophic bacteria that form organic particles in the sulfidic zone (e.g., oxygen-poor section with detectable sulfide levels (> 0.3 µM) but undetectable NO; Coban-Yildiz et al., 2006; Yilmaz et al., 2006; Grote et al., 2008; Canfield and Thamdrup, 2009; Glaubitz et al., 2010; Ediger et al., 2019). However, they can also be involved in the production of N2 and linked formation of organic particles in the oxygen-poor section with detectable levels of sulfide and NO (see Fig. 1, e.g., Epsilonproteobacteria Sulfurimonas acting as an autotrophic denitrifier; Glaubitz et al., 2010; Fuchsman et al., 2012b; Kirkpatrick et al., 2018).
The inorganic component is mainly due to sinking particles of manganese oxides (Mn, III, IV) that are formed due to the oxidation of dissolved Mn (II, III) pumped from the sulfidic zone (e.g., ; Konovalov et al., 2003; Clement et al., 2009; Dellwig et al., 2010). Ultimately, sinking particles of manganese oxides are dissolved back to Mn (II, III), mainly via chemosynthetic bacteria that drive sulfur reduction (e.g., ; Jørgensen et al., 1991; Konovalov et al., 2003; Johnson, 2006; Yakushev et al., 2007; Fuschman et al., 2011; Stanev et al., 2018). Overall, these arrays of bacteria mediate the reactions described above by using electron acceptors according to the theoretical “electron tower” (e.g., ; Stumm and Morgan, 1970; Murray et al., 1995; Canfield and Thamdrup, 2009). Therefore, the vertical distributions of NO, N2 excess, and content of small particles are driven by the reactions that occur in the chemical zones of oxygen-poor water masses (e.g., nitrogenous and manganous zones, which correspond to the sections where NO and Mn(IV), respectively, are predominantly used as electron acceptors; Murray et al., 1995; Konovalov et al., 2003; Yakushev et al., 2007; Canfield and Thamdrup, 2009; see also Sect. 4.2 and 4.3).
3.1 Bio-optical and physicochemical data measured by BGC-Argo floats
We used data collected by three BGC-Argo floats that profiled at a temporal resolution of 5–10 d in the first 1000 m depth of the Black Sea from December 2013 to July 2019 (Fig. 1). These floats – allocated World Meteorological Organization (WMO) numbers 6900807, 6901866, and 7900591 – collected 239, 301, and 518 vertical profiles, respectively. BGC-Argo float 6901866 was equipped with four sensors: (1) a SBE-41 CP conductivity–T–depth sensor (Sea-Bird Scientific), (2) an Aanderaa 4330 optode (serial number 1411, O2 range 0–1000 µM, with an accuracy of 1.5 %), (3) a WETLabs ECO Triplet Puck, and (4) a Satlantic Submersible Ultraviolet Nitrate Analyzer (SUNA). These sensors measured upward profiles of (1) temperature (T), conductivity, and depth, (2) dissolved oxygen (O2), (3) chlorophyll fluorescence, total optical backscattering (particles + pure seawater) at 700 nm, and fluorescence by colored dissolved organic matter, and (4) nitrate (NO; detection limit of ∼0.5 µM with T ∕ salinity correction processing) and bisulfide (HS−, detection limit of ∼0.5 µM; Stanev et al., 2018). Floats 6900807 and 7900591 were equipped with only the first three sensors.
Raw data of fluorescence and total backscattering were converted into chlorophyll concentration (chl) and particle backscattering (bbp) following standard protocols, respectively (Schmechtig et al., 2014, 2015). Spike signals in vertical profiles of chl and bbp and due to particle aggregates were removed by using a median filter with a window size of three data points (Briggs et al., 2011). NO, HS−, and O2 data were processed following BGC-Argo protocols (Bittig and Körtzinger, 2015; Johnson et al., 2018; Thierry et al., 2018). Sampling regions covered by the three floats encompassed most of the Black Sea area (Fig. 1 and Appendix A). However, we only used data collected during periods without a clear injection of small particles derived from the productive layer and Bosporus plume (e.g., advection of water masses, Stanev et al., 2017). This restriction allowed us to focus on the in situ 1D processes driving local formation of the bbp-layer, with minimal interference from any possible external sources of small particles.
We only describe the time series of data collected by float 6901866 because this was the only float carrying a NO/HS− sensor. Data acquired by floats 6900807 and 7900591 are described in Appendix A and nevertheless used as complementary data to those of float 6901866 to corroborate (1) qualitative correlations between O2 levels and the location of the bbp-layer and (2) consistency in the location of the bbp maximum within the bbp-layer.
3.2 Defining the oxygen-poor zone, mixed-layer depth, and productive layer
We used O2 and NO to, respectively, define the top and bottom isopycnals of the oxygen-poor zone where denitrifying and anammox bacteria are expected to be found. To set the top isopycnal, we applied an O2 threshold of ∼ 3 µM because denitrifying and anammox bacteria seem to tolerate O2 concentrations beneath this threshold (Jensen et al., 2008; Dalsgaard et al., 2014; Babbin et al., 2014). The bottom isopycnal was defined as the deepest isopycnal at which NO was detected by the SUNA sensor (0.23±0.32 µM). NO was used to set this isopycnal because heterotrophic denitrification and subsequent reactions cannot occur without NO (Lam et al., 2009; Bristow et al., 2017). HS− was not used to delimit the bottom of this zone because the maximum concentration of HS− that denitrifying and anammox bacteria tolerate is not well established (Murray et al., 1995; Kirkpatrick et al., 2012; see also Sect. 4.1).
Mixed-layer depth (MLD) was computed as the depth at which density differed from 0.03 kg m−3 with respect to the density recorded at 1 m depth (de Boyer Montégut et al., 2004). We used chl to define the productive layer where living phytoplankton were present and producing particulate organic carbon. The base of this layer was set as the depth at which chl decreased below 0.25 mg m−3. This depth was used only as a reference to highlight the periods when surface-derived small particles were clearly injected into the oxygen-poor zone.
3.3 Complementary cruise data on N2 excess and NO
Published data on N2 : Ar ratios and NO collected in the southwest of the Black Sea in March 2005 (Fuchsman et al., 2008, 2019) were exploited to complement discussion of our results. N2 produced by anaerobic microbial communities (N2 excess, µM) was estimated from N2 : Ar ratios and argon concentrations at atmospheric saturation (Hamme and Emerson, 2004). N2 excess data were used to (1) describe the oxygen-poor zone where N2 is expected to be predominantly produced and (2) highlight qualitative correlations between N2 excess, the location of the bbp-layer, and vertical distribution of small particles within the bbp-layer.
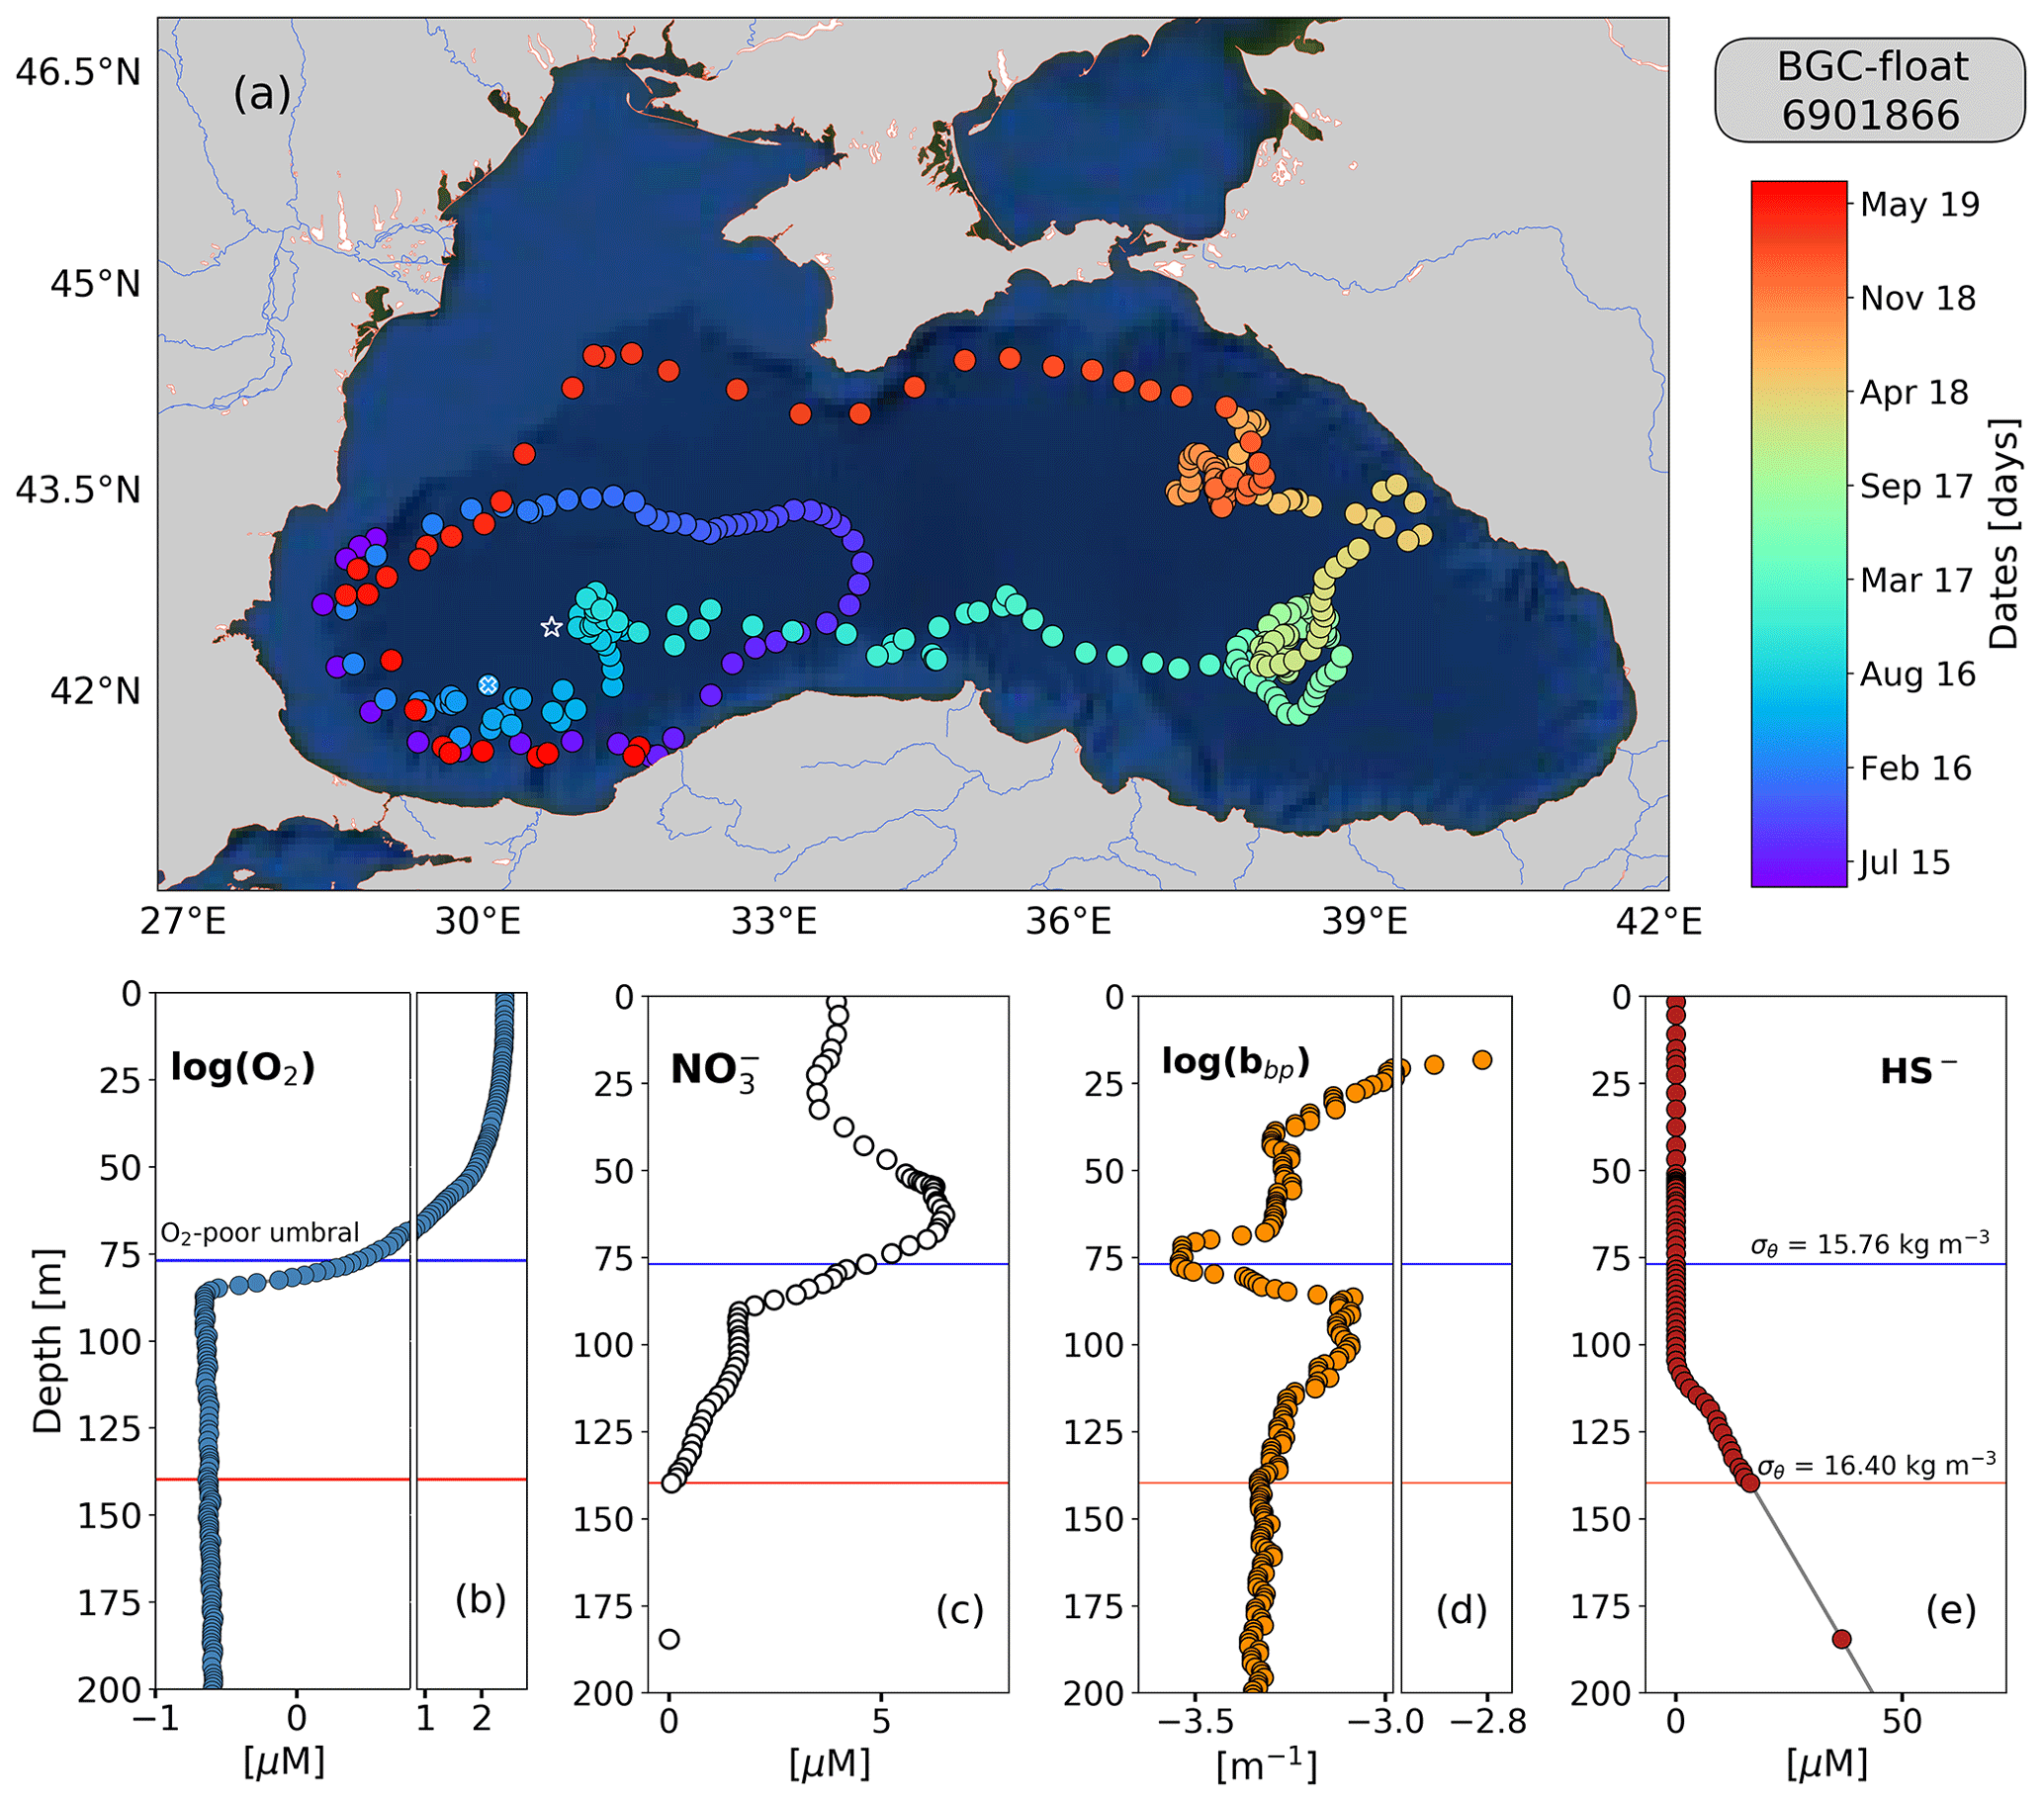
Figure 1(a) Sampling locations of float 6901866 between May 2015 and July 2019. Colored circles indicate the date (color bar) for a given profile. The white star in (a) marks the sampling site of the cruise (March 2005). The white x in (a) highlights the float location on 6 April 2016. Float profiles of (b) log (O2), (c) NO, (d) log (bbp), and (e) HS− collected on 24 November 2018.
4.1 Description of the oxygen-poor zone
The top and bottom of the oxygen-poor zone are located around isopycnals (mean ± standard deviation) 15.79±0.23 and 16.30±0.09 kg m−3, respectively. The two isopycnals therefore delimit the oxygen-poor water masses where nitrate-reducing SAR11 and denitrifying, anammox, and sulfur-oxidizing bacteria are expected to be found (zone hereafter called the OPDA, Fig. 2; Kuypers et al., 2003; Lam et al., 2007; Yakushev et al., 2007; Fuschman et al., 2011; Kirkpatrick et al., 2012). The top location of the OPDA shows large spatial–temporal variability ranging between 80 and 180 m (or σθ between 15.5 and 15.9 kg m−3, Fig. 2). Similarly, the OPDA thickness varies between 30 and 80 m, which corresponds to a σθ separation of ∼ 0.50 kg m−3. The bottom of the OPDA is slightly sulfidic (HS µM, n=86) and deeper than suggested (e.g., σθ=16.20 kg m−3 and H2S≤10 nM; Murray et al., 1995). However, our results coincide with the slightly sulfidic conditions of the deepest isopycnal at which anammox bacteria can still be recorded (σθ=16.30 kg m−3 and H2S ≥ 10 µM; Kirkpatrick et al., 2012).
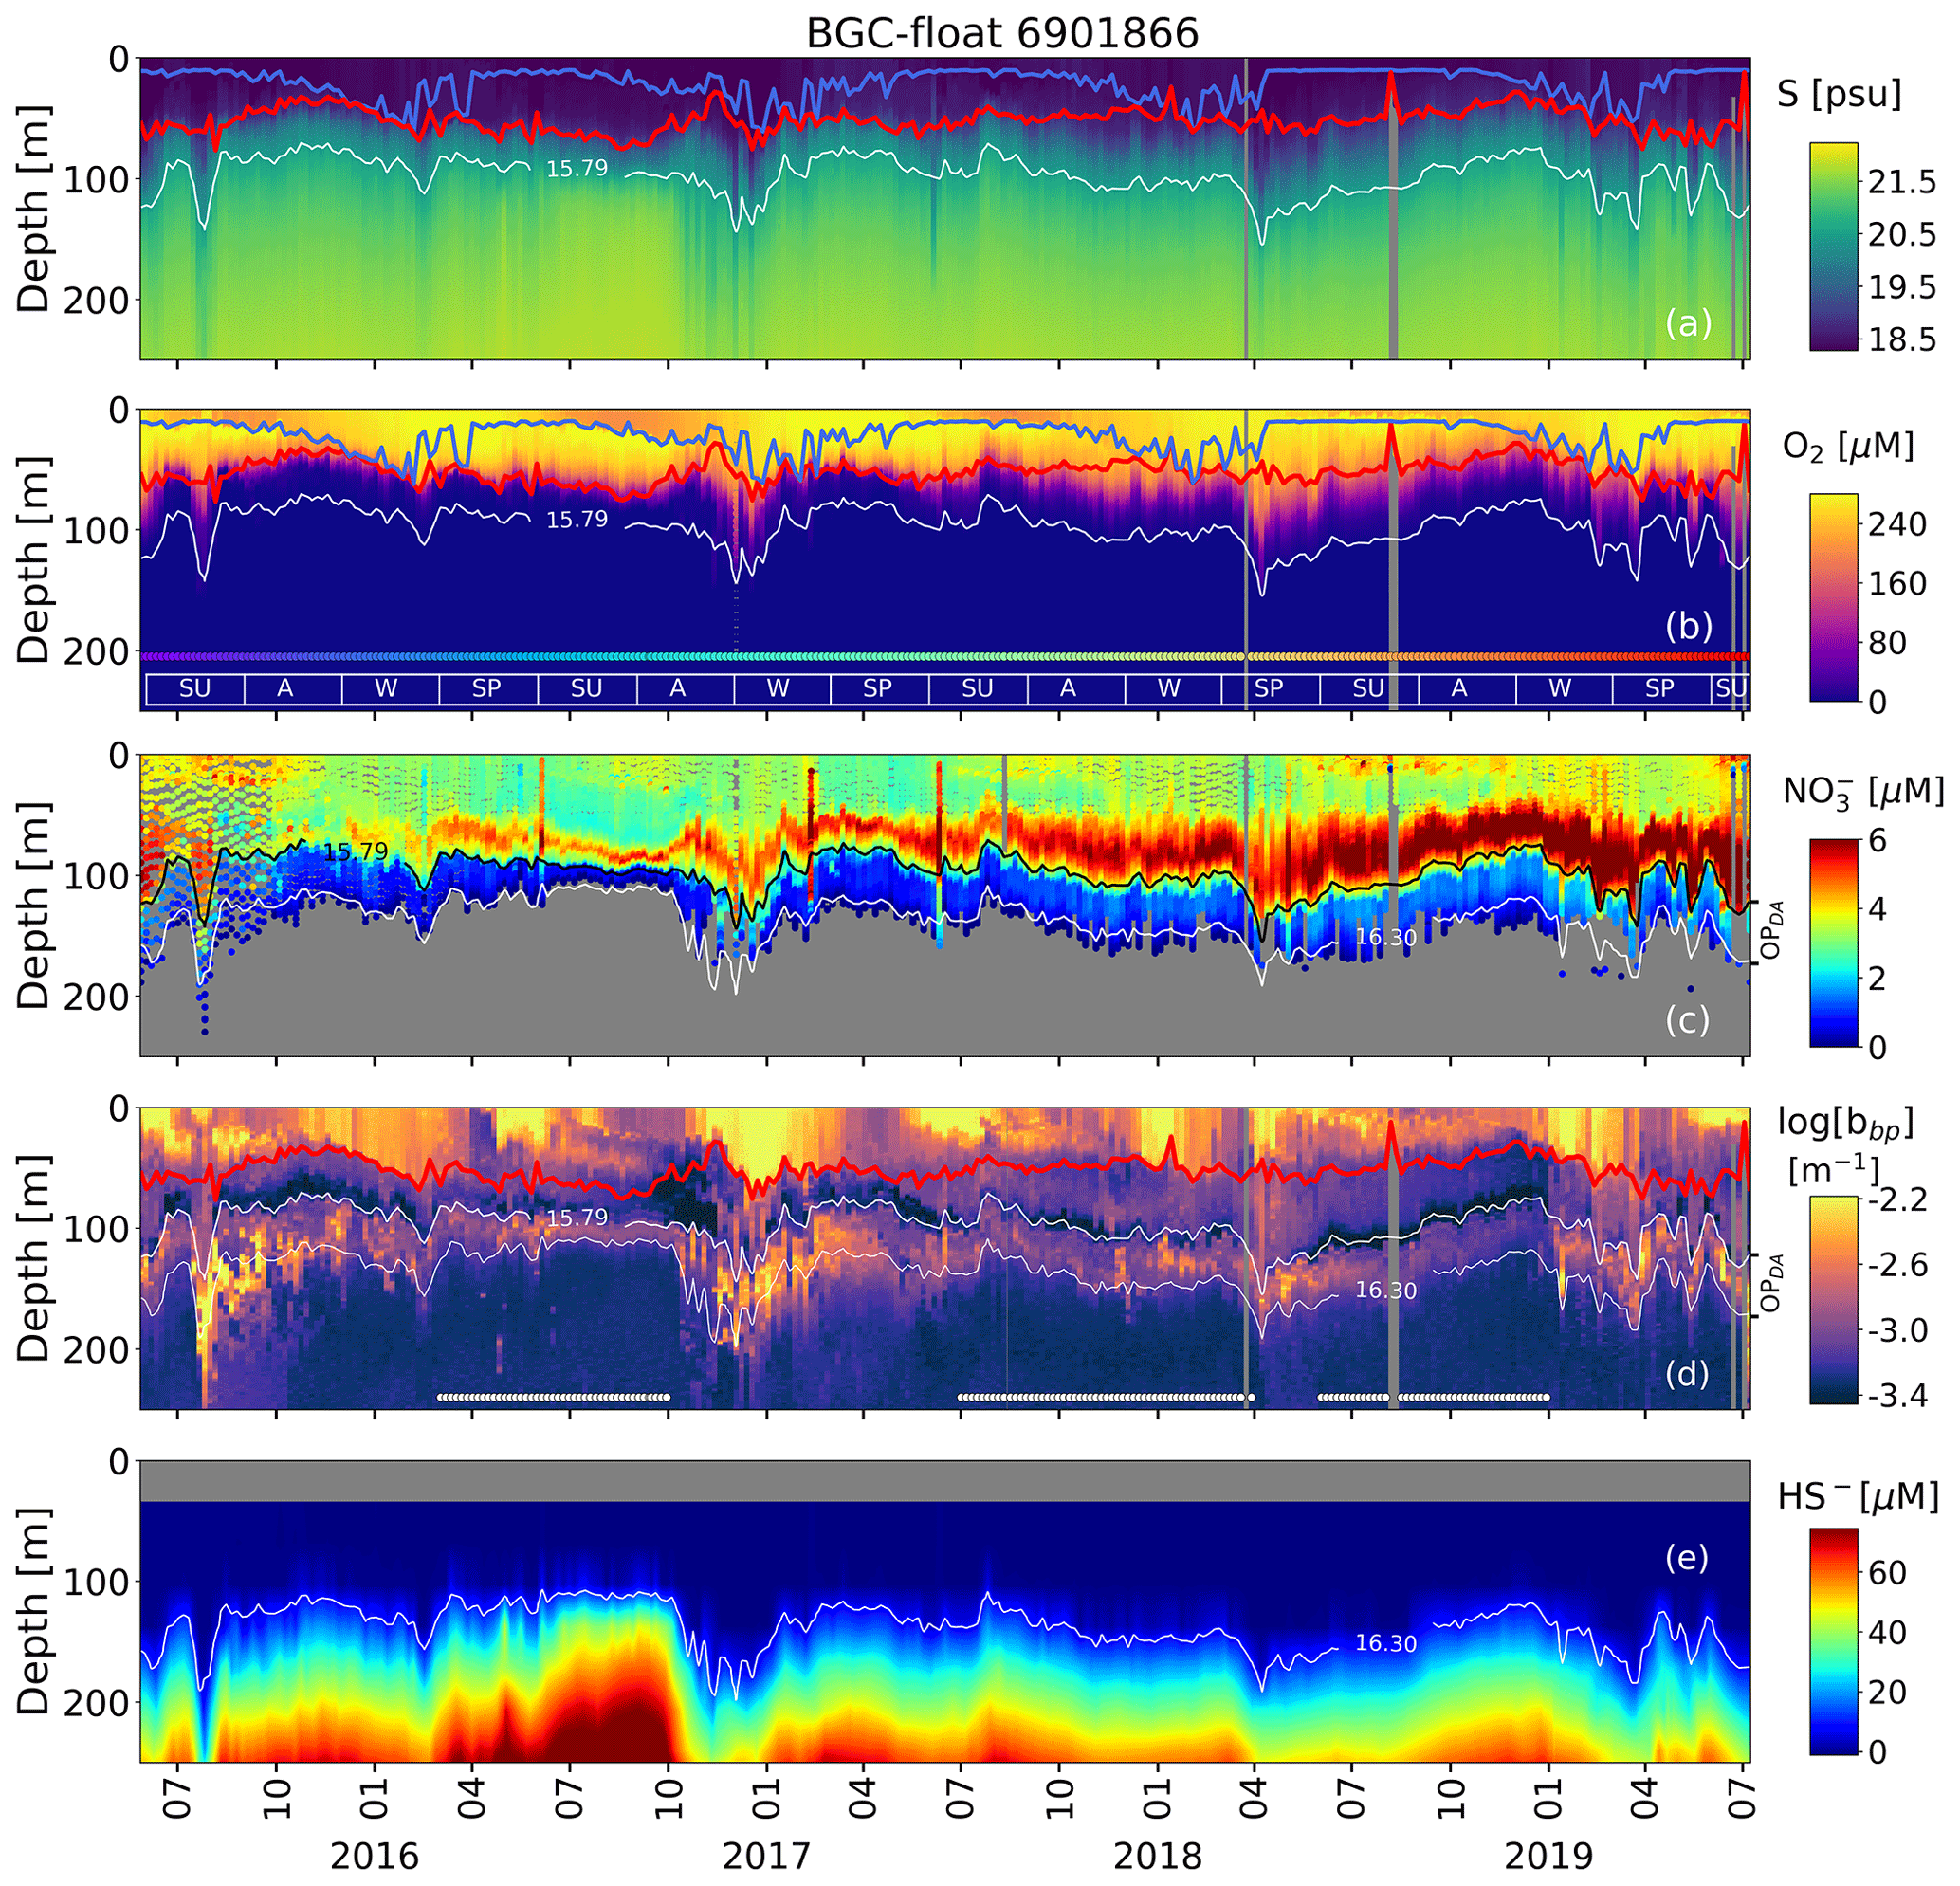
Figure 2Time series of (a) salinity (S), (b) O2, (c) NO, (d) log(bbp), and (e) HS−. The blue lines in (a) and (b) indicate the mixed-layer depth. The red lines in (a), (b), and (d) show the base of the productive region. Isopycnals 15.79 and 16.30 kg m−3 describe the top and bottom of the oxygen-poor zone (OPDA), respectively. SU, A, W, and SP stand for summer, fall, winter, and spring, respectively. The colored horizontal line in (b) indicates the sampling site for a given date (Fig. 1). The horizontal white lines in (d) are the profiles used to (1) delimit the OPDA and (2) compute correlations between bbp, NO, and T within the OPDA.
4.2 NO, O2, and MnO2 as key drivers of the thickness and location of the suspended small-particle layer
The permanent bbp-layer is always confined within the two isopycnals that delimit the OPDA (Fig. 2). It follows that the thickness and top location of this layer demonstrate the same spatial and temporal variability as the one described for the OPDA (Fig. 2 and Appendix A). This correlation indicates that variations in the thickness and top location of the bbp-layer are partially driven, respectively, by (1) the amount of NO available to produce N2 inside the OPDA via the set of bacteria communities involved and (2) downward ventilation of oxygen-rich subsurface waters (Fig. 2 and Appendix A).
NO and O2 are two of the key factors that modulate the presence of (1) denitrifying and anammox bacteria working in conjunction with nitrate-reducing SAR11 (Fuschman et al., 2011; Ulloa et al., 2012; Tsementezi et al., 2016; Bristow et al., 2017), and probably with chemoautotrophic ammonia-oxidizing bacteria (in this case, only with anammox, e.g., γAOB; Ward and Kilpatrick, 1991; Lam et al., 2007), and (2) sulfur-oxidizing bacteria (e.g., SUP05 and potentially Epsilonproteobacteria Sulfurimonas; Canfield et al., 2010; Glaubitz et al., 2010; Fuschman et al., 2011, 2012b; Ulloa et al., 2012; Kirkpatrick et al., 2018). Therefore, the results described above highlight that at least a fraction of the bbp-layer should be due to this array of bacteria. This notion is supported by three main observations. Firstly, the top location of the bbp-layer is driven by the intrusion of subsurface water masses ( psu) with O2 concentrations above the levels tolerated by denitrifying and anammox bacteria (O2≥3 µM, Jensen et al., 2008; Babbin et al., 2014; Fig. 2). As a result, in regions where O2 is ventilated to deeper water masses, the top location of the bbp-layer is also deeper. The contrary is observed when O2 ventilation is shallower (Fig. 2 and Appendix A). Secondly, nitrate-reducing SAR11 and denitrifying, anammox, and sulfur-oxidizing bacteria reside between isopycnals 15.60 and 16.30 kg m−3 (Fuchsman et al., 2011, 2012a; Kirkpatrick et al., 2012), while the bbp-layer is formed between isopycnals ∼ 15.79 and 16.30 kg m−3. We can thus infer coexistence of such bacteria between the coincident isopycnals where the bbp-layer is generated. Thirdly, NO declines from around isopycnal 15.79 kg m−3 to isopycnal 16.30 kg m−3 due to the expected N2 production via the microbial communities involved (Figs. 2–3 and Kirkpatrick et al., 2012).
The ventilation of subsurface O2 is also key in driving the depth at which MnO2 is formed (O2 ≤ 3–5 µM; Clement et al., 2009) and can thus contribute to setting the characteristics of the bbp-layer via its subsequent accumulation and dissolution (Konovalov et al., 2003; Clement et al., 2009; Dellwig et al., 2010). Thus, in regions where subsurface O2 (e.g., O2 ≥ 3–5 µM and psu) is ventilated to deeper water masses, both the formation of MnO2 and top location of the bbp-layer can be expected to be deeper and vice versa (Fig. 2). Finally, the dissolution of MnO2 should also influence the thickness of the bbp-layer because it occurs just beneath the maxima of the optical particles inside this layer (Konovalov et al., 2006; see the explanation in Sect. 4.3).
Overall, the qualitative evidence presented above points out that particles of MnO2 as well as nitrate-reducing SAR11 and denitrifying, anammox, and sulfur-oxidizing bacteria appear to define the characteristics of the bbp-layer (Johnson, 2006; Konovalov et al., 2003; Fuchsman et al., 2011, 2012b; Stanev et al., 2018). This observation leads us to argue, in the next section, that the bbp-layer is partially composed of the main group of microbial communities involved in N2 yielding as well as of MnO2.
4.3 Role of the removal rate of NO, MnO2, and temperature in the vertical distribution of small particles
We propose that the removal rate of NO is a key driver of the vertical distribution of small particles and N2 excess within the OPDA. This is because the vertical profiles of small particles and of N2 excess are qualitatively similar, and both profiles are clearly related to the rate at which NO is removed from the OPDA (Figs. 3–4). For instance, maxima of N2 excess and bbp coincide around isopycnal 16.11±0.11 kg m−3 (Fig. 3; Konovalov et al., 2005; Fuchsman et al., 2008, 2019). At this isopycnal, the mean concentration of NO is 1.19±0.53 µM. We thus propose that this NO threshold value splits the OPDA into two sub-zones with distinctive biogeochemical conditions (e.g., nitrogenous and manganous zones; Canfield and Thamdrup, 2009). Ultimately, these two different sets of conditions drive the rates at which NO and small particles are removed and formed within the OPDA, respectively (Fig. 3 and explanation below).
The first sub-zone is thus located between the top of the OPDA (σθ=15.79 kg m−3) and around isopycnal 16.11 kg m−3. Here, removal rates of NO ( µM m−1, Fig. 4) are likely to be boosted by (1) high content of organic matter (dissolved organic carbon = 122±9 µM, Margolin et al., 2016) and NO ( µM) and (2) O2 levels staying between a range that maintains the yielding of N2 (0.24±0.04 µM ≥ O µM, n=100, the means of the minima and maxima of O2, respectively, in the first sub-zone) and promotes the formation of MnO2 (e.g., maximum of Mn(II) oxidation is at O2 levels ∼0.2 µM; Clement et al., 2009). Consequently, the formation of biogenic and inorganic small particles (and related N2 excess) increases from the top of the OPDA to around isopycnal 16.11 kg m−3 (Fig. 3). This hypothesis is (1) in part confirmed by significant and negative power-law correlations between the suspended small-particle content and NO in this sub-zone (Fig. 3) and is (2) in agreement with the progressive accumulation of MnO2 from around isopycnal 15.8 kg m−3 to isopycnal 16.10 kg m−3 (e.g., Konovalov et al., 2006).
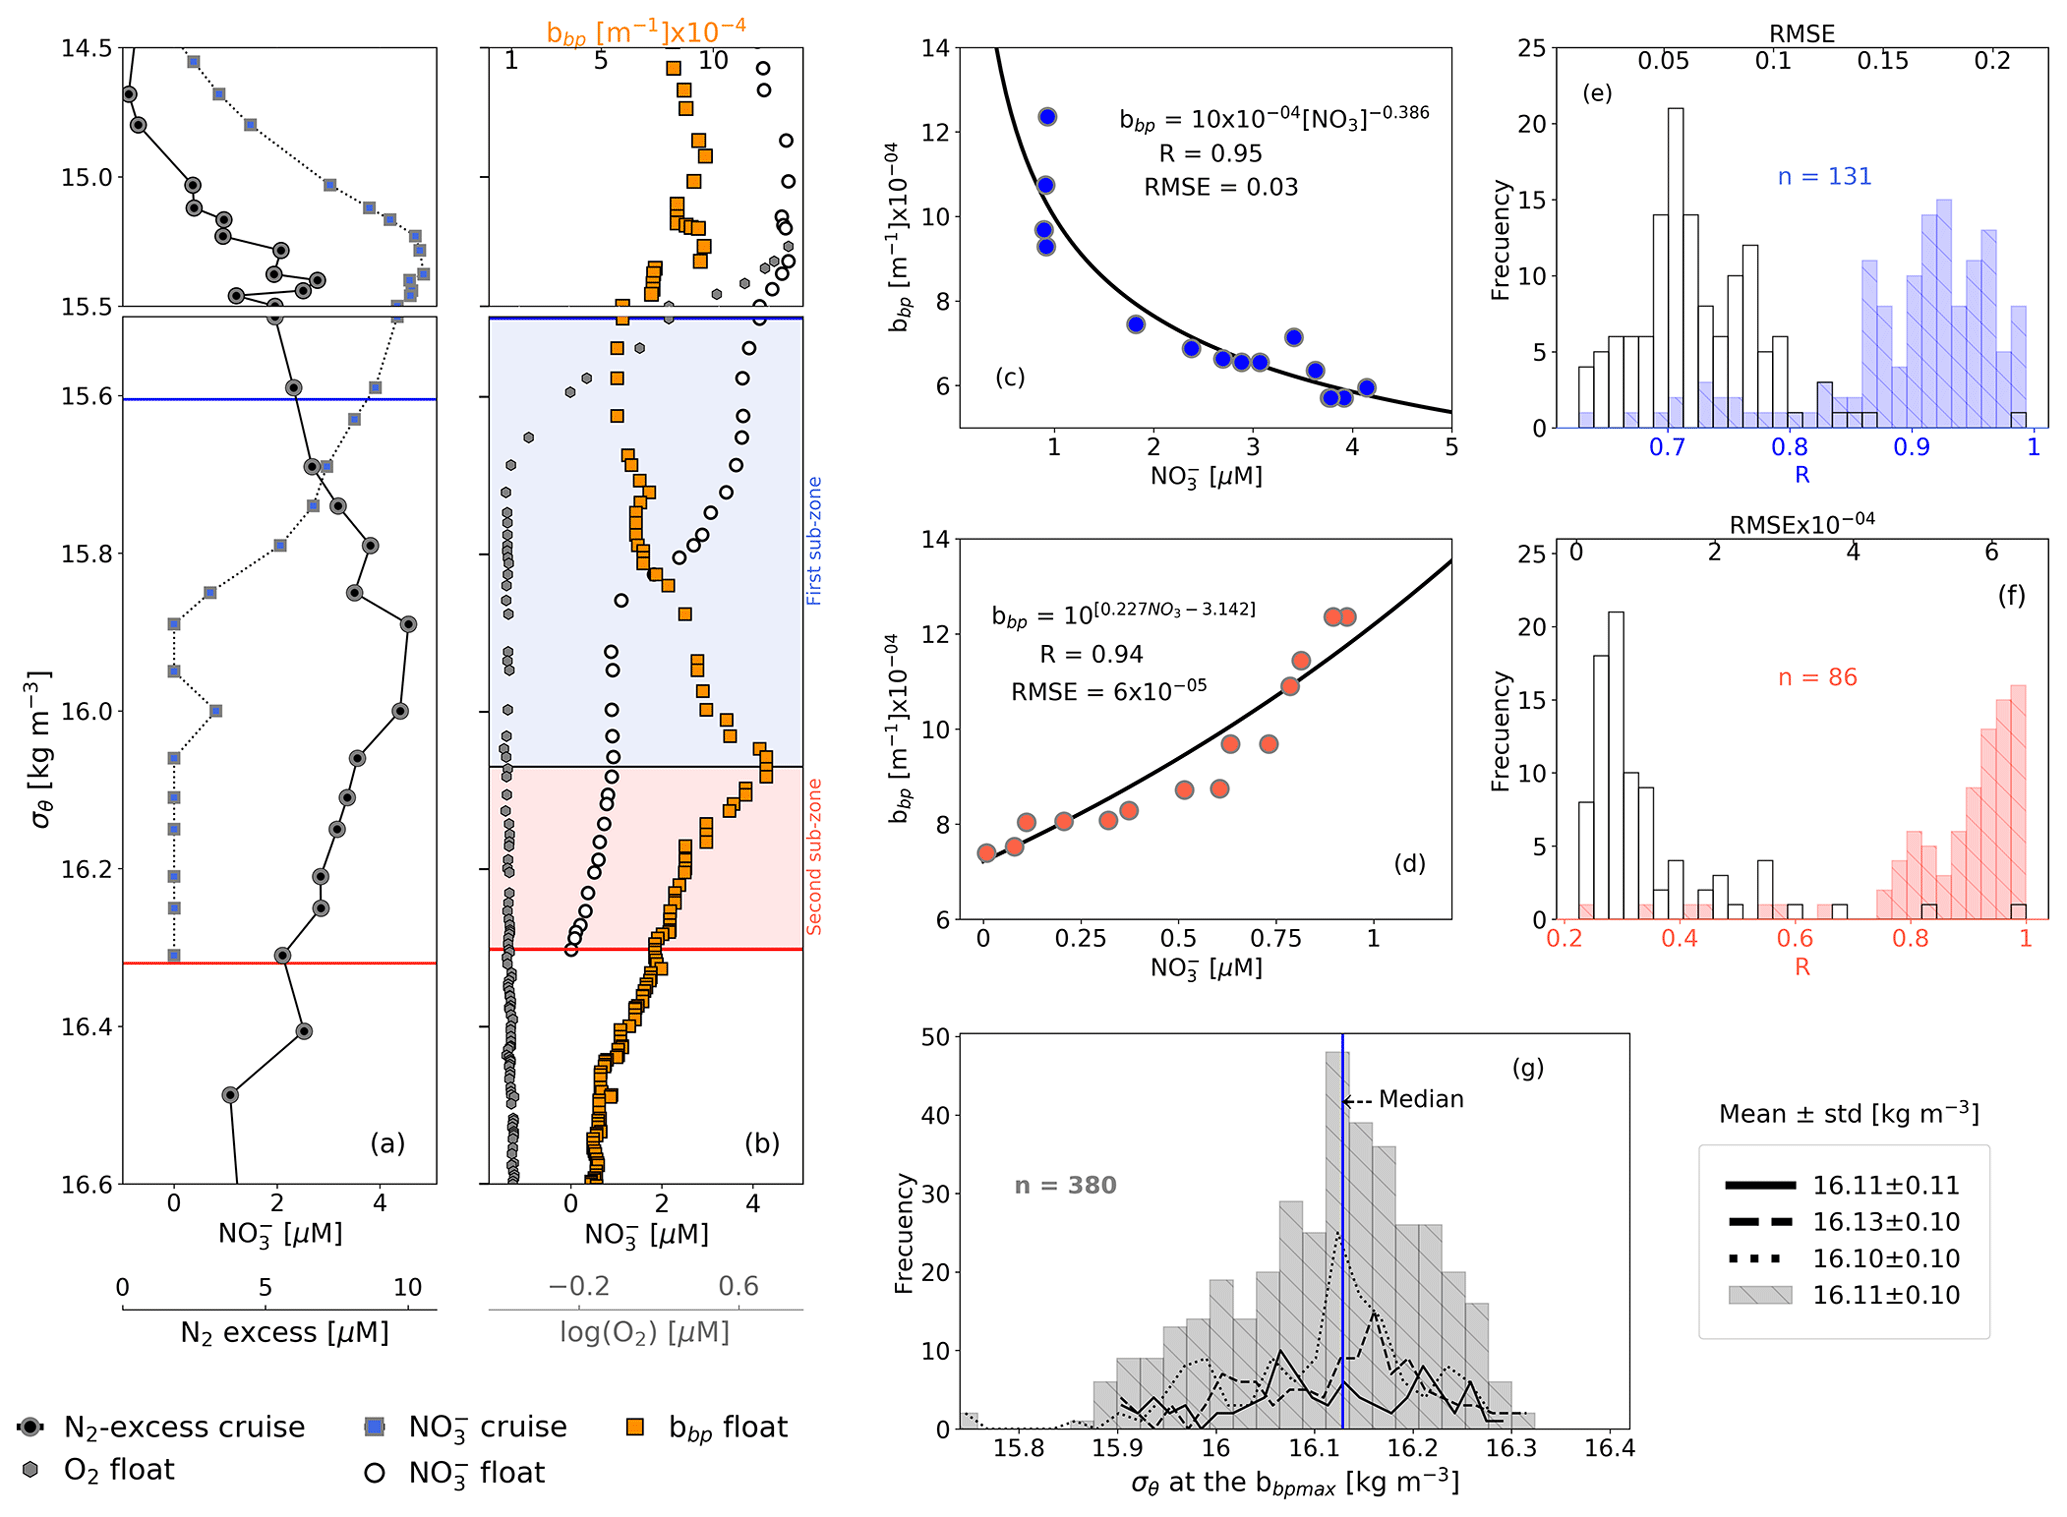
Figure 3(a) Cruise profiles of NO and N2 excess, collected in March 2005 (Fuchsman et al., 2019). (b) Float profiles of NO, bbp, and log (O2) measured on 6 April 2016. Profiles in (a) and (b) were conducted in the northwest of the basin (see Fig. 1). The top and bottom of the OPDA are described in (a) and (b) as horizontal blue and red lines, respectively. The bbp maximum is the horizontal black line in (b). The first and second sub-zones of the OPDA are, respectively, highlighted in (b) as blue and red squares. NO vs. bbp in (c) are the first and (d) second sub-zones of the float profile in (b). The number of data points visualized in (c) is lower than in (b) for the first sub-zone because bbp and NO are not always recorded at the same depths. (e) Frequency distributions of correlation coefficients (R, blue bars) and root mean square error (RMSE, white bars) for NO vs. bbp in the first sub-zone. (f) Same as (e) but for the second sub-zone. (g) Frequency distributions of the isopycnals at which bbp maxima are found within the OPDA. Dotted, dashed, and solid black lines in (g) are data collected by floats 7900591, 6901866, and 6900807, respectively. Gray bars include all data.
The second sub-zone is located between isopycnal 16.11 kg m−3 and the bottom of the OPDA (σθ=16.30 kg m−3, Fig. 3). Here, NO is low ( µM) and O2 is relatively constant (0.23±0.02 µM, n=2284; mean of O2 calculated in the second sub-zone for all profiles) or lower than the minimum of O2 recorded by this sensor (0.22±0.02 µM, n=89). These constant (or lower) levels of O2 roughly correspond to those at which anammox and heterotrophic denitrification are inhibited by ∼50 % (0.21 and 0.81 µM, respectively; Dalsgaard et al., 2014). In addition, low levels of NO necessarily promote the microbial use of Mn(IV) as an electron acceptor, ultimately dissolving the particles of MnO2 into Mn(II) (e.g., manganous zone; Konovalov et al., 2006; Yakushev et al., 2007; Canfield and Thamdrup, 2009). As a result, this sub-zone exhibits a decline in removal rates of NO ( µM m−1, Fig. 4) along with inhibited formation of biogenic small particles and dissolution of MnO2. Ultimately, both the content of small particles and related N2 excess decrease from around isopycnal 16.11 kg m−3 to the bottom of the OPDA (Fig. 3). These results are in agreement with (1) significant and positive exponential correlations computed between the small-particle content inferred from bbp and NO within this sub-zone (Fig. 3) and (2) the overlap of nitrogenous and manganous zones in this sub-zone because the content of MnO2 particles and dissolved Mn(II) concurrently declines and increases just beneath isopycnal 16.11 kg m−3, respectively (e.g., Murray et al., 1995; Konovalov et al., 2003, 2005, 2006; Yakushev et al., 2007; Canfield and Thamdrup, 2009).
Strong-positive linear correlations are also recorded between bbp and T in the first sub-zone of the OPDA (Fig. 4). This is likely to indicate that the formation of small particles is sensitive to very tiny increments in T (0.003±0.001 ∘C m−1, n=133). We thus infer a tendency for the decline rates of NO and related production of N2 to increase with T. This hypothesis is at least partially supported by the significant correlation between NO decline rates and T increase rates in this sub-zone (Fig. 4). Within the second sub-zone, T continues increasing while bbp decreases, likely due to inhibition of the formation of small particles for the reasons described above (Fig. 4). These observations suggest that the production of small particles is likely to have first- and second-order covariations with NO and T, respectively – a likelihood backed up by a lack of correlation between NO decline rates and T increase rates in this sub-zone (Fig. 4). Finally, more information is needed to investigate the physical and/or biogeochemical processes driving the correlation between the increase rates of T and declines rates of NO in the first sub-zone. This is however beyond the scope of our study.
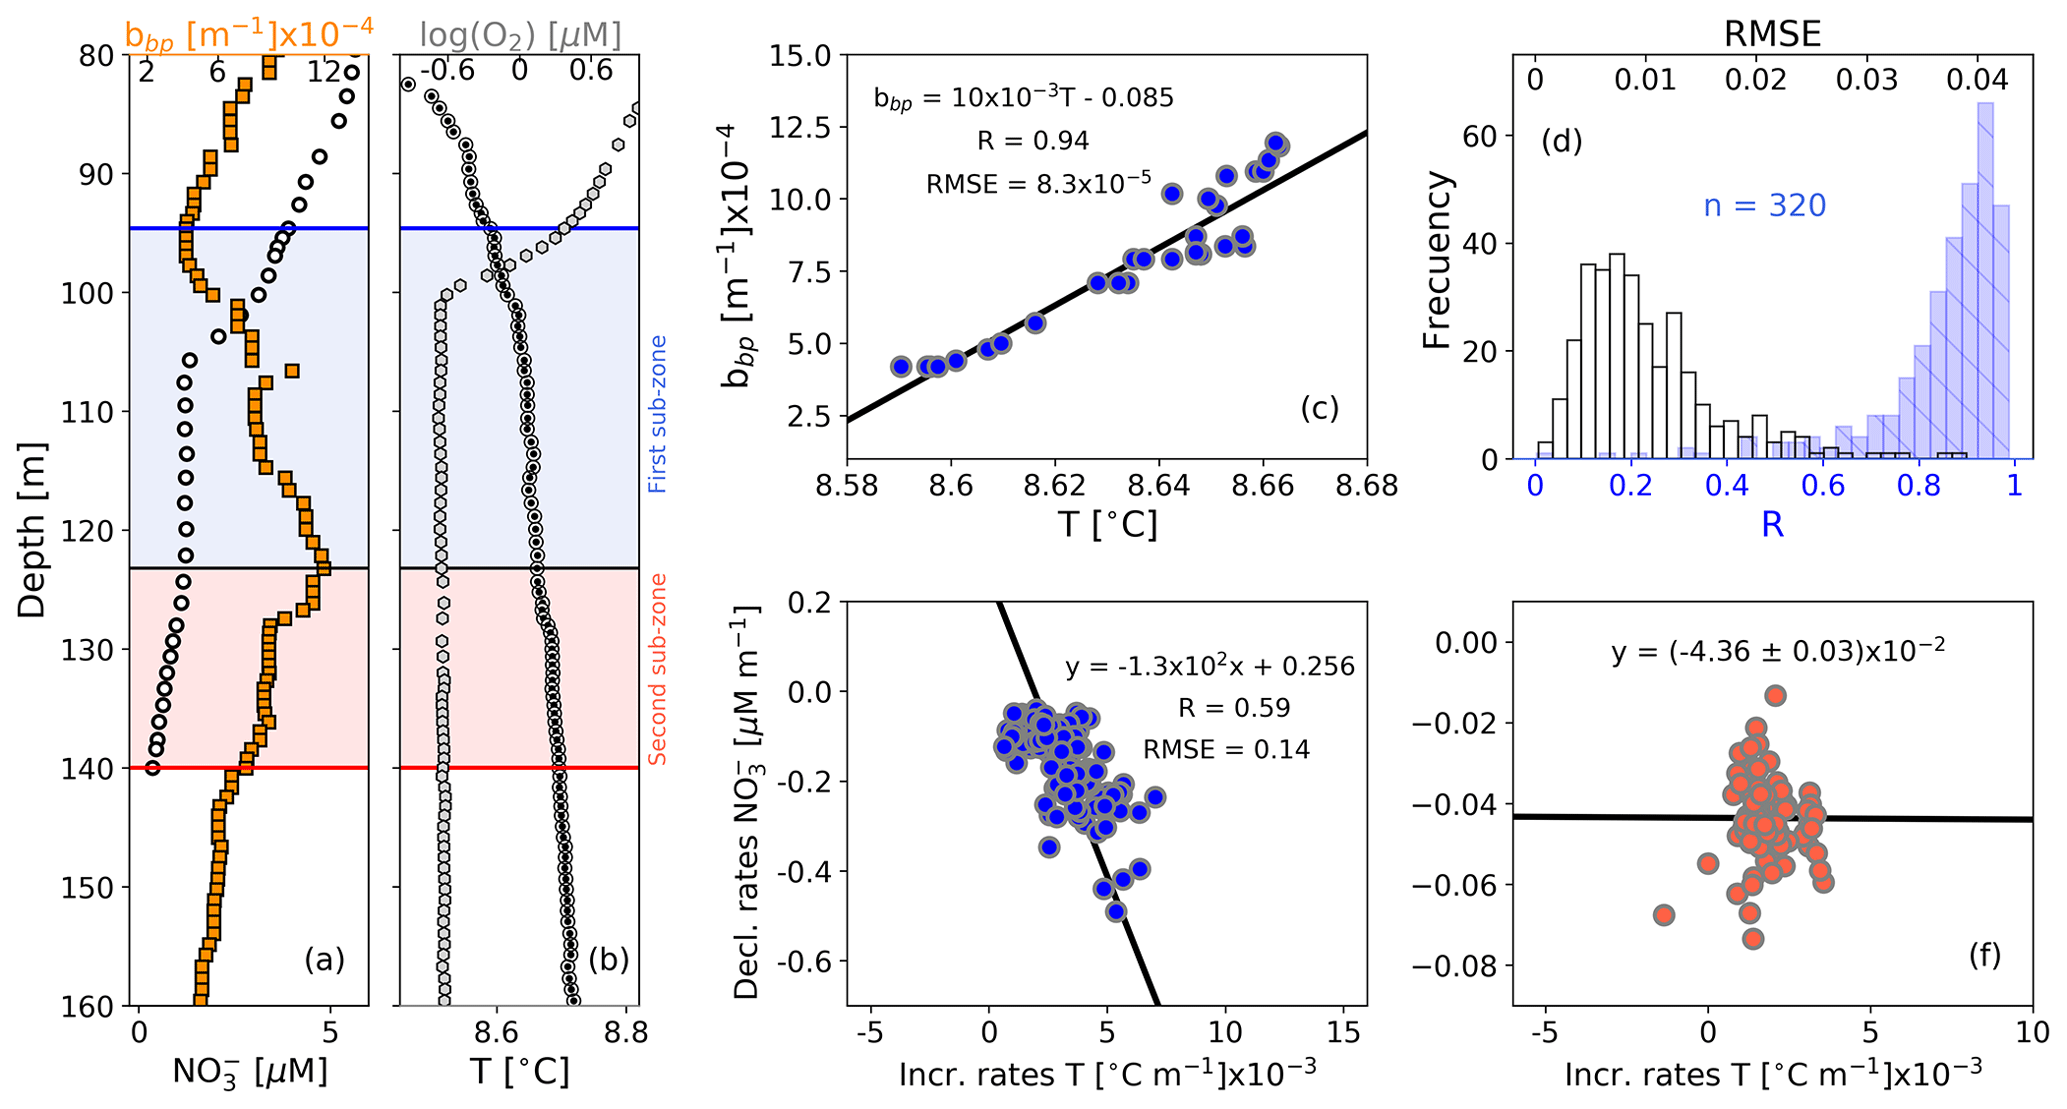
Figure 4Float profiles of (a) NO and bbp and (b) T and log (O2) collected on 10 September 2017. Horizontal blue and red lines in (a) and (b) are the top and bottom of the OPDA. The bbp maximum is indicated in (a) and (b) as horizontal black lines. The first and second sub-zones of the OPDA are, respectively, highlighted in (a) and (b) as blue and red squares. (c) bbp vs. T for the first sub-zone of the profile in (b). (d) Frequency distributions of correlation coefficients (R, blue bars) and root mean square errors (RMSE, white bars) for bbp vs. T in the first sub-zone, including data collected by the three floats. Decrease rates of NO vs. increase rates of T in (e) the first sub-zone and (f) the second sub-zone.
To summarize, BGC-Argo float data combined with a proxy of N2 production suggest that in regions without the Bosporus plume influence, the bbp-layer systematically tracks and delineates the effective N2-yielding section independently of (1) the biogeochemical mechanisms driving N2 yielding and (2) the contribution that MnO2 and other microorganisms can be expected to make to the formation of the bbp-layer (e.g., Lam et al., 2007; Fuchsman et al., 2011, 2012a; Kirkpatrick et al., 2018). It is thus finally inferred that this bbp-layer is at least partially composed of the predominant anaerobic microbial communities involved in the production of N2, such as nitrate-reducing SAR11 and anammox, denitrifying, and sulfur-oxidizing bacteria. These results also suggest that N2 production rates can be highly variable in the Black Sea because the characteristics of the bbp-layer show large spatial–temporal variations driven by changes in NO and O2 (Figs. 2 and 4). Finally, we propose that bbp and O2 can be exploited as a combined proxy for defining the N2-producing section of the oxygen-poor Black Sea. We consider that this combined proxy can delineate the top and base of this section by applying an O2 threshold of 3.0 µM and the bottom isopycnal of the bbp-layer, respectively. This section should thus be linked to free-living bacteria (0.2–2 µm) and those associated with small suspended particles (> 2–20 µm) as well as to small inorganic particles (0.2–20 µm).
4.4 New perspectives for studying N2 yielding in oxygen-deficient zones
The conclusions and inferences of this study, especially those related to the origin and drivers of the bbp-layer, primarily apply to the Black Sea. However, these findings may also have a wider application. In particular, the shallower water masses of oxygen-deficient zones (ODZs) are similarly characterized by the formation of a layer of suspended small particles that can be optically detected by bbp and the attenuation coefficients of particles (Spinrad et al., 1989; Naqvi et al., 1993; Whitmire et al., 2009). This layer is mainly linked to N2-yielding microbial communities because (1) its location coincides with the maxima of N2 excess, microbial metabolic activity, and nitrite (NO, the intermediate product of denitrification and anammox that is mainly accumulated in the N2-yielding section: Spinrad et al., 1989; Naqvi et al., 1991, 1993; Devon et al., 2006; Chang et al., 2010, 2012; Ulloa et al., 2012; Wojtasiewicz et al., 2020), and (2) MnO2 is not accumulated as in the Black Sea (Martin and Knauer, 1984; Johnson et al., 1996; Lewis and Luther, 2000). Therefore, our findings suggest that highly resolved vertical profiles of bbp and O2 can potentially be used as a combined proxy to define the effective N2-production section of ODZs. Such a definition can be key to better-constrained global estimates of N2 loss rates because it can allow us to (1) accurately predict the oxygen-poor water volume where around 90 % of N2 is produced in the ODZ core (Babbin et al., 2014) and (2) evaluate how the location and thickness of the N2-yielding section vary due to changes in the biogeochemical factors that modulate anammox and heterotrophy denitrification.
Global estimates of N2 production differ by 2–3-fold between studies (e.g., 50–150 Tg N yr−1, Codispoti et al., 2001; Bianchi et al., 2012, 2018; DeVries et al., 2012; Wang et al., 2019). These discrepancies are caused in part by inaccurate estimations of the oxygen-poor volume of the N2-production section. Other sources of uncertainties arise from the methods applied to estimate the amount of particulate organic matter (POM) that fuels N2 production. For instance, POM fluxes and their subsequent attenuation rates are not well resolved because they are computed, respectively, from satellite-based primary-production algorithms and generic power-law functions (Bianchi et al., 2012, 2018; DeVries et al., 2012). POM-flux estimates based on these algorithms visibly exclude (1) POM supplied by zooplankton migration (Kiko et al., 2017; Tutasi and Escribano, 2020), (2) substantial events of POM export decoupled from primary production (Karl et al., 2012), and (3) the role of small particles derived from the physical and biological fragmentation of larger ones (Karl et al., 1988; Briggs et al., 2020), which are more efficiently remineralized by bacteria in ODZs (Cavan et al., 2017). In addition, these estimates do not take into consideration the inhibition effect that O2 intrusions may have on N2-yielding rates (Whitmire et al., 2009; Ulloa et al., 2012; Dalsgaard et al., 2014; Peters et al., 2016; Margolskee et al., 2019).
Overall, mechanistic predictions of N2 production misrepresent the strong dynamics of the biogeochemical and physical processes that regulate them. Consequently, it is still debated whether the oceanic nitrogen cycle is in balance or not (Codispoti, 2007; Gruber and Galloway, 2008; DeVries et al., 2012; Jayakumar et al., 2017; Bianchi et al., 2018; Wang et al., 2019). The subsiding uncertainty points to a compelling need for alternative methods that allow accurate refinement of oceanic estimations of N2 production.
Our study supports the proposition that robotic observations of bbp and O2 can be used to better delineate the N2-yielding section at the appropriate spatial (e.g., vertical and regional) and temporal (e.g., event, seasonal, interannual) resolutions. In addition, POM fluxes and N2 can be simultaneously quantified using the same float technology (BGC-Argo, Bishop and Wood, 2009; Dall'Olmo and Mork, 2014; Reed et al., 2018; Boyd et al., 2019; Estapa et al., 2019; Rasse and Dall'Olmo, 2019). These robotic measurements can contribute to refining global estimates of N2 production by better constraining both the oxygen-poor section where N2 is produced and POM fluxes that fuel its loss. Ultimately, O2 intrusions into the N2-yielding section can potentially be quantified by BGC-Argo floats to assess their regulatory effect on N2 production.
Our results along with those from previous studies suggest that the bbp-layer of the oxygen-poor Black Sea is at least partially composed of nitrate-reducing SAR11 and anammox, denitrifying, and sulfur-oxidizing bacteria. The location and thickness of this layer show strong spatial–temporal variability, mainly driven by the ventilation of oxygen-rich subsurface waters and nitrate available to generate N2, respectively. Such variations in the characteristics of the bbp-layer highlight that N2-production rates can be highly variable in the Black Sea. We therefore propose that high-resolution measurements of O2 and bbp can potentially be exploited as a combined proxy to delineate the effective N2-yielding section of ODZs. This proposition is in part supported by evidence that the bbp-layer and a majority of N2-yielding microbial communities are both confined in the shallower oxygen-poor water masses of ODZs. We however recommend investigation into the key biogeochemical drivers of the bbp-layer for each ODZ. This information will be critical for validating the applicability of the bbp-layer in assessing spatial–temporal changes in N2 production.
Finally, it is evident that BGC-Argo float observations can acquire essential proxies of N2 production and associated drivers at appropriate spatial and temporal resolutions. The development of observation–modeling synergies therefore has the potential to deliver an unprecedented view of N2-yielding drivers if robotic observations become an integrated part of model validation. Ultimately, this approach could prove essential for reducing present uncertainties in the oceanic N2 budget.
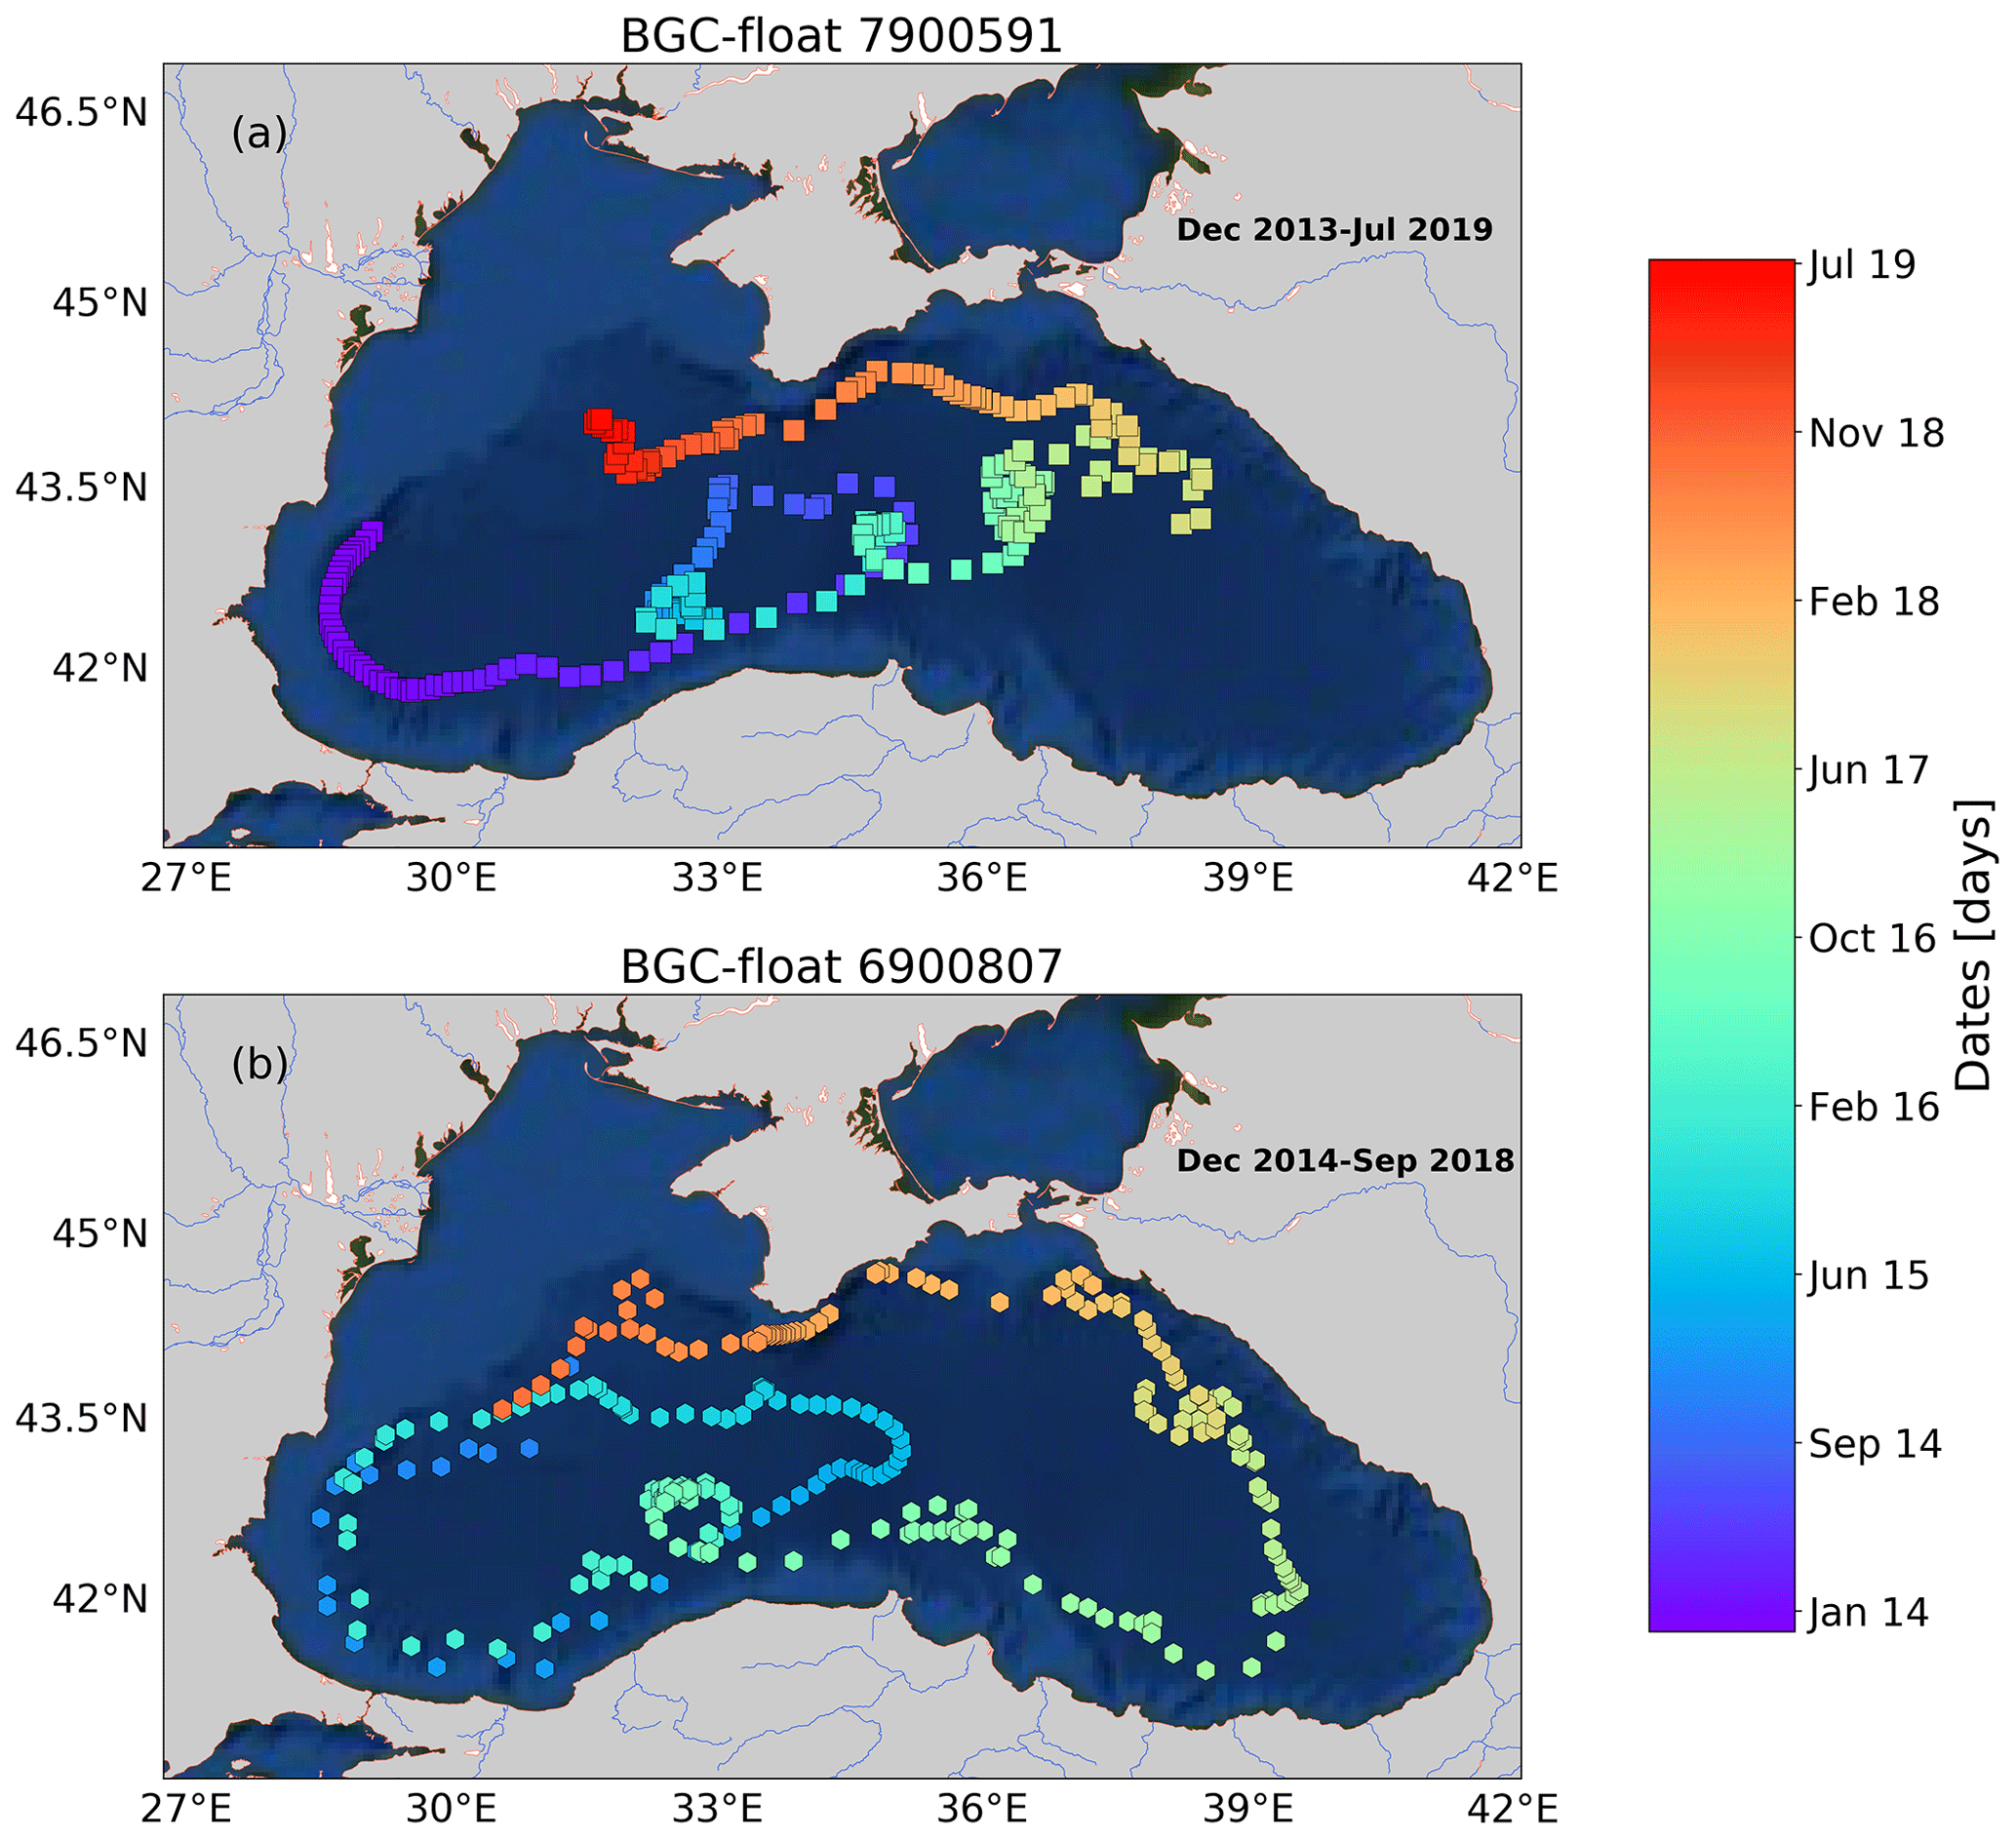
Figure A1Sampling locations of floats (a) 7900591 and (b) 6900807 between December 2013 and July 2019. Colored squares and hexagons indicate the date (color bar) for a given profile of floats 6900807 and 7900591, respectively.

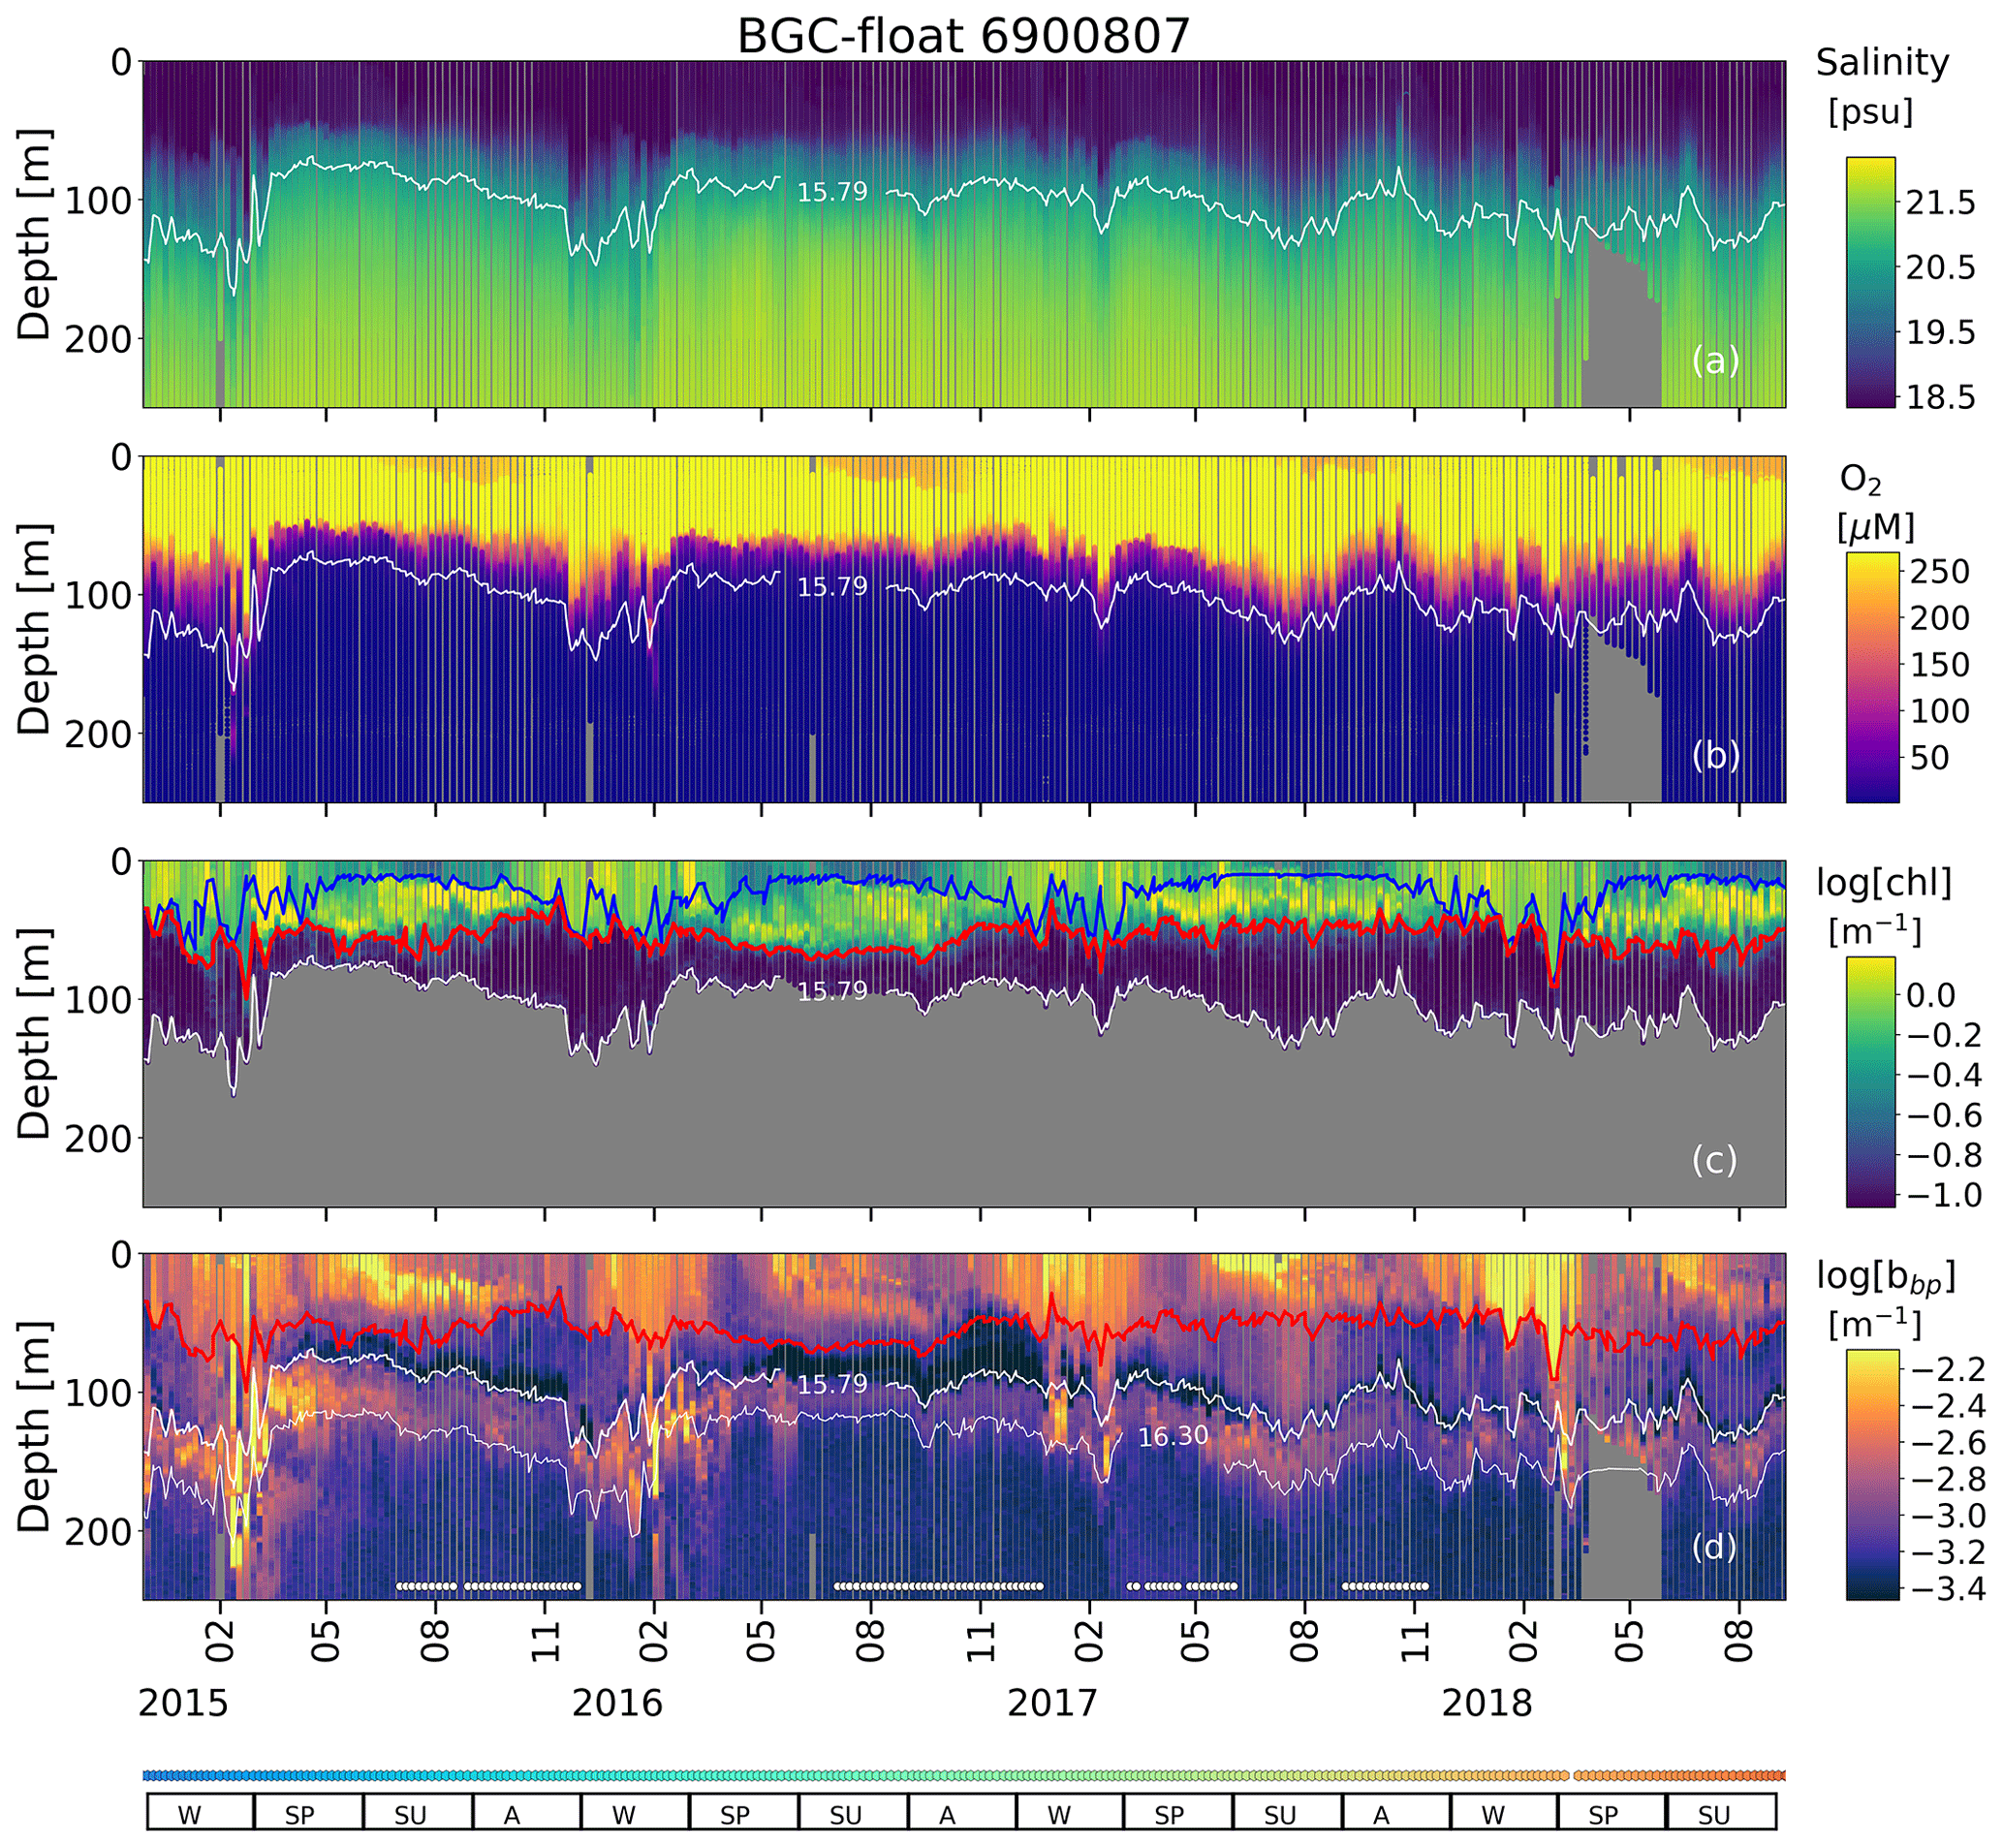
Figure A2Time series of (a) S, (b) O2, (c) log (chl), and (d) log (bbp) for float 7900591. The blue line in (c) indicates the mixed layer depth. The red lines in (c) and (d) show the base of the productive region. Isopycnals 15.79 and 16.30 kg m−3 describe the top and bottom of the oxygen-poor zone (OPDA), respectively. SU, A, W, and SP stand for summer, autumn, winter, and spring, respectively. The colored horizontal line at the bottom indicates the sampling site for a given date (Fig. A1). The horizontal white lines in (d) are the profiles used to (1) delimit the OPDA and (2) find the isopycnals at which bbp is maximum in the OPDA. chl is set to zero in the OPDA due to fluorescence contamination (Stanev et al., 2017).
These data were collected and made freely available by the International Argo Program and the national programs that contribute to it (Argo, 2020). The Argo Program is part of the Global Ocean Observing System. Data on N2 : Ar ratios are freely available at https://doi.org/10.1029/2018GB006032 (Fuchsman et al., 2019).
RR conceptualized the study, wrote the original draft, and generated all the figures. HC contributed to tuning the study's conceptualization and figure design. AP processed all BGC-Argo float data. RR and HC reviewed and edited the final manuscript.
The authors declare that they have no conflict of interest.
This study was conducted under the framework of the Marie Skłodowska-Curie Individual Fellowship awarded to Rafael Rasse (NOCEANIC project). This study is a contribution to the REMOCEAN project (H. Claustre), and the final writing was funded by the REFINE project (H. Claustre). We finally thank Clara A. Fuchsman and the anonymous reviewer for their accurate and constructive feedback, which allowed us to significantly improve the original version of the manuscript.
This research has been supported by the European Union's Horizon 2020 research and innovation program (NOCEANIC project, grant no. 839062), and the European Research Council, Seventh Framework Programme (REMOCEAN project: grant no. 246777; and REFINE project: grant no. 834177).
This paper was edited by Aninda Mazumdar and reviewed by Clara A. Fuchsman and one anonymous referee.
Argo: Argo float data and metadata from Global Data Assembly Centre (Argo GDAC), SEANOE, https://doi.org/10.17882/42182, 2020.
Babbin, A. R., Keil, R. G., Devol, A. H., and Ward, B. B.: Organic matter stoichiometry, flux, and oxygen control nitrogen loss in the ocean, Science, 344, 406–408, https://doi.org/10.1126/science.1248364, 2014.
Bianchi, D., Dunne, J. P., Sarmiento, J. L., and Galbraith, E. D.: Data-based estimates of suboxia, denitrification, and N2O production in the ocean and their sensitivities to dissolved O2, Global Biogeochem. Cy., 26, GB004209, https://doi.org/10.1029/2011GB004209, 2012.
Bianchi, D., Weber, T. S., Kiko, R., and Deutsch, C.: Global niche of marine anaerobic metabolisms expanded by particle microenvironments, Nat. Geosci., 11, 263–268, https://doi.org/10.1038/s41561-018-0081-0, 2018.
Bishop, J. K. and Wood, T. J.: Year-round observations of carbon biomass and flux variability in the Southern Ocean, Global Biogeochem. Cy., 23, https://doi.org/10.1029/2008GB003206, 2009.
Bittig, H. C. and Körtzinger, A.: Tackling oxygen optode drift: Near-surface and in-air oxygen optode measurements on a float provide an accurate in situ reference, J. Atmos. Ocean. Technol., 32, 1536–1543, https://doi.org/10.1175/JTECH-D-14-00162.1, 2015.
Boyd, P. W., Claustre, H., Levy, M., Siegel, D. A., and Weber, T.: Multi-faceted particle pumps drive carbon sequestration in the ocean, Nature, 568, 327–335, https://doi.org/10.1038/s41586-019-1098-2, 2019.
Briggs, N., Perry, M. J., Cetinić, I., Lee, C., D'Asaro, E., Gray, A. M., and Rehm, E.: High-resolution observations of aggregate flux during a sub-polar North Atlantic spring bloom, Deep-Sea Res. Pt. I., 58, 1031–1039, https://doi.org/10.1016/j.dsr.2011.07.007, 2011.
Briggs, N., Dall'Olmo, G., and Claustre, H.: Major role of particle fragmentation in regulating biological sequestration of CO2 by the oceans, Science, 367, 791–793, https://doi.org/10.1126/science.aay1790, 2020.
Bristow, L. A., Dalsgaard, T., Tiano, L., Mills, D. B., Bertagnolli, A. D., Wright, J. J., Hallam, S. J., Ulloa, O., Canfield, D. E., Revsbech, N. P., and Thamdrup, B.: Ammonium and nitrite oxidation at nanomolar oxygen concentrations in oxygen minimum zone waters, P. Natl. Acad. Sci. USA, 113, 10601–10606, https://doi.org/10.1073/pnas.1600359113, 2016.
Bristow, L. A., Callbeck, C. M., Larsen, M., Altabet, M. A., Dekaezemacker, J., Forth, M., Gauns, M., Glud, R. N., Kuypers, M. M., Lavik, G., and Milucka, J.: N2 production rates limited by nitrite availability in the Bay of Bengal oxygen minimum zone, Nat. Geosci., 10, 24–29, https://doi.org/10.1038/ngeo2847, 2017.
Cavan, E. L., Trimmer, M., Shelley, F., and Sanders, R.: Remineralization of particulate organic carbon in an ocean oxygen minimum zone, Nat. Commun., 8, 1–9, https://doi.org/10.1038/ncomms14847, 2017.
Chang, B. X., Devol, A. H., and Emerson, S. R.: Denitrification and the nitrogen gas excess in the eastern tropical South Pacific oxygen deficient zone, Deep-Sea Res. Pt. I., 57, 1092–1101, https://doi.org/10.1016/j.dsr.2010.05.009, 2010.
Chang, B. X., Devol, A. H., and Emerson, S. R.: Fixed nitrogen loss from the eastern tropical North Pacific and Arabian Sea oxygen deficient zones determined from measurements of N2 : Ar, Global Biogeochem. Cy., 26, GB004207, https://doi.org/10.1029/2011GB004207, 2012.
Callbeck, C. M., Lavik, G., Ferdelman, T. G., Fuchs, B., Gruber-Vodicka, H. R., Hach, P. F., Littmann, S., Schoffelen, N. J., Kalvelage, T., Thomsen, S., and Schunck, H.: Oxygen minimum zone cryptic sulfur cycling sustained by offshore transport of key sulfur oxidizing bacteria, Nat. Commun., 9, 1–11, https://doi.org/10.1038/s41467-018-04041-x, 2018.
Canfield, D. E. and Thamdrup, B.: Towards a consistent classification scheme for geochemical environments, or, why we wish the term `suboxic' would go away, Geobiology, 7, 385–392, https://doi.org/10.1111/j.1472-4669.2009.00214.x, 2009.
Canfield, D. E., Stewart, F. J., Thamdrup, B., De Brabandere, L., Dalsgaard, T., Delong, E. F., Revsbech, N. P., and Ulloa, O.: A cryptic sulfur cycle in oxygen-minimum–zone waters off the Chilean coast, Science, 330, 1375–1378, https://doi.org/10.1126/science.1196889, 2010.
Clement, B. G., Luther, G. W., and Tebo, B. M.: Rapid, oxygen-dependent microbial Mn (II) oxidation kinetics at sub-micromolar oxygen concentrations in the Black Sea suboxic zone, Geochim. Cosmochim. Ac., 73, 1878–1889, https://doi.org/10.1016/j.gca.2008.12.023, 2009.
Codispoti, L. A., Brandes, J. A., Christensen, J. P., Devol, A. H., Naqvi, S. W. A., Paerl, H. W., and Yoshinari, T.: The oceanic fixed nitrogen and nitrous oxide budgets: Moving targets as we enter the anthropocene?, Sci. Mar., 65, 85–105, https://doi.org/10.3989/scimar.2001.65s285, 2001.
Codispoti, L. A.: An oceanic fixed nitrogen sink exceeding 400 Tg N a−1 vs the concept of homeostasis in the fixed-nitrogen inventory, Biogeosciences, 4, 233–253, https://doi.org/10.5194/bg-4-233-2007, 2007.
Codispoti, L. A., Brandes, J. A., Christensen, J. P., Devol, A. H., Naqvi, S. W. A., Paerl, H. W., and Yoshinari, T.: The oceanic fixed nitrogen and nitrous oxide budgets: Moving targets as we enter the anthropocene?, Sci. Mar., 65, 85–105, 2007.
Çoban-Yıldız, Y., Altabet, M. A., Yılmaz, A., and Tuğrul, S.: Carbon and nitrogen isotopic ratios of suspended particulate organic matter (SPOM) in the Black Sea water column, Deep Sea Res. Pt. II, 53, 1875–1892, https://doi.org/10.1016/j.dsr2.2006.03.021, 2006.
Dall'Olmo, G. and Mork, K. A.: Carbon export by small particles in the Norwegian Sea, Geophys. Res. Lett., 41, 2921–2927, https://doi.org/10.1002/2014GL059244, 2014.
Dalsgaard, T., Thamdrup, B., Farías, L., and Revsbech, N. P.: Anammox and denitrification in the oxygen minimum zone of the eastern South Pacific, Limnol. Oceanogr., 57, 1331–1346, https://doi.org/10.4319/lo.2012.57.5.1331, 2012.
Dalsgaard, T., Stewart, F. J., Thamdrup, B., De Brabandere, L., Revsbech, N. P., Ulloa, O., Canfield, D. E. and DeLong, E. F.: Oxygen at nanomolar levels reversibly suppresses process rates and gene expression in anammox and denitrification in the oxygen minimum zone off northern Chile, Mbio, 5, e01966-14, https://doi.org/10.1128/mBio.01966-14, 2014.
de Boyer Montégut, C., Madec, G., Fischer, A. S., Lazar, A., and Iudicone, D.: Mixed layer depth over the global ocean: An examination of profile data and a profile-based climatology, J. Geophys. Res.-Oceans, 109, https://doi.org/10.1029/2004JC002378, 2004.
Dellwig, O., Leipe, T., Ma, C., Glockzin, M., Pollehne, F., Schnetger, B., Yakushev, E. V, and Bo, M. E.: A new particulate Mn–Fe–P-shuttle at the redoxcline of anoxic basins, Geochim. Cosmochim. Ac., 74, 7100–7115. https://doi.org/10.1016/j.gca.2010.09.017, 2010.
DeVries, T., Deutsch, C., Primeau, F., Chang, B., and Devol, A.: Global rates of water-column denitrification derived from nitrogen gas measurements, Nat. Geosci., 5, 547–550, https://doi.org/10.1038/ngeo1515, 2012.
DeVries, T., Deutsch, C., Rafter, P. A., and Primeau, F.: Marine denitrification rates determined from a global 3-D inverse model, Biogeosciences, 10, 2481–2496, https://doi.org/10.5194/bg-10-2481-2013, 2013.
Ediger, D., Murray, J. W., and Yılmaz, A.: Phytoplankton biomass, primary production and chemoautotrophic production of the Western Black Sea in April 2003, J. Mar. Syst., 198, 103183, https://doi.org/10.1016/j.jmarsys.2019.103183, 2019.
Estapa, M. L., Feen, M. L., and Breves, E.: Direct observations of biological carbon export from profiling floats in the subtropical North Atlantic, Global Biogeochem. Cy., 33, 282–300, https://doi.org/10.1029/2018GB006098, 2019.
Fuchsman, C. A., Murray, J. W., and Konovalov, S. K.: Concentration and natural stable isotope profiles of nitrogen species in the Black Sea, Mar. Chem., 111, 90–105, https://doi.org/10.1016/j.marchem.2008.04.009, 2008.
Fuchsman, C. A., Kirkpatrick, J. B., Brazelton, W. J., Murray, J. W., and Staley, J. T.: Metabolic strategies of free-living and aggregate-associated bacterial communities inferred from biologic and chemical profiles in the Black Sea suboxic zone, FEMS Microbiol. Ecol., 78, 586–603, https://doi.org/10.1111/j.1574-6941.2011.01189.x, 2011.
Fuchsman, C. A., Staley, J. T., Oakley, B. B., Kirkpatrick, J. B., and Murray, J. W.: Free-living and aggregate-associated Planctomycetes in the Black Sea, FEMS Microbiol. Ecol., 80, 402–416, https://doi.org/10.1111/j.1574-6941.2012.01306.x, 2012a.
Fuchsman, C. A., Murray, J. W., and Staley, J. T.: Stimulation of autotrophic denitrification by intrusions of the Bosporus Plume into the anoxic Black Sea, Front. Microbiol., 3, 257, https://doi.org/10.3389/fmicb.2012.00257, 2012b.
Fuchsman, C. A., Devol, A. H., Saunders, J. K., McKay, C., and Rocap, G.: Niche partitioning of the N cycling microbial community of an offshore oxygen deficient zone, Front. Microbiol., 8, 2384, https://doi.org/10.3389/fmicb.2017.02384, 2017.
Fuchsman, C. A., Paul, B., Staley, J. T., Yakushev, E. V., and Murray, J. W.: Detection of transient denitrification during a high organic matter event in the Black Sea, Global Biogeochem. Cy., 33, 143–162, https://doi.org/10.1029/2018GB006032, 2019.
Ganesh, S., Parris, D. J., DeLong, E. F., and Stewart, F. J.: Metagenomic analysis of size-fractionated picoplankton in a marine oxygen minimum zone, ISME J., 8, 187, https://doi.org/10.1038/ismej.2013.144, 2014.
Ganesh, S., Bristow, L. A., Larsen, M., Sarode, N., Thamdrup, B., and Stewart, F. J.: Size-fraction partitioning of community gene transcription and nitrogen metabolism in a marine oxygen minimum zone, ISME J., 9, 2682, https://doi.org/10.1038/ismej.2015.44, 2015.
Glaubitz, S., Labrenz, M., Jost, G., and Jürgens, K.: Diversity of active chemolithoautotrophic prokaryotes in the sulfidic zone of a Black Sea pelagic redoxcline as determined by rRNA-based stable isotope probing, FEMS Microbiol. Ecol., 74, 32-41, https://doi.org/10.1111/j.1574-6941.2010.00944.x, 2010.
Grote, J., Jost, G., Labrenz, M., Herndl, G. J., and Jürgens, K: Epsilonproteobacteria represent the major portion of chemoautotrophic bacteria in sulfidic waters of pelagic redoxclines of the Baltic and Black Seas, Appl. Environ. Microbiol., 74, 7546–7551, https://doi.org/10.1128/AEM.01186-08, 2008.
Gruber, N. and Galloway, J. N.: An Earth-system perspective of the global nitrogen cycle, Nature, 451, 293–296, https://doi.org/10.1038/nature06592, 2008.
Gruber, N. and Sarmiento, J. L.: Global patterns of marine nitrogen fixation and denitrification, Global Biogeochem. Cy., 11, 235–266, https://doi.org/10.1029/97GB00077, 1997.
Hamme, R. C. and Emerson, S. R.: The solubility of neon, nitrogen and argon in distilled water and seawater, Deep-Sea Res. Pt. I, 51, 1517–1528, https://doi.org/10.1016/j.dsr.2004.06.009, 2004.
Helm, K. P., Bindoff, N. L., and Church, J. A.: Observed decreases in oxygen content of the global ocean, Geophys. Res. Lett., 38, https://doi.org/10.1029/2011GL049513, 2011.
Jayakumar, A., Chang, B. X., Widner, B., Bernhardt, P., Mulholland, M. R., and Ward, B. B.: Biological nitrogen fixation in the oxygen-minimum region of the eastern tropical North Pacific ocean, ISME J., 11, 2356–2367, https://doi.org/10.1038/ismej.2017.97, 2017.
Jensen, M. M., Kuypers, M. M., Gaute, L., and Thamdrup, B.: Rates and regulation of anaerobic ammonium oxidation and denitrification in the Black Sea, Limnol. Oceanogr., 53, 23–36, https://doi.org/10.4319/lo.2008.53.1.0023, 2008.
Johnson, K. S.: Manganese redox chemistry revisited, Science, 313, 1896–1897, https://doi.org/10.1126/science.1133496, 2006.
Johnson, K. S., Coale, K. H., Berelson, W. M., and Gordon, R. M.: On the formation of the manganese maximum in the oxygen minimum, Geochim. Cosmochim. Ac., 60, 1291–1299, https://doi.org/10.1016/0016-7037(96)00005-1, 1996.
Johnson, K. S., Pasqueron de Fommervault, O., Serra, R., D'Ortenzio, F., Schmechtig, C., Claustre, H., and Poteau, A.: Processing Bio-Argo nitrate concentration at the DAC level, https://doi.org/10.13155/46121, 2018.
Jørgensen, B. B., Fossing, H., Wirsen, C. O., and Jannasch, H. W.: Sulfide oxidation in the anoxic Black Sea chemocline, Deep-Sea Res., 38, S1083–S1103, https://doi.org/10.1016/S0198-0149(10)80025-1, 1991.
Karl, D. M., Knauer, G. A., and Martin, J. H.: Downward flux of particulate organic matter in the ocean: a particle decomposition paradox, Nature, 332, 438–441, https://doi.org/10.1038/332438a0, 1988.
Karl, D. M., Church, M. J., Dore, J. E., Letelier, R. M., and Mahaffey, C.: Predictable and efficient carbon sequestration in the North Pacific Ocean supported by symbiotic nitrogen fixation, P. Natl. Acad. Sci. USA, 109, 1842–1849, https://doi.org/10.1073/pnas.1120312109, 2012.
Keeling, R. F. and Garcia, H. E.: The change in oceanic O2 inventory associated with recent global warming, P. Natl. Acad. Sci. USA, 99, 7848–7853, https://doi.org/10.1073/pnas.122154899, 2002.
Kiko, R., Biastoch, A., Brandt, P., Cravatte, S., Hauss, H., Hummels, R., Kriest, I., Marin, F., McDonnell, A. M. P., Oschlies, A., and Picheral, M.: Biological and physical influences on marine snowfall at the equator, Nat. Geosci., 10, 852–858, https://doi.org/10.1038/ngeo3042, 2017.
Kirkpatrick, J. B., Fuchsman, C. A., Yakushev, E., Staley, J. T., and Murray, J. W.: Concurrent activity of anammox and denitrifying bacteria in the Black Sea, Front. Microbiol., 3, 256, https://doi.org/10.3389/fmicb.2012.00256, 2012.
Kirkpatrick, J. B., Fuchsman, C. A., Yakushev, E. V., Egorov, A. V., Staley, J. T., and Murray, J. W.: Dark N2 fixation: nifH expression in the redoxcline of the Black Sea, Aquat. Microb. Ecol., 82, 43–58. https://doi.org/10.3354/ame01882, 2018.
Konovalov, S. K., Luther, G. I. W., Friederich, G. E., Nuzzio, D. B., Tebo, B. M., Murray, J. W., Oguz, T., Glazer, B., Trouwborst, R. E., Clement, B., and Murray, K. J.: Lateral injection of oxygen with the Bosporus plume–fingers of oxidizing potential in the Black Sea, Limnol. Oceanogr., 48, 2369–2376, https://doi.org/10.4319/lo.2003.48.6.2369, 2003.
Konovalov, S. K., Murray, J. W., and Luther III, G. W.: Black Sea Biogeochemistry, Oceanography, 18, 24, https://doi.org/10.5670/oceanog.2005.39, 2005.
Konovalov, S. K., Murray, J. W., Luther, G. W., and Tebo, B. M.: Processes controlling the redox budget for the oxic/anoxic water column of the Black Sea, Deep-Sea Res. Pt. II, 53, 1817–1841, https://doi.org/10.1016/j.dsr2.2006.03.013, 2006.
Kuypers, M. M., Sliekers, A. O., Lavik, G., Schmid, M., Jørgensen, B. B., Kuenen, J. G., Damsté, J. S. S., Strous, M., and Jetten, M. S.: Anaerobic ammonium oxidation by anammox bacteria in the Black Sea, Nature, 422, 608, https://doi.org/10.1038/nature01472, 2003.
Lam, P., Jensen, M. M., Lavik, G., McGinnis, D. F., Müller, B., Schubert, C. J., Amann, R., Thamdrup, B., and Kuypers, M. M.: Linking crenarchaeal and bacterial nitrification to anammox in the Black Sea, P. Natl. Acad. Sci. USA, 104, 7104–7109, https://doi.org/10.1073/pnas.0611081104, 2007.
Lam, P., Lavik, G., Jensen, M. M., van de Vossenberg, J., Schmid, M., Woebken, D., Gutiérrez, D., Amann, R., Jetten, M. S. and Kuypers, M. M.: Revising the nitrogen cycle in the Peruvian oxygen minimum zone, P. Natl. Acad. Sci. USA, 106, 4752–4757, https://doi.org/10.1073/pnas.0812444106, 2009.
Lewis, B. L. and Luther III, G. W.: Processes controlling the distribution and cycling of manganese in the oxygen minimum zone of the Arabian Sea, Deep Sea Res. Pt. II, 47, 1541–1561, https://doi.org/10.1016/S0967-0645(99)00153-8, 2000.
Margolin, A. R., Gerringa, L. J., Hansell, D. A., and Rijkenberg, M. J.: Net removal of dissolved organic carbon in the anoxic waters of the Black Sea, Mar. Chem., 183, 13–24, https://doi.org/10.1016/j.marchem.2016.05.003, 2016.
Margolskee, A., Frenzel, H., Emerson, S., and Deutsch, C.: Ventilation pathways for the North Pacific oxygen deficient zone, Global Biogeochem. Cy., 33, 875–890, https://doi.org/10.1029/2018GB006149, 2019.
Martin, J. H. and Knauer, G. A.: VERTEX: manganese transport through oxygen minima, Earth Planet. Sci., 67, 35–47, https://doi.org/10.1016/0012-821X(84)90036-0, 1984.
Murray, J. W., Codispoti, L. A., and Friederich, G. E.: Oxidation-reduction environments: The suboxic zone in the Black Sea, in: Aquatic chemistry: Interfacial and interspecies processes, edited by: Huang, C. P., O'Melia, C. R., and Morgan, J. J., ACS Advances in Chemistry Series, 224, 157–176, American Chemical Society, Washington DC, 1995.
Murray, J. W., Fuchsman, C., Kirkpatrick, J., Paul, B., and Konovalov, S. K.: Species and δ15N Signatures of nitrogen Transformations in the Suboxic Zone of the Black Sea, Oceanography., 18, 36–47, https://doi.org/10.5670/oceanog.2005.40, 2005.
Naqvi, S. W. A.: Geographical extent of denitrification in the Arabian Sea, Oceanol. Acta, 14, 281–290, 1991.
Naqvi, S. W. A., Kumar, M. D., Narvekar, P. V., De Sousa, S. N., George, M. D., and D'silva, C.: An intermediate nepheloid layer associated with high microbial metabolic rates and denitrification in the northwest Indian Ocean, J. Geophys. Res.-Oceans, 98, 16469–16479, https://doi.org/10.1029/93JC00973, 1993.
Organelli, E., Dall'Olmo, G., Brewin, R. J., Tarran, G. A., Boss, E., and Bricaud, A.: The open-ocean missing backscattering is in the structural complexity of particles, Nat. Commun., 9, 1–11, https://doi.org/10.1038/s41467-018-07814-6, 2018.
Oschlies, A., Brandt, P., Stramma, L., and Schmidtko, S.: Drivers and mechanisms of ocean deoxygenation, Nat. Geosci., 11, 467–473, https://doi.org/10.1038/s41561-018-0152-2, 2018.
Peters, B. D., Babbin, A. R., Lettmann, K. A., Mordy, C. W., Ulloa, O., Ward, B. B., and Casciotti, K. L.: Vertical modeling of the nitrogen cycle in the eastern tropical South Pacific oxygen deficient zone using high-resolution concentration and isotope measurements, Global Biogeochem. Cy., 30, 1661–1681, https://doi.org/10.1002/2016GB005415, 2016.
Rasse, R. and Dall'Olmo, G.: Do oceanic hypoxic regions act as barriers for sinking particles? A case study in the eastern tropical north Atlantic, Global Biogeochem. Cy., 33, https://doi.org/10.1029/2019GB006305, 2019.
Reed, A., McNeil, C., D'Asaro, E., Altabet, M., Bourbonnais, A., and Johnson, B.: A gas tension device for the mesopelagic zone, Deep Sea Res. Pt. I, 139, 68–78, https://doi.org/10.1016/j.dsr.2018.07.007, 2018.
Schmechtig, C., Claustre, H., Poteau, A., and D'Ortenzio, F.: Bio-Argo quality control manual for the chlorophyll-a concentration, Argo Data Management, https://doi.org/10.13155/35385, 2014.
Schmechtig, C., Poteau, A., Claustre, H., D'ortenzio, F., Giorgio Dall'Olmo, G., and Boss E.: Processing BGC-Argo particle backscattering at the DAC level, Argo Data Management, https://doi.org/10.13155/39459, 2015.
Schmidtko, S., Stramma, L., and Visbeck, M.: Decline in global oceanic oxygen content during the past five decades, Nature, 542, 335–339, https://doi.org/10.1038/nature21399, 2017.
Sorokin, Y. I.: The Black Sea: ecology and oceanography, Biology of Inland Waters Series, Leiden Backhuys, Netherlands, 875 pp., 2002.
Spinrad, R. W., Glover, H., Ward, B. B., Codispoti, L. A., and Kullenberg, G.: Suspended particle and bacterial maxima in Peruvian coastal waters during a cold water anomaly, Deep-Sea Res. Pt. I, 36, 715–733, 1989.
Stanev, E. V., Grayek, S., Claustre, H., Schmechtig, C., and Poteau, A.: Water intrusions and particle signatures in the Black Sea: a Biogeochemical-Argo float investigation, Ocean Dyn., 67, 1119–1136, https://doi.org/10.1007/s10236-017-1077-9, 2017.
Stanev, E. V., Poulain, P. M., Grayek, S., Johnson, K. S., Claustre, H., and Murray, J. W.: Understanding the Dynamics of the Oxic-Anoxic Interface in the Black Sea, Geophys. Res. Lett., 45, 864–871, https://doi.org/10.1002/2017GL076206, 2018.
Stramma, L., Johnson, G. C., Sprintall, J., and Mohrholz, V.: Expanding oxygen-minimum zones in the tropical oceans, Science, 320, 655–658, https://doi.org/10.1126/science.1153847, 2008.
Stramski, D., Reynolds, R. A., Kahru, M., and Mitchell, B. G.: Estimation of particulate organic carbon in the ocean from satellite remote sensing, Science, 285, 239–242, https://doi.org/10.1126/science.285.5425.239, 1999.
Stramski, D., Boss, E., Bogucki, D., and Voss, K. J.: The role of seawater constituents in light backscattering in the ocean, Prog. Oceanogr., 61, 27–56, https://doi.org/10.1016/j.pocean.2004.07.001, 2004.
Stumm, W. and Morgan, J. J.: Aquatic Chemistry: An Introduction Emphasizing Chemical Equilibria in Natural Waters, Wiley-Interscience, New York, 1970.
Thierry, V., Bittig, H., and Argo BGC Team.: Argo quality control manual for dissolved oxygen concentration, Version 2.0, 23 October 2018, Argo Data Management, https://doi.org/10.13155/46542, 2018.
Tsementzi, D., Wu, J., Deutsch, S., Nath, S., Rodriguez-R, L. M., Burns, A. S., Ranjan, P., Sarode, N., Malmstrom, R. R., Padilla, C. C., nad Stone, B. K.: SAR11 bacteria linked to ocean anoxia and nitrogen loss, Nature, 536, 179–183, https://doi.org/10.1038/nature19068, 2016.
Tutasi, P. and Escribano, R.: Zooplankton diel vertical migration and downward C flux into the oxygen minimum zone in the highly productive upwelling region off northern Chile, Biogeosciences, 17, 455–473, https://doi.org/10.5194/bg-17-455-2020, 2020.
Ulloa, O., Canfield, D. E., DeLong, E. F., Letelier, R. M., and Stewart, F. J.: Microbial oceanography of anoxic oxygen minimum zones, P. Natl. Acad. Sci. USA, 109, 15996–16003, https://doi.org/10.1073/pnas.1205009109, 2012.
Wang, W. L., Moore, J. K., Martiny, A. C., and Primeau, F. W.: Convergent estimates of marine nitrogen fixation, Nature, 566, 205–211, https://doi.org/10.1038/s41586-019-0911-2, 2019.
Ward, B. B.: How nitrogen is lost, Science, 341, 352–353, https://doi.org/10.1126/science.1240314, 2013.
Ward, B. B., Devol, A. H., Rich, J. J., Chang, B. X., Bulow, S. E., Naik, H., Pratihary, A., and Jayakumar, A.: Denitrification as the dominant nitrogen loss process in the Arabian Sea, Nature, 461, 78–81, https://doi.org/10.1038/nature08276, 2009.
Ward, B. B. and Kilpatrick, K. A.: Nitrogen transformations in the oxic layer of permanent anoxic basins: the Black Sea and the Cariaco Trench, in: Black Sea Oceanography, Springer, Dordrecht, https://doi.org/10.1007/978-94-011-2608-3_7, 111–124, 1991.
Ward, B. B., Tuit, C. B., Jayakumar, A., Rich, J. J., Moffett, J., and Naqvi, S. W. A.: Organic carbon, and not copper, controls denitrification in oxygen minimum zones of the ocean, Deep-Sea Res. Pt. I., 55, 1672–1683, https://doi.org/10.1016/j.dsr.2008.07.005, 2008.
Whitmire, A. L., Letelier, R. M., Villagrán, V., and Ulloa, O.: Autonomous observations of in vivo fluorescence and particle backscattering in an oceanic oxygen minimum zone, Opt. Express, 17, 21992–22004, https://doi.org/10.1364/OE.17.021992, 2009.
Wojtasiewicz, B., Trull, T. W., Bhaskar, T. U., Gauns, M., Prakash, S., Ravichandran, M., and Hardman-Mountford, N. J.: Autonomous profiling float observations reveal the dynamics of deep biomass distributions in the denitrifying oxygen minimum zone of the Arabian Sea, 207, 103103, J. Mar. Syst., https://doi.org/10.1016/j.jmarsys.2018.07.002, 2020.
Yakushev, E. V., Pollehne, F., Jost, G., Kuznetsov, I., Schneider, B., and Umlauf, L.: Analysis of the water column oxic/anoxic interface in the Black and Baltic seas with a numerical model, Mar. Chem., 107, 388–410, https://doi.org/10.1016/j.marchem.2007.06.003, 2007.
Yılmaz, A., Çoban-Yıldız, Y., Telli-Karakoç, F., and Bologa, A.: Surface and mid-water sources of organic carbon by photoautotrophic and chemoautotrophic production in the Black Sea. Deep Sea Research Part II: Topical Studies in Oceanography, Deep Sea Res. Pt. II, 53, 1988–2004, https://doi.org/10.1016/j.dsr2.2006.03.015, 2006.
- Abstract
- Introduction
- Background nature of the small particles contributing to the bbp-layer and their links with N2 yielding
- Methods
- Results and discussion
- Conclusions
- Appendix A: Sampling locations and time series of floats 7900591 and 6900807
- Data availability
- Author contributions
- Competing interests
- Acknowledgements
- Financial support
- Review statement
- References