the Creative Commons Attribution 4.0 License.
the Creative Commons Attribution 4.0 License.
 | 22 Feb 2021
Changes in population depth distribution and oxygen stratification are involved in the current low condition of the eastern Baltic Sea cod (Gadus morhua)
Martin Hansson
Alessandro Orio
Karin Limburg
During the past 20 years, hypoxic areas have expanded rapidly in the Baltic Sea, which has become one of the largest marine “dead zones” in the world. At the same time, the most important commercial fish population of the region, the eastern Baltic cod, has experienced a drastic reduction in mean body condition, but the processes behind the relation between deoxygenation and condition remain elusive. Here we use extensive long-term monitoring data on cod biology and distribution as well as on hydrological variations to investigate the processes that relate deoxygenation and cod condition during the autumn season. Our results show that the depth distribution of cod has increased during the past 4 decades at the same time of the expansion, and shallowing, of waters with oxygen concentrations detrimental to cod performance. This has resulted in a progressively increasing spatial overlap between the cod population and low-oxygenated waters after the mid-1990s. This spatial overlap and the actual oxygen concentration experienced by cod therein statistically explained a large proportion of the changes in cod condition over the years. These results complement previous analyses on fish otolith microchemistry that also revealed that since the mid-1990s, cod individuals with low condition were exposed to low-oxygen waters during their life. This study helps to shed light on the processes that have led to a decline of the eastern Baltic cod body condition, which can aid the management of this population currently in distress. Further studies should focus on understanding why the cod population has moved to deeper waters in autumn and on analyzing the overlap with low-oxygen waters in other seasons to quantify the potential effects of the variations in physical properties on cod biology throughout the year.
- Article
(5016 KB) - Full-text XML
-
Supplement
(130 KB) - BibTeX
- EndNote


The oceans and marine coastal areas are experiencing dramatic deoxygenation worldwide (Breitburg et al., 2018). Declining oxygen can have multiple direct and indirect effects on aquatic organisms and entire ecosystems (Breitburg, 2002; Rabalais et al., 2002; Wu, 2002; Diaz and Rosenberg, 2008; Levin et al., 2009). In particular, studies undertaken both in the wild and within experimental set-ups have revealed large effects of hypoxia on basic metabolism, behavior, ecology, distribution and life-history traits of fish (Chabot and Dutil, 1999; Pichavant et al., 2001; Eby et al., 2005; Herbert and Steffensen, 2005; Domenici et al., 2007; Stramma et al., 2012).
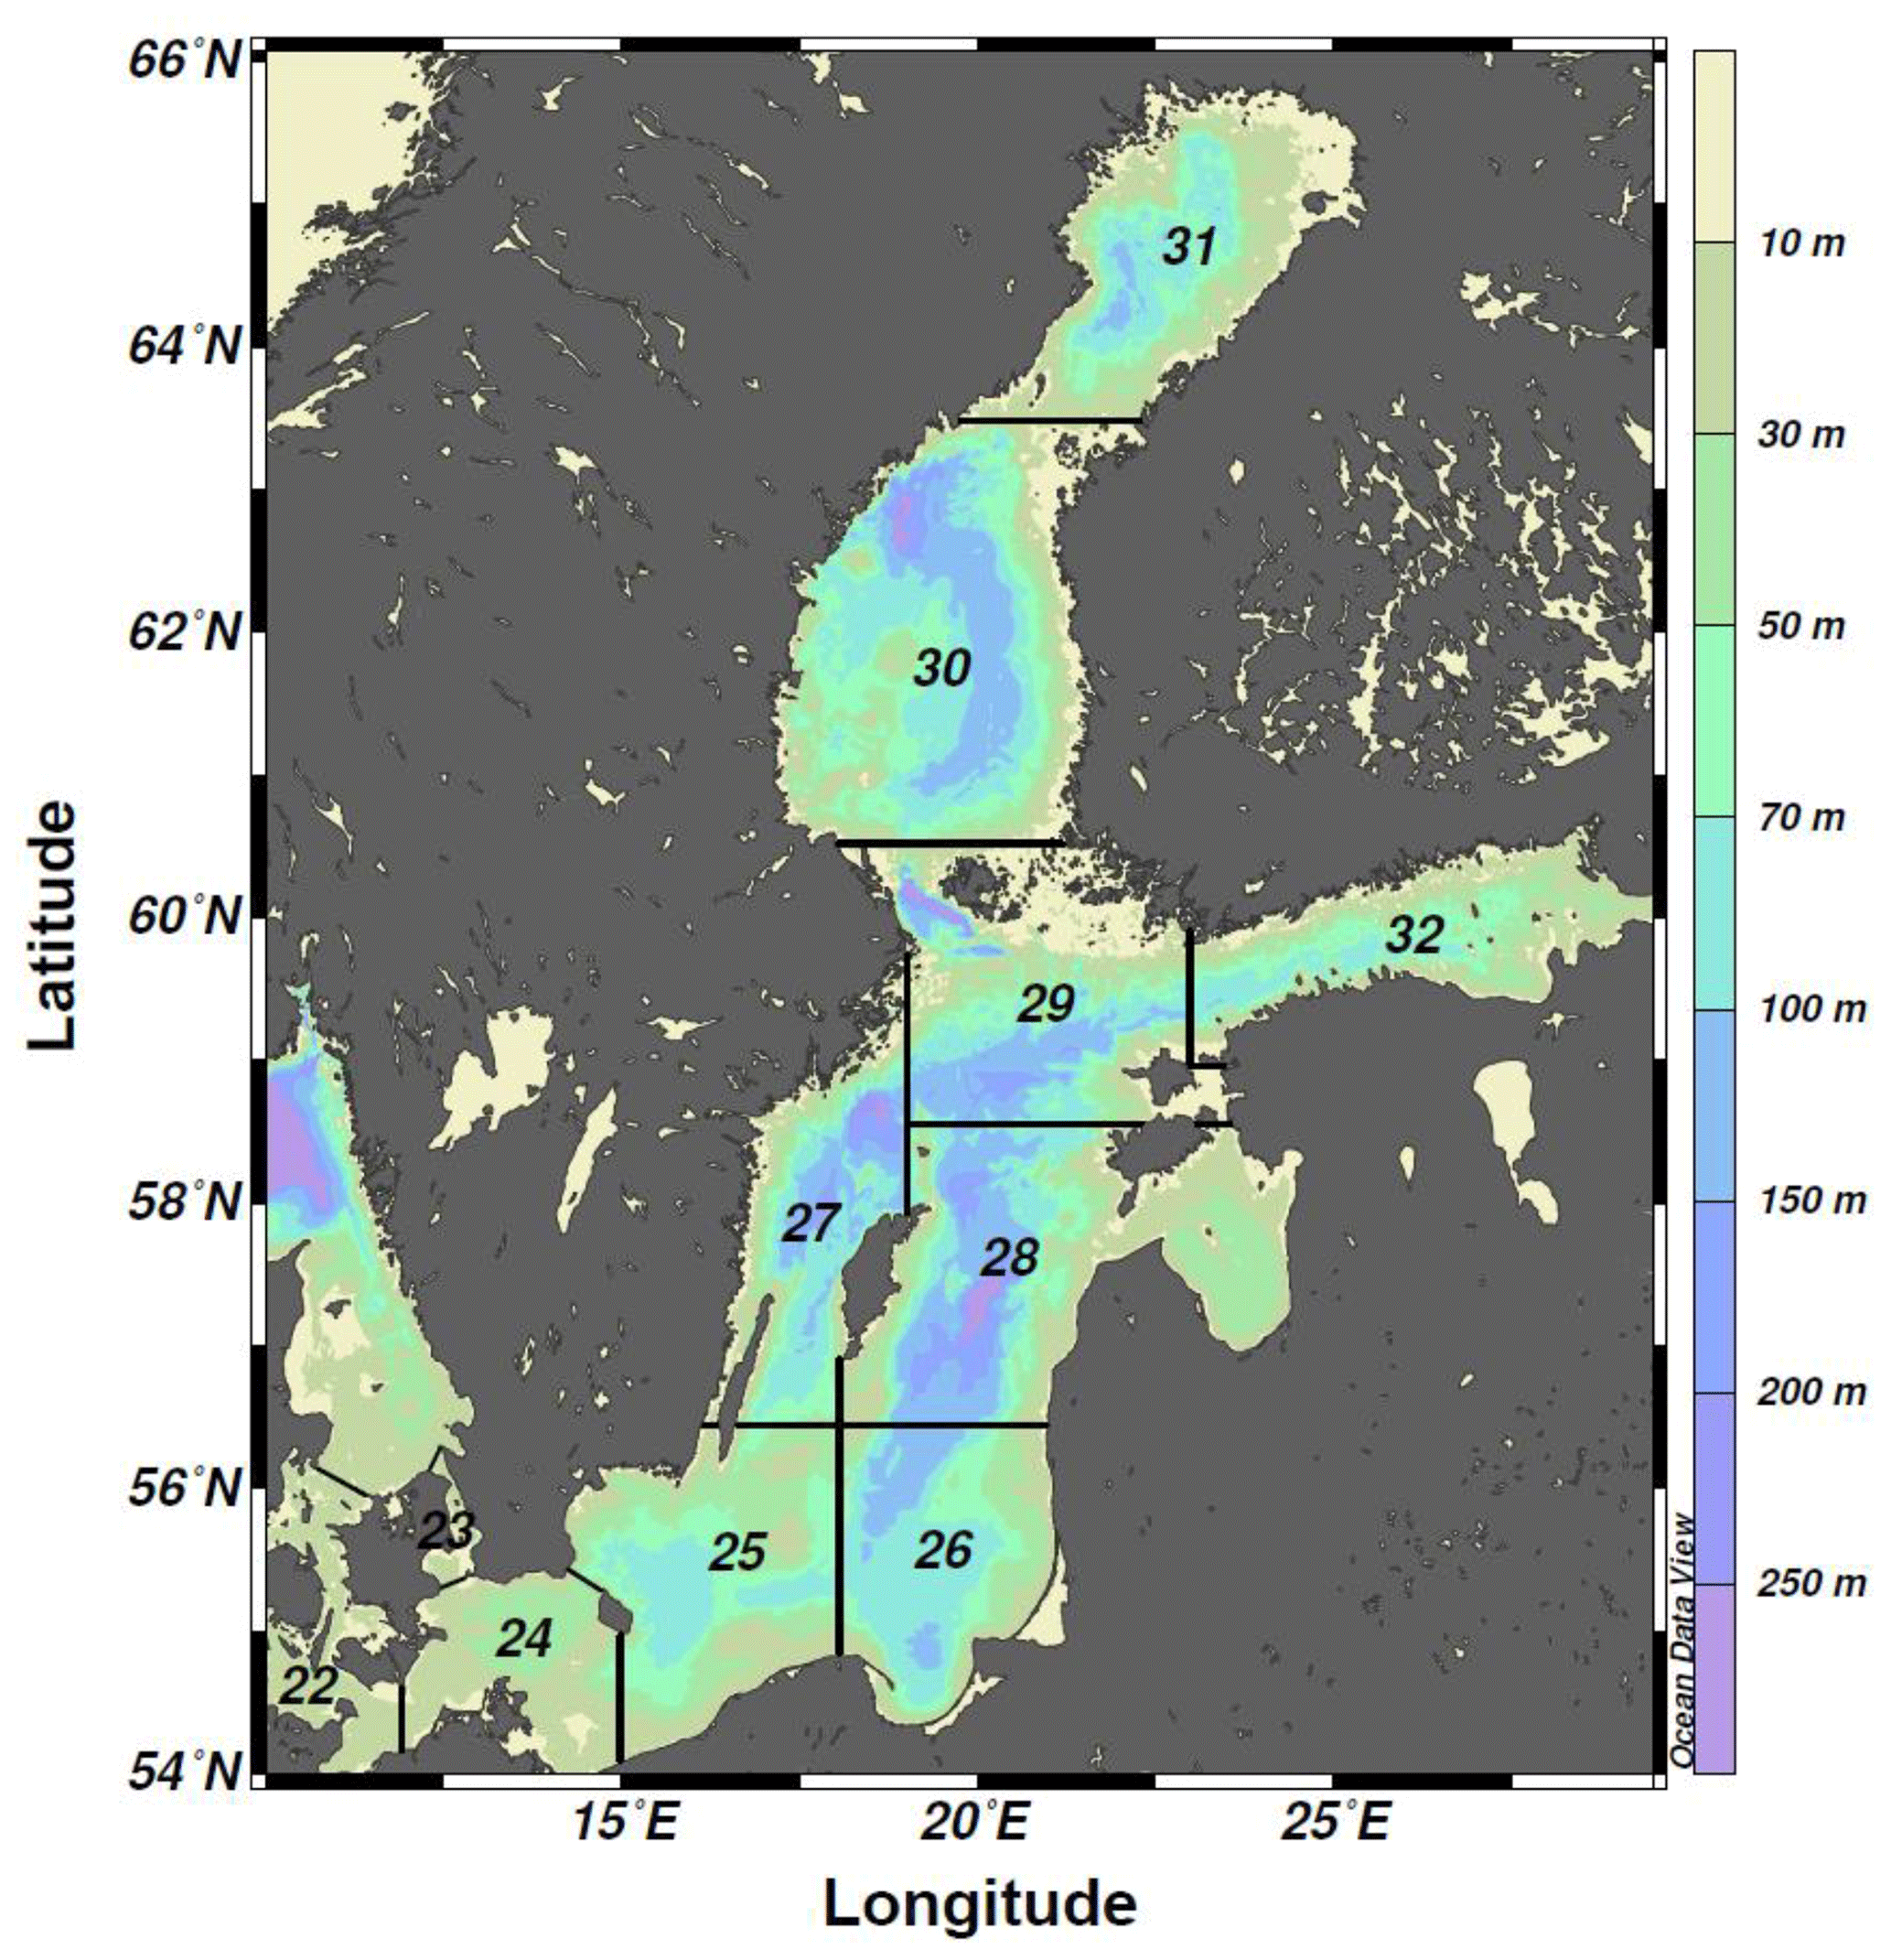
Figure 1Bathymetric map of the Baltic Sea divided into ICES subdivisions (SDs). The study area includes the SDs 25–28 (i.e., the central Baltic Sea).
The Baltic Sea (Fig. 1) is one of the largest brackish areas in the world where the oxygenated, yet scarce and irregular, saline water inflows from the adjacent North Sea, combined with a water residence time of about 25–30 years, make the system particularly prone to hypoxia (Carstensen et al., 2014; Reusch et al., 2018). As a consequence, and in combination with global warming and eutrophication, the Baltic Sea has become one of the largest anthropogenic “dead zones” in the world (Breitburg et al., 2018), with degradation or elimination of benthic communities and disruption of benthic food webs over vast areas (Conley et al., 2009). In particular, since the early 1990s the anoxic and hypoxic areas have increased rapidly in the southern and central Baltic Sea (Carstensen et al., 2014) (Fig. 2).
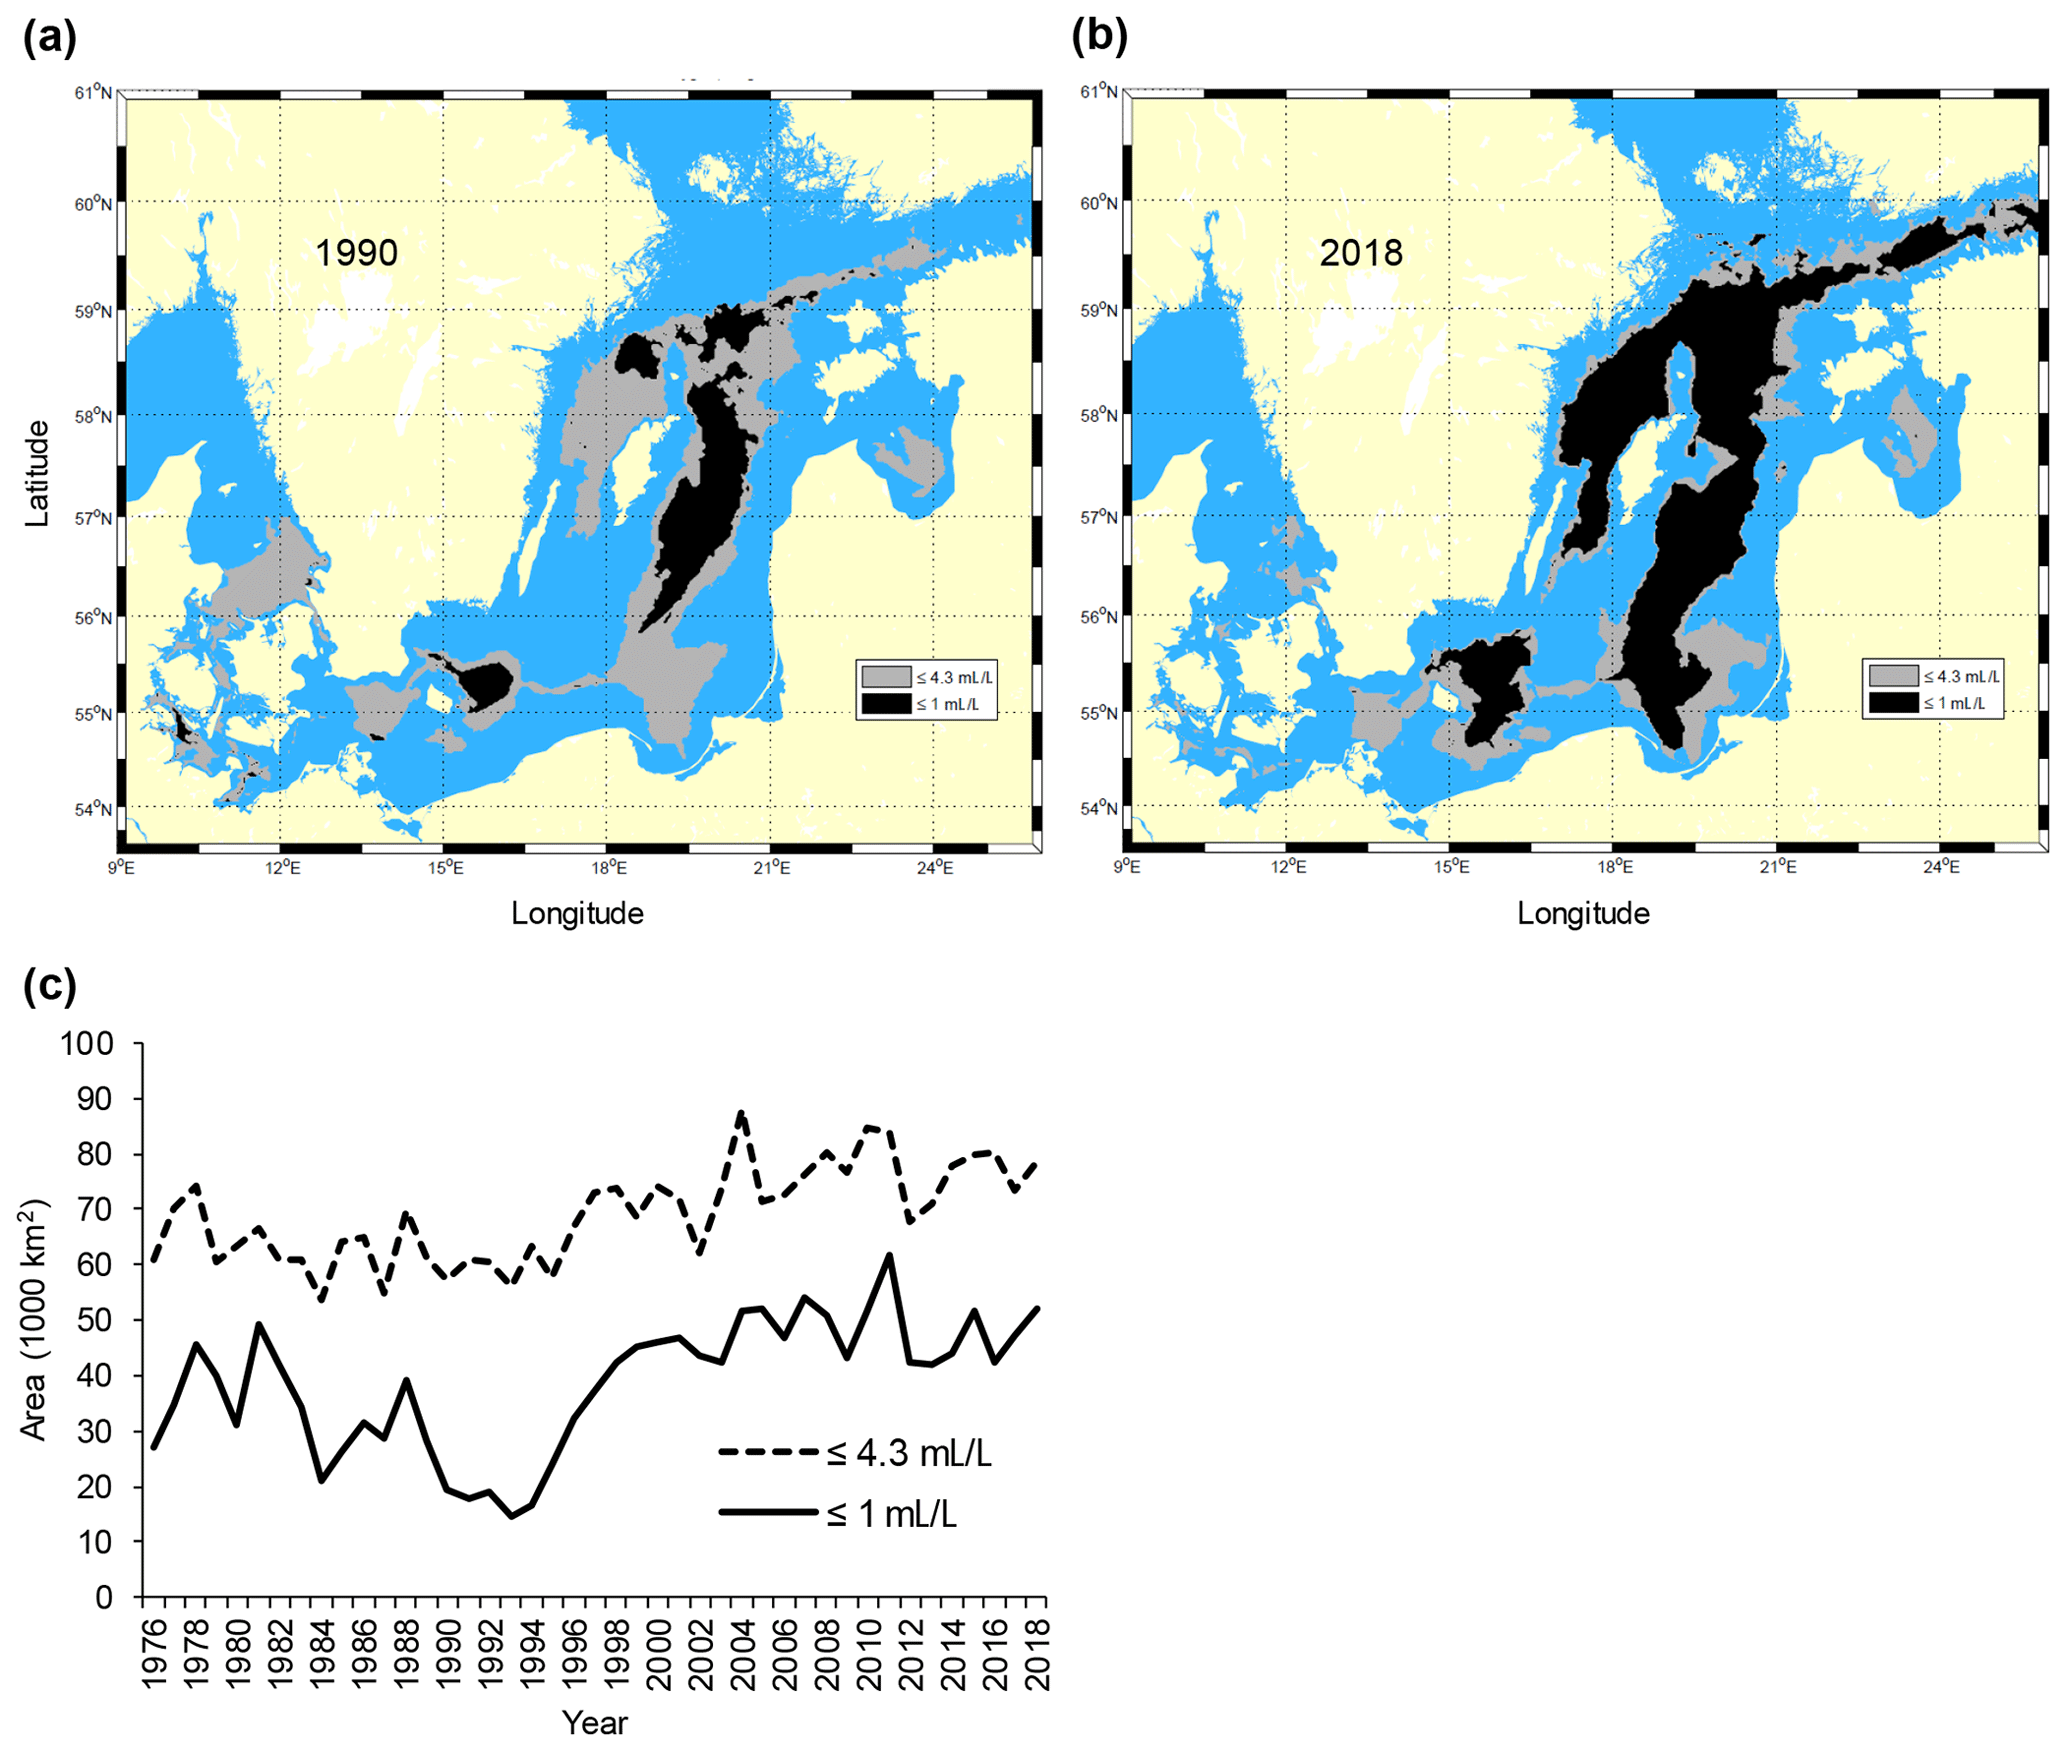
Figure 2Maps of the Baltic Sea with superimposed areas with oxygen concentration ≤1 mL L−1 (black, avoided by cod) and ≤4.3 mL L−1 (grey, sub-lethal level, producing negative effects on cod performance) in (a) 1990 and (b) 2018. Time series of the total area (km2) with oxygen concentration ≤1 and ≤4.3 mL L−1 in the subdivisions 25–28 (c). Raw oxygen data were retrieved from the ICES Dataset on Ocean Hydrography (ICES; http://www.ices.dk, last access: 21 January 2020) and processed by the Swedish Meteorological and Hydrological Institute (SMHI) (see also Casini et al., 2016a).
In this degraded demersal and benthic environment, body condition (a morphometric index of fish fatness and well-being) of the dominant demersal fish population, the eastern Baltic cod Gadus morhua (hereafter simply referred to as Baltic cod), has declined since the mid-1990s (Casini et al., 2016a). This decline was also stressed by the fishery that suffered from an increasingly high proportion of catches of lean cod with low economic value. Low condition has a negative effect on reproductive potential (Mion et al., 2018), mortality (Casini et al., 2016b) and potentially also movements (Mehner and Kasprzak, 2011) with indirect effects on prey and therefore food-web structure and ecosystem functioning as shown in other systems (e.g., Ekau et al., 2010). Therefore, it is very important to understand the ultimate factors leading to low cod condition.
The decline in the Baltic cod condition has been related to a decrease in the main pelagic prey abundance in the main distribution area of cod (Eero et al., 2012; Casini et al., 2016a) and increased parasite infestation (Horbowy et al., 2016) but also to the increased extent of hypoxic and anoxic areas (Casini et al., 2016a). The mechanistic processes linking hypoxia and cod conditions could be various and not mutually exclusive, including stress due to direct hypoxia exposure, suitable-habitat contraction and consequent change in cod spatial distribution, and change in the surrounding biota such as reduction of important benthic prey (Casini et al., 2016a). Limburg and Casini (2019), using otolith microchemistry, showed that fish in low condition at capture were exposed during their lives to lower oxygen levels than those in good condition (at least from the mid-1990s), suggesting that direct exposure to low-oxygen waters could constitute a key factor. However, Limburg and Casini (2019) did not analyze the spatial distribution of the cod population in relation to low-oxygen layers and therefore whether or not a large part of the population indeed experienced stressful circumstances, which could explain the decline in mean population condition found by Casini et al. (2016a).
In this study, we fill this gap and specifically analyze the temporal changes in the depth distribution of cod, from long-term monitoring data, in relation to the actual oxygen levels experienced by the cod population and the oxygen levels acknowledged in literature to affect cod behavior and performance.
2.1 Biological data and estimation of cod condition
Biological data on eastern Baltic cod individuals (n=124 165) were collected during the Baltic International Trawl Survey, BITS, between 1991 and 2018 (retrieved from the DATRAS database of the International Council for the Exploration of the Sea, ICES; http://www.ices.dk, last access: 28 January 2020) and previous Swedish and Latvian bottom trawl surveys performed in 1979–1990 in the Baltic Sea (Casini et al., 2016a). Cod individual body condition (Fulton's K) was estimated as , where W is the total weight (g) and L the total length (cm, typically measured from the tip of the snout to the tip of the longer lobe of the caudal fin) of the fish. Mean condition was estimated for ICES subdivision (SD) 25 (corresponding to the main distribution area for eastern Baltic cod since the early 1990s; Orio et al., 2017) and SDs 26–28 separately, updating the time series in Casini et al. (2016a). More northern SDs were not included due to their low and inconsistent survey coverage through the years. Condition for small fish (represented here by the size class 20–29 cm) and large fish (represented here by the size class 40–49 cm) was used in the analyses, as cod change diet during their ontogeny, and these two size classes differ in feeding habits (Neuenfeldt et al., 2020). We could not use smaller and larger size classes because of their scarcity in the BITS survey catches. The small size class could also be considered to represent juvenile fish (Eero et al., 2015), although, since around 2005, the mean length at first maturity has decreased below 30 cm (Köster et al., 2017). Years with <25 observations for the respective length classes and SDs were excluded from the analyses. We focused on cod condition in autumn (quarter 4 BITS survey, from mid-October to mid-December), corresponding to the cod main growth season after spawning in spring–summer (Mion et al., 2020). Moreover, for the autumn season, long time series of oxygen levels and extent of hypoxic areas are also available (Casini et al., 2016a).
2.2 Estimation of cod depth distribution
Indices of cod biomass (calculated as catch per unit effort, CPUE, kg/h, herein referred to as biomass) and depth distribution (i.e., mean depth and interquartile range of predicted depth distribution) from the BITS and historical bottom trawl surveys in SDs 25–28 from 1979 to 2018 were estimated for large (≥30 cm) and small cod (<30 cm) using a modeling procedure similar to the one used in Orio et al. (2019). However, in the current study rather than including environmental variables in the models, quarter was included in interactions with latitude and longitude and with depth. To estimate the changes in cod depth distribution in SDs 26–28 that account for the changes in the spatial distribution of the cod population, the SD-specific depth distributions were weighted by the annual SD-specific cod CPUEs from the bottom trawl surveys in quarter 4, estimated from the same model, for large and small cod.
2.3 Depth of hypoxic layers
Baltic cod have been shown to avoid oxygen concentrations below 1 mL L−1 (approximately 1.4 mg L−1) (Schaber et al., 2012). Therefore, time series of the depth at which 1 mL L−1 oxygen concentration was encountered in October–November by SD were constructed by the Swedish Meteorological and Hydrological Institute (SMHI) using raw data retrieved from the ICES Dataset on Ocean Hydrography (ICES; http://www.ices.dk, last access: 21/01/2020).
Time series of depth at which 4.3 mL L−1 oxygen concentration (approximately 6 mg L−1) was encountered in October–November by SD were also constructed. This oxygen concentration, on average, has been found to affect the performance of fish (Vaquer-Sunyer and Duarte, 2008). Specifically for cod, 4.3 mL L−1 has been found as the threshold below which an effect on condition and growth starts to be observable (Chabot and Dutil, 1999). Therefore, we expected that the occurrence of cod in areas and depths with an oxygen concentration ≤4.3 mL L−1 would lead to an increase in the proportion of cod individuals with very low condition (K<0.8; Eero et al., 2012) and a decrease in mean condition in the population. To relate the depths at which 1 and 4.3 mL L−1 oxygen concentrations were encountered to cod depth of occurrence in SDs 26–28, the oxygen depths in each SD were weighted with the annual SD-specific cod CPUEs from the bottom trawl surveys in quarter 4, for large and small cod. In this way, the oxygen circumstances in the SDs where cod were more abundant were weighted the most.
2.4 Depth overlap between cod and hypoxic layers and oxygen experienced by cod
We estimated the overlap (% meters) between the cod depth range of distribution and the water layer with oxygen concentration ≤4.3 mL L−1, as estimated above, in both SD 25 and SDs 26–28. We also constructed the time series of the oxygen concentrations at the mean depth and interquartile range of the cod depth distribution in each SD (October–November data from the ICES Dataset on Ocean Hydrography and processed by SMHI). Also in this case, for SDs 26–28 the oxygen concentrations in each SD were weighted with the annual SD-specific cod CPUEs from the bottom trawl surveys in quarter 4, for large and small cod.
2.5 Modeling of cod condition versus oxygen
To formally analyze the effect of the depth overlap and oxygen concentrations experienced by cod on cod condition, we used generalized additive models (GAMs; Hastie and Tibshirani, 1990). The following additive formulation was used:
where depth overlap is the overlap between the cod depth range of distribution and the water layer with an oxygen concentration ≤4.3, and oxygen experienced is the actual oxygen level corresponding to the cod depth distribution (we used for this the oxygen corresponding to the deeper interquartile of the cod depth range of distribution). s is the thin plate smoothing spline function and ε is random error. We limited the maximum degrees of freedom acceptable for each term to k=4, which retains model flexibility and allows at the same time an ecological interpretability of the results. A gamma distribution with an identity function was used. Residuals were inspected for deviation from the assumption of normality and no autocorrelation using graphical methods (Cleveland, 1993). The statistical analyses were performed using the mgcv library of R v. 4.0.2 (https://www.r-project.org). The significance level was set to α=0.05 for all tests.
3.1 Cod condition
Cod condition increased slightly between the mid-1970s and mid-1990s but declined abruptly thereafter. This pattern was similar in SD 25 and SDs 26–28 for both large and small cod (Fig. 3), but after the mid-1990s condition dropped more for large cod (∼ 30 % for large cod and 20 %–25 % for small cod). The percentage of large fish with very low condition (<0.8; see Eero et al., 2012) increased from the end of the 1990s in both SD 25 and SDs 26–28, reaching 30 %–40 % in recent years. The percentage of small fish with low condition also increased, but lagged temporally behind the large cod, and at 10 %–20 % of observations was lower than the high incidences of large cod in poor condition (Fig. 3). In general, in SD 25 condition declined slightly more (and the percentage of fish with very low condition increased more) than in SDs 26–28 after the mid-1990s.
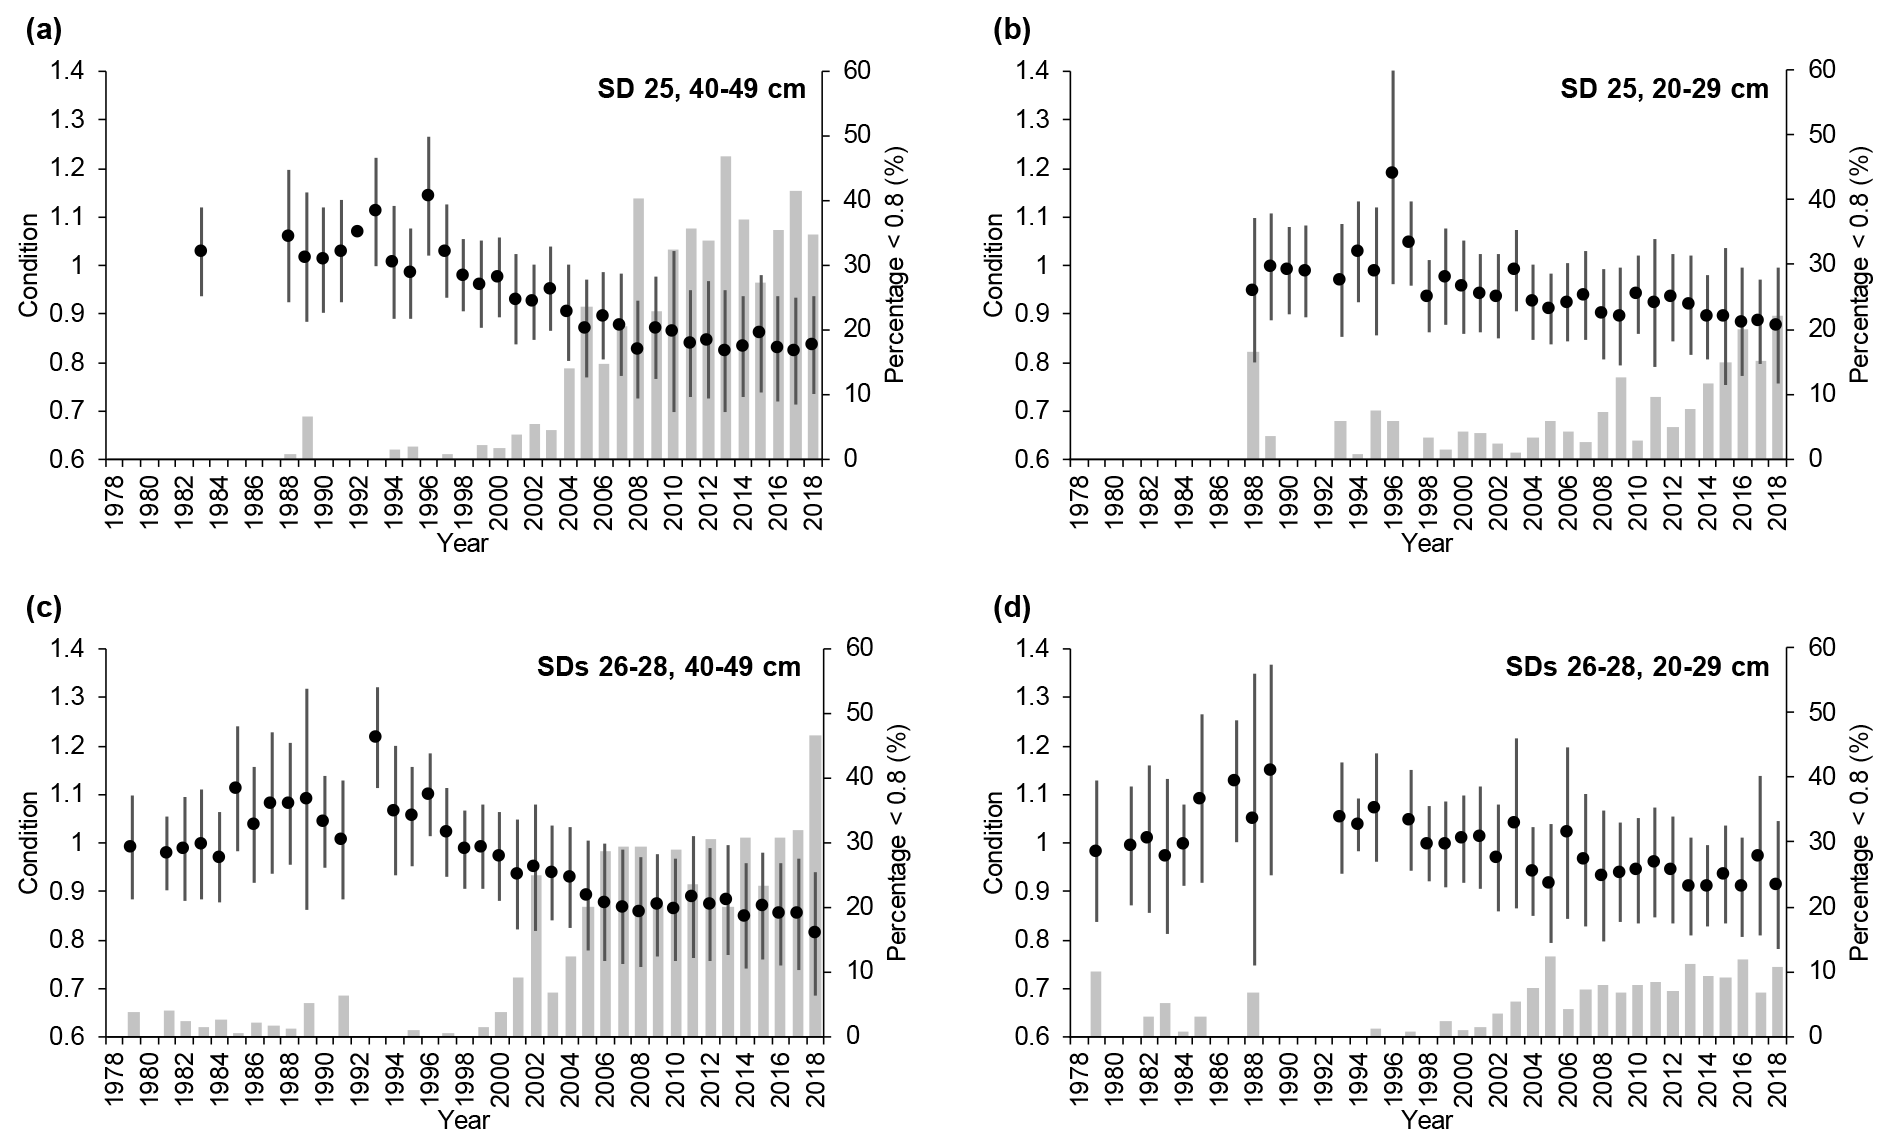
Figure 3Temporal developments of mean cod condition (±1 standard deviation) in subdivision (SD) 25 and SDs 26–28 for (a, c) large cod (40–49 cm) and (b, d) small cod (20–29 cm). Superimposed (grey bars) are the temporal developments of the percentage of cod with very low condition (<0.8) for the respective SDs and length classes.
3.2 Cod depth distribution
Large cod in SD 25 were distributed between 35 and 50 m depth (average 43 m) at the beginning of the time series, but they have been found in somewhat deeper waters (down to 40–60 m, average 50 m) from the early 2000s (Fig. 4a). In SDs 26–28 large cod were distributed between 35 and 55 m depth (average 45 m) at the beginning of the time series, whereas after the mid-1990s they became distributed between 50 and 75 m depth (average 62 m) (Fig. 4c). Along with the change in mean depth, large cod in SDs 26–28 have shown a contraction of the range of depth distribution in the past 20 years. Small cod were distributed somewhat shallower than the large fish, but they also moved into deeper waters during the time period investigated. In SD 25, small cod shifted distribution from between 30 and 50 m depth (average 40 m) to 45–60 m depth (average 53 m) (Fig. 5a). In SDs 26–28 small cod moved deeper with time as well, from 30–50 m depth (average 40 m) to 45–65 m depth (average 55 m), and they experienced a contraction of the range of depth distribution similar to what occurred for the large fish in this area (Fig. 5c).
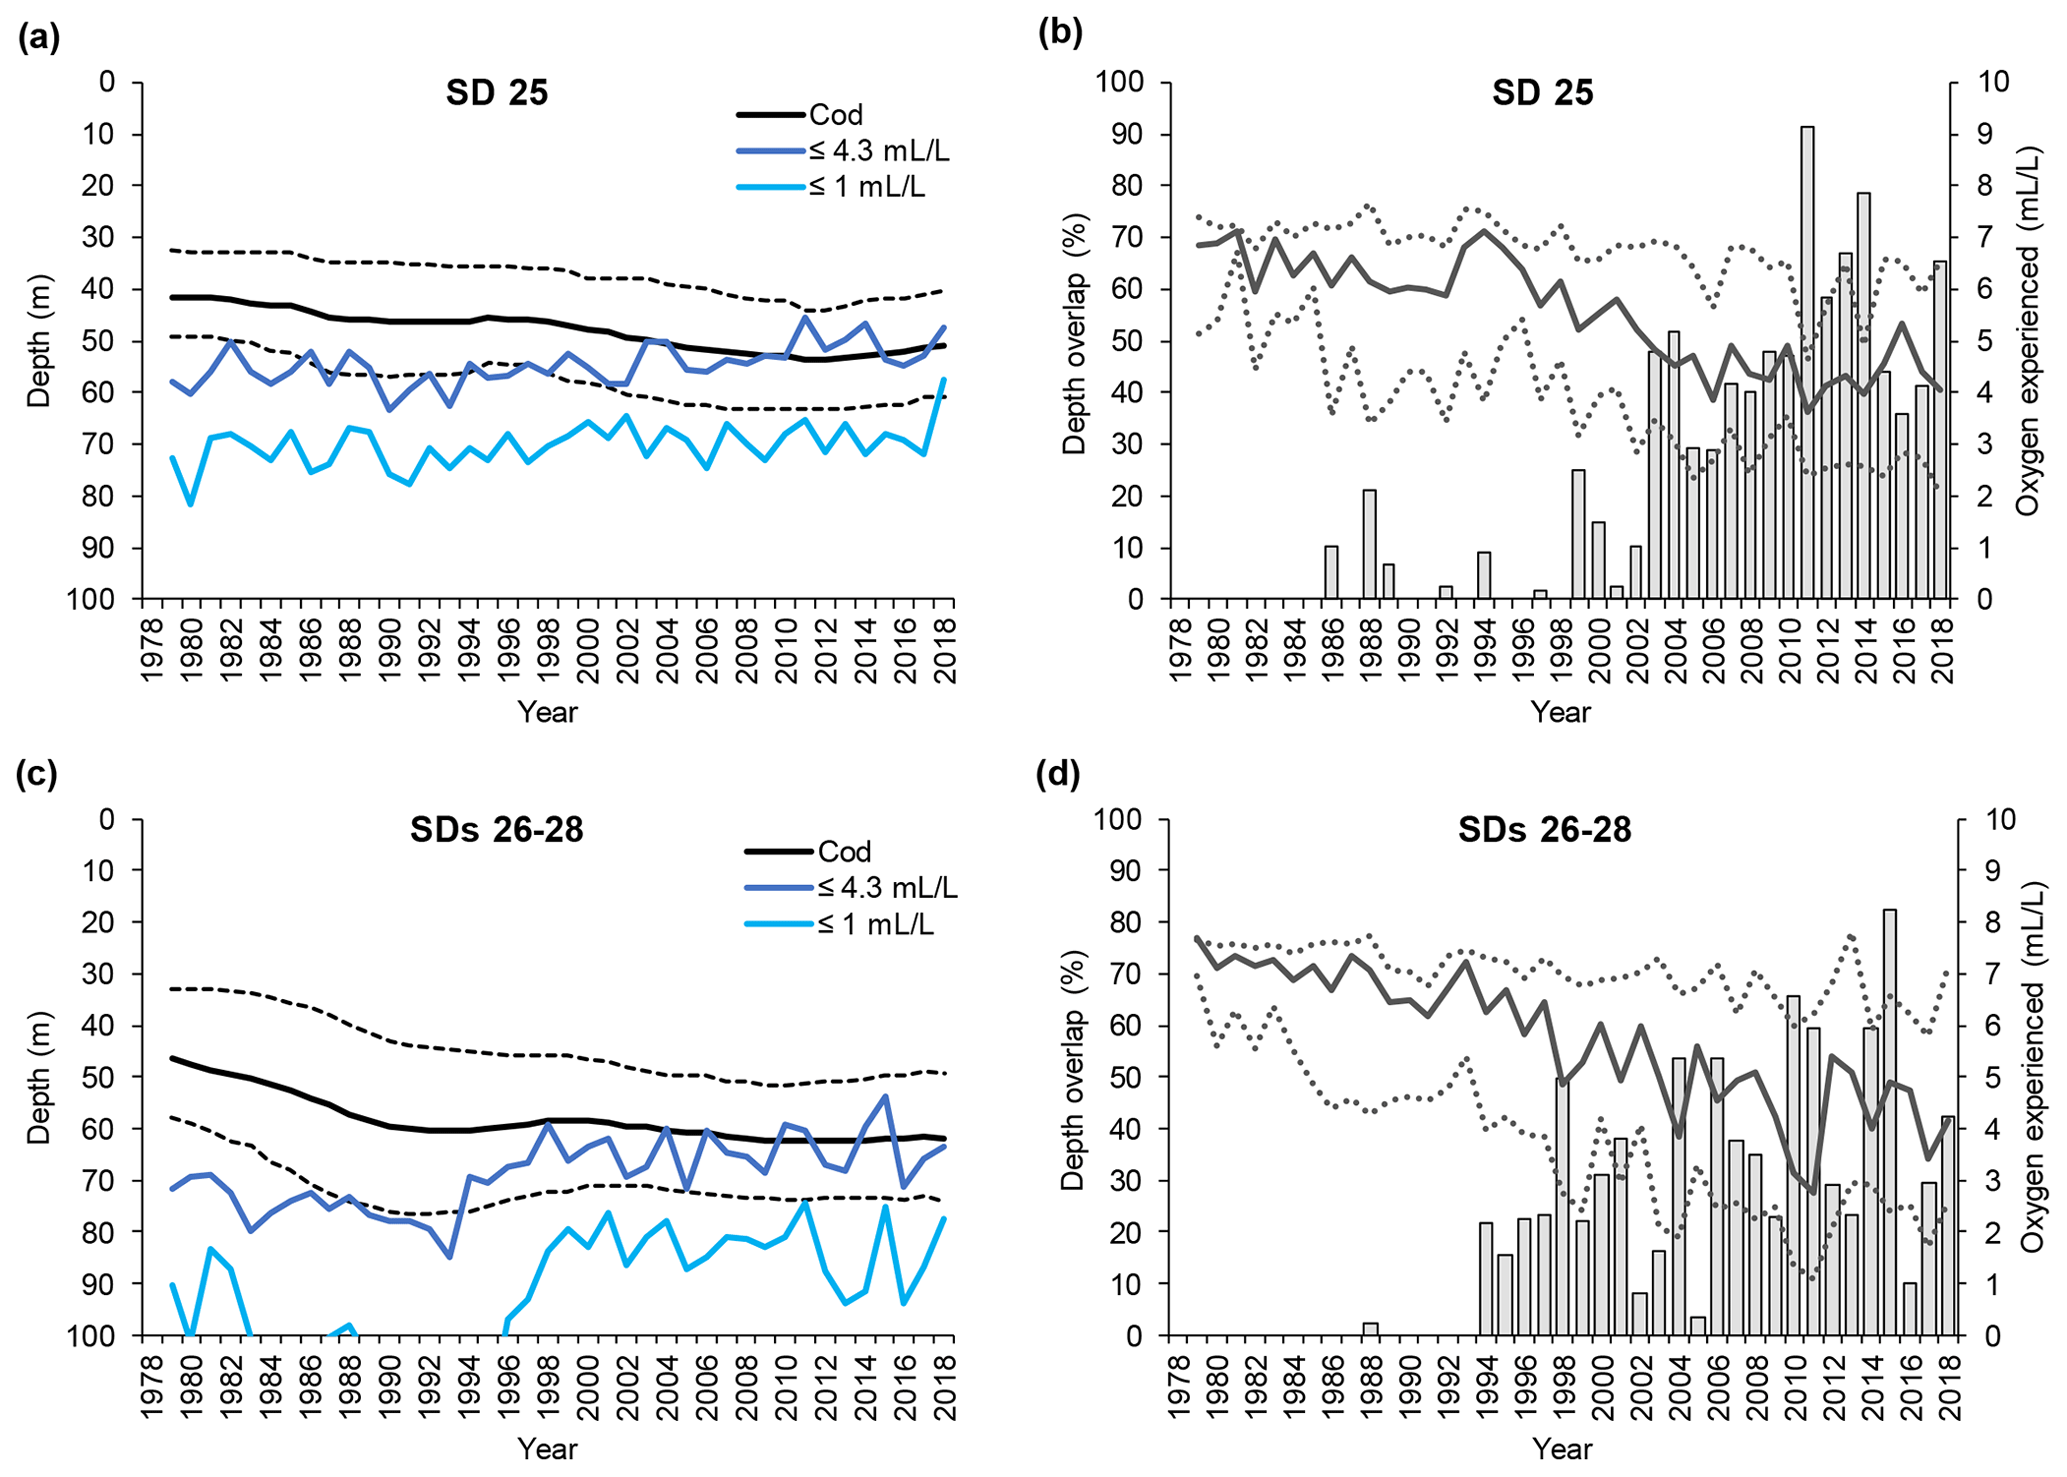
Figure 4Time series of large cod (≥30 cm) depth distribution (mean and interquartile range of each predicted depth distribution; see Orio et al., 2019) as well as depths of oxygen concentration 1 and 4.3 mL L−1, for (a) subdivision (SD) 25 and (c) SDs 26–28. Time series of the depth overlap (i.e., overlap between large cod depth range of distribution and the depth of the water layer with oxygen concentration ≤4.3 mL L−1) (grey bars) and oxygen concentration at the mean and interquartile range of large cod depth distribution (solid line and dotted lines), in (b) SD 25 and (d) SDs 26–28.
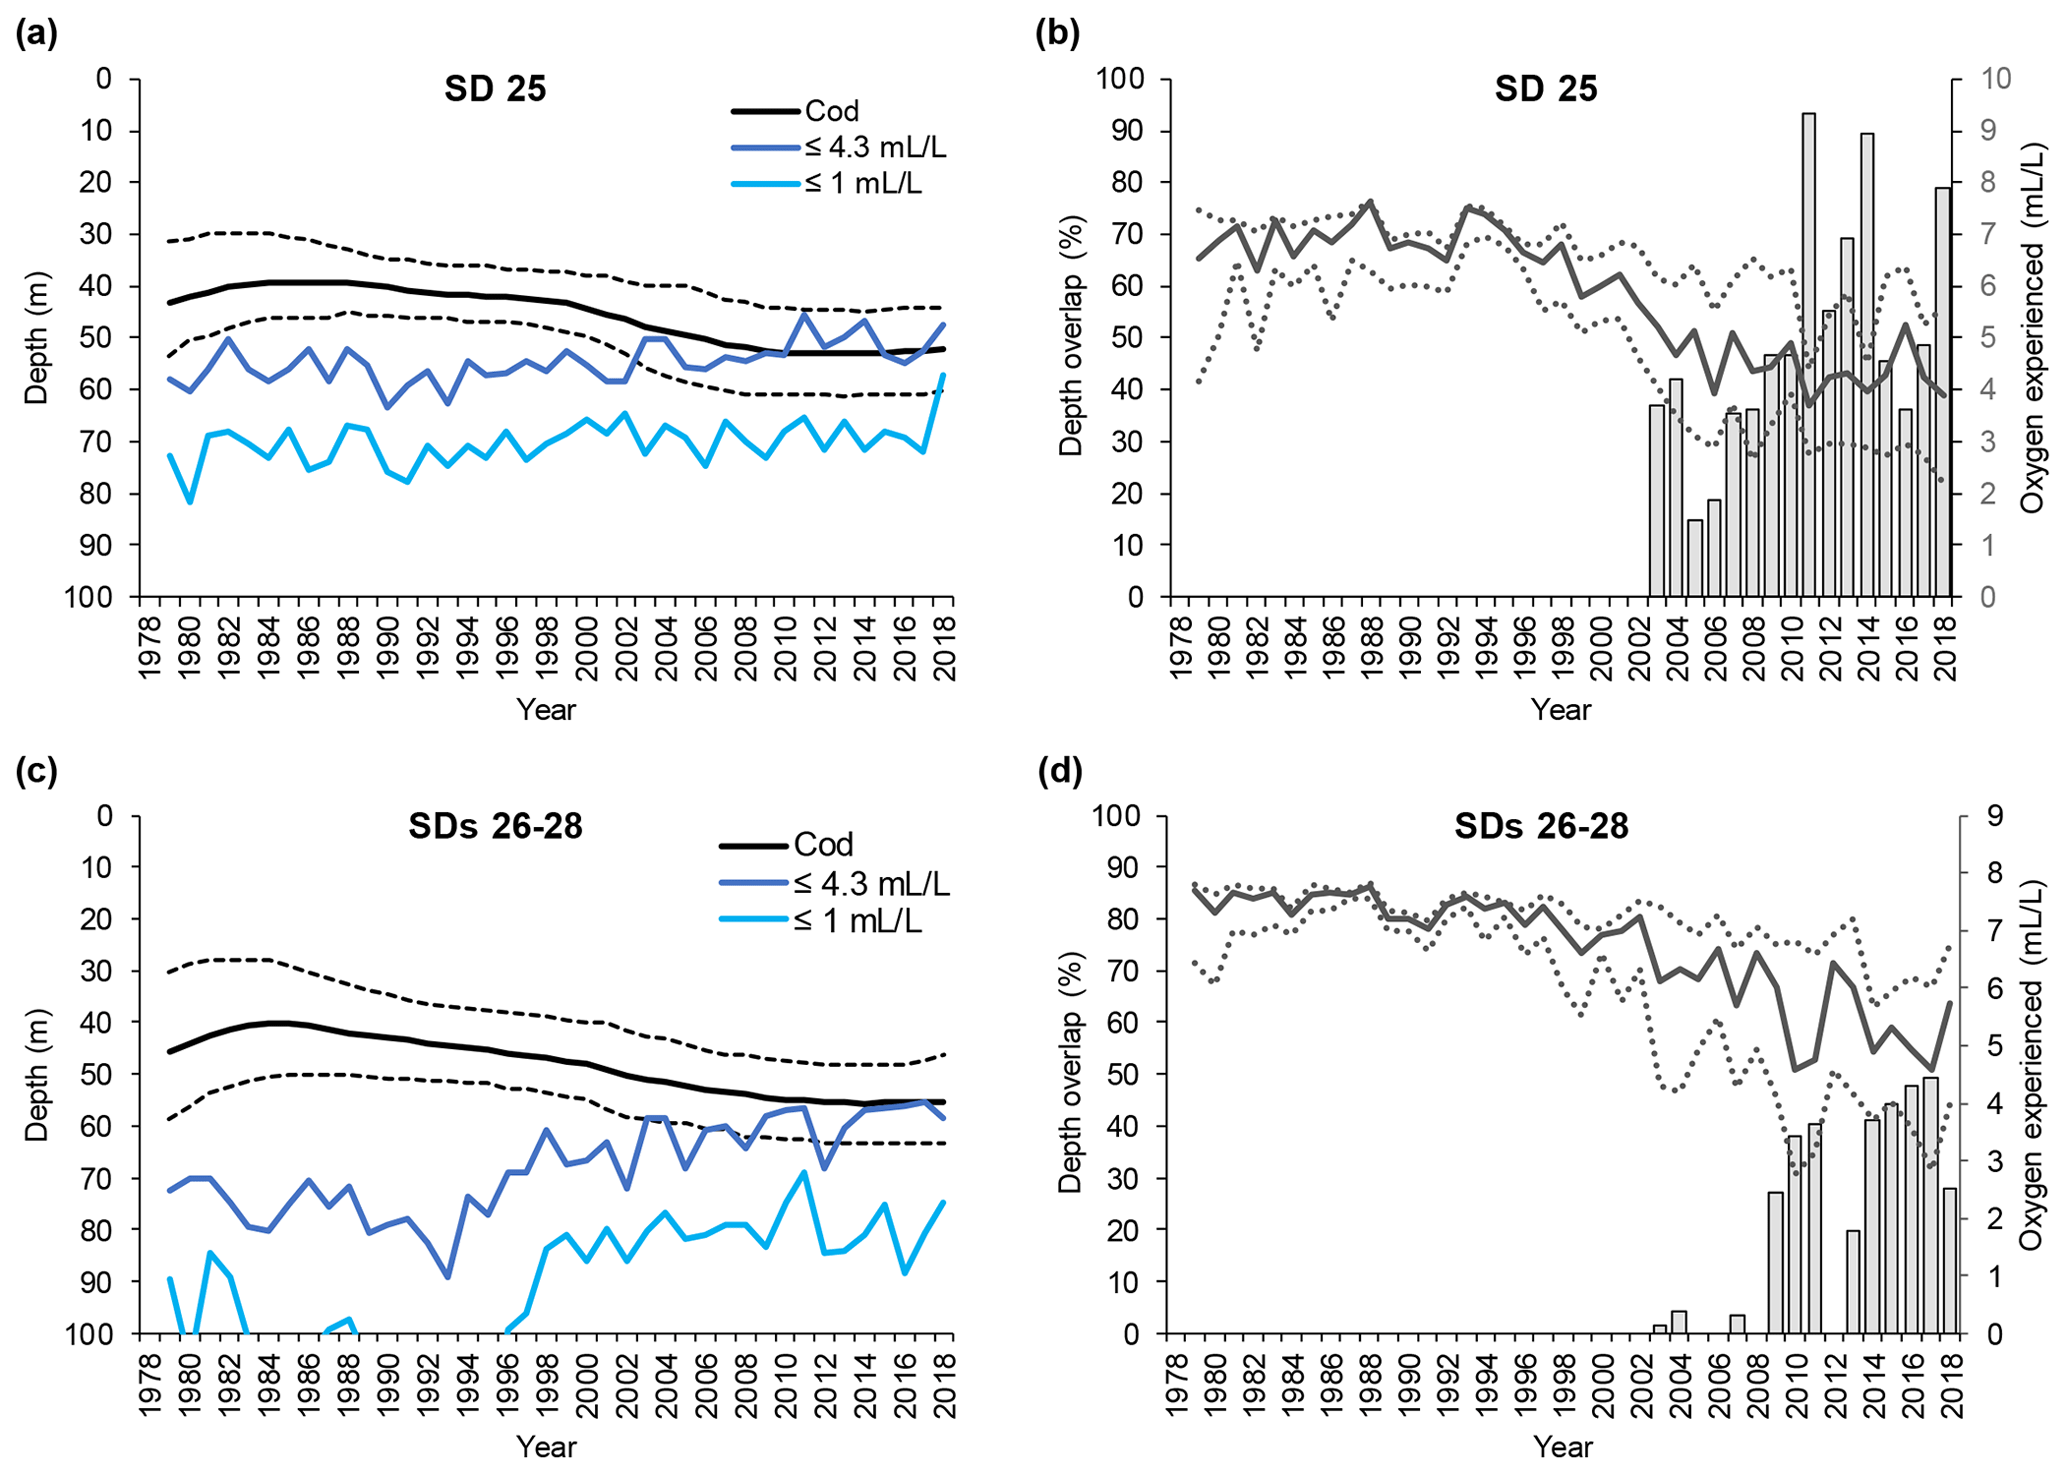
Figure 5Time series of small cod (<30 cm) depth distribution (mean and interquartile range of each predicted depth distribution; see Orio et al., 2019) as well as depth of oxygen concentration 1 and 4.3 mL L−1, for (a) subdivision (SD) 25 and (c) SDs 26–28. Time series of the depth overlap (i.e., overlap between small cod depth range of distribution and the depth of the water layer with oxygen concentration ≤4.3 mL L−1) (grey bars) and oxygen concentration at the mean and interquartile range of small cod depth distribution (solid line and dotted lines), in (b) SD 25 and (d) SDs 26–28.
3.3 Depth of hypoxic layers
The depth at which 1 mL L−1 was encountered remained fairly constant at around 70 m in SD 25, while in SDs 26–28 it decreased from below 120 m to around 80 m over the past 20 years (Figs. 4a, c and 5a, c). Over the same time period, the depth at which 4.3 mL L−1 was encountered diminished in SD 25 from ∼ 60 to ∼ 50 m, and in SDs 26–28 the 4.3 mL L−1 threshold has shifted from ∼ 80 to ∼ 60 m since the early 1990s (Figs. 4a, c and 5a, c). The oxygen depths in SDs 26–28, accounting for the SD-specific distribution of the cod, did not differ much between large and small cod (note the slightly different patterns in the oxygen depths between Fig. 4c and Fig. 5c, which is due to the different distribution of small and large cod among these three SDs).
3.4 Depth overlap between cod and hypoxic layers and oxygen experienced by cod
Large cod depth distribution never overlapped with the depth of oxygen ≤1 mL L−1 along the time period analyzed, except in the very last year in SD 25 (Fig. 4a, c). On the other hand, large cod distribution heavily overlapped with the depth with oxygen ≤4.3 mL L−1 since the mid-1990s (Fig. 4a, c), and the overlap, although oscillating, has increased in the past 20 years, reaching values higher than 90 % in SD 25 and higher than 80 % in SDs 26–28 (Fig. 4b, d).
Also, small cod distribution never overlapped with depth with oxygen ≤1 mL L−1 along the time period analyzed, except in the very last year in SD 25 (Fig. 5a, c). On the other hand, small cod distribution has overlapped with the depth with oxygen ≤4.3 mL L−1 since the early 2000s (Fig. 5a, c), and the overlap, although oscillating, has increased in the past 15 years, reaching values higher than 90 % in SD 25 and up to 50 % in SDs 26–28 (Fig. 5b, d).
The actual oxygen concentrations experienced by cod changed extensively during the study period. Large cod in SD 25 experienced oxygen concentrations of 5–7 mL L−1 (average ∼ 6.5 mL L−1) during the late 1970s and early 1980s, while especially since the mid-1990s a decline, paralleled by a widening of the experienced oxygen range, has occurred until reaching values of 2.5–5.5 mL L−1 (average ∼ 4 mL L−1). Similar patterns also occurred in SDs 26–28, although the oxygen at the lower interquartile range of the cod depth distribution declined further down to be close to 1 mL L−1 (Fig. 4b, d).
Small cod in SD 25 experienced oxygen concentrations of 6–7.5 mL L−1 (average ∼ 7 mL L−1) during the late 1970s and early 1980s, while especially since the late-1990s a decline, paralleled by a widening of the experienced oxygen range, has occurred until reaching values of 3–6 mL L−1 (average ∼ 4 mL L−1). Similar patterns also occurred in SDs 26–28, although the oxygen experienced in the latest years was relatively better than in SD 25, being 3.5–6.5 mL L−1 (average ∼ 5 mL L−1) (Fig. 5b, d).
3.5 Modeling of cod condition versus oxygen
The GAMs explained 68.3 % and 61.8 % of the total deviance, for large and small cod, respectively (see the caption of Fig. 6 for more statistics). For both models, oxygen experienced by cod was the most important predictor of condition, while depth overlap explained a minor part of the model deviance. For large cod, the effect of oxygen experienced was positive and seemed to reach an asymptote at around 5 mL L−1 (Fig. 6a), while for the small cod this was not the case, with a positive effect over the whole range of the experienced oxygen (Fig. 6b). Depth overlap was negatively correlated to condition, although this effect was much stronger for the large cod (Fig. 6a, b). The residuals of the models did not strongly violate the normality and homogeneity assumptions and were not autocorrelated (Fig. S1). The use of GAMs with an interactive formulation (i.e., depth overlap and oxygen experienced used in interaction) explained a similar amount of deviance (69.4 % and 62.1 % for large and small cod, respectively).
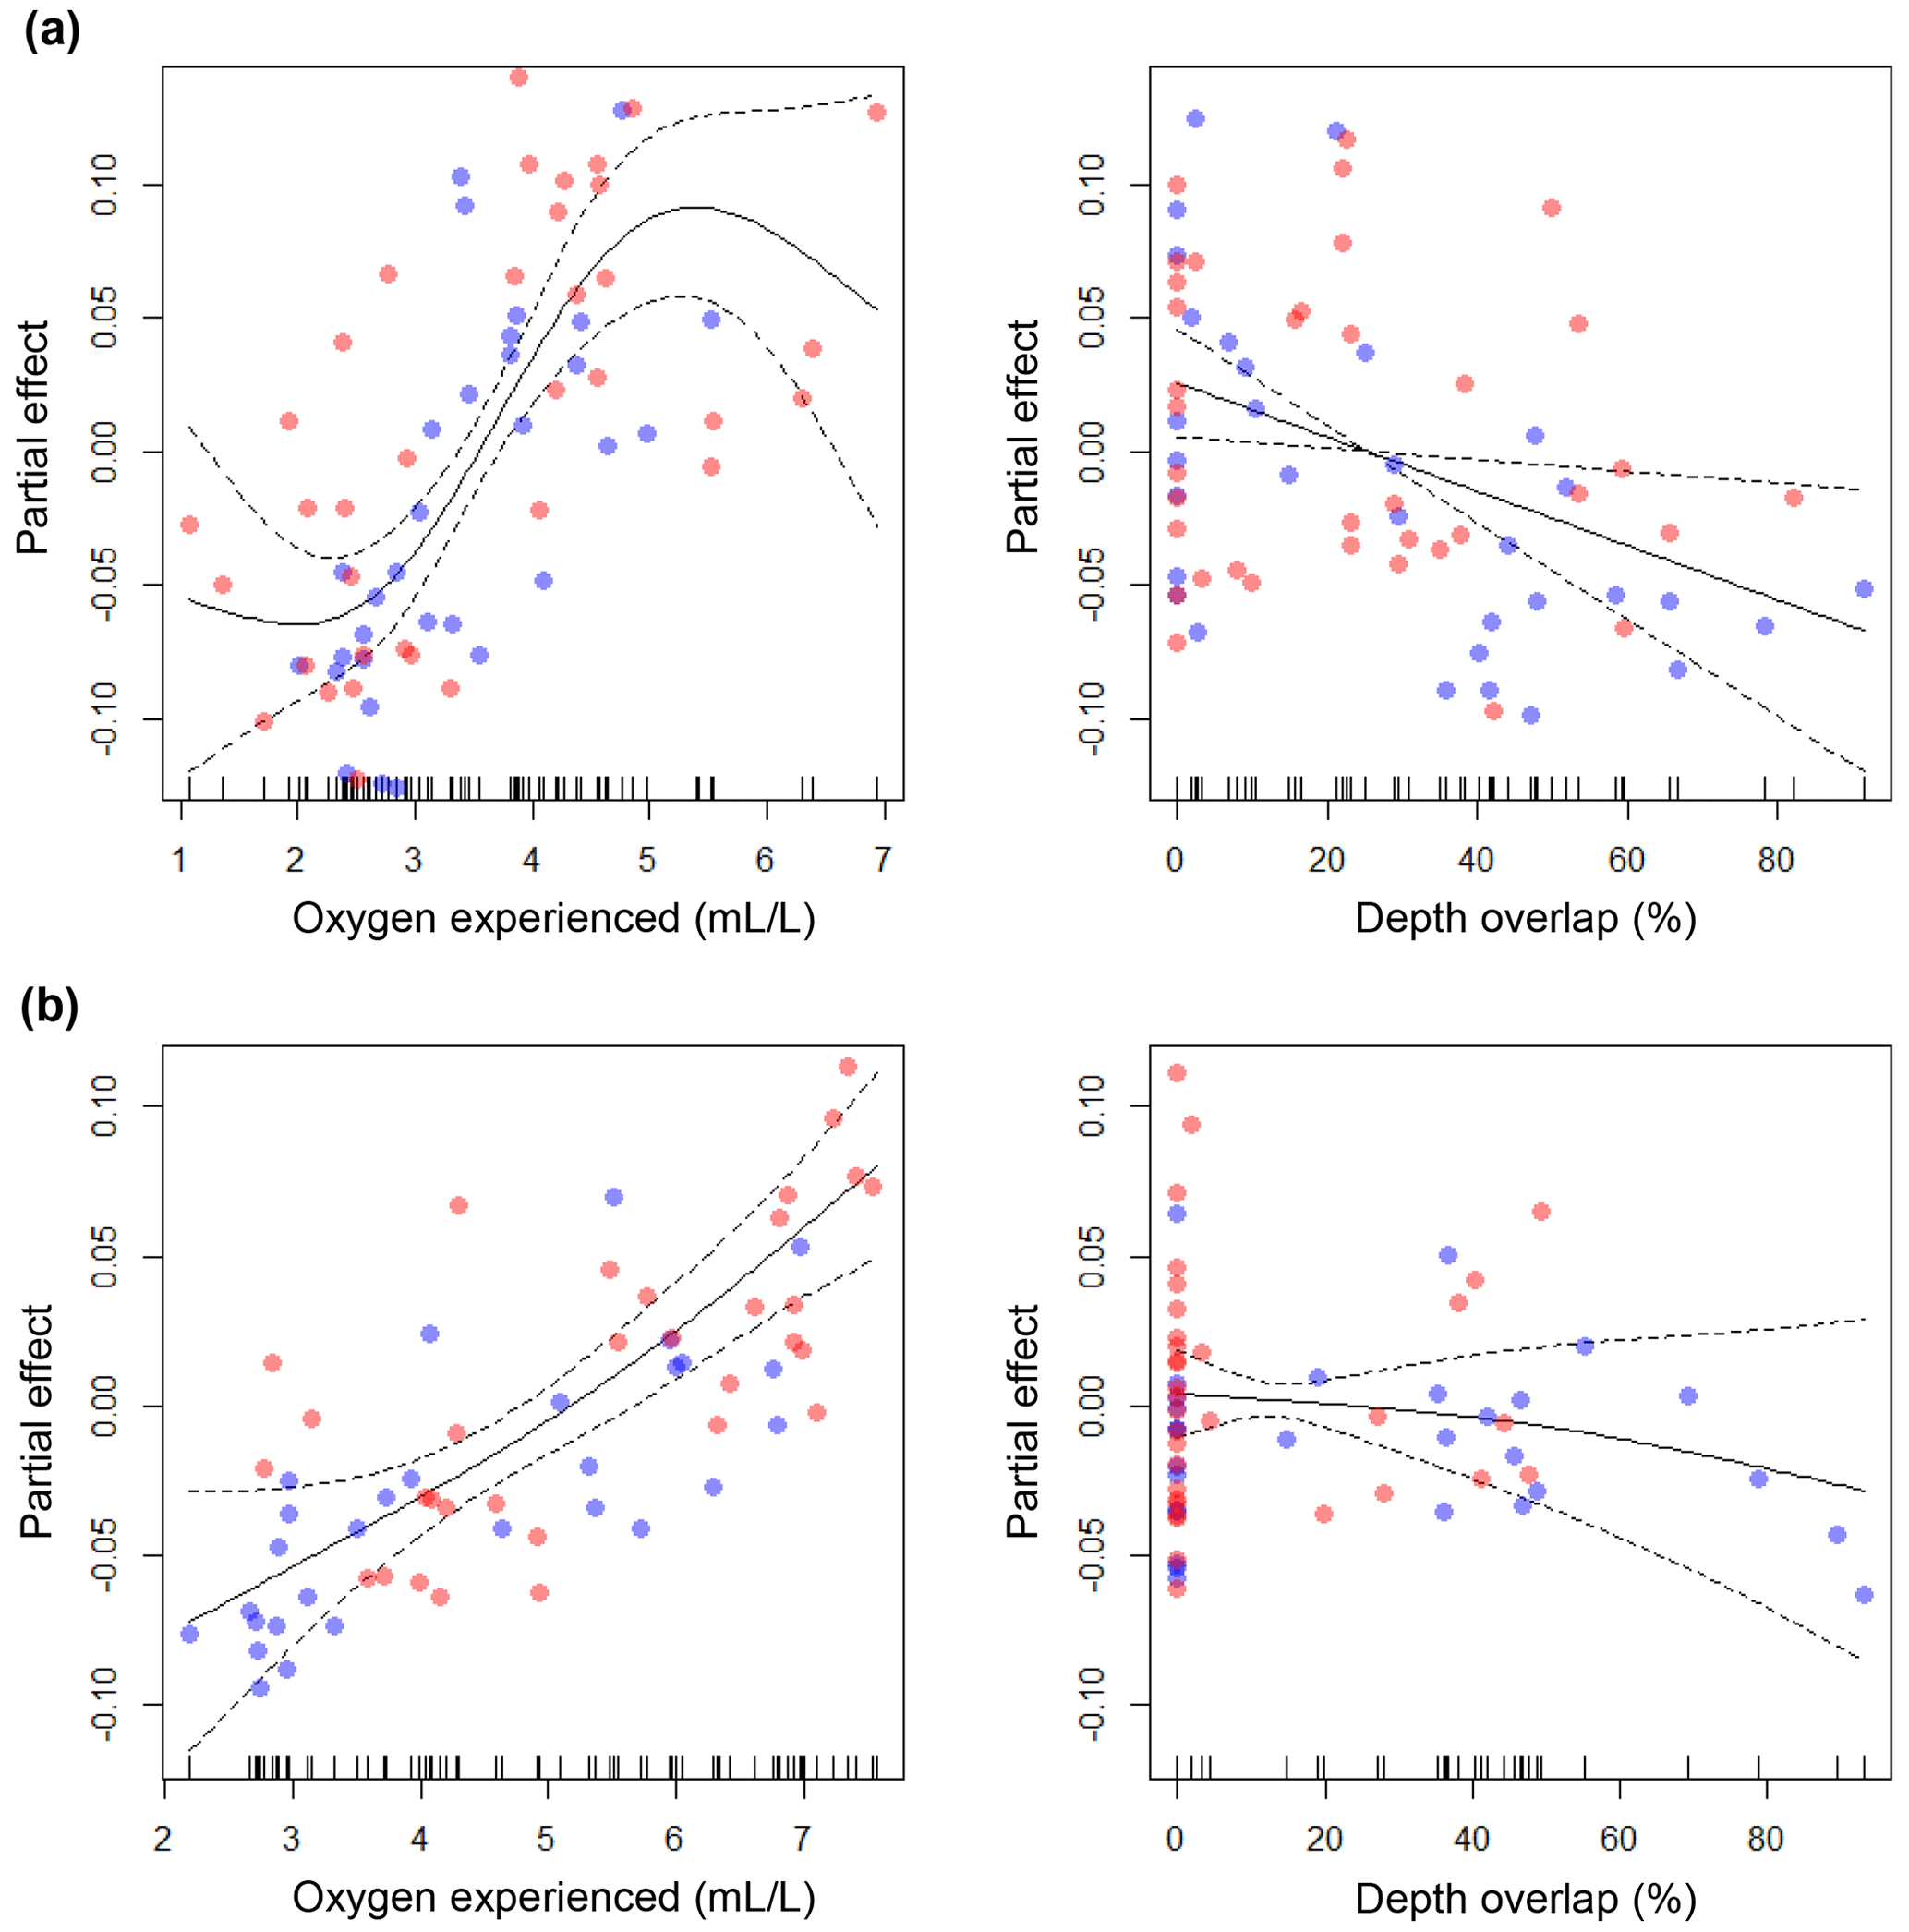
Figure 6Results of the generalized additive models (GAMs). The plots show the partial effects of the depth overlap (i.e., overlap between cod depth range of distribution and the depth of the water layer with oxygen concentration ≤4.3 mL L−1) and of the actual oxygen experienced (at the deepest interquartile of the cod depth range of distribution) on cod condition, for (a) large cod and (b) small cod. Blue and red dots represent subdivision (SD) 25 and SDs 26–28, respectively. Statistics for large cod (a): depth overlap (edf = 1.00; F=6.46; p=0.01), oxygen experienced (edf = 2.86; F=10.88; p<0.00001). Statistics for small cod (b): depth overlap (edf=1.30; F=0.82; p=0.55), oxygen experienced (edf=1.51; F=17.60; p<0.00001). See Figs. S1 and S2 for the analysis of the residuals.
In this paper, we analyzed the potential mechanisms relating Baltic Sea deoxygenation with changes in eastern Baltic cod body condition during the past 4 decades. To this end, we investigated the changes in depth distribution of the cod population and the vertical changes in oxygen gradients based on long-term biological and hydrological monitoring data. Moreover, we related the results of these analyses with proxies for hypoxia exposure from individual fish otolith microchemistry recently published in literature.
4.1 Cod depth distribution and overlap with hypoxic layers
Our analyses show an increase in the areas with an oxygen level below cod tolerance (i.e., oxygen concentration ≤1 mL L−1; Schaber et al., 2012). Moreover, this oxygen threshold has also shifted with time towards shallower depths, determining an overall contraction of the potentially suitable habitat for cod (Casini et al., 2016a). Declines in oxygen concentrations have caused a contraction of the habitat and the distribution of fish in other systems (Eby and Crowder, 2002; Stramma et al., 2012; Breitburg et al., 2018) with measurable effects on, for example, individual growth (e.g., Campbell and Rice, 2014). In the Baltic Sea, however, this change seems not to have affected the cod depth distribution in autumn, since the latter has always been above 70–75 m, a depth almost never reached by the waters with oxygen concentration ≤1 mL L−1. On the other hand, it could be hypothesized that during the latest decade the cod population was unable to occupy even deeper habitats because of the vertical rise of this oxygen layer. This hypothesis seems to be supported by the decline in the range of depth distribution (i.e., a squeeze of the cod habitat occupation) shown by both large and small cod in SDs 26–28 during the past 20 years. Explaining the temporal changes in the depth distribution of cod is beyond the scope of this paper, but a potential reason could be that cod seek deeper layers to avoid too warm waters, which could be detrimental when resources are scarce. In fact, pelagic prey have declined since the mid-1990s in the southern and central Baltic Sea (Casini et al., 2016a), and therefore cod might go deeper to optimize metabolism. Small cod, moreover, could seek deeper waters to escape from the predation of the increased seals and aquatic birds (Orio et al., 2019). The temporal patterns revealed by our study for quarter 4 generally conform to what was found by Orio et al. (2019) for quarter 1. However, the increased depth distribution of large cod in SDs 26–28 found in our study in quarter 4 contrasts with findings in the same areas in quarter 1, where a shallowing has instead been observed since the mid-1990s after an initial deepening (Orio et al., 2019). In quarter 1 cod are in general distributed deeper than in quarter 4 (Orio et al., 2019, and this study, respectively), and it could be that in quarter 1, when the water is also less stratified, large cod were able to dwell in exceptionally deep layers in the mid-1990s because of the good oxygen circumstances during that period (Carstensen et al. 2014; this study). Different requirements that the large mature fish have for their maturation and successful reproduction when they approach spawning in late spring (Røjbek et al., 2012) could potentially also contribute to the difference in the temporal patterns of distribution between the quarters.
The depth where oxygen concentration falls to ≤4.3 mL L−1 (“sub-lethal” level, i.e., level that has been shown in previous studies to affect cod performance; Chabot and Dutil, 1999; Vaquer-Sunyer and Duarte, 2008) has shallowed during the past 4 decades, as a consequence of deoxygenation. Our analysis revealed that this vertical rise, together with the deepening of the cod depth distribution, has resulted in cod starting to dwell more and more in these hostile low-oxygen waters. The depths at which cod have been dwelling during the past 2 decades correspond to the depths of the Baltic Sea permanent stratification where the oxygen drops quickly, explaining the wider range of oxygen concentrations that cod have experienced during this period. Moreover, our analysis reveals that the oxygen concentrations that the cod population indeed experienced have progressively decreased until approaching 1 mL L−1 (tolerance level, i.e., level that has been shown in previous studies to be avoided by cod; Schaber et al., 2012) at the lowest boundary of its distribution. The overlap between cod depth distribution and the sub-lethal oxygen layers occurred mainly after the mid-1990s, concomitant with the drop in cod condition, while in earlier years the cod population occurred mostly above those layers. The progressively higher proportion of the cod population in sub-lethal oxygen layers after the mid-1990s, as revealed by our study, also conforms to the increasingly higher proportion of individuals in extremely low condition (<0.8 Fulton's K), which include starving fish and fish close to the condition mortality threshold (Eero et al., 2012; Casini et al., 2016b).
4.2 Relation to otolith microchemistry from literature
Limburg and Casini (2019) using otolith microchemistry recently found that Baltic cod with low condition at capture experienced lower oxygen levels than cod with high condition during their lives. However, Limburg and Casini (2019) did not analyze to what extent the cod population indeed experienced low-oxygen levels and therefore whether the exposure to low-oxygen waters could explain the decline in the mean condition of the cod population. Our study did this, showing that a large part of the population has dwelled in sub-lethal low-oxygen levels after the mid-1990s in quarter 4. Together, the individual-based study by Limburg and Casini (2019) and the present population-level study provide consistent and robust indications that the decline in mean cod condition of the population since the mid-1990s is due to an increased overlap with low-oxygen layers. This suggests that currently condition may carry over from chronic exposure to low oxygen concentrations, which weakens fish and produces a cascade of effects, from reduced metabolic scope, leading to lower activity and slower digestion (Claireaux and Chabot, 2016), to greater susceptibility to disease and parasites (e.g., Sokolova et al., 2018). Both Limburg and Casini (2019) and the present study also revealed that the exposure to hypoxic waters was lower in the period before the mid-1990s and was unrelated to cod condition, confirming that, before the mid-1990s, factors other than direct low-oxygen exposure played a greater role in shaping cod condition as also concluded by Casini et al. (2016a).
4.3 Mechanisms shaping cod condition
We have confirmed here, using population-level monitoring data, that direct oxygen exposure is likely a key factor shaping cod condition after the mid-1990s (Limburg and Casini, 2019). Low-oxygen exposure has been shown in laboratory experiments to reduce cod appetite with consequent significant decline in body condition and growth (Chabot and Dutil, 1999). This seems to conform to the observation of a decline in eastern Baltic cod feeding level from stomach content analyses (Neuenfeldt et al., 2020) that was put in relation with cod growth by Brander (2000) earlier. Therefore, a lower appetite due to an increased direct exposure to low-oxygen waters seems to be a sound explanation to both the decline in growth (Brander, 2000) and condition (this study). In our estimations of cod overlap with sub-lethal waters, we considered the oxygen thresholds affecting cod performance as found in laboratory experiments performed on relatively large fish (∼ 45 cm, Chabot and Dutil, 1999). Interestingly, in our statistical analysis the inflection of the curve relating the actual oxygen experienced and condition for large cod (40–49 cm in our study) started to occur at ∼ 4.5–5 mL L−1, corresponding well to the threshold found experimentally in Chabot and Dutil (1999). The threshold for small fish could be higher however, although a size-dependent hypoxia tolerance in fish is still debated (Vaquer-Sunyer and Duarte, 2008; Nilsson and Östlund-Nilsson, 2008). This could however explain why in our statistical analysis the effect of oxygen experienced on small cod condition was linear without reaching an asymptote at high oxygen concentrations. In this case our assumption of a 4.3 mL L−1 sub-lethal threshold for small cod could be considered very conservative.
Besides direct exposure to sub-lethal oxygen levels, other factors, not mutually exclusive, might contribute to explain the decline in condition as well (Casini et al., 2016a). For example deoxygenation, by deteriorating the benthic communities, has likely affected important benthic prey for cod in negative ways and therefore also indirectly influenced cod condition and growth (Neuenfeldt et al., 2020). Moreover, the more severe decline in condition in SD 25 compared to SDs 26–28, for example, could be due to the higher density of cod in the southern Baltic Sea during the past 20 years (Orio et al., 2017) leading to density-dependent effects and the lower abundance of sprat, the main pelagic fish prey for cod, in this area (Casini et al., 2014). Additional potential reasons of the decline in cod condition after the early 1990s are constituted by the increased biomass of flounder that could have deprived cod of important benthic food resources (Haase et al., 2020) and increased parasite infestation (Horbowy et al., 2016). All these factors could have acted, singularly or in combination, on cod together with direct low-oxygen exposure, shaping the decline in their condition observed in the past 3 decades. Moreover, cod condition was also relatively low in the 1970s–1980s (although not showing individuals with very low condition, Fig. 2), when the cod population did not seem to spend time in low-oxygen waters, confirming that the main drivers of mean condition can vary in time.
We have shown here the potential mechanisms linking deoxygenation to cod condition in the Baltic Sea. A combination of increased depth distribution of the cod population and a vertical rise of the sub-lethal oxygen layers have led cod to dwell progressively more in hostile low-oxygen waters, contributing to explain the reduction in cod condition in the past 2 decades. Further analyses should focus on revealing the reasons of the shift of cod distribution to deeper and less-oxygenated waters. We stress that our depth analyses were focused on the autumn season, when cod growth is maximized for the accumulation of energy reserves to be utilized for spawning the following spring–summer (Mion et al., 2020). The changes in cod depth distribution are different in other seasons, especially those before and during spawning (Orio et al., 2019), when cod could have different environment requirements for reproduction. Therefore, further analyses should be performed to investigate the changes in cod population depth distribution in relation to oxygen stratification in other seasons to better understand the biotic and abiotic spatiotemporal dynamics, and their effects on cod performance, over the entire year.
The codes used in this study are available upon request to the corresponding author.
Time series used in this study are available upon request to the corresponding author.
The supplement related to this article is available online at: https://doi.org/10.5194/bg-18-1321-2021-supplement.
MC designed and coordinated the study. MC, MH, AO and KL prepared the raw data. MC estimated cod condition, MH performed the hydrographic modeling and AO performed the cod distribution modeling. MC prepared the first draft of the manuscript and all authors contributed to the final version.
The authors declare that they have no conflict of interest.
This article is part of the special issue “Ocean deoxygenation: drivers and consequences – past, present and future (BG/CP/OS inter-journal SI)”. It is a result of the International Conference on Ocean Deoxygenation, Kiel, Germany, 3–7 September 2018.
We thank all the personnel involved in the long-term fish and hydrological monitoring programs and data collection at the SLU's Department of Aquatic Resources (and former Swedish National Board of Fisheries) and at the Swedish Meteorological and Hydrological Institute. We also thank the Institute of Food safety, Animal Health and Environment “BIOR”, Latvia, for the historical Latvian data on cod condition and survey catches. We are grateful to Keith Brander, Jan Dierking and the one anonymous reviewer for their constructive suggestions that improved the manuscript.
This study was funded by the Swedish Research Council Formas (grant no. 2018-00775 to Michele Casini: “Fish interactions in the marine benthic habitat: a knowledge gap in Baltic Sea fish ecology and multispecies fisheries management”) and the US National Science Foundation (project OCE-1923965 to Karin Limburg: “Shifting the hypoxia paradigm – new directions to explore the spread and impacts of ocean/Great Lakes deoxygenation”).
This paper was edited by Kenneth Rose and reviewed by Jan Dierking, Keith Brander, and one anonymous referee.
Brander, K.: Reduced growth in Baltic Sea cod may be due to mild hypoxia, ICES J. Mar. Sci., 77, 2003–2005, https://doi.org/10.1093/icesjms/fsaa041, 2020.
Breitburg, D.: Effects of hypoxia, and the balance between hypoxia and enrichment, on coastal fishes and fisheries, Estuaries, 25, 767–781, https://doi.org/10.1007/BF02804904, 2002.
Breitburg, D., Levin, L. A., Oschlies, A., Grégoire, M., Chavez, F. P., Conley, D. J., Garçon, V., Gilbert, D., Gutiérrez, D., Isensee, K., Jacinto, G. S., Limburg, K. E., Montes, I., Naqvi, S. W. A., Pitcher, G. C., Rabalais, N. N., Roman, M. R., Rose, K. A., Seibel, B. A., Telszewski, M., Yasuhara, M., and Zhang, J.: Declining oxygen in the global ocean and coastal waters, Science, 359, eaam7240, https://doi.org/10.1126/science.aam7240, 2018.
Campbell, L. A. and Rice, J. A.: Effects of hypoxia-induced habitat compression on growth of juvenile fish in the Neuse River Estuary, North Carolina, USA. Mar. Ecol. Prog. Ser., 497, 199–213, https://doi.org/10.3354/meps10607, 2014.
Carstensen, J., Andersen, J. H., Gustafsson, B. G., and Conley, D. J.: Deoxygenation of the Baltic Sea during the last century, P. Natl. Acad. Sci. USA, 111, 5628–5633, https://doi.org/10.1073/pnas.1323156111, 2014.
Casini, M., Rouyer, T., Bartolino V., Larson N., and Grygiel, W.: Density dependence in space and time: opposite synchronous variations in population distribution and body condition in the Baltic Sea sprat (Sprattus sprattus) over three decades, Plos One, 9, e92278, https://doi.org/10.1371/journal.pone.0092278, 2014.
Casini, M., Käll, F., Hansson, M., Plikshs, M., Baranova, T., Karlsson, O., Lundström, K., Neuenfeldt, S., Gårdmark, G., and Hjelm J.: Hypoxic areas, density dependence and food limitation drive the body condition of a heavily exploited marine fish predator, R. Soc. Open Sci., 3, 160416, https://doi.org/10.1098/rsos.160416, 2016a.
Casini, M., Eero, M., Carlshamre, S., and Lövgren, J.: Using alternative biological information in stock assessment: condition-corrected natural mortality of Eastern Baltic cod, ICES J. Mar. Sci., 73, 2625–2631, https://doi.org/10.1093/icesjms/fsw117, 2016b.
Chabot, D. and Dutil, J.-D.: Reduced growth of Atlantic cod in non-lethal hypoxic conditions, J. Fish Biol., 55, 472–491, https://doi.org/10.1111/j.1095-8649.1999.tb00693.x, 1999.
Claireaux, G. and Chabot, D.: Responses by fishes to environmental hypoxia: integration through Fry's concept of aerobic metabolic scope, J. Fish Biol., 88, 232–251, https://doi.org/10.1111/jfb.12833 , 2016.
Cleveland, W. S.: Visualizing data, Hobart Press, Summit, NJ, 1993.
Conley, D. G. Björck, S., Bonsdorff, E., Carstensen, J., Destouni, G., Gustafsson, B. G., Hietanen, S., Kortekaas, M., Kuosa, H., Meier, H. E. M., Müller-Karulis, B., Nordberg, K., Norkko, A., Nürnberg, G., Pitkänen, H., Rabalais, N. N., Rosenberg, R., Savchuk, O. P., Slomp, C. P., Voss, M., Wulff, F., and Zillén L.: Hypoxia-related processes in the Baltic Sea, Environ. Sci. Technol., 43, 3412–3420, https://doi.org/10.1021/es802762a, 2009.
Diaz, R. J., and Rosenberg, R.: Spreading dead zones and consequences for marine ecosystems, Science, 321, 926–929, https://doi.org/10.1126/science.1156401, 2008.
Domenici, P., Lefrançois, C., and Shingles, A.: Hypoxia and the antipredator behaviours of fishes, Phil. Trans. R. Soc. B, 362, 2015–2121, https://doi.org/10.1098/rstb.2007.2103, 2007.
Eby, L. A. and Crowder, L. B.: Hypoxia-based habitat compression in the Neuse River Estuary: context-dependent shifts in behavioral avoidance thresholds, Can. J. Fish. Aquat. Sci., 59, 952–965, https://doi.org/10.1139/f02-067, 2002.
Eby, L. A., Crowder, L. B., McClellan, C. M., Peterson, C. H., and Powers, M. J.: Habitat degradation from intermittent hypoxia: impacts on demersal fishes, Mar. Ecol. Prog. Ser., 291, 249–261, https://doi.org/10.3354/meps291249, 2005.
Eero, M., Vinther, M., Haslob, H., Huwer, B., Casini, M., Storr-Paulsen, M., and Köster, F. W.: Spatial management of marine resources can enhance the recovery of predators and avoid local depletion of forage fish, Cons. Lett., 5, 486–492, https://doi.org/10.1111/j.1755-263X.2012.00266.x, 2012.
Eero, M., Hjelm, J., Behrens, J., Buckmann, Cardinale, M., K., Casini, M., Gasyukov, P., Holmgren, N., Horbowy, J., Hüssy, K., Kirkegaard, E., Kornilovs, G., Krumme, U., Köster, F.W., Oeberst, R., Plikshs, M., Radtke, K., Raid, T., Schmidt, J., Tomczak, M., Vinther, M., Zimmermann, C., and Storr-Paulsen, M.: Eastern Baltic cod in distress: biological changes and challenges for stock assessment, ICES J. Mar. Sci., 72, 2180–2186, https://doi.org/10.1093/icesjms/fsv109, 2015.
Ekau, W., Auel, H., Pörtner, H.-O., and Gilbert, D.: Impacts of hypoxia on the structure and processes in pelagic communities (zooplankton, macro-invertebrates and fish), Biogeosciences, 7, 1669–1699, https://doi.org/10.5194/bg-7-1669-2010, 2010.
Haase, K., Orio, A., Pawlak, J., Pachur, M., and Casini, M.: Diet of dominant demersal fish species in the Baltic Sea: is flounder steeling benthic food from cod?, Mar. Ecol. Progr. Ser., 645, 159–170, https://doi.org/10.3354/meps13360, 2020.
Hastie, T. J. and Tibshirani, R. J.: Generalized additive models, Chapman and Hall/CRC, London, UK, 1990.
Herbert, N. A. and Steffensen, J. F.: The response of Atlantic cod, Gadus morhua, to progressive hypoxia: fish swimming speed and physiological stress, Mar. Biol., 147, 1403–1412, https://doi.org/10.1007/s00227-005-0003-8, 2005.
Horbowy, J., Podolska, M., and Nadolna-Ałtyn, K.: Increasing occurrence of anisakid nematodes in the liver of cod (Gadus morhua) from the Baltic Sea: Does infection affect the condition and mortality of fish?, Fish. Res., 179, 99–103, https://doi.org/10.1016/j.shres.2016.02.011, 2016.
Köster, F. W., Huwer, B., Hinrichsen, H.-H., Neumann, V., Makarchouk, A., Eero, M., V. Dewitz, B., Hüssy, K., Tomkiewicz, J., Margonski, P., Temming, A., Hermann, J.-P., Oesterwind, D., Dierking, J., Kotterba, P., and Plikshs, M.: Eastern Baltic cod recruitment revisited-dynamics and impacting factors, ICES J. Mar. Sci., 74, 3–19, https://doi.org/10.1093/icesjms/fsw172, 2017.
Levin, L. A., Ekau, W., Gooday, A. J., Jorissen, F., Middelburg, J. J., Naqvi, S. W. A., Neira, C., Rabalais, N. N., and Zhang, J.: Effects of natural and human-induced hypoxia on coastal benthos, Biogeosciences, 6, 2063–2098, https://doi.org/10.5194/bg-6-2063-2009, 2009.
Limburg, K. and Casini, M.: Otolith chemistry indicates recent worsened Baltic cod condition is linked to hypoxia exposure, Biol. Lett., 15, 20190352, https://doi.org/10.1098/rsbl.2019.0352, 2019.
Mehner, T. and Kasprzak, P.: Partial diel vertical migrations in pelagic fish, J. Anim. Ecol., 80, 761–770, https://doi.org/10.1111/j.1365-2656.2011.01823.x, 2011.
Mion, M., Thorsen, A., Dierking, J., Herrmann, J.-P., Huwer, B., Vitale, F., von Dewitz, B., and Casini, M.: Effect of fish length and nutritional condition on the fecundity of distressed Atlantic cod Gadus morhua from the Baltic Sea, J. Fish Biol., 92, 1016–1034, https://doi.org/10.1111/jfb.13563, 2018.
Mion, M., Hilvarsson, A., Hüssy, K., Krumme, U., Krüger-Johnsen, M., McQueen, K., Mohamed, E., Motyka, R., Orio, A., Plikšs, M., Radtke, K., and Casini, M.: Historical growth of Eastern Baltic cod (Gadus morhua): setting a baseline with international tagging data, Fish. Res., 223, 105442, https://doi.org/10.1016/j.fishres.2019.105442, 2020.
Neuenfeldt, S., Bartolino, V., Orio, A., Andersen, K. H., Andersen, N. G., Niiranen, S., Bergström, U., Ustups, D. Kallasvuo, M., Kulatska, N., and Casini, M.: Feeding and growth of Atlantic cod (Gadus morhua L.) in the Eastern Baltic Sea under environmental change, ICES J. Mar. Sci., 77, 624–632, https://doi.org/10.1093/icesjms/fsz224, 2020.
Nilsson, G. E. and Östlund-Nilsson, S.: Does size matter for hypoxia tolerance in fish?, Biol. Rev., 83, 173–189, https://doi.org/10.1111/j.1469-185X.2008.00038.x, 2008.
Orio, A., Florin, A.-B., Bergström, U., Šics, I., Baranova, T., and Casini, M.: Modelling indices of abundance and size-based indicators of cod and flounder stocks in the Baltic Sea using newly standardized trawl survey data, ICES J. Mar. Sci., 74, 1322–1333, https://doi.org/10.1093/icesjms/fsx005, 2017.
Orio, A., Bergström, U., Florin, A.-B., Lehmann, A., Šics, I., and Casini, M.: Spatial contraction of demersal fish populations in a large marine ecosystem, J. Biogeogr., 46, 633–645, https://doi.org/10.1111/jbi.13510, 2019.
Pichavant, K., Person-Le-Ruyet, J., Le Bayon, N., Severe, A., Le Roux, A., and Boeuf, G.: Comparative effects of long-term hypoxia on growth, feeding and oxygen consumption in juvenile turbot and European sea bass, J. Fish Biol. 59, 875–883, https://doi.org/10.1111/j.1095-8649.2001.tb00158.x, 2001.
Rabalais, N. N, Turner, R. E, and Wiseman Jr, W. J.: Gulf of Mexico hypoxia, A.K.A “The dead zone”, Annu. Rev. Ecol. Syst., 33, 235–263, https://doi.org/10.1146/annurev.ecolsys.33.010802.150513, 2002.
Reusch, T. B. H., Dierking, J., Andersson, H., Bonsdorff, E., Carstensen, J., Casini, M., Czajkowski, M., Hasler, B., Hinsby, K., Hyytiäinen, K., Johannesson, K., Jomaa, S., Jormalainen, V., Kuosa, H., Kurland, S., Laikre, L., MacKenzie, B. R., Margonski, P., Melzner, F., Oesterwind, D., Ojaveer, H., Refsgaard, J. C., Sandström, A., Schwarz, G., Tonderski, K., Winder, M., and Zandersen, M.: The Baltic Sea as a time machine for the future coastal ocean. Sci. Adv., 4, eaar8195, https://doi.org/10.1126/sciadv.aar8195, 2018.
Røjbek, M. C., Jacobsen, C., Tomkiewicz, J., and Støttrup, J. G.: Linking lipid dynamics with the reproductive cycle in Baltic cod Gadus morhua, Mar. Ecol. Progr. Ser., 471, 215–234, https://https://doi.org/10.3354/meps10012, 2012.
Schaber, M., Hinrichsen, H.-H., and Gröger, J.: Seasonal changes in vertical distribution patterns of cod (Gadus morhua) in the Bornholm Basin, Central Baltic Sea, Fish. Oceanogr., 21, 33–43, https://doi.org/10.1111/j.1365-2419.2011.00607.x, 2012.
Sokolova, M., Buchmann, K., Huwer, B., Kania, P. W., Krumme, U., Galatius, A., Hemmer-Hansen, J., and Behrens, J. W.: Spatial patterns in infection of cod Gadus morhua with the seal-associated liver worm Contracaecum osculatum from the Skagerrak to the central Baltic Sea, Mar. Ecol. Progr. Ser., 606, 105–118, https://doi.org/10.3354/meps12773, 2018.
Stramma, L., Prince E. D., Schmidtko, S., Luo, J., Hoolihan, J. P., Visbeck, M, Wallace, D. W. R., Brandt, P., and Körtzinger, A.: Expansion of oxygen minimum zones may reduce available habitat for tropical pelagic fishes, Nat. Clim. Change, 2, 33–37, https://doi.org/10.1038/nclimate1304, 2012.
Vaquer-Sunyer, R. and Duarte, C. M.: Thresholds of hypoxia for marine biodiversity, P. Natl Acad. Sci. USA, 105, 15452–15457, https://doi.org/10.1073/pnas.0803833105, 2008.
Wu, R. S. S.: Hypoxia: from molecular responses to ecosystem responses, Mar. Pollut. Bull. 45, 35–45, https://doi.org/10.1016/S0025-326X(02)00061-9, 2002.