the Creative Commons Attribution 4.0 License.
the Creative Commons Attribution 4.0 License.
 | 04 Mar 2021
Microclimatic comparison of lichen heaths and shrubs: shrubification generates atmospheric heating but subsurface cooling during the growing season
Johan Asplund
Arvid Odland
Stefanie Reinhardt
Hans Renssen
Lichen heaths are declining in abundance in alpine and Arctic areas partly due to an increasing competition with shrubs. This shift in vegetation types might have important consequences for the microclimate and climate on a larger scale. The aim of our study is to measure the difference in microclimatic conditions between lichen heaths and shrub vegetation during the growing season. With a paired plot design, we measured the net radiation, soil heat flux, soil temperature and soil moisture on an alpine mountain area in southern Norway during the summer of 2018 and 2019. We determined that the daily net radiation of lichens was on average 3.15 MJ (26 %) lower than for shrubs during the growing season. This was mainly due to a higher albedo of the lichen heaths but also due to a larger longwave radiation loss. Subsequently, we estimate that a shift from a lichen heath to shrub vegetation leads to an average increase in atmospheric heating of 3.35 MJ d−1 during the growing season. Surprisingly, the soil heat flux and soil temperature were higher below lichens than below shrubs during days with high air temperatures. This implies that the relatively high albedo of lichens does not lead to a cooler soil compared to shrubs during the growing season. We predict that the thicker litter layer, the presence of soil shading and a higher evapotranspiration rate at shrub vegetation are far more important factors in explaining the variation in soil temperature between lichens and shrubs. Our study shows that a shift from lichen heaths to shrub vegetation in alpine and Arctic areas will lead to atmospheric heating, but it has a cooling effect on the subsurface during the growing season, especially when air temperatures are relatively high.
- Article
(7323 KB) - Full-text XML
- BibTeX
- EndNote


Lichen heaths are one of the most dominant vegetation types across alpine and Arctic areas (Cornelissen et al., 2001). For example, lichen heaths cover up to 6 % of Norway (Bryn et al., 2018). Besides their extensive abundance, lichens are important forage for reindeer during winter (Heggberget et al., 2002; Vistnes and Nellemann, 2008). However, the lichen cover has decreased in alpine and Arctic areas during the last decades (Cornelissen et al., 2001; Joly et al., 2009; Elmendorf et al., 2012; Lang et al., 2012; Fraser et al., 2014; Maliniemi et al., 2018). For instance, Fraser et al. (2014) estimated that lichen cover decreased by 24 % in the western Canadian Arctic between 1980 and 2013. Also, large continuous lichen mats are rarely observed anymore in the western Canadian Arctic, while they were common 40 years ago (Fraser et al., 2014). In addition, a long-term study reported a decrease in lichen cover of up to of 25 % in northern Fennoscandia (Maliniemi et al., 2018). This indicates that similar declining trends have been observed throughout alpine and Arctic areas. The lichen decline is attributed to grazing by reindeer (Joly et al., 2009; Bernes et al., 2015) and an increased competition with vascular plants that benefit from climate change, especially shrubs (Cornelissen et al., 2001; Fraser et al., 2014; Moffat et al., 2016; Vuorinen et al., 2017; Chagnon and Boudreau, 2019). Experimental warming studies show that this lichen decline has the potential to proceed with the ongoing temperature increase due to an increase in height and density of shrubs and graminoids (Walker et al., 2006; Elmendorf et al., 2012). Therefore, it is important to study the consequences of the lichen decline on alpine and Arctic ecosystems.
Shrubs benefit from recent climate change, since the higher temperatures and longer growing seasons are in favor of their growing conditions (Myers-Smith et al., 2011, 2020). Indeed, many studies found an increase in shrub cover, biomass, and abundance in alpine and Arctic areas over the past decades (Sturm et al., 2001b; Hallinger et al., 2010; see Myers-Smith et al., 2011, for a review). Such an increase in shrubs alters the vegetation composition in these areas (Pajunen et al., 2011; Boscutti et al., 2018). For example, multiple studies have reported a negative relationship between shrubs and lichen occurrence (Cornelissen et al., 2001; Pajunen et al., 2011; Maliniemi et al., 2018). Moreover, Chagnon and Boudreau (2019) found a lower lichen abundance and diversity below shrubs compared to areas without shrubs. These studies imply that shrub vegetation outcompetes the lichen heaths in the long run. This might alter the alpine and Arctic environment in various ways, since lichens and shrubs have distinct characteristics. For example, Aartsma et al. (2020) measured an average albedo of 0.255 for lichen heaths, while the average albedo of shrubs was 0.132. In addition, terricolous lichen mats are characterized by a high insulating capacity, especially during dry conditions (Beringer et al., 2001; Porada et al., 2016). Therefore the shift from lichen-dominated areas to shrub-dominated areas might have, among others, important consequences for the microclimate and the macroclimate of alpine and Arctic areas.
Extensive studies have shown that shrub expansion has a substantial impact on microclimatic conditions, including surface albedo, soil temperature and permafrost stability (Myers-Smith et al., 2011; Loranty et al., 2018a). Chapin et al. (2005) estimated that a shift from tundra to a complete shrub environment has the potential to increase the atmospheric heating substantially. Contrary to this increase in atmospheric warming, shrubs can have a cooling effect on the subsurface due to shading by the canopy. Myers-Smith and Hik (2013) found that summer soil temperatures were 2 ∘C lower below a shrub cover than below shrub-free patches due to shading of the soil by the shrub canopy. The shading effect also reduces permafrost thaw below shrubs (Blok et al., 2010). However, it is expected that the large-scale increase in atmospheric heating due to shrub expansion will overwhelm the cooling effect of shading, and soil temperature will increase below shrubs in the long term (Lawrence and Swenson, 2011; Bonfils et al., 2012). Therefore, the general accepted view is that shrub expansion has a positive feedback on climate warming (Pearson et al., 2013), although some uncertainties still exist (Loranty and Goetz, 2012).
While we have a good understanding of how shrubs affect the climate, the impact of lichens on the micro- and macroclimate has not been studied in a thorough way yet. It is anticipated that the lichens' insulating properties and their high albedo will have a cooling effect on the micro- and macroclimate (Bernier et al., 2011; Porada et al., 2016). For example, Odland et al. (2017) found a negative correlation between lichen abundance and soil temperature on Norwegian mountain summits. Also, Porada et al. (2016) modeled the impact of lichens and bryophytes on the soil temperature at high latitudes. They estimated that lichens and bryophytes lower the soil temperature on average by 2.7 ∘C compared to an environment without lichens and bryophytes. However, they considered only the insulating properties of the two vegetation types and not the high albedo of lichens. Therefore, lichens might decrease the soil temperature even more. Most of the field measurements on the influence of lichens on the subsurface microclimate are based on differences between lichens and bare soil or disturbed lichens (e.g., Fauria et al., 2008; Nystuen et al., 2019; Van Zuijlen et al., 2020). A study on the differences in microclimatic conditions and thaw depth below understory vegetation of a larch forest in northeastern Siberia revealed that the soil temperature below lichen-dominated patches was higher than the soil temperature below shrub-dominated patches (Loranty et al., 2018b). However, constructive field measurements on the difference in soil temperature between lichens and shrubs in alpine and Arctic areas are lacking, and therefore it is uncertain how the observed shift from lichen-dominated areas to shrub-dominated areas will change the micro- and macroclimate in these areas.
To address this issue, we have set up a study to measure the difference in microclimatic conditions between lichen heaths and shrub vegetation at a mountain site in Norway. Our study design follows recommendations to apply a vegetation-specific approach to come to more detailed conclusions on the impact of shrub expansion and lichen decline (Stoy et al., 2012; Juszak et al., 2016; Williamson et al., 2016; Loranty et al., 2018a). We focus on four microclimatic variables: net radiation, soil heat flux, soil temperature and soil moisture. We used a paired plot design to measure these variables simultaneously at lichen and shrub plots in a Norwegian mountain area during two summers. Due to the paired plot design, we ensured that the lichen and paired shrub plots face similar background weather conditions, topographical characteristics and parent material. Considering the higher albedo of the lichen plots compared to the shrub plot that we reported in an earlier study (Aartsma et al., 2020) and the insulating properties of terricolous lichens (Porada et al., 2016), we hypothesize that (1) lichen heaths have a lower net radiation than shrubs, (2) the soil heat flux is lower below lichens than below shrubs, and (3) the soil temperature is lower below lichens than below shrubs. With this study, we advance the knowledge on the impact of lichens on the microclimate during the growing season, which is important to answer the question of how a future vegetation shift from lichen-dominated areas towards shrub-rich environments might alter the micro- and macroclimate.
2.1 Study area
The study was conducted at Imingfjellet (60.1901∘ N, 8.5724∘ E), a mountain area in southern Norway with an elevation ranging from 1100 to 1350 m a.s.l. The landscape and vegetation characteristics of this area are typical for continental alpine areas in Scandinavia. The vegetation is low-alpine zone vegetation. Windswept ridgetops are covered with lichen heaths (see Appendix A for a picture of the area). Most common lichen species are of the genera Cladonia, Flavocetraria, Alectoria and Cetraria (Aartsma et al., 2020). The most abundant shrub species in the area is Betula nana, mainly located on the midslope and ridgetop positions. The parent material of the soils in the study area consists of metarhyolitic moraine material (NGU, 2020). No permafrost is present at the study site. The nearest weather station (Dagali, 25 km from the study site; 828 m a.s.l., MET Norway, 2019, station no. 29790) reported an average yearly temperature of 0.5 ∘C with an average July temperature of 11 ∘C for the period 1988–2007. The average yearly precipitation during this period was 550 mm.
2.2 Data collection
We selected a study site of 2.5 km along a county road and 200 m from this road into the field, resulting in an area of ca. 50 ha. In this study site, we delineated the lichen heaths using areal images of Geonorge (2018) in ArcMap (ESRI, 2019). The delineated lichen patches had a total area of 15 ha. Within these patches, we randomly selected 10 locations. In the field, we selected the lichen-dominated plots within a radius of 50 m around each location that fulfilled the criteria of Table 1. If multiple lichen plots per location fulfilled these criteria, we selected the plot with the highest percentage of lichen cover. Subsequently, we selected shrub-dominated plots around each lichen plot that fulfilled the criteria of Table 1. The shrub plot with the highest percentage of shrub cover was selected if multiple shrub plots fulfilled the criteria. This led to 10 paired plots (Fig. 1). We measured the climatic variables simultaneously and in an identical way in one of the paired lichen and shrub plot at the time for 2 d. After these 2 d, we moved the sensors to the next paired plots. We conducted the measurements on these plots between 4 July and 13 August 2018. Days with a precipitation duration of more than 30 min were excluded to minimize the effect of precipitation on the radiation measurements.
The terms of the net radiation, the soil heat flux, the soil temperature and the soil moisture were measured on the same position, on the same height or depth, and with the same sensors in each lichen and shrub plot (Fig. 2). We measured the incoming shortwave radiation, reflected shortwave radiation, incoming longwave radiation and outgoing longwave radiation in watts per square meters (W m−2) with one Kipp & Zonen CNR4 net radiometer per plot. We placed the radiometer 30 cm above the canopy, which led to a measurement radius of 112 cm. With this height, we ensured that all the measured reflected shortwave radiation was reflected by the studied plot. The radiometer measured every 5 s and the data loggers (Kipp & Zonen Logbox SE) collected 5 min averages. We measured the soil heat flux at two positions per plot with Hukseflux HFP01SC self-calibrating heat flux sensors. We placed the heat flux sensors at 5 cm depth below the soil surface, and measurements were done every 5 min. These measurements were recorded with Campbell Scientific CR800 data loggers. We measured the soil temperature on three positions per plot and at each of these positions on two depths (1 and 5 cm below the soil surface) with LogTag TRIX-8 temperature loggers. The temperature loggers measured the soil temperature every 5 min. We measured soil moisture at the same three positions as the soil temperature with ECH2O 5TM soil moisture sensors at 5 cm below the soil surface. These sensors measured the soil moisture every 5 min and the measurements were recorded with Em50 data loggers. We measured the reference air temperature at 1 m height at one location in the study area (Fig. 1) with an UTL-3 temperature data logger placed in a Stevenson screen throughout the field season. In addition, we measured the precipitation manually with a regular rain gauge.
Table 1Criteria for the selection of lichen and corresponding shrub-dominated plots. Table adapted from Aartsma et al. (2020).
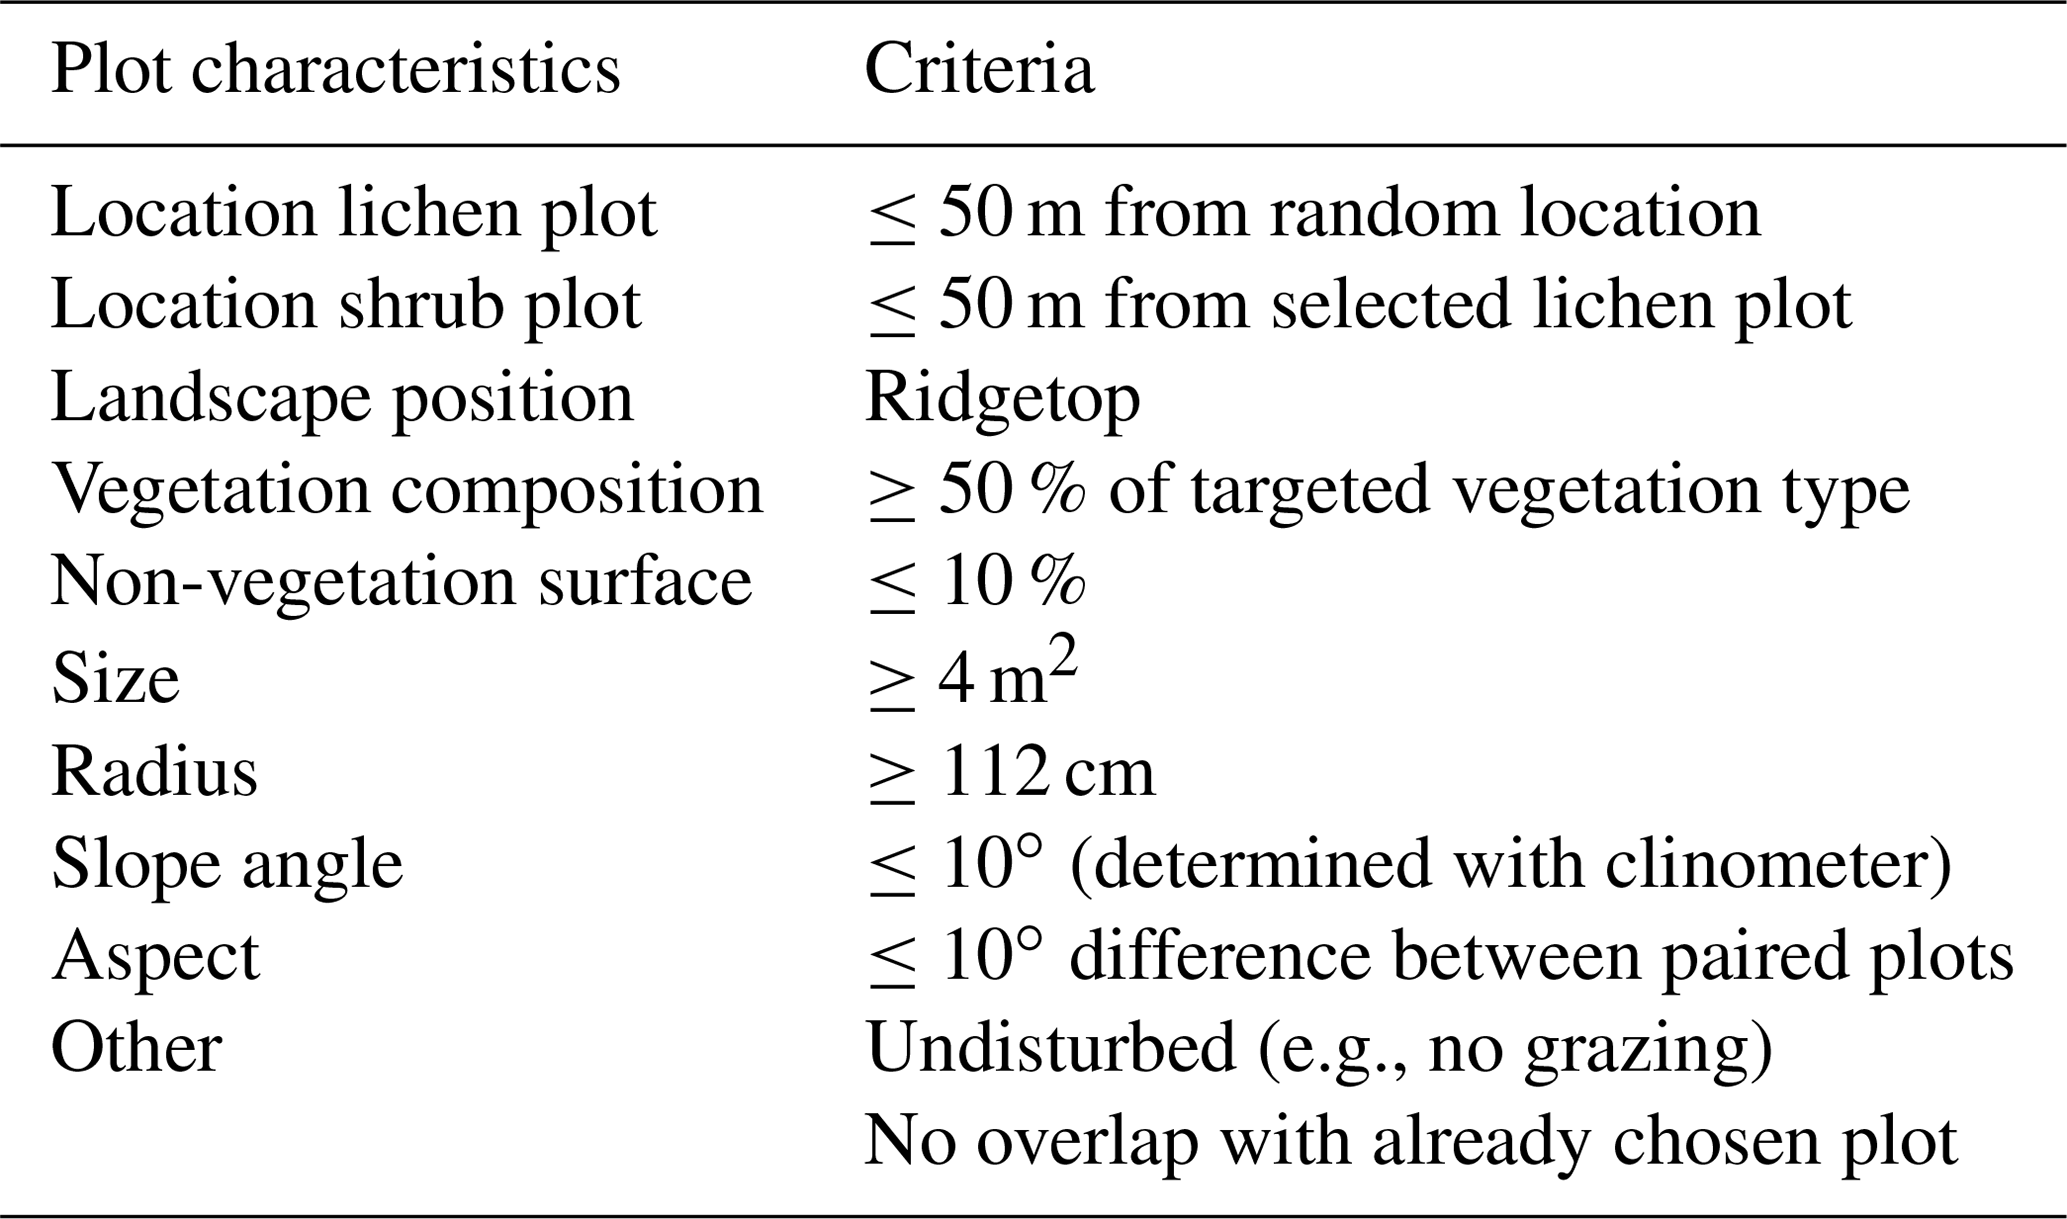
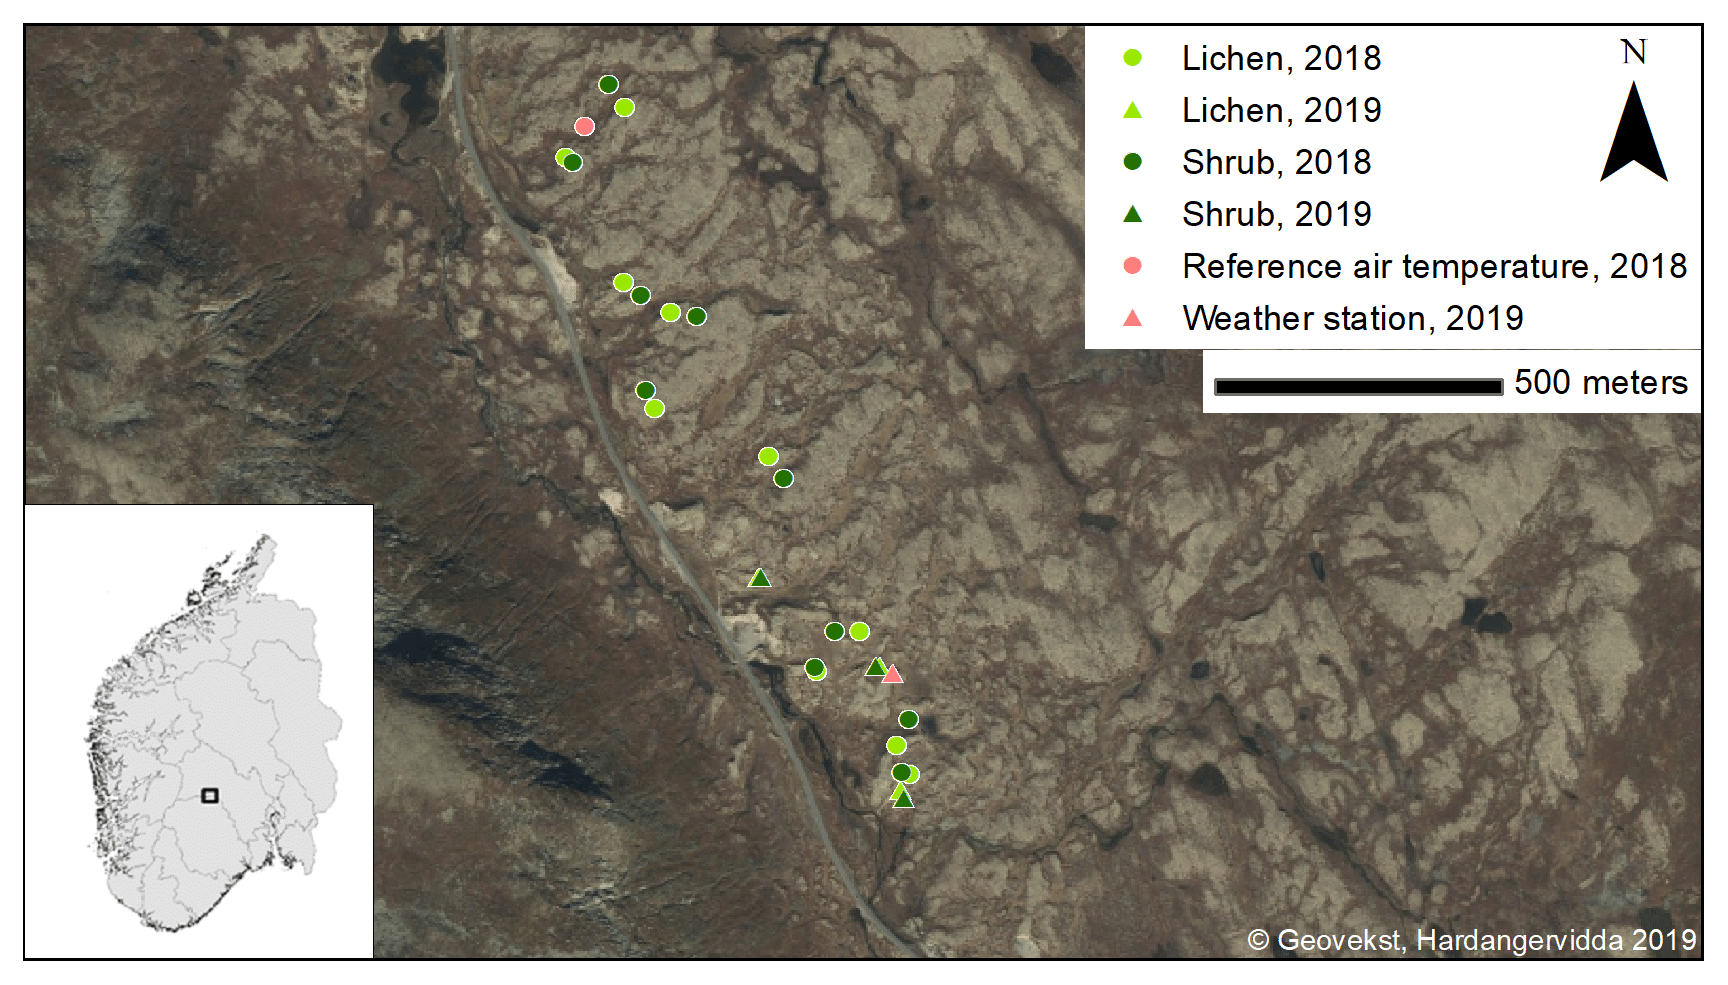
Figure 1Locations of the plots in the study area. Inset: location of Imingfjellet in southern Norway.
We measured the vegetation height in every plot at 10 cm intervals along a north–south and an east–west transect. This led to 49 height measurements per plot. The thickness of the litter layer was determined at each of the five positions where soil temperature or soil heat flux were measured in each plot. We drilled one hole in the middle of each plot with a soil auger (∅ 4 cm) and described the soil using the FAO guidelines (WRB, 2006). In each plot, we took three soil samples of the upper 6 cm of the mineral soil by filling a metal cylinder (volume 265 cm3) twice per sample. If the metal cylinder encountered a rock during insertion into the soil, we took a new sample in close vicinity. The two sub-samples were mixed and dried at 105 ∘C for 24 h. Subsequently we weighed the samples and calculated the bulk density per sample. In addition, we measured the organic matter percentage using the loss-on-ignition method (Heiri et al., 2001, ignition conditions: 550 ∘C for 3 h) and measured the particle size distribution by dry sieving using an Endecott EFL 1 MK11 sieve shaker.
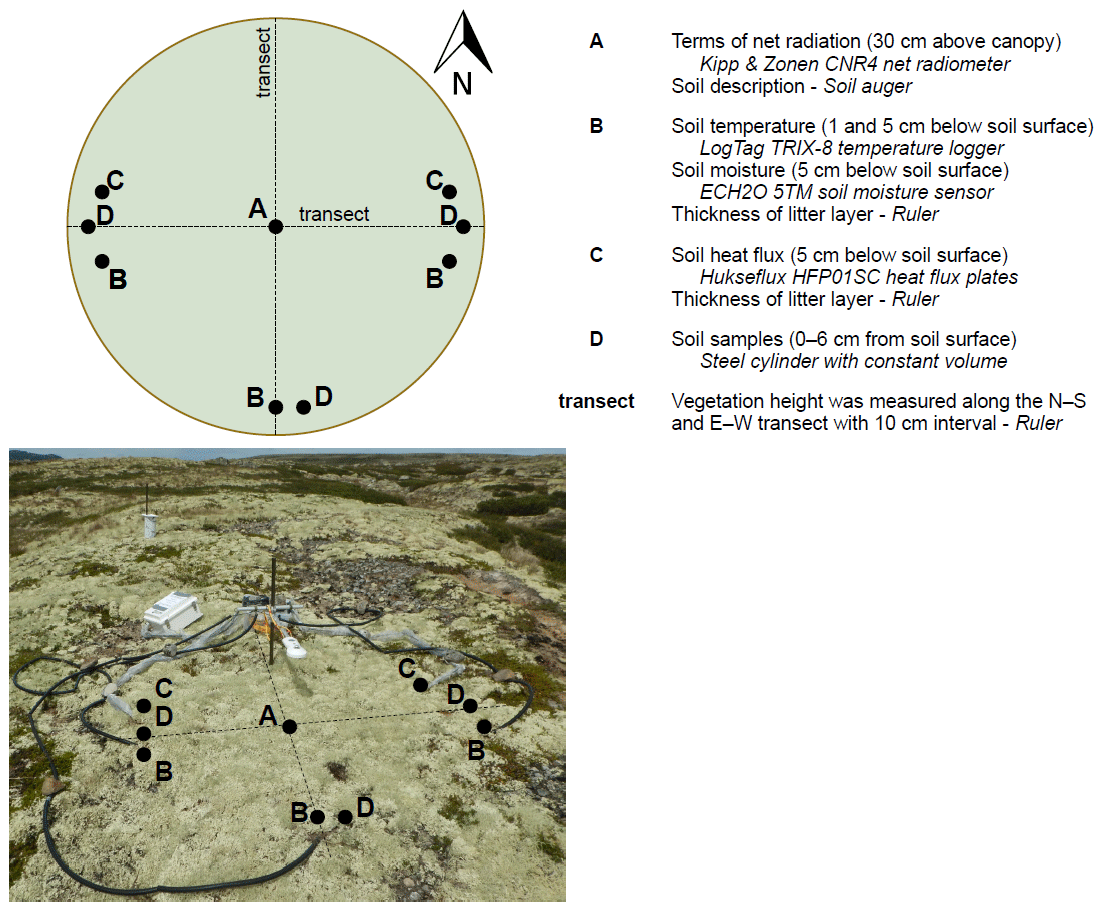
Figure 2A schematic overview of the positions of the measurements within one plot, a picture of the setup and a list of measured variables per plot. The sensors and materials are indicated in italic. All variables were measured at the same positions within all lichen and shrub plots.
The 2 d measurements performed in 2018 were complemented in 2019 with measurements for 6 subsequent days in three additional paired lichen and shrub plots. We chose to measure the microclimatic conditions for more subsequent days than during the field season of 2018 in order to gain more insight in the variability over time. In addition, we selected the locations of the paired plots of 2019 subjectively (Fig. 1). However, the plots of 2019 also fulfilled the criteria of Table 1. We measured one paired plot at the end of June, one paired plot at the end of July and one paired plot in mid-August. To monitor the background weather conditions in a more thorough way than during the 2018 field season, we placed a HOBO RX3000 remote weather station at the study site for the 2019 field season (see Appendix B for a list of sensors of the weather station).
2.3 Microclimate calculations
For each plot, we calculated the net radiation (Q∗) with the four terms of the radiation balance using Eq. (1) (Oke, 2002):
in which SWin is the incoming shortwave radiation, SWout is the reflected shortwave radiation, LWin is the incoming longwave radiation and LWout is the outgoing longwave radiation.
We corrected the measurements of the soil heat flux for heat storage above the heat flux plates using Eq. (2) (Oke, 2002):
in which QG0 is the soil heat flux at the soil surface, QGz is the measured soil heat flux at depth z, Cs is the heat capacity of the soil above the plate and is the change in temperature of the soil above the plate. For this correction, we converted the 5 min measurements to hourly averages and used the soil temperature that was measured at 1 cm depth to calculate . We determined Cs using Eq. (3) (De Vries, 1963):
in which xmin, xorg and xw are the volume fractions of the mineral soil, organic matter and water, respectively. We obtained the volume fractions of the mineral soil and organic matter with the organic matter and bulk density measurements. At two plots, the QG0 could not be calculated at one position due to the loss of a xorg measurement and malfunctioning of a soil temperature sensor at 1 cm depth.
2.4 Data analysis
For every plot of the field season of 2018, we calculated an average vegetation height, thickness of the litter layer, percentage of soil organic matter, bulk density, and silt and clay fraction. To test if these variables and the thickness of the A horizon (obtained during the soil description) differ significantly between the lichen and shrub plots, we performed a Wilcoxon signed rank test.
To test for differences in microclimatic conditions between the lichen and shrub plots, we used linear mixed models for the net radiation, soil heat flux, soil temperature and soil moisture. Due to the differences in sample design between the field seasons of 2018 and 2019 (e.g., the plots of 2019 were selected subjectively, which might introduce selection bias), we chose to use only the 10 paired plots of 2018 for the models. We utilized vegetation type (lichen or shrub) and the reference air temperature with interaction as fixed effects. We added the reference air temperature as fixed effect since we expected that it affects the response variables directly (soil temperature and soil heat flux) or indirectly by being a proxy for the general weather conditions (net radiation and soil moisture). We included the interaction vegetation type x reference air temperature since the microclimatic variables might respond in a different way to the air temperature for lichens than for shrubs. Day of measurement nested into plot number was added as random effect to account for the paired sample design. Per microclimatic variable, we constructed separate models for daily measurements, daytime measurements (08:00–22:00 LT) and nighttime measurements (22:00–8:00 LT). Therefore, we converted the 5 min measurements of the net radiation and hourly measurements of QG0 into daily, daytime and nighttime totals (in megajoule) and the 5 min measurements of soil temperature and soil moisture into daily, daytime and nighttime averages. Only the soil temperature measured at 5 cm depth was used for this analysis.
The longer period of measurements per paired plot during the field season of 2019 allowed us to study the difference in microclimatic conditions between lichens and shrubs over a longer time period. We constructed time series of the hourly averages of the reference air temperature, net radiation, soil heat flux and soil temperature for the three paired plots to gain more insight in the specific dynamics of the variables. In addition, we analyzed the difference in microclimatic conditions between lichens and shrubs during a warm, sunny day and a cold, cloudy day. As a basis for this analysis, we selected from one paired plot measurements from a distinct warm, sunny day and measurements from a distinct cold, cloudy day and constructed time series of the reference air temperature, net radiation, soil heat flux and soil temperature.
All statistical analyses were made using R version 4.0.2 (R Core Team, 2020). The mixed models were constructed with the package nlme (Pinheiro et al., 2011).

Figure 3Difference in vegetation height (a), thickness of the litter layer (b), thickness of the A horizon (c), organic matter (d), bulk density (e), and silt and clay fraction (f) between the lichen and shrub plots of 2018. Asterisks indicate the significance according to the Wilcoxon signed rank test. : p value <0.01; no asterisks means no significant difference. n=10 for each boxplot.
3.1 Canopy and soil variables
We found a significant difference in vegetation height, thickness of litter layer and thickness of A horizon between the lichen and shrub plots (Fig. 3). Almost no plant litter was present under the lichen plots, while we measured an average (± SE) thickness of 7.1 (± 0.2) cm under the shrub plots. We found no significant difference in soil organic matter, bulk density, and silt and clay fraction between the lichen and shrub plots. Moreover, there was no clear difference in soil type between the lichen and shrub plots. All soils were classified as podzols or showed clear signs of podzolization.
3.2 Microclimatic conditions throughout the field season
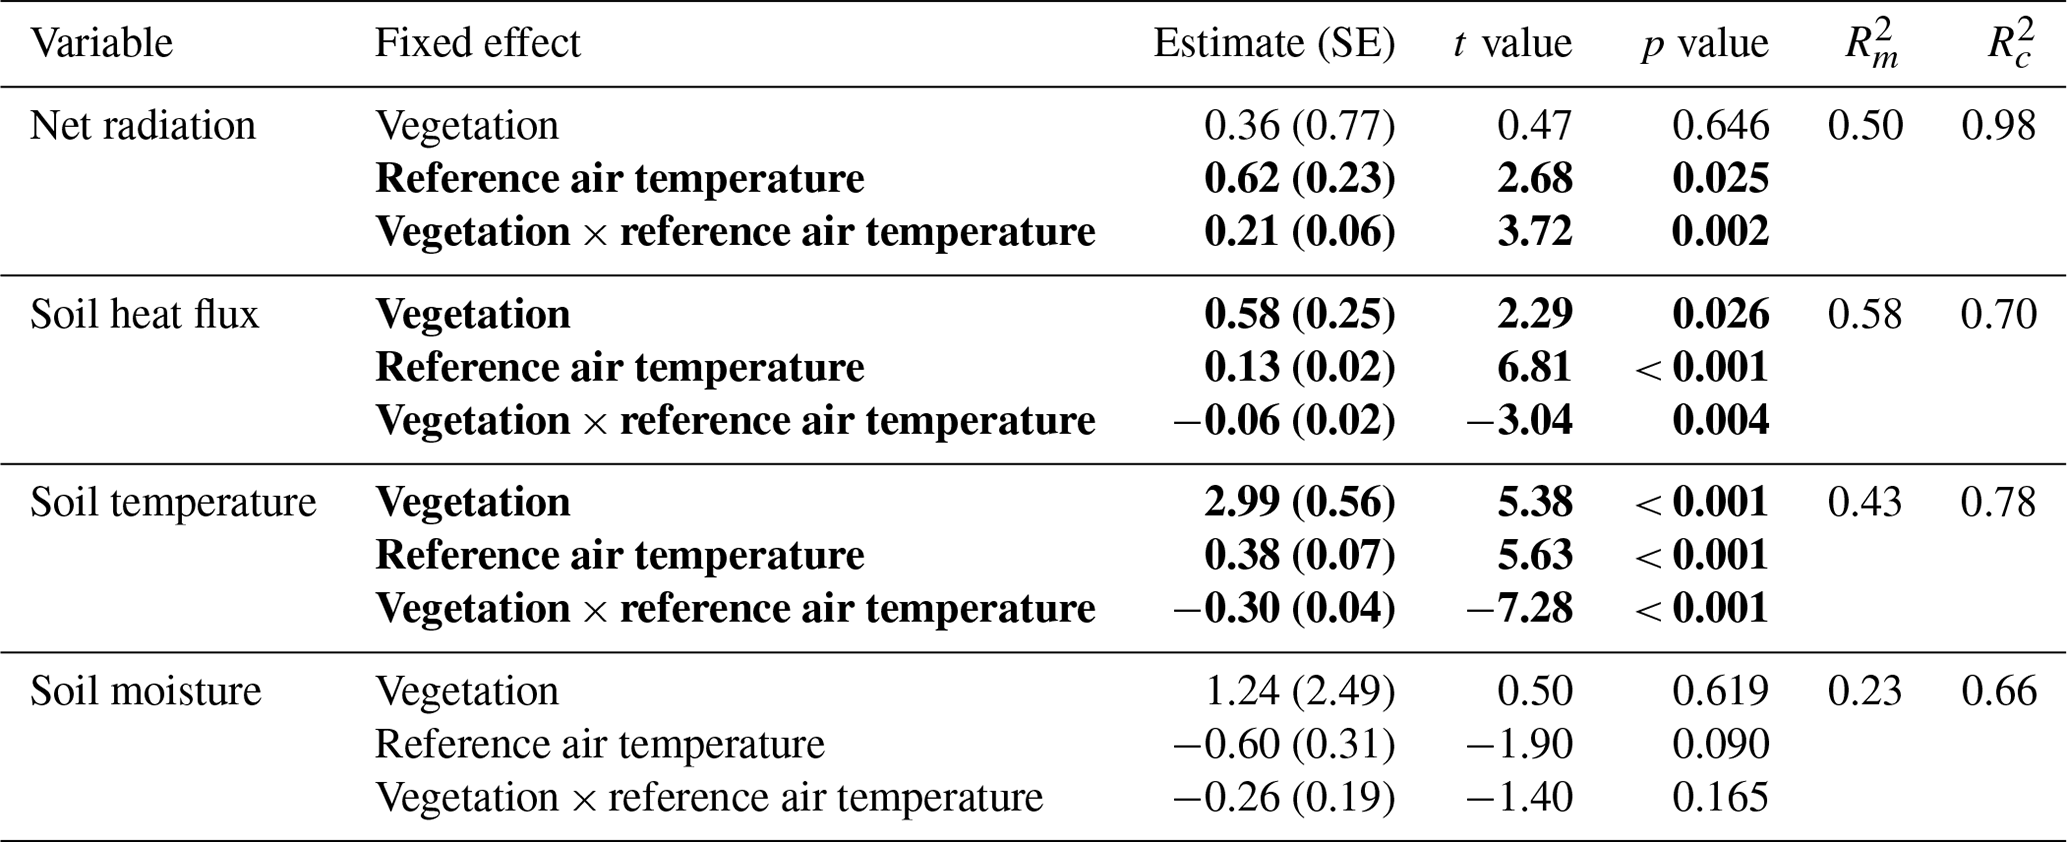
The daily total net radiation, daily total soil heat flux and daily average soil temperature differed significantly between the lichen and shrub plots of 2018 (Table 2, Figs. 4, 5). The shrub plots had a higher net radiation than the lichen plots during the entire field season (Fig. 4b). This difference in net radiation was mainly initiated by a difference in SW* (SWin − SWout) between the vegetation types (Fig. 6), governed by the higher albedo of the lichens compared to the shrubs, since SWin values were the same. On average, the daily net radiation was 3.15 MJ (26 %) lower for the lichen plots than for the shrub plots. The daily total soil heat flux and daily average soil temperature were higher under lichens than under shrubs for a substantial amount of days during the field season (Fig. 4c, d), and this difference was significant when air temperatures are relatively high (Fig. 5b, c). There was no significant difference in soil moisture between the lichen and shrub plots (Table 2, Figs. 4e, 5d). The measurements of the three paired lichen and shrub plots of 2019 showed similar patterns to 2018 for the four microclimatic variables (Appendix D).
Table 2Results of the linear mixed models for the effect of vegetation type and air temperature on the daily total net radiation, the daily total soil heat flux, the daily average soil temperature and the daily average soil moisture. Statistically significant effects (p<0.05) are indicated in bold. indicates the variation explained by the fixed effects, and indicates the variation explained by the entire model. See Fig. 5 for a visualization of the models. The results of the linear mixed models for daytime and nighttime are reported in Appendix C.
3.3 Microclimatic differences in daytime vs. night
The difference in daily total net radiation between the lichen and shrub plot arose during daytime (Fig. 7a, Appendix E). The higher albedo of lichens compared to shrubs will have its effect on the net radiation only during the day due to the absence of shortwave radiation at night. The soil heat flux below lichens was larger than below shrubs during daytime, while it was smaller or even negative below lichens during nighttime (Fig. 7b, Appendix E). As a consequence, the daily amplitude of the soil heat flux was larger for a lichen plot than for a shrub plot (Appendix E). The daily amplitude of the soil temperature was also larger for lichens than for shrubs (Appendix E), but the soil temperature differed only significantly between lichens and shrubs during daytime, with higher air temperatures for our measurements of 2018 (Fig. 7c).

Figure 4Daily measurements during the field season of 2018 for the background weather conditions (air temperature and precipitation) (a), net radiation (b), soil heat flux (c), soil temperature (d) and soil moisture (e). Every day is divided into the lichen and corresponding shrub plot for graphs (b), (c), (d) and (e). For ease of display, we calculated averages per plot for the soil heat flux (n=2), soil temperature (n=3) and soil moisture (n=3). Error bars display minimum and maximum values for soil heat flux and standard errors for soil temperature and soil moisture. Vertical dotted lines indicate a plot change.
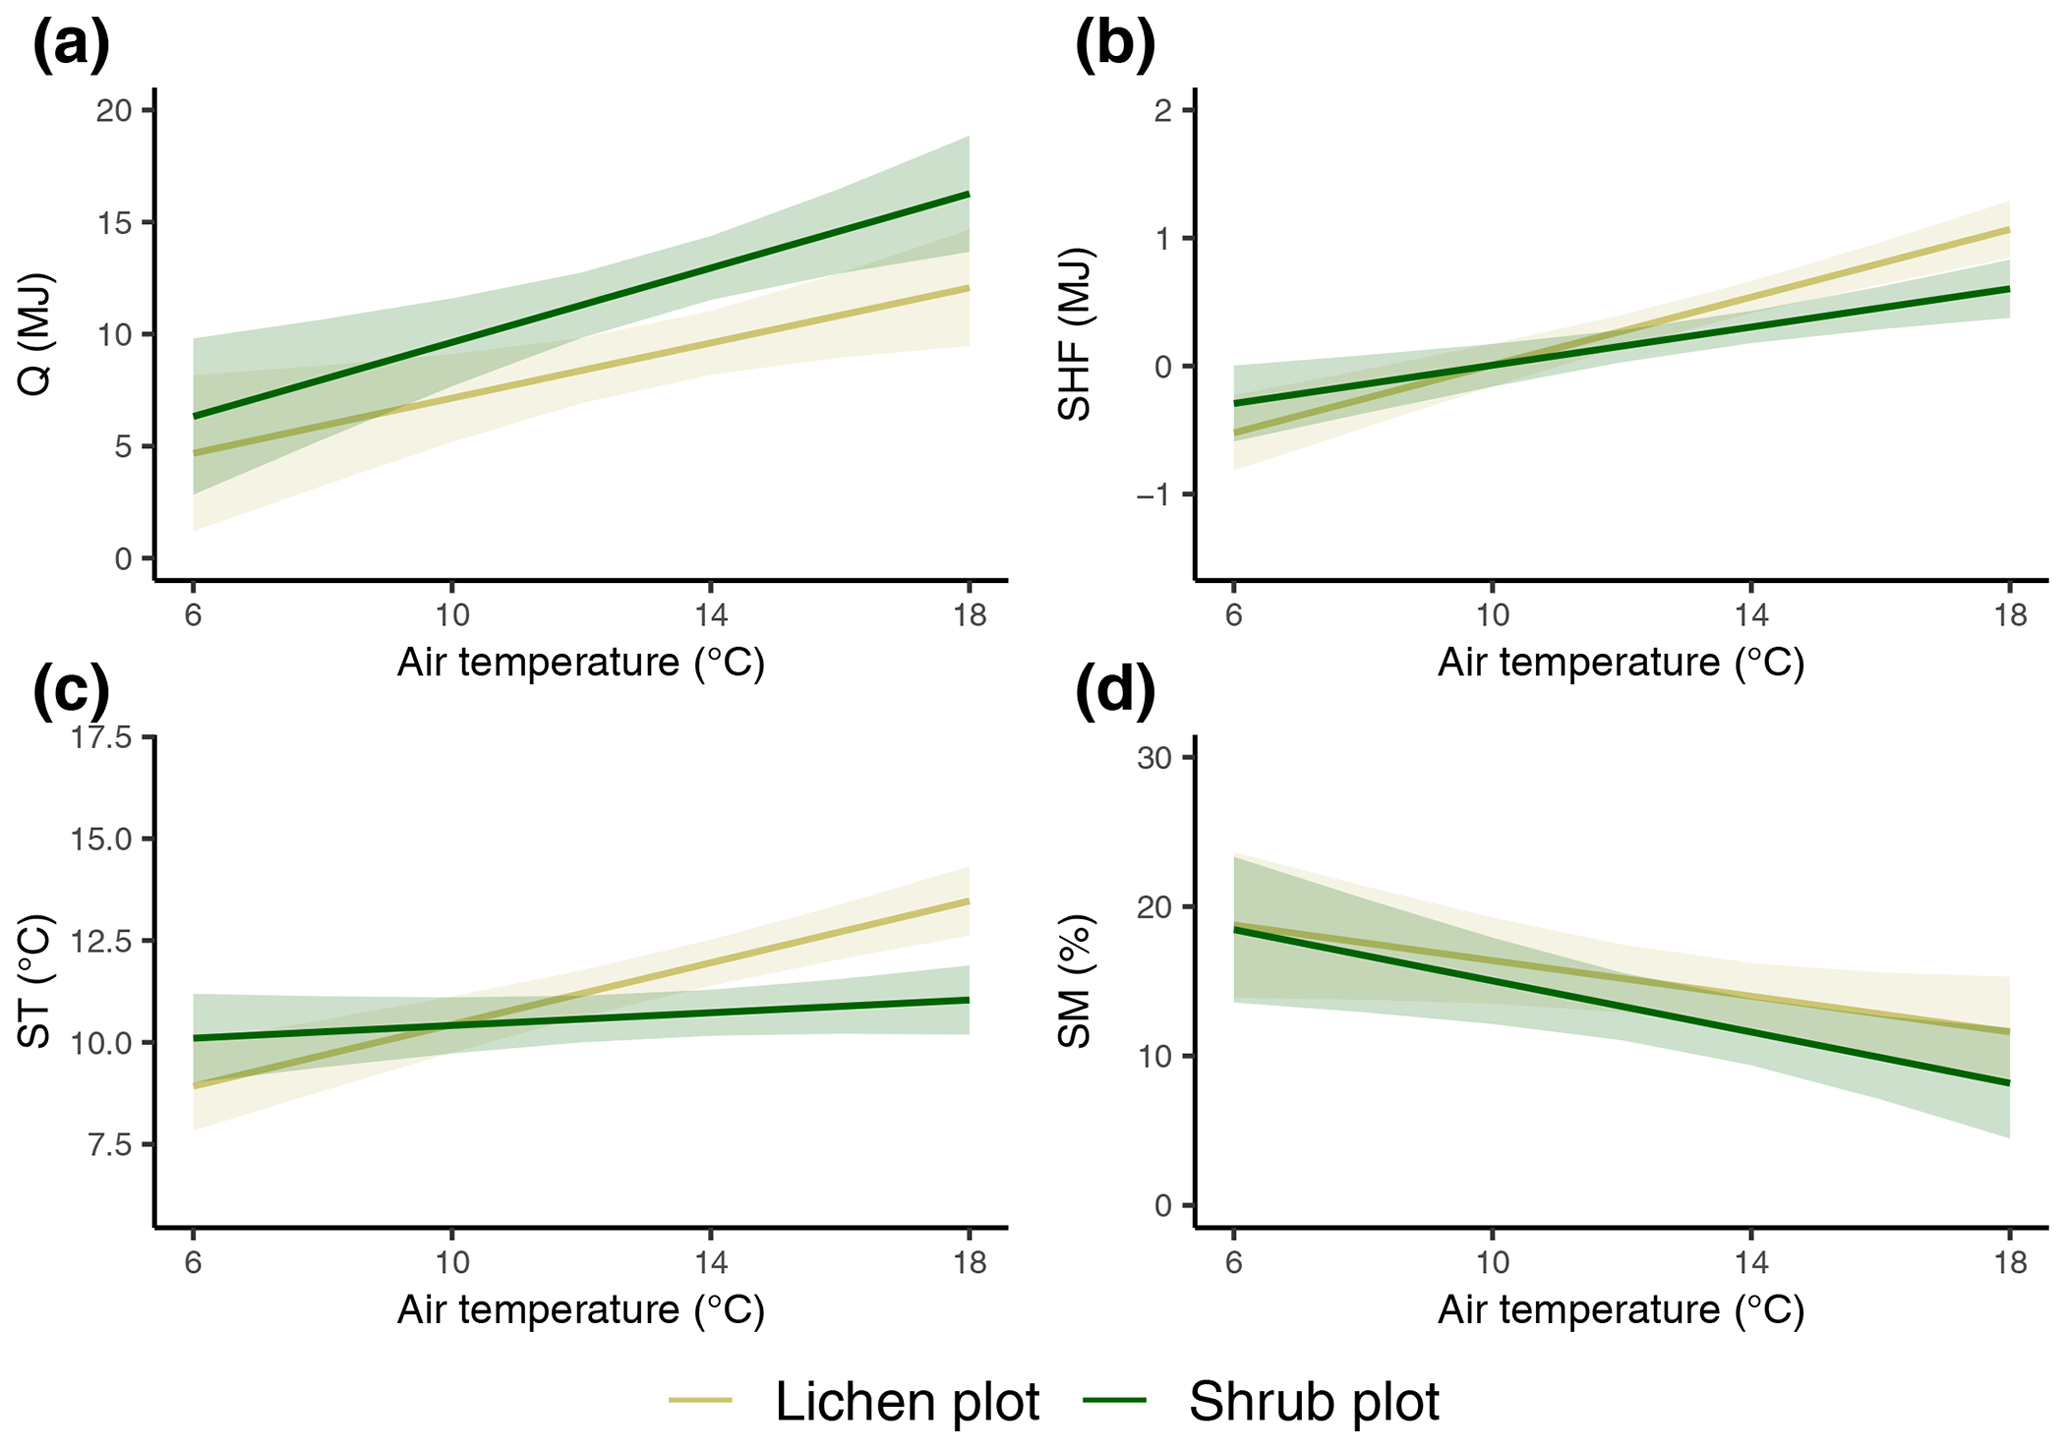
Figure 5The modeled relationships with 95 % confidence intervals between vegetation type, daily average reference air temperature and daily total net radiation (a), daily total soil heat flux (b), daily average soil temperature (c), and daily average soil moisture (d). See Table 2 for details on the mixed models.
3.4 Warm and sunny day vs. cold and cloudy day
The differences in the microclimatic variables between the lichen and shrub plots were more pronounced during a warm, sunny day than during a cold, cloudy day (Fig. 8). The difference in net radiation was larger during a sunny day, since the incoming shortwave radiation is relatively high, and therefore the higher albedo of lichens played a more dominant role in the net radiation. Similar to the net radiation, the difference in soil heat flux between the lichen and shrub plot was larger during a warm, sunny day. However, the soil heat flux was higher below the lichen plot than below the shrub plot.

Figure 6Average radiation balance for all lichen and shrub plots of the entire field season of 2018. SW* = SWin − SWout and LW* = LWin − LWout.
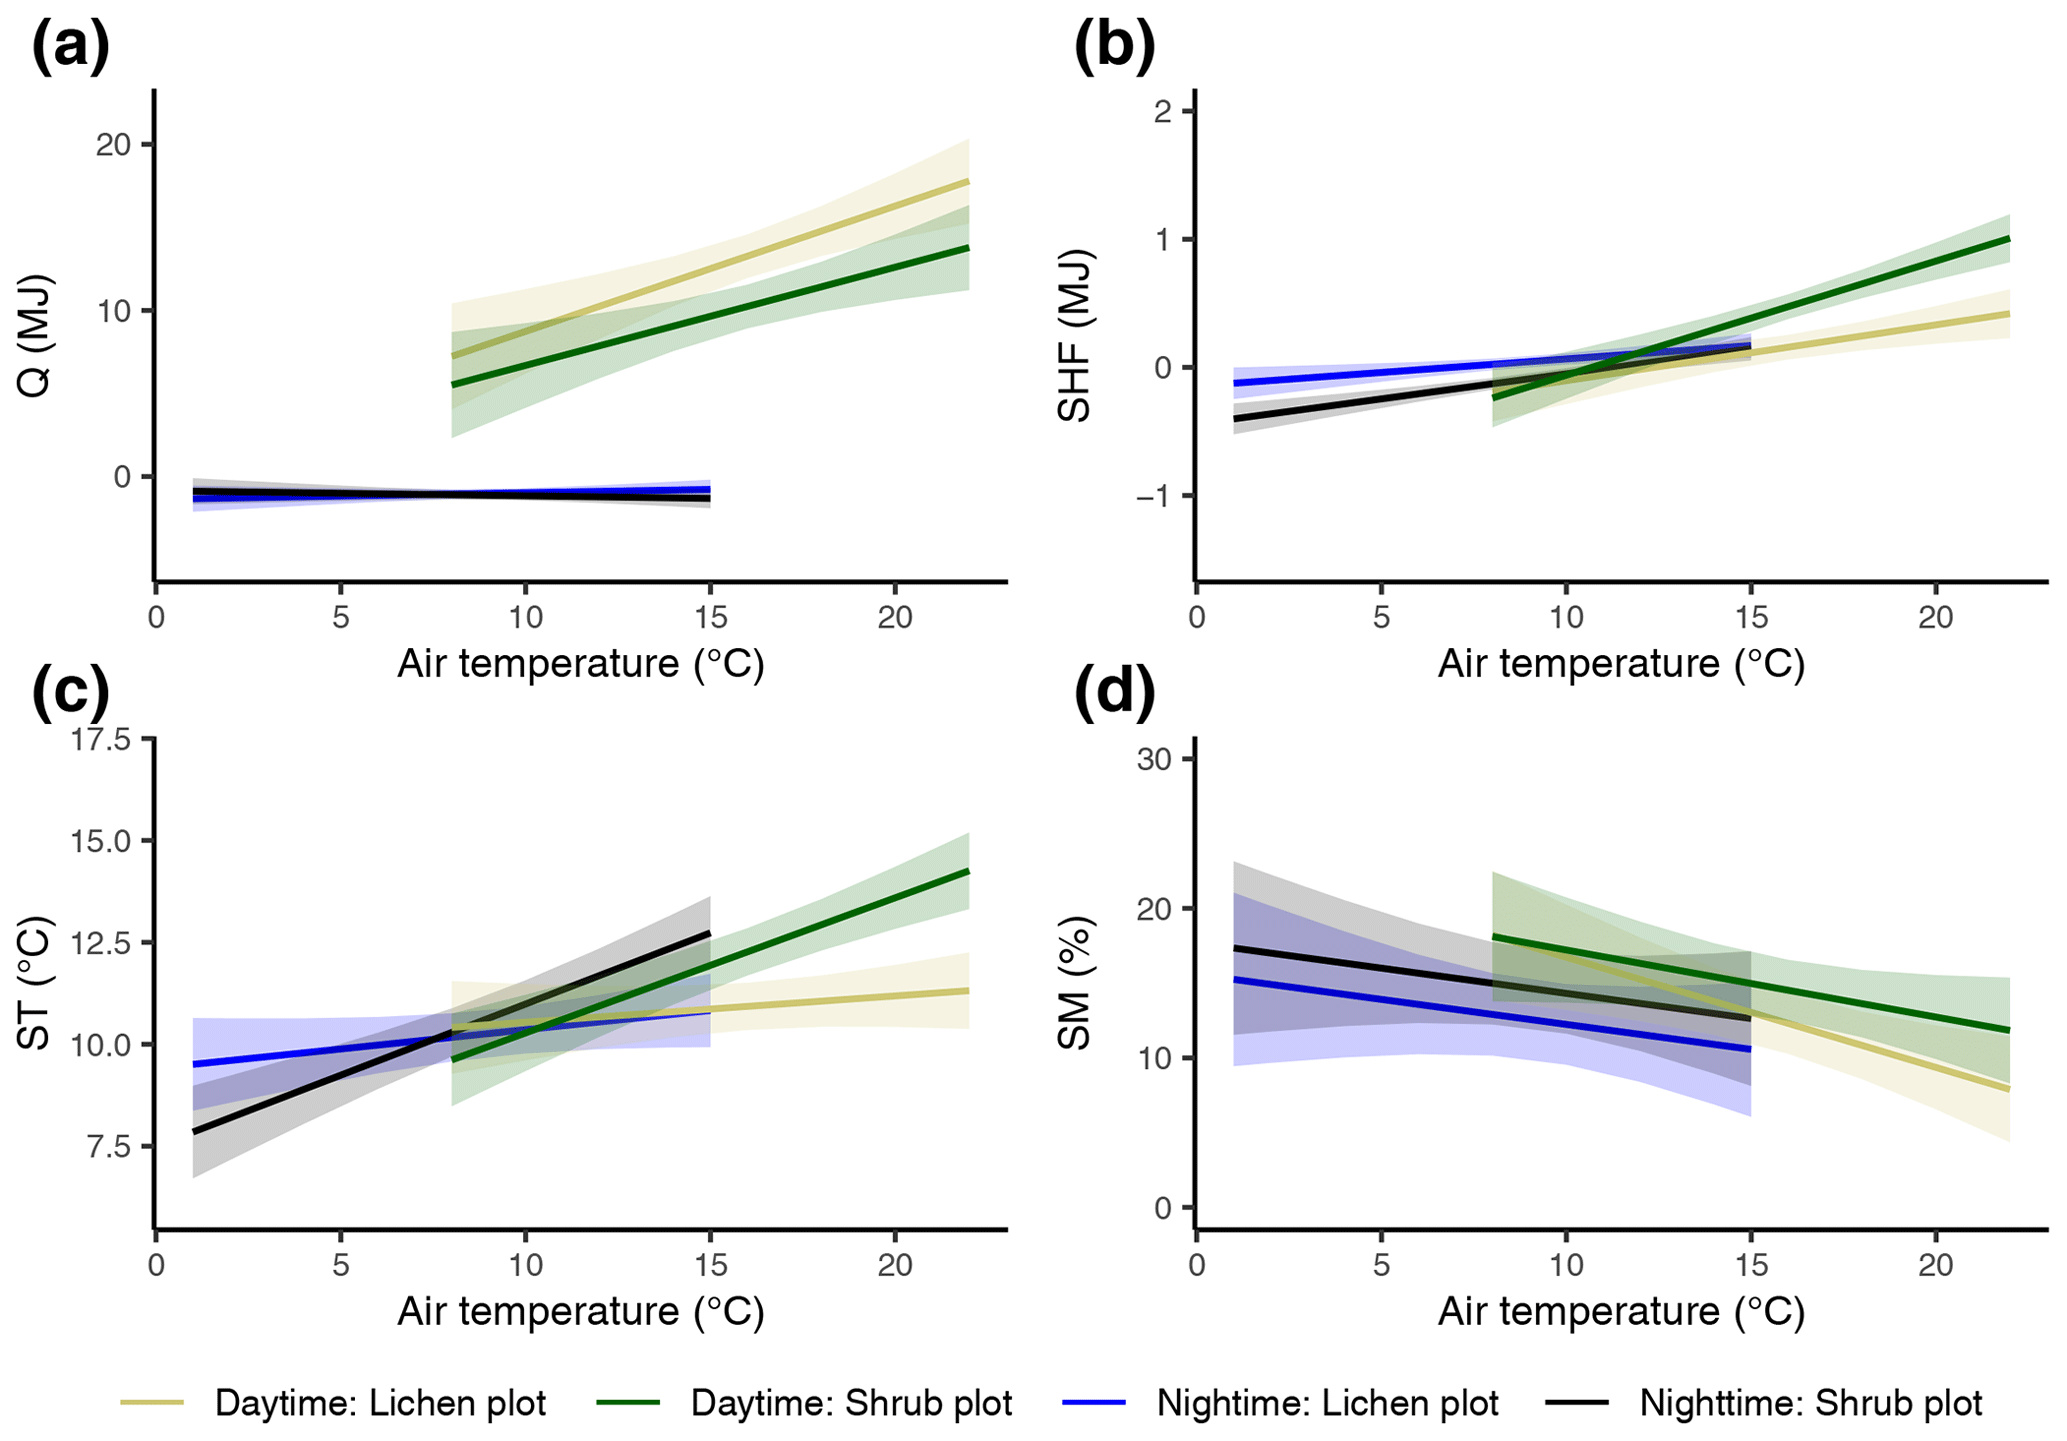
Figure 7The modeled relationships with 95 % confidence intervals between vegetation type, average reference air temperature and total net radiation (a), total soil heat flux (b), average soil temperature (c), and average soil moisture (d) during daytime and nighttime. See Appendix C for details on the mixed models.
4.1 Radiation balance
The higher net radiation of the shrub plots compared to the lichen plots was in line with our hypothesis. This difference is mainly initiated by the higher albedo of the lichen plots, as SW* is higher for shrubs than for lichens, while the difference in LW* (LWin − LWout) is marginal (Fig. 6). Moreover, previously we measured an average difference in albedo of 0.124 between the lichen and shrub plots of 2018 (Aartsma et al., 2020). The daily average net radiation of our shrub plots was 3.15 MJ higher than of our lichen plots. Chapin et al. (2005) reported an increase in atmospheric heating of 0.55 MJ d−1 when the alpine tundra shifts into shrubs. Using their definition of atmospheric heating (sensible + latent heat flux, i.e., net radiation − soil heat flux), we measured an average difference in atmospheric heating of 3.35 MJ d−1 between our lichen and shrub plots. This difference is more than 6 times larger than estimated by the study of Chapin et al. (2005). However, Chapin et al. (2005) assumed that the albedo of shrubs is 0.02 higher than the albedo of alpine tundra, which is substantially lower than the difference in albedo between our lichen and shrub plots. This indicates that a loss of alpine tundra that contains a large amount of lichens might contribute to more atmospheric heating than the loss of alpine tundra without lichens. However, our value of atmospheric heating might be slightly overestimated, since our measurements were conducted during a relatively warm and sunny field season. This is reflected, among others, in the relatively large daily mean SWin that we measured during our field season (255 W m−2) compared to long-term studies at similar latitudes (200 W m−2) (Eugster et al., 2000). Nevertheless, our study shows that large variations in radiation dynamics exist within alpine tundra depending on the vegetation composition.
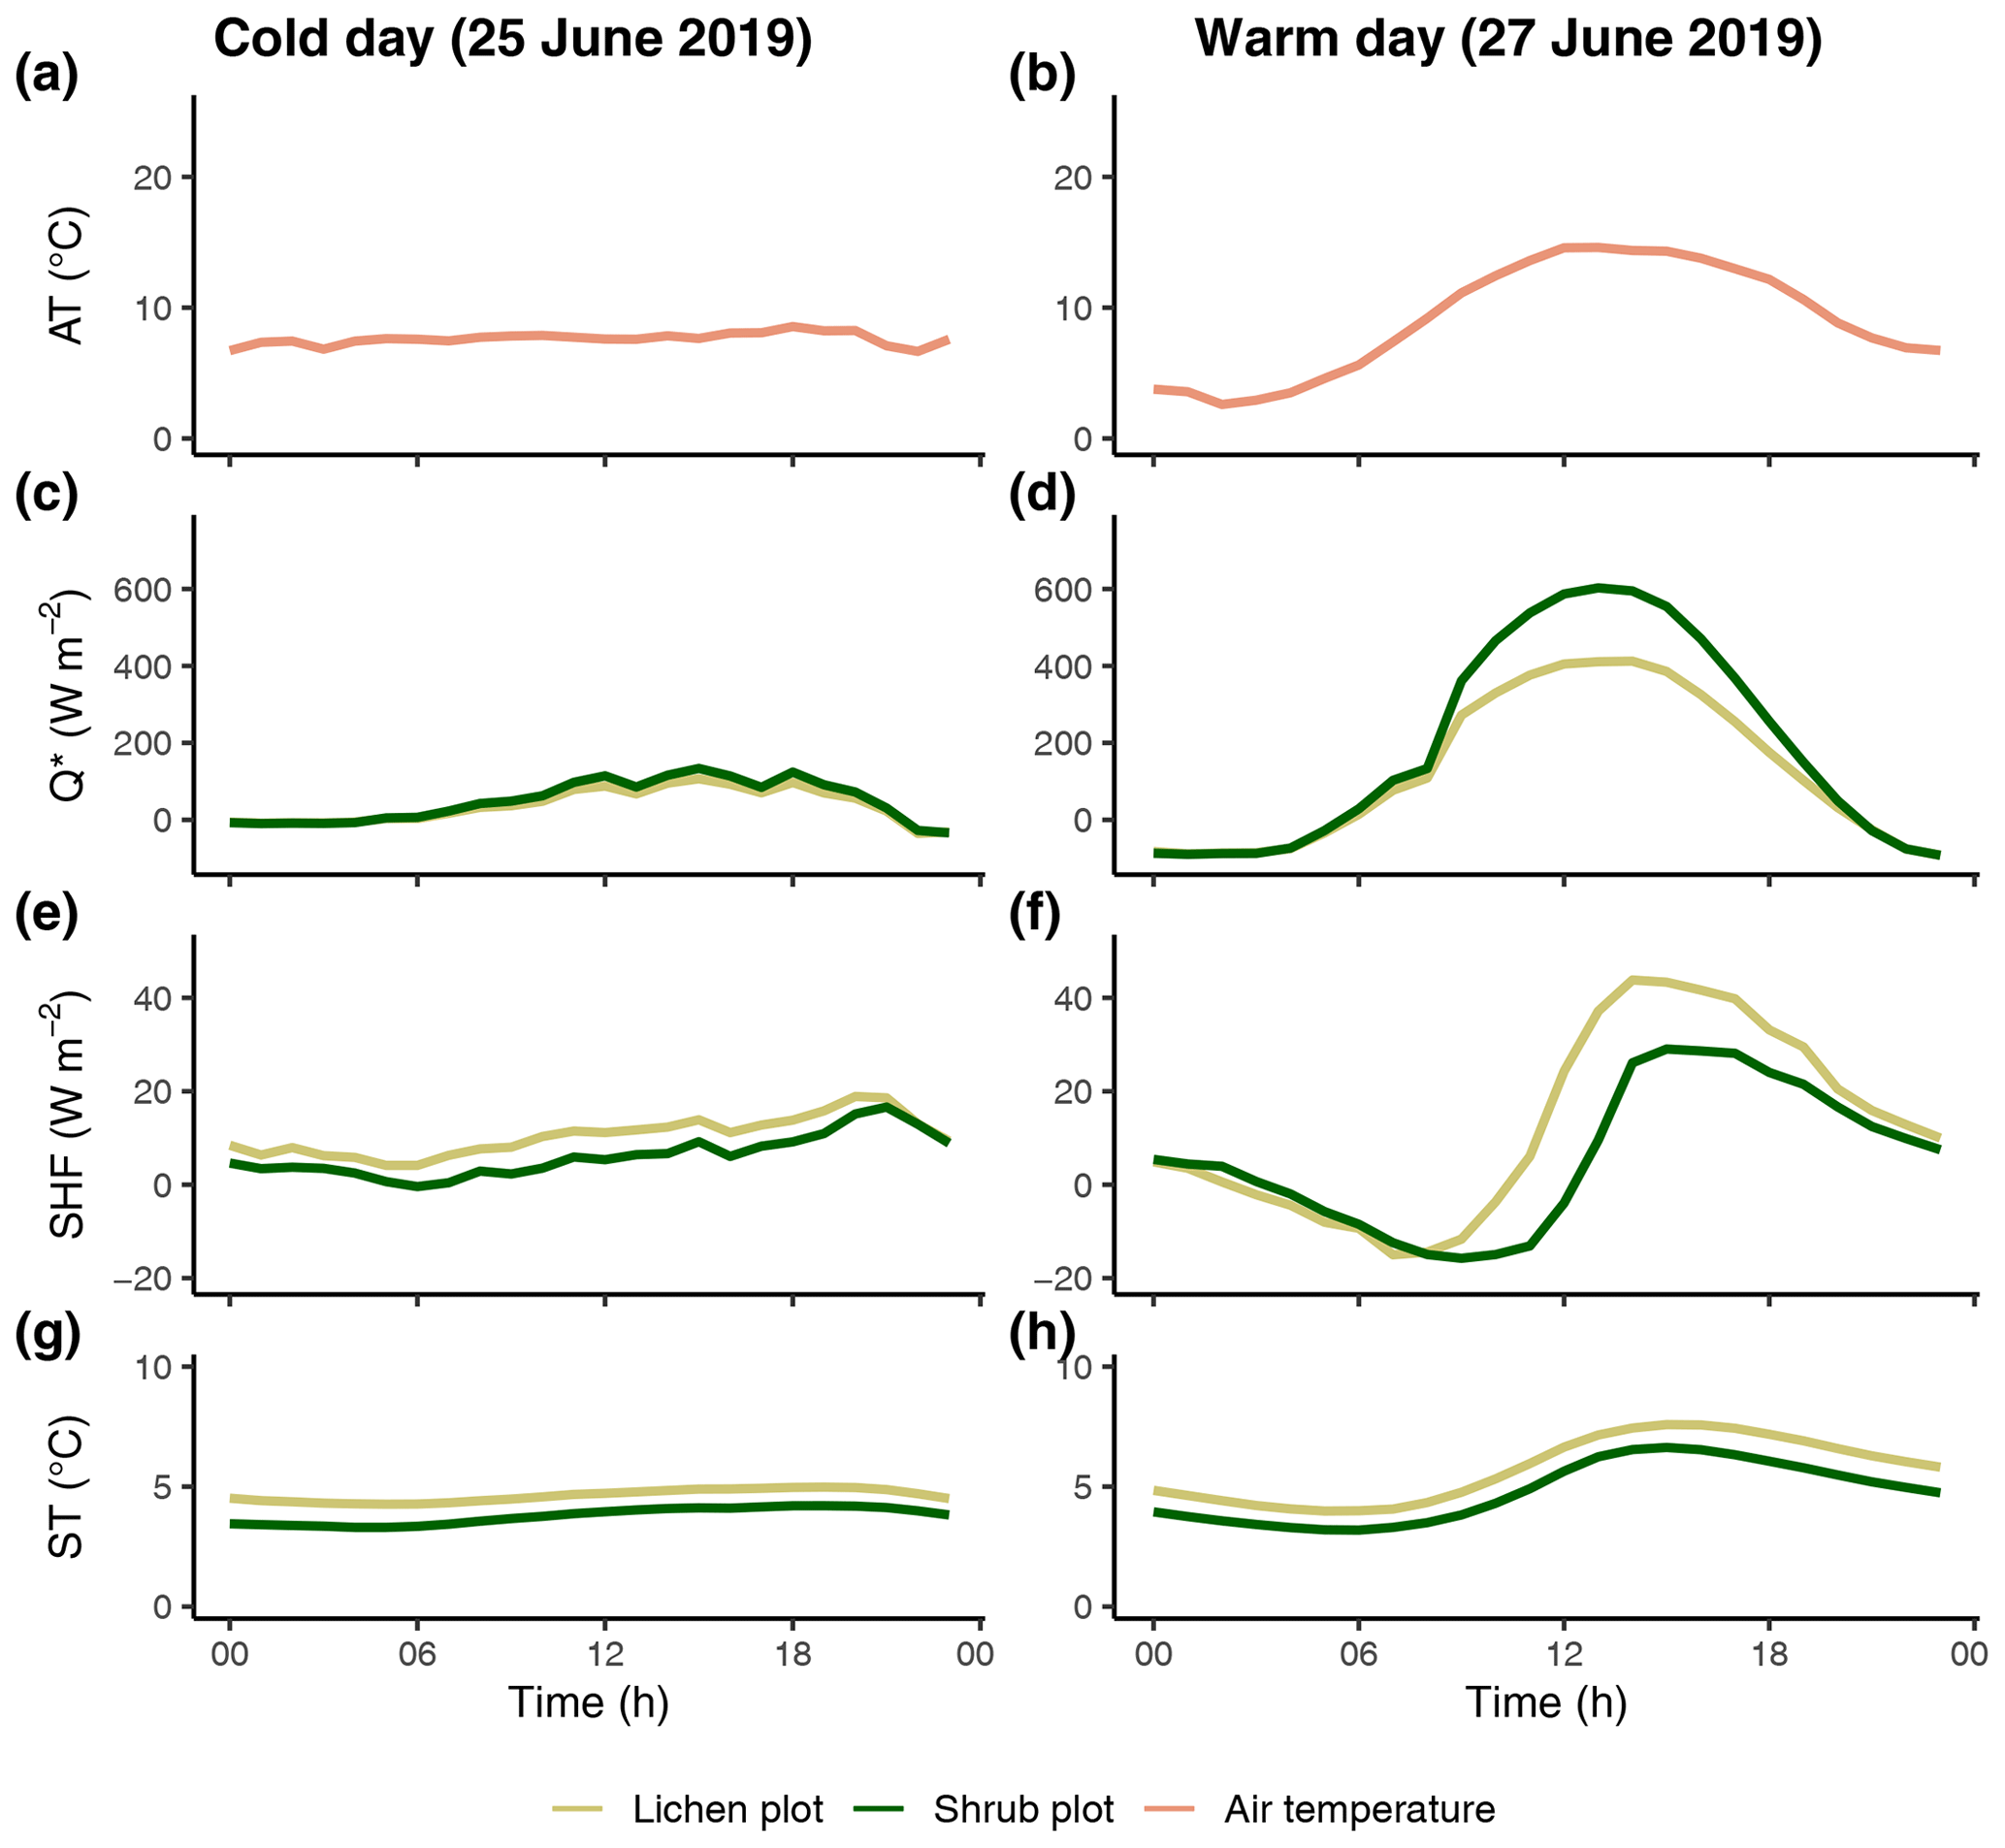
Figure 8The reference air temperature (a, b) and difference in net radiation (c, d), soil heat flux (e, f) and soil temperature (g, h) between one lichen and paired shrub plot during a cold, cloudy day and a warm, sunny day. AT: reference air temperature; Q*: net radiation; SHF: soil heat flux; ST: soil temperature. The same paired plots are used for both days.
The marginally lower LW* for the lichen plots (Fig. 6) is surprising, since it implies that the surface of lichens is warmer than the surface of shrubs. The larger longwave radiation loss of the lichen plots is a result of a larger LWout, since LWin is similar for the paired lichen and shrub plots. Due to the dependence of LWout on the surface temperature following Stefan–Boltzmann's law (Oke, 2002), a larger LWout for the lichen plots suggests a higher surface temperature for the lichen plots, which seems counterintuitive considering the higher albedo of lichens. Moreover, time series of the LWout show that the difference in LWout between lichens and shrubs is made during daytime, while there is no difference during nighttime (Appendix F). This points to additional processes that dominate over the effect of the albedo, showing an opposite effect. Contrasting and counterintuitive results have also been found by previous studies. For example, Stoy et al. (2012) measured a higher surface temperature for the lichen species Cladonia rangiferina than for the moss species Sphagnum fuscum despite the higher albedo of C. rangiferina, while Gauslaa (1984) found a 20 ∘C higher thallus temperature of the dark-colored lichen species Bryocaulon divergens than the light-colored lichen species Alectoria ochroleuca. Parallel to our findings, Gersony et al. (2016) measured with infrared thermography that the leaf temperature of B. nana is lower than for any other species in plots from a range of tundra types located in northern Alaska. A possible explanation could be that a difference in canopy morphology between lichens and shrubs leads to differences in the energy balance (i.e., evapotranspiration; see Sect. 4.2.3, Gersony et al., 2016), but this cannot be concluded from our measurements. The measurements of Loranty et al. (2018b) on evapotranspiration of lichens and shrubs as understory vegetation below a larch forest in northeastern Siberia indicate that shrubs indeed have a higher evapotranspiration and lower surface temperatures than lichens during days with high air temperatures. However, more research including the full energy balance and surface temperature of vegetation is needed to draw a solid conclusion on the dynamics between the albedo and the surface temperature of lichens and other vegetation types.
4.2 Subsurface microclimate
The higher soil heat flux and soil temperature underneath the lichen plots during nearly the entire field season were not in line with our hypothesis. We thus infer that the higher albedo is not generating a cooler subsurface compared to shrubs but that other differences between lichens and shrubs are more determinative. Our results are supported by the study of Mikola et al. (2018), who also found lower soil temperatures below shrub plots than below lichen plots in the Siberian Arctic tundra. In addition, consistent with our results, Loranty et al. (2018b) found that the soil temperature below lichens was higher than the soil temperature below shrubs during the early to middle growing season but that the difference in soil temperature decreased towards the end of the growing season.
We consider three reasons that might lead to a lower soil heat flux and soil temperature below shrubs compared to lichens: (1) differences in the subsurface between lichens and shrubs (i.e., litter layer); (2) shading of the surface underneath the taller shrubs with dense canopy; (3) differences in the energy balance of lichens and shrubs. In the following sections we will discuss how these three reasons might have affected our measurements.
4.2.1 Litter layer
A difference in the subsurface between the lichen and shrub plots could lead to differences in the thermal properties (e.g., thermal conductivity, heat capacity) of the subsurface (Abu-Hamdeh and Reeder, 2000; Oke, 2002), which can in turn affect the soil heat flux and soil temperature. Since we did not find a difference in several mineral soil properties or a difference in soil moisture between the lichen and the shrub plots (Fig. 3), it is unlikely that differences in the mineral soil initiated the higher soil heat flux and soil temperature below lichens. However, we did find a large difference in litter layer thickness below lichens and shrubs. This organic litter layer contains, among others, dead leaves and roots and has a low thermal conductivity (Abu-Hamdeh and Reeder, 2000). Due to this low conductivity, the litter layer has an insulating effect on the mineral soil underneath and is likely to lead to a lower soil heat flux and soil temperature below shrubs (Beringer et al., 2001). Only some studies have addressed the insulating capacity of litter in the field (Beringer et al., 2001; Barrere et al., 2017). For example, Barrere et al. (2017) measured a thermal conductivity of 1.36 W m−1 K−1 for an Arctic soil and 0.19 W m−1 K−1 for a dry litter layer from shrubs in the Canadian Arctic and simulated that this litter layer decreased the summer soil temperature considerably. The insulating properties of litter might be of specific interest for our study, since the thermal conductivity mainly depends on moisture availability (De Vries, 1963; Ochsner et al., 2001; Oke, 2002). Since our measurements were conducted during a relatively dry summer, the thermal conductivity of the litter might be even lower than during a normal summer, and therefore the insulating effect might have been amplified.
The insulating properties of litter can potentially also explain the smaller daily amplitude and delay in maximum and minimum for the soil heat flux and soil temperature below shrubs (Appendix E). It appears that the soil below lichens gains and loses heat much easier than the soil below shrubs and that the soil temperature below lichens is more strongly coupled with the air temperature than the soil temperature below shrubs. Figure 5c also indicates a stronger relationship between soil and air temperature at the lichen plots than at the shrubs plots.
4.2.2 Shading by the shrub canopy
A second reason that we consider likely to cause the lower soil heat flux and soil temperature below shrubs compared to lichens is the shading effect of the subsurface by the shrub canopy. Loranty et al. (2018a) state that the amount of energy available for the soil heat flux depends, among others, on the thermal gradient between the ground surface and the underlying soil. They advocate that the temperature of the ground surface, which includes only ground-cover vegetation such as lichens and mosses, is a better variable than the temperature of the land surface, which includes tall overlying vegetation canopies, since it is the ground-cover vegetation that is in direct contact with the underlying soil. It is plausible that the ground surface temperature in our lichen plots was higher than the ground surface temperature in our shrub plots due to shading of Betula nana on the ground-cover vegetation in the shrub plots. Therefore the thermal gradient between the ground-cover vegetation and the soil was likely to be larger in our lichen plots, and this led subsequently to a higher soil heat flux.
Multiple studies have addressed the shading effect of shrub canopies (Bewley et al., 2007; Juszak et al., 2014; Williams et al., 2014; Juszak et al., 2016). Juszak et al. (2016) measured an average growing season transmittance of only 0.36 below Betula nana. Moreover, multiple studies have also measured the impact of this shading on the soil microclimate below shrubs (Blok et al., 2010, 2011; Myers-Smith and Hik, 2013; Juszak et al., 2016). Blok et al. (2010) measured a lower QG below Betula nana plots with a dense canopy compared to plots where the canopy was removed, despite a higher net radiation for the plots with a dense canopy. This low QG led to a decrease in active layer thickness below the plots with a dense canopy. Also, Myers-Smith and Hik (2013) found a 2 ∘C lower soil temperature below shrub plots compared to open tundra plots due to shading of the shrub canopy. The above-mentioned studies show the possibility that shading by shrubs can cause a lower soil heat flux and soil temperature, and this might therefore have led to a higher soil heat flux and soil temperature below our lichen plots compared to our shrub plots.
4.2.3 Energy balance
A third reason for the unexpected results that we consider is that a larger part of the net radiation of the shrub plots is used for evapotranspiration compared to the lichen plots, and therefore a smaller fraction of net radiation is left to heat the soil. The net radiation that is available at the earth surface is usually partitioned over three components (Eq. 4) (Oke, 2002):
in which QH is the energy that is used to heat up the atmosphere (sensible heat flux), QE is the energy that is used for evapotranspiration (latent heat flux), and QG is the energy that penetrates into the soil (soil heat flux). Since lichens do not have roots, they will not take up water actively from the soil and transpire back in the atmosphere. Therefore, the latent heat flux over a lichen canopy is solely dependent on evaporation and is relatively low. This is in contrast to shrub vegetation that does take up and transpire water actively. The latent heat flux of shrubs is the sum of evaporation and transpiration and can thus be expected to be relatively high.
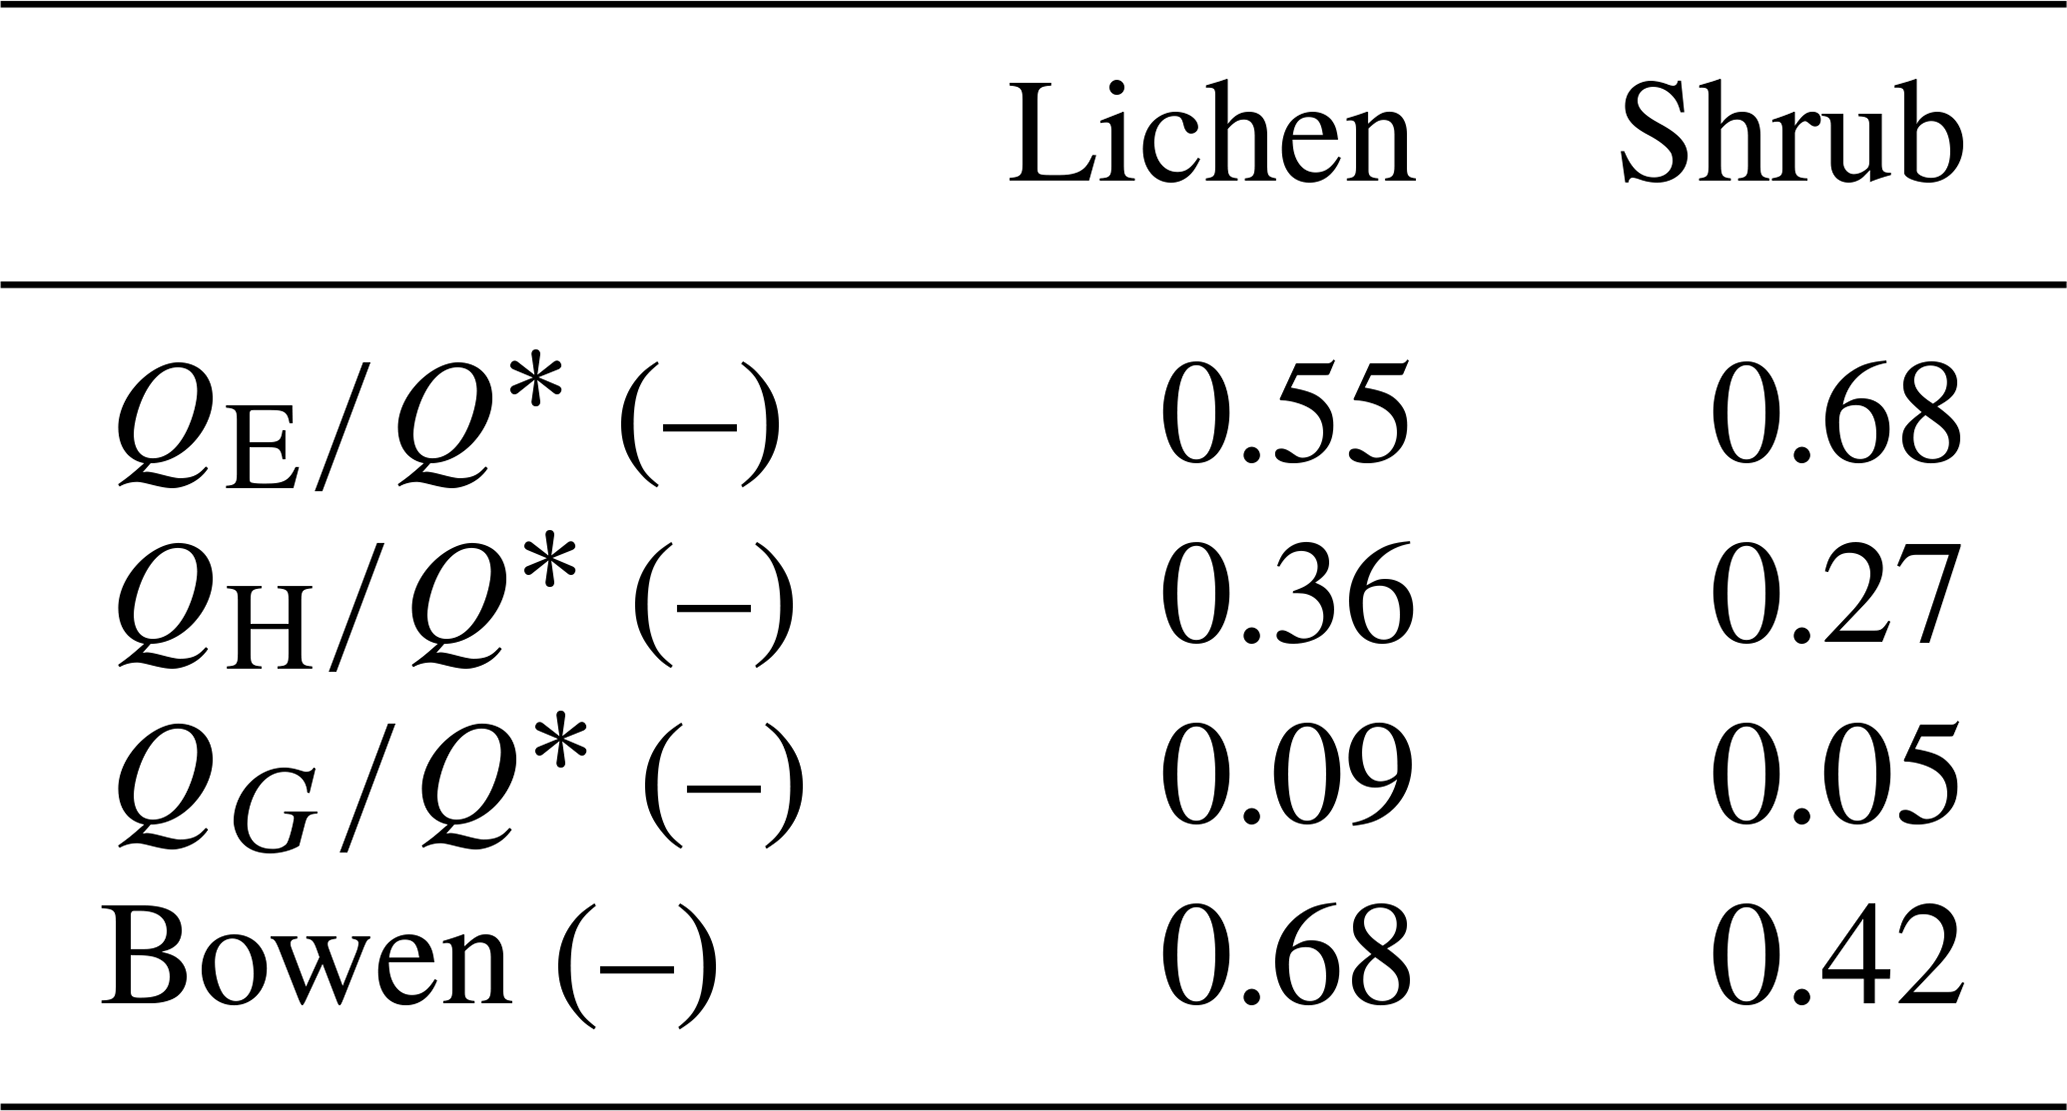
To verify that a larger part of the available energy is used for QE of our shrub plots compared to our lichen plots, we estimated QE of the plots measured in 2019 in a similar way as Eaton et al. (2001), using the formula of Priestley and Taylor (1972). Table 3 shows how the net radiation is partitioned over the three fluxes in our plots (see Appendix G for calculations and additional results). These values imply that shrubs do use a larger part of the net radiation for evapotranspiration than lichens. The fraction of 0.55 for our lichen plots is close to the 0.49 found by both Eaton et al. (2001) and Boudreau and Rouse (1995) for a lichen-heath tundra. Moreover, the Bowen ratios fall within the range of low Arctic upland tundra and low Arctic shrub tundra reported by Eugster et al. (2000). Multiple other studies have found a higher for shrub tundra compared to shrub-free tundra heaths (McFadden et al., 1998; Eugster et al., 2000), even though their tundra heaths consisted of less lichens than our study. Moreover, Sabater et al. (2020) measured that lichens have less evapotranspiration than shrubs, when both vegetation types are part of the understory vegetation of a mountain birch forest. Loranty et al. (2018b) measured that the evapotranspiration of shrubs below a larch forest was substantially higher than lichens during a warm day when the photosynthetically active radiation was high. Considering these studies, we infer that the relatively high latent heat flux for our shrub plots is also a potential reason for their lower soil heat flux and soil temperature compared to our lichen plots. In addition, the lower for the shrub plots could be an explanation for the lower LWout and inferred lower surface temperature of the shrub plots compared to the lichen plots (see Sect. 4.1). Moreover, this lower LWout of the shrub canopy might affect the energy balance and lower the temperature of the ground surface below the shrub canopy, as has been shown by studies that assessed the radiation balance and energy partitioning in boreal and montane forests (Webster et al., 2017; Todt et al., 2018). However, this mechanism has not been studied yet in shrub tundra, and it is unclear if this plays a role in the difference in the subsurface microclimate between lichens and shrubs. Therefore, detailed measurements on the complete energy balance of lichens and shrubs are needed to confirm the partitioning of the net radiation over the three heat fluxes.
Table 3The average partitioning of net radiation over the three fluxes and the average Bowen ratio () for the three paired lichen and shrub plots of 2019. See Appendix G for the calculation and additional results.
4.3 Synthesis
It is not possible from our study to conclude if one or more of the proposed reasons lead to the lower soil heat flux and soil temperature below shrubs compared to lichens. Considering the delay in maximum and minimum soil heat flux and the lower daily amplitude of the soil heat flux and soil temperature below shrubs (Appendix E), it is likely that the litter layer below the shrubs plays an important role, since the other two proposed reasons would not generate this effect. However, additional measurements are needed to give a solid conclusion. Nevertheless, our study does show that the high albedo of lichens is not leading to lower soil temperatures below lichens than below shrubs during the growing season. Since recent studies have shown that differences in color, and therefore albedo, did not even cause a difference in soil temperature between lichen species (Nystuen et al., 2019; Van Zuijlen et al., 2020), it is unlikely that albedo is an important factor determining the difference in soil temperature between the two different vegetation types. Instead, the marked differences in canopy structure between lichens and shrubs are a more essential factor.
Our study shows that a shift from lichens to shrubs decreases the summer soil temperature, while other studies showed that shrub expansion can lead to higher winter soil temperatures, since the shrub canopy is trapping snow that insulates the soil (Sturm et al., 2001a; Myers-Smith and Hik, 2013). As a result, a shift from lichen heaths to shrub vegetation leads to lower soil temperature fluctuations during the course of a year. The change in fluctuation will be even more distinct with a shift from lichen heaths to shrub vegetation than with a shift from a general Arctic tundra towards shrub vegetation. The reason for this is that lichen heaths occur mainly on areas with shallow or missing snow cover, which are characterized by low winter soil temperatures (Odland and Munkejord, 2008; Sundstøl and Odland, 2017). In addition, a shift towards shrubs might have important consequences for permafrost, soil microbial activity and carbon storage due to a changing soil temperature (Myers-Smith et al., 2011; Loranty et al., 2018a). Therefore, these consequence might be more distinct when the initial vegetation stage includes a large abundance of lichens, since the soil temperature change is larger.
Multiple studies have discussed the cooling capacity of lichens on the underlying soil and have argued that this cooling capacity is a result of their high albedo and the insulating properties of lichens due to their low conductivity. However, most studies measured or modeled lower soil temperatures below lichens in relation to bare soil or disturbed lichens (Beringer et al., 2001; Gold et al., 2001; Porada et al., 2016; Nystuen et al., 2019; Van Zuijlen et al., 2020), but the comparison with another vegetation type has rarely been made. Our study shows that the cooling capacity of lichens does not lead to a lower soil temperature compared to shrubs. In addition, Van Zuijlen et al. (2020) concluded that the difference in soil microclimate between lichen species is not driven by the color of lichen species but by lichen mat morphology. Therefore, our study and the study of Van Zuijlen et al. (2020) imply that the insulating capacity of lichens is a much more important factor determining the soil temperature than the high albedo.
Although the high albedo of lichens does not have a cooling effect on the subsurface, it will have a cooling effect on the atmosphere. Since lichens might continue to decrease in abundance due to shrub expansion, it is important to estimate the impact of such a shift on regional and possibly global climate. We measured an average increase in atmospheric heating of 3.35 MJ d−1 during the growing season with every square meter of lichen that turns into shrub. This value is, among others, dependent on the incoming solar radiation and can therefore change with latitude and day of the year. Modeling studies should use our measurements to estimate the impact of the loss of lichen cover on the climate over alpine and Arctic areas. Lichen heaths are often not incorporated in land surface models or are clumped together with mosses, despite their distinct characteristics (Stoy et al., 2012; Wullschleger et al., 2014; Porada et al., 2016). Therefore, the effect of the high albedo of lichens on the radiation balance might be underestimated in these models. With a thorough estimation of the distribution of lichens over the Arctic, our study can help to develop a first version of lichen heaths as a separate plant functional type in land surface models.
Even though our measurements were conducted on one study site and a large part of our analysis was based on measurements from a warm and dry year, we consider that our conclusions are representative for other alpine sites and sites across the Arctic. The dry and warm field season of 2018 might have amplified the difference in microclimatic conditions between lichens and shrubs. However, several studies across the Arctic or studies conducted in boreal forests reported similar results as in our study concerning the difference in microclimatic conditions between lichens and shrubs (Loranty et al., 2018b; Mikola et al., 2018; Grünberg et al., 2020). Moreover, the expansion of shrubs in general is associated with higher summer soil temperatures and atmospheric heating (Myers-Smith et al., 2011).
We compared the lichen-dominated plots with plots dominated by B. nana, but other shrub species lead to a decline of lichens as well (Moffat et al., 2016; Chagnon and Boudreau, 2019), since this decline is attributed to an increased competition of light (Cornelissen et al., 2001; Walker et al., 2006; Elmendorf et al., 2012). Other shrub species also cause lower soil temperatures. For example, Frost et al. (2018) found that alder (Alnus viridis ssp. fruticosa) cooled the soil by up to 9 ∘C compared to open tundra. In addition, shrub species that will grow taller than B. nana might affect the (micro) climate even more (Bonfils et al., 2012; Lafleur and Humphreys, 2018). Therefore, we think that our results would have been similar or even more pronounced if we had studied a shrub species other than B. nana.
Our study shows that lichens have a lower net radiation than shrubs during the growing season. In addition, we show that the soil underneath the lichens has a higher soil temperature and a higher soil heat flux than the soil below shrubs, especially during warm days. This implies that the relatively high albedo of lichens affects the radiation balance but not the subsurface microclimate. Potential reasons for this could be the thicker litter layer, shading by the canopy or more evapotranspiration in the shrub plots. We conclude that the decline of lichens due to shrub expansion will lead to atmospheric heating (i.e., higher latent + sensible heat flux) but has a cooling effect on the subsurface during the growing season. Future studies should focus on the quantification of the effect of lichen decline on the climate on a regional and possibly on the scale of the Arctic.
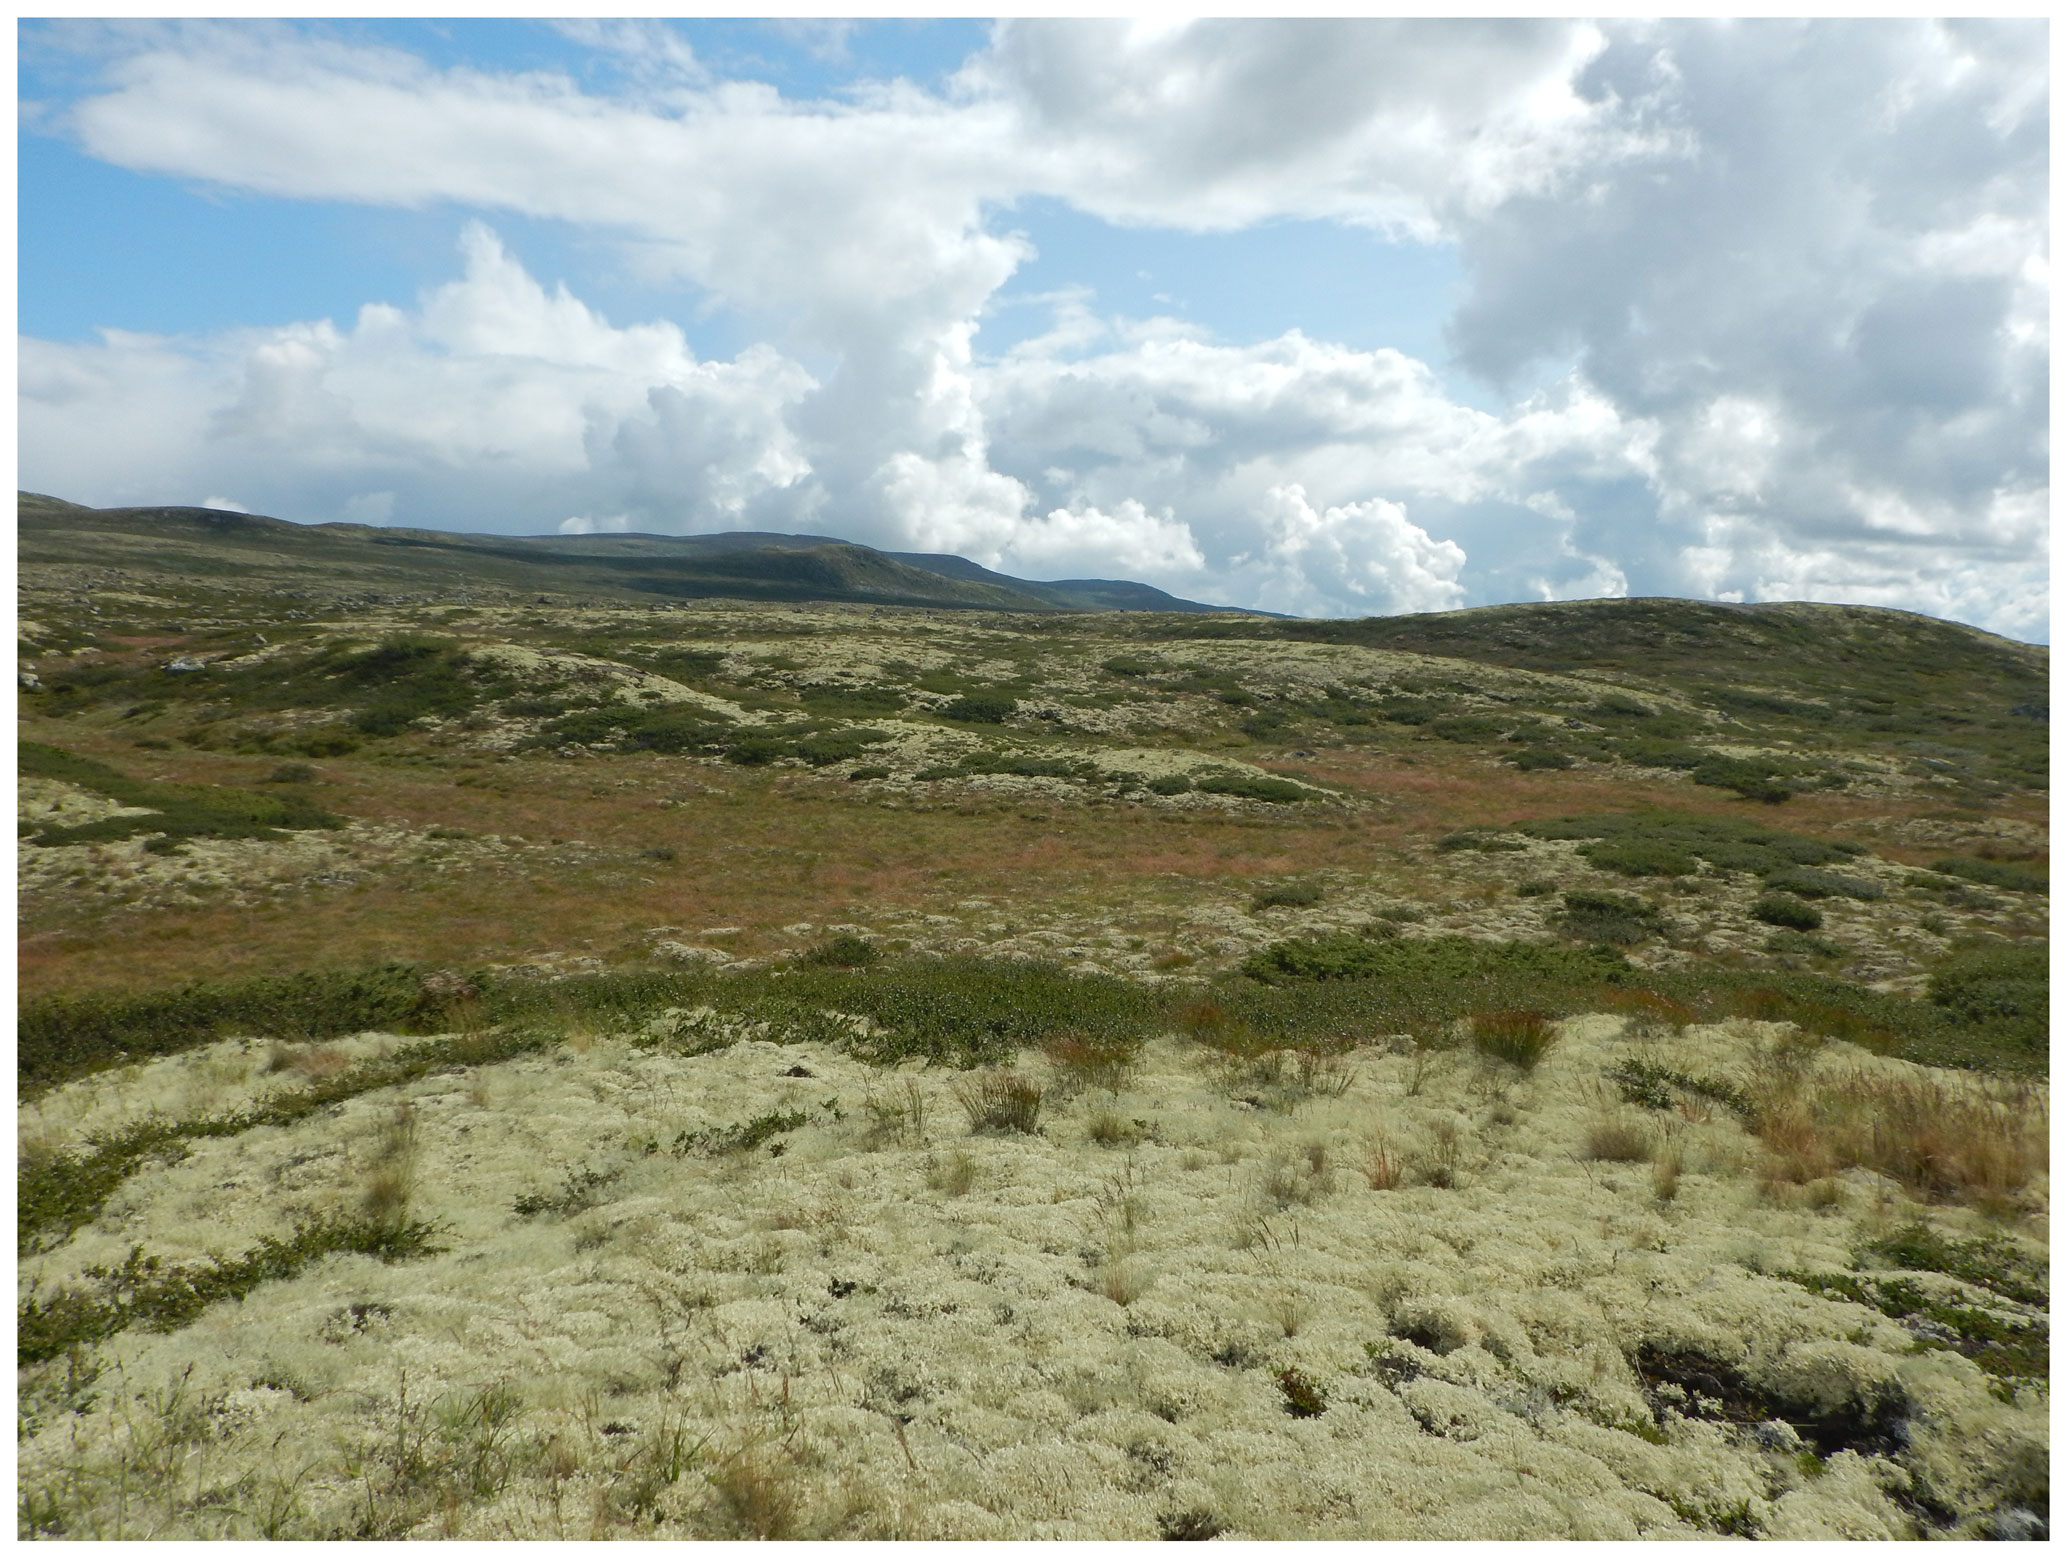
Figure A1Picture of the study area. Lichen heaths are mainly located on the windswept ridgetops, while shrubs are located on the midslopes and ridgetops.
Table B1Sensors of the HOBO RX 3000 remote weather station that was used during the field season of 2019.
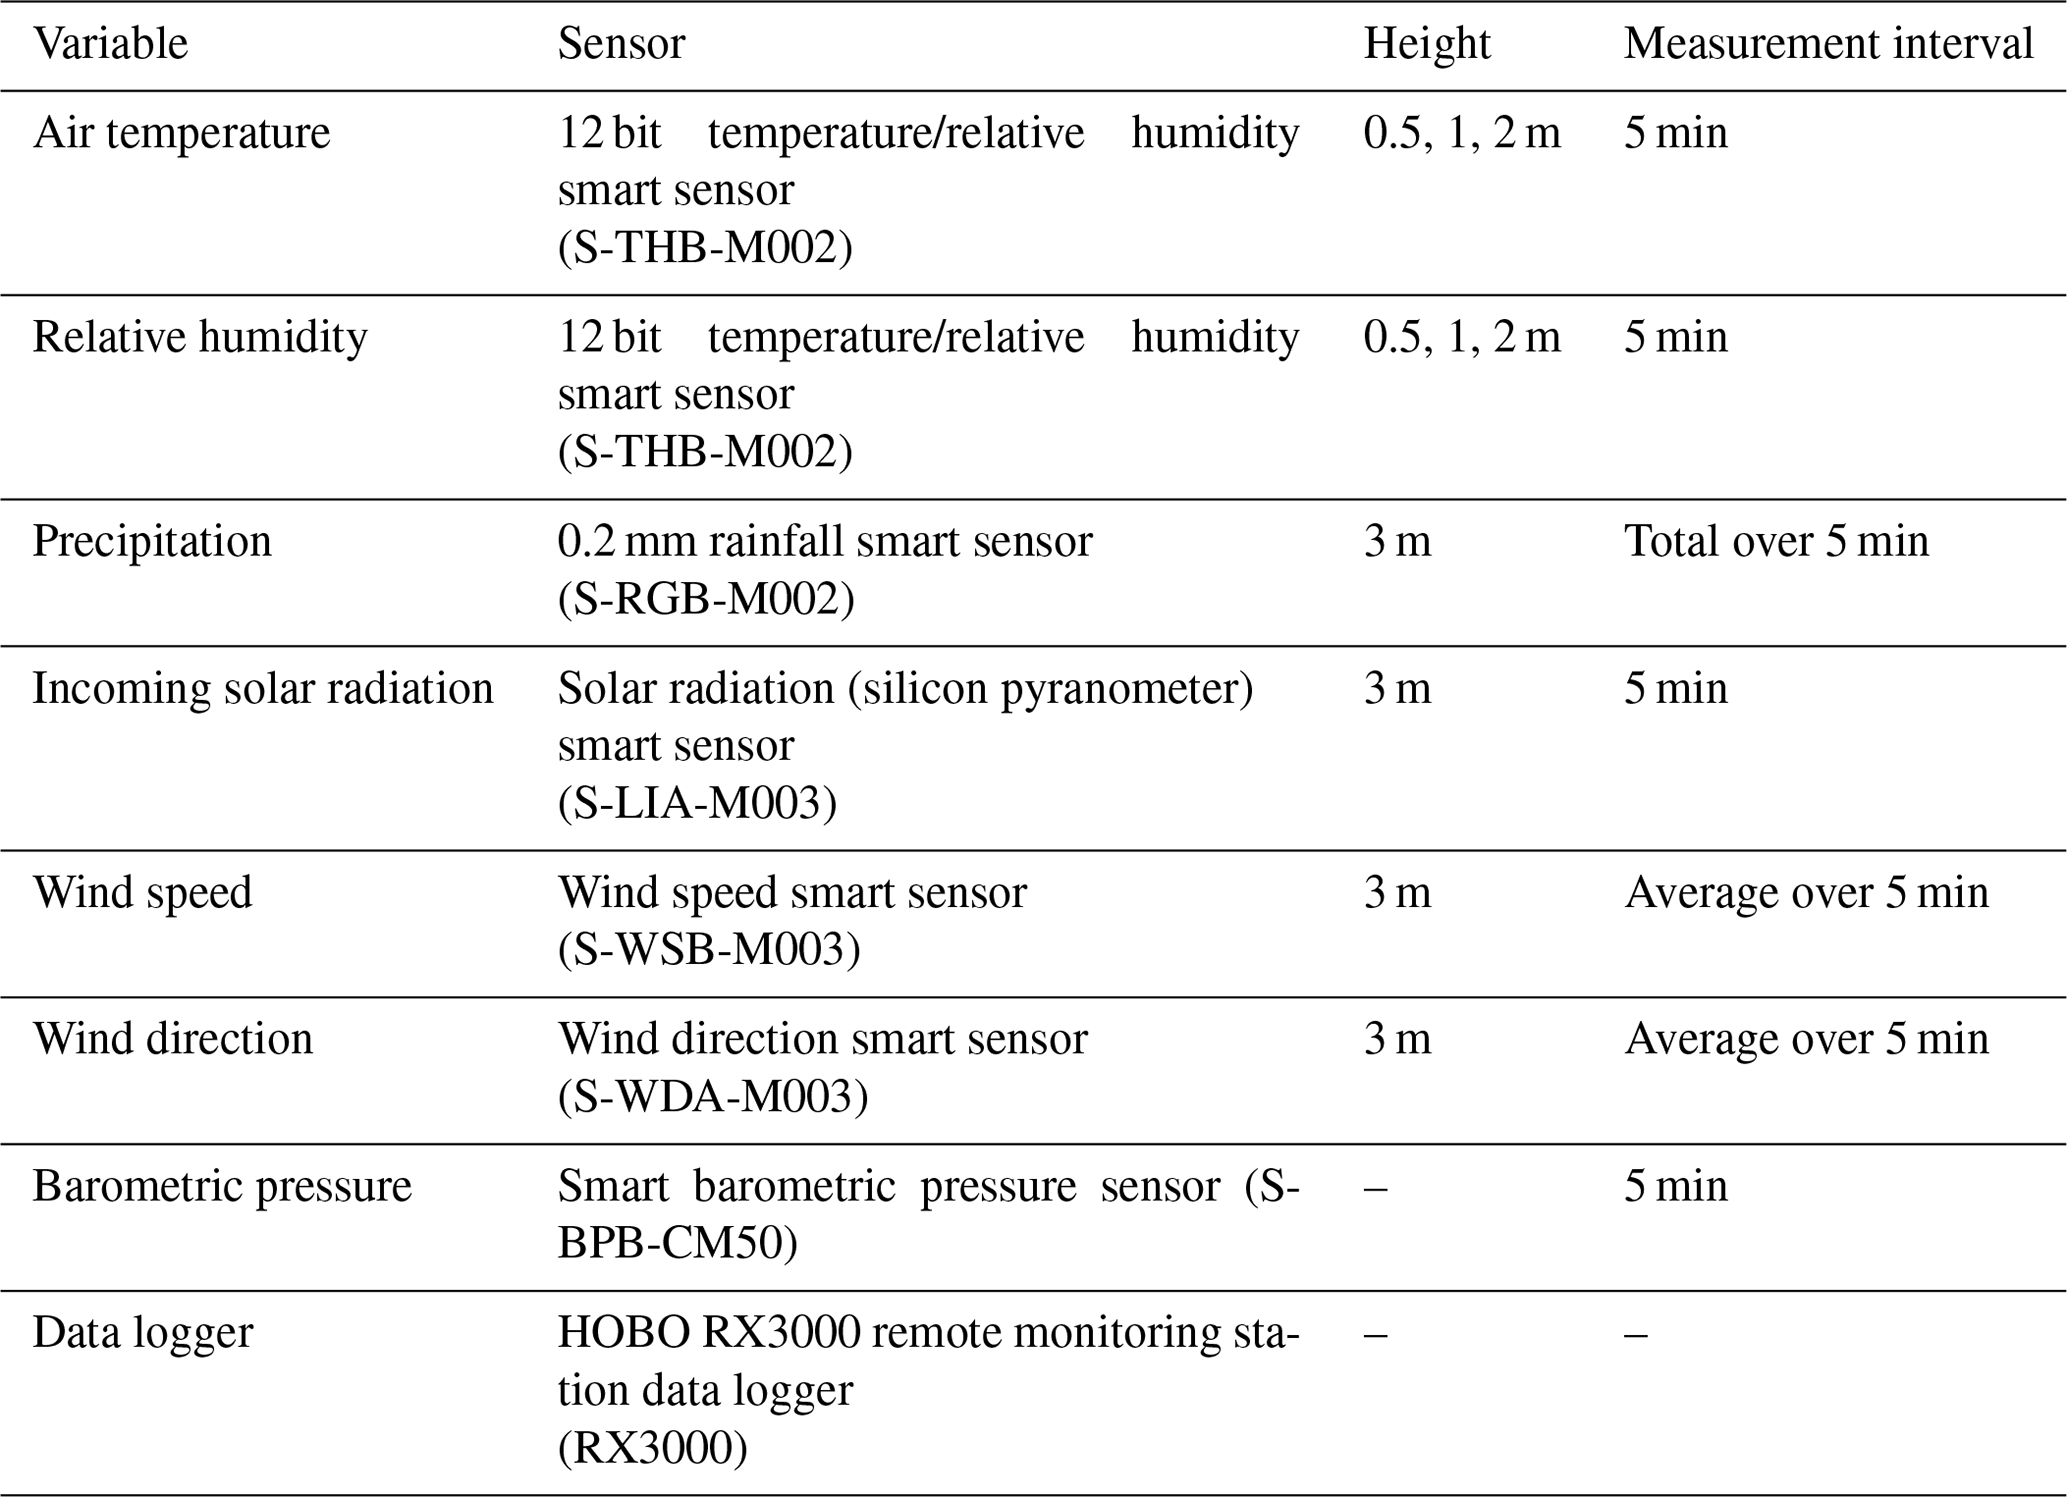
Table C1Results of the linear mixed models for the effect of vegetation type and air temperature on the daytime total net radiation, the daytime total soil heat flux, the daytime average soil temperature and the daytime average soil moisture. Statistically significant effects (p<0.05) are indicated in bold. indicates the variation explained by the fixed effects, and indicates the variation explained by the entire model. See Fig. 7 for a visualization of the models.
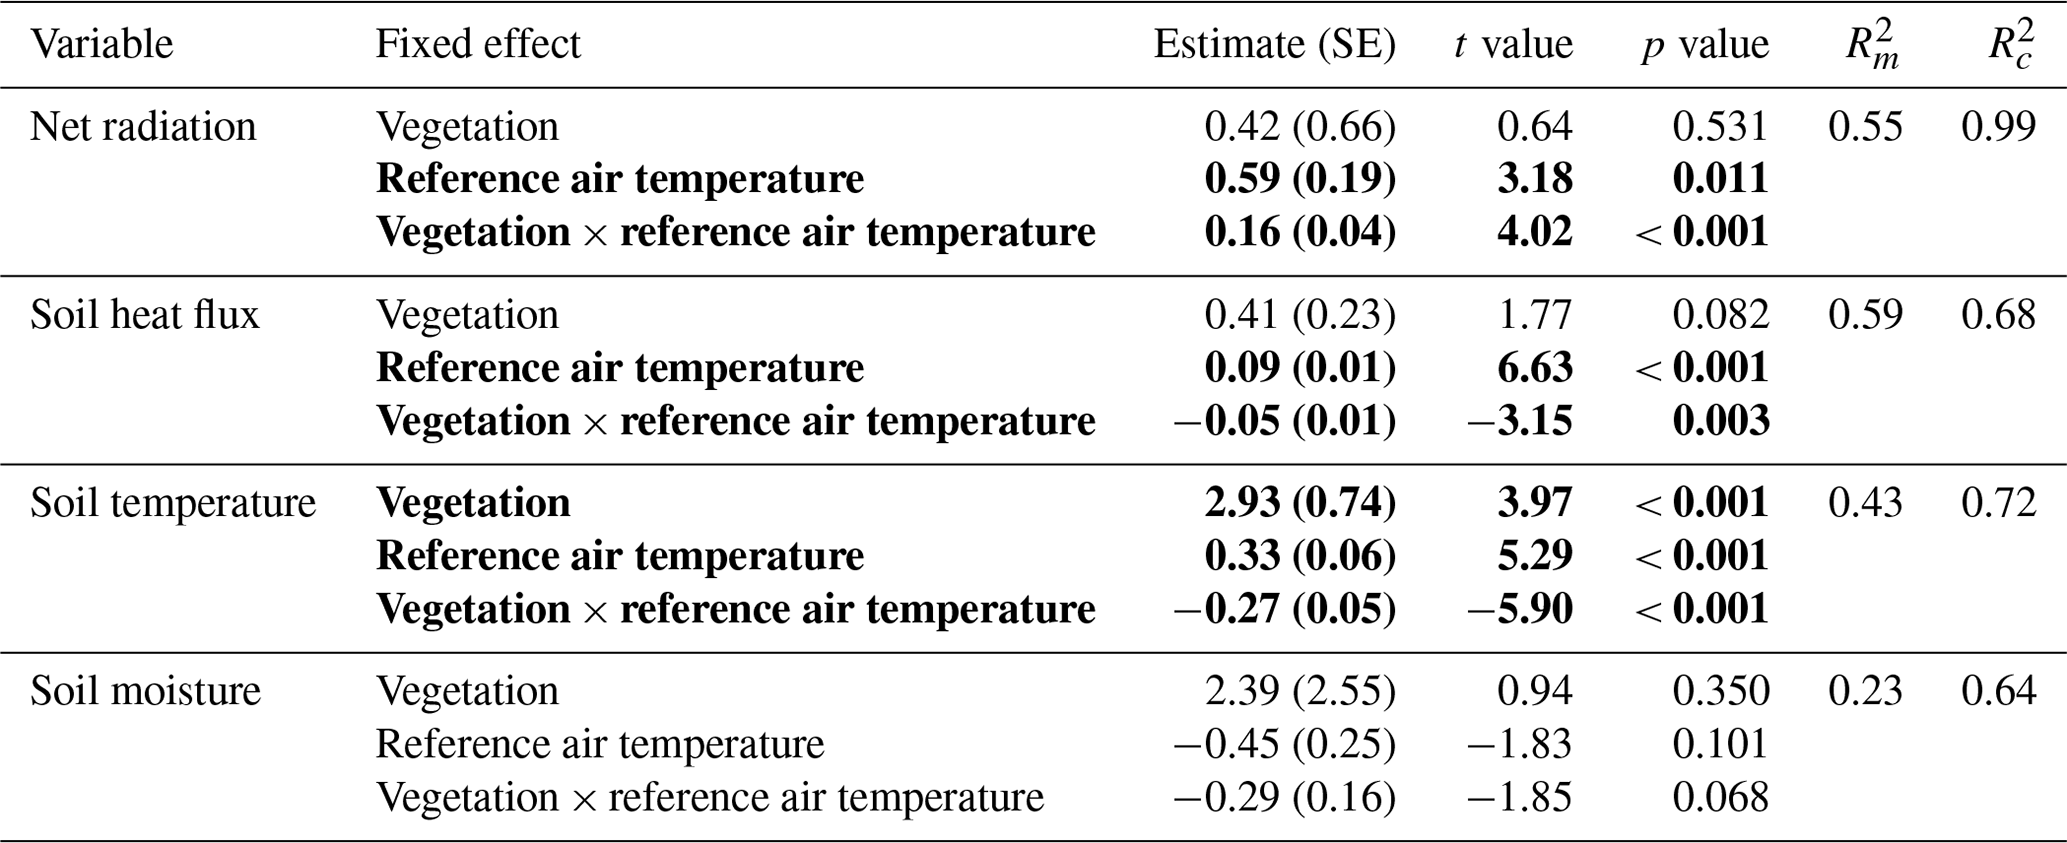
Table C2Results of the linear mixed models for the effect of vegetation type and air temperature on the nighttime total net radiation, the nighttime total soil heat flux, the nighttime average soil temperature and the nighttime average soil moisture. Statistically significant effects (p<0.05) are indicated in bold. indicates the variation explained by the fixed effects, and indicates the variation explained by the entire model. See Fig. 7 for a visualization of the models.
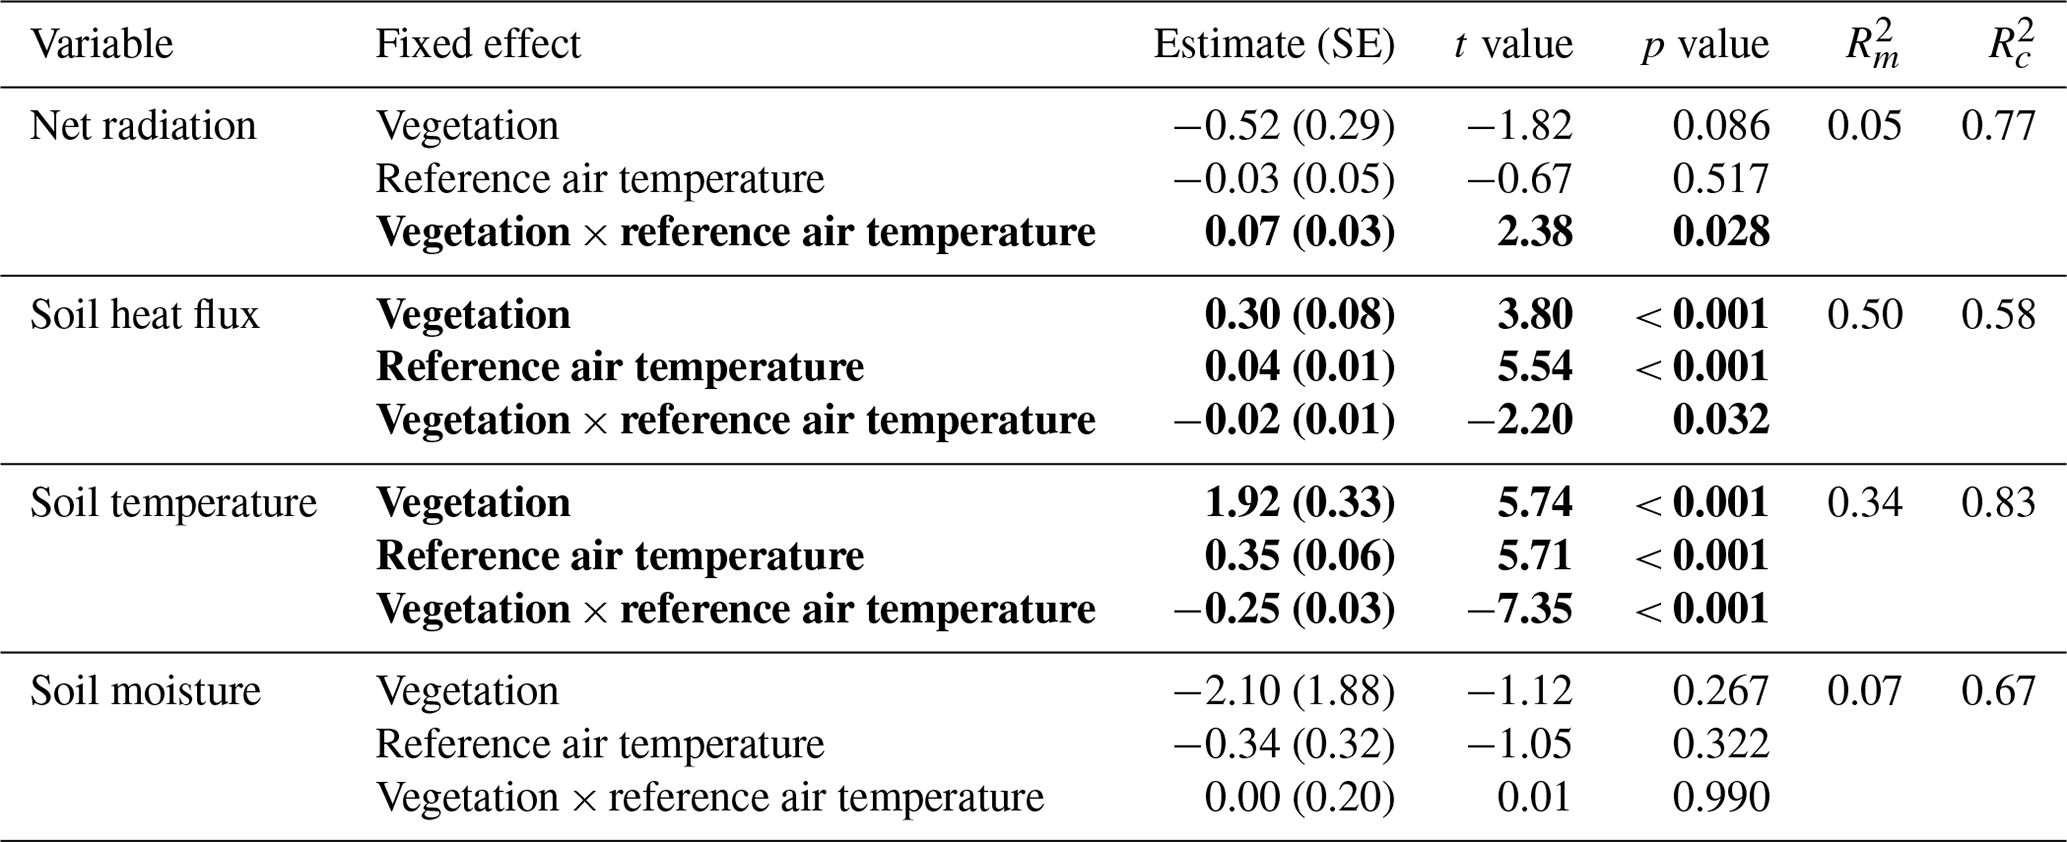
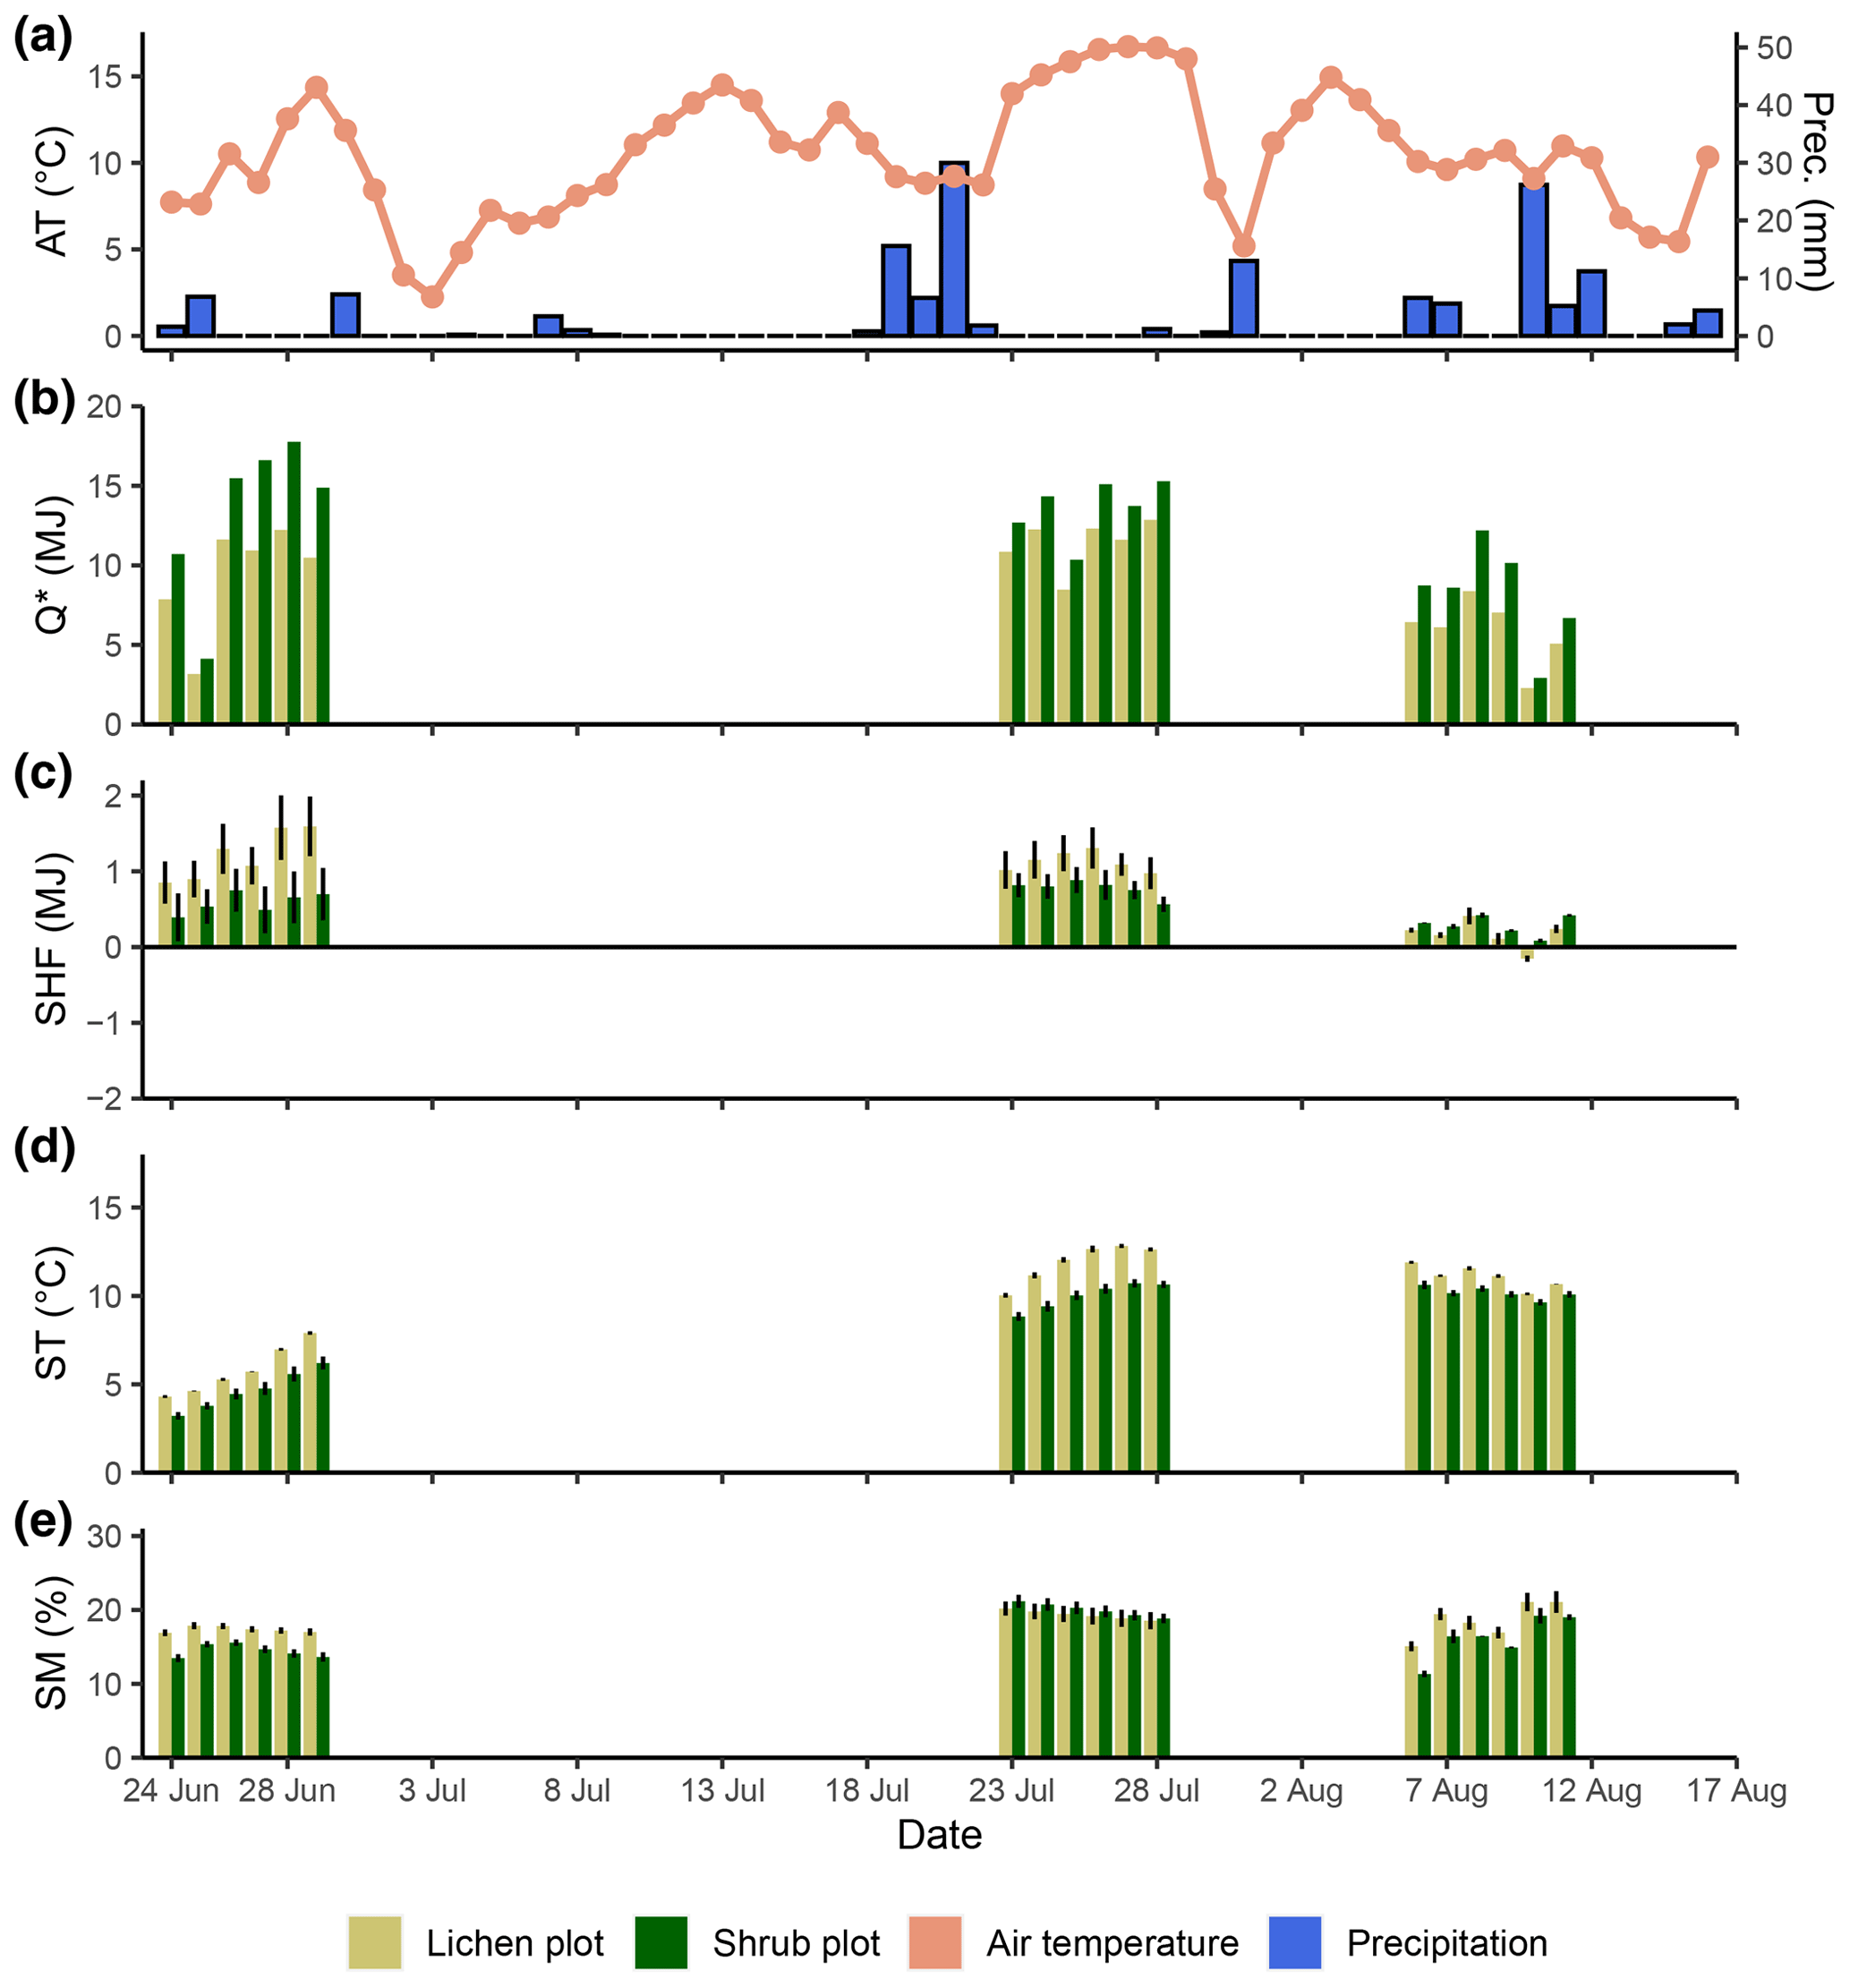
Figure D1Daily measurements during the field season of 2019 for the background weather conditions (air temperature and precipitation) (a), net radiation (b), soil heat flux (c), soil temperature (d) and soil moisture (e). Every day is divided into the lichen and corresponding shrub plot for graphs (b), (c), (d) and (e). For ease of display, we calculated averages per plot for the soil heat flux (n=2), soil temperature (n=3) and soil moisture (n=3). Error bars display minimum and maximum values for soil heat flux and standard errors for soil temperature and soil moisture.
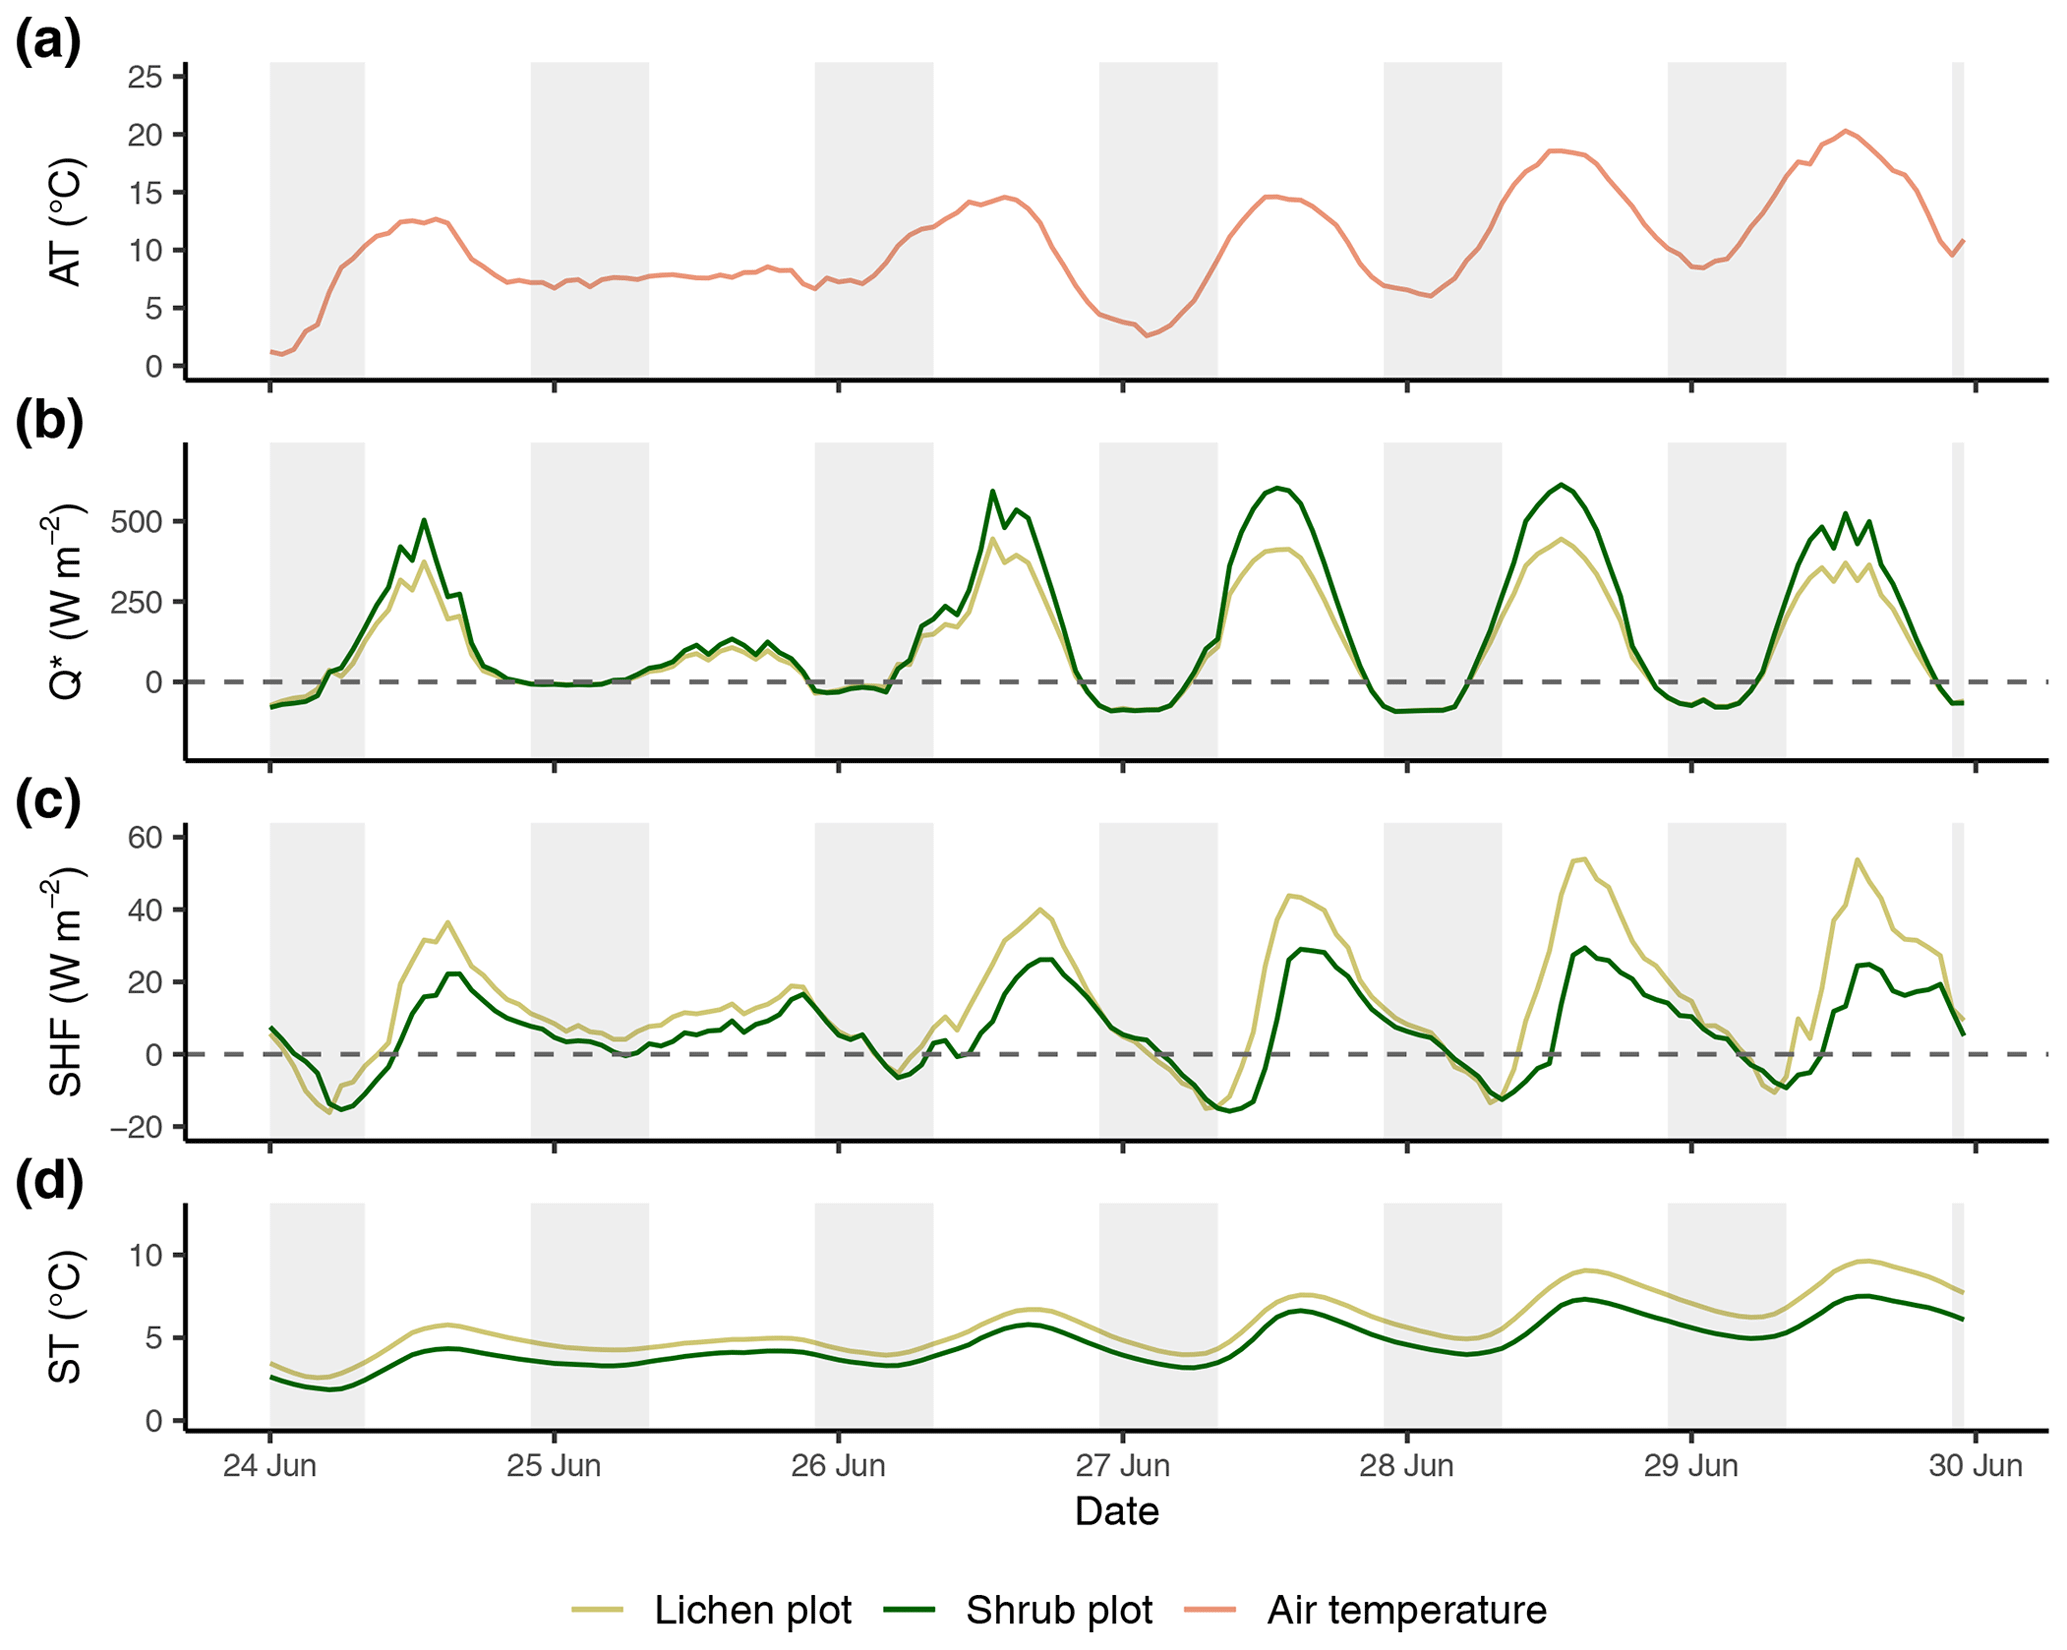
Figure E1Time series of the reference air temperature (a), net radiation (b), soil heat flux (c) and soil temperature (d) of the first set of paired plots of the field season of 2019. Time series are constructed with hourly averages. Shaded areas indicate nighttime (22:00–08:00 LT). AT: reference air temperature; Q*: net radiation; SHF: soil heat flux; ST: soil temperature.
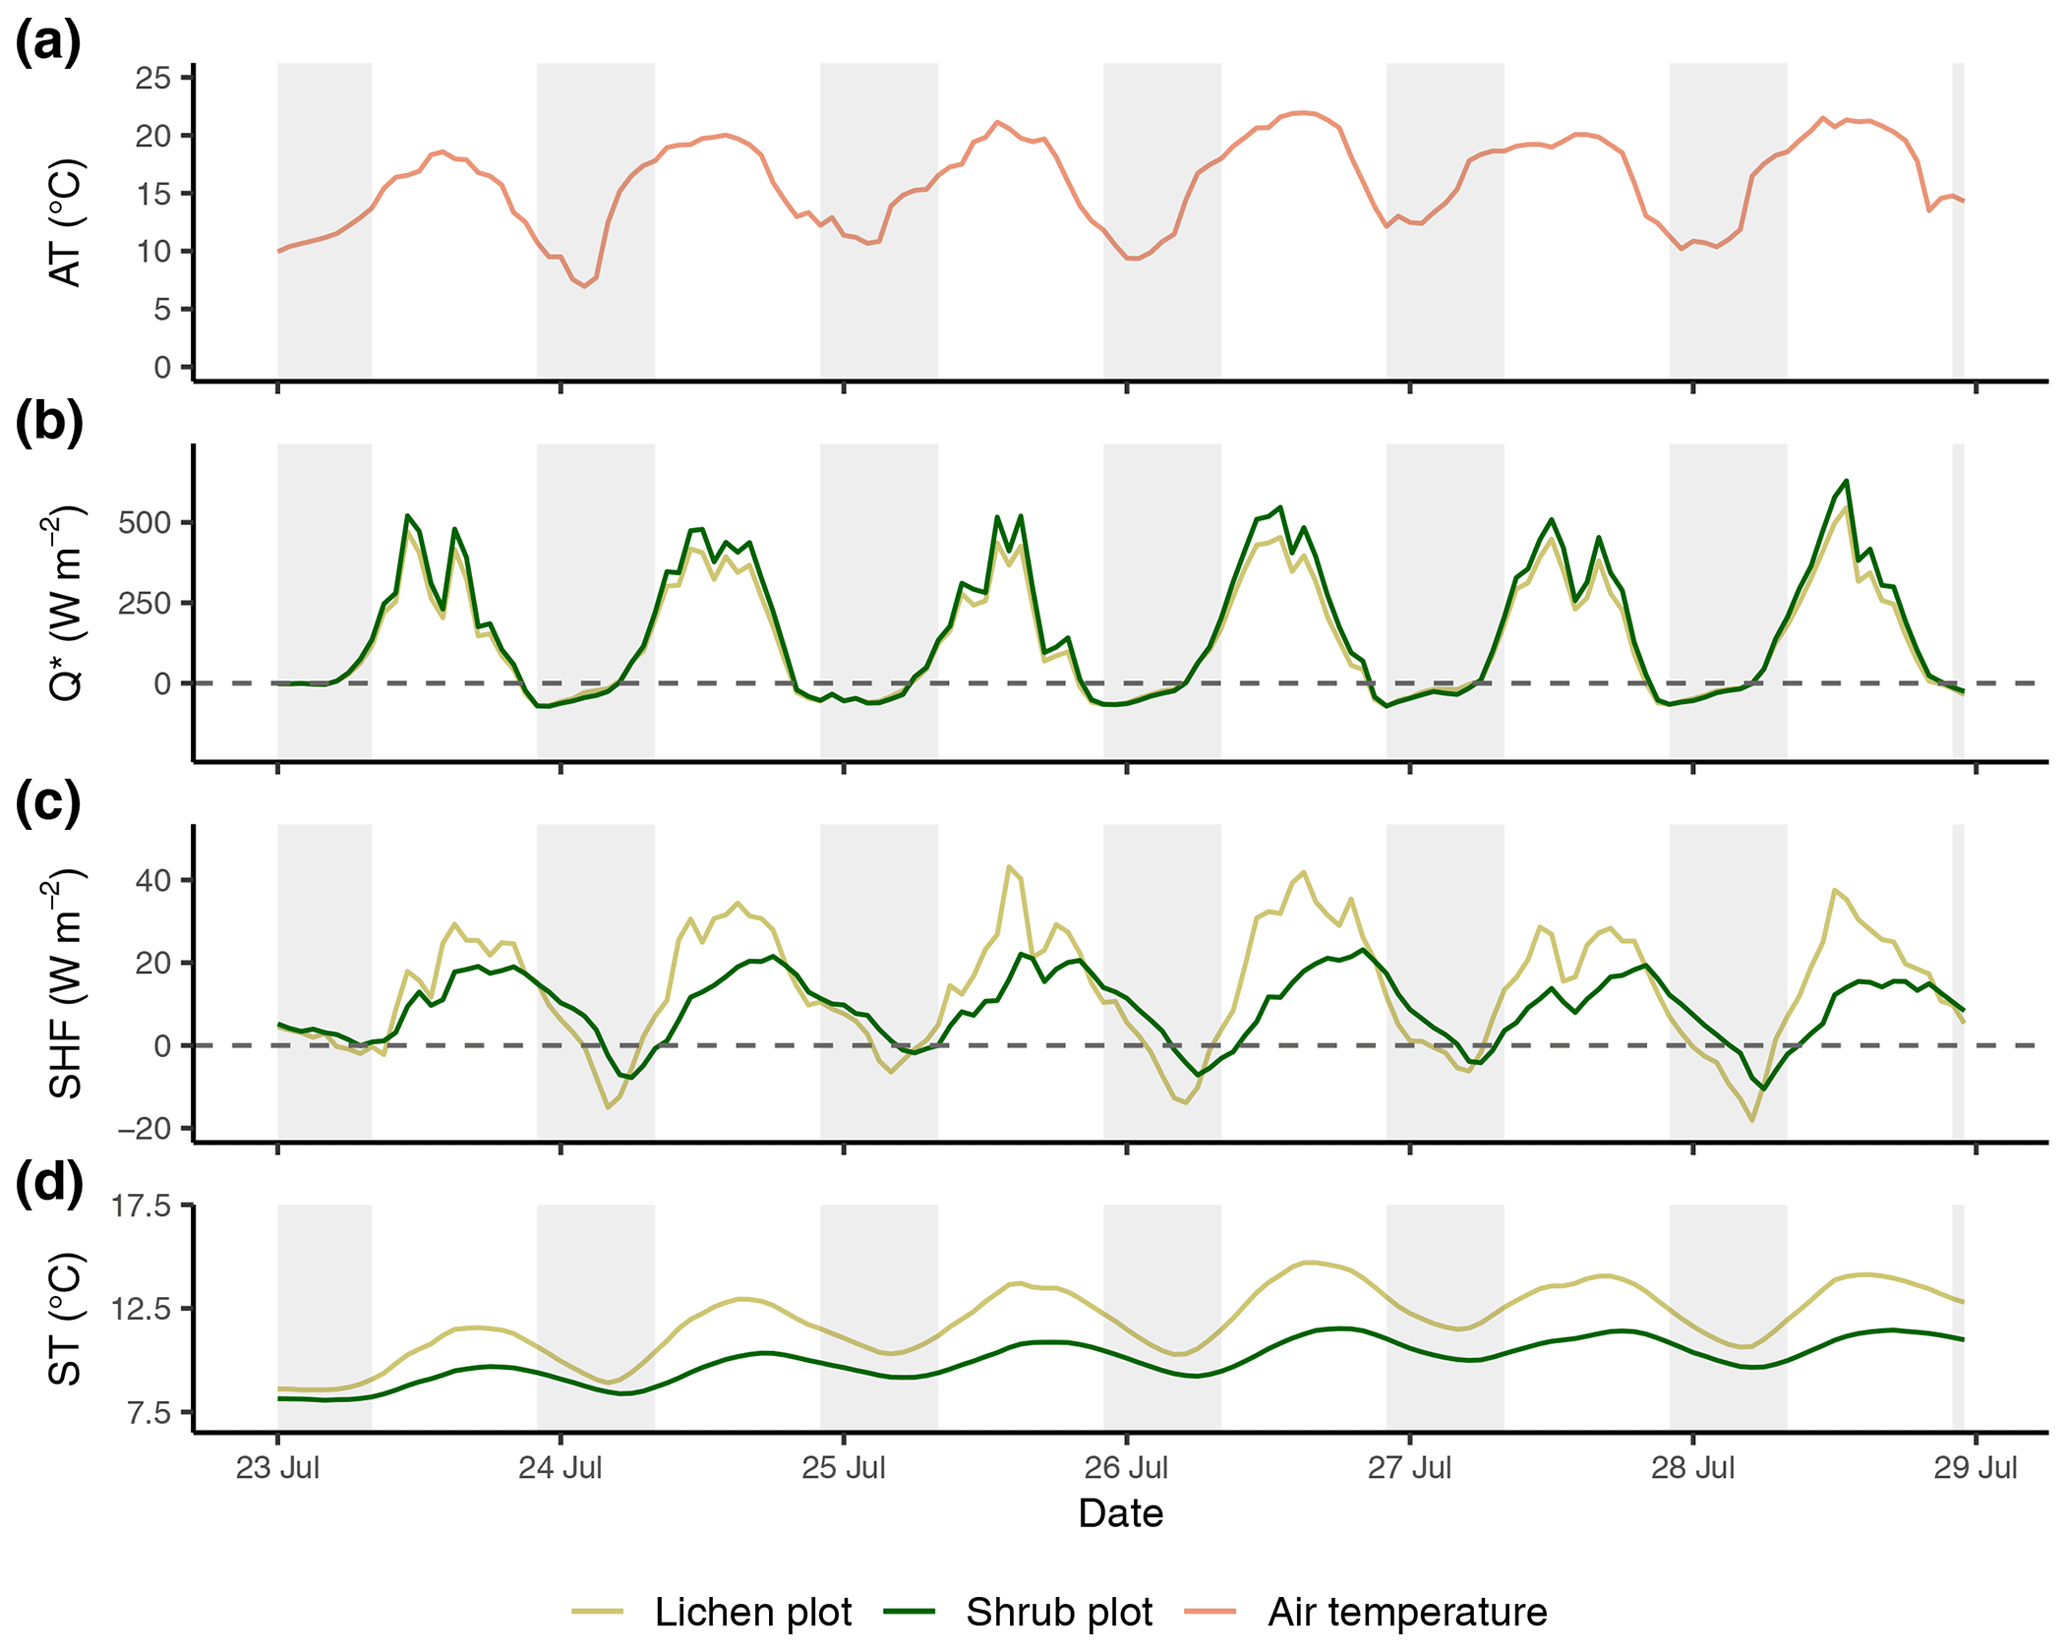
Figure E2Time series of the reference air temperature (a), net radiation (b), soil heat flux (c) and soil temperature (d) of the second set of paired plots of the field season of 2019. Time series are constructed with hourly averages. Shaded areas indicate nighttime (22:00–08:00 LT). AT: reference air temperature; Q*: net radiation; SHF: soil heat flux; ST: soil temperature.
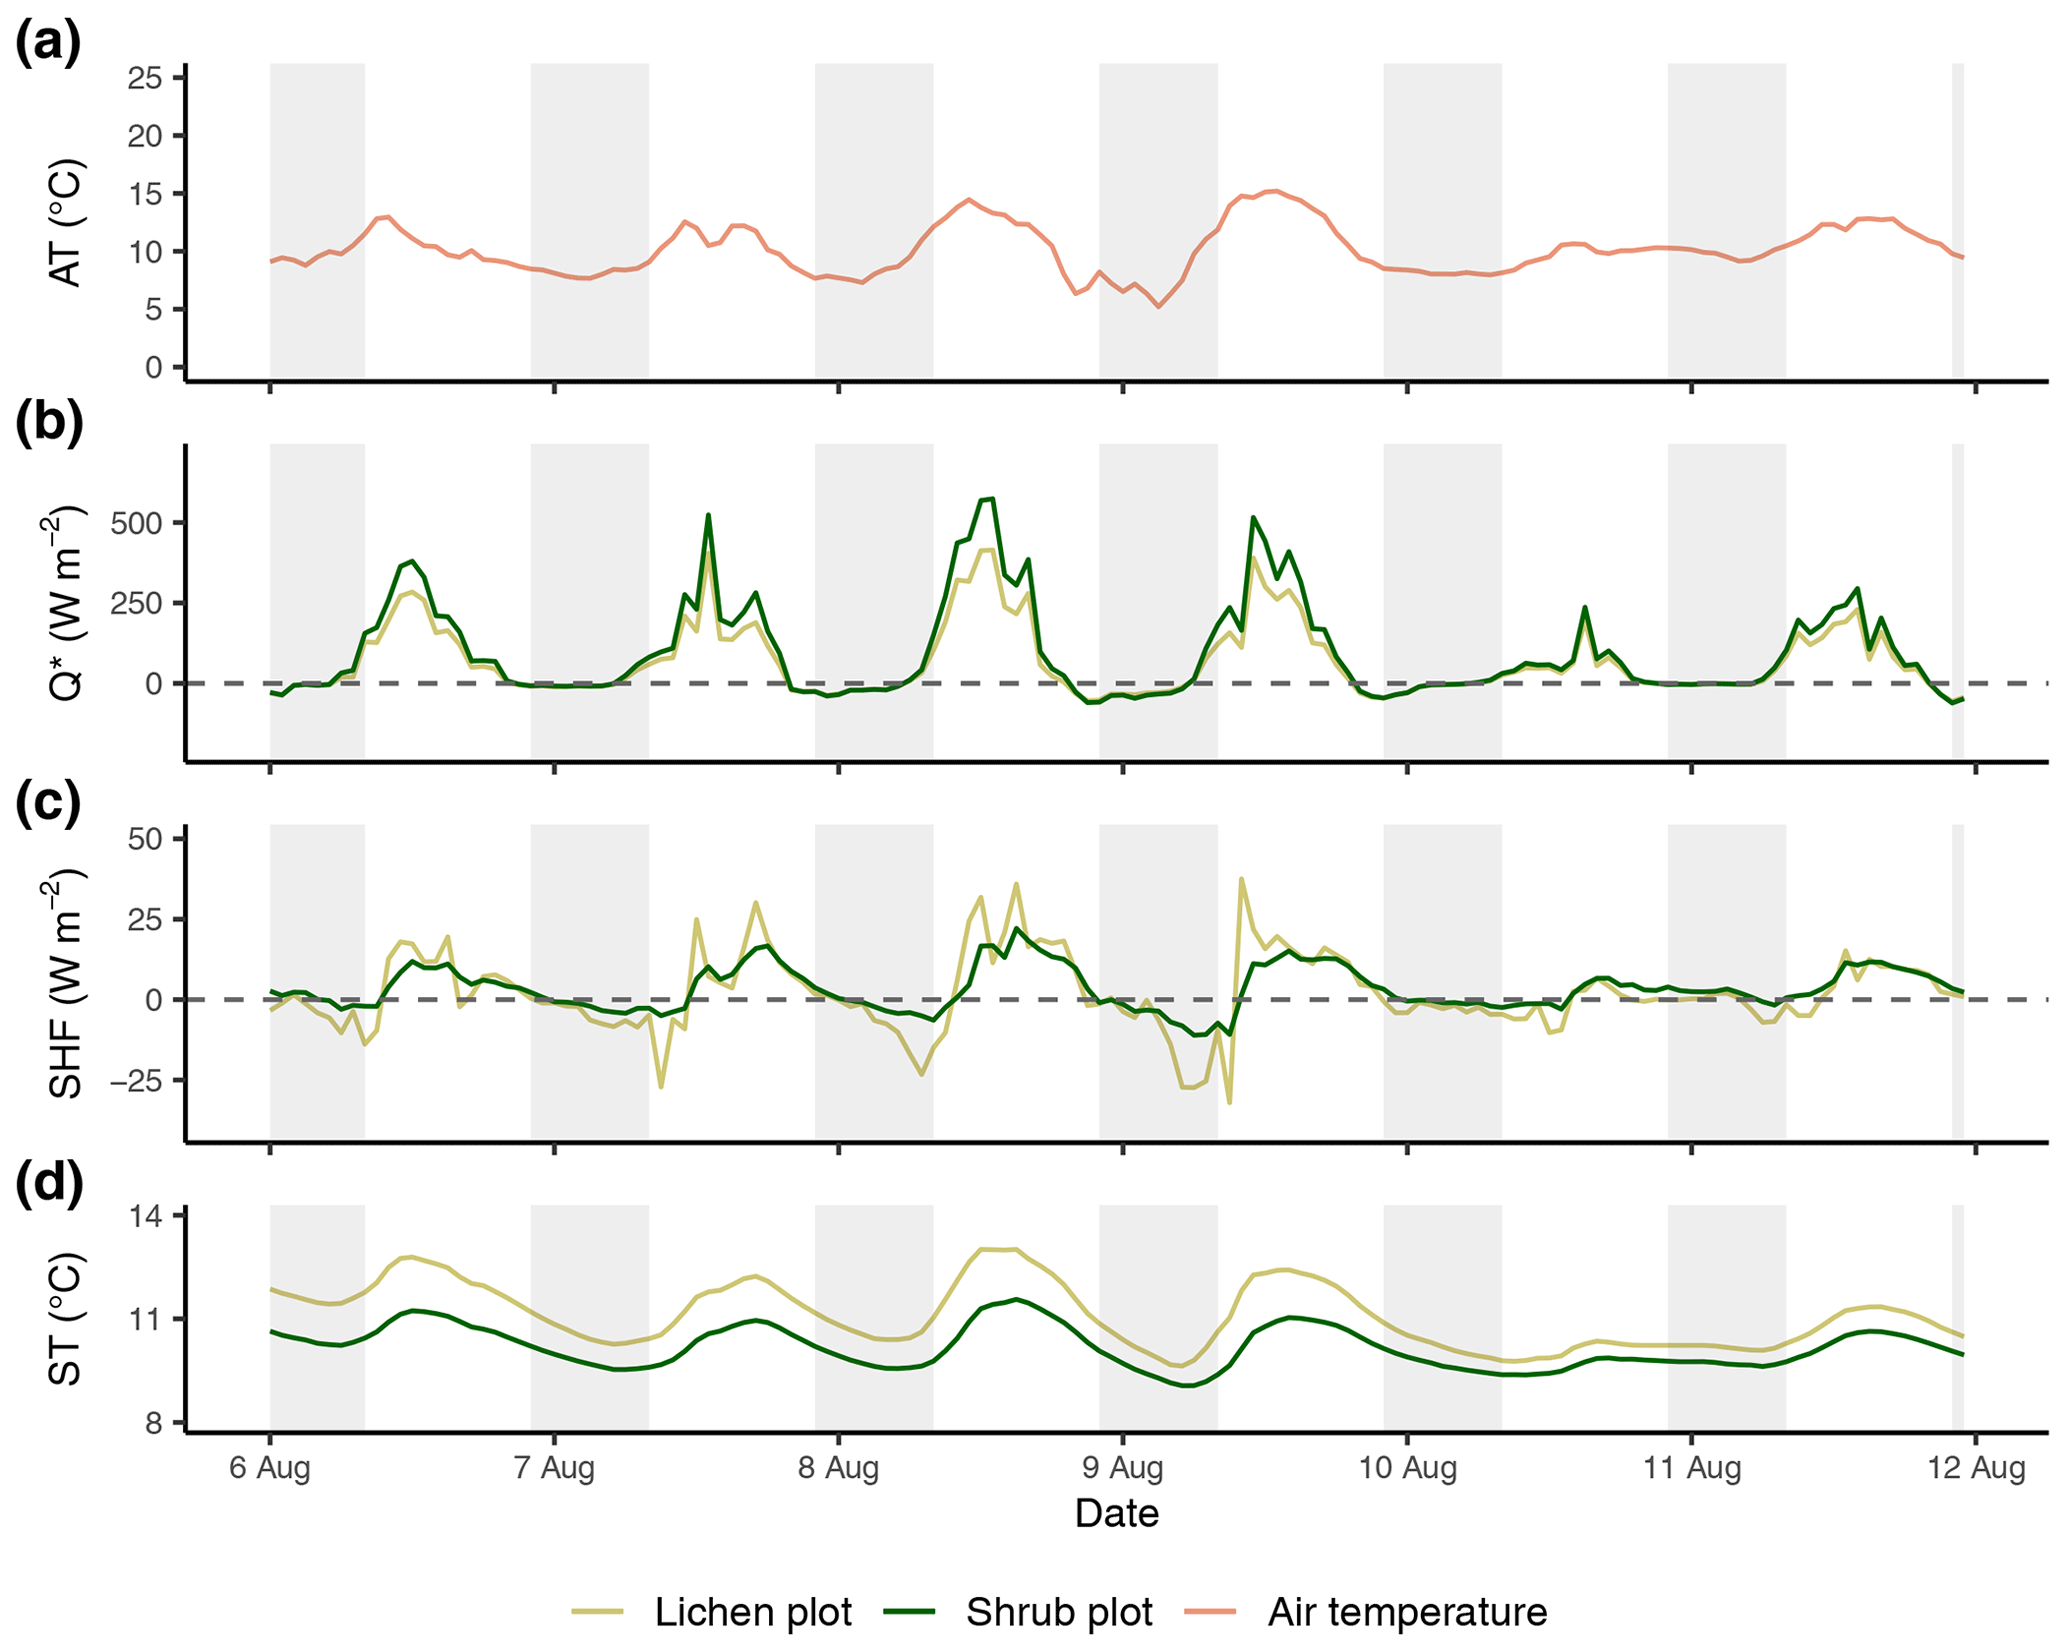
Figure E3Time series of the reference air temperature (a), net radiation (b), soil heat flux (c) and soil temperature (d) between the third set of paired plots of the field season of 2019. Time series are constructed with hourly averages. Shaded areas indicate nighttime (22:00–08:00 LT). AT: reference air temperature; Q*: net radiation; SHF: soil heat flux; ST: soil temperature.
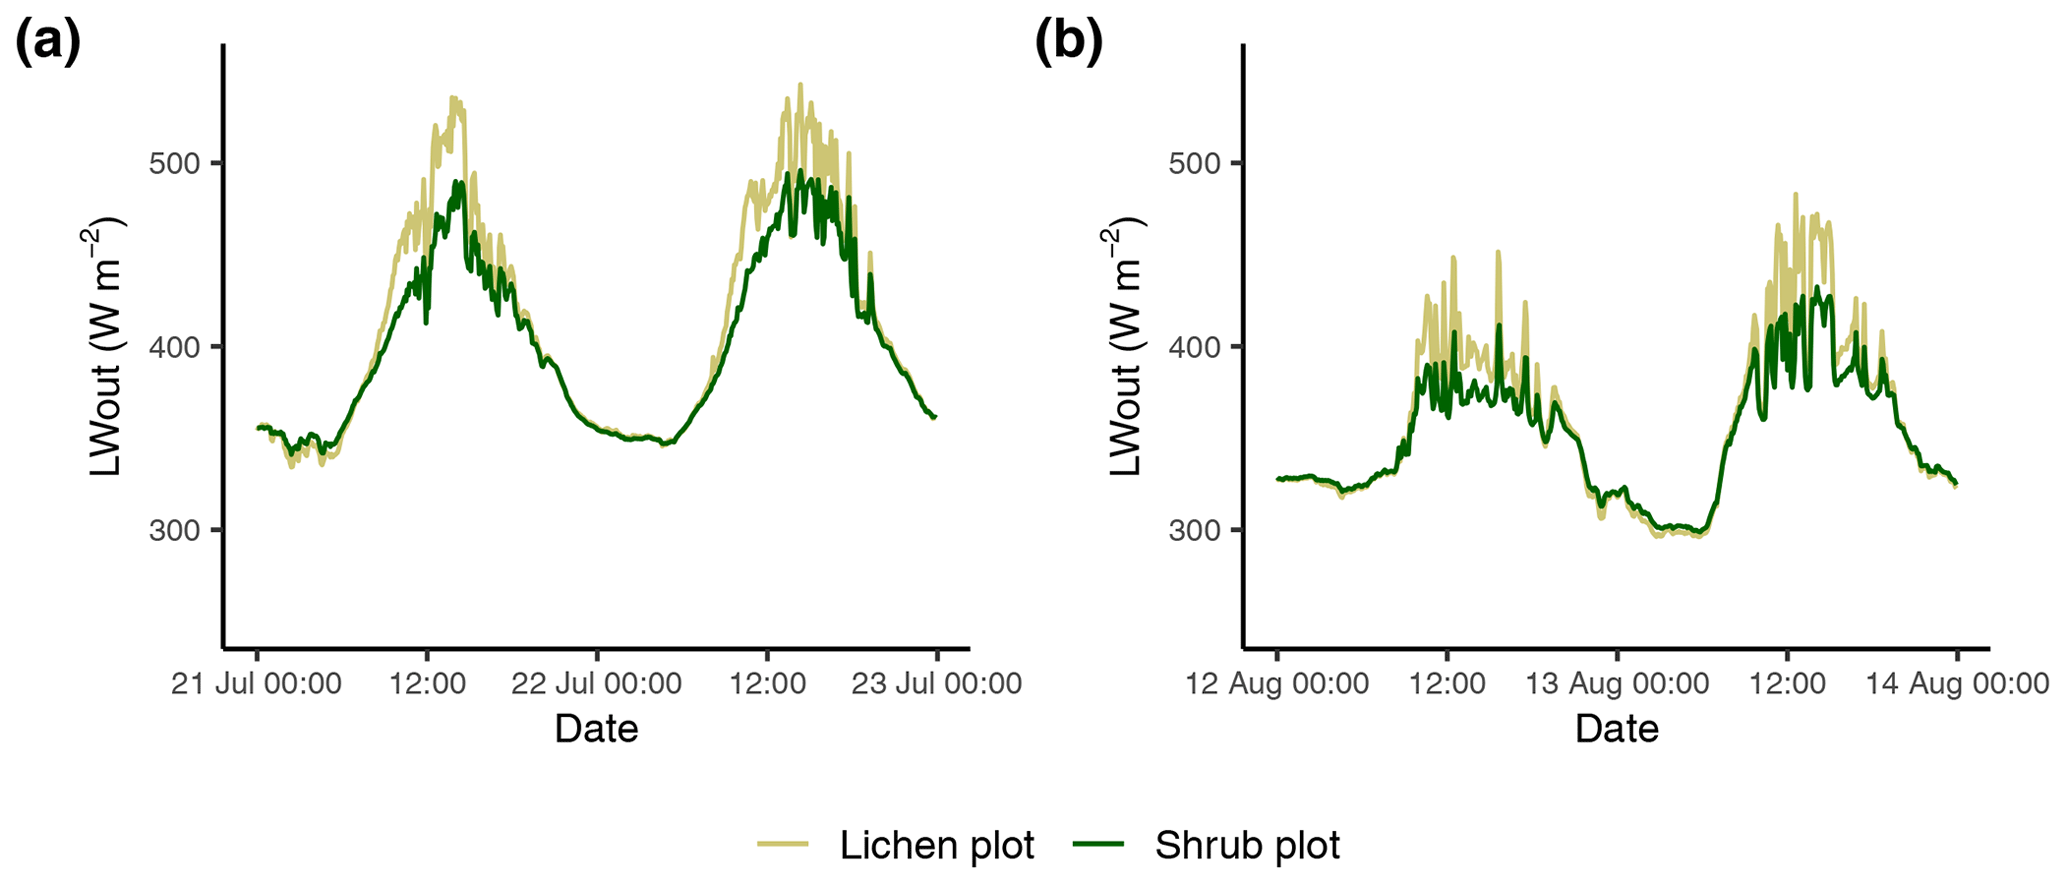
Figure F1Time series of the outgoing longwave radiation of the paired lichen and shrub plots measured on 21 and 22 July 2018 (a) and on 12 and 13 August 2018 (b).
To test if the shrub plots used more energy for the latent heat flux than the lichen plots, we calculated the latent heat flux for the plots of the field season of 2019 in a similar way as Eaton et al. (2001) using the formula of Priestley and Taylor (1972):
in which α is an empirical constant (−), S is the slope of the saturation vapor–temperature curve (Pa K−1) depending on the air temperature and γ is the psychrometric constant (65 Pa K−1). We used the α for upland lichen-heath tundra (0.90) and shrub tundra (1.08) estimated in the Canadian Arctic for our estimation (Eaton et al., 2001). Subsequently, we calculated the sensible heat flux with
and the Bowen ratio with
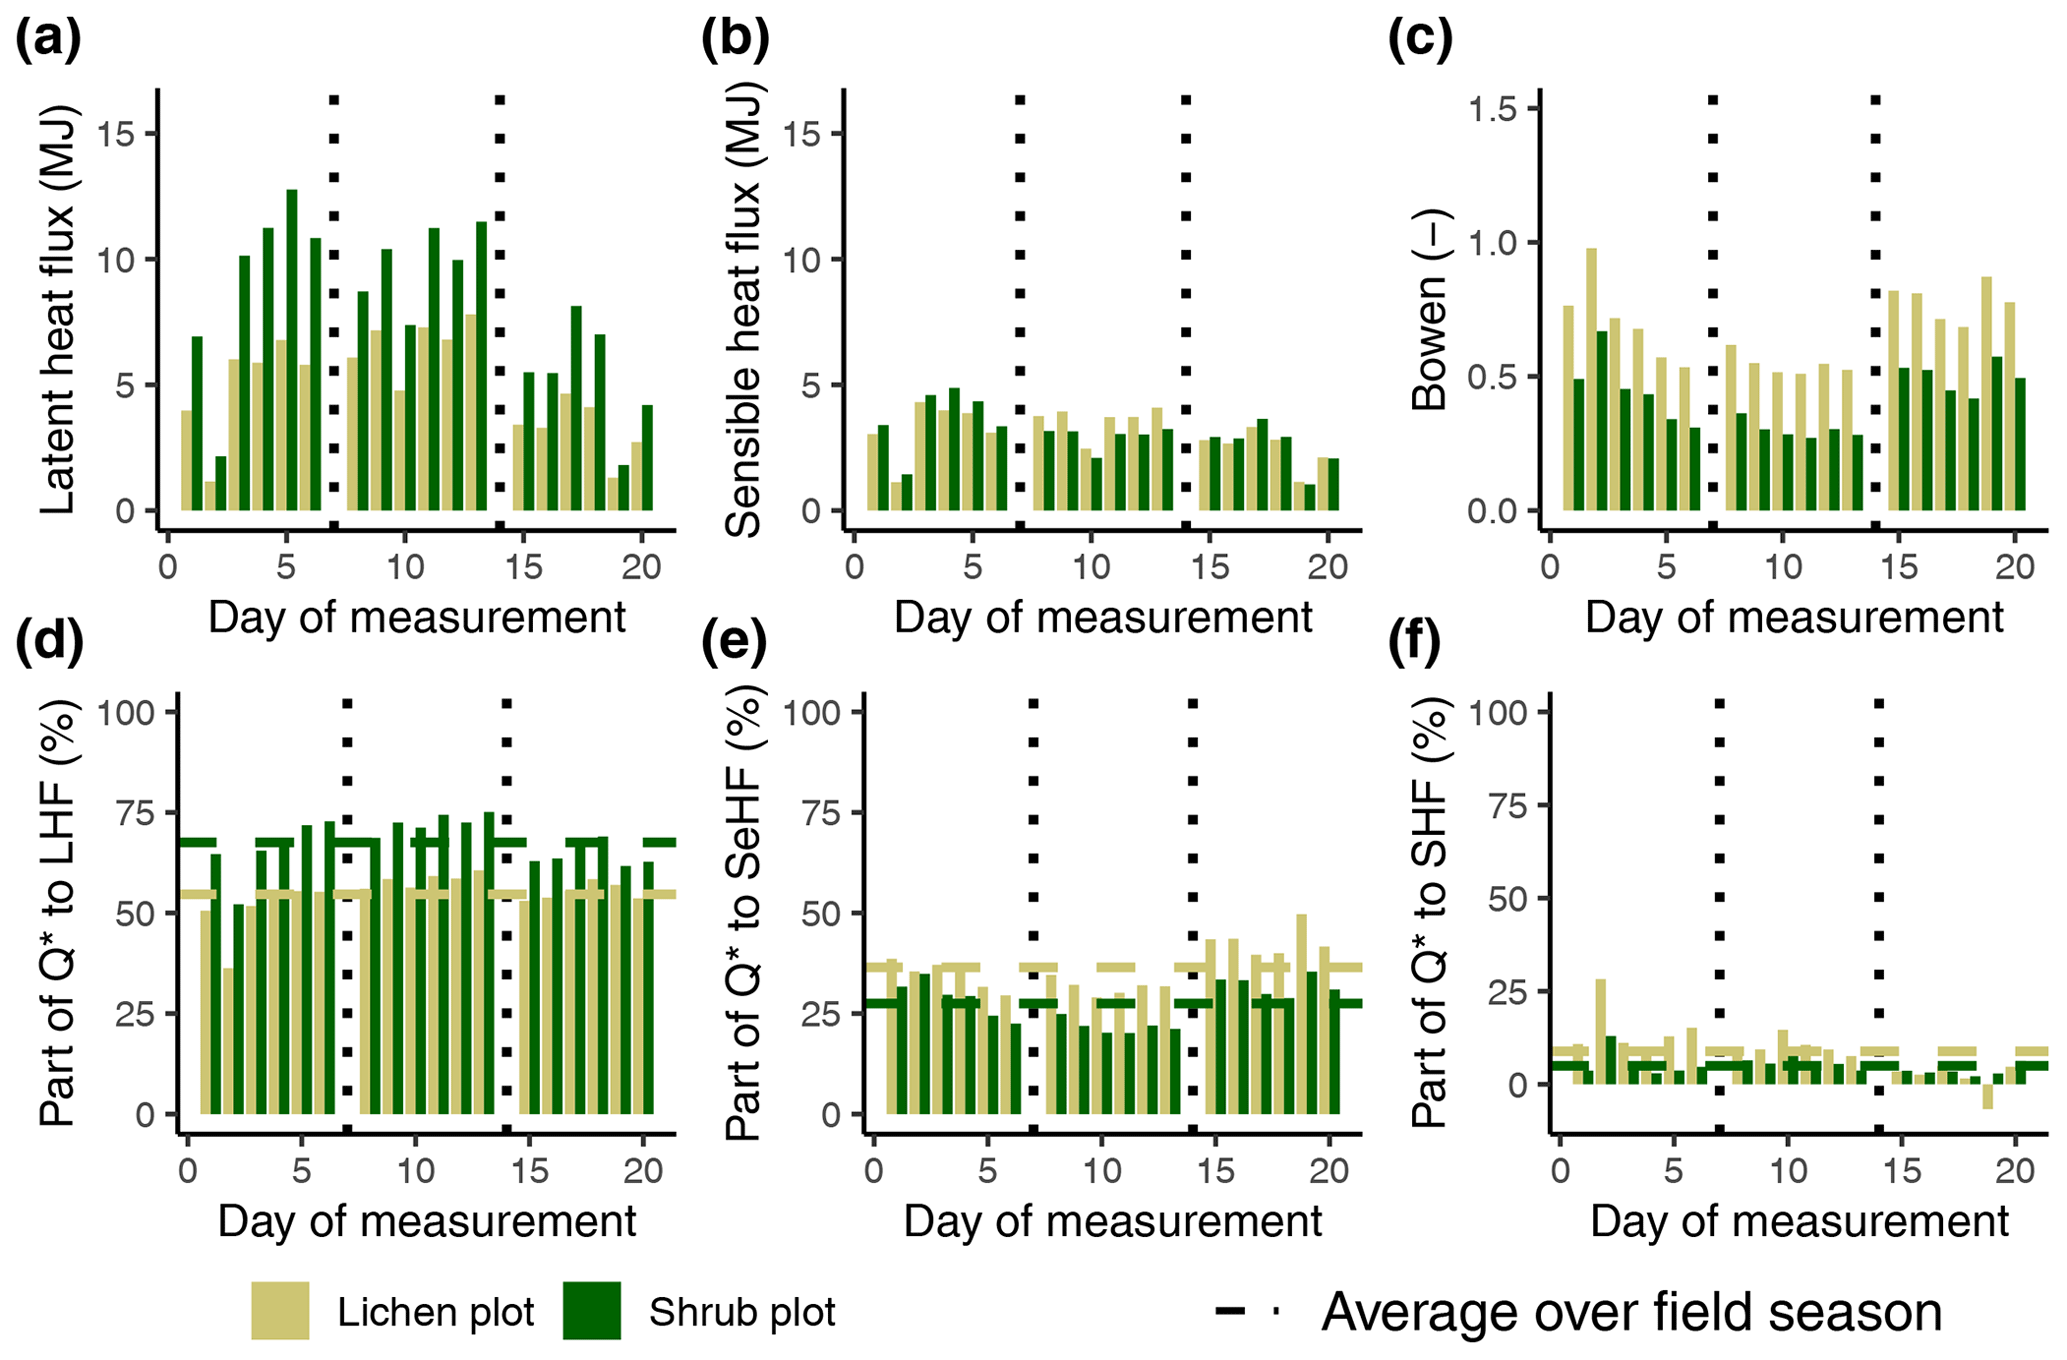
Figure G1The calculated latent heat flux (a), sensible heat flux (b), Bowen ratio (c) and the fractions (d), (e) and (f) per lichen and shrub plot of 2019. The vertical dotted lines indicate a plot change. LHF: latent heat flux; SeHF: sensible heat flux; SHF: soil heat flux; Q*: net radiation. See Appendix D for the exact dates of the measurements of the three paired plots.
The data that are used for this paper are available via https://doi.org/10.23642/usn.13637525 (Aartsma et al., 2021).
PA, AO, SR and HR conceived the study design. PA collected the data. PA analyzed the data with input from JA. PA wrote the manuscript with contributions from all other authors.
The authors declare that they have no conflict of interest.
We thank Roland Pape and three reviewers for their valuable comments on an earlier version of this paper.
This study was funded by the University of South-Eastern Norway (grant no. 3430_2700068). This study has also been supported by the Norges Forskningsråd (grant no. 249902/F20), the Nansenfondet (grant no. 124811) and the Statsminister Gunnar Knudsen og Hustru Sofie født Cappelens familielegat (grant no. 5700051).
This paper was edited by Paul Stoy and reviewed by Elise Gallois and two anonymous referees.
Aartsma, P., Asplund, J., Odland, A., Reinhardt, S., and Renssen, H.: Surface albedo of alpine lichen heaths and shrub vegetation, Arct. Antarct. Alp. Res., 52, 312–322, https://doi.org/10.1080/15230430.2020.1778890, 2020.
Aartsma, P., Asplund, J., Odland, A., Reinhardt, S., and Renssen, H.: Data from Microclimatic comparison of lichen heaths and shrubs: shrubification generates atmospheric heating but subsurface cooling during the growing season, https://doi.org/10.23642/usn.13637525, 2021.
Abu-Hamdeh, N. H. and Reeder, R. C.: Soil thermal conductivity effects of density, moisture, salt concentration, and organic matter, Soil Sci. Soc. Am. J., 64, 1285–1290, https://doi.org/10.2136/sssaj2000.6441285x, 2000.
Barrere, M., Domine, F., Decharme, B., Morin, S., Vionnet, V., and Lafaysse, M.: Evaluating the performance of coupled snow–soil models in SURFEXv8 to simulate the permafrost thermal regime at a high Arctic site, Geosci. Model Dev., 10, 3461–3479, https://doi.org/10.5194/gmd-10-3461-2017, 2017.
Beringer, J., Lynch, A. H., Chapin, F. S., Mack, M., and Bonan, G. B.: The representation of arctic soils in the land surface model: the importance of mosses, J. Climate, 14, 3324–3335, https://doi.org/10.1175/1520-0442(2001)014<3324:TROASI>2.0.CO;2, 2001.
Bernes, C., Bråthen, K. A., Forbes, B. C., Speed, J. D., and Moen, J.: What are the impacts of reindeer/caribou (Rangifer tarandus L.) on arctic and alpine vegetation? A systematic review, Environ. Evidence, 4, 4, https://doi.org/10.1186/s13750-014-0030-3, 2015.
Bernier, P., Desjardins, R., Karimi-Zindashty, Y., Worth, D., Beaudoin, A., Luo, Y., and Wang, S.: Boreal lichen woodlands: a possible negative feedback to climate change in eastern North America, Agr. Forest Meteorol., 151, 521–528, https://doi.org/10.1016/j.agrformet.2010.12.013, 2011.
Bewley, D., Pomeroy, J., and Essery, R.: Solar radiation transfer through a subarctic shrub canopy, Arct. Antarct. Alp. Res., 39, 365–374, https://doi.org/10.1657/1523-0430(06-023)[BEWLEY]2.0.CO;2, 2007.
Blok, D., Heijmans, M., Schaepman-Strub, G., van Ruijven, J., Parmentier, F., Maximov, T., and Berendse, F.: The cooling capacity of mosses: controls on water and energy fluxes in a Siberian tundra site, Ecosystems, 14, 1055–1065, https://doi.org/10.1007/s10021-011-9463-5, 2011.
Blok, D., Heijmans, M. M., Schaepman-Strub, G., Kononov, A., Maximov, T., and Berendse, F.: Shrub expansion may reduce summer permafrost thaw in Siberian tundra, Global Change Biol., 16, 1296–1305, https://doi.org/10.1111/j.1365-2486.2009.02110.x, 2010.
Bonfils, C., Phillips, T., Lawrence, D., Cameron-Smith, P., Riley, W., and Subin, Z.: On the influence of shrub height and expansion on northern high latitude climate, Environ. Res. Lett., 7, 015503, https://doi.org/10.1088/1748-9326/7/1/015503, 2012.
Boscutti, F., Casolo, V., Beraldo, P., Braidot, E., Zancani, M., and Rixen, C.: Shrub growth and plant diversity along an elevation gradient: Evidence of indirect effects of climate on alpine ecosystems, Plos One, 13, https://doi.org/10.1371/journal.pone.0196653, 2018.
Boudreau, L. D. and Rouse, W. R.: The role of individual terrain units in the water balance of wetland tundra, Clim. Res., 5, 31–47, https://doi.org/10.3354/cr005031, 1995.
Bryn, A., Strand, G.-H., Angeloff, M., and Rekdal, Y.: Land cover in Norway based on an area frame survey of vegetation types, Norsk Geogr. Tidsskr., 72, 131–145, https://doi.org/10.1080/00291951.2018.1468356, 2018.
Chagnon, C. and Boudreau, S.: Shrub canopy induces a decline in lichen abundance and diversity in Nunavik (Québec, Canada), Arct. Antarct. Alp. Res., 51, 521–532, https://doi.org/10.1080/15230430.2019.1688751, 2019.
Chapin, F. S., Sturm, M., Serreze, M. C., McFadden, J. P., Key, J., Lloyd, A. H., McGuire, A., Rupp, T. S., Lynch, A. H., and Schimel, J. P.: Role of land-surface changes in Arctic summer warming, Science, 310, 657–660, https://doi.org/10.1126/science.1117368, 2005.
Cornelissen, J. H. C., Callaghan, T. V., Alatalo, J., Michelsen, A., Graglia, E., Hartley, A., Hik, D., Hobbie, S., Press, M., and Robinson, C. H.: Global change and arctic ecosystems: is lichen decline a function of increases in vascular plant biomass?, J. Ecol., 89, 984–994, https://doi.org/10.1111/j.1365-2745.2001.00625.x, 2001.
De Vries, D. A.: Thermal properties of soils, Physics of plant environment, edited by: Van Wijk, W. R., North-Holland Publishing Co., Amsterdam, 210–235, 1963.
Eaton, A. K., Rouse, W. R., Lafleur, P. M., Marsh, P., and Blanken, P. D.: Surface energy balance of the western and central Canadian subarctic: Variations in the energy balance among five major terrain types, J. Climate, 14, 3692–3703, https://doi.org/10.1175/1520-0442(2001)014<3692:SEBOTW>2.0.CO;2, 2001.
Elmendorf, S. C., Henry, G. H., Hollister, R. D., Björk, R. G., Bjorkman, A. D., Callaghan, T. V., Collier, L. S., Cooper, E. J., Cornelissen, J. H., Day, T. A., Foosa, A. M., Gould, W., Grétarstdóttir, J., Harte, J., Hermanutz, L., Hik, D. S., Hofgaard, A., Jarrad, F., Jónsdóttir, I., Keuper, F., Klanderud, K., Klein, J., Koh, S., Kudo, G., Lang, S. I., Loewen, V., May, J., Mercado, J., Michelsen, A., Molau, U., Myers-Smith, I. H., Oberbauer, S. F., Pieper, S., Post, E., Rixen, C., Robinson, C. H., Schmidt, N., Shaver, G. R., Stenström, A., Tolvanen, A., Totland, Ø., Troxler, T., Wahren, C.-H., Webber, P., Welker, J. M., and Wookey, P.: Global assessment of experimental climate warming on tundra vegetation: heterogeneity over space and time, Ecol. Lett., 15, 164–175, https://doi.org/10.1111/j.1461-0248.2011.01716.x, 2012.
ESRI: ArcGIS Release 10.6, Redlands, CA, 2019.
Eugster, W., Rouse, W. R., Pielke Sr, R. A., Mcfadden, J. P., Baldocchi, D. D., Kittel, T. G., Chapin, F. S., Liston, G. E., Vidale, P. L., and Vaganov, E.: Land–atmosphere energy exchange in Arctic tundra and boreal forest: available data and feedbacks to climate, Global Change Biol., 6, 84–115, https://doi.org/10.1046/j.1365-2486.2000.06015.x, 2000.
Fauria, M. M., Helle, T., Niva, A., Posio, H., and Timonen, M.: Removal of the lichen mat by reindeer enhances tree growth in a northern Scots pine forest, Can. J. For. Res., 38, 2981–2993, https://doi.org/10.1139/X08-135, 2008.
Fraser, R. H., Lantz, T. C., Olthof, I., Kokelj, S. V., and Sims, R. A.: Warming-induced shrub expansion and lichen decline in the Western Canadian Arctic, Ecosystems, 17, 1151–1168, https://doi.org/10.1007/s10021-014-9783-3, 2014.
Frost, G. V., Epstein, H. E., Walker, D. A., Matyshak, G., and Ermokhina, K.: Seasonal and long-term changes to active-layer temperatures after tall shrubland expansion and succession in Arctic tundra, Ecosystems, 21, 507–520, https://doi.org/10.1007/s10021-017-0165-5, 2018.
Gauslaa, Y.: Heat resistance and energy budget in different Scandinavian plants, Ecography, 7, 5-6, https://doi.org/10.1111/j.1600-0587.1984.tb01098.x, 1984.
Geonorge: Norge i bilder WMS-Ortofoto, available at: https://kartkatalog.geonorge.no, last access: 8 June 2018 (in Norwegian).
Gersony, J. T., Prager, C. M., Boelman, N. T., Eitel, J. U., Gough, L., Greaves, H. E., Griffin, K. L., Magney, T. S., Sweet, S. K., and Vierling, L. A.: Scaling thermal properties from the leaf to the canopy in the Alaskan arctic tundra, Arct. Antarct. Alp. Res., 48, 739–754, https://doi.org/10.1657/AAAR0016-013, 2016.
Gold, W. G., Glew, K. A., and Dickson, L. G.: Functional influences of cryptobiotic surface crusts in an alpine tundra basin of the Olympic Mountains, Washington, USA, Northwest Sci., 75, 315–326, 2001.
Grünberg, I., Wilcox, E. J., Zwieback, S., Marsh, P., and Boike, J.: Linking tundra vegetation, snow, soil temperature, and permafrost, Biogeosciences, 17, 4261–4279, https://doi.org/10.5194/bg-17-4261-2020, 2020.
Hallinger, M., Manthey, M., and Wilmking, M.: Establishing a missing link: warm summers and winter snow cover promote shrub expansion into alpine tundra in Scandinavia, New Phytol., 186, 890–899, https://doi.org/10.1111/j.1469-8137.2010.03223.x, 2010.
Heggberget, T. M., Gaare, E., and Ball, J. P.: Reindeer (Rangifer tarandus) and climate change: importance of winter forage, Rangifer, 22, 13–31, 2002.
Heiri, O., Lotter, A. F., and Lemcke, G.: Loss on ignition as a method for estimating organic and carbonate content in sediments: reproducibility and comparability of results, J. Paleolimnol., 25, 101–110, https://doi.org/10.1023/A:1008119611481, 2001.
Joly, K., Jandt, R. R., and Klein, D. R.: Decrease of lichens in Arctic ecosystems: the role of wildfire, caribou, reindeer, competition and climate in north-western Alaska, Polar Res., 28, 433–442, https://doi.org/10.1111/j.1751-8369.2009.00113.x, 2009.
Juszak, I., Erb, A. M., Maximov, T. C., and Schaepman-Strub, G.: Arctic shrub effects on NDVI, summer albedo and soil shading, Remote Sens. Environ., 153, 79–89, https://doi.org/10.1016/j.rse.2014.07.021, 2014.
Juszak, I., Eugster, W., Heijmans, M. M. P. D., and Schaepman-Strub, G.: Contrasting radiation and soil heat fluxes in Arctic shrub and wet sedge tundra, Biogeosciences, 13, 4049–4064, https://doi.org/10.5194/bg-13-4049-2016, 2016.
Lafleur, P. M. and Humphreys, E. R.: Tundra shrub effects on growing season energy and carbon dioxide exchange, Environ. Res. Lett., 13, 055001, https://doi.org/10.1088/1748-9326/aab863, 2018.
Lang, S. I., Cornelissen, J. H., Shaver, G. R., Ahrens, M., Callaghan, T. V., Molau, U., Ter Braak, C. J., Hölzer, A., and Aerts, R.: Arctic warming on two continents has consistent negative effects on lichen diversity and mixed effects on bryophyte diversity, Global Change Biol., 18, 1096–1107, https://doi.org/10.1111/j.1365-2486.2011.02570.x, 2012.
Lawrence, D. M. and Swenson, S. C.: Permafrost response to increasing Arctic shrub abundance depends on the relative influence of shrubs on local soil cooling versus large-scale climate warming, Environ. Res. Lett., 6, 045504, https://doi.org/10.1088/1748-9326/6/4/045504, 2011.
Loranty, M. M. and Goetz, S. J.: Shrub expansion and climate feedbacks in Arctic tundra, Environ. Res. Lett., 7, 011005, https://doi.org/10.1088/1748-9326/7/1/011005, 2012.
Loranty, M. M., Abbott, B. W., Blok, D., Douglas, T. A., Epstein, H. E., Forbes, B. C., Jones, B. M., Kholodov, A. L., Kropp, H., Malhotra, A., Mamet, S. D., Myers-Smith, I. H., Natali, S. M., O'Donnell, J. A., Phoenix, G. K., Rocha, A. V., Sonnentag, O., Tape, K. D., and Walker, D. A.: Reviews and syntheses: Changing ecosystem influences on soil thermal regimes in northern high-latitude permafrost regions, Biogeosciences, 15, 5287–5313, https://doi.org/10.5194/bg-15-5287-2018, 2018a.
Loranty, M. M., Berner, L. T., Taber, E. D., Kropp, H., Natali, S. M., Alexander, H. D., Davydov, S. P., and Zimov, N. S.: Understory vegetation mediates permafrost active layer dynamics and carbon dioxide fluxes in open-canopy larch forests of northeastern Siberia, Plos One, 13, e0194014, https://doi.org/10.1371/journal.pone.0194014, 2018b.
Maliniemi, T., Kapfer, J., Saccone, P., Skog, A., and Virtanen, R.: Long-term vegetation changes of treeless heath communities in northern Fennoscandia: Links to climate change trends and reindeer grazing, J. Veg. Sci., 29, 469–479, https://doi.org/10.1111/jvs.12630, 2018.
McFadden, J. P., Chapin, F. S., and Hollinger, D. Y.: Subgrid-scale variability in the surface energy balance of arctic tundra, J. Geophys. Res.-Atmos., 103, 28947–28961, https://doi.org/10.1029/98JD02400, 1998.
MET Norway: available at: https://www.met.no, last access: 09 August 2019.
Mikola, J., Virtanen, T., Linkosalmi, M., Vähä, E., Nyman, J., Postanogova, O., Räsänen, A., Kotze, D. J., Laurila, T., Juutinen, S., Kondratyev, V., and Aurela, M.: Spatial variation and linkages of soil and vegetation in the Siberian Arctic tundra – coupling field observations with remote sensing data, Biogeosciences, 15, 2781–2801, https://doi.org/10.5194/bg-15-2781-2018, 2018.
Moffat, N. D., Lantz, T. C., Fraser, R. H., and Olthof, I.: Recent vegetation change (1980–2013) in the tundra ecosystems of the Tuktoyaktuk Coastlands, NWT, Canada, Arct. Antarct. Alp. Res., 48, 581–597, https://doi.org/10.1657/AAAR0015-063, 2016.
Myers-Smith, I. H., Forbes, B. C., Wilmking, M., Hallinger, M., Lantz, T., Blok, D., Tape, K. D., Macias-Fauria, M., Sass-Klaassen, U., and Lévesque, E.: Shrub expansion in tundra ecosystems: dynamics, impacts and research priorities, Environ. Res. Lett., 6, 045509, https://doi.org/10.1088/1748-9326/6/4/045509, 2011.
Myers-Smith, I. H. and Hik, D. S.: Shrub canopies influence soil temperatures but not nutrient dynamics: an experimental test of tundra snow–shrub interactions, Ecol. Evol., 3, 3683–3700, https://doi.org/10.1002/ece3.710, 2013.
Myers-Smith, I. H., Kerby, J. T., Phoenix, G. K., Bjerke, J. W., Epstein, H. E., Assmann, J. J., John, C., Andreu-Hayles, L., Angers-Blondin, S., and Beck, P. S.: Complexity revealed in the greening of the Arctic, Nat. Clim. Change, 10, 106–117, https://doi.org/10.1038/s41558-019-0688-1, 2020.
NGU: available at: https://www.ngu.no, last access: 29 June 2020.
Nystuen, K. O., Sundsdal, K., Opedal, Ø. H., Holien, H., Strimbeck, G. R., and Graae, B. J.: Lichens facilitate seedling recruitment in alpine heath, J. Veg. Sci., 30, 868–880, https://doi.org/10.1111/jvs.12773, 2019.
Ochsner, T. E., Horton, R., and Ren, T.: A new perspective on soil thermal properties, Soil Sci. Soc. Am. J., 65, 1641–1647, https://doi.org/10.2136/sssaj2001.1641, 2001.
Odland, A. and Munkejord, H. K.: Plants as indicators of snow layer duration in southern Norwegian mountains, Ecol. Indicators, 8, 57–68, https://doi.org/10.1016/j.ecolind.2006.12.005, 2008.
Odland, A., Bandekar, G., Hanssen-Bauer, I., and Sandvik, S. M.: Relationships between vegetation, air and soil temperatures on Norwegian mountain summits, Geogr. Ann. A, 99, 313–326, https://doi.org/10.1080/04353676.2017.1333324, 2017.
Oke, T. R.: Boundary layer climates, Routledge, London, 2002.
Pajunen, A., Oksanen, J., and Virtanen, R.: Impact of shrub canopies on understorey vegetation in western Eurasian tundra, J. Veg. Sci., 22, 837–846, https://doi.org/10.1111/j.1654-1103.2011.01285.x, 2011.
Pearson, R. G., Phillips, S. J., Loranty, M. M., Beck, P. S., Damoulas, T., Knight, S. J., and Goetz, S. J.: Shifts in Arctic vegetation and associated feedbacks under climate change, Nat. Clim. Change, 3, 673–677, https://doi.org/10.1029/2005JG000013, 2013.
Pinheiro, J., Bates, D., DebRoy, S., and Sarkar, D.: nlme: Linear and Nonlinear Mixed Effects Models, R package version 3.1-148, available at: https://CRAN.R-project.org/package=nlme (last access: 1 November 2020), 2011.
Porada, P., Ekici, A., and Beer, C.: Effects of bryophyte and lichen cover on permafrost soil temperature at large scale, The Cryosphere, 10, 2291–2315, https://doi.org/10.5194/tc-10-2291-2016, 2016.
Priestley, C. H. B. and Taylor, R.: On the assessment of surface heat flux and evaporation using large-scale parameters, Mon. Weather Rev., 100, 81–92, https://doi.org/10.1175/1520-0493(1972)100<0081:OTAOSH>2.3.CO;2, 1972.
R Core Team. R: A language and environment for statistical computing, Vienna, Austria: R Foundation for Statistical Computing, available at: https://www.R-project.org/, last access: 1 November 2020.
Sabater, A. M., Ward, H. C., Hill, T. C., Gornall, J. L., Wade, T. J., Evans, J. G., Prieto-Blanco, A., Disney, M., Phoenix, G. K., and Williams, M.: Transpiration from subarctic deciduous woodlands: Environmental controls and contribution to ecosystem evapotranspiration, Ecohydrology, 13, e2190, https://doi.org/10.1002/eco.2190, 2020.
Stoy, P. C., Street, L. E., Johnson, A. V., Prieto-Blanco, A., and Ewing, S. A.: Temperature, heat flux, and reflectance of common subarctic mosses and lichens under field conditions: might changes to community composition impact climate-relevant surface fluxes?, Arct. Antarct. Alp. Res., 44, 500–508, https://doi.org/10.1657/1938-4246-44.4.500, 2012.
Sturm, M., Holmgren, J., McFadden, J. P., Liston, G. E., Chapin, F. S., and Racine, C. H.: Snow–Shrub Interactions in Arctic Tundra: A Hypothesis with Climatic Implications, J. Climate, 14, 336–344, https://doi.org/10.1175/1520-0442(2001)014<0336:SSIIAT>2.0.CO;2, 2001a.
Sturm, M., Racine, C., and Tape, K.: Increasing shrub abundance in the Arctic, Nature, 411, 546, https://doi.org/10.1038/35079180, 2001b.
Sundstøl, S. A. and Odland, A.: Responses of Alpine Vascular Plants and Lichens to Soil Temperatures, Ann. Bot. Fenn., 54, 17–28, https://doi.org/10.5735/085.054.0304, 2017.
Todt, M., Rutter, N., Fletcher, C., Wake, L., Bartlett, P., Jonas, T., Kropp, H., Loranty, M., and Webster, C.: Simulation of longwave enhancement in boreal and montane forests, J. Geophys. Res.-Atmos., 123, 13731–13747, https://doi.org/10.1029/2018JD028719, 2018.
Van Zuijlen, K., Roos, R. E., Klanderud, K., Lang, S. I., and Asplund, J.: Mat-forming lichens affect microclimate and litter decomposition by different mechanisms, Fungal Ecol., 44, 100905, https://doi.org/10.1016/j.funeco.2019.100905, 2020.
Vistnes, I. I. and Nellemann, C.: Reindeer winter grazing in alpine tundra: impacts on ridge community composition in Norway, Arct. Antarct. Alp. Res., 40, 215–224, https://doi.org/10.1657/1523-0430(07-001)[VISTNES]2.0.CO;2, 2008.
Vuorinen, K. E., Oksanen, L., Oksanen, T., Pyykönen, A., Olofsson, J., and Virtanen, R.: Open tundra persist, but arctic features decline–Vegetation changes in the warming Fennoscandian tundra, Global Change Biol., 23, 3794–3807, https://doi.org/10.1111/gcb.13710, 2017.
Walker, M. D., Wahren, C. H., Hollister, R. D., Henry, G. H., Ahlquist, L. E., Alatalo, J. M., Bret-Harte, M. S., Calef, M. P., Callaghan, T. V., and Carroll, A. B.: Plant community responses to experimental warming across the tundra biome, P. Natl. Acad. Sci. USA, 103, 1342–1346, https://doi.org/10.1073/pnas.0503198103, 2006.
Webster, C., Rutter, N., and Jonas, T.: Improving representation of canopy temperatures for modeling subcanopy incoming longwave radiation to the snow surface, J. Geophys. Res.-Atmos., 122, 9154–9172, https://doi.org/10.1002/2017JD026581, 2017.
Williams, M., Rastetter, E. B., Van der Pol, L., and Shaver, G. R.: Arctic canopy photosynthetic efficiency enhanced under diffuse light, linked to a reduction in the fraction of the canopy in deep shade, New Phytol., 202, 1267–1276, https://doi.org/10.1111/nph.12750, 2014.
Williamson, S. N., Barrio, I. C., Hik, D. S., and Gamon, J. A.: Phenology and species determine growing-season albedo increase at the altitudinal limit of shrub growth in the sub-Arctic, Global Change Biol., 22, 3621–3631, https://doi.org/10.1111/gcb.13297, 2016.
WRB: World reference base for soil resources 2006, World Soil Resources Reports No. 103, FAO, Rome, 2006.
Wullschleger, S. D., Epstein, H. E., Box, E. O., Euskirchen, E. S., Goswami, S., Iversen, C. M., Kattge, J., Norby, R. J., van Bodegom, P. M., and Xu, X.: Plant functional types in Earth system models: past experiences and future directions for application of dynamic vegetation models in high-latitude ecosystems, Ann. Bot., 114, 1–16, https://doi.org/10.1093/aob/mcu077, 2014.