the Creative Commons Attribution 4.0 License.
the Creative Commons Attribution 4.0 License.
 | 12 Jan 2021
Increased carbon capture by a silicate-treated forested watershed affected by acid deposition
Lyla L. Taylor
Charles T. Driscoll
Peter M. Groffman
Greg H. Rau
Joel D. Blum
David J. Beerling
Meeting internationally agreed-upon climate targets requires carbon dioxide removal (CDR) strategies coupled with an urgent phase-down of fossil fuel emissions. However, the efficacy and wider impacts of CDR are poorly understood. Enhanced rock weathering (ERW) is a land-based CDR strategy requiring large-scale field trials. Here we show that a low 3.44 t ha−1 wollastonite treatment in an 11.8 ha acid-rain-impacted forested watershed in New Hampshire, USA, led to cumulative carbon capture by carbonic acid weathering of 0.025–0.13 t CO2 ha−1 over 15 years. Despite a 0.8–2.4 t CO2 ha−1 logistical carbon penalty from mining, grinding, transportation, and spreading, by 2015 weathering together with increased forest productivity led to net CDR of 8.5–11.5 t CO2 ha−1. Our results demonstrate that ERW may be an effective, scalable CDR strategy for acid-impacted forests but at large scales requires sustainable sources of silicate rock dust.
- Article
(650 KB) - Full-text XML
-
Supplement
(868 KB) - BibTeX
- EndNote


The Intergovernmental Panel on Climate Change (IPCC) (Rogelj et al., 2018) Special Report on global warming indicates large-scale deployment of carbon dioxide removal (CDR) technologies will be required to avoid warming in excess of 1.5 ∘C by the end of this century. Land-based CDR strategies include enhanced rock weathering (ERW), which aims to accelerate the natural geological process of carbon sequestration by amending soils with crushed reactive calcium (Ca)- and magnesium (Mg)-bearing rocks such as basalt (The Royal Society and The Royal Academy of Engineering, 2018; Hartmann et al., 2013). Forests represent potential large-scale deployment opportunities where rock amendments may provide a range of benefits, including amelioration of soil acidification and provisioning of inorganic plant nutrients to cation-depleted soils (Hartmann et al., 2013; Beerling et al., 2018). Although ERW has not yet been demonstrated as a CDR technique at the catchment scale, a forested watershed experiment at the Hubbard Brook Experimental Forest (HBEF, 43∘56′N, 71∘45′ W) in the White Mountains of New Hampshire, USA, provides an unusual opportunity for assessing proof of concept in this priority research area.
The HBEF watershed experiment, designed to restore soil calcium following decades of leaching by acid rain, involved application of a finely ground rapidly weathered calcium silicate mineral wollastonite (CaSiO3; 3.44 t ha−1) on 19 October 1999 to an 11.8 ha forested watershed (Likens et al., 2004; Peters et al., 2004; Shao et al., 2016). Unlike the carbonate minerals (e.g. CaCO3) commonly applied to acidified soils (Lundström et al., 2003), wollastonite does not release CO2 when weathered (Supplement) so is much better suited for CDR (Hartmann et al., 2013). It also has dissolution kinetics comparable to or faster than other calcium-rich silicate minerals such as labradorite found in basalt (Brantley et al., 2008). Thus, the HBEF experiment provides a timely and unparalleled opportunity for investigating the long-term (15 years) effects of ERW on CDR potential via forest and stream-water chemistry responses.
In the case of ERW with wollastonite, CDR follows as Ca cations (Ca2+) liberated by weathering consume atmospheric CO2 through the formation of bicarbonate (HCO) by charge balance, as described by the following reaction:
However, forests in the northeastern USA have experienced acid deposition (Likens and Bailey, 2014), changes in nitrogen cycling (Goodale and Aber, 2001; McLauchlan et al., 2007), and increases in dissolved organic carbon (DOC) fluxes (Cawley et al., 2014) that may affect CO2 removal efficiency by ERW processes. In particular, CO2 consumption as measured by bicarbonate production may be diminished if sulfate (SO), nitrate (NO), or naturally occurring organic acid (OA) anions (Fakhraei and Driscoll, 2015) (H2A−) in DOC intervene to inhibit the following mineral weathering reactions. For example
These environmental effects on stream-water chemistry are well documented at the HBEF (Cawley et al., 2014; Likens and Bailey, 2014; Rosi-Marshall et al., 2016; McLauchlan et al., 2007) and may be exacerbated under future climate change (Sebestyen et al., 2009; Campbell et al., 2009).
Here we exploit the experimental design and long-term monitoring of stream-water chemistry, trees, and soils for two small forested HBEF watersheds to evaluate the effects of the wollastonite treatment in 1999 on catchment CO2 consumption via inorganic and organic pathways. Further, we examine how biogeochemical perturbations in S, N, and organic carbon cycling affect catchment inorganic CO2 consumption. We consider the forest response, the carbon cost for ERW deployment (mining, grinding, transportation, and application), and the net greenhouse gas balance for the treatment. Finally, we provide an initial assessment of the net CDR potential of silicate treatments deployed over larger areas of acidified forest in the northeastern United States.
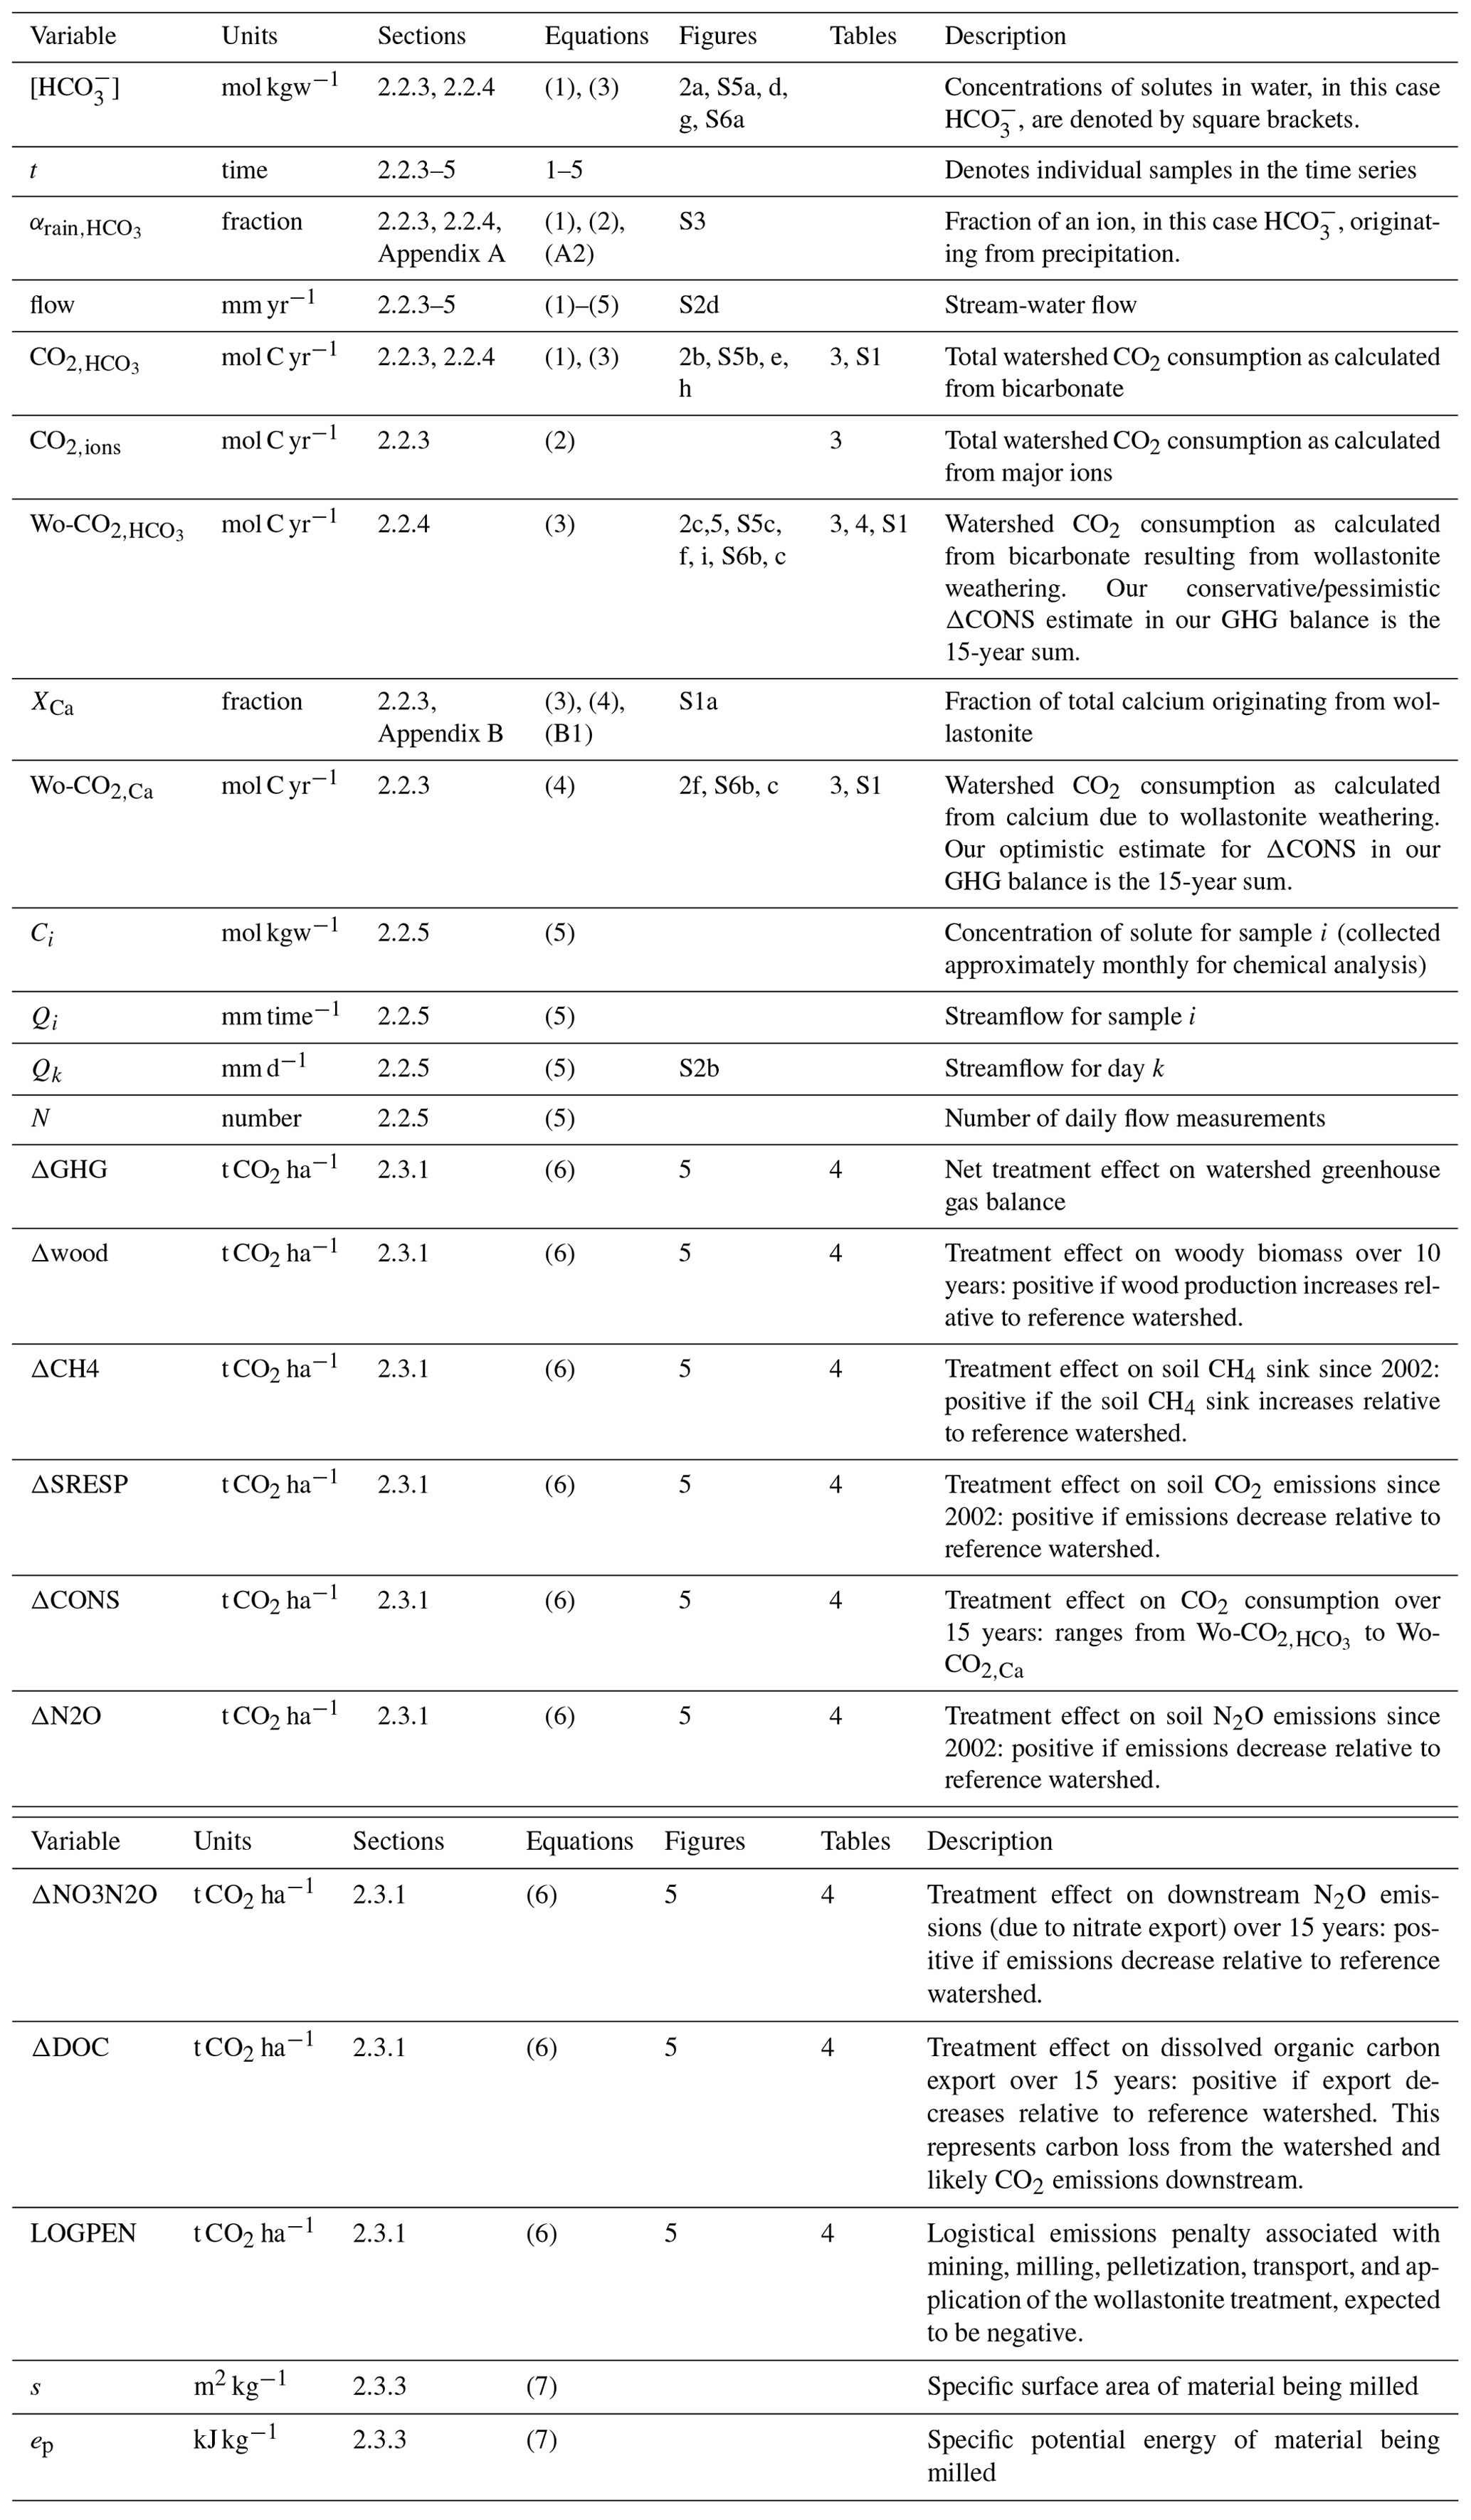
This section describes the site and wollastonite treatment (Sect. 2.1) and our approaches for modelling the inorganic carbon fluxes in stream water (Sect. 2.2) and other greenhouse gas fluxes associated with the treatment (Sect. 2.3). The variables from each of the seven equations in Methods are tabulated in Table 1 along with the section, equation, figure, and table numbers where they appear.
2.1 Site and treatment
2.1.1 Site description
The HBEF has a temperate climate with ∼ 1400 mm mean annual precipitation of which up to one-third falls as snow (Campbell et al., 2007). The mean temperatures in January and July are −9 and 18 ∘C respectively, and the period from mid-May to mid-September comprises the growing season (Campbell et al., 2007). There are six small southeast-facing watersheds in the HBEF (Fig. 1) with 20 %–30 % slopes (Groffman et al., 2006), including one which received the silicate treatment (watershed W1, 11.8 ha, 488–747 m a.s.l.) and a biogeochemical reference (watershed W6, 13.2 ha, 545–791 m a.s.l.). Carbonate and evaporite minerals are in very low abundance (< 1 % calcite in the crystalline rocks and glacial deposits) in these silicate-mineral-dominated watersheds (Johnson et al., 1981). Well-drained Typic Haplorthod soils with pH < 4.5 and mean depth of 0.6 m formed from relatively impermeable glacial till, which restricts water flow and protects the underlying schist bedrock from weathering. Overland runoff and flow through bedrock are both thought to be negligible (Likens, 2013). Hydrologically, the HBEF watersheds are typical of small catchments in northern New England (Sopper and Lull, 1965). Flow rates for W1 and W6 along with stream-water pH are shown in Fig. S1 in the Supplement. Prior to treatment, stream-water calcium concentrations were under 30 µmol L−1 while bicarbonate concentrations were under 5 µmol L−1, below the ranges for typical world rivers (Moon et al., 2014) (60–2293 µmol Ca2+ L−1, 179–4926 µmol HCO L−1).
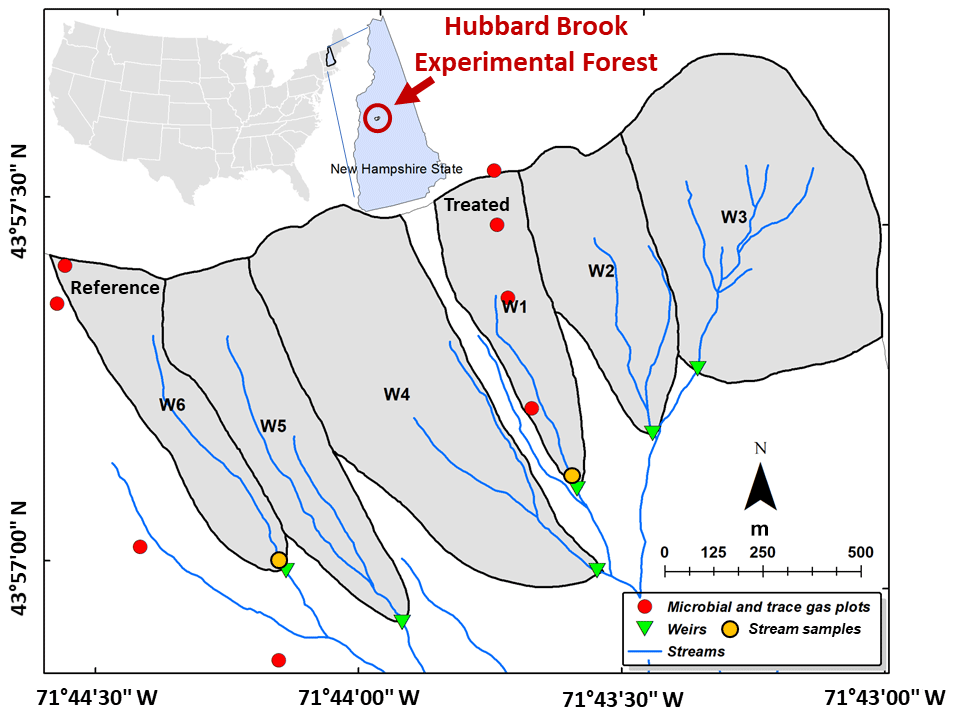
Figure 1Location of the sampling sites and experimental watersheds. Our stream-water samples were collected just upstream of the weirs in the treated and reference watersheds (gold discs), and our trace gas samples were collected at different elevations in treated (W1) and untreated (W6) forests (red discs).
Fagus grandifolia Britt., Betula alleghaniensis Ehrh., and Acer saccharum Marsh. are the dominant trees in this northern hardwood forest, while Betula papyrifera Marsh., Abies balsamea (L.) Mill., and Picea rubens Sarq. are common at the highest elevations where soils tend to be shallow and wetter (Cho et al., 2012). A. saccharum and P. rubens are both calcium-sensitive, but soil calcium-bearing minerals are less available to A. saccharum (Blum et al., 2002), and total bioavailable calcium content decreases with elevation (Cho et al., 2012). This silicate-addition experiment was designed to replace bioavailable calcium which had been stripped from the soils by decades of acid deposition.
2.1.2 Treatment description
On 19 and 21 October 1999, W1 was treated with 344 g m−2 of pelletized wollastonite (CaSiO3) by a GPS-equipped helicopter with a motorized spreader to ensure even deployment across the catchment, including the 1804 m2 streambed (Peters et al., 2004). Following treatment, the lignin-sulfonate binder forming the pellets dissolved within several days (Peters et al., 2004), and the ground wollastonite itself dissolved rapidly in the upper Oie soil horizon, increasing Oie base saturation from 40 % to 78 % and raising soil pH from 3.88 to 4.39 within 1 year (Johnson et al., 2014). Although the budget of wollastonite-derived calcium (Wo-Ca) has never been closed due to lack of data from vegetation and from deeper soil layers (Shao et al., 2016), it is thought that uptake by vegetation and retention by soil exchange sites delayed transport of Wo-Ca to lower soil horizons and stream water for 3 years (Johnson et al., 2014).
2.2 Geochemical modelling and CO2 consumption fluxes
CO2 consumption, the CDR pathway most closely associated with ERW, can be calculated from concentrations of either bicarbonate or the base cations released during weathering (Reaction R1). These two approaches may provide different answers if bicarbonate is reduced in the presence of other acids (Reactions R2–R4). To calculate bicarbonate-derived CO2 consumption, we must model the speciation of dissolved inorganic carbon (DIC). This depends on two variables which must also be modelled because we do not have a time series: stream-water pCO2 and stream-water temperature. We then calculate total catchment CO2 consumption fluxes and treatment effects, taking care to account for differences in sampling frequency between chemistry samples and water flow measurements.
2.2.1 Forward modelling of stream-water chemistry including dissolved inorganic carbon
We used a forward modelling approach to calculate dissolved stream-water bicarbonate concentrations ([HCO]stream) in the treated and reference watersheds (Fig. 1) over ∼ 25 years, including 15 years post-treatment, with the United States Geological Survey (USGS) aqueous geochemistry software PHREEQC version 3.3.12-12704 (Parkhurst and Appelo, 1999) and monthly long-term (1992–2014) stream-water (Driscoll, 2016b, a) and rain and snow precipitation (Likens, 2016b, a) chemistry measurements.
Using MATLAB (version R2016a) scripts, we wrote PHREEQC input files and determined the inorganic carbon species for each stream-water sample with PHREEQC. Along with a standard database which decouples ammonium and nitrate (Amm.dat, provided with the PHREEQC software), we included the ionization constants for the organic acid triprotic analogue and the constants for Al complexation described for Hubbard Brook streams (Fakhraei and Driscoll, 2015) in our PHREEQC simulations. These are pKa1 = 2.02, pKa2 = 6.63, pKa3 = 7.30, pKAl1 = 4.07, pKAl2 = 7.37, pKAl3 = 6.65, and site density m = 0.064 mol sites mol C−1. Our organic acid concentrations are the product of the corresponding site density of reactions and the measured dissolved organic carbon concentration (Fakhraei and Driscoll, 2015); these were PHREEQC inputs along with total monomeric Al and major ion concentrations from the longitudinal datasets.
Spectator ions (Cl− and NH) were adjusted to achieve charge balance given the measured pH for the treated and reference watersheds. Cl− was only adjusted when charge balance was not achieved using NH alone. This was deemed to be the case when PHREEQC failed to converge or when the percent error exceeded 5 %. We used original rather than adjusted rainwater Cl to calculate the contribution of rainwater to stream-water chemistry (described below). These adjusted ions were then held constant for our modelled scenarios, while pH was allowed to vary.
Exploratory PHREEQC tests (charge balancing on DIC) either with or without organic acids suggest that the acids depress total DIC, HCO, and also the saturation state of gaseous CO2. Similar variability in the saturation is also observed when DIC values from partially degassed samples from the streams are used as input. We chose minimum and maximum values of 1100 and 1700 ppm, or ∼ 3 and 4.6 × 368, the mean value of Mauna Loa pCO2 (Tans and Keeling, 2017) for 1985–2012. These values correspond to log10(pCO2(g)) = SD derived from a prior analysis of this variability for the same time range (Fakhraei and Driscoll, 2015).
2.2.2 Stream-water temperature
Air temperatures for the Hubbard Brook watersheds (Campbell, 2016) were converted to stream-water temperatures (Mohseni and Stefan, 1999). Rainwater temperatures were set equal to stream-water temperatures. These temperatures were used in our PHREEQC modelling, with equilibrium constants for the DIC species as functions of temperature. Only samples measured closest to the weirs and with a valid pH were processed with PHREEQC.
2.2.3 Total catchment CO2 consumption
We calculate total annual watershed CO2 consumption (Reaction R1) as the product of stream-water flow and stream-water bicarbonate concentration [HCO] at time t corrected for the HCO contribution from rainwater (αrain,HCO3(t), Appendix A):
where [HCO](t) is given in mol kgw−1 and flow(t) is the “runoff” in mm yr−1. Calculated [HCO] and annual CO2 consumption for the treated and reference watersheds (Eq. 1) comprise our baseline simulations and represent a primary test of hypothesized increased carbon capture resulting from weathering of the applied silicate.
Bicarbonate-derived CO2 consumption (Eq. 1) is the most conservative approach to estimating net carbon fluxes related to ERW. For natural freshwaters in equilibrium with the atmosphere, this entails a titration for total alkalinity with a possible correction for the concentration of organic acid anions (Köhler et al., 2000). However, another widely used (Jacobson and Blum, 2003) measure of CO2 consumption is derived by assuming that any base cations (Ca2+, Mg2+, K+, and Na+) released from minerals will be charge-balanced by bicarbonate formation in the oceans:
where the term represents a commonly applied correction for sulfuric acid weathering (Chetelat et al., 2008) (Reaction R2). Contributions from precipitation such as αrain,Ca(t) are calculated by replacing bicarbonate with the individual base cation in Eq. (A2). We tabulate CO2,ions(t) results for comparison with CO below.
2.2.4 Response of CO2 consumption to treatment
To isolate a treatment effect for bicarbonate, we used strontium isotopes as a tracer of wollastonite (Wo) weathering within a previously published mixing function (Nezat et al., 2010; Peters et al., 2004) (Appendix B, Fig. S3). This mixing function provides the fraction XCa of calcium originating from wollastonite (Eq. B1). We remove the contribution of all mineral sources other than wollastonite to CO2 consumption (Eq. 1), which is simulated with Ca2+ concentrations reduced by (1−XCa):
which effectively provides a lower limit on the treatment effect.
We can also derive an upper limit for the treatment effect from Reaction (R1). For an ERW treatment, transient changes in the export of ions not derived from the applied minerals may occur, but we consider that the cations released from the applied minerals comprise the most unambiguous treatment effect in our study. The charge associated with wollastonite-derived Ca2+ (Wo-Ca) determines the CO2 consumption associated with the HBEF wollastonite treatment. Our optimistic treatment effect based on calcium rather than bicarbonate is
Equations (3) and (4), together with our flux calculations accounting for sparsity of concentration data compared to daily flow data (Sect. 2.2.5), should help avoid major uncertainties in catchment-scale CO2 consumption calculations: the provenance of the cations and variations in concentration and discharge (Moon et al., 2014).
2.2.5 Flux calculations
To ensure that fluxes from our two watersheds were comparable and to correct for the sparsity of solute measurements compared to flow measurements, we created rolling annual flow-adjusted fluxes using Method 5 of Littlewood et al. (1998) at five evenly spaced points each year:
where Qi is the measured instantaneous stream flow, Ci is the concentration for sample i, M is the number of stream-water chemistry samples in the year (usually 12), Qk is the kth flow measurement, and N is the number of flow measurements. In our case, daily flow measurements (Campbell, 2015) and approximately monthly stream-water samples (Driscoll, 2016b, a) were available. Therefore, the mean concentration for the preceding 12 months is multiplied by the mean flow for the same period, suitably scaled to get the total annual flux. Without sub-daily timestamps for the longitudinal stream-water chemistry data, we used daily total flows rather than instantaneous flows. Tests suggested that there was little difference between using mean daily instantaneous flows and the mean daily total flows.
2.3 Greenhouse gas balance
The success of any treatment for climate change mitigation is determined by the net greenhouse gas (CO2 equivalent) fluxes prior to and following treatment, at the treatment site and downstream. In addition to increased CO2 consumption, desirable outcomes for a treatment include increased ecosystem carbon storage in biomass and soils and decreases in ecosystem, downstream, and logistical greenhouse gas emissions.
2.3.1 Greenhouse gas budget for the wollastonite treatment
At the HBEF, we have measured the CO2 consumption due to the wollastonite treatment in two different ways and these determine our range of values to be incorporated in our greenhouse gas (GHG) budget. Several other treatment effects can be estimated relative to the reference watershed, but some aspects of the total GHG balance are missing. For example, we have measurements of soil respiration (root + heterotrophic) and dissolved organic carbon (DOC) export in stream water, but we lack measurements of canopy respiration from leaves and stems and export of particulate organic carbon in stream water. Our partial greenhouse gas budget for the HBEF wollastonite treatment will therefore be given by
where our partial GHG treatment effect (ΔGHG) is the sum of greenhouse gas sink and source responses. Measured sinks for the wollastonite experiment include biomass in wood (Δwood), CO2 consumption (ΔCONS), and a soil sink for methane (ΔCH4). Sources include N2O emissions from both soil (ΔN2O) and exported nitrate (ΔNO3N2O) and CO2 emissions from soil respiration (ΔSRESP), exported dissolved organic carbon (ΔDOC), and logistical operations (LOGPEN).
Sink effects are defined as positive if the sink increases and are given by the difference (treated − reference) between the two watersheds, whereas source effects are defined as positive for reductions in greenhouse gas emissions (reference − treated). With these definitions, penalties are negative and reduce ΔGHG in Eq. (6). Logistical emissions and CO2 consumption due to weathering of applied wollastonite are zero for the reference watershed, so we expect LOGPEN to be negative and ΔCONS to be positive.
Wood is a longer-term carbon sink than leaves or twigs so we have chosen to let this represent our biomass increment. Equation (6) neglects ecosystem disturbances including fire and possible carbonate mineral precipitation in soils. There is no evidence for the latter at the HBEF.
We used a range of emissions factors for N2O to estimate the penalty associated with nitrate export (ΔNO3N2O); low: 0.0017 kg N2O-N kg−1 DIN (Hu et al., 2016) and high: 0.0075 kg N2O-N kg−1 DIN (De Klein et al., 2006), where DIN is dissolved inorganic nitrogen dominated by nitrate. This N2O was then converted to CO2e (CO2 equivalents in terms of cumulative radiative forcing) given the 100-year time horizon global warming potential (Pachauri et al., 2014) (GWP100) for N2O: 265 g CO2e g−1 N2O. Likewise, ΔCH4 was converted to CO2e (CO2 equivalents in terms of cumulative radiative forcing) given GWP100 for CH4: 28 g CO2e g−1 CH4.
2.3.2 Carbon sequestration in wood
We calculate our treatment effect on wood production as the difference between the treated and reference watershed mean wood production (Battles et al., 2014) over two 5-year periods. We considered these differences (treated − reference) to be an estimate of the treatment effect on potentially long-term (decades to centuries) biomass carbon sequestration. Assuming 46.5 % of the woody biomass is carbon (Martin et al., 2018), our calculated cumulative additional C sequestration in the treated watershed over 10 years was 20.7 mol C m−2 (9.1 t CO2 ha−1). Our optimistic and pessimistic values are derived from the 95 % confidence intervals for the 5-year mean values (Battles et al., 2014).
2.3.3 Greenhouse gas emissions from soils
Measurements (Groffman, 2016) were taken at four elevations in the treated watershed and at points just west of the reference watershed starting in 2002 (Fig. 1). Gas samples were collected from chambers placed on three permanent PVC rings at each of these eight sites (Groffman, 2016). The data were not normally distributed so were analysed with Kruskal–Wallis tests at the 0.05 significance level; however, tests with one-way ANOVA produced the same overall results. All analyses were done in MATLAB R2016a.
Cumulative curves for each of the 24 chambers were generated by matching the dates of the measurements, excluding points which were missing data for any chamber and allowing up to a week's discrepancy between catchments. Nearly all discrepancies were within 1 d. Assuming diurnal variation was minor compared to seasonal variation, each datum (g C m−2 h−1) was multiplied by 24 h and by 30 d to get g C m−2 per month. There was no extrapolation to fill gaps in the dataset; results are internally consistent but not comparable to other datasets. We were particularly interested in the elevation-specific responses, as the different elevations have distinct tree species compositions and below-ground responses to the wollastonite treatment (Fahey et al., 2016).
The HBEF experimental watersheds are divided into 25 × 25 m plots on slope-corrected grids. Vegetation has been surveyed four times since the late 1990s and assigned a zone designation in each plot (Driscoll et al., 2015a, b; Battles et al., 2015b, a) (Fig. S12). To estimate the respiration savings over the whole watershed, we added the areas of individual plots which were assigned to our four vegetation types (low, middle, and high hardwoods and spruce–fir). Because there were seven vegetation types in the datasets, we compared all types with pairwise Kruskal–Wallis tests at the 0.05 significance level using the basal area data for the six dominant tree species. Kruskal–Wallis tests were appropriate because the data, and therefore the differences from the means (residuals), were not normally distributed. These tests suggested that the “extra” vegetation types (“birch–fern glade” and “poor hardwoods” at high elevations and mid-elevations) could be combined with spruce–fir and high and middle hardwoods respectively. Watershed fractions for our combined forest types were 0.155 for spruce–fir, 0.16 for high hardwoods, 0.415 for middle hardwoods, and 0.27 for low hardwoods. When creating our composite treatment effects for the entire watershed, we considered a treatment effect to be present only where our statistical analyses suggested significantly different fluxes.
2.3.4 Logistical carbon emissions costs
We used the 1999 upstate New York CO2 emission factor for electricity generation from oil (United States Environmental Protection Agency, 1999) (0.9 Mg CO2 MWh−1) and rearranged Eq. (28) of Stamboliadis et al. (2009):
where the specific surface area s (1600 m2 kg−1 for our treatment) is related to the specific potential energy ep of the material (kJ kg−1), with theoretical parameters (Stamboliadis et al., 2009) α = 139 m2 kJ−1 and μ = 0.469 (dimensionless). We convert this potential energy to MWh t−1 Qz (3600 s h−1 and 1000 kWh MWh−1). The equation was derived for quartz (Qz) which has hardness 7. Because wollastonite hardness is in the range 5–5.5, this equation may overestimate the energy needed to grind the wollastonite.
The main energy source in Allerton will have been coal, and the 1999 Illinois emissions factor (United States Environmental Protection Agency, 1999) is 1.1 Mg CO2 MWh−1. The monetary cost is USD 0.041 kWh−1 for pelletization of limestone fines and USD 0.85 t−1 product, so we estimate 20.73 kWh t−1 product.
Table 2Logistical penalty calculations for the Hubbard Brook wollastonite treatment.
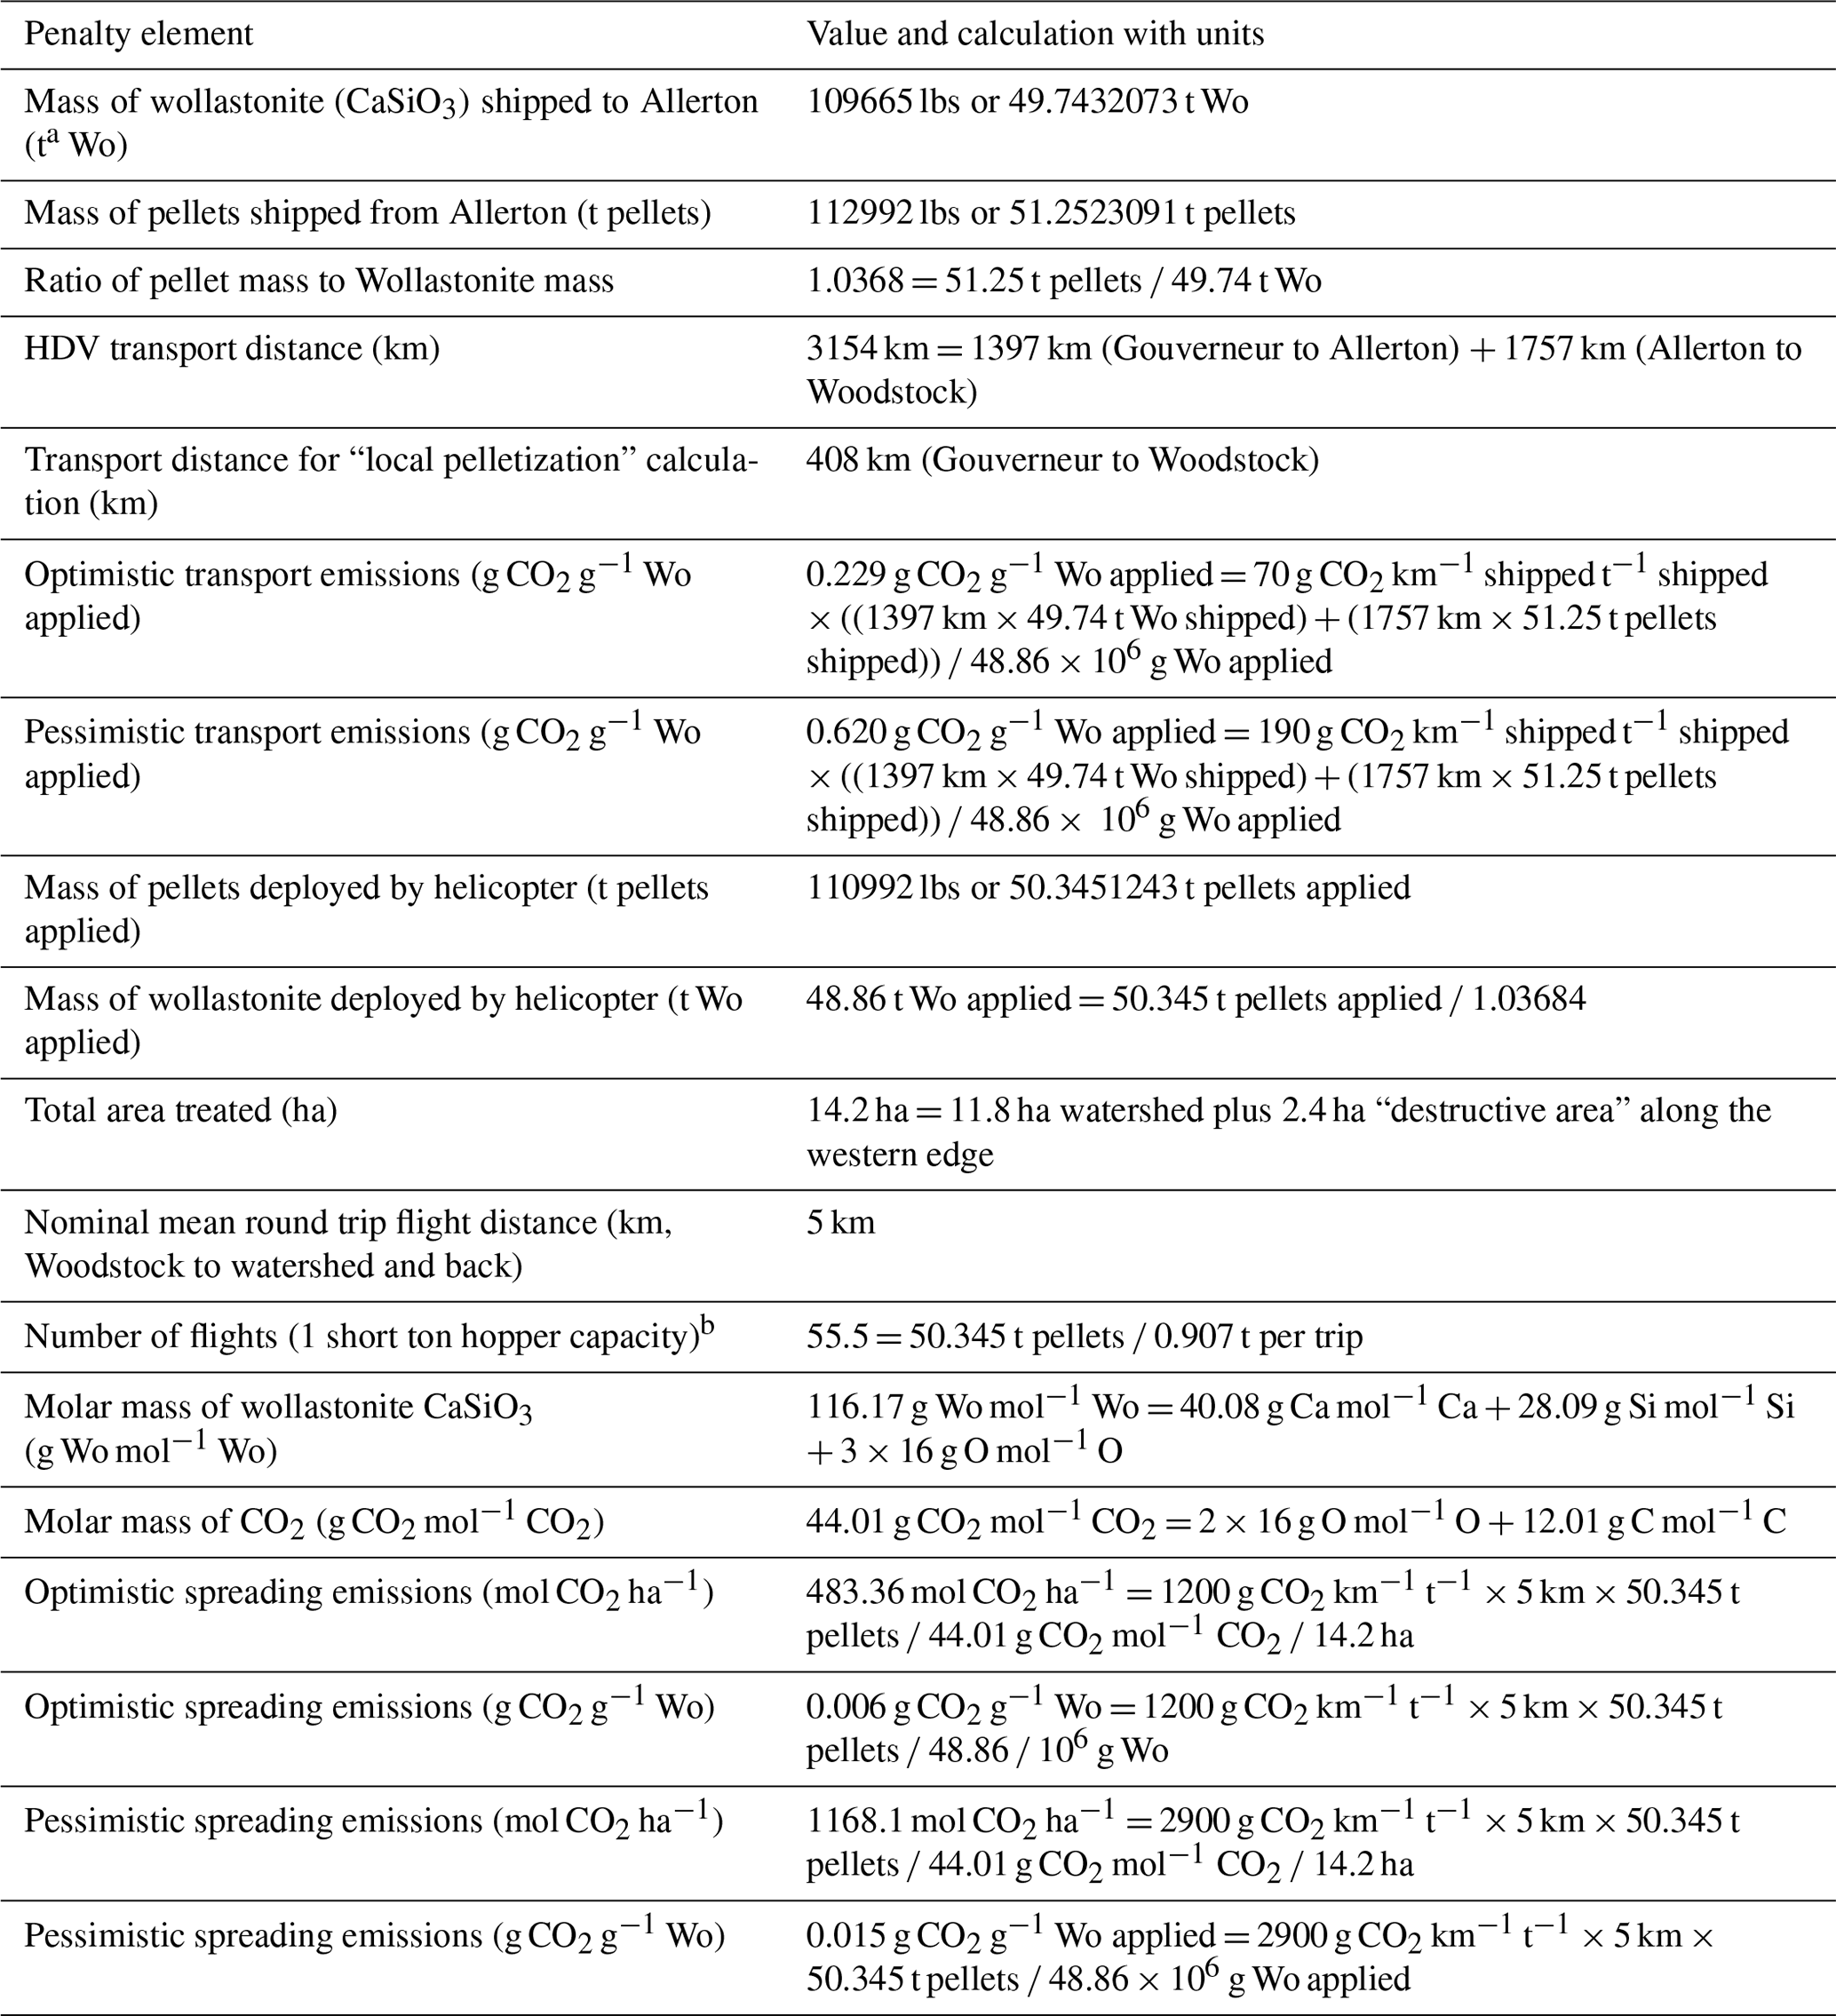
a Megagrammes or metric tons, not short tons. b Number of flights does not explicitly enter into penalty calculations because the emissions for short-haul aircraft are multiplied by the 5 km round trip distance and the entire mass transported, rather than the mass transported during one round trip (one short ton).
Road transport distances were estimated using Google Maps (1397 km from Gouverneur to Allerton, 1757 km from Allerton to Woodstock, 408 km from Gouverneur to Woodstock). We used standard emissions ranges (Sims et al., 2014) for heavy-duty vehicles (HDVs) (70–190 g CO2 km−1 t per rock) and for short-haul cargo aircraft (1200–2900 g CO2 km−1 t−1). Calculation details are given in Table 2. The MATLAB script used for these calculations is available on request. Note that t refers to megagrammes, not US short tons.
3.1 Wollastonite treatment increased stream-water CO2 export
We first consider the time series of stream-water changes in Ca2+ concentrations in the treated ([Ca]Treated) and reference ([Ca]Ref) watersheds. Immediately after treatment, [Ca]Treated increased from < 30 to ∼ 60 µmol L−1 and then slowly declined over the next decade, remaining persistently above [Ca]Ref for 15 years (Fig. 2a). The initial post-treatment peak represents dissolution of wollastonite within the stream (Peters et al., 2004) and release of calcium from hyporheic exchange during the first few years (Shao et al., 2016; Nezat et al., 2010). Retention of Ca2+ ions liberated by wollastonite dissolution (Wo-Ca) in the watershed soils (Nezat et al., 2010) and sequestration into tree biomass (Balogh-Brunstad et al., 2008; Nezat et al., 2010) delayed appearance in stream water for 3 years (Shao et al., 2016; Nezat et al., 2010). Subsequently, [Ca]Treated remained approximately double [Ca]Ref, with a ∼ 30 % contribution from non-wollastonite Ca2+ until 2012. Towards the end of the time series, increased seasonal NO export in the treated watershed between 2012 and 2014 (Rosi-Marshall et al., 2016) led to Wo-Ca displacing non-Wo-Ca from the soil exchanger.
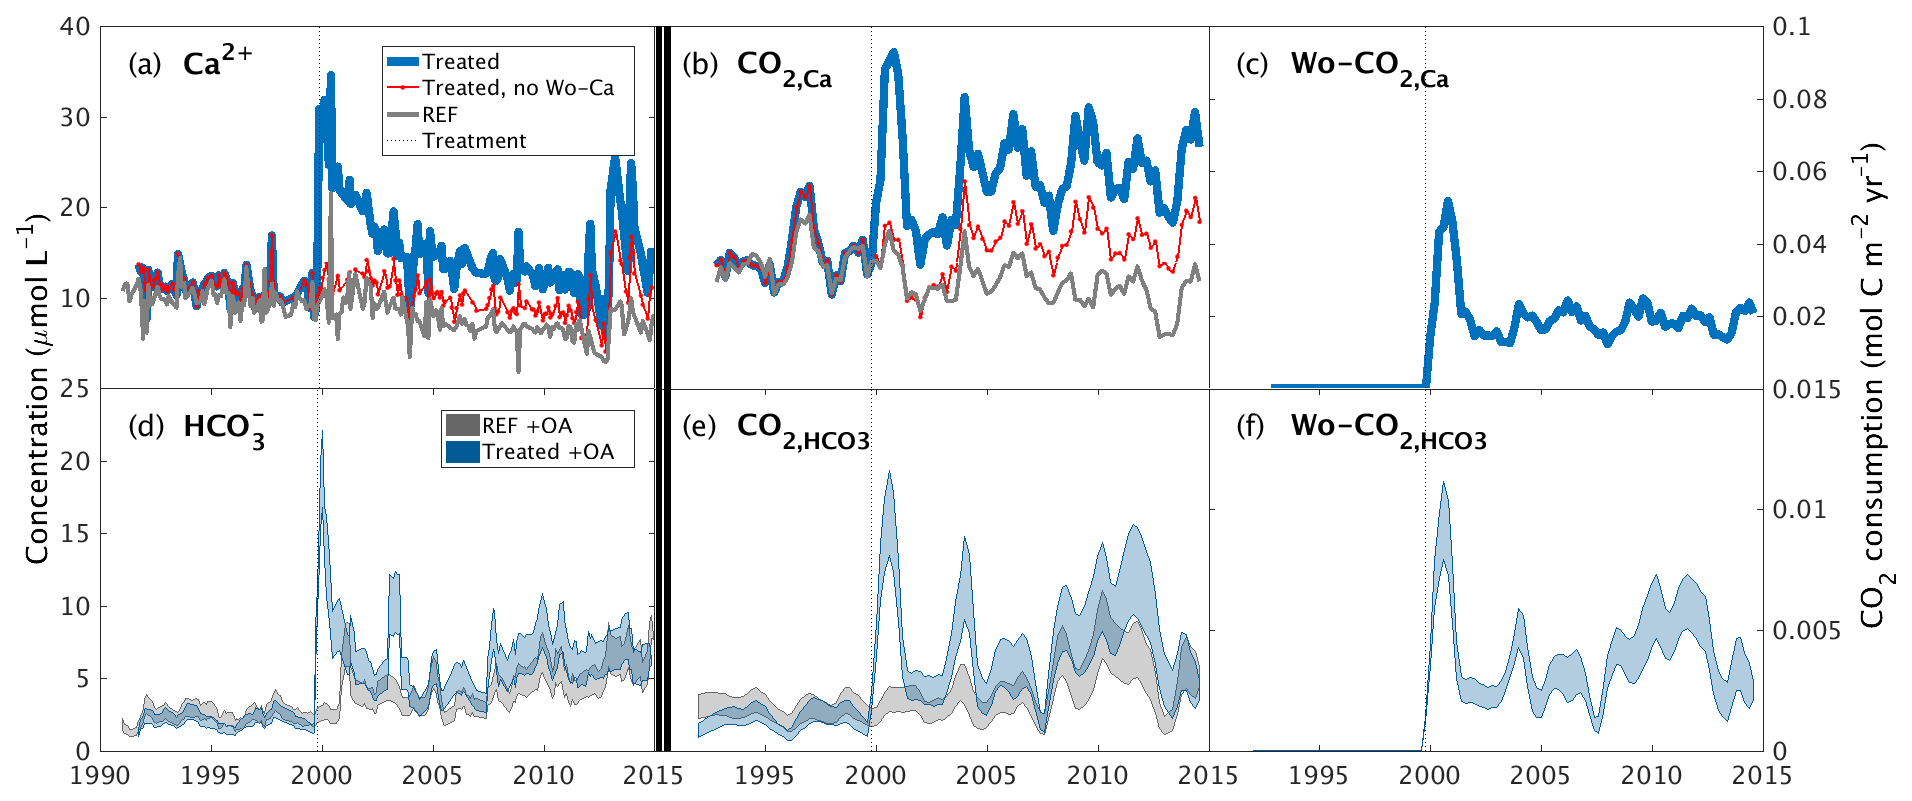
Figure 2Inorganic CO2 capture at the Hubbard Brook Experimental Forest. (a) Observed calcium and (b) calcium export in the reference (grey) and treated (blue) watersheds along with the contribution from sources other than wollastonite (red) and the time of treatment (vertical dotted line). (c) Calculated CO2 consumption due to the treatment (Wo-CO2,Ca, Eq. 9). (d) Modelled stream-water bicarbonate, (e) CO2 consumption (CO, Eq. 5), and (f) CO2 consumption due to the treatment (Wo-CO, Eq. 7); colours as for calcium. Simulations (d–f) account for the presence of organic acids (+OA). All calcium export (b) and CO2 consumption curves (c, e, f) were calculated with flow-normalized concentrations and corrected for sparsity of samples (Methods).
We derived the annual export of Ca2+ from the treated and reference watersheds as the product of mean annual flow-adjusted Ca2+ stream-water concentrations and annual flow (Fig. 2b) (Methods). After accounting for variations in flow, increased stream-water Ca2+ concentrations in the treated watershed are translated into a 2-fold increase in total Ca2+ export relative to the reference watershed that was maintained for 15 years until 2015 through this analysis period. Overall, the wollastonite treatment resulted in a sharp spike in calculated CO2 consumption (Wo-CO2,Ca) that decreased but remained elevated as a result of the treatment (Fig. 2c).
Temporal patterns in modelled stream-water bicarbonate concentration in both treated and reference watersheds (Fig. 2d), and the corresponding total annual CO2 consumption (CO) (Fig. 2e) and CO2 consumption resulting from treatment (Wo-CO) (Fig. 2f), largely mirror changes in stream-water Ca2+ concentrations but are modified by the supply and loss of anions. Calculated flow-adjusted CO2 consumption (Fig. 2e) peaked 2–3 years post-treatment with a broader peak in CO2 consumption evident in 2007–2012 corresponding to declining legacy effects of acid rain until transient NO peaks appeared 2012–2015. Wo-CO shows a pattern that mirrors Wo-CO2,Ca but is generally 5 times lower (Fig. 2c, f).
3.2 Sulfuric, nitric, and organic acids reduce CDR
We next undertook sensitivity analyses to investigate the effects of acid deposition, increased NO, and organic acid export from the treated watershed on bicarbonate concentrations and resulting CO2 consumption (Fig. S5). In a “low-SO4” scenario (Fig. S5a–c), we sought to understand the effects of acid deposition by replacing the mean monthly time series of stream-water and rainwater SO for the treated watershed with a new time series (purple curve, Fig. S5a) created by repeating the post-2010 datasets, which reflect diminished acid deposition following emission controls from the US Clean Air Act (Likens and Bailey, 2014). Removing acid rain effects in this manner dramatically increased the calculated bicarbonate concentrations and total annual CO2 consumption (CO), increasing the initial spikes resulting from the wollastonite treatment in both by at least 4-fold (purple curves, Fig. S5b, c). An additional legacy of acidification in North American forests (Harrison et al., 1989) is SO retention on soil clay mineral Fe and Al oxides (Fuller et al., 1987), which were subsequently released by increased soil pH following wollastonite weathering (Shao et al., 2016; Fakhraei et al., 2016). To assess the effect of this legacy SO, we ran simulations for the treated watershed substituting the lower stream-water SO concentrations from the reference watershed (T REF, green curves, Fig. S5b, c). Results suggest that legacy SO accounts for over half of the total acid deposition effect on increased [HCO] and CO2 consumption in the simulations.
In the “ref NO3” scenario (Fig. S5d–f), seasonal spikes in stream-water export of NO recorded from the treated watershed between 2012 and 2015 were removed by substituting the reference watershed stream-water NO concentration measurements lacking these spikes. This manipulation markedly increased modelled bicarbonate (Fig. S5e) and mean annual CO2 consumption (Fig. S5f). To quantify the effects of organic acids on bicarbonate production in the treated watershed, we ran “+OA” and “−OA” simulations, i.e. with and without accounting for organic acids respectively (Fig. S5g–i). Results showed that removing OA from our simulations also increased modelled stream-water bicarbonate concentration (Fig. S5h), and resulting CO2 consumption (Fig. S5i), in the treated watershed.
3.3 Effects of increasing wollastonite treatment
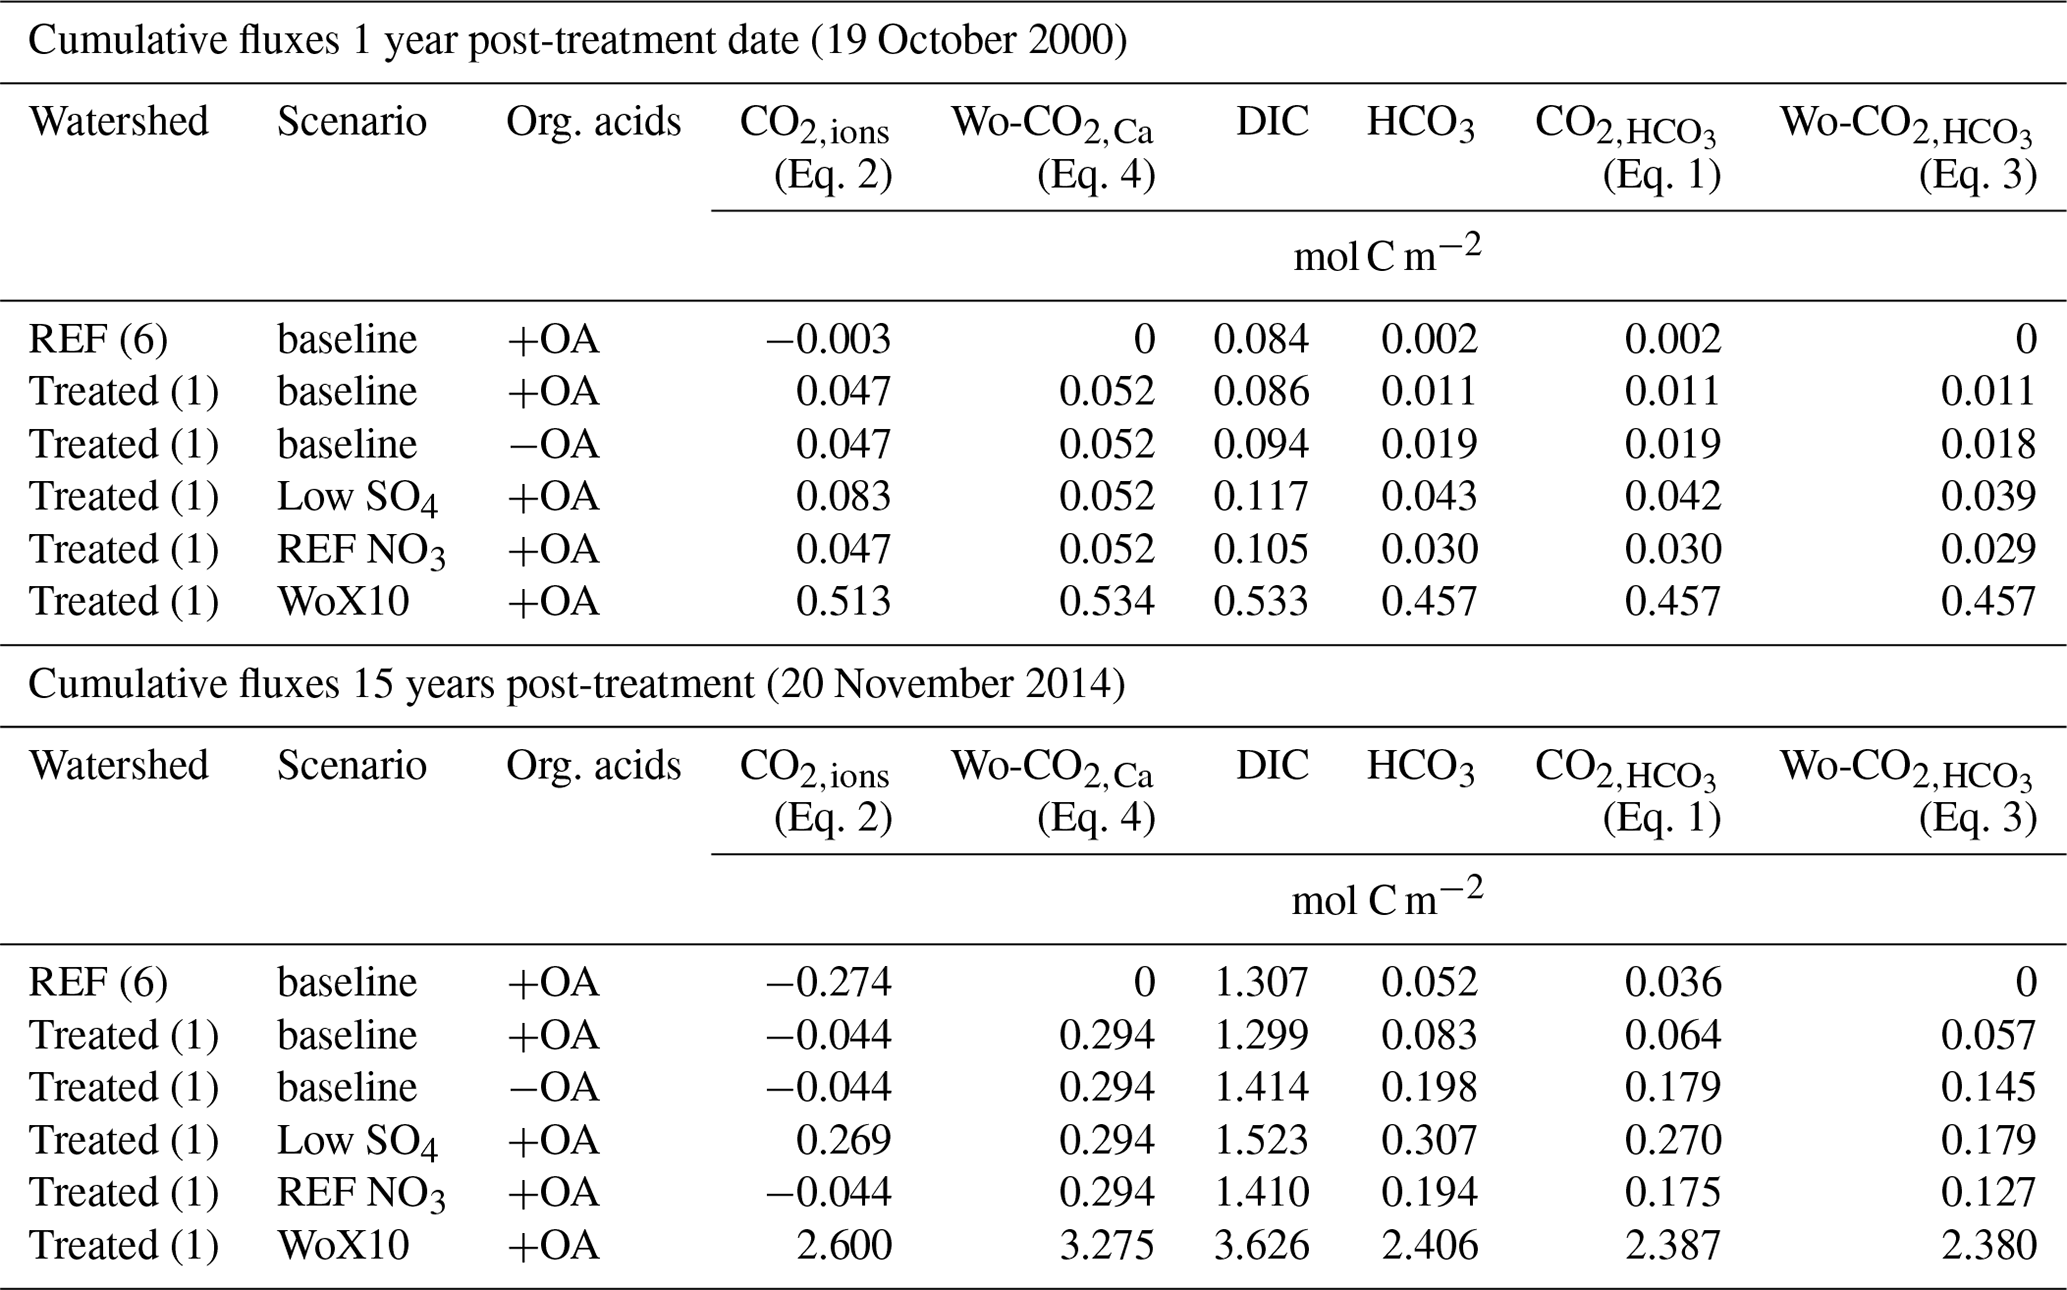
Because the HBEF application rate (3.44 t ha−1) is smaller than the 10–50 t ha−1 suggested for ERW strategies (Strefler et al., 2018; Beerling et al., 2018), we simulated the possible effects of a 10-fold increase in the stream-water Ca2+ concentrations on bicarbonate production (Fig. S6a) and CO2 consumption (Fig. S6b). In this initial assessment, we assume stream-water responses are directly proportional to wollastonite application rate, i.e. 34.4 t ha−1, and that all other variables remained unchanged. Results show that after 15 years, cumulative Wo-CO is 73 % of Wo-CO2,Ca (Fig. S6c), as opposed to less than 20 % for the actual rate of 3.44 t ha−1 (Table 3). These results suggest that at higher application rates of wollastonite, the details of the CO2 consumption calculations become less important.
Table 3Cumulative fluxes from treatment date calculated with stream-water partial pressure of CO2 (gas) = 3.63 × atmospheric CO2 partial pressure measured at Mauna Loa (Tans and Keeling, 2017) (see Methods). DIC: dissolved inorganic carbon. Scenarios are defined in the main text.
3.4 Amplification of organic carbon sequestration by wollastonite treatment
In reversing long-term Ca2+ depletion of soils, the silicate rock treatment significantly increased forest growth and wood production between 2–12 years post-treatment relative to the reference watershed (Battles et al., 2014). This forest response increased total carbon sequestration by 20.7 mol C m−2 or 9.1 t CO2 ha−1 during those 10 years as a result of the treatment (Methods).
Changes in greenhouse gas (GHG) emissions from soils represent a further route to affecting the climate mitigation potential of the wollastonite treatment. Despite a rapid increase of one pH unit in the upper organic soil horizon (Oie), soil respiration CO2 fluxes showed no significant difference between watersheds during the first 3 years after treatment (Groffman et al., 2006). However, our analysis of newly available longer-term datasets indicates that the treatment significantly reduced soil respiration in the high-elevation hardwood zone (∼ 660–845 m a.s.l.) (χ2(1,270) = 17.2, P < 0.001), possibly due to reduced fine-root biomass (Fahey et al., 2016) rather than changes in microbial activity (Groffman et al., 2006). No significant effects on soil respiration were detected in any of the other HBEF vegetation zones (Fig. 3). The wollastonite treatment increased the soil sink strength for CH4 (χ2(1,266) = 30.8, P < 0.001) in the low-elevation hardwood zone (482–565 m a.s.l.), while it decreased in the high-elevation zone (χ2(1,268) = 22.3, P < 0.001) (Supplement, Fig. S8). There were no significant treatment effects on soil N2O fluxes in any vegetation zone (Supplement).
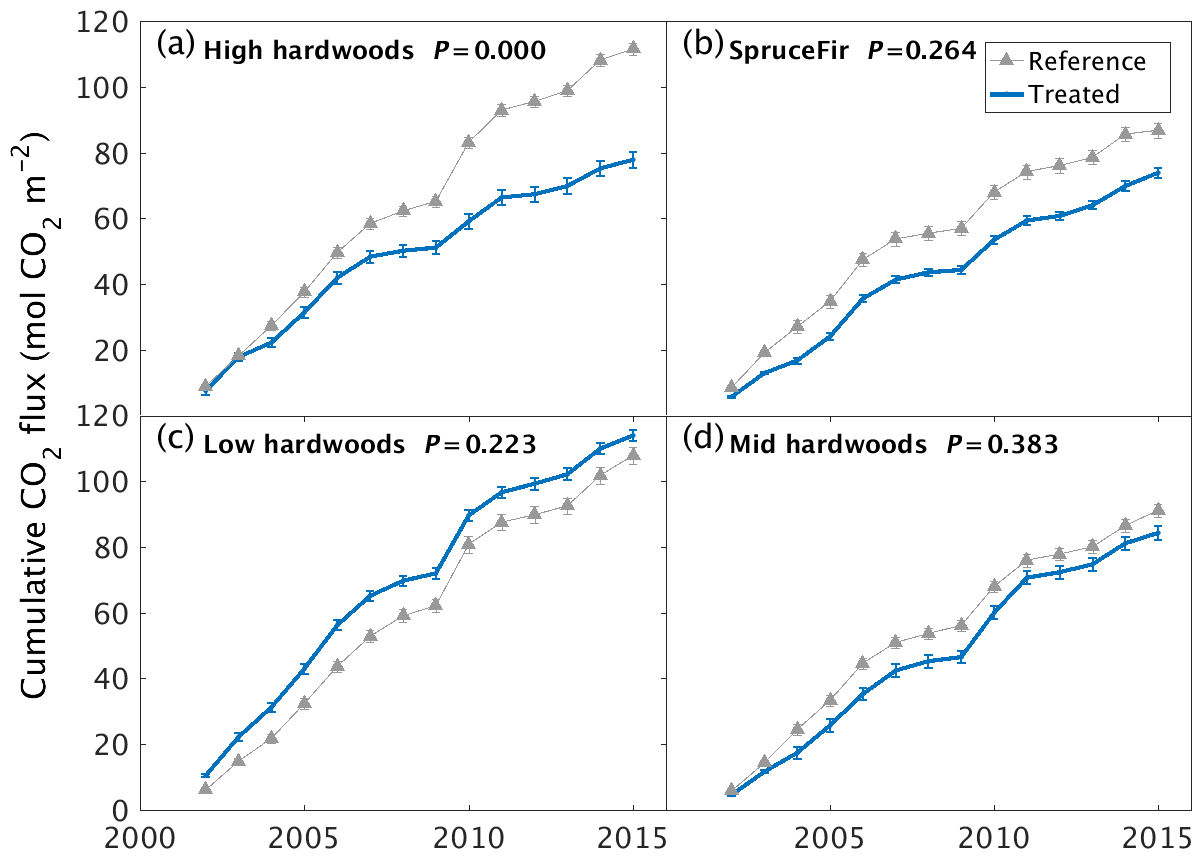
Figure 3Long-term soil respiration responses to wollastonite treatment at Hubbard Brook Experimental Forest. Cumulative soil CO2 respiration responses of treated and untreated (a) high-elevation hardwoods, (b) high-elevation conifers, (c) low-elevation hardwoods, or (d) mid-elevation hardwoods. Plots show cumulative means ±1 SE for three chamber measurements at each site and time. Reference data were collected from untreated forests immediately adjacent to the western edge of our reference catchment. P values from Kruskal–Wallis tests comparing treated and reference raw data (Supplement) are shown.
3.5 Logistical CO2 emissions and net CDR
We next considered carbon emissions (penalties) for logistical operations involved in mining, grinding, transporting, and applying the wollastonite (Fig. 4, Table 2). In the HBEF experiment, wollastonite was mined and milled on site near Gouverneur, New York. We used CO2 emissions factors for electricity generation in upstate New York (United States Environmental Protection Agency, 1999) to estimate the maximum CO2 penalty for mining and grinding to the mean particle size 16 µm diameter (Methods). However, local hydropower (Energy Information Administration, 1997) and regional nuclear power suggest these costs could have been zero. This would represent a substantial carbon saving for the overall ERW process relative to prior expectation of ERW studies in which grinding CO2 emissions account for up to 30 % reduction in ERW–CDR efficiency (Renforth, 2012; Moosdorf et al., 2014).
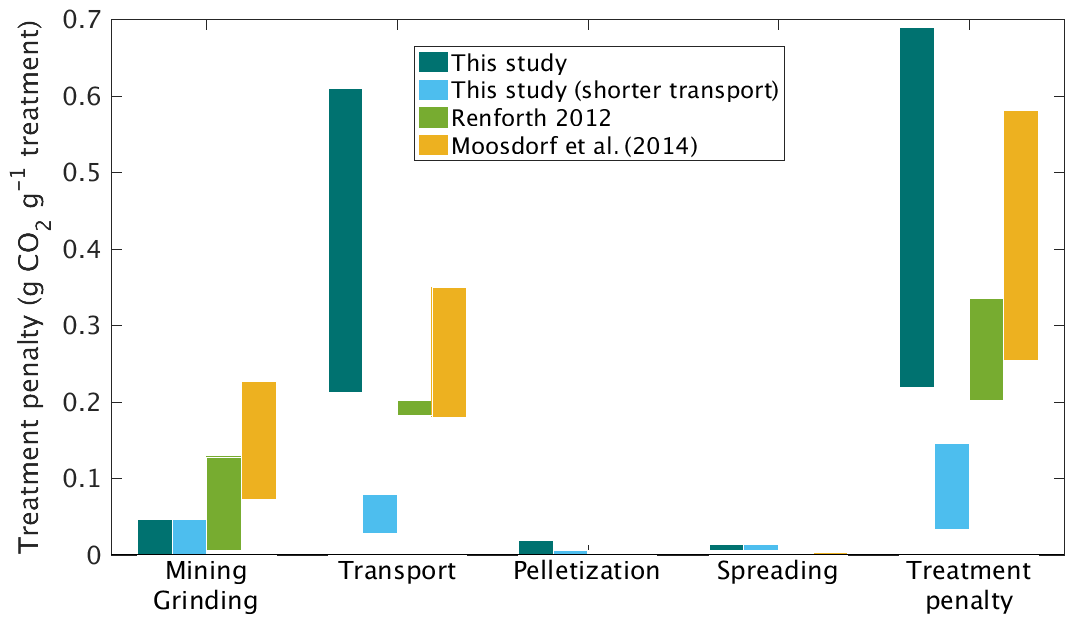
Figure 4Carbon penalties for the wollastonite treatment. Carbon penalties for logistic elements of the treatment are compared with literature estimates for large-scale roll-out of enhanced rock weathering for the HBEF treatment (3.44 t ha−1), with and without long-distance transport for pelletization.
Table 4Measured elements of the treatment effect on the greenhouse gas budget for the Hubbard Brook Experimental Forest wollastonite experiment.
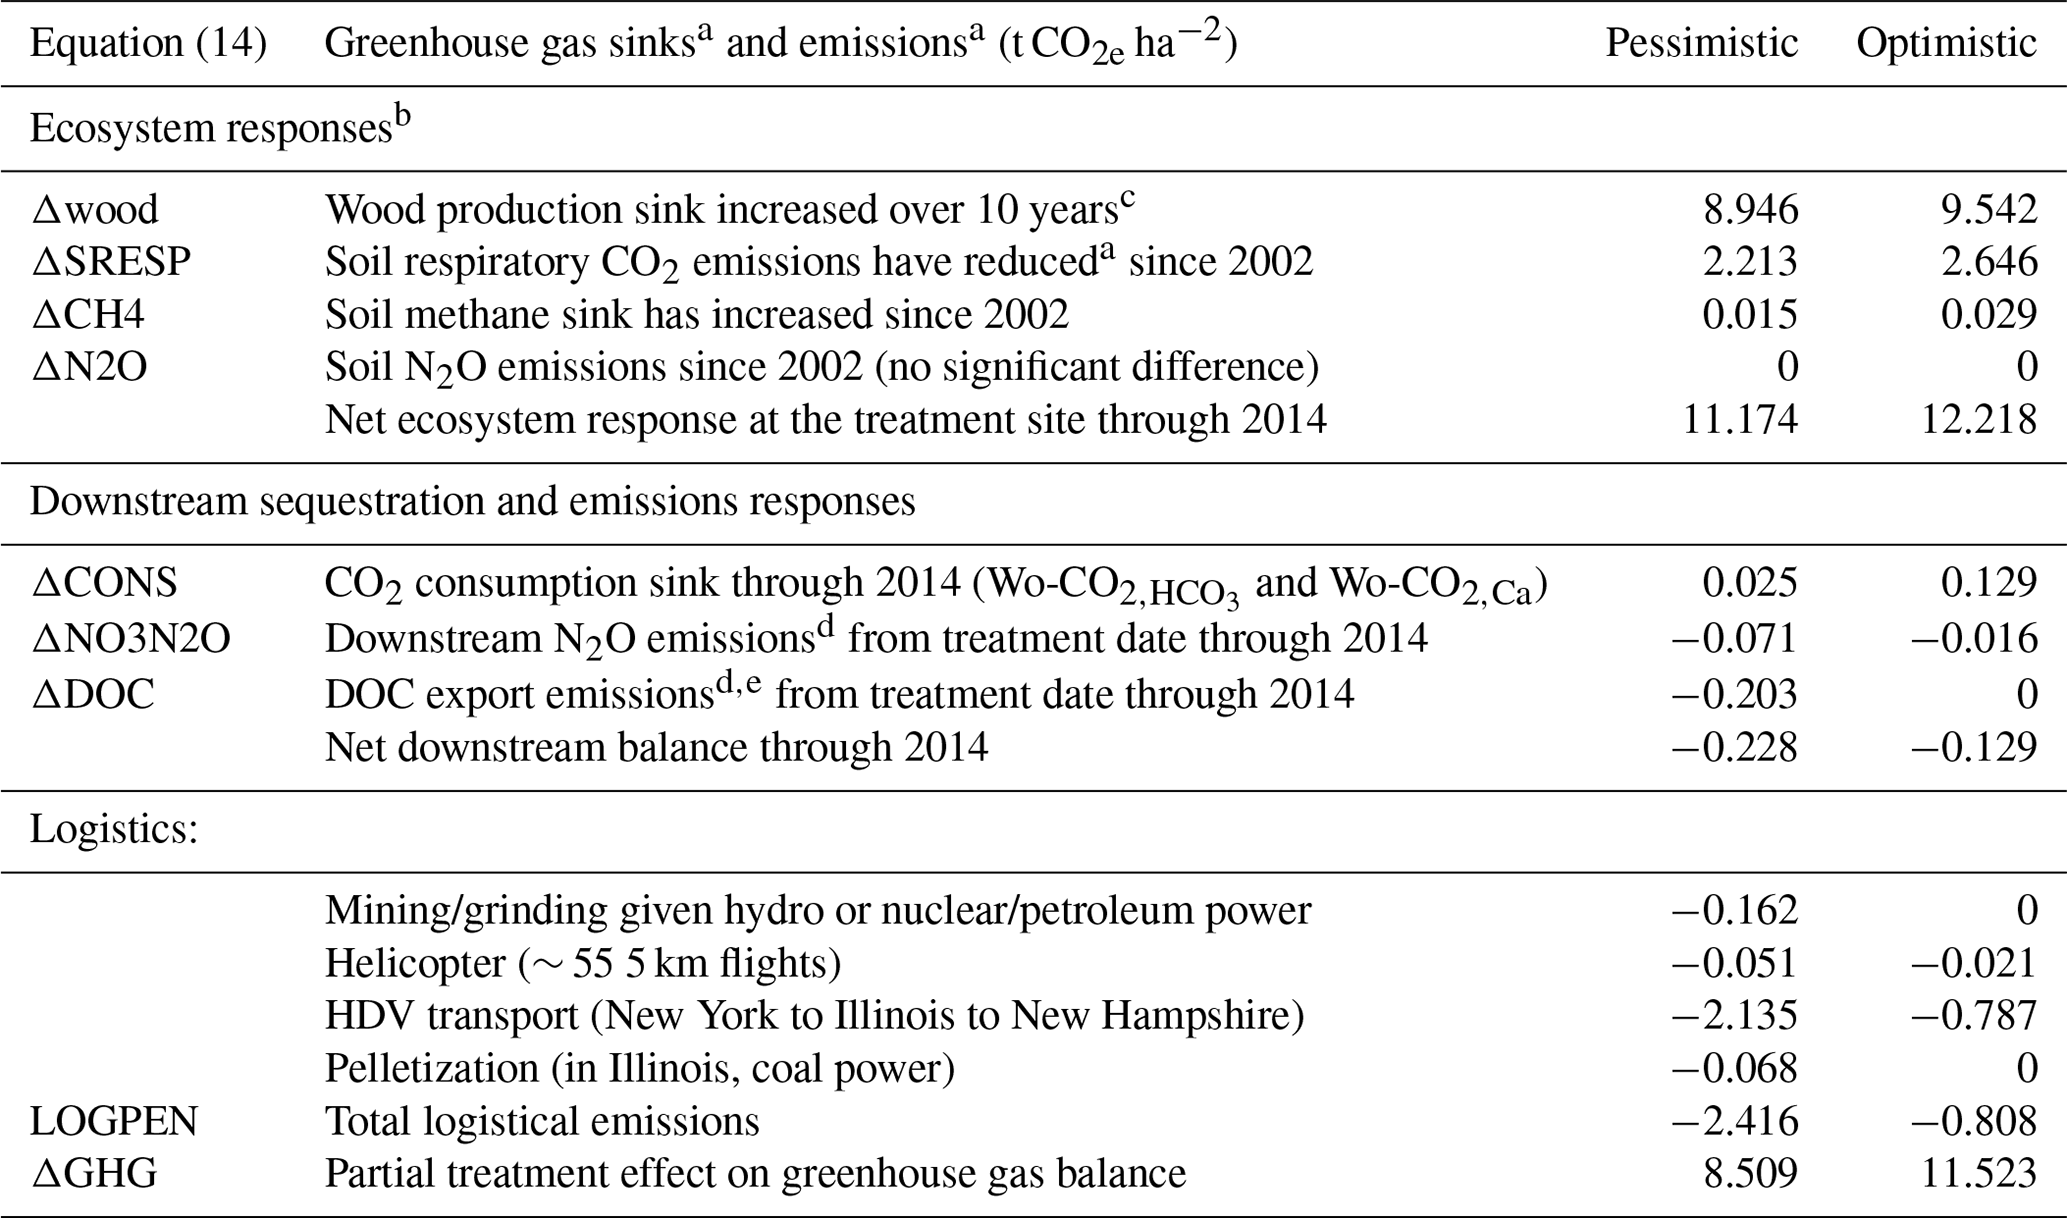
a Defined as the difference between watersheds: treated − reference for sinks and reference − treated for emissions. b Some possible treatment responses such as canopy respiration and particulate organic carbon export are unknown. c After Battles et al. (2014). We have not attempted to extrapolate these results. d ΔDOC and ΔNO3N2O are penalties because these lead to CO2 and N2O emissions downstream. e The “optimistic” value for DOC assumes complete burial and undesirable low-oxygen conditions in downstream waters.
In the HBEF experiment, the milled wollastonite was transported by highway to Allerton, Illinois, for pelletization and then returned to the staging area near Woodstock, New Hampshire (round trip > 3150 km). Transportation CO2 emissions were 0.22–0.61 t CO2 t Wo−1. Given coal power in central Illinois, we estimate pelletization emitted up to 0.02 t CO2 t Wo−1 (Methods). Application at Hubbard Brook occurred via 55 ∼ 5 km helicopter flights, which gives a further CO2 cost of 0.01–0.15 t CO2 t Wo−1. In total, these logistical operations emitted 0.23–0.69 t CO2 t Wo−1 or 0.8–2.4 t CO2 ha−1 for the 11.8 ha of the HBEF treated watershed (Table 4). However, local pelletization could have reduced heavy-duty vehicle (HDV) transport distance to ∼ 400 km and lowered total CO2 emitted during logistical operations to 0.04–0.15 t CO2 t Wo−1. At other forested sites, where wind-drift of material is not critical, pelletization may not be necessary.
These carbon emission penalties must be subtracted from watershed carbon removal to calculate net CDR for the wollastonite treatment at HBEF (Fig. 5; Table 4). Compared in this way, we find increased wood production over 10 years (Battles et al., 2014) repays the total logistical CO2 costs 4–12 times over. The components (Fig. 5; Table 4) comprise 8.5–11.5 t CO2 ha−1 of the total GHG budget associated with the wollastonite treatment (Methods). These figures would increase to 10.4–12.2 t CO2 ha−1 if the wollastonite had been pelletized anywhere along the route from Gouverneur to New Hampshire.

Figure 5Carbon responses for the wollastonite treatment. Elements of the greenhouse gas balance associated with the wollastonite treatment (Table 4). The CO2 consumption range is given by Wo-CO calculated by Eq. (3) and Wo-CO2,Ca calculated by Eq. (4), time-integrated from the application date through 2014. Nitrate export in stream water leading to N2O greenhouse gas emissions downstream and a small increase in the soil CH4 sink have been converted to CO2 equivalents (Methods). Exported DOC is assumed to be respired downstream.
Wollastonite treatment effects on stream-water chemistry play a minor role in the greenhouse gas budget (Fig. 5; Table 4). For our hypothetical 10-fold higher treatment (34.4 t ha−1), CO2 consumption calculated by assumed calcium release is ∼ 10 times higher, but carbon emission penalties scale with increased rock mass. Assuming pelletization near the mine to reduce transport costs, the total logistical penalty would be 1.2–5.1 t CO2 ha−1. In total, net CDR would be 6.8–12.4 t CO2 ha−1 for the 10-fold larger treatment if none of the other GHG fluxes changed. We have not attempted to extrapolate other forest biomass and soil GHG fluxes or stream-water DOC and NO responses.
3.6 Potential for deployment at larger scales
The HBEF forests are representative of a major area of eastern North America receiving acid deposition since the 1950s (Likens and Bailey, 2014) which may be suitable for remediation and carbon capture via ERW treatment with a silicate rock or mineral. For example, the Appalachian and Laurentian-Acadian northern hardwood forests (NHWFs) covering a combined area of 0.137 Mkm2 in the United States (Ferree and Anderson, 2013) have the same dominant hardwood trees as the HBEF experimental watersheds (Fagus grandifolia, Betula alleghaniensis, and Acer saccharum). Acid deposition exceeded “critical loads” likely to harm ecosystems in almost 9000 ha of New Hampshire's Acer saccharum stands (NHAs) (Schaberg et al., 2010). These forests might be expected to respond similarly to a wollastonite treatment. The acid-sensitive trees Acer saccharum and Picea rubens are also widely distributed along the high-elevation acid sensitive regions of the Appalachian Mountains which have already been impacted by acid deposition (Lawrence et al., 2015). We define this as a 40 km corridor along the Appalachian Mountains comprising 0.14 Mkm2 and overlapping with the High Allegheny Plateau (HAL) ecoregion where Acer saccharum is declining above ∼ 550 m a.s.l. (Bailey et al., 2004) (0.07 Mkm2).
We examined the potential CO2 consumption for a range of wollastonite application rates encompassing those suggested for ERW strategies (Strefler et al., 2018; Beerling et al., 2018) (Fig. 6). In this analysis, we adjusted mean (2003–2012) Wo-CO2,Ca for the actual 3.44 t ha−1 treatment (∼ 0.2 mol C m−2 yr−1) proportionally for 10–50 t ha−1 treatments. We assume logistical carbon penalties are minimized and balanced by forest biomass carbon sequestration responses to treatment. This analysis suggests net CDR potential of 0.3–1.7 Mt CO2 yr−1 along the Appalachian corridor, which is 2 %–12 % of New Hampshire state emissions (13.8 Mt CO2) in 2016 (Energy Information Administration, 2019). However, world wollastonite reserves (Curry, 2019) (≥ 0.1 Pg) are insufficient to treat large areas of eastern North America at rates of 10–50 t ha−1, highlighting the requirement for alternative sustainable sources of silicate materials.

Figure 6Projected CO2 consumption following higher-dosage treatments. We considered the possibility of higher-dosage silicate treatments on other northeastern United States higher-altitude forests affected by acid rain, such as Acer saccharum forests in New Hampshire (NHAs), the High Allegheny Plateau (HAL) ecoregion, the Appalachian trail corridor (AT), or northern hardwood forests (NHWFs) dominated by the same tree species as at Hubbard Brook. Because the world's wollastonite reserves (yellow discs) are insufficient to treat these areas, other calcium-rich silicate minerals would be required. CO2 consumption due to higher dosage (t ha−1) is estimated as (mean observed CO2,Ca between 2004 and 2012) × area × dosage ∕ 3.44 t ha−1.
Our analyses of wollastonite application at the HBEF provide a unique long-term (15 year) perspective on the whole watershed carbon cycle responses and net CDR by accounting for the associated CO2 costs of logistical operations. By 2015, net CDR amounted to 8.5–11.5 t CO2 ha−1 at a low rate of wollastonite application, with increased carbon sequestration into forest biomass playing the dominant role. We estimate that if the HBEF application rates were increased 10-fold, net CDR would increase by 8 %, assuming 400 km transport distances and no change in forest responses. Amplification of organic carbon capture may therefore represent a major CDR benefit of ERW when applied to forested lands affected by acid rain. Forest management practices, disturbance regimes, and the ultimate fate of any harvested wood are also important in determining the storage lifetime of the sequestered carbon. Our results highlight the need to carefully monitor the net carbon balance of forested ecosystems in response to a silicate treatment, including wood and canopy respiration (Fahey et al., 2005) (Methods). This challenging goal might best be achieved with fully instrumented eddy covariance plots, although the HBEF topography is not well suited for this approach (Fahey et al., 2005).
Inorganic CO2 consumption calculated based on stream-water bicarbonate fluxes approximately doubled in the treated watershed relative to the reference watershed 15 years post-treatment (0.028 and 0.016 t CO2 ha−1 respectively) (Table 3). The presence of SO, NO, and organic acid anions lowered the efficiency of CO2 consumption by alkalinity generation, with acid deposition having the single largest calculated effect (Table 3). The cause of increased NO export from the treated watershed is not as yet understood (Rosi-Marshall et al., 2016). If it proves a general feature of terrestrial ecosystem responses to silicate mineral treatment, this could affect the efficiency of carbon capture via bicarbonate export. Overall, we suggest that continued recovery of eastern North American and European forests and soils from acid deposition creates conditions beneficial to watershed health, carbonic-acid-driven weathering, and inorganic carbon export following application of crushed silicate minerals.
In Asia, acid rain is an ongoing problem with an estimated 28 % of Chinese land area (∼ 2.7 Mkm2) receiving potentially damaging S deposition in 2005 (Zhao et al., 2009), and critical loads were exceeded in ∼ 0.36 Mkm2 of the European Economic Area (EEA) in 1999 (Larssen et al., 2003), approximately double the affected area of US northern hardwood forests (Fig. 6). Figure 6 suggests that a single 30 t Wo ha−1 treatment over 0.14 Mkm2 (Appalachian Trail corridor) could, in principle, sequester ∼ 1 Mt CO2 yr−1 or 15 Mt CO2 over 15 years via wollastonite-derived Ca export in stream water alone. Adding the Chinese and European acidified areas could potentially sequester 0.34 Gt CO2, approximately 0.2 %–0.7 % of the ∼ 50–150 Gt CDR required by 2050 to avoid warming in excess of 1.5∘ (Rogelj et al., 2018). Inclusion of biomass and soil responses increases CDR contributions from ERW on acidified forests, but these will still be modest. Assuming no further forest responses beyond the 15-year HBEF timeframe, we report a GHG balance of ∼ 10 t CO2e ha−1. This translates to 1 Gt CO2e Mkm−2 suggesting 3.2 Gt CO2e over 15 years for the Appalachian Trail, the EEA, and China combined, or 2 %–6 % of global required CDR as described above.
It is uncertain whether other acidified forest ecosystems would respond similarly to the HBEF Acer saccharum forests in New Hampshire. Many Chinese soils (Duan et al., 2016), as well as old deep soils in areas such as the Virginian Blue Ridge Mountains and the German Harz and Fichtel mountains (Garmo et al., 2014), have high SO sorption capacity. These soils may retain substantially more SO than the HBEF soils, with potential for prolonged SO flushing following ERW treatment and lower bicarbonate production. Liming studies suggest a range of other effects, some of which may also occur with silicate treatments. Liming increases nitrate export, migration of heavy metals and acidity to deeper soil, and fine root production in topsoils leading to frost damage (Huettl and Zoettl, 1993).
Many forests have been limed with carbonate minerals such as calcite and dolomite to mitigate acidification in the past. Dolomite has also helped reverse Mg deficiency in conifers (Huettl and Zoettl, 1993). Liming generally improves water quality, although it also forms mixing zones with high-molecular-weight Al complexes toxic to fish (Teien et al., 2006). With silicate treatments, nontoxic hydroxyaluminosilicates form instead (Teien et al., 2006). Unfortunately, carbonates are contraindicated for CDR on acid soils because they can be a net source of CO2 in the presence of strong acids (Hamilton et al., 2007). Treatments of European and North American acidified forests with calcite (1–18 t ha−1 CaCO3) or dolomite (2–8.7 t ha−1 CaMg(CO3)2) have, in general, resulted in increased DOC export and soil respiration without increasing tree growth, regardless of forest composition (Lundström et al., 2003). As calcite and dolomite are 44 % and 48 % CO2 by weight, these treatments will have released 0.44–7.9 and 0.96–4.54 t CO2 ha−1 respectively when fully dissolved, although dissolution may be slow. Over 6 years following a 2.9 t dolomite ha−1 treatment (90 % 0.2–2.0 mm grains) in a Norwegian coniferous watershed equating to 1.36 t CO2 ha−1, less than 1 % of the dolomite dissolved (Hindar et al., 2003). We estimate that CO2 consumption corrected for CO2 release and as measured with dolomite-derived Ca and Mg in stream water (Dol-CO) averaged 0.02 mol CO2 m−2 yr−1. CO2 release from carbonate minerals equals Ca and Mg release on a molar basis, so 0.02 mol Dol-CO2 m−2 yr−1 was also either exported in stream water or lost to the atmosphere. This experiment may have a negative greenhouse gas balance depending on logistical penalties and soil respiration, as there was no significant treatment effect on tree growth or vitality (Hindar et al., 2003). Ca-sensitive Acer saccharum is present at Woods Lake in New York state, yet tree biomass decreased with no significant differences relative to reference catchments during the 20 years following a 6.89 t Mg-calcite ha−1 application (Melvin et al., 2013), equivalent to 3.07 t CO2 ha−1 given 8 % Mg content of the pellets. In contrast to our study and other liming studies, root biomass and soil carbon stocks increased in response to this treatment, although soil respiration was reduced (Melvin et al., 2013). Acer saccharum basal area and crown vigour increased over 23 years in response to 22.4 t dolomitic limestone ha−1 (equivalent to 10.0 t CO2 ha−1) on the Allegheny Plateau, although basal area and survival of another dominant canopy species, Prunus serotina, was reduced (Long et al., 2011). Clearly, forest responses to mineral treatments are species- and site-specific.
Although the HBEF experiment used wollastonite, this is not a target mineral for ERW, because of both its limited reserves (Curry, 2019) and high monetary costs (Schlesinger and Amundson, 2018). Recent all-inclusive guide prices of ∼ USD 700 Mg−1 for helicopter deployment of pelletized lime along the Appalachian Mountain corridor are comparable to the price of USD 694 Mg−1 for unpelletized 10 µm wollastonite in 2000 (Virta, 2000). Less expensive materials such as locally sourced waste fines from mines or volcanic ash (Longman et al., 2020) should be considered if their heavy metal content is low, but the choice of treatment material should be considered together with the vegetation and the native minerals. Application of magnesium-rich materials (e.g. olivine), for example, may help reverse Mg deficiency in Pinus sylvatica and Picea abies as dolomite has done (Huettl and Zoettl, 1993), but some other tree species, such as Acer saccharum, have a higher demand for calcium than for magnesium (Long et al., 2009). The treatment of ecologically sensitive catchments always requires caution as some species, such as Sphagnum mosses and lichens, may respond poorly to treatment (Traaen et al., 1997).
Finally, we consider integration of ERW treatments with forest management practices. Dominant CDR pathways depend on biogeochemical cycling which in turn depends on the life cycle of the dominant trees. For example, base cation export and therefore CO2 consumption temporarily increases following clear-felling, then decreases while trees are young and growing due to base cation uptake, and remains low after trees mature due to nutrient recycling (Balogh-Brunstad et al., 2008). These dynamics may be less obvious in forests which are not clear-felled; Acer saccharum forests are often thinned and retain a canopy as the seedlings are adapted to shade. Individual Acer saccharum trees can live for over 300 years, growing relatively slowly for the first 40 years and attaining maximum height during the first 150 years (Godman et al., 1990). One may expect to maximize wood production of growing trees with ERW treatments meeting or exceeding the forest demand for previously limited nutrients such as calcium, which would also minimize soil respiration if the trees allocate less carbon to roots. Treatments could be repeated as necessary to meet the nutritional needs of sensitive trees or to maintain high CO2 consumption. Conversely, rising soil pH may not suit some species. For example, Acer saccharum normally grows in organic-rich soils with pH under 7.3 (Godman et al., 1990) and its growth may be hindered at higher pH following large treatments. Outside the main tree growth phase, and in forests without responsive tree species, CO2 consumption could become the dominant GHG response to ERW treatments depending on the extent to which it is counteracted by DOC export as soil pH rises (Johnson et al., 2014) and decomposition rates and fluxes rise (Lovett et al., 2016). Site-specific research is required to determine the optimum dosage, timing, efficacy, and suitability of ERW treatments on acid-impacted forests.
We estimated the contribution of rain and snow (Likens, 2016b, a) relative to all other sources using a previously published mixing model (Négrel et al., 1993). We assume all Cl− in the water is from rain and snow, noting however that this common treatment of Cl as an unreactive tracer is not always justified (Lovett et al., 2005). We calculate the contribution of precipitation to the stream water (αrain) using Na and Cl, which are less affected by nutrient cycling and adsorption than other major ions (Négrel et al., 1993):
To account for attenuation of the rain and snow precipitation leaching through the soil, Cl∕Na and HCO3∕Na at any given time (t) are means from the previous 3 months. We estimate the contribution of rain and snow to other ions such as HCO in the stream water as follows:
We applied an existing two-component mixing model (Peters et al., 2004):
where pre-app and post-app refer to pre-application and post-application stream-water concentrations and Wo refers to wollastonite. The Sr data (Blum, 2019) have been extended through 2015 (Fig. S1a). See Supplement for further discussion of the use of strontium and its isotopes as tracers of Ca2+ provenance.
Our MATLAB code and scripts used for this project are provided in the Supplement, without any guarantees whatsoever.
Our data are available from the Long Term Ecological Research (LTER) Network Data Portal. This public repository can be accessed via the Hubbard Brook Ecosystem Study website: https://hubbardbrook.org/d/hubbard-brook-data-catalog (last access: July 2019). The data include chemistry data for treated and reference watersheds (https://doi.org/10.6073/pasta/fcfa498c5562ee55f6e84d7588a980d2, Driscoll, 2016a; https://doi.org/10.6073/pasta/0033e820ff0e6a055382d4548dc5c90c, Driscoll, 2016b), precipitation chemistry data for treated and reference watersheds (https://doi.org/10.6073/pasta/8d2d88dc718b6c5a2183cd88aae26fb1, Likens, 2016a; https://doi.org/10.6073/pasta/df90f97d15c28daeb7620b29e2384bb9, Likens, 2016b), trace gas flux data (https://doi.org/10.6073/pasta/9d017f1a32cba6788d968dc03632ee03, Groffman, 2016), forest inventory data for 2006 and 2011 (https://doi.org/10.6073/pasta/94f9084a3224c1e3e0ed38763f8dae02, Battles et al., 2015a; https://doi.org/10.6073/pasta/37c5a5868158e87db2d30c2d62a57e14, Battles et al., 2015b) and for 1999 and 2001 (https://doi.org/10.6073/pasta/a2300121b6d594bbfcb3256ca1c300c8, Driscoll et al., 2015a; https://doi.org/10.6073/pasta/9ff720ba22aef2b40fc5d9a7b374aa52, Driscoll et al., 2015b), streamflow data (https://doi.org/10.6073/pasta/727ee240e0b1e10c92fa28641bedb0a3, Campbell, 2015), Sr isotope data (https://doi.org/10.6073/pasta/43ebc0f959780cfc30b7ad53cc4a3d3e, Blum, 2019), and air temperature data (https://doi.org/10.6073/pasta/75b416d670de920c5ace92f8f3182964, Campbell, 2016). See Supplement for a full list of filenames, package IDs, DOIs, and access dates.
The supplement related to this article is available online at: https://doi.org/10.5194/bg-18-169-2021-supplement.
All authors contributed to project conceptualization and interpretation of model results. LLT undertook model simulations and data analysis. LLT and DJB drafted the manuscript with edits and revisions from all authors. CTD designed the wollastonite watershed study and provided data and observations for model simulations. JDB provided strontium isotope datasets. PMG provided soil respiration, nitrous oxide, and methane flux data. GHR contributed to project conceptualization and edited the manuscript.
The authors declare that they have no conflict of interest.
Lyla L. Taylor and David J. Beerling gratefully acknowledge funding from the Leverhulme Trust through a Leverhulme Research Centre Award (RC-2015-029). This paper is a contribution of the Hubbard Brook Ecosystem Study. Hubbard Brook is part of the Long-Term Ecological Research (LTER) network, which is supported by the National Science Foundation (DEB-1633026). Lyla L. Taylor thanks Ruth Yanai for a helpful discussion about vegetation, Fred Worrall for advice on flow adjustment and flux calculation, Peter Wade for advice on the initial PHREEQC setup, and Andrew Beckerman and Evan DeLucia for constructive criticism and advice on statistical modelling. We are grateful to Gregory Lawrence for information about applying lime treatments to the Appalachian Trail corridor, to Lisa Martel for providing the locations of the trace gas sampling sites, and to Habibollah Fahkraei for creating the watershed map with weir and trace gas sampling locations in Fig. 1. We are grateful for comments from W. Brian Whalley and editor Tyler Cyronak and for reviews from Morgan Jones and the anonymous referee which led to major improvements in this paper.
This research has been supported by the Leverhulme Trust (grant no. RC-2015-029) and the National Science Foundation (DEB-1633026).
This paper was edited by Tyler Cyronak and reviewed by Morgan Jones and one anonymous referee.
Bailey, S., Horsley, S., Long, R., and Hallett, R.: Influence of edaphic factors on sugar maple nutrition and health on the Allegheny Plateau, Soil Sci. Soc. Am. J., 68, 243–252, 2004.
Balogh-Brunstad, Z., Keller, C. K., Bormann, B. T., O'Brien, R., Wang, D., and Hawley, G.: Chemical weathering and chemical denudation dynamics through ecosystem development and disturbance, Global Biogeochem. Cy., 22, GB1007, https://doi.org/10.1029/2007GB002957, 2008.
Battles, J. J., Fahey, T. J., Driscoll Jr., C. T., Blum, J. D., and Johnson, C. E.: Restoring soil calcium reverses forest decline, Environ. Sci. Technol. Lett., 1, 15–19, 2014.
Battles, J. J., Driscoll Jr., C. T., Bailey, S. W., Blum, J. D., Buso, D. C., Fahey, T. J., Fisk, M., Groffman, P. M., Johnson, C., and Likens, G.: Forest Inventory of a Calcium Amended Northern Hardwood Forest: Watershed 1, 2011, Hubbard Brook Experimental Forest, Environmental Data Initiative, https://doi.org/10.6073/pasta/94f9084a3224c1e3e0ed38763f8dae02, 2015a.
Battles, J. J., Driscoll Jr., C. T., Bailey, S. W., Blum, J. D., Buso, D. C., Fahey, T. J., Fisk, M., Groffman, P. M., Johnson, C., and Likens, G.: Forest Inventory of a Calcium Amended Northern Hardwood Forest: Watershed 1, 2006, Hubbard Brook Experimental Forest, Environmental Data Initiative, https://doi.org/10.6073/pasta/37c5a5868158e87db2d30c2d62a57e14, 2015b.
Beerling, D. J., Leake, J. R., Long, S. P., Scholes, J. D., Ton, J., Nelson, P. N., Bird, M., Kantzas, E., Taylor, L. L., and Sarkar, B.: Farming with crops and rocks to address global climate, food and soil security, Nat. Plants, 4, 138–147, 2018.
Blum, J. D.: Streamwater Ca, Sr and 87Sr/86Sr measurements on Watershed 1 at the Hubbard Brook Experimental Forest, Environmental Data Initiative, https://doi.org/10.6073/pasta/43ebc0f959780cfc30b7ad53cc4a3d3e, 2019.
Blum, J. D., Klaue, A., Nezat, C. A., Driscoll, C. T., Johnson, C. E., Siccama, T. G., Eagar, C., Fahey, T. J., and Likens, G. E.: Mycorrhizal weathering of apatite as an important calcium source in base-poor forest ecosystems, Nature, 417, 729–731, 2002.
Brantley, S. L., Kubicki, J. D., and White, A. F.: Kinetics of water-rock interaction, Springer, New York, USA, 2008.
Campbell, J.: Hubbard Brook Experimental Forest (USDA Forest Service): Daily Streamflow by Watershed, 1956–present, Environmental Data Initiative, https://doi.org/10.6073/pasta/727ee240e0b1e10c92fa28641bedb0a3, 2015.
Campbell, J.: Hubbard Brook Experimental Forest (USDA Forest Service): Daily Mean Temperature Data, 1955–present, Environmental Data Initiative, https://doi.org/10.6073/pasta/75b416d670de920c5ace92f8f3182964, 2016.
Campbell, J. L., Driscoll, C. T., Eagar, C., Likens, G. E., Siccama, T. G., Johnson, C. E., Fahey, T. J., Hamburg, S. P., Holmes, R. T., and Bailey, A. S.: Long-term trends from ecosystem research at the Hubbard Brook Experimental Forest, Gen. Tech. Rep. NRS-17, US Department of Agriculture, Forest Service, Northern Research Station, Newtown Square, PA, USA, 41 p., 2007.
Campbell, J. L., Rustad, L. E., Boyer, E. W., Christopher, S. F., Driscoll, C. T., Fernandez, I. J., Groffman, P. M., Houle, D., Kiekbusch, J., and Magill, A. H.: Consequences of climate change for biogeochemical cycling in forests of northeastern North America, Can. J. Forest Res., 39, 264–284, 2009.
Cawley, K. M., Campbell, J., Zwilling, M., and Jaffé, R.: Evaluation of forest disturbance legacy effects on dissolved organic matter characteristics in streams at the Hubbard Brook Experimental Forest, New Hampshire, Aquat. Sci., 76, 611–622, 2014.
Chetelat, B., Liu, C.-Q., Zhao, Z., Wang, Q., Li, S., Li, J., and Wang, B.: Geochemistry of the dissolved load of the Changjiang Basin rivers: anthropogenic impacts and chemical weathering, Geochim. Cosmochim. Ac., 72, 4254–4277, 2008.
Cho, Y., Driscoll, C. T., Johnson, C. E., Blum, J. D., and Fahey, T. J.: Watershed-level responses to calcium silicate treatment in a northern hardwood forest, Ecosystems, 15, 416–434, 2012.
Curry, K. C.: Mineral Commodity Summaries: Wollastonite, available at: https://www.usgs.gov/centers/nmic/wollastonite-statistics-and-information, last access: 11 September 2019.
De Klein, C., Novoa, R. S. A., Ogle, S., Smith, K. A., Rochette, P., Wirth, T. C., McConkey, B. G., Mosier, A., and Rypdal, K.: N2O emissions from managed soils, and CO2 emissions from lime and urea application, in: 2006 IPCC Guidelines for National Greenhouse Gas Inventories, Vol 4: Agriculture, Forestry and Other Land Use, edited by: Eggleston, S., Buendia, L., Miwa, K., Ngara, T., and Tanabe, K., Institute for Global Environmental Strategies (IGES), Intergovernmental Panel on Climate Change (IPPC), Kanagawa, Japan, 11.11–11.54, 2006.
Driscoll, C. T.: Longitudinal Stream Chemistry at the Hubbard Brook Experimental Forest, Watershed 1, 1991–present, Environmental Data Initiative, https://doi.org/10.6073/pasta/fcfa498c5562ee55f6e84d7588a980d2, 2016a.
Driscoll, C. T.: Longitudinal Stream Chemistry at the Hubbard Brook Experimental Forest, Watershed 6, 1982–present, Environmental Data Initiative, https://doi.org/10.6073/pasta/0033e820ff0e6a055382d4548dc5c90c, 2016b.
Driscoll, C. T., Bailey, S. W., Blum, J. D., Buso, D. C., Eagar, C., Fahey, T. J., Fisk, M., Groffman, P. M., Johnson, C., Likens, G., Hamburg, S. P., and Siccama, T. G.: Forest Inventory of a Calcium Amended Northern Hardwood Forest: Watershed 1, 2001, Hubbard Brook Experimental Forest, Environmental Data Initiative, https://doi.org/10.6073/pasta/a2300121b6d594bbfcb3256ca1c300c8, 2015a.
Driscoll Jr., C. T., Bailey, S. W., Blum, J. D., Buso, D. C., Eagar, C., Fahey, T. J., Fisk, M., Groffman, P. M., Johnson, C., Likens, G., Hamburg, S. P., and Siccama, T. G.: Forest Inventory of a Calcium Amended Northern Hardwood Forest: Watershed 1, 1996, Hubbard Brook Experimental Forest. Environmental Data Initiative, https://doi.org/10.6073/pasta/9ff720ba22aef2b40fc5d9a7b374aa52, 2015b.
Duan, L., Yu, Q., Zhang, Q., Wang, Z., Pan, Y., Larssen, T., Tang, J., and Mulder, J.: Acid deposition in Asia: emissions, deposition, and ecosystem effects, Atmos. Environ., 146, 55–69, https://doi.org/10.1016/j.atmosenv.2016.07.018, 2016.
Energy Information Administration: Inventory of Power Plants in the United States, United States Department of Energy, Washington, DC, USA, DCDOE/EIA-0095(97), 431 pp., 1997.
Energy Information Administration: Energy-Related Carbon Dioxide Emissions by State, 2005–2016, United States Department of Energy, Washington, D.C. 20585, USA, 34 pp., 2019.
Fahey, T., Siccama, T., Driscoll, C., Likens, G., Campbell, J., Johnson, C., Battles, J., Aber, J., Cole, J., and Fisk, M.: The biogeochemistry of carbon at Hubbard Brook, Biogeochemistry, 75, 109–176, 2005.
Fahey, T. J., Heinz, A. K., Battles, J. J., Fisk, M. C., Driscoll, C. T., Blum, J. D., and Johnson, C. E.: Fine root biomass declined in response to restoration of soil calcium in a northern hardwood forest, Can. J. Forest Res., 46, 738–744, 2016.
Fakhraei, H. and Driscoll, C. T.: Proton and aluminum binding properties of organic acids in surface waters of the northeastern US, Environ. Sci. Technol., 49, 2939–2947, https://doi.org/10.1021/es504024u, 2015.
Fakhraei, H., Driscoll, C. T., Renfro, J. R., Kulp, M. A., Blett, T. F., Brewer, P. F., and Schwartz, J. S.: Critical loads and exceedances for nitrogen and sulfur atmospheric deposition in Great Smoky Mountains National Park, United States, Ecosphere, 7, e01466, https://doi.org/10.1002/ecs2.1466, 2016.
Ferree, C. and Anderson, M. G.: A map of terrestrial habitats of the Northeastern United States: methods and approach, Nature Conservancy, Eastern Conservation Science, Eastern Regional Office, Boston, USA, 2013.
Fuller, R., Driscoll, C., Lawrence, G., and Nodvin, S.: Processes regulating sulphate flux after whole-tree harvesting, Nature, 325, 707–710, 1987.
Garmo, Ø. A., Skjelkvåle, B. L., de Wit, H. A., Colombo, L., Curtis, C., Fölster, J., Hoffmann, A., Hruška, J., Høgåsen, T., and Jeffries, D. S.: Trends in surface water chemistry in acidified areas in Europe and North America from 1990 to 2008, Water Air Soil Poll., 225, 1880, https://doi.org/10.1007/s11270-014-1880-6, 2014.
Godman, R. M., Yawney, H. W., and Tubbs, C. H.: Acer saccharum Marsh. sugar maple, in: Silvics of North America Volume 2, Agriculture Handbook 654, tech. coords. Burns, R. M. and Honkala, B. H., United States Department of Agriculture, Forest Service, Washington, D.C., USA, 1990.
Goodale, C. L. and Aber, J. D.: The long-term effects of land-use history on nitrogen cycling in northern hardwood forests, Ecol. Appl., 11, 253–267, 2001.
Groffman, P. M.: Forest soil: atmosphere fluxes of carbon dioxide, nitrous oxide and methane at the Hubbard Brook Experimental Forest, 1997–present, Environmental Data Initiative, https://doi.org/10.6073/pasta/9d017f1a32cba6788d968dc03632ee03, 2016.
Groffman, P. M., Fisk, M. C., Driscoll, C. T., Likens, G. E., Fahey, T. J., Eagar, C., and Pardo, L. H.: Calcium additions and microbial nitrogen cycle processes in a northern hardwood forest, Ecosystems, 9, 1289–1305, 2006.
Hamilton, S. K., Kurzman, A. L., Arango, C., Jin, L., and Robertson, G. P.: Evidence for carbon sequestration by agricultural liming, Global Biogeochem. Cy., 21, GB2021, https://doi.org/10.1029/2006GB002738, 2007.
Harrison, R. B., Johnson, D. W., and Todd, D. E.: Sulfate adsorption and desorption reversibility in a variety of forest soils, J. Environ. Qual., 18, 419–426, 1989.
Hartmann, J., West, A. J., Renforth, P., Köhler, P., Christina, L., Wolf-Gladrow, D. A., Dürr, H. H., and Scheffran, J.: Enhanced chemical weathering as a geoengineering strategy to reduce atmospheric carbon dioxide, supply nutrients, and mitigate ocean acidification, Rev. Geophys., 51, 113–149, 2013.
Hindar, A., Wright, R. F., Nilsen, P., Larssen, T., and Høgberget, R.: Effects on stream water chemistry and forest vitality after whole-catchment application of dolomite to a forest ecosystem in southern Norway, Forest Ecol. Manag., 180, 509–525, 2003.
Hu, M., Chen, D., and Dahlgren, R. A.: Modeling nitrous oxide emission from rivers: a global assessment, Glob. Change Biol., 22, 3566–3582, 2016.
Huettl, R. F. and Zoettl, H.: Liming as a mitigation tool in Germany's declining forests – reviewing results from former and recent trials, Forest Ecol. Manag., 61, 325–338, 1993.
Jacobson, A. D. and Blum, J. D.: Relationship between mechanical erosion and atmospheric CO2 consumption in the New Zealand Southern Alps, Geology, 31, 865–868, 2003.
Johnson, C. E., Driscoll, C. T., Blum, J. D., Fahey, T. J., and Battles, J. J.: Soil chemical dynamics after calcium silicate addition to a northern hardwood forest, Soil Sci. Soc. Am. J., 78, 1458–1468, 2014.
Johnson, N. M., Driscoll, C. T., Eaton, J. S., Likens, G. E., and McDowell, W. H.: “Acid rain”, dissolved aluminum and chemical weathering at the Hubbard Brook Experimental Forest, New Hampshire, Geochim. Cosmochim. Ac., 45, 1421–1437, 1981.
Köhler, S., Laudon, H., Wilander, A., and Bishop, K.: Estimating organic acid dissociation in natural surface waters using total alkalinity and TOC, Water Res., 34, 1425–1434, 2000.
Larssen, S., Barrett, K. J., Fiala, J., Goodwin, J., Hagen, L. O., Henriksen, J. F., de Leeuw, F., Tarrason, L., and van Aalst, R.: Air quality in Europe: State and trends 1990-99, No. 4-2002, European Environment Agency, Copenhagen, Denmark, 2003.
Lawrence, G., Sullivan, T., Burns, D., Bailey, S., Cosby, B., Dovciak, M., Ewing, H., McDonnel, T., Minocha, R., and Rice, K.: Acidic deposition along the Appalachian Trail corridor and its effects on acid-sensitive terrestrial and aquatic resources: results of the Appalachian Trail MEGA-transect atmospheric deposition effects study, National Park Service, Fort Collins, Colorado, USA, 2015.
Likens, G. E.: Chemistry of Bulk Precipitation at Hubbard Brook Experimental Forest, Watershed 6, 1963–present, Environmental Data Initiative, https://doi.org/10.6073/pasta/8d2d88dc718b6c5a2183cd88aae26fb1, 2016a.
Likens, G. E.: Chemistry of Bulk Precipitation at Hubbard Brook Experimental Forest, Watershed 1, 1963–present, Environmental Data Initiative, https://doi.org/10.6073/pasta/df90f97d15c28daeb7620b29e2384bb9, 2016b.
Likens, G. E.: Biogeochemistry of a forested ecosystem, 3rd edn., Springer Science & Business Media, New York, USA, 208 pp., 2013.
Likens, G. E. and Bailey, S. W.: The discovery of acid rain at the Hubbard Brook Experimental Forest: a story of collaboration and long-term research, in: USDA Forest Service Experimental Forests and Ranges, Springer, New York, USA, 463–482, 2014.
Likens, G. E., Buso, D. C., Dresser, B. K., Bernhardt, E. S., Hall Jr., R. O., Macneale, K. H., and Bailey, S. W.: Buffering an acidic stream in New Hampshire with a silicate mineral, Restor. Ecol., 12, 419–428, 2004.
Littlewood, I., Watts, C., and Custance, J.: Systematic application of United Kingdom river flow and quality databases for estimating annual river mass loads (1975–1994), Sci. Total Environ., 210, 21–40, 1998.
Long, R. P., Horsley, S. B., Hallett, R. A., and Bailey, S. W.: Sugar maple growth in relation to nutrition and stress in the northeastern United States, Ecol. Appl., 19, 1454–1466, 2009.
Long, R. P., Horsley, S. B., and Hall, T. J.: Long-term impact of liming on growth and vigor of northern hardwoods, Can. J. Forest Res., 41, 1295–1307, 2011.
Longman, J., Palmer, M. R., and Gernon, T. M. J. A.: Viability of greenhouse gas removal via the artificial addition of volcanic ash to the ocean, Anthropocene, 32, 100264, https://doi.org/10.1016/j.ancene.2020.100264, 2020.
Lovett, G. M., Likens, G. E., Buso, D. C., Driscoll, C. T., and Bailey, S. W.: The biogeochemistry of chlorine at Hubbard Brook, New Hampshire, USA, Biogeochemistry, 72, 191–232, 2005.
Lovett, G. M., Arthur, M. A., and Crowley, K. F.: Effects of calcium on the rate and extent of litter decomposition in a northern hardwood forest, Ecosystems, 19, 87–97, 2016.
Lundström, U., Bain, D., Taylor, A., and Van Hees, P.: Effects of acidification and its mitigation with lime and wood ash on forest soil processes: a review, Water, Air and Soil Pollution: Focus, 3, 5–28, 2003.
Martin, A. R., Doraisami, M., and Thomas, S. C.: Global patterns in wood carbon concentration across the world's trees and forests, Nat. Geosci., 11, 915–920, https://doi.org/10.1038/s41561-018-0246-x, 2018.
McLauchlan, K. K., Craine, J. M., Oswald, W. W., Leavitt, P. R., and Likens, G. E.: Changes in nitrogen cycling during the past century in a northern hardwood forest, P. Natl. Acad. Sci. USA, 104, 7466–7470, 2007.
Melvin, A. M., Lichstein, J. W., and Goodale, C. L.: Forest liming increases forest floor carbon and nitrogen stocks in a mixed hardwood forest, Ecol. Appl., 23, 1962–1975, 2013.
Mohseni, O. and Stefan, H.: Stream temperature/air temperature relationship: a physical interpretation, J. Hydrol., 218, 128–141, 1999.
Moon, S., Chamberlain, C., and Hilley, G.: New estimates of silicate weathering rates and their uncertainties in global rivers, Geochim. Cosmochim. Ac., 134, 257–274, 2014.
Moosdorf, N., Renforth, P., and Hartmann, J.: Carbon dioxide efficiency of terrestrial enhanced weathering, Environ. Sci. Technol., 48, 4809–4816, 2014.
Négrel, P., Allègre, C. J., Dupré, B., and Lewin, E.: Erosion sources determined by inversion of major and trace element ratios and strontium isotopic ratios in river water: the Congo Basin case, Earth Planet. Sc. Lett., 120, 59–76, 1993.
Nezat, C. A., Blum, J. D., and Driscoll, C. T.: Patterns of Ca/Sr and 87Sr/86Sr variation before and after a whole watershed CaSiO3 addition at the Hubbard Brook Experimental Forest, USA, Geochim. Cosmochim. Ac., 74, 3129–3142, https://doi.org/10.1016/j.gca.2010.03.013, 2010.
Pachauri, R. K., Allen, M. R., Barros, V. R., Broome, J., Cramer, W., Christ, R., Church, J. A., Clarke, L., Dahe, Q., and Dasgupta, P.: Climate change 2014: synthesis report. Contribution of Working Groups I, II and III to the fifth assessment report of the Intergovernmental Panel on Climate Change, IPCC, Geneva, Switzerland, 2014.
Parkhurst, D. L. and Appelo, C.: User's guide to PHREEQC (Version 2): A computer program for speciation, batch-reaction, one-dimensional transport, and inverse geochemical calculations, US Geological Survey, Denver, USA, 326 pp., 1999.
Peters, S. C., Blum, J. D., Driscoll, C. T., and Likens, G. E.: Dissolution of wollastonite during the experimental manipulation of Hubbard Brook Watershed 1, Biogeochemistry, 67, 309–329, https://doi.org/10.1023/B:BIOG.0000015787.44175.3f, 2004.
Renforth, P.: The potential of enhanced weathering in the UK, Int. J. Greenh. Gas Con., 10, 229–243, 2012.
Rogelj, J., Shindell, D., Jiang, K., Fifita, S., Forster, P., Ginzburg, V., Handa, C., Kheshgi, H., Kobayashi, S., Kriegler, E., Mundaca, L., Séférian, R., and Vilariño, M.: Mitigation Pathways Compatible with 1.5 ∘C in the Context of Sustainable Development, in: Global Warming of 1.5 ∘C, an IPCC special report on the impacts of global warming of 1.5 ∘C above pre-industrial levels and related global greenhouse gas emission pathways, in the context of strengthening the global response to the threat of climate change, Intergovernmental Panel on Climate Change, available at: https://www.ipcc.ch/site/assets/uploads/sites/2/2019/05/SR15_Chapter2_Low_Res.pdf (last access: 18 October 2019), 2018.
Rosi-Marshall, E. J., Bernhardt, E. S., Buso, D. C., Driscoll, C. T., and Likens, G. E.: Acid rain mitigation experiment shifts a forested watershed from a net sink to a net source of nitrogen, P. Natl. Acad. Sci. USA, 113, 7580–7583, 2016.
Schaberg, P. G., Miller, E. K., and Eagar, C.: Assessing the threat that anthropogenic calcium depletion poses to forest health and productivity, US Department of Agriculture, Forest Service, Pacific Northwest and Southern Research Stations, Portland, OR, USA, 37–58, 2010.
Schlesinger, W. H. and Amundson, R.: Managing for soil carbon sequestration: Let's get realistic, Glob. Change Biol., 25, 386–389, https://doi.org/10.1111/gcb.14478, 2018.
Sebestyen, S. D., Boyer, E. W., and Shanley, J. B.: Responses of stream nitrate and DOC loadings to hydrological forcing and climate change in an upland forest of the northeastern United States, J. Geophys. Res.-Biogeo., 114, G02002, https://doi.org/10.1029/2008JG000778, 2009.
Shao, S., Driscoll, C. T., Johnson, C. E., Fahey, T. J., Battles, J. J., and Blum, J. D.: Long-term responses in soil solution and stream-water chemistry at Hubbard Brook after experimental addition of wollastonite, Environ. Chem, 13, 528–540, 2016.
Sims, R., Schaeffer, R., Creutzig, F., Cruz-Núñez, X., D'agosto, M., Dimitriu, D., Figueroa Meza, M., Fulton, L., Kobayashi, S., and Lah, O.: Transport, Cambridge University Press, Cambridge, UK and New York, USA, 2014.
Sopper, W. E. and Lull, H. W.: The representativeness of small forested experimental watersheds in northeastern United States, International Association of Hydrological Sciences, 66, 441–456, 1965.
Stamboliadis, E., Pantelaki, O., and Petrakis, E.: Surface area production during grinding, Miner. Eng., 22, 587–592, 2009.
Strefler, J., Amann, T., Bauer, N., Kriegler, E., and Hartmann, J.: Potential and costs of carbon dioxide removal by enhanced weathering of rocks, Environ. Res. Lett., 13, 034010, https://doi.org/10.1088/1748-9326/aaa9c4, 2018.
Tans, P. and Keeling, R.: Mauna Loa CO2 monthly mean data, United States National Oceanic and Atmospheric Administration, Global Monitoring Laboratory, available at: https://www.esrl.noaa.gov/gmd/ccgg/trends/data.html (last access: 15 April 2020), 2017.
Teien, H.-C., Kroglund, F., Åtland, Å., Rosseland, B. O., and Salbu, B.: Sodium silicate as alternative to liming-reduced aluminium toxicity for Atlantic salmon (Salmo salar L.) in unstable mixing zones, Sci. Total Environ., 358, 151–163, 2006.
The Royal Society and the Royal Academy of Engineering: Greenhouse gas removal, 134 pp., available at: https://royalsociety.org/topics-policy/projects/greenhouse-gas-removal (last access: 24 April 2019), 2018.
Traaen, T., Frogner, T., Hindar, A., Kleiven, E., Lande, A., and Wright, R.: Whole-catchment liming at Tjønnstrond, Norway: an 11-year record, Water, Air Soil Poll., 94, 163–180, 1997.
United States Environmental Protection Agency: Emissions & Generation Resource Integrated Database (eGRID), available at: https://www.epa.gov/sites/production/files/2018-02/egrid2016_all_files_since_1996.zip (last access: 16 September 2019), 1999.
Virta, R. L.: Minerals Yearbook: Wollastonite, available at: https://www.usgs.gov/centers/nmic/wollastonite-statistics-and-information (last access: 21 June 2019), 2000.
Zhao, Y., Duan, L., Xing, J., Larssen, T., Nielsen, C. P., and Hao, J.: Soil acidification in China: is controlling SO2 emissions enough?, Environ. Sci. Technol., 43, 8021–8026, https://doi.org/10.1021/es901430n, 2009.
- Abstract
- Introduction
- Methods
- Results
- Discussion
- Appendix A: Contributions of rain and snow precipitation to stream-water chemistry
- Appendix B: Fraction of calcium derived from wollastonite
- Code availability
- Data availability
- Author contributions
- Competing interests
- Acknowledgements
- Financial support
- Review statement
- References
- Supplement