the Creative Commons Attribution 4.0 License.
the Creative Commons Attribution 4.0 License.
 | 15 Mar 2021
Representing methane emissions from wet tropical forest soils using microbial functional groups constrained by soil diffusivity
Debjani Sihi
Xiaofeng Xu
Mónica Salazar Ortiz
Christine S. O'Connell
Whendee L. Silver
Carla López-Lloreda
Julia M. Brenner
Ryan K. Quinn
Jana R. Phillips
Brent D. Newman
Tropical ecosystems contribute significantly to global emissions of methane (CH4), and landscape topography influences the rate of CH4 emissions from wet tropical forest soils. However, extreme events such as drought can alter normal topographic patterns of emissions. Here we explain the dynamics of CH4 emissions during normal and drought conditions across a catena in the Luquillo Experimental Forest, Puerto Rico. Valley soils served as the major source of CH4 emissions in a normal precipitation year (2016), but drought recovery in 2015 resulted in dramatic pulses in CH4 emissions from all topographic positions. Geochemical parameters including (i) dissolved organic carbon (C), acetate, and soil pH and (ii) hydrological parameters like soil moisture and oxygen (O2) concentrations varied across the catena. During the drought, soil moisture decreased in the slope and ridge, and O2 concentrations increased in the valley. We simulated the dynamics of CH4 emissions with the Microbial Model for Methane Dynamics-Dual Arrhenius and Michaelis–Menten (M3D-DAMM), which couples a microbial functional group CH4 model with a diffusivity module for solute and gas transport within soil microsites. Contrasting patterns of soil moisture, O2, acetate, and associated changes in soil pH with topography regulated simulated CH4 emissions, but emissions were also altered by rate-limited diffusion in soil microsites. Changes in simulated available substrate for CH4 production (acetate, CO2, and H2) and oxidation (O2 and CH4) increased the predicted biomass of methanotrophs during the drought event and methanogens during drought recovery, which in turn affected net emissions of CH4. A variance-based sensitivity analysis suggested that parameters related to aceticlastic methanogenesis and methanotrophy were most critical to simulate net CH4 emissions. This study enhanced the predictive capability for CH4 emissions associated with complex topography and drought in wet tropical forest soils.
- Article
(2391 KB) - Full-text XML
-
Supplement
(3254 KB) - BibTeX
- EndNote


This manuscript has been authored by UT-Battelle, LLC, under contract DE-AC05-00OR22725 with the U.S. Department of Energy (DOE). The US government retains and the publisher, by accepting the article for publication, acknowledges that the US government retains a nonexclusive, paid-up, irrevocable, worldwide license to publish or reproduce the published form of this manuscript, or allow others to do so, for US government purposes. DOE will provide public access to these results of federally sponsored research in accordance with the DOE Public Access Plan (http://energy.gov/downloads/doe-public-access-plan, last access: 16 February 2021).
Wet tropical forest soils contribute significantly to global emissions of methane (CH4; Pachauri et al., 2014). Although net emissions of CH4 from upland soils are infrequent in temperate climates, studies show that CH4 emissions are common in wet tropical forests, even in upland soils (Cattânio et al., 2002; Keller and Matson, 1994; Silver et al., 1999; Teh et al., 2005; Verchot et al., 2000). Landscape topography can strongly influence the proportions of CH4 production and oxidation in mountainous tropical regions, affecting net emissions (Silver et al., 1999; O'Connell et al., 2018). Climate, and specifically patterns in rainfall, also affects emissions from tropical forests. Climate change may increase the frequency and severity of extreme rainfall and drought events, altering the spatial and temporal dynamics of CH4 emissions through changes in redox dynamics and substrate availability (Silver et al., 1999; Chadwick et al., 2016; Neelin et al., 2006). Thus, accurately estimating CH4 emissions under a variety of climatic and topographic conditions is important for predicting soil carbon–climate feedbacks in the humid tropical biome.
Several studies have reported the effect of drought events on biogenic CH4 emissions across different wet tropical forest soils. For example, Aronson et al. (2019) demonstrated that the lower soil moisture conditions during the 2015–2016 El Niño event increased consumption of atmospheric CH4 in a wet tropical forest Oxisol of Costa Rica. Similarly, a large-scale, 5-year throughfall exclusion experiment in a moist tropical forest Oxisol in Brazil also reported increased consumption of atmospheric CH4 under the drought treatment, followed by a recovery of CH4 emissions to pre-treatment values after the experiment ceased (Davidson et al., 2004, 2008). Using rainout shelters, Wood and Silver (2012) found spatial variability in CH4 oxidation rates, with an increase of 480 % uptake in valleys in an Ultisol in Puerto Rico. More recently, in a similar Puerto Rico Ultisol, O'Connell et al. (2018) reported increasing consumption of atmospheric CH4 during a Caribbean drought event, followed by increased production of CH4 after the drought was over. The post-drought net CH4 emission rates were higher than the pre-drought emissions, such that the benefits to atmospheric radiation imparted by the lowered emissions during the drought were eliminated. The sharp differences between pre- and post-drought emissions suggested that drought affected the balance of methanogenesis and methanotrophy in the soils, but the study lacked analysis of the microbial community's contributions to these two separate processes.
The concept of “microsites” inside soil aggregates or within soil micropores can help explain the coexistence of oxidative and reductive processes in soils (Silver et al., 1999; Teh and Silver, 2006), which may have occurred in the post-drought period in the O'Connell et al. (2018) study. Oxygen can remain inside micropores during saturated conditions and thereby maintain aerobic microbial respiration; likewise, hypoxic conditions can persist in microsites under extended droughts and thereby maintain anaerobiosis. Additionally, liquid substrates for methanogenesis such as acetate can accumulate in microsites under dry conditions because their diffusion to hungry microbial communities may be restricted. Conversely, gaseous substrates such as CO2 and H2 may accumulate in microsites under saturated conditions because gaseous diffusion can be limited. The observed rapid flush of CH4 in response to a post-drought wetting event (O'Connell et al., 2018) suggests methanogenesis continued during the drought in the Ultisol's microsites, despite low soil moisture and high O2 supply (Andersen et al., 1998; Bosse and Frenzel, 1998; Teh et al., 2005; von Fischer and Hedin, 2002). Finely textured soils common to the humid tropics can facilitate the co-existence of reduced solute and gas species with O2 because the rate of solute and gaseous exchanges is controlled by diffusion into and out of microaggregates (Hall and Silver, 2013; Liptzin et al., 2011; Silver et al., 2013). In particular, hematite precipitation on clay minerals, found in both Oxisols and Ultisols, can enhance formation of soil aggregates because of their high surface area and charge properties (Hall et al., 2016). Soil organic matter can also enhance aggregation and at the same time consume O2 (Six et al., 2004). However, few if any measurements of microsites exist in real field soils.
To explain the diverse observations of CH4 emissions during and after drought across a wet tropical forest catena, we hypothesized that explicit representations of diffusion into and out of microsites for gas and solute transport would be required. To account for the balance of methanotrophy and methanogenesis, separate microbial functional groups for CH4 production and oxidation would need to be defined. Therefore, a microbial functional group model for CH4 production and consumption (Xu et al., 2015) was merged with a soil diffusivity module (Davidson et al., 2012; Sihi et al., 2018) to simulate the dynamics of net in situ CH4 emissions from soil microsites (Sihi et al., 2020a). This module considers three key mechanisms for CH4 production and consumption: aceticlastic methanogenesis (production from acetate), hydrogenotrophic methanogenesis (production from H2 and CO2), and aerobic methanotrophy (oxidation of CH4 and reduction of O2) (Fig. 1). Here we report a modeling experiment to explain contrasting patterns of observed CH4 emissions following a severe drought in 2015, and we provide new data to describe CH4 emissions under non-drought conditions in 2016. We explicitly account for changes in soil moisture, O2, acetate, and microbial functional group dynamics within soil microsites in the model.

Figure 1Conceptual figure of the modeling approach. Panel (a) shows the model representation of soil microsite distribution (modified from Sihi et al., 2020a; also see Eq. 14). The cylinder refers to the volume beneath the soil chambers. The intensity of different cylinder colors in the figure refers to rate of a process or the intensity of a concentration inside microsites in each theoretical cylinder; e.g., a dark color means a higher rate/intensity, and a light color means a lower rate/intensity for a given process. The 2D graph on the right refers to the probability density function of the rate of the process or intensity of the concentration in the bulk soil. A wide distribution skewed to the right (dark line) implies higher bulk rates of the process or higher concentrations, and a narrow distribution skewed to the left (light line) implies lower bulk rates of the process or lower concentrations, of any of the following: solute concentration [Si], gas concentration [Gi], soil moisture (SoilMi), gas and solute diffusion (Diffi), methane production (Prodi), and methane oxidation (Oxi). Panel (b) is the schematic of the microbial-functional-group-based model for simulating soil methane (CH4) dynamics in field soils (modified from Xu et al., 2015). The schematic represents the decomposition of soil organic matter (SOM) and plant litter into carbon dioxide (CO2) and dissolved organic matter (DOC); the production of acetate and hydronium ion (H+) from decomposition and fermentation of DOC, which also decreases pH; the production of acetate and hydronium ion (H+) from homoacetogenesis, which decreases pH; and the production of dihydrogen ion (H2) and CO2 from decomposition of DOC. The intermediary products then have three possible non-mutually exclusive pathways: (1) aceticlastic methanogenesis, which is the production of methane from aqueous acetate found in soil solutions; (2) hydrogenotrophic methanogenesis, which is the production of methane from hydrogen; and (3) methanotrophy, which is the oxidation of methane into carbon dioxide.
2.1 Study site
The study was conducted across a tropical forest catena near the El Verde Field Station in the Luquillo Experimental Forest (LEF) in northeastern Puerto Rico in the United States (latitude 18∘19′16.83′′ N, longitude 65∘49′10.13′′ W). The site is part of a National Science Foundation Long-Term Ecological Research (LTER) and Critical Zone Observatory (CZO) site and is also part of the US Department of Energy's Next Generation Ecosystem Experiment–Tropics. The mean annual temperature at the site is 23 ∘C, and the long-term mean rainfall is approximately 3500 mm yr−1 with low seasonality (Scatena, 1989). Inter-annual variability of rainfall ranges between 2600 and 5800 mm yr−1, sometimes associated with extreme rainfall events (approximately 100 mm d−1) from Caribbean storm systems (Heartsill-Scalley et al., 2007). The LEF is classified as a wet tropical forest according to the Holdridge life zone system, which considers rainfall, elevation, latitude, humidity, and evapotranspiration (Harris et al., 2012).
The landscape at the field site is highly dissected with short catenas, characterized by a land surface distance of <30 m from ridgetop to valley (O'Connell et al., 2018). This study partitioned sampling along a catena from ridgetop, slope, and valley topographic positions (Fig. S1). The soils are clay-rich Ultisols, which were derived from basaltic and andesitic volcanoclastic parent materials. Soils are acidic (average pH is 4.3 and 5.1 in ridge and valley topographic positions, respectively, Fig. 2). The valley soils have approximately 30 % clay and approximately 15 % sand, while the ridge soils have approximately 22 % clay and approximately 30 % sand (Brenner et al., 2019). The soils contain high concentrations of iron (Fe) and aluminum (Al) (oxy)hydroxides where their relative concentrations vary along the catena, and differences in Fe speciation are associated with variable redox conditions (Hall and Silver, 2013, 2015). A detailed soil survey in the immediate vicinity lists three soil types (Zarzal, Cristal, and Prieto) with a minimal litter layer due to rapid decomposition (Parton et al., 2007; Cusack et al., 2009), surface (A) horizons 5 cm thick, and B horizons 130 to 150 cm thick (Soil Survey Staff, 1995). The surface soil bulk density ranged from 0.5 to 0.7 g cm−3, and by 25 cm depth it ranged from 0.8 to 1.1 g cm−3 (Cabugao et al., 2021), similar to previous observations (Johnson et al., 2014; Silver et al., 1999). The forest composition is relatively diverse, with the mature tabonuco (Dacryodes excelsa Vahl) and sierra palm (Prestoea montana) trees being most dominant (Scatena and Lugo, 1995; Wadsworth, 1951).
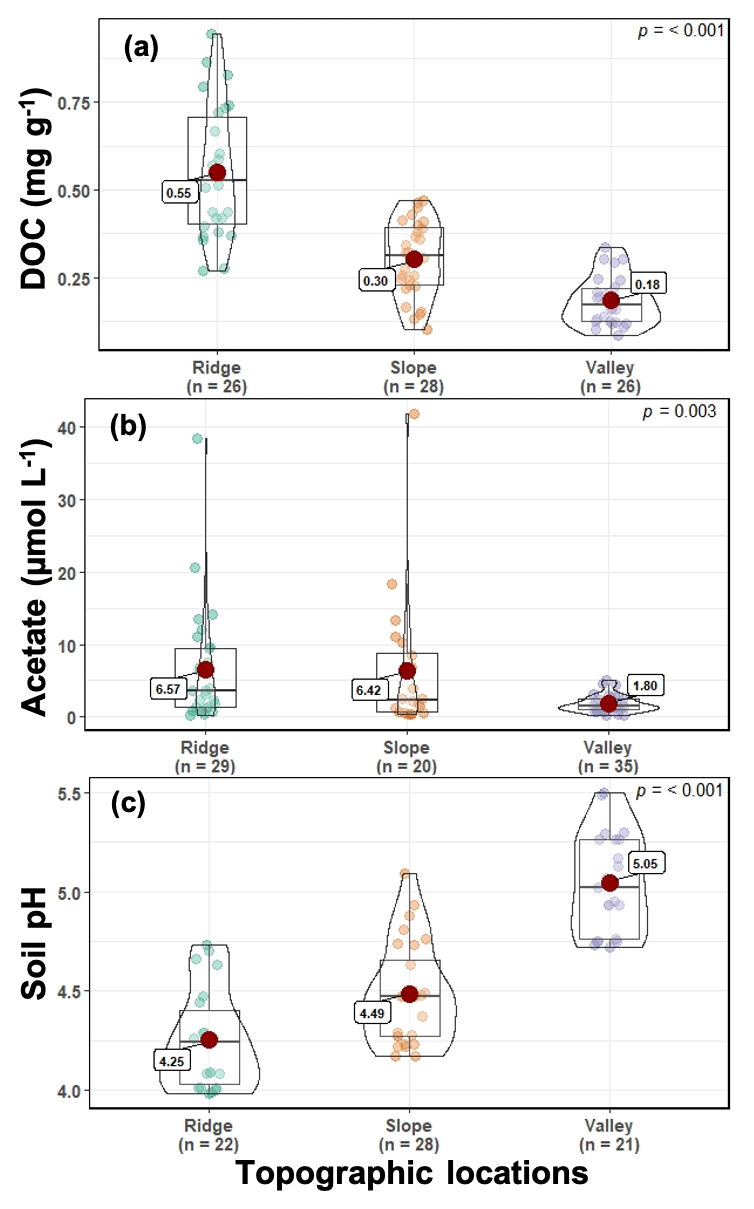
Figure 2Soil and porewater chemistry (dissolved organic carbon [DOC], a; acetate, b; and pH, c) along the ridge–slope–valley topographic gradient.
2.2 Soil and porewater sampling
Previous CH4 measurements in the LEF at the soil surface, 10 cm depth, and 35 cm depth found the highest CH4 concentrations at 10 cm depth (Silver et al., 1999), while 30 cm depth was the location of maximum soil organic carbon (SOC) concentrations (Johnson et al., 2014). To initialize the model, soil and soil water samples were collected from depths ranging from 0–30 cm in accordance with these previous studies. Soil samples were collected in triplicate from a depth of 0–10 cm and on a quarterly timeframe from the ridgetop, slope, and valley positions for over 2 years. The soil pH was determined using a 1 : 2 ratio of soil : solution using a glass electrode with 0.005 M CaCl2 as the equilibrated soil solution (Thomas, 1996; Sihi et al., 2020b). Porewater samples were collected approximately weekly for over 2 years using MacroRhizon soil water samplers (length = 5 cm) (Rhizosphere Research Products B.V., Wageningen, the Netherlands) installed at both 5–10 and 25–30 cm depth in triplicate in the ridge, slope, and valley topographic positions (Sihi et al., 2020c). The soil water samples were analyzed for organic acid concentrations (acetate) using high-performance liquid chromatography (Dionex ICS-5000+ Thermo-Fisher Waltham, MA, USA) with the Dionex IonPac AS11-HC column using a potassium hydroxide eluent and gradient elution. The samples were analyzed for total dissolved organic carbon (DOC) using a Shimadzu total organic C analyzer (Shimadzu TOC-L CSH/CSN analyzer, Baltimore, MD, USA). The soil and porewater measurements were conducted in 2017–2018 (the number of samples n ranged between 20 and 35, Fig. 2) to initialize different model parameters for the catena, because measurements were not available for 2015–2016. To that end, the chemical data were used as the reference characteristics of the bulk soil, and the temporal evolution of DOC, acetate, and soil pH at the microsites was calculated using probability distributions of soil moisture and O2 across soil microsites over the 2-year measurement window. Soil bulk density and particle density values were taken from O'Connell et al. (2018).
2.3 In situ methane flux and soil driver measurements
Campbell Scientific CS 655 soil moisture and temperature sensors and Apogee SO-110 O2 sensors were co-located with soil gas flux chambers at 15 cm soil depth along the catena, each with five replications along five transects (Fig. S1) (O'Connell et al., 2018). Following Liptzin et al. (2011), soil O2 sensors were installed in gas-permeable soil equilibration chambers (295 cm3). Data from these sensors were collected hourly using Campbell Scientific CR10000 data loggers and AM16/32B multiplexers (Campbell Scientific, Logan, UT, USA), which were processed using site-based calibration equations.
Soil flux chambers were placed on the top of the soil surface. Soil CH4 emissions along the catena were measured during 2015 (26 February to 23 December, O'Connell et al., 2018; Silver, 2019) and 2016 (5 April to 18 July) (Sihi et al., 2020d) using a cavity ring-down spectroscopy gas analyzer (Picarro G2508, Santa Clara, CA, USA) connected to 12 automated eosAC closed dynamic soil chambers (Pumpanen et al., 2004) using a multiplexer (Eosense Inc., Dartmouth, Nova Scotia, Canada). Data for soil CH4 emissions were processed using eosAnalyze-AC (v3.5.0) software followed by a series of quality control protocols (O'Connell et al., 2018). We used daily average values of drivers (soil temperature, soil moisture, and O2 concentrations) and CH4 emissions in the modeling exercise. See O'Connell et al. (2018) for more information on the soil sensor, chamber arrays, and the data analysis pipeline.
The data from the 2015 Caribbean drought was partitioned into four distinct periods (O'Connell et al., 2018): (1) pre-drought from day of year (DOY) 57 to 115 (dark gray on Fig. 3), (2) the drought from DOY 116 to 236 (medium gray on Fig. 3), (3) drought recovery from DOY 237 to 328 (light gray on Fig. 3), and (4) post-drought from DOY 329 to 354 (white on Fig. 3). Total precipitation during the drought period was 700 mm in 2015 and 1088 mm during the same time frame in 2016 (Zimmerman, 2000).
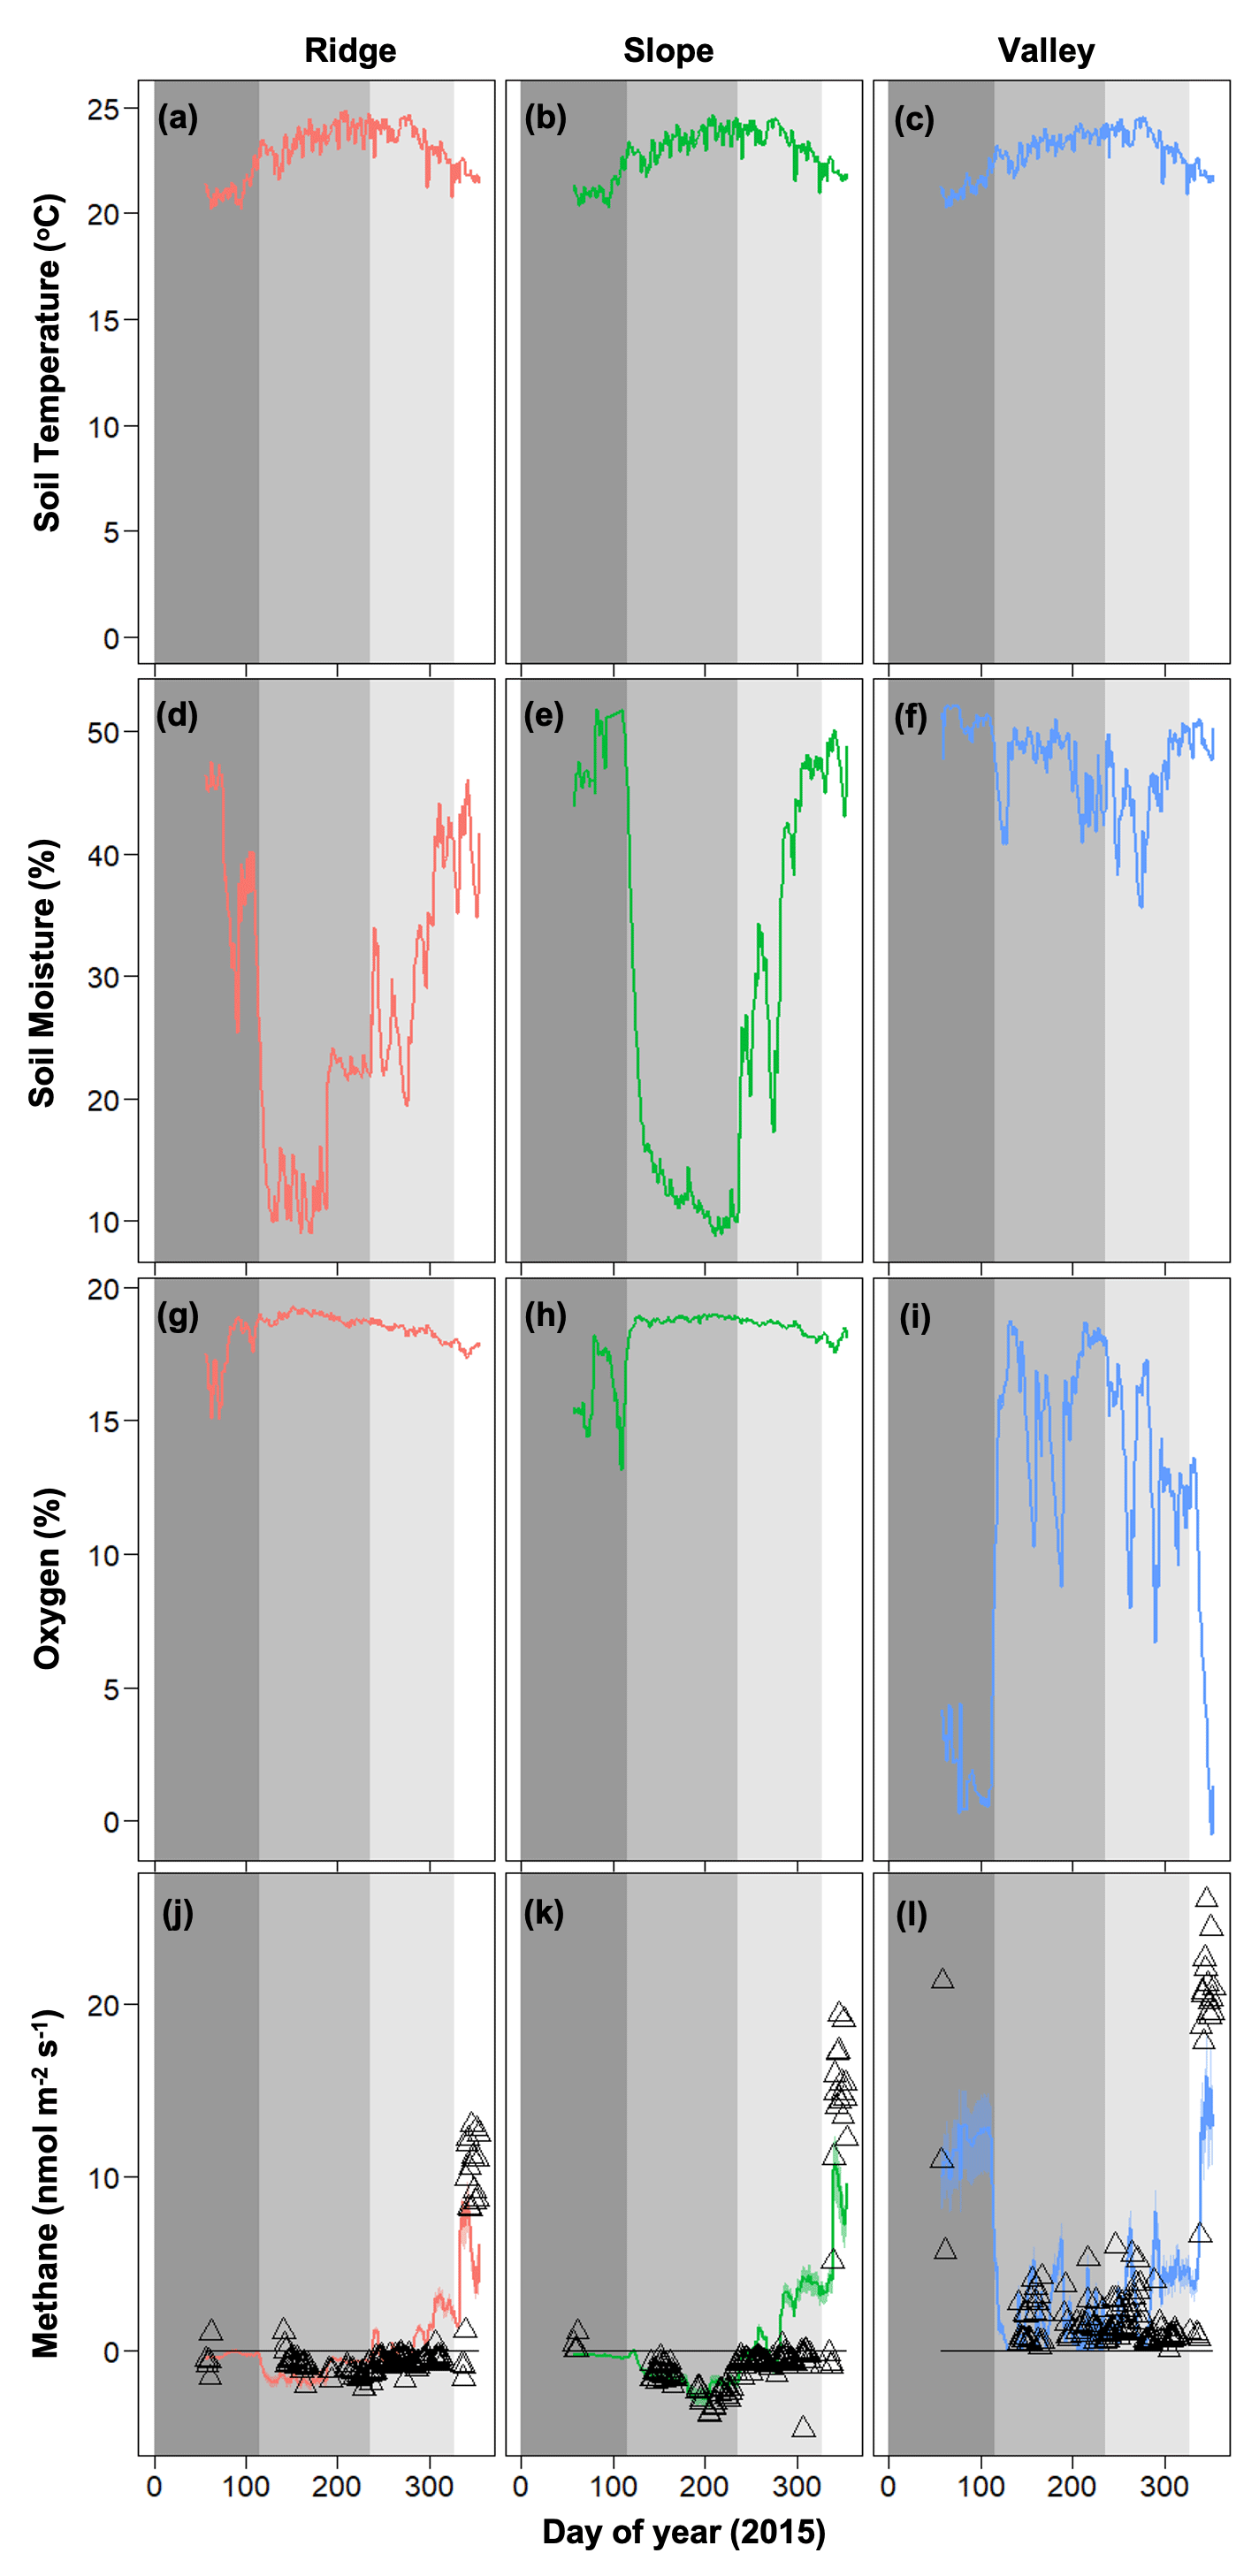
Figure 3Temporal dynamics of observed meteorological drivers (soil temperature, a–c; soil moisture, d–f; soil oxygen, g–i) and net methane emissions (j–l) for 2015 (Data are taken from O'Connell et al., 2018). For methane emissions, symbols represent observed data and lines represent model simulations. Dark gray, medium gray, light gray, and white shading represent pre-drought, drought, drought recovery, and post-drought events (O'Connell et al., 2018).
2.4 Modeling approach
2.4.1 Microbial functional group model for methane production and oxidation
An existing microbial-functional-group-based model for CH4 production and consumption (Xu et al., 2015) was adopted for this research (Sihi, 2020). As shown in Fig. 1, acetate and H2 CO2 represent substrate (nM cm−3) for aceticlastic and hydrogenotrophic methanogenesis reactions, respectively. On the other hand, CH4 and O2 concentrations represent substrate for the methanotrophy reaction. Acetate and CO2 are inputs based on measurements of soil water and pH described in Sect. 2.2. In the model, acetate is formed by fermentation and by homoacetogenesis (but not by syntrophic acetate oxidation) as defined in Xu et al. (2015) in their Appendix in Eqs. (A15) and (A16) (Fig. 1b). Methylotrophic methanogenesis (Narrowe et al., 2019) is neglected in the model. The overall reaction rates are represented as
where (in nM cm−3 h−1) is the rate of CH4 production and/or consumption under variable substrate concentrations. (nM cm−3) represents microbial functional groups: aceticlastic methanogens, hydrogenotrophic methanogens, and aerobic methanotrophs, respectively. Growth rates and substrate use efficiencies of microbial functional groups are represented as (h−1) and (unitless), respectively (Table 1). The substrate limitation on CH4 production is imposed by assuming a Michaelis–Menten relationship with the half-saturation constants for CH4 production and oxidation being (nM cm−3). Although minor contributions of iron-dependent anaerobic CH4 oxidation to net CH4 emissions can be expected in our study site (Ettwig et al., 2016), we did not represent this process here as anaerobic oxidation of CH4 is still not fully understood, and it is generally low in most ecosystems.
Table 1Fitted values of M3D-DAMM model parameters.
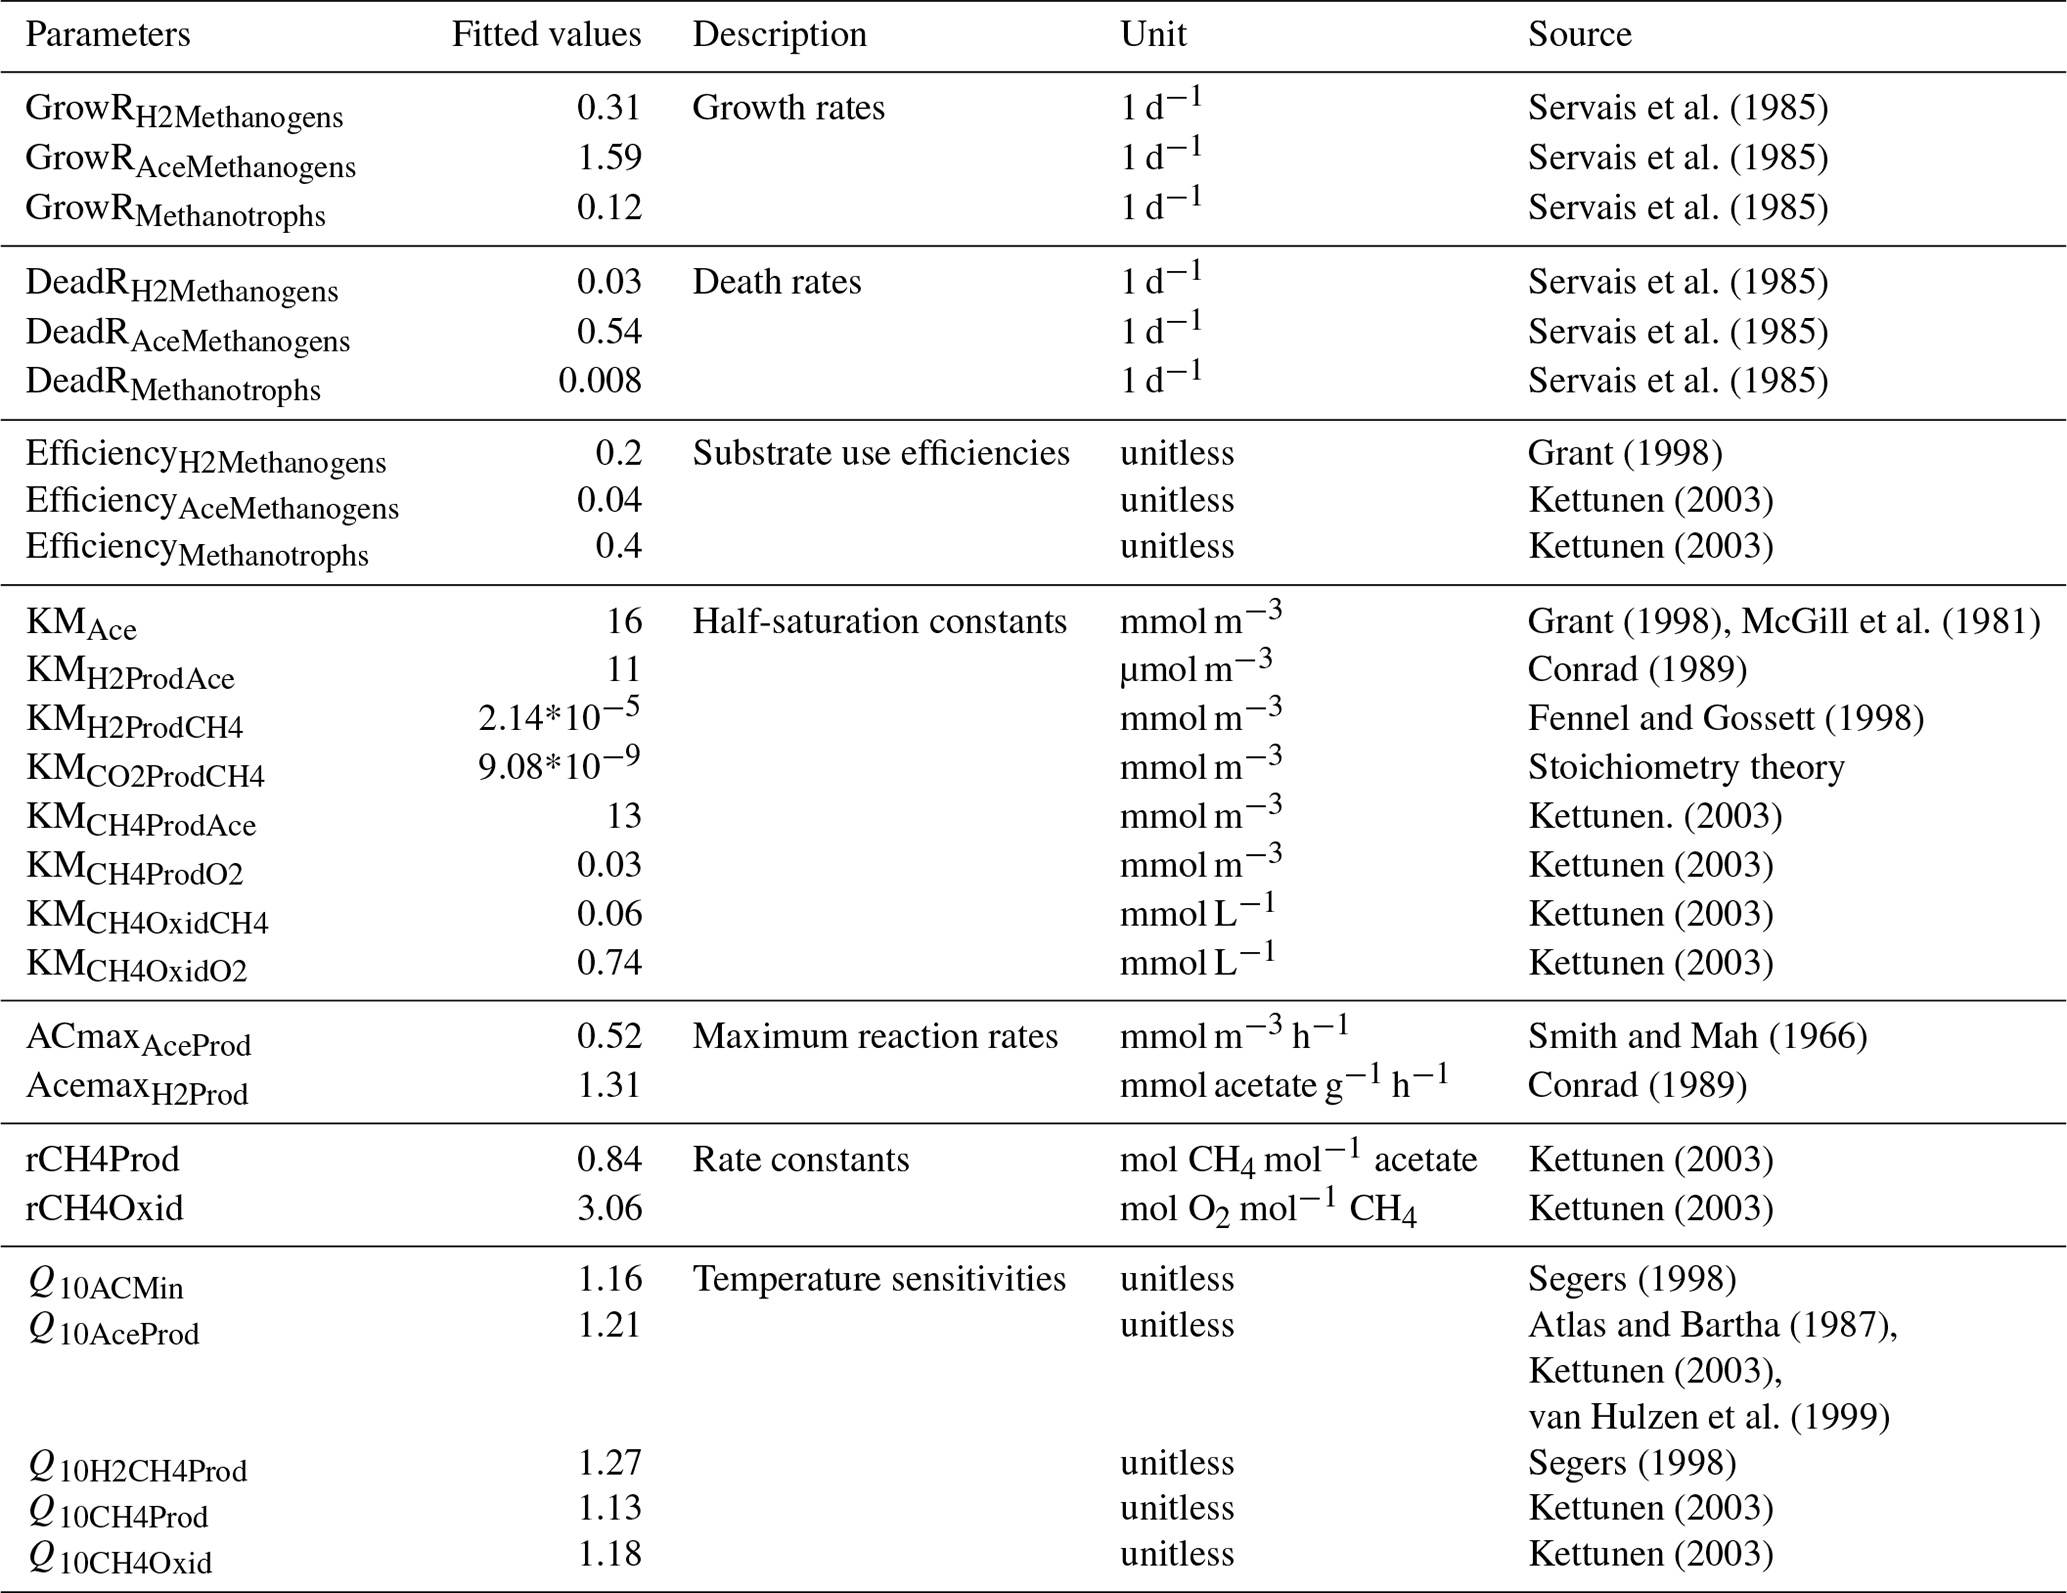
Initial values of model parameters were collected from literature (“Source”). Also see Xu et al. (2015) for detailed information on model parameters.
The extent of change in is controlled by the balance between and following
where is calculated as a multiplicative function of and the ,
and is a function of (death rate, Table 1) and (microbial biomass).
All rate equations were modified by the scalers for temperature, f(T) and pH, f(pH) functions, described below. We represented the temperature effect, f(T), using a classic Q10 function:
We represented the pH effect, f(pH), based on Cao et al. (1995):
where we set the minimum, optimum, and maximum soil pH values to 4, 7, and 10, respectively. Following Xu et al. (2015), we considered the contribution of acetate to pH as follows:
Although other mechanisms to alter soil pH are present at the site, e.g., Fe reduction and oxidation (Teh et al., 2005; Hall and Silver, 2013), these are not considered in the model at this time. Calibrated values of , , and Q10,i are presented in Table 1.
2.4.2 Diffusion module for gaseous and solute transport in soil profile and across soil–air boundary
In order to account for the diffusion of gases across the soil–air boundary and solutes (e.g., acetate) through soil water films (Fig. 1), we added the diffusion module of the Dual Arrhenius and Michaelis–Menten (DAMM) model (Davidson et al., 2012; Sihi, 2020; Sihi et al., 2018, 2020a) to the existing microbial functional group model, which we refer to as M3D-DAMM. We calculated initial concentration of gases like O2, H2, CO2, and CH4, [Gasconc] (unit: V V−1), as a function of a unitless diffusion coefficient of gas in air (Dgas), volume fraction of gas in air (V V−1), and gas diffusivity ( ) as follows:
where represents the tortuosity of diffusion pathway for gases as a function of soil water (SoilM) and temperature (SoilT):
where the air-filled porosity (a) was calculated by subtracting the volume fraction of soil moisture (V V−1) from total porosity. Porosity was calculated as
The exponent of accounts for diffusivity of gases through porous media (Davidson and Trumbore, 1995). The exponent of 1.75 represents the temperature response of gaseous diffusion (Massman, 1998; Davidson et al., 2006). Following Davidson et al. (2012), the value used for gaseous diffusivity coefficient (Dgas) was calculated based on an assumed boundary condition such that the concentration of gaseous substrates in the soil pore space would be equivalent to the volume fraction of gases in air under completely dry conditions.
We assumed another boundary condition to determine the value of the aqueous diffusion coefficient, Dliq, such that soluble substrates like acetate would be available at the enzymatic reaction site under conditions with saturating soil water content (Davidson et al., 2012):
We represented soluble substrates (acetate) diffused through a soil water film as Aqueous-substrateav (µM L−1), which we calculated as follows:
where the term represents the diffusion rate of aqueous substrates to the enzymatic active site (Papendick and Campbell, 1981). Concentrations of acetate in the aqueous phase (µM L−1) were obtained from the measurements across the catena averaged by depths (10 and 30 cm) of Rhizon samplers.
We calculated CH4 emissions, CH4emission (unit: µmole m−2 h−1), as a function of concentration ([CH4conc]), production (CH4prod), and oxidation (CH4ox) of CH4, multiplied by the equivalent depth (set to 15 cm) (for cm−3 volume to cm−2 area conversion) and 104 (for m2 to cm2 conversion) as follows:
2.4.3 Soil microsites
The importance of diverse microsite conditions was inferred based on many previous observations in the field and the lab of co-occurrences of oxic soil concentrations and reduced redox-active species (Silver et al., 1999; Teh et al., 2005; Megonigal and Geunther 2008; Hall et al. 2013, 2016; Sihi et al., 2020a). The high clay content, abundant Fe oxides, and visible redox mottling, particularly in the valley and slope soils, facilitate a diversity of soil microenvironments where O2 and CH4 can seemingly co-occur, albeit in different microsite locations (Silver et al., 1999; Teh and Silver, 2006). Microsite diversity was also invoked to help explain the rapid CH4 emissions following drought at the field site (O'Connell et al., 2018). Techniques for accurately measuring in situ microsite activities remain very limited to date, here or elsewhere. Therefore, we simulated production, consumption, and diffusion processes within soil microsites using a log-normal probability distribution function of soil moisture and available C based on these previously observed relationships (Fig. 1). The average values of individual processes across simulated microsites (represented by “i”) represent the reaction in the bulk soil, which we constrained using the net measured CH4 emissions:
We directly adopted the probability distribution function of soil moisture and C from Sihi et al. (2020a), which constrained values of Frequencyi of soil microsites. We a priori assigned the size of the microsites to be at least an order magnitude smaller than the diameter used for bulk measurements of CH4 fluxes. Thus, the mean diameter of microsites was assumed to be at the millimeter scale (the size class of small stable aggregates in these soils), as the diameter of soil chambers was 15.24 cm. Thus, the resultant number of total microsites below each soil flux chamber was 10 000.
2.4.4 Sensitivity analysis
We evaluated the sensitivity of model parameters with a global variance-based sensitivity analysis using the R-multisensi package. This method uses a global sensitivity index (0 < GSI < 1) to determine the sensitivity of CH4 emissions to model parameter values (Bidot et al., 2018). We conducted a multivariate technique to estimate GSI values in sequential steps. First, we implemented a factorial design on the uncertain model parameters, which is followed by a principal component analysis on model outputs. Then, we extracted GSI values by an ANOVA-based sensitivity analysis on the first principal component. To that end, parameters with high GSI values may explain high temporal variations of the observed CH4 emissions, and those with low GSI values are insignificant to reproduce the temporal dynamics of CH4 emissions.
2.4.5 Statistical analysis
We used R (version 3.5.1) for statistical analyses, modeling, and visualization purposes (R Core Team, 2018). Statistical analyses and figures were produced using R-ggstatsplot (Patil, 2018) and R-ggplot2 (Wickham, 2016) packages. Differences in soil and porewater chemistry across the catena were compared using robust t test. Correlograms for soil temperature, soil moisture, O2, and soil CH4 emissions were created using adjusted Holm correlation coefficients. All statistical analyses were conducted at the 5 % significance level. We implemented the M3D-DAMM model using R-FME package (Soetaert, 2016).
3.1 Observational dynamics of soil biogeochemistry
Soil and porewater chemistry varied along the catena (Fig. 2). Dissolved organic carbon (DOC) values followed the trend of ridge > slope > valley (p≤0.001). Soil DOC concentrations (mean ± SE) were 0.55 ± 0.10, 0.30 ± 0.03, and 0.18 ± 0.03 mg g−1 in ridge, slope, and valley soils, respectively. Organic acid (acetate) concentrations were significantly higher in the ridge (6.57 ± 1.48 µM L−1) and slope (6.42 ± 2.19 µM L−1) than in the valley (1.80 ± 0.20 µM L−1) (p=0.003). Soil pH followed the trend of valley > slope > ridge (p<0.001). Average soil pH ranged from 4.25 ± 0.11 in the ridge to 4.49 ± 0.08 in the slope and to 5.05 ± 0.09 in the valley.
Soil moisture and soil O2 concentrations were distinctly different in the drought year (2015) compared to 2016. The drought in 2015 decreased soil moisture in the slope and ridge soils and increased O2 concentrations in the valley soils (Fig. 3) (also see O'Connell et al., 2018). Generally, average soil moisture was higher in the valley (0.47 ± 0.05 in 2015 and 0.51 ± 0.01 % in 2016) as compared to the ridge (0.31 ± 0.12 in 2015 and 0.39 ± 0.03 % in 2016) and slope (0.30 ± 0.16 in 2015 and 0.41 ± 0.04 % in 2016). Average O2 concentrations were generally lower in the valley (11.54 ± 5.94 in 2015 and 6.30 ± 2.96 % in 2016) as compared to the ridge (18.37 ± 0.72 in 2015 and 17.52 ± 0.42 % in 2016) and slope (18.09 ± 1.22 in 2015 and 16.89 ± 0.58 % in 2016). After the drought ended, the recovery of soil moisture in the ridge and slope soils proceeded more quickly than the recovery of O2 concentrations in the valley soils (Fig. 3). Soil temperature ranges were averaged across the topographic gradient and were similar in both years (average was 21.58 ± 1.88 in 2015 and 22.97 ± 1.04 ∘C in 2016).
In 2016, net CH4 emissions were generally positive in the valley and were marginally negative in the ridge and slope (Fig. 4). The dynamics of CH4 were very different following the 2015 drought, resulting in net positive CH4 emissions in the post-drought period for all topographic positions (Fig. 3) (as described in more detail in O'Connell et al., 2018). The magnitude of CH4 emissions was greater in the valley, followed by the slope and then the ridge.
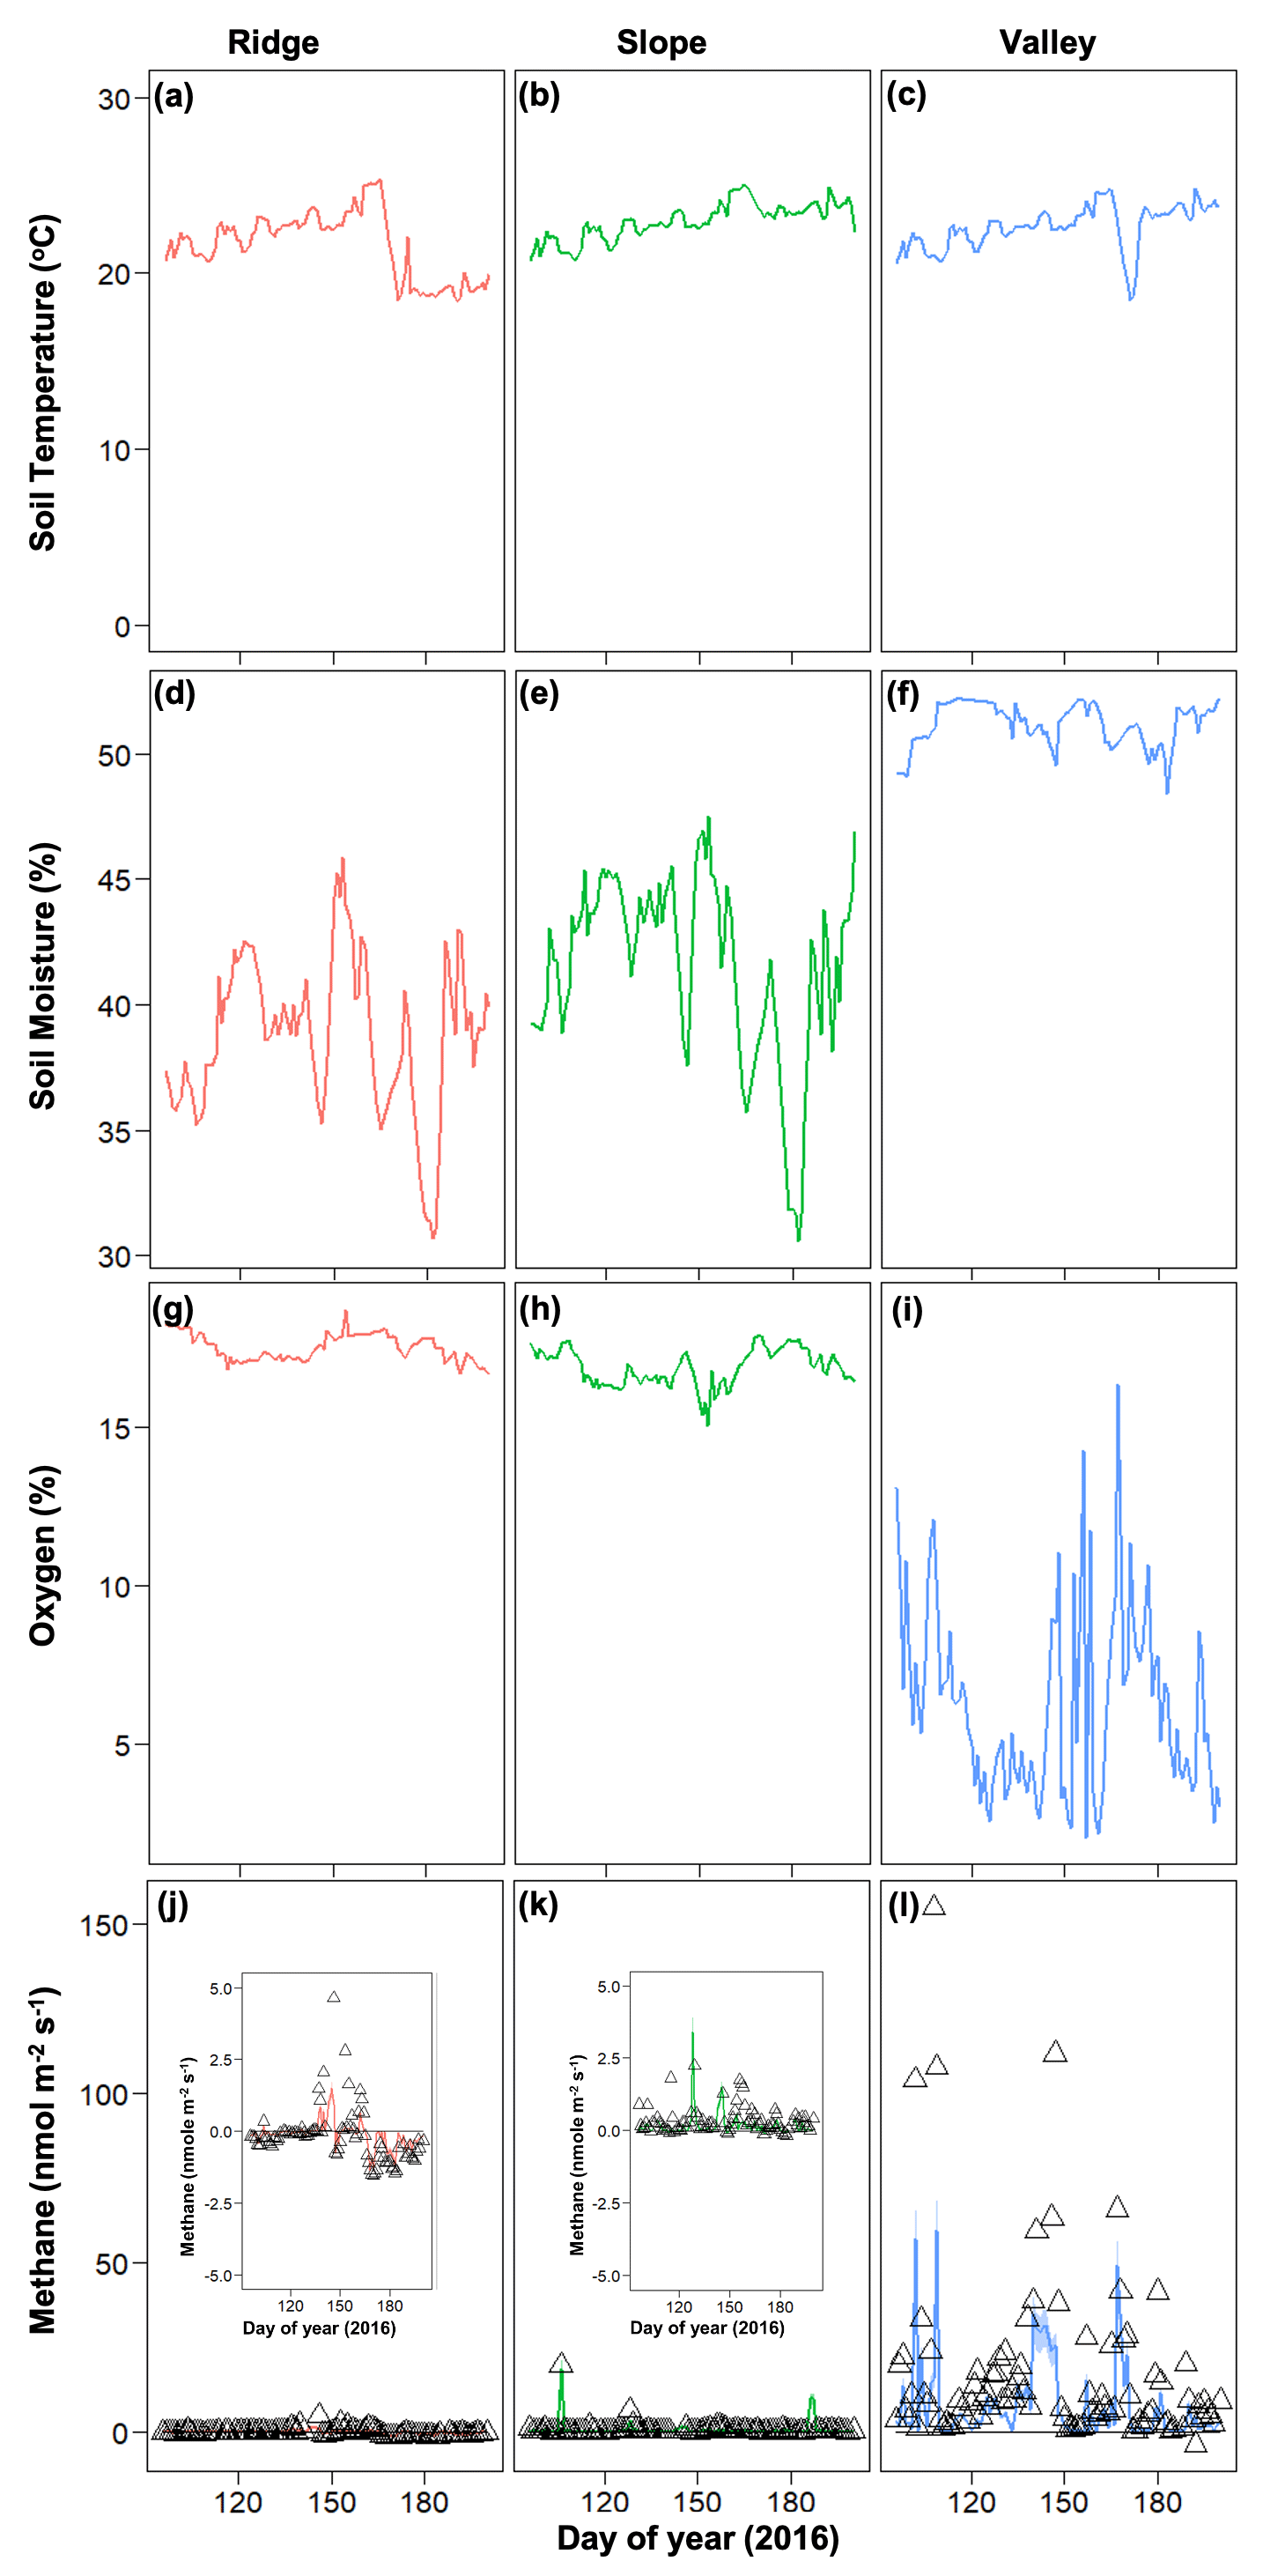
Figure 4Temporal dynamics of observed meteorological drivers (soil temperature, a–c; soil moisture, d–f; soil oxygen, g–i) and net methane emissions (j–l) for 2016. For methane emissions, symbols represent observed data and lines represent model simulations.
The strength of the relationships between net CH4 emissions and soil temperature, moisture, and O2 concentrations was contingent on both topographic position and year (2015 vs. 2016) (Fig. 5). For example, the relation between CH4 emissions and soil moisture was stronger in 2016 (normal year) than in 2015 (drought year). The correlation between CH4 emissions and O2 concentrations was stronger and more negative in 2015 than 2016. Correlations between soil moisture and O2 concentrations were negative and stronger in 2016 than in 2015. Correlation coefficients between soil O2 concentrations and CH4 emissions were negative and strongest for valley soils and lowest for ridge soils in 2015, but they were uncorrelated in 2016 for ridge and slope soils (Fig. S2).
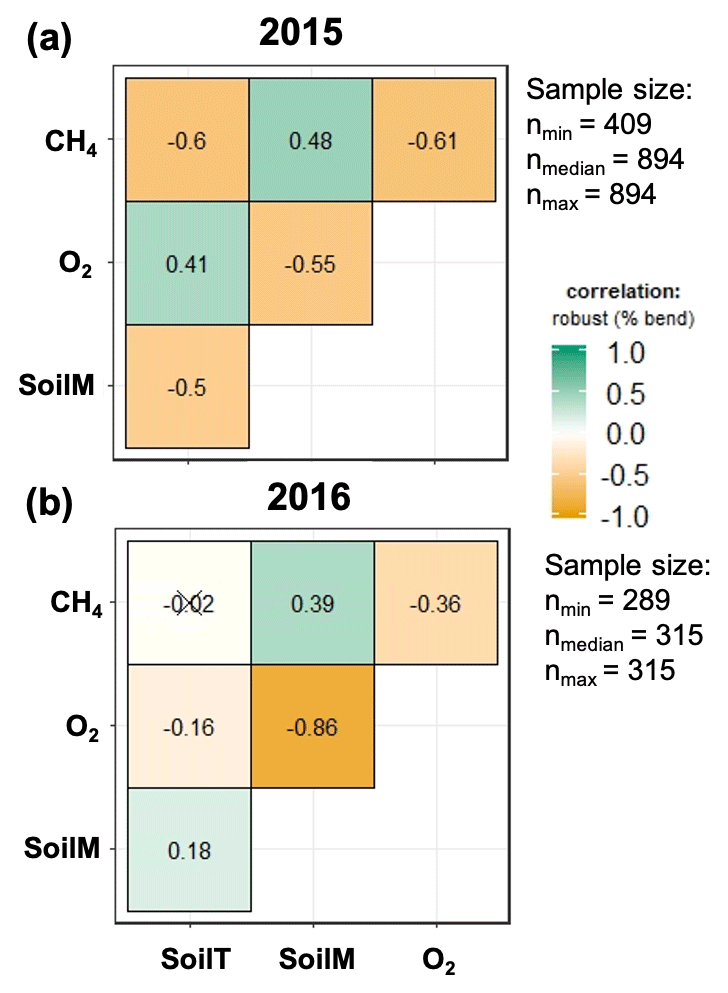
Figure 5Relation between soil meteorology and methane emissions for 2015 (a) and 2016 (b). SoilM, SoilT, O2, and CH4 represent soil moisture, soil temperature, oxygen, and methane, respectively. Numbers represent adjusted Holm correlation coefficients, and numbers with “X” indicate a non-significant correlation at p<0.05.
3.2 Model simulations of methanogenesis and methanotrophy
In general, there was little bias in the relationships between the observed and simulated CH4 emissions (Fig. 6). The model explained 72 % and 67 % of the variation in soil CH4 emissions for 2015 and 2016, respectively, although the model performance varied across the catena (Figs. 6, S3, S4). Overall, simulated CH4 emissions captured the trend of valley > slope ≥ ridge for 2016. The model also captured the dramatically different dynamics of field CH4 emissions as a function of topography during and after the 2015 drought. Net positive CH4 emissions were simulated in the drought recovery and post-drought periods in the ridge and slope in 2015, while net negative emissions were simulated in the other times for these landscape positions. Additionally, simulated net CH4 emissions were decreased during the drought and drought recovery in the valley soils, as well as the strong net CH4 emissions in the valley soils in the post-drought period.

Figure 6Observed versus simulated methane (CH4) emissions and model residuals for 2015 (a, b) and 2016 (c, d).
The ridge and slope positions were more similar to each other than to the valley soils. Simulated decreased production of acetate and hydrogen during the 2015 drought in the ridge and slope positions resulted in decreased biomass of aceticlastic methanogens and hydrogenotrophic methanogens (Figs. S5, S6). Gross CH4 production therefore decreased during these time periods (Fig. S7). Simultaneously, as soil moisture decreased, simulated methanotrophic biomass increased during the drought (Fig. S5). The simulated biomass of both aceticlastic methanogens and hydrogenotrophic methanogens increased dramatically in the ridge and slope soils during the drought recovery (aceticlastic methanogens: 3.3 and 5.3 times higher than drought period for ridge and slope, respectively; hydrogenotrophic methanogens: 6.1 and 12 times higher than drought period for ridge and slope, respectively) and post-drought (aceticlastic methanogens: 5.2 and 8.8 times higher than drought period for ridge and slope, respectively; hydrogenotrophic methanogens: 12 and 24 times higher than drought period for ridge and slope, respectively) period. Concomitantly, production of acetate and H2 was much higher in the ridge and slope soils during the drought recovery (acetate: 1.8 and 2.4 times higher than the drought period for ridge and slope soils, respectively; H2: 3.5 and 6.0 times higher than the drought period for ridge and slope soils, respectively) and the post-drought (acetate: 2.3 and 3.2 times higher than the drought period for ridge and slope, respectively; H2: 5.6 and 10 times higher than the drought period for ridge and slope, respectively) period. Together, gross CH4 production in the ridge and slope soils was significantly higher during the drought recovery (1.9 and 2.5 times higher than the drought period for ridge and slope, respectively) and post-drought periods (3.4 and 4.6 times higher than the drought period for ridge and slope, respectively) compared to the drought (Fig. S7). Simulated production of acetate was increased, which also lowered soil pH values during drought recovery (Fig. S6), with a more pronounced effect in the ridge and slope soils. Additionally, simulated methanotrophic biomass and CH4 oxidation decreased during the post-drought period (Figs. S5, S7), which is the same time period during which net CH4 production increased strongly.
For the valley soils, simulated values of aceticlastic methanogens and concomitant acetate production increased during the 2015 drought (Figs. S5, S6). During the drought recovery and post-drought period, both aceticlastic methanogens and acetate production decreased in the valley, while hydrogenotrophic methanogens and H2 production were stable. Gross CH4 production, however, remained relatively flat during the drought event in the valley and only increased during the post-drought period (Fig. S7). Simulated CH4 oxidation and methanotrophic biomass, on the other hand, increased dramatically during the drought and drought recovery period (Figs. S5, S7) and then decreased strongly during the post-drought period. However, simulated methanotrophic biomass was smaller in the valley soils compared to the ridge and slope soils. Methane oxidation by methanotrophs exerted strong controls on simulated net CH4 emissions, not only in the valley but in all the topographic positions.
3.3 The influence of microsites on net methane emissions
Concomitant with decreased soil moisture, the simulated diffusion of gases (O2, H2) was enhanced during the drought event in 2015, while diffusion of the solute (acetate) was dramatically decreased, particularly for the ridge and slope soils (Fig. S8). However, reduction in soil moisture and increase in O2 can inhibit fermentative hydrogen production (Cabrol et al., 2017). Consequently, simulated gross CH4 production through hydrogenotrophic and aceticlastic pathways both decreased during the drought event for the ridge and slope positions (Figs. S7, S9). As soil moisture increased during the drought recovery and post-drought periods, the diffusion of gases decreased, and diffusion of acetate increased in the ridge and slope soils (Fig. S8). Consequently, simulated values of gross CH4 production increased and gross CH4 oxidation decreased during drought recovery and the post-drought period (Fig. S7). These factors likely contribute to the large pulses of net CH4 emissions during the post-drought period for ridge and slope positions (Fig. 3).
Overall, the valley soils were relatively insensitive to changes in the diffusion rate of either gases or solutes (Fig. S8), most likely because soil moisture remained relatively stable, regardless of drought conditions (Fig. 3). The lower sand and higher clay contents in the valley soils (Brenner et al., 2019), as well as the lower topographic position, likely caused the valley soils to remain wetter than the slope and ridge soils. Therefore, simulated values of gross CH4 production were fairly stable in the valley soils (Fig. S7) during the drought and drought recovery period.
Simulated production, oxidation, and net flux of CH4 was further modified by reactions occurring within soil microsites. For example, during the drought (∼ DOY 200 in 2015), gross CH4 production was more frequent in soil microsites in the valley compared to the slope and ridge (Fig. 7). Simulated values of CH4 oxidation were much greater in microsites in the slope and ridge positions, so the net CH4 emissions were positive in the valley soils and negative in the ridge and slope positions. During the 2015 post-drought period (DOY 345), the frequency of CH4 production was much greater in all topographic positions compared to the drought period (DOY 200), and it was also more enhanced in the valley soils compared to the slope and ridge. Thus, net positive CH4 emissions were observed in all topographic positions in the post-drought period (Fig. 3). Methane oxidation at DOY 345 was much greater in the ridge and slope compared to the valley, similar to predictions at DOY 200. Therefore, the prominent CH4 emissions from all three topographic positions were primarily due to increased production (CH4 production on DOY 345 was 150 %, 248 %, and 80 % higher than DOY 200 in ridge, slope, and valley, respectively) rather than decreased oxidation (CH4 oxidation was 32 %, 31 %, and 43 % lower on DOY 345 than DOY 200 in ridge, slope, and valley, respectively), which agrees with previous studies in our site (Teh et al., 2005, 2008; von Fischer and Hedin, 2002).
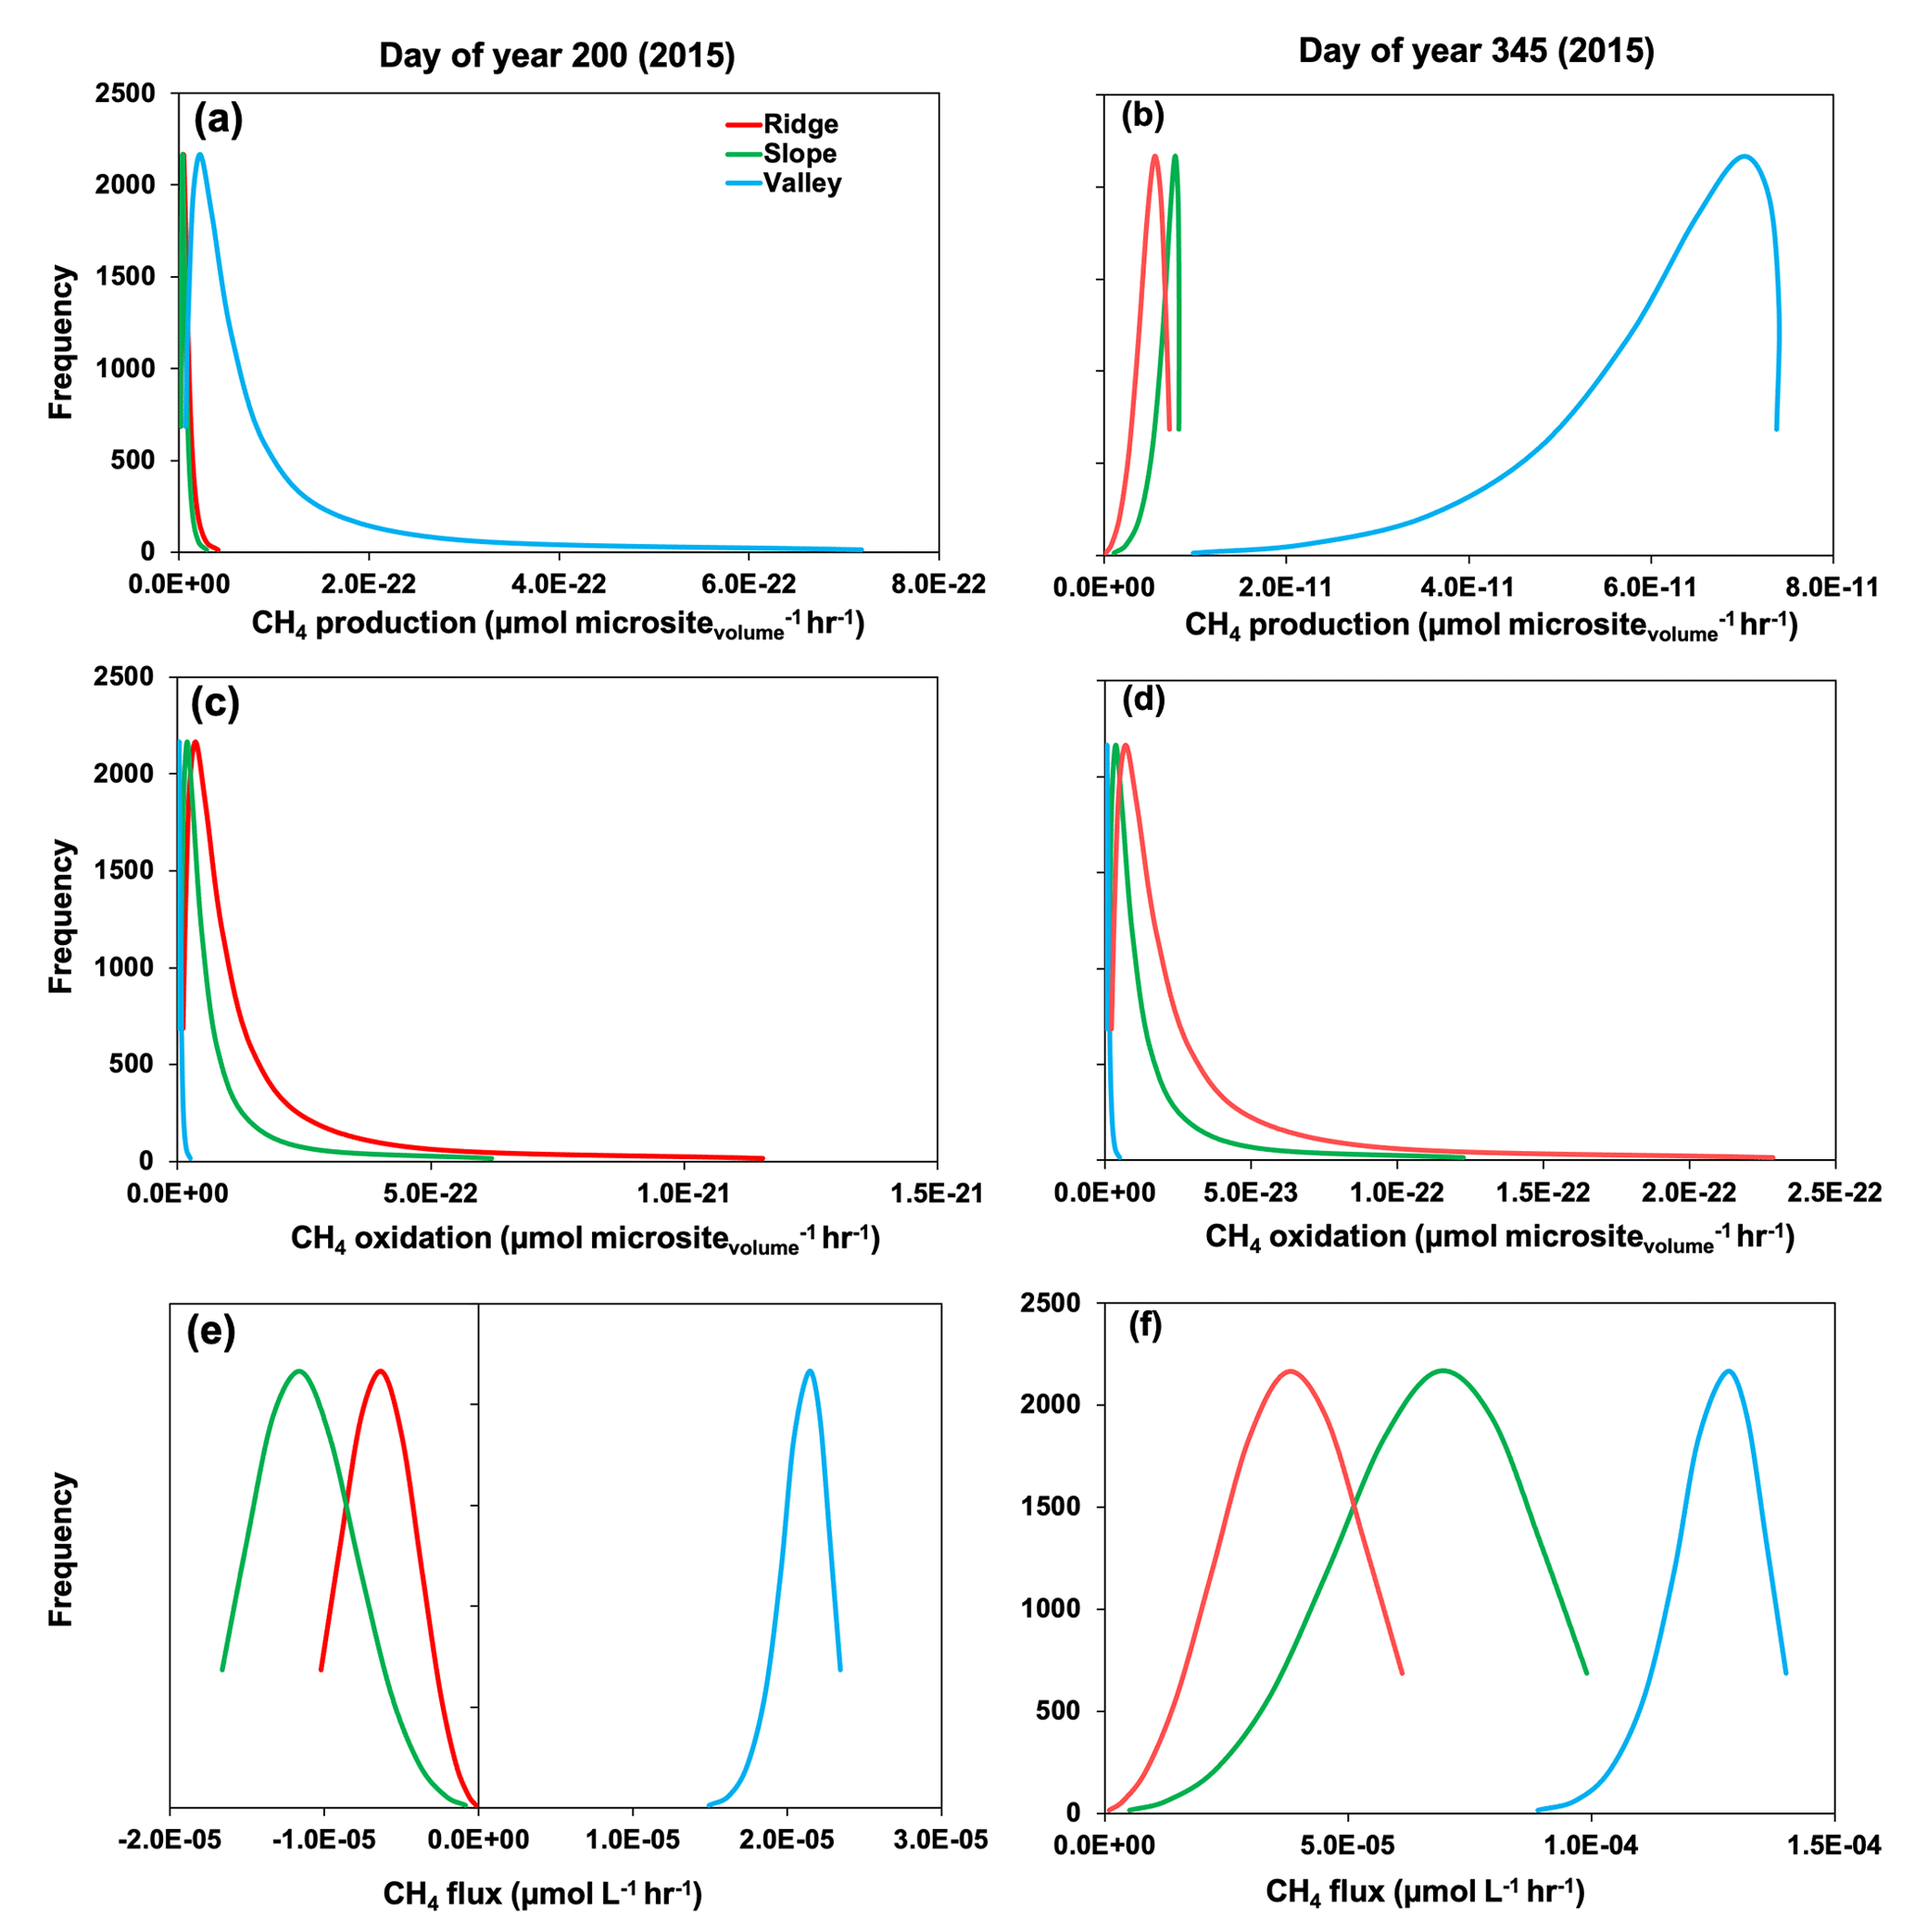
Figure 7Rates of gross methane (CH4) production (a, b), oxidation (c, d), and net flux (e, f) across simulated soil microsites. Day of year 200 and 345 represent drought and post-drought recovery, respectively (see medium gray and white shading in Fig. 3).
Diffusion into microsites strongly affected the concentrations of gases and solutes experienced by microbes, and differences as a function of topographic position were again predicted. Acetate production and diffusion were enhanced in valley soils during the drought, when compared to the slope and ridge soils (Fig. S10). The H2 production was also enhanced in the valley soils during the drought, but the wetter valley soils experienced lower rates of H2 diffusion compared to the ridge and slope soils. Increases in O2 diffusion were also apparent in the ridge and slope soils during the drought, and those increases were greater than in the valley soils. During the post-drought period, however, the frequency of H2 and O2 diffusion was much greater for the ridge soils compared to the valley soils (Fig. S10).
Of all parameters, the most sensitive ones were those that controlled CH4 production through the aceticlastic pathway, followed by the parameters related to CH4 oxidation (Fig. 8). The GSI values for parameters related to aceticlastic methanogenesis and methanotrophy ranged between 0.25–0.75, whereas the corresponding GSI values for hydrogenotrophic methanogenesis were always <0.1.
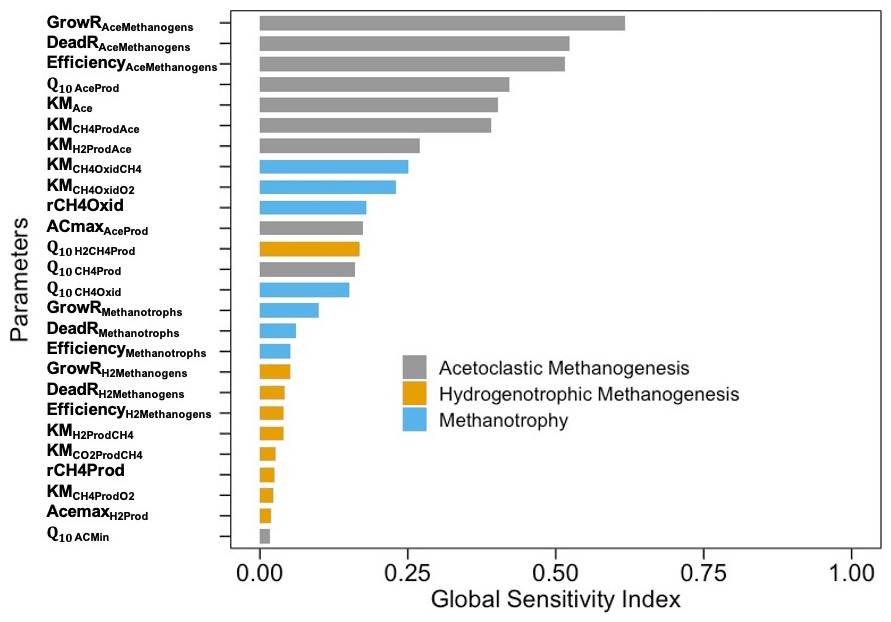
Figure 8Global sensitivity indices of M3D-DAMM model parameters (defined in Table 1). Gray, yellow, and blue colors represent parameters for aceticlastic methanogenesis, hydrogenotrophic methanogenesis, and methanotrophy, respectively.
4.1 Mechanisms governing net methane emissions
Although the initial concentrations of available C for fermentation (i.e., DOC) and substrate for aceticlastic methanogenesis (i.e., acetate) in the bulk soil followed the trend of ridge > slope > valley (Fig. 2), the pattern of net CH4 emissions across the catena was opposite (valley > slope ≥ ridge), especially in 2016 (Fig. 4). The seemingly counterintuitive relations of substrate concentrations in the bulk soil versus net CH4 emissions can be explained by modeling the differing redox conditions across soil microsites. Diffusion promoted the availability of the acetate substrate through more connected soil water films in the wetter valley soils and caused higher gross CH4 production in 2016, as compared to the relatively drier slope and ridge soils (Figs. S7, S8). In contrast, diffusion of gaseous methanotrophic substrates (CH4 and O2) was promoted in the air-filled pore spaces in the drier ridge and slope soils (Fig. S8), resulting in reduced net CH4 emissions for these two topographic positions in 2016 (Fig. 4). Further, reduced diffusion of O2 in the wetter valley soils decreased gross methanotrophy compared to the slope and ridge soils (Figs. S7, S8). Consequently, in 2016, net CH4 emissions dominated the valley soils but were minimal in the ridge and slope soils.
On the other hand, the drought event in 2015 decreased the simulated CH4 emission in the slope and ridge soils by decreasing H2 production and both production (Fig. S6) and diffusion of acetate (Fig. S8). The drought increased the CH4 sink strength of both ridge and slope soils as the observed net CH4 emissions became more negative during the drought compared to the pre-drought period (Fig. 3). Contributing factors predicted by the model include enhanced O2 diffusion into the drier ridge and valley soils (Fig. S8), as well as enhanced methanotrophic biomass (Fig. S5). In the valley, the primary impact of the drought appeared to be due to increased methanotrophy (Fig. S7), since acetate, H2, and gross CH4 production were predicted to continue unabated (Figs. S6, S7). This suggests that drought enhanced consumption of atmospheric CH4 in our site, which is consistent with findings from natural droughts and throughfall exclusion experiments in other wet tropical forest soils (Aronson et al., 2019; Davidson et al., 2004, 2008; Wood and Silver, 2012).
However, simulation of observed CH4 emission during drought recovery in 2015 required explicit representations of the complex interaction of the diffusive supply of solute and gases, dynamics of the microbial functional groups, and the associated acetate–pH feedback loop across the distribution of soil microsites (Fig. 3). The drought recovery increased soil moisture, which likely prompted anaerobiosis across all topographic locations by significantly reducing gas diffusivity in a fraction of the simulated microsites (11, 17, and 21 % in ridge, slope, and valley, respectively) (McNicol and Silver, 2014; Sihi et al., 2020a; Teh et al., 2005). The return to dominantly reducing conditions also was predicted to stimulate fermentation and the production of acetate through homoacetogenesis (Fig. S6). Enhanced production and diffusion of acetate during recovery (Fig. S8) triggered growth in the predicted biomass of aceticlastic methanogens (Fig. S5), which in turn increased rates of aceticlastic methanogenesis (Fig. S9).
Simulated rates of hydrogenotrophic methanogenesis also increased in anaerobic microsites (Figs. S9, S10), mediated by increased production of H2 and subsequent stimulation of the biomass of hydrogenotrophic methanogens during the drought recovery in 2015 (Fig. S5). Overall, the absolute values of simulated gross CH4 production through hydrogenotrophic and aceticlastic pathways (Fig. S9) outweighed the simulated gross CH4 oxidation rates (Fig. S7), resulting in net soil CH4 emissions across the catena during the post-drought period (Fig. 3).
Acetate-driven CH4 increases, decreases in methanotrophy due to decreasing O2, and increasing hydrogenotrophic methanogenesis all contributed to the post-drought pulses of CH4 (Fig. 8). Both kinds of methanogens increase during drought recovery and post-drought, but aceticlastic methanogens were 2 orders of magnitude more abundant than hydrogenotrophic methanogens. Additionally, acetate may accumulate in microsites during drought and then become more available with drought recovery due to enhanced solute diffusion (Fig. S8). The model simulations suggest that hydrogen diffusion was lessened under the drought recovery, which is consistent with decreasing rates of gas diffusion through saturated soils (Fig. S8). Further, H2 has a faster turnover rate compared to acetate (Xu et al., 2015), and therefore accumulation in soils, especially shallow soils which are the subject of this study, is minimized. So, acetate versus hydrogen substrate availability in microsites better explains the observations of higher CH4 production under the post-drought conditions.
Additionally, acetate is a source of proton and should reduce soil pH (Amaral et al., 1998; Conrad and Klose, 1999; Jones et al., 2003). Previous studies (Xu et al., 2015; Xu et al., 2010) demonstrated that acetate-driven soil pH reduction can reduce net CH4 production by as much as 30 %, especially in systems with low initial soil pH like our study site. Given that optimal pH for biological activities peaks near neutral pH, the relatively higher soil pH in the valley versus ridge and slope soil further enhanced the topographic patterns of CH4 emissions (Conrad, 1996; also see Figs. 2, 3, and 4). Note that the initial soil pH across the landscape was already in the acidic range (Fig. 2); consequently, the simulated acetate production and concomitant decrease in soil pH during the 2015 drought recovery further suppressed gross CH4 production in ridge soils in comparison to the valley soils (Figs. S6 and S7). Iron-reducing bacteria can also suppress CH4 production either by competing with aceticlastic methanogens for acetate substrate or controlling the flow of acetate to both hydrogenotrophic and aceticlastic methanogens by dissimilatory iron reduction (Teh et al., 2008). Additionally, Fe reduction can increase soil pH by proton consumption and colloid dispersion, whereas Fe oxidation can lead to more acidic conditions (Hall and Silver, 2013; Thompson et al., 2006). None of the Fe-associated mechanisms are currently represented in the M3D-DAMM model.
Hence, high-temporal-resolution field-scale measurements of CH4 emissions and soil and porewater chemistry facilitated evaluation of the combined effects of soil redox conditions (moisture and O2 concentrations) and associated pH feedbacks on underlying processes occurring across soil microsites while accounting for variation along the catena as a result of changing climatic drivers over time. The M3D-DAMM model captured the Birch-type effect by quantifying the pulses in soil CH4 emissions as a function of increases in soil moisture following a strong drought (Birch, 1958). Specifically, the model coupled with microsite diffusivity explained CH4 emissions common to wet valley soils and rare in comparatively drier ridge and slope soils and predicted the net release of CH4 emissions from all topographic positions following a strong drought.
4.2 Sensitivity analysis
The variance-based sensitivity analysis confirmed the importance of microbial functional groups and their complex interactions with the surrounding biophysical and chemical environments in controlling CH4 production and oxidation. For example, the growth and death of aceticlastic methanogens and the relative efficiency of aceticlastic methanogenesis were the most sensitive parameters (Fig. 8), which is consistent with another modeling effort on CH4 fluxes across the Arctic landscape (Wang et al., 2019). Although from completely different ecosystem types, Wang et al. (2019) and the present study confirmed the importance of simulating soil topographies and microbial mechanisms when evaluating the heterogeneities in CH4 fluxes. Representations of both direct (methanogenic substrate) and indirect (soil pH feedback) effects of acetate may have contributed to higher GSI values for parameters representing aceticlastic methanogenesis, which is similar to a previous study (Xu et al., 2015). The sensitivity of CH4 emissions to the parameters representing methanotrophy was secondary to that of those representing aceticlastic methanogenesis, which is consistent with the increase in methanotrophic biomass during the drought. Our predicted changes in microbial biomass might be unacceptably large for the entire soil microbial community, which may only double or perhaps quadruple in response to changes in conditions, but individuals can grow exponentially (Goberna et al. 2010; Pavlov and Ehrenberg 2013; Roussel et al. 2015; Buan 2018).
4.3 Other processes
We did not completely reproduce the net emissions of soil CH4 during the 2015 post-drought period across the catena with the M3D-DAMM model. To capture the full potential of net emissions of CH4 (white shading in Fig. 3) from sesquioxide-rich soils, future modeling efforts may need to explicitly include the dynamics of redox-sensitive elements such as Fe and associated pH feedback under contrasting redox conditions (Barcellos et al., 2018; Bhattacharyya et al., 2018; Hall and Silver, 2013, 2015, 2016; O'Connell et al., 2018; Parfitt et al., 1975; and Silver et al., 1999). Wetting events can lower soil redox potential and reduce electron acceptors like Fe(III) to Fe(II). This concomitant reduction of Fe may increase soil pH, especially in anaerobic microsites, which could further increase net emissions of soil CH4 (Tang et al., 2016; Zheng et al., 2019). Accounting for these effects may allow model simulations to better match the highest observed net CH4 emissions in the post-drought period (Fig. 3).
Additionally, the reduction of Fe(III) to Fe(II) has supported anaerobic CH4 oxidation in other ecosystems (Ettwig et al., 2016). Within this context, a measurable amount of anaerobic oxidation of CH4 has previously been reported at our study site (Blazewicz et al., 2012). Additionally, Fe-reducing microorganisms can utilize acetate as a substrate and thereby compete with methanogens and reduce net methane emissions (Teh et al., 2008). Given the gradient of Fe in our study site, it is likely that biogeochemical cycling of Fe and CH4 is coupled (O'Connell et al., 2018), which should be accounted for in future modeling efforts. For example, a modeling study supported the importance of Fe in simulating CH4 cycling in an Arctic soil (Tang et al., 2016). To that end, building a comprehensive framework that also includes Fe biogeochemistry will afford greater confidence in projected CH4 emissions from wet tropical forests under future climatic conditions (Bonan, 2008; Pachauri et al., 2014; Xu et al., 2016).
High-frequency CH4 emission measurements coupled with real-time soil chemical measurements identified spatial and temporal variations affecting CH4 production and oxidation in wet tropical forest soils of Puerto Rico. Overall, contrasting patterns of soil moisture between ridge and valley soils played an instrumental role in governing net CH4 emissions. For example, consistently greater soil moisture likely favored methanogenesis by lowering the availability of O2 in valley soils compared to ridgetop soils, especially in microsites with high soil moisture and soil C content. However, soil porewater chemistry, particularly the concentrations of acetate and associated soil pH, influenced the pattern of net emissions of CH4 across the catena (valley > slope > ridge) during wetting after the 2015 drought. Thus, our results provide compelling evidence of the importance of both hot spots and hot moments in generating and mediating CH4 emissions in wet tropical forest soils. A microbial-functional-group-based model coupled with a diffusivity module and consideration of soil microsites adequately reproduced both the spatial and temporal dynamics of soil CH4 emissions, although mechanisms involving Fe biogeochemistry were neglected.
This study suggests that representing the microbial mechanisms and the interactions of microbial functional groups with the soil biophysical and chemical environment across soil microsites is critical for modeling CH4 production and consumption. To that end, explicit consideration of these underlying mechanisms improved predictions of CH4 dynamics in response to regional climatic events and provided insight into differential dynamics of solute and gas diffusion, different microbial functions, and gross CH4 production and oxidation as a function of topography. Hence, we contribute to the ongoing development and improvements of Earth system and process models to better simulate microbial roles in CH4 cycling at regional and global scales. However, observational data concerning the activities of different soil microbial functional groups are still needed to confirm the mechanisms proposed here. Future studies should integrate geochemical and microbiological information relevant for oscillatory redox conditions in wet tropical forests, especially those related to the redox-sensitive elements to build a comprehensive framework for modeling tropical soil CH4 emissions.
Meteorological data are available from the Luquillo LTER repository (Zimmerman, 2000). The 2015 soil moisture, respiration, and oxygen data are available from the Luquillo LTER repository (Silver, 2019). The 2016 greenhouse gas fluxes (Sihi et al., 2020d), soil chemistry (Sihi et al., 2020b), and Macro-Rhizon porewater data (Sihi et al., 2020c) are available from ESS-DIVE repository. R scripts used for this modeling exercise are archived at the Zenodo repository (Sihi, 2020).
The supplement related to this article is available online at: https://doi.org/10.5194/bg-18-1769-2021-supplement.
DS performed the data curation of 2016 flux data and the soil and lysimeter data, collated diffusion and microsite processes into the model presented herein, interpreted and validated the model application, developed the visualization, and wrote the original draft. XX provided the model code used in the investigation and assisted with its modification and application. MSO collected the 2016 field flux data. CSO and WLS provided the 2015 flux data and the 2015–2016 field soil measurements for temperature, oxygen, and moisture. CSO developed workflow for field flux data management, cleaning and analysis. WLS acquired the funding, administered the project, and supervised the research team involved with collection of the 2015 data. CLL collected the Rhizon water samples and soil samples from the field site, with assistance from MAM. JMB analyzed the Rhizon water samples in the lab. JRP, RKQ, and JMB completed the laboratory soil analyses. BDN supplied, installed, and maintained the Rhizon water samplers. MAM acquired the funding and administered the project that collected the 2016 data; conceptualized the paper and proposed the methods; supervised the research team; and contributed to the writing, interpretation, and visualization of subsequent drafts. All authors contributed to the manuscript through reviewing and editing subsequent drafts.
The authors declare that they have no conflict of interest.
We appreciate the site access and support facilitated by Grizelle González of the US Department of Agriculture (USDA) Forest Service International Institute of Tropical Forestry and by Jess Zimmerman of the University of Puerto Rico at Rio Piedras (UPR). We thank William McDowell of the University of New Hampshire (UNH) for logistical support. We thank Brian Yudkin, Jordan Stark, and Gisela Gonzalez for assistance with field data and sample collection. We are grateful to the editor and three anonymous reviewers whose efforts improved this manuscript.
This work was supported through an Early Career Award to MAM through the US Department of Energy (DOE) Biological and Environmental Research Program and by grants from the US DOE (grant no. TES-DE-FOA-0000749) and the National Science Foundation (NSF) (grant no. DEB-1457805) to WLS, as well as the NSF Luquillo Critical Zone Observatory (grant no. EAR-0722476) to UNH and the NSF Luquillo Long-Term Ecological Research Program (grant no. DEB-0620910) to UPR. WLS received additional support from the USDA National Institute of Food and Agriculture, McIntire Stennis project CA-B-ECO-7673-MS. This research used resources of the Compute and Data Environment for Science (CADES) at the Oak Ridge National Laboratory, which is managed by UT-Battelle, LLC, under contract DE-AC05-00OR22725 with the US Department of Energy.
This paper was edited by Edzo Veldkamp and reviewed by three anonymous referees.
Amaral, J. A., Ren, T., and Knowles, R.: Atmospheric methane consumption by forest soils and extracted bacteria at different pH values, Appl. Environ. Microbiol., 64, 2397–2402, 1998.
Andersen, B. L., Bidoglio, G., Leip, A., and Rembges, D.: A new method to study simultaneous methane oxidation and methane production in soils, Global Biogeochem. Cy., 12, 587–594, https://doi.org/10.1029/98GB01975, 1998.
Aronson, E. L., Dierick, D., Botthoff, J., Oberbauer, S., Zelikova, T. J., Harmon, T. C., Rundel, P., Johnson, R. F., Swanson, A. C., and Pinto-Tomás, A. A.: ENSO-influenced drought drives methane flux dynamics in a tropical wet forest soil, J. Geophys. Res.-Biogeo., 124, 2267–2276, https://doi.org/10.1029/2018JG004832, 2019.
Atlas, R. M. and Bartha, R.: Microbial ecology: fundamentals and applications, The Benjamim/Cummings, Menlo Park, 2nd Edn., 533 pp., 1987.
Barcellos, D., O'Connell, C. S., Silver, W., Meile, C., and Thompson, A.: Hot spots and hot moments of soil moisture explain fluctuations in iron and carbon cycling in a humid tropical forest soil, Soil Systems, 2, 59, https://doi.org/10.3390/soilsystems2040059, 2018.
Bhattacharyya, A., Campbell, A. N., Tfaily, M. M., Lin, Y., Kukkadapu, R. K., Silver, W. L., Nico, P. S., and Pett-Ridge, J.: Redox fluctuations control the coupled cycling of iron and carbon in tropical forest soils, Environ. Sci. Technol., 52, 14129–14139, https://doi.org/10.1021/acs.est.8b03408, 2018.
Bidot, C., Monod, H., and Taupin, M.-L.: A quick guide to multisensi, an R package for multivariate sensitivity analyses, available at: https://mran.microsoft.com/snapshot/2017-08-06/web/packages/multisensi/vignettes/multisensi-vignette.pdf (last access: 16 February 2021), 2018.
Birch, H.: The effect of soil drying on humus decomposition and nitrogen availability, Plant Soil, 10, 9–31, 1958.
Blazewicz, S. J., Petersen, D. G., Waldrop, M. P., and Firestone, M. K.: Anaerobic oxidation of methane in tropical and boreal soils: ecological significance in terrestrial methane cycling, J. Geophys. Res., 117, G02033, https://doi.org/10.1029/2011JG001864, 2012.
Bonan, G. B.: Forests and climate change: forcings, feedbacks, and the climate benefits of forests, Science, 320, 1444–1449, https://doi.org/10.1126/science.1155121, 2008.
Bosse, U. and Frenzel, P.: Methane emissions from rice microcosms: the balance of production, accumulation and oxidation, Biogeochemistry, 41, 199–214, 1998.
Brenner, J., Porter, W., Phillips, J. R., Childs, J., Yang, X., and Mayes, M. A.: Phosphorus sorption on tropical soils with relevance to Earth system model needs, Soil Res., 57, 17–27, https://doi.org/10.1071/SR18197, 2019.
Buan, N. R.: Methanogens: pushing the boundaries of biology, Emerg. Top. Life Sci., 2, 629–646, https://doi.org/10.1042/ETLS20180031, 2018.
Cabrol, L., Marone, A., Tapia-Venegas, E., Steyer, J. P., Ruiz-Filippi, G., and Trably, E.: Microbial ecology of fermentative hydrogen producing bioprocesses: useful insights for driving the ecosystem function, FEMS Microbiol. Rev., 41, 158–181, 2017.
Cabugao, K. G., Yaffar, D., Stenson, N., Childs, J., Phillips, J., Mayes, M. A., Yang, X., Weston, D. J., and Norby, R. J.: Bringing function to structure: Root–soil interactions shaping phosphatase activity throughout a soil profile in Puerto Rico, Ecol. Evol., 11, 1150–1164, https://doi.org/10.1002/ece3.7036, 2021.
Cao, M., Dent, J., and Heal, O.: Modeling methane emissions from rice paddies, Global Biogeochem. Cy., 9, 183–195, https://doi.org/10.1029/94GB03231, 1995.
Cattânio, J. H., Davidson, E. A., Nepstad, D. C., Verchot, L. V., and Ackerman, I. L.: Unexpected results of a pilot throughfall exclusion experiment on soil emissions of CO2, CH4, N2O, and NO in eastern Amazonia, Biol. Fert. Soils, 36, 102–108, https://doi.org/10.1007/s00374-002-0517-x, 2002.
Chadwick, R., Good, P., Martin, G., and Rowell, D. P.: Large rainfall changes consistently projected over substantial areas of tropical land, Nat. Clim. Change, 6, 177–181, https://doi.org/10.1038/NCLIMATE2805, 2016.
Conrad, R.: Control of methane production in terrestrial ecosystems, in: John Wiley & Sons, Chichester, 39–58, 1989.
Conrad, R.: Soil microorganisms as controllers of atmospheric trace gases (H2, CO, CH4, OCS, N2O, and NO), Microbiol. Mol. Biol. Rev., 60, 609–640, 1996.
Conrad, R. and Klose, M.: Anaerobic conversion of carbon dioxide to methane, acetate and propionate on washed rice roots, FEMS Microbiol. Ecol., 30, 147–155, https://doi.org/10.1111/j.1574-6941.1999.tb00643.x, 1999.
Cusack, D. F., Silver, W. L., and McDowell, W. H.: Biological nitrogen fixation in two tropical forests: ecosystem-level patterns and effects of nitrogen fertilization, Ecosystems, 12, 1299–1315, 2009.
Davidson, E. A. and Trumbore, S. E.: Gas diffusivity and production of CO2 in deep soils of the eastern Amazon, Tellus B, 47, 550–565, https://doi.org/10.3402/tellusb.v47i5.16071, 1995.
Davidson, E. A., Ishida, F. Y., and Nepstad, D. C.: Effects of an experimental drought on soil emissions of carbon dioxide, methane, nitrous oxide, and nitric oxide in a moist tropical forest, Glob. Change Biol., 10, 718–730, https://doi.org/10.1111/j.1365-2486.2004.00762.x, 2004.
Davidson, E. A., Savage, K. E., Trumbore, S. E., and Borken, W.: Vertical partitioning of CO2 production within a temperate forest soil, Glob. Change Biol., 12, 944–956, https://doi.org/10.1111/j.1365-2486.2005.01142.x, 2006.
Davidson, E. A., Nepstad, D. C., Ishida, F. Y., and Brando, P. M.: Effects of an experimental drought and recovery on soil emissions of carbon dioxide, methane, nitrous oxide, and nitric oxide in a moist tropical forest, Glob. Change Biol., 14, 2582–2590, https://doi.org/10.1111/j.1365-2486.2008.01694.x, 2008.
Davidson, E. A., Samanta, S., Caramori, S. S., and Savage, K.: The Dual Arrhenius and Michaelis–Menten kinetics model for decomposition of soil organic matter at hourly to seasonal time scales, Glob. Change Biol., 18, 371–384, https://doi.org/10.1111/j.1365-2486.2011.02546.x, 2012.
Ettwig, K. F., Zhu, B., Speth, D., Keltjens, J. T., Jetten, M. S., and Kartal, B.: Archaea catalyze iron-dependent anaerobic oxidation of methane, P. Natl. Acad. Sci. USA, 113, 12792–12796, https://doi.org/10.1073/pnas.1609534113, 2016.
Fennell, D. E. and Gossett, J. M.: Modeling the production of and competition for hydrogen in a dechlorinating culture, Environ. Sc. Technol., 32, 2450–2460, https://doi.org/10.1021/es980136l, 1998.
Goberna, M., Gadermaier, M., García, C., Wett, B., and Insam, H.: Adaptation of methanogenic communities to the cofermentation of cattle excreta and olive mill wastes at 37 ∘C and 55 ∘C, Appl. Environ. Microb., 76, 19, 6564–6571, https://doi.org/10.1128/AEM.00961-10, 2010.
Grant, R. F.: Simulation of methanogenesis in the mathematical model ecosys, Soil Biol. Biochem., 30, 883–896, https://doi.org/10.1016/S0038-0717(97)00218-6, 1998.
Hall, S. J. and Silver, W. L.: Iron oxidation stimulates organic matter decomposition in humid tropical forest soils, Glob. Change Biol., 19, 2804–2813, https://doi.org/10.1111/gcb.12229, 2013.
Hall, S. J. and Silver, W. L.: Reducing conditions, reactive metals, and their interactions can explain spatial patterns of surface soil carbon in a humid tropical forest, Biogeochemistry, 125, 149–165, https://doi.org/10.1007/s10533-015-0120-5, 2015.
Hall, S. J., Liptzin, D., Buss, H. L., DeAngelis, K., and Silver, W. L.: Drivers and patterns of iron redox cycling from surface to bedrock in a deep tropical forest soil: A new conceptual model, Biogeochemistry, 130, 177–190, 2016.
Harris, N. L., Lugo, A. E., Brown, S., and Heartsill-Scalley, T. (Eds.): Luquillo Experimental Forest: Research history and Opportunities, EFR-1, Washington, DC, U.S. Department of Agriculture, 152 pp., 2012.
Heartsill-Scalley, T., Scatena, F. N., Estrada, C., McDowell, W., and Lugo, A. E.: Disturbance and long-term patterns of rainfall and throughfall nutrient fluxes in a subtropical wet forest in Puerto Rico, J. Hydrol., 333, 472–485, https://doi.org/10.1016/j.jhydrol.2006.09.019, 2007.
Johnson, A. H., Xing, H. X., and Scatena, F. N.: Controls on soil carbon stocks in El Yunque National Forest, Puerto Rico, Soil Sci. Soc. Am. J., 79, 294–304, https://doi.org/10.2136/sssaj2014.05.0199, 2014.
Jones, D., Dennis, P., Owen, A., and Van Hees, P.: Organic acid behavior in soils–misconceptions and knowledge gaps, Plant Soil, 248, 31–41, 2003.
Keller, M. and Matson, P. A.: Biosphere-atmosphere exchange of trace gases in the tropics: Evaluating the effects of land use changes, in: Global Atmospheric-Biospheric Chemistry, Springer, 103–117, https://doi.org/10.1007/978-1-4615-2524-0, 1994.
Kettunen, A.: Connecting methane fluxes to vegetation cover and water table fluctuations at microsite level: A modeling study, Global Biogeochem. Cy., 17, 1051, https://doi.org/10.1029/2002GB001958, 2003.
Liptzin, D., Silver, W. L., and Detto, M.: Temporal dynamics in soil oxygen and greenhouse gases in two humid tropical forests, Ecosystems, 14, 171–182, https://doi.org/10.1007/s10021-010-9402-x, 2011.
Massman, W.: A review of the molecular diffusivities of H2O, CO2, CH4, CO, O3, SO2, NH3, N2O, NO, and NO2 in air, O2 and N2 near STP, Atmos. Environ., 32, 1111–1127, https://doi.org/10.1016/S1352-2310(97)00391-9, 1998.
McGill, W. B., Hunt, H. W., Woodmansee, R. G., and Reuss, J. O.: Phoenix, a model of the dynamics of carbon and nitrogen in grassland soils, Ecol. Bull., 33, 49–115, 1981.
McNicol, G. and Silver, W. L.: Separate effects of flooding and anaerobiosis on soil greenhouse gas emissions and redox sensitive biogeochemistry, J. Geophys. Res.-Biogeo., 119, 557–566, https://doi.org/10.1002/2013JG002433, 2014.
Megonigal, J. P. and Geunther, A. B.: Methane emissions from upland forest soils and vegetation, Tree Physiol., 28, 491–498, 2008.
Narrowe, A. B., Borton, M. A., Hoyt, D. W., Smith, G. J., Daly, R. A., Angle, J. C., Eder, E. K., Wong, A. R., Wolfe, R. A., Pappas, A., Bohrer, G., Miller, C. S., and Wrighton, K. A.: Uncovering the diversity and activity of methylotrophic methanogens in freshwater wetland soils, mSystems, 4, e00320-19, https://doi.org/10.1128/mSystems.00320-19, 2019.
Neelin, J. D., Münnich, M., Su, H., Meyerson, J. E., and Holloway, C. E.: Tropical drying trends in global warming models and observations, P. Natl. Acad. Sci. USA, 103, 6110–6115, https://doi.org/10.1073/pnas.0601798103, 2006.
O'Connell, C. S., Ruan, L., and Silver, W. L.: Drought drives rapid shifts in tropical rainforest soil biogeochemistry and greenhouse gas emissions, Nat. Commun., 9, 1–9, https://doi.org/10.1038/s41467-018-03352-3, 2018.
Pachauri, R. K., Allen, M. R., Barros, V. R., Broome, J., Cramer, W., Christ, R., Church, J. A., Clarke, L., Dahe, Q., and Dasgupta, P.: Climate change 2014: Synthesis report. Contribution of Working Groups I, II and III to the Fifth Assessment Report of the Intergovernmental Panel on Climate Change, IPCC, https://doi.org/10.1013/epic.45156.d001, 2014.
Papendick, R. and Campbell, G. S.: Theory and measurement of water potential, Water Potential Relations in Soil Microbiology, 9, 1–22, 1981.
Parfitt, R. L., Atkinson, R. J., and Smart, R. S. C.: The mechanism of phosphate fixation by iron oxides, Soil Sci. Soc. Am. J., 39, 837–841, https://doi.org/10.2136/sssaj1975.03615995003900050017x, 1975.
Parton, W., Silver, W. L., Burke, I., Grassens, L., Harmon, M. E., Currie, W. S., King, J. Y., Adair, E. C., Brandt, L. A., Hart, S. C., and Fasth, B.: Global-scale similarities in nitrogen release patterns during long-term decomposition, Science, 315, 361–364, https://doi.org/10.1126/science.1134853, 2007.
Patil, I.: ggstatsplot: “ggplot2” Based Plots with Statistical Details, Zenodo, https://doi.org/10.5281/zenodo.2074621, 2018.
Pavlov, M. Y. and Ehrenberg, M.: Optimal control of gene expression for fast proteome adaptation to environmental change, Proc. Natl. Acad. Sci. USA, 110, 20527–20532, https://doi.org/10.1073/pnas.1309356110, 2013.
Pumpanen, J., Kolari, P., Ilvesniemi, H., Minkkinen, K., Vesala, T., Niinistö, S., Lohila, A., Larmola, T., Morero, M., and Pihlatie, M.: Comparison of different chamber techniques for measuring soil CO2 efflux, Agr. Forest Meteorol., 123, 159–176, https://doi.org/10.1016/j.agrformet.2003.12.001, 2004.
R Core Team.: R: A language and environment for statistical computing, Vienna, Austria, available at: https://www.r-project.org/ (last access: 16 February 2021), 2018.
Roussel E. G., Cragg, B. A., Webster, G., Sass, H., Tang, X., Williams, A. S., Gorra, R., Weightman, A. J., and Parkes, R. J.: Complex coupled metabolic and prokaryotic community responses to increasing temperatures in anaerobic marine sediments: Critical temperatures and substrate changes, FEMS Microbiol. Ecol., 91, fiv084, https://doi.org/10.1093/femsec/fiv084, 2015.
Scatena, F. and Lugo, A. E.: Geomorphology, disturbance, and the soil and vegetation of two subtropical wet steepland watersheds of Puerto Rico, Geomorphology, 13, 199–213, https://doi.org/10.1016/0169-555X(95)00021-V, 1995.
Scatena, F. N.: An introduction to the physiography and history of the Bisley Experimental Watersheds in the Luquillo Mountains of Puerto Rico, Gen. Tech. Rep. SO-72, New Orleans, LA: US Dept of Agriculture, Forest Service, Southern Forest Experiment Station, Vol. 72, 22 pp., 1989.
Segers, R.: Methane production and methane consumption: a review of processes underlying wetland methane fluxes, Biogeochemistry, 41, 23–51, https://doi.org/10.1023/A:1005929032764, 1998.
Servais, P., Billen, G., and Rego, J. V.: Rate of bacterial mortality in aquatic environments, Appl. Environ. Microbiol., 49, 1448–1454, 1985.
Sihi, D.: PR-model v1.0., Zenodo, https://doi.org/10.5281/zenodo.3890562, 2020.
Sihi, D., Davidson, E. A., Chen, M., Savage, K. E., Richardson, A. D., Keenan, T. F., and Hollinger, D. Y.: Merging a mechanistic enzymatic model of soil heterotrophic respiration into an ecosystem model in two AmeriFlux sites of northeastern USA, Agr. Forest Meteorol., 252, 155–166, https://doi.org/10.1016/j.agrformet.2018.01.026, 2018.
Sihi, D., Davidson, E. A., Savage, K. E., and Liang, D.: Simultaneous numerical representation of soil microsite production and consumption of carbon dioxide, methane, and nitrous oxide using probability distribution functions, Glob. Change Biol., 26, 200–218, https://doi.org/10.1111/gcb.14855, 2020a.
Sihi, D., López-Lloreda, C., Brenner J. M., Quinn R. K., Phillips J. R., and Mayes, M. A.: Soil chemistry data across a catena in the Luquillo Experimental Forest, Puerto Rico: A Comprehensive Framework for Modeling Emissions from Tropical Soils and Wetlands, https://doi.org/10.15485/1618870, 2020b.
Sihi, D., López-Lloreda, C. Brenner J. M., Quinn R. K., Phillips J. R., Newman B. D., and Mayes, M. A.: Porewater data across a catena in the Luquillo Experimental Forest, Puerto Rico: A Comprehensive Framework for Modeling Emissions from Tropical Soils and Wetlands, https://doi.org/10.15485/1618869, 2020c.
Sihi, D., Salazar-Ortiz, M., and Mayes, M. A.: Soil chamber fluxes (CO2 and CH4) across a catena in the Luquillo Experimental Forest, Puerto Rico: A Comprehensive Framework for Modeling Emissions from Tropical Soils and Wetlands, https://doi.org/10.15485/1632882, 2020d.
Silver, W.: LCZO – Soil Moisture – Soil Respiration, Oxygen and Water Content – El Verde – (2014–2016), HydroShare, available at: http://www.hydroshare.org/resource/4f025f6ba647411c8c16800f607d5baf (last access: 16 February 2021), 2019.
Silver, W. L., Lugo, A., and Keller, M.: Soil oxygen availability and biogeochemistry along rainfall and topographic gradients in upland wet tropical forest soils, Biogeochemistry, 44, 301–328, 1999.
Silver, W. L., Liptzin, D., and Almaraz, M.: Soil redox dynamics and biogeochemistry along a tropical elevation gradient, in: Ecological gradient analyses in a tropical landscape, edited by: González, G., Willig, M. R., and Waide, R. B., Ecol. Bull., Wiley-Blackwell, Hoboken, NJ, Vol. 54, 195–210, 2013.
Six, J., Bossuyt, H., Dergryze, S., and Denef, K.: A history of research on the link between (micro)aggregates, soil biota, and soil organic matter dynamics, Soil Till. Res., 79, 7–31, 2004.
Smith, P. H. and Mah, R. A.: Kinetics of acetate metabolism during sludge digestion, Appl. Microbiol., 14, 368–371, 1966.
Soetaert, K.: R Package FME: Inverse modelling, sensitivity, Monte Carlo – Applied to a dynamic simulation model, (CRAN Vignette 2), available at: https://cran.r-project.org/web/packages/FME/vignettes/FMEdyna.pdf (last access: 16 February 2021), 2016.
Soil Survey Staff: Order 1 Soil Survey of the Luquillo Long-Term Ecological Research Grid, Puerto Rico, USDA, NRCS, available at: https://luq.lter.network/content/ (last access: 16 February 2021), 1995.
Tang, G., Zheng, J., Xu, X., Yang, Z., Graham, D. E., Gu, B., Painter, S. L., and Thornton, P. E.: Biogeochemical modeling of CO2 and CH4 production in anoxic Arctic soil microcosms, Biogeosciences, 13, 5021, https://doi.org/10.5194/bg-13-5021-2016, 2016.
Teh, Y. A. and Silver, W. L.: Effects of soil structure destruction on methane production and carbon partitioning between methanogenic pathways in tropical rain forest soils, J. Geophys. Res.-Biogeo., 111, G01003, https://doi.org/10.1029/2005JG000020, 2006.
Teh, Y. A., Silver, W. L., and Conrad, M. E.: Oxygen effects on methane production and oxidation in humid tropical forest soils, Glob. Change Biol., 11, 1283–1297, https://doi.org/10.1111/j.1365-2486.2005.00983.x, 2005.
Teh, Y. A., Dubinsky, E. A., Silver, W. L., and Carlson, C. M.: Suppression of methanogenesis by dissimilatory Fe (III)-reducing bacteria in tropical rain forest soils: Implications for ecosystem methane flux, Glob. Change Biol., 14, 413–422, https://doi.org/10.1111/j.1365-2486.2007.01487.x, 2008.
Thomas, G. W.: Soil pH and soil acidity, Methods of Soil Analysis: Part 3 Chemical Methods, SSSA Book Series no. 5, Soil Science Society of America, Madison, WI, USA 5, 475–490, https://doi.org/10.2136/sssabookser5.3.c16, 1996.
Thompson, A., Chadwick, O. A., Boman, S., and Chorover, J.: Colloid mobilization during soil iron redox oscillations, Environ. Sci. Technol., 40, 5743–5749, https://doi.org/10.1021/es061203b, 2006.
van Hulzen, J. B., Segers, R., van Bodegom, P. M., and Leffelaar, P. A.: Temperature effects on soil methane production: an explanation for observed variability, Soil Biol. Biochem., 31, 1919–1929, https://doi.org/10.1016/S0038-0717(99)00109-1, 1999.
Verchot, L. V., Davidson, E. A., Cattânio, J. H., and Ackerman, I. L.: Land-use change and biogeochemical controls of methane fluxes in soils of eastern Amazonia, Ecosystems, 3, 41–56, https://doi.org/10.1007/s100210000009, 2000.
von Fischer, J. C. and Hedin, L. O.: Separating methane production and consumption with a field-based isotope pool dilution technique, Global Biogeochem. Cy., 16, 1034, https://doi.org/10.1029/2001GB001448, 2002.
Wadsworth, F. H.: Forest management in the Luquillo mountains, I-setting, Caribbean Forester, 12, 114–124, 1951.
Wang, Y., Yuan, F., Yuan, F., Gu, B., Hahn, M. S., Torn, M. S., Ricciuto, D. M., Kumar, J., He, L., Zona, D., Lipson, D. L., Wagner, R., Oechel, W. C., Wullschleger, S. D., Thornton, P. E., and Xu, X.: Mechanistic modeling of microtopographic impact on CH4 processes in an Alaskan tundra ecosystem using the CLM-Microbe model, J. Adv. Model. Earth Sy., 11, 4228–4304, 2019.
Wickham, H.: ggplot2: elegant graphics for data analysis, Springer-Verlag, New York, 213 pp., https://doi.org/10.1007/978-0-387-98141-3, 2016.
Wood, T. E. and Silver, W. L.: Strong spatial variability in trace gas dynamics following experimental drought in a humid tropical forest, Global Biogeochem. Cy., 26, GB3005, https://doi.org/10.1029/2010GB004014, 2012.
Xu, X., Elias, D. A., Graham, D. E., Phelps, T. J., Carroll, S. L., Wullschleger, S. D., and Thornton, P. E.: A microbial functional group-based module for simulating methane production and consumption: Application to an incubated permafrost soil, J. Geophys. Res.-Biogeo., 120, 1315–1333, https://doi.org/10.1002/2015jg002935, 2015.
Xu, X., Yuan, F., Hanson, P. J., Wullschleger, S. D., Thornton, P. E., Riley, W. J., Song, X., Graham, D. E., Song, C., and Tian, H.: Reviews and syntheses: Four decades of modeling methane cycling in terrestrial ecosystems, Biogeosciences, 13, 3735–3755, https://doi.org/10.5194/bg-13-3735-2016, 2016.
Xu, X. F., Tian, H. Q., Zhang, C., Liu, M. L., Ren, W., Chen, G. S., Lu, C. Q., and Bruhwiler, L.: Attribution of spatial and temporal variations in terrestrial methane flux over North America, Biogeosciences, 7, 3637–3655, https://doi.org/10.5194/bg-7-3637-2010, 2010.
Zheng, J., Thornton, P. E., Painter, S. L., Gu, B., Wullschleger, S. D., and Graham, D. E.: Modeling anaerobic soil organic carbon decomposition in Arctic polygon tundra: insights into soil geochemical influences on carbon mineralization, Biogeosciences, 16, 663–680, https://doi.org/10.5194/bg-16-663-2019, 2019.
Zimmerman, J.: Meteorological data from El Verde Field Station: NADP Tower, 2000–2020, Luquillo LTER dataset, https://doi.org/10.6073/pasta/d62b391ee1c4e26, 2000.