the Creative Commons Attribution 4.0 License.
the Creative Commons Attribution 4.0 License.
 | 06 Apr 2021
Porewater δ13CDOC indicates variable extent of degradation in different talik layers of coastal Alaskan thermokarst lakes
Joshua F. Dean
Jorien E. Vonk
Lukas Wacker
Gert-Jan Reichart
Han Dolman
Thermokarst lakes play an important role in permafrost environments by warming and insulating the underlying permafrost. As a result, thaw bulbs of unfrozen ground (taliks) are formed. Since these taliks remain perennially thawed, they are zones of increased degradation where microbial activity and geochemical processes can lead to increased greenhouse gas emissions from thermokarst lakes. It is not well understood though to what extent the organic carbon (OC) in different talik layers below thermokarst lakes is affected by degradation. Here, we present two transects of short sediment cores from two thermokarst lakes on the Arctic Coastal Plain of Alaska. Based on their physiochemical properties, two main talik layers were identified. A “lake sediment” is identified at the top with low density, sand, and silicon content but high porosity. Underneath, a “taberite” (former permafrost soil) of high sediment density and rich in sand but with lower porosity is identified. Loss on ignition (LOI) measurements show that the organic matter (OM) content in the lake sediment of 28±3 wt % (1σ, n=23) is considerably higher than in the underlying taberite soil with 8±6 wt % (1σ, n=35), but dissolved organic carbon (DOC) leaches from both layers in high concentrations: 40±14 mg L−1 (1σ, n=22) and 60±14 mg L−1 (1σ, n=20). Stable carbon isotope analysis of the porewater DOC (δ13CDOC) showed a relatively wide range of values from −30.74 ‰ to −27.11 ‰ with a mean of ‰ (1σ, n=21) in the lake sediment, compared to a relatively narrow range of −27.58 ‰ to −26.76 ‰ with a mean of ‰ (1σ, n=21) in the taberite soil (one outlier at −30.74 ‰). The opposite was observed in the soil organic carbon (SOC), with a narrow δ13CSOC range from −29.15 ‰ to −27.72 ‰ in the lake sediment ( ‰, 1σ, n=23) in comparison to a wider δ13CSOC range from −27.72 ‰ to −25.55 ‰ in the underlying taberite soil ( ‰, 1σ, n=21). The wider range of porewater δ13CDOC values in the lake sediment compared to the taberite soil, but narrower range of comparative δ13CSOC, along with the δ13C-shift from δ13CSOC to δ13CDOC indicates increased stable carbon isotope fractionation due to ongoing processes in the lake sediment. Increased degradation of the OC in the lake sediment relative to the underlying taberite is the most likely explanation for these differences in δ13CDOC values. As thermokarst lakes can be important greenhouse gas sources in the Arctic, it is important to better understand the degree of degradation in the individual talik layers as an indicator for their potential in greenhouse gas release, especially, as predicted warming of the Arctic in the coming decades will likely increase the number and extent (horizontal and vertical) of thermokarst lake taliks.
- Article
(9657 KB) - Full-text XML
- BibTeX
- EndNote


Thermokarst lakes are common in permafrost landscapes of Siberia, Canada, and Alaska where they regionally cover more than 40 % of the land area (Lehner and Döll, 2004). Near Utqiaġvik, Alaska, they cover 23 % of the land surface (Engram et al., 2018). The name thermokarst lake refers to the process of lake formation through thaw-induced permafrost degradation resulting in the formation of topographic depressions in previously stable ground. This process is especially effective when the permafrost soils contain high proportions of ground ice (West and Plug, 2008). Along the Beaufort Sea coast of northern Alaska, permafrost soils locally contain up to 50 % ice in soil volume (Kanevskiy et al., 2013). Upon thaw, these soils undergo substantial volume loss, causing soil collapse and large-scale subsidence. Thawing is further exacerbated through water bodies such as ponds which form in hydrologically closed depressions. The pond water raises the soil temperature of the underlying permafrost as dark water surfaces trap heat due to their low albedo. With incipient thawing, ponds can eventually grow to large thermokarst lakes through horizontal and vertical permafrost degradation over time (West and Plug, 2008). Sudden processes like lake drainage, and flooding of drained lake basins, can also abruptly lead to the formation of new thermokarst lakes within days or weeks (van Huissteden et al., 2011), subjecting the permafrost landscape to constant change.
Thermokarst lake systems also play a vital role in the overall greenhouse gas budget and carbon balance of the Arctic. Depending on their depth, location in the landscape, adjacent soil properties, levels of shoreline erosion, and local climate conditions, thermokarst lakes were net carbon sinks (Walter et al., 2006, 2007) or sources of atmospheric carbon (Walter Anthony et al., 2014) during the Holocene. Favorable conditions for carbon sequestrations in these lakes are met when the input of organic material through shoreline erosion outpaces its degradation rate. Sediment accumulation rates can also increase when aquatic productivity is enhanced through supply from nutrient-rich permafrost soil erosion (e.g., yedoma) or when the lake itself provides the physical conditions (e.g., anoxia) for carbon accumulation and preservation in deeper water (Walter Anthony et al., 2014). Thermokarst lakes can act as net carbon sources when conditions for carbon sequestration are not met. Even conservative estimates expect an increase in future greenhouse gas emissions from thermokarst lakes through processes such as lake expansion due to warming air temperatures in the Arctic (van Huissteden et al., 2011).
Thermokarst lakes that freeze all the way to the lake bed in winter are referred to as bedfast-ice lakes. Once a thermokarst lake reaches a critical water depth which exceeds the maximum lake ice thickness in winter, the deepest part of the water column remains unfrozen year-round (Arp et al., 2012). These so-called floating-ice lakes then convey heat to the lake bed, and as a result a thaw bulb or talik (a zone of permanently unfrozen ground) forms that first extends into the frozen “lake sediment” and eventually propagates into the frozen soils below (Heslop et al., 2015). The uppermost part of the talik consists of materials accumulated through lake sedimentation that steadily grow in thickness through ongoing deposition. The main sediment sources in thermokarst lakes are allochthonous material of terrestrial origin from erosion of permafrost shorelines (input of previously frozen soil organic carbon (SOC)) and tundra vegetation as well as autochthonous material from aquatic productivity (Roiha et al., 2016). The deeper part of the talik contains the previously frozen ground of the permafrost underlying the lake; these thawed permafrost soils are called “taberite” (Grosse et al., 2007; Walter Anthony et al., 2014; Heslop et al., 2015).
Hugelius et al. (2014) estimated the total amount of SOC in the upper 3 m of the permafrost landscapes to be 1307 Pg (±170 Pg) of which 822 Pg was attributed to perennially frozen soils. Taliks can reach 95 m vertically into the permafrost under deep thermokarst lakes in Siberia (Schwamborn et al., 2002), but their growth is restricted and halts when a state of thermal equilibrium is reached (Boike et al., 2015). Lake taliks in the Arctic Coastal Plain of Alaska do not grow as deep and reach maximum depths of 53 m in ground-ice-rich permafrost (Ling and Zhang, 2003). As talik formation below thermokarst lakes progresses vertically, it introduces previously frozen SOC into the active carbon cycle by exposing it to year-round microbial degradation. In the same way these lakes function as natural incubators for permafrost organic carbon (OC) that is eroded horizontally from its shorelines as talik expansion also occurs laterally (Walvoord et al., 2019). This shoreline OC becomes part of the lake sediment after deposition on the lake bed. The water-saturated, thawed sediments leach dissolved organic carbon (DOC), a readily bioavailable form of OC, into their porewater where it is taken up and consumed by microorganisms (Nelson and Wear, 2014; Silveira, 2005; Spencer et al., 2015; Vonk et al., 2013). OC that is part of a talik as SOC or DOC is exposed to increased levels of degradation in comparison to the frozen grounds of the surrounding landscape (Heslop et al., 2015).
Despite extensive research on the importance of thermokarst lakes in the carbon cycle of permafrost regions, the role of taliks in thermokarst lake systems is not well understood. It is known that thermokarst lake taliks include thawed permafrost soil in its deeper layers and a steadily growing layer of lake sedimentation at the top of the talik. These layers, or facies (Farquharson et al., 2016), can differ significantly in OC content due to the different formation processes. In particular, it is unclear to what degree the uppermost talik facies of the lake sediment and the taberite facies are affected by degradation processes (Heslop et al., 2015). We hypothesize that the level of soil degradation is likely more intense towards the top of the talik in the lake sediment and declines with sediment depth towards the taberite facies. Here we use DOC concentrations, soil organic matter (SOM) content (based on LOI), and δ13CSOC and δ13CDOC ratios to evaluate the degree of degradation processes in different lake talik facies. We analyzed these parameters in sediment cores from two thermokarst lakes near the city of Utqiaġvik, Alaska (Fig. 1).

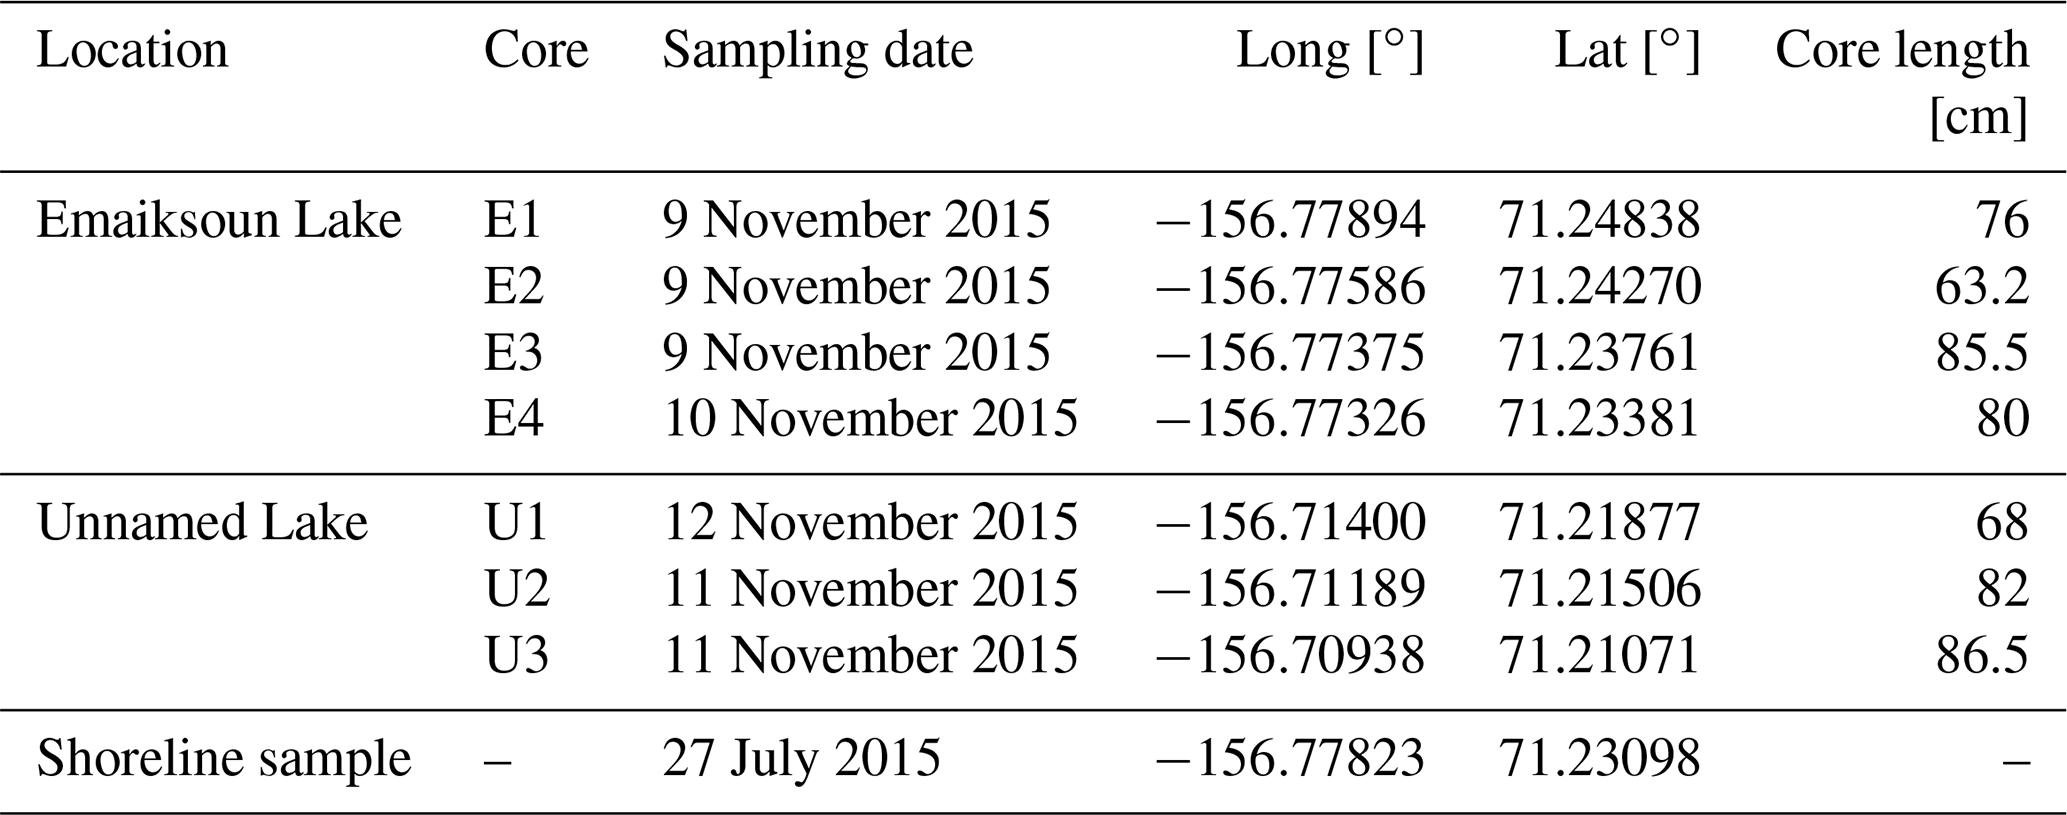
Figure 1Study area 5 km south of Utqiaġvik (Alaska) with lake bathymetry maps. Emaiksoun and Unnamed Lake were sampled for sediment core transects E1–E4 and U1–U3, respectively. Dashed blue outlines indicate their remnant shorelines of previous lake extents (or old partially drained lake basins). The location and age of a radiocarbon shoreline sample is displayed at the southern shoreline of Emaiksoun Lake. (The overview map was created with the Generic Mapping Tool 6.1.1. The main map was created in QGIS 3.16.0 with the OpenLayers Plugin through imported satellite images from © Google Maps (map data: 2020 TerraMetrics).)
The different talik facies were characterized using physical and sedimentary techniques (X-ray fluorescence scanning, sediment density, water content, grain size, magnetic susceptibility, core imaging). The changes from δ13CSOC to δ13CDOC in the individual talik facies were of particular interest to determine whether OC degradation occurs at different rates in the individual carbon pools of the lake sediment versus the taberite.
2.1 Field site and sampling
Sediment cores were collected along two transects at two thermokarst lakes on the Arctic Coastal Plain of Alaska, 4 and 8 km south of Utqiaġvik (formerly Barrow), the northernmost settlement in Alaska. The landscape of the Arctic Coastal Plain is characterized by a flat topography of 0–300 m above sea level with only minor elevation changes, especially in the study area along the Chukchi Sea coastline (Sellmann et al., 1975). Utqiaġvik has a cold maritime climate with a mean annual temperature of −12 ∘C and an annual precipitation of 106 mm of which 63 % falls as rain during the summer months (Hinkel et al., 2003).
Emaiksoun and Unnamed Lake were selected for sediment coring based on their depths of more than 2 m (Fig. 1) in the bathymetry maps which classifies them as floating-ice lakes on the Alaskan Coastal Plane. Also, Hinkel et al. (2012) and Engram et al. (2018) identified Emaiksoun Lake as a floating-ice lake with comparable lake depth measurements of more than 2 m. Unnamed Lake to the southeast of Emaiksoun Lake has a similar maximum depth of 2.5 m and can thus also be considered a talik-forming, floating-ice lake as the maximum winter ice thickness on the Arctic Coastal Plain averages around 1.5–2 m (Hinkel et al., 2012).
The prevailing easterly and westerly winds in the region cause wave formation and shoreline erosion perpendicular to the wind direction that lead to north–south-oriented and elongated shapes of the lakes (Black and Barksdale, 1949; Livingstone, 1954) characteristic for this region (Fig. 1). These windy conditions also cause constant suspension and mixing of the uppermost sediment layers in the shallow lakes as most lakes do not exceed a water depth of 2 m. The lakes are surrounded by a marshy tundra landscape with shallow ponds and vegetation consisting of tundra grasses, brown mosses, Sphagnum, and occasional Betula nana shrubs.
Geologically the Arctic Coastal Plain of Alaska is predominantly underlain by fluvial and marine deposits of Pliocene to late Pleistocene age. These deposits are attributed to the geological Gubik Formation which is divided into several subunits of different age and sedimentary characteristics (Black, 1964). The study area is underlain by one of these subgroups called the Barrow Unit. It is described as a heterogeneous formation of fluvial, lagoon, beach, lacustrine, and shallow marine deposits that was deposited as recently as 120 000 years ago in the late Pleistocene and was frequently reworked by different agents of transport (marine, coastal, fluvial, lacustrine erosion, and redeposition), especially throughout the Holocene (Black, 1964; Repenning, 1983).
A lake survey took place from 28 July–1 August 2015 which included bathymetry measurements of four thermokarst lakes and shoreline sediment sampling. For the lake depth measurements, a Humminbird PiranhaMAX 160 fish finder was operated from a boat to collect depth data across the lakes. The spacing between GPS positions of the depth data is displayed in Fig. 1. Based on GPS data and depth measurements, bathymetric lake maps were compiled in QGIS 3.16.0 by creating shoreline shapefiles and interpolated raster layers of the data points by applying the Triangulated Irregular Network (TIN) method from the build-in interpolation plug-in.
During a second field trip from 2–15 November 2015, a total of 14 short sediment cores (60–84 cm) were taken from seven coring sites along north–south lines from two thermokarst lakes (Fig. 1; Table 1) with a manual, hand-held UWITEC gravity coring device. A transect of four coring sites from Emaiksoun Lake (E1–E4) and another transect of three coring sites from Unnamed Lake (U1–U3) were collected through holes drilled in the frozen lake surfaces. At each of the seven coring sites two sediment cores were collected approximately 1.5 m apart. One core from each site was used for sedimentary and geochemical analysis and the other for DOC porewater extraction. Layer thicknesses between the two sediment cores of each pair deviated on average only 3±2 cm. This suggests stable sediment deposition rates (locally), no major sediment deformation during coring, and homogenous core properties at the same core depths for the paired cores across the short distances. In the field the sediment cores were stored horizontally in insulated boxes after sampling to keep them above freezing temperature (4–7 ∘C). Porewater samples for DOC analysis were extracted from one sediment core at each sampling location at a 10 cm resolution at the end of the sampling day, maximally 6 h after core collection. Sampling was carried out with 5 cm long porous polymer soil moisture sampler (SMS) rhizons (0.12–0.18 µm pore size; Rhizosphere Research Products B.V.) which were inserted into the sediment cores through small holes drilled after the coring. Pre-evacuated vials (9 mL) were attached to the rhizons to extract the desired porewater volume of at least 5 mL; at times that process took a few minutes but could last up to 12 h depending on the soil properties and porewater content at the sampling depth. By running through the pores of the rhizons the water samples were directly filtered of all particulates and microorganisms in the porewater, while still virtually capturing the entire DOC pool (Dean et al., 2018). The samples were subsequently also treated with three to four drops of potassium iodide (KI) to further prevent microbial activity. After extraction, the porewater samples and all sediment cores were stored at 4 ∘C in the insulated boxes used in the field, shipped in cooled containers (4 ∘C), and after 2 weeks of transit stored horizontally, dark, and refrigerated at 4 ∘C at the laboratories of the Vrije Universiteit Amsterdam.
Table 1Overview of sediment cores and shoreline sample details.
2.2 Core scanning analysis
Core splitting, linescan core imaging, and X-ray fluorescence (XRF) scanning at a 1 cm resolution with an XRF scanner (Avaatech Analytical X-Ray Technology) were carried out at the Royal Netherlands Institute for Sea Research (NIOZ). The XRF data were taken at X-ray intensities of 10 kV and 30 kV (Hennekam et al., 2019), measuring amongst others iron (Fe), calcium (Ca), and silicon (Si). At the Vrije Universiteit Amsterdam the cores were measured for magnetic susceptibility and gamma-ray bulk density with a GEOTEK Multi-Sensor Core Logger (MSCL) at a 1 cm resolution (Witak et al., 2005). For both MSCL measurements the results were calibrated against standards of known density and magnetic susceptibility.
2.3 Sediment analysis
Grain size analyses were carried out with a laser-diffraction particle sizer (Sympatec HELOS KR) at the sediment laboratory of the Vrije Universiteit Amsterdam. In total 58 samples were analyzed at a standard resolution of 10 cm, and core sections with particularly homogenous core properties (E4, 24–78 cm) were individually sampled at lower resolution (maximum distance of 23 cm between samples).
All cores were subsampled at a higher resolution (4 cm) across the boundary of lake sediment and taberite to record the changes in grain size properties in higher resolution, an approach that was applied to all other core analyses. The grain size samples were brought to boiling point together with 5 mL of 30 % hydrogen peroxide (H2O2) to oxidize all organic components in the sediment. Secondly, the organic-free samples were treated with 5 mL of 10 % hydrochloric acid (HCl) to remove all carbonates. In a last step 300 mg of Na4O2P7 was added to the samples and, subsequently heated to the boiling point to break up particle conglomerates (van Buuren et al., 2020). Loss-on-ignition (LOI) data were collected with thermogravimetric analysis (TGA) carried out on a LECO TGA701 at the Vrije Universiteit Amsterdam. The samples were heated up incrementally from room temperature to 550 ∘C for several minutes while the weights before and after combustion were measured until they stabilized (van Buuren et al., 2020). The loss on ignition at 550 ∘C is here used as equivalent to the amount of SOM in the sediment. The water content of the sediment is based on the difference between wet and dry weights of the samples by loss in moisture after drying at 60 ∘C over a period of at least 48 h until a stable sample weight was reached (Ackroyd, 1957).
2.4 Carbon isotopes and DOC
The δ13CSOC analysis was carried out at the stable isotope laboratory of the Vrije Universiteit Amsterdam with a FlashEA 1112 NC series elemental analyzer coupled to a Thermo Finnigan DELTAplusXP isotope ratio mass spectrometer (IRMS). Prior to analysis, the samples were weighed into silver capsules and pre-treated by fumigation in a desiccator for 12 h with fuming HCl (37 %). Samples were folded and double-wrapped in tin capsules prior to analysis and calibrated against internationally distributed δ13C reference materials USGS24 ( ‰ relative to Vienna Pee Dee Belemnite (VPDB)), USGS40 ( ‰ VPDB), and USGS41 ( ‰ VPDB) (Coplen, 1996; Qi et al., 2003).
The filtered DOC porewater samples showed signs of flocculation and precipitation of solid materials a few days to weeks after sampling. Microbial activity can be ruled out as a cause due to the sample treatment with KI and the rhizon filtering process. Possible explanations are the interaction of porewater and its dissolved compounds with air in the headspace of the sample vials or flocculation as a result of reduced micro-turbulence in the sample vials. The precipitates were measured for their OC contents and stable carbon isotope values to account for any OC that was taken from the DOC pool through flocculation processes.
In order to record the original amount of carbon that was present as DOC, the porewater samples were refiltered (pre-combusted, 0.7 µm GF/F filters) to measure both DOC concentrations in the filtrate and the precipitated OC collected on the filters as newly formed particulate organic carbon (POC). The combined mass of detected DOC in the porewater and POC on the filters was summed up as a total carbon mass to recalculate the original DOC concentration prior to flocculation. The final δ13CDOC values are composed of the combined δ13C values of the DOC and POC based on their OC mass-based weighted average.
The dried filters with collected POC were placed in silver capsules, 25 µL Milli-Q water was added to wet the sample, and was then treated with 25 µL of 1 M HCL for 30 min. Another 50 µL 1 M HCl was added for an additional 30 min before drying at 60 ∘C for 3 h. The prepared samples were combusted to CO2 and quantified for their carbon mass with a Carlo Erba NC 2500 elemental analyzer at the Systems Ecology laboratory of the Vrije Universiteit Amsterdam. Subsequent δ13C analysis of the POC was carried out on a coupled Thermo Finnigan Delta Plus IRMS. The δ13C measurements were calibrated against internationally recognized standards USGS24 ( ‰ VPDB), USGS40 ( ‰ VPDB), USGS41 ( ‰ VPDB), and IAEA-CH-7 ( ‰ VPDB) (Coplen, 1996; Qi et al., 2003) and in-house standards of glutamic acid (−24.08 ‰) and birch leaf (−27.74 ‰).
The DOC and δ13CDOC measurements were carried out at the KU Leuven, Belgium, with an Aurora 1030W TOC carbon analyzer (OI Analytical) coupled to a Thermo Delta V Advantage IRMS (Dean et al., 2020; Morana et al., 2015). The porewater samples were pre-treated with 10 % phosphoric acid (H3PO4) to remove dissolved inorganic carbon (DIC). Samples were then purged with 5 % sodium persulfate (Na2S2O8) at 97 ∘C to oxidize all DOC to CO2. The CO2 was conveyed to the analyzing units of the carbon analyzer and the IRMS with nitrogen (N2) as the carrier gas. The calibration of the δ13CDOC measurements was based on an IAEA-CH-6 (−10.449 ‰ ± 0.033 VPDB) and a sucrose standard (−26.99 ‰). The DOC concentrations were calibrated against the same isotope standards at an array of different concentrations.
2.5 Radiocarbon dating
The radiocarbon (14C) dating was carried out at ETH Zürich, Switzerland, on 10 samples, of which seven were macrofossils (brown moss leaves and stems from E3 and U2, 16 cm resolution). Three samples were composed of bulk sediment; from the top of cores E3 and U2 and a tundra surface sample from the southern eroding shoreline of Emaiksoun Lake. The brown mosses were picked using sterile tweezers under a microscope from sieved (63 µm) bulk samples which were before soaked with 5 % sodium hydroxide (NaOH). Sample preparation for the 14C analysis was carried out at the Vrije Universiteit Amsterdam. The three bulk samples were fumigated in a desiccator for 3 d with 37 % fuming HCl at 60 ∘C. The same procedure was repeated with 5 % NaOH to neutralize the sample again, followed by drying. The macrofossil brown moss samples were treated with an acid–base–acid (ABA) procedure. The samples reacted with 0.5 M HCl for 1 h at 60 ∘C and then soaked in 0.1 M NaOH for 45 min and again soaked in 0.5 M HCl for 1 h at 60 ∘C. In between each soaking step and after the ABA procedure, each sample was rinsed three times with Milli-Q water. Afterwards the brown moss samples were dried at 60 ∘C for 24 h.
The fumigated bulk samples were directly analyzed after combustion with a gas-ion-source-equipped AMS (MICADAS) system at the Laboratory for Ion Beam Physics at the ETH Zürich (Wacker et al., 2013). The macrofossil samples were graphitized and a high-precision measurement performed (Wacker et al., 2010). Calibration of the radiocarbon ages to ranges of 2σ calendar years (yr) before present (BP) was carried out using IntCal20 (Reimer et al., 2020).
All seven cores contain a basal facies of taberite (Units A and B – former permafrost soils that are now unfrozen) with a facies of lake sediment on top (Unit C). Both facies are part of the talik that formed under these thermokarst lakes. However, their properties differ due to their different origins and processes of formation. In the following, we present the physical and geochemical results that identify and distinguish these different facies.
3.1 Physicochemical properties
The physical core descriptions in Figs. 2–3 show that the bottom half to two-thirds of all sediment cores are made up by sediments that can be attributed to the Barrow Unit of the Gubik Formation (taberite) – Units A–B (Black, 1964). The grain size data show that all cores (except E4 and U3) have a facies of silty clay with a low average sand content (8±6 %, 1σ, n=10) at their base (Unit A). The dominating color in Unit A was identified as a very dark gray (2.5Y 3/0) on the Munsell Soil Color Chart (1988). Small mussel shells or shell fragments were frequently present as well as scattered clusters of unidentified plant remains and small, well-rounded pebbles. Overall, Unit A is here identified as a shallow marine deposit from the Barrow Unit.
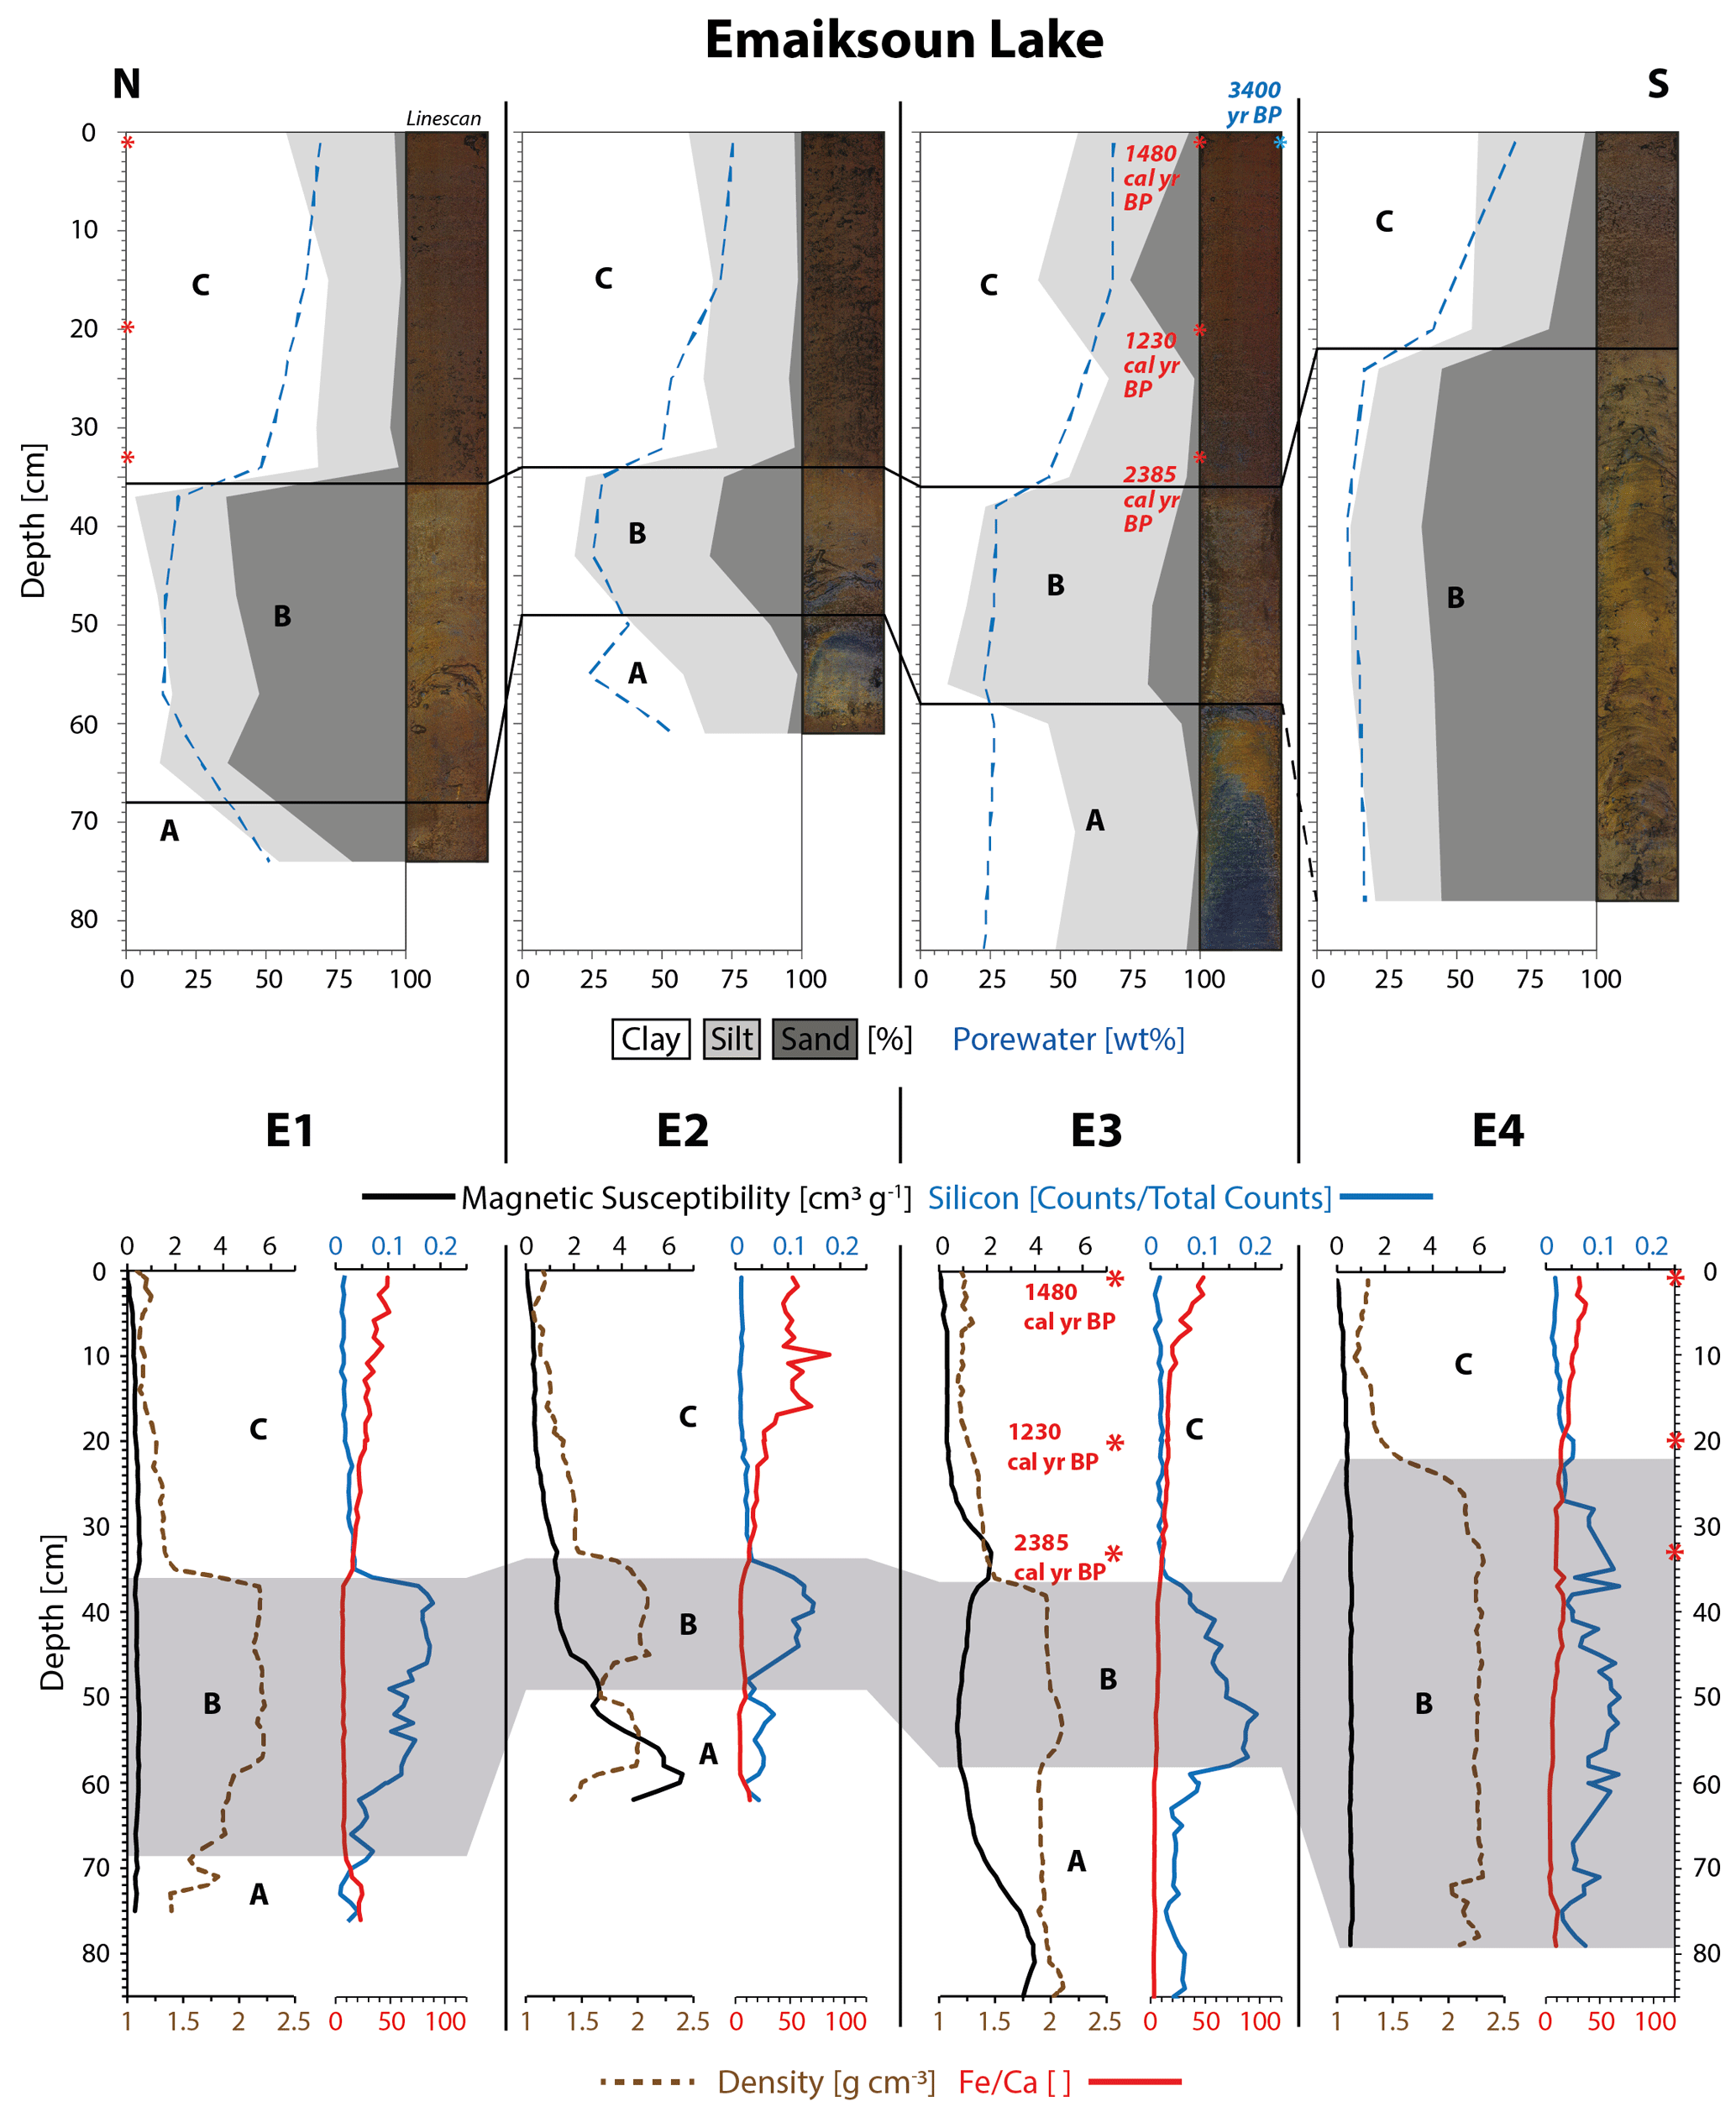
Figure 2Physical property plots of cores E1–E4 from Emaiksoun Lake show the talik subdivided into three units (A, B, C). The taberite soil (A–B) is distinguishable from the overlying lake sediment (C), especially through sharp boundaries in color, porewater content, grain size, sediment density, and silicon content. A vertical macrofossil radiocarbon age profile (red numbers) and a bulk sediment age (blue number) at the sediment surface are displayed as rounded values in core E3.
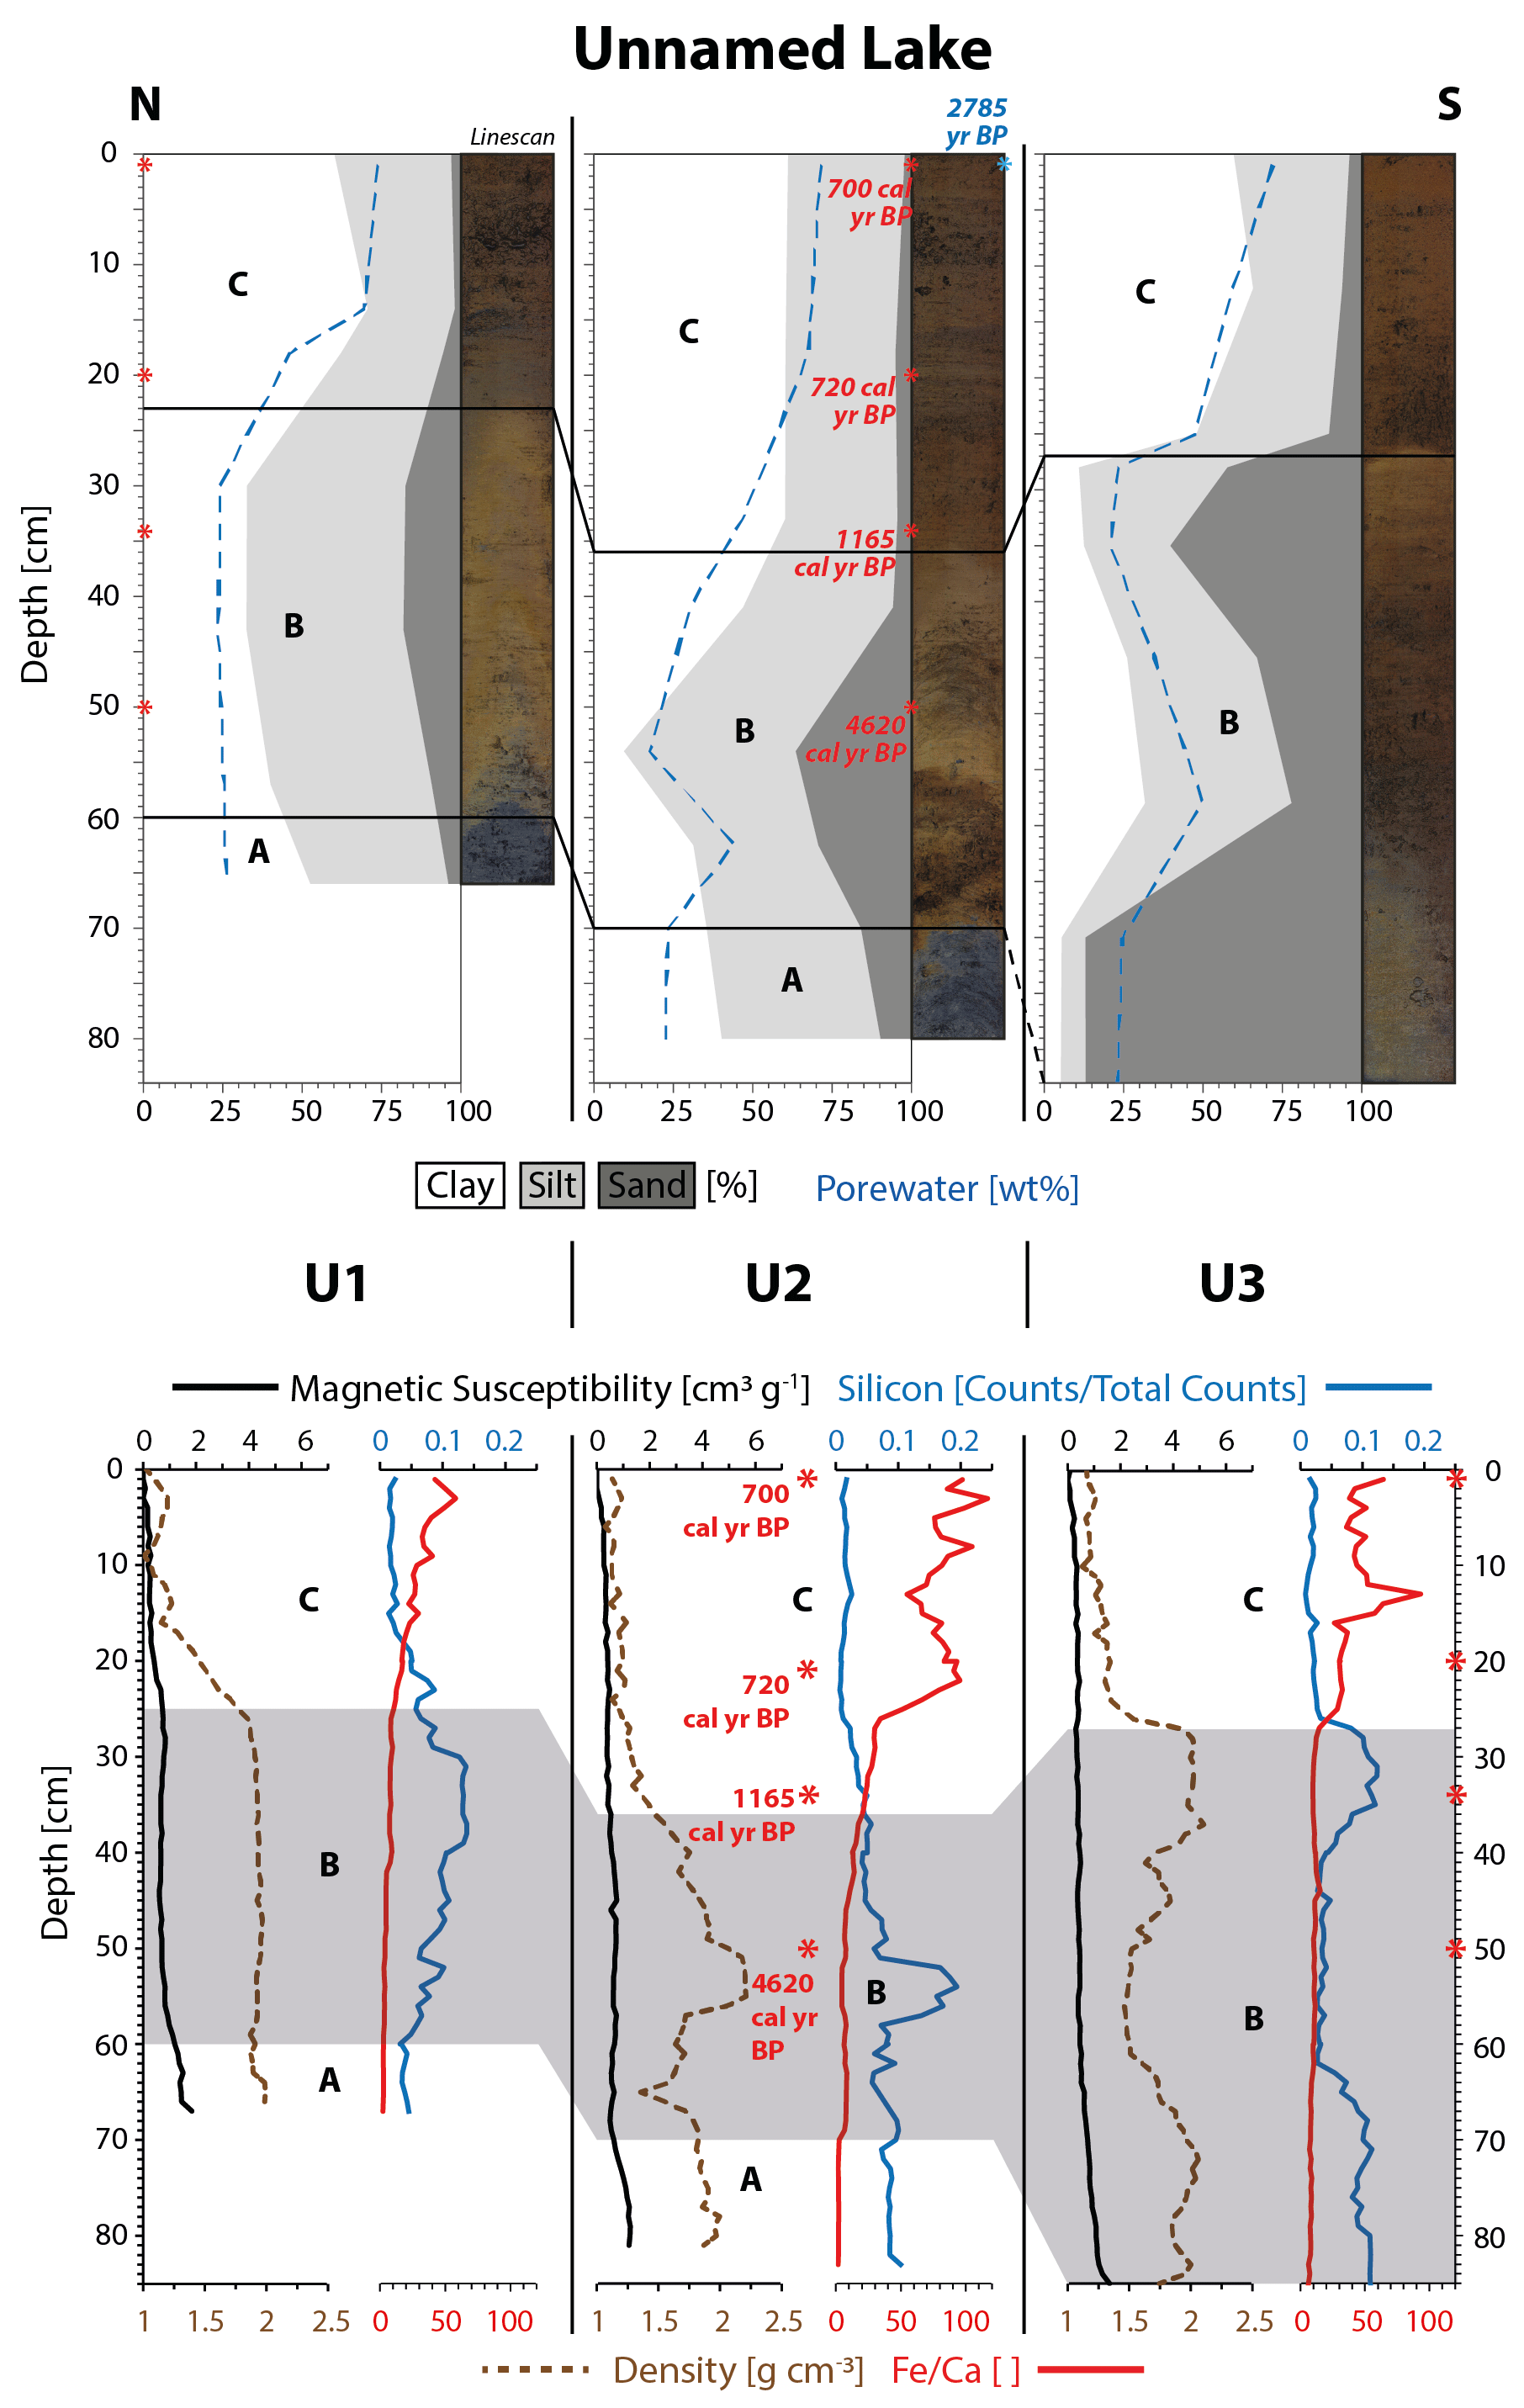
Figure 3Physical property plots of cores U1–U3 from Unnamed Lake show the talik subdivided into three units (A, B, C). The taberite soil (A–B) is distinguishable from the overlying lake sediment (C), especially through sharp boundaries in color, porewater content, grain size, sediment density, and silicon content. A vertical radiocarbon macrofossil age profile (red numbers) and a bulk sediment age (blue number) at the sediment surface are displayed as rounded values in core U2.
Unit B is present in all seven sediment cores; in E4 and U3 it makes up the base layer due to the lack of a Unit A. The grain size distribution in this unit is heterogeneous and ranges from sand (U3) to sandy loam (E3) and silty loam (U1). This unit is characterized by a strong variation in sand content due to some degree of mixing with the adjacent Units A and C. The sand content ranges from 5.8 % (U2, 41 cm) up to 87 % (U3, 70 and 84 cm). Overall, the common distinguishing parameter across Unit B in all cores is the high average sand content (41±24 %, 1σ, n=25) compared to Units A and C. The XRF data for silicon (Si) also coincide with the elevated sand content (Figs. 2–3). The dominant color of Unit B was determined as a dark grayish (2.5Y 4/2) to grayish brown (2.5Y 5/2). The color change from Unit A to B is clearly distinguishable as a sharp boundary in all cores, except from E1, where it appears as a more gradual transition. Furthermore, Unit B contains well-rounded pebbles, ranging in size from a few millimeters to more than 1 cm in diameter, which are homogenously spread out across the unit. Mussel shell fragments were rare in this unit. Unit B is here identified as a coastal beach deposit of the Barrow Unit.
The deposition of Units A (shallow marine) and B (coastal, beach) in that order can be interpreted as a succession of marine regression deposits capturing a seaward-moving coastline during the Pleistocene (Brigham-Grette and Carter, 1992). The porewater content across both units is at a low average of 26±10 wt % (1σ, n=35) with four major outliers in E1 (51 wt %, 74 cm), E2 (54 wt %, 61 cm), U2 (44 wt %, 62 cm), and U3 (50 wt %, 58 cm). The sediment density across both units does not drop below 1.36 g cm−3 (U2, 65 cm) and stands at an overall high average ±1σ of 1.94±0.2 g cm−3 (n=327) with a maximum density of 2.3 g cm−3 (E4, 34 cm). The magnetic susceptibility data (Figs. 2–3) also indicate elevated levels of magnetic particles in Units A–B (apart from E1 and E2), reflecting the abundance of mineral soil present in contrast to the overlying Unit C. The classification of Units A–B as marine deposits of the Barrow Unit within the Gubik Formation suggest that these sediments were originally not deposited through the means of lake sedimentation but were an integrated part of the permafrost ground before thermokarst lake and talik formation took place at the sampling location.
A third unit, Unit C, was identified at the top of all seven sediment cores which differs strongly from the underlying Units A–B. The boundary between Units B and C is marked by an abrupt color change to a very dark brown (10YR 2/2). The unstratified sediment of Unit C is a homogenous mud, dominated by clay or silty clay with a low average sand content (5±5 %, 1σ, n=23), except for one outlier in E3 (25 %, 15 cm). The change in grain size is reflected in a sharp boundary to Unit B, especially in E1, E2, E4, and U3. The porewater content increases strongly from the bottom (47±2.7 wt %, 1σ, n=7) to the water-saturated top of Unit C (72±2.4 wt %, 1σ, n=7). The average water content of 70±11 wt % (1σ, n=23) is considerably higher than in the Units A–B (26±10 wt %, 1σ, n=35). The sediment of Unit C is for a large part made up by plant detritus of terrestrial origin, mainly in the form of unidentified plant remains but also of roots, small leaves, and stems among which brown mosses, Sphagnum, and Betula nana were identified. Furthermore, freshwater ostracod shells and shell fragments were present in small numbers. The sediment density drops significantly at the Unit B–C boundary to a Unit C average of 1.24±0.1 g cm−3 (1σ, n=212), which is in strong contrast to the combined Units A–B density average of 1.94±0.2 g cm−3 (1σ, n=327). The low sand content across Unit C (5±5 %, 1σ, n=23) is also reflected in the XRF-Si count that is negligible in comparison to the high levels of Unit B (Figs. 2–3). Additionally, the ratios in Figs. 2–3 show that marine carbonate (represented by Ca) is still present throughout Units A–B, indicated by the very low values as opposed to elevated values in Unit C where terrestrial sources (represented by Fe) appear more dominant and carbonates are hardly present. Based on these physical properties, Unit C is classified as a homogenous lake sediment that contains large amounts of terrestrial plant detritus that differs strongly from the underlying taberite facies of the Units A–B.
The Units A–B were here identified as Pleistocene marine deposits of the Gubik Formation which were formerly part of the permafrost soil. From here onwards, they are collectively referred to as taberite, the overlying organic-rich mud of Unit C as lake sediment.
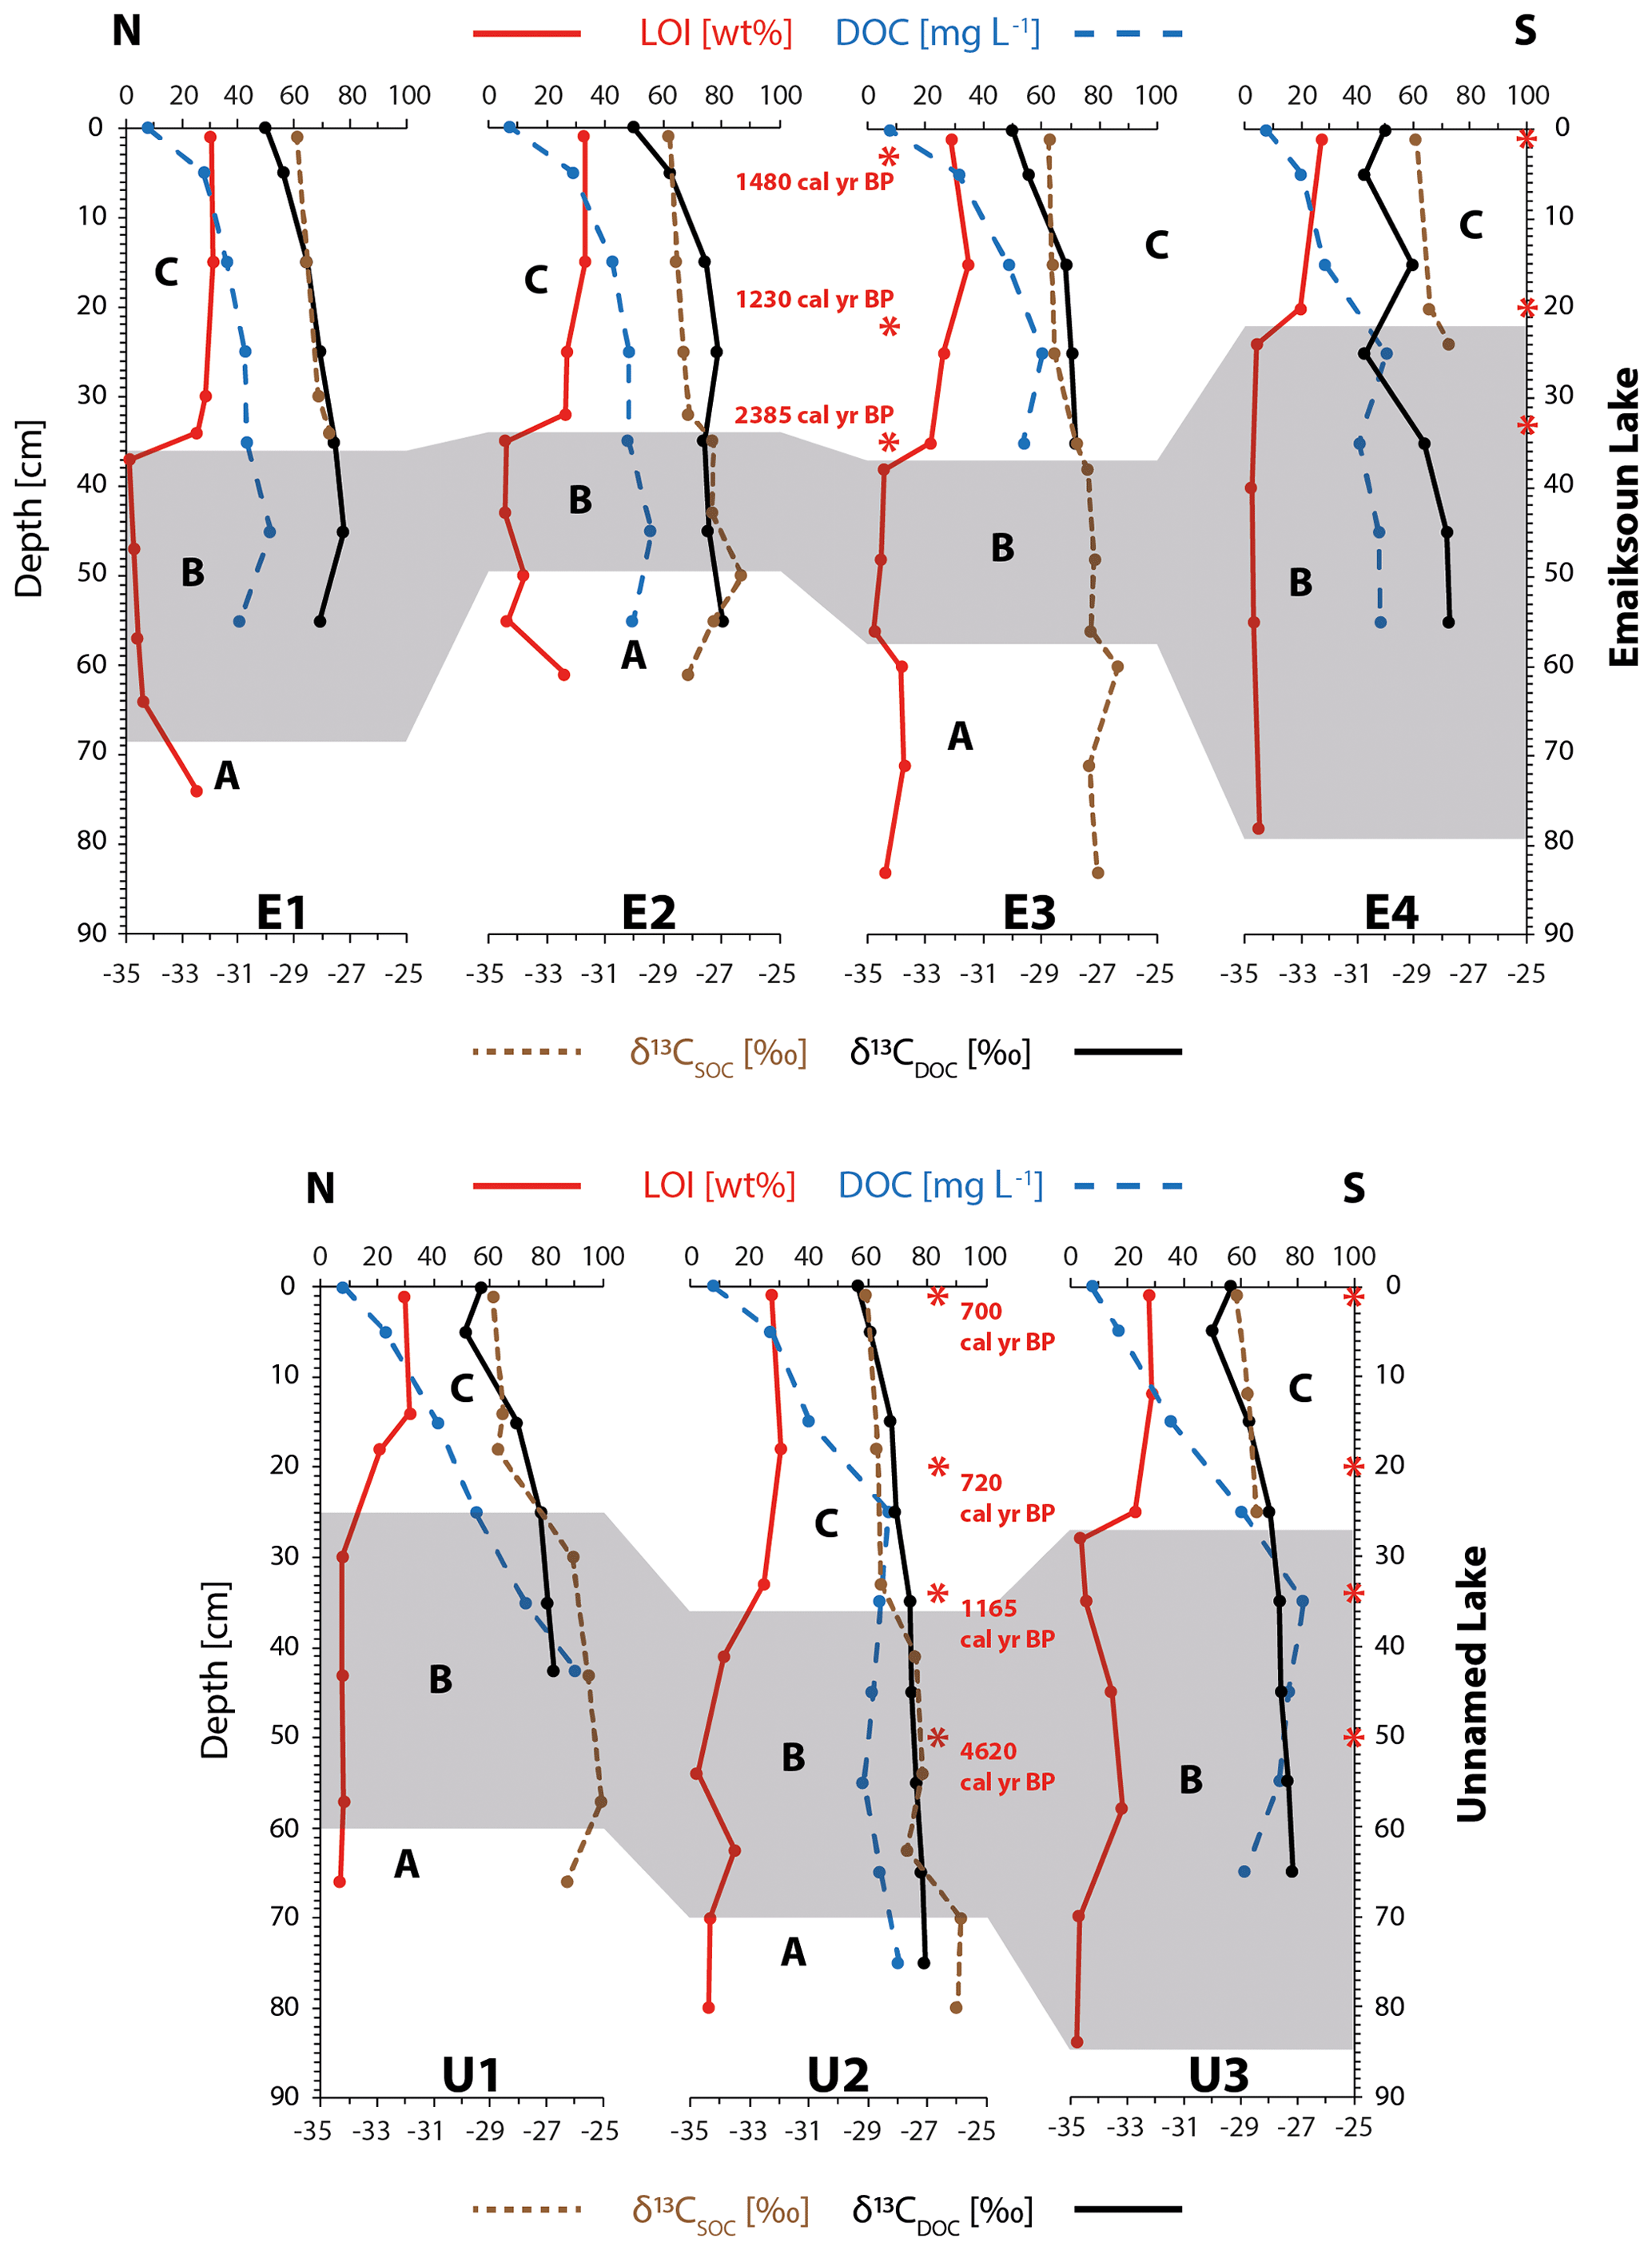
Figure 4Carbon plots of Emaiksoun Lake and Unnamed Lake displaying profiles for loss on ignition (LOI at 550 ∘C), porewater dissolved organic carbon concentration (DOC), and stable carbon isotope ratios of the sediment (δ13CSOC) and porewater DOC (δ13CDOC). A prominent jump in LOI values marks the B–C boundary.
3.2 Talik carbon stocks
The taberite and lake sediment differ particularly in their OC characteristics as displayed in Fig. 4. The most prominent difference between the taberite and the lake sediment is the SOM content, shown as LOI [wt %] at 550 ∘C. The lake sediment is characterized by a high LOI of 28±4 wt % (1σ, n=23) in contrast to the combined LOI of the taberite with 8±6 wt % (1σ, n=35). The high LOI values in the lake sediment support the observation from the core descriptions where abundant amounts of plant detritus were present. The change in LOI at the Units B–C boundary is sharp in all cores with the exception of U1 and U2 where a more gradual transition zone between the units formed.
The SOM (represented by LOI) in all sedimentary facies is the source material for DOC leaching into the sediment porewater where it can be further degraded (Kindler et al., 2011; McCullough et al., 2018; Peter et al., 2016). Nonetheless, the pronounced difference between LOI in the taberite and the lake sediment is not reflected in the DOC concentrations. On the contrary, the average DOC concentration in the SOM-poor soil of Units A–B (60±14 mg L−1, 1σ, n=20) is higher than in the SOM-rich lake sediment (40±14 mg L−1, 1σ, n=22). While the DOC concentrations in the taberite remain at stable levels across the profile, the DOC concentration in the lake sediment decreases steadily from its base (48±12 mg L−1, 1σ, n=7) towards the sediment surface at 1 cm core depth (25±5 mg L−1, 1σ, n=7).
The DOCnorm data displayed in Fig. 5a are normalized DOC concentrations converted to their total carbon mass in milligrams taking into account the known sediment volume, density, and porewater content. The normalization of DOC data points at certain core depths is based on the fixed volume (Vcore) of 1 cm (h) thick cross sections of the sediment core tubes (d=9 cm) with a volume of 63.6 cm3.
The total sediment density (ρsediment total) of each core section is known from the gamma-ray density measurements. Together with Vcore the total sediment mass including the pore water (msediment total) can be determined for each core depth.
The wet and dry weights of sediment samples were also measured; thus the relative amount of porewater [wt %] in relation to the total sediment mass (Figs. 2–3) at a certain core depth is also known. Together with msediment total the total porewater mass (mporewater) was calculated.
With mporewater, in turn the total porewater volume (Vporewater) present at a certain sampling depth can be calculated together with the known density of water (ρwater).
In a final step Vporewater and DOC concentration are used to determine the total mass of DOC present at a certain core depth for that fixed 63.3 cm3 volume (Vcore) of a 1 cm thick core cross section.
Normalized DOCnorm values in milligrams display the total amount of DOC present in each individual layer better than relative DOC concentrations [mg L−1]. The same approach of carbon normalization per 1 cm sediment core slice (63.6 cm3) at the sampling depth was applied to the SOMnorm [g] data in Fig. 5a, which is based on the LOI (550 ∘C) data. The normalized and quantified SOMnorm expressed in mass units is also representative of the amount of SOC in the ground as organic matter (OM) generally contains about 58 wt % OC (Christensen and Malmros, 1982). For Figs. 5 and 6 linear interpolations of the data were made to create matching depth data pairs. When DOC concentrations and SOM content are both normalized for their sediment properties (density, water content) at the sampling point, one obtains a more accurate representation of the total OC present at a given depth. This normalization shows that DOCnorm (Fig. 5a) in the lake sediment is directly dependent on the availability of SOMnorm (R2=0.40, P<0.001). The same correlation (Fig. 5a) is found in the taberite soil (R2=0.59, P<0.001).
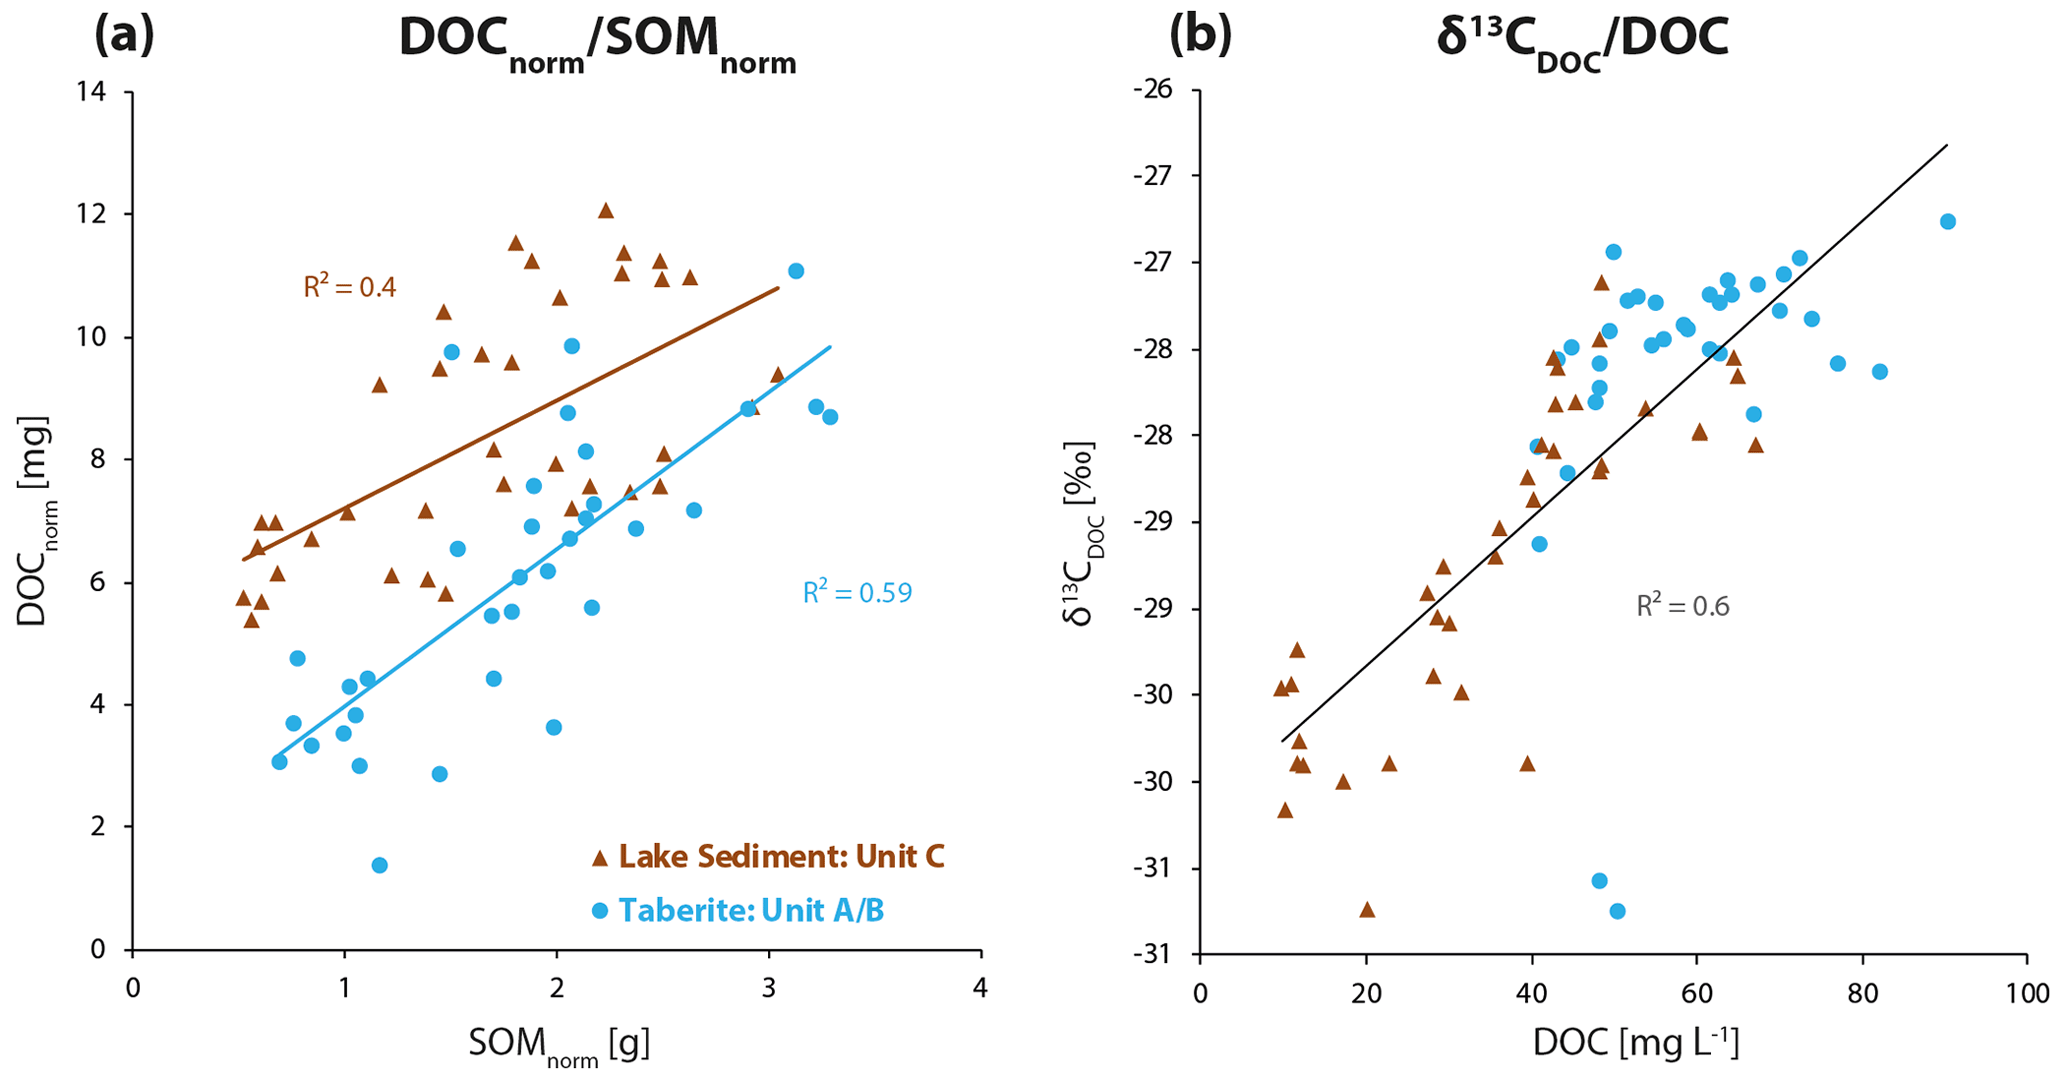
Figure 5(a) DOCnorm [mg] displays porewater DOC in mass units instead of concentrations. It shows that the total amount of DOC present in the lake sediment is higher than in the taberite. At the same time the total amount of SOMnorm [g] ranges in the same order of magnitude in both facies. (b) DOC concentrations are the highest in the taberite while DOC concentrations in the lake sediment have a broader concentration range. At the same time there is a trend across the complete talik profile of higher δ13CDOC values with higher DOC concentrations.
The higher the SOM content (and therefore SOC content), the more OC is leached into the sediment porewater as DOC. Furthermore, the normalized carbon plots (Fig. 5a) show that the total amount of OC available as DOC is in fact higher in the lake sediment than in the taberite soil. At the same time the total amount of OC available as SOMnorm [g] is almost identical in both the lake sediment and the taberite.
3.3 Stable carbon isotopes
The linear regression line in Fig. 5b shows a significant trend of higher δ13CDOC values with higher DOC concentrations across the complete talik profile (R2=0.60, P<0.001). This finding confirms the observations from Fig. 4 where DOC concentrations were increasing and δ13CDOC values were higher with progressing talik depth. The trend of higher δ13CDOC values with depth is particularly pronounced within the lake sediment from the top at 5 cm depth ( ‰, 1σ, n=7) to the bottom of the cores ( ‰, 1σ, n=7). Average δ13CDOC values of the taberite ( ‰, 1σ, n=21) are significantly different from the lake sediment ( ‰, 1σ, n=21), as confirmed in a one-way ANOVA test (P<0.001, F=12, Fcrit=4), which was performed as the values from the taberite are not normally distributed. The average δ13CSOC values of the taberite and lake sediment are ‰ (1σ, n=21) and ‰ (1σ, n=23), respectively. Generally, δ13CSOC values across the lake sediment slightly increase with depth from the top at 1 cm core depth ( ‰, 1σ, n=7) to the bottom of the unit ( ‰, 1σ, n=7). When plotting δ13CDOC and δ13CSOC against each other (Fig. 6a), two opposing trends stand out. Firstly, the δ13CDOC values in the taberite soil (R2=0.24, P<0.04) stay within a narrow range of 0.82 ‰ (min. −27.58 ‰ to max. −26.76 ‰, excluding one outlier at −30.74 ‰) while the δ13CSOC has a broad range of 2.17 ‰ (min. −27.72 ‰ to max. −25.55 ‰). The opposite relation (R2=0.44, P<0.001) is observed for the lake sediment where the δ13CDOC has a wide range of 3.63 ‰ (min. −30.74 ‰ to max. −27.11 ‰) while the δ13CSOC is limited to a narrow range of 1.43 ‰ (min. −29.15 ‰ to max. −27.72 ‰).

Figure 6(a) The lake sediment δ13CSOC value range is narrow while its δ13CDOC value range is wide; the opposite trend is the case for the taberite. The dashed lines highlight the respective δ13CDOC and δ13CSOC value ranges. The 1 : 1 line visualizes the changes in values from δ13CSOC to δ13CDOC in both facies. (b) The loss-on-ignition (LOI) data of the lake sediment are stable at a high level across both lakes and all cores while coinciding with a high variability in δ13CDOC values. Conversely, the δ13CDOC values of the taberite stay in a narrower range independent of the variability in LOI values. LOI is here used as an equivalent for SOM.
The LOI data (as equivalent for SOM content) are plotted against δ13CDOC in Fig. 6b, further supporting the observation of different value ranges in δ13CDOC between the lake sediment and the taberite from Fig. 6a. It stands out that the lake sediment is more variable in its δ13CDOC range with 3.63 ‰ (min. −30.74 ‰ to max. −27.11 ‰) with a range in LOI values of 15 wt % (min. 19.8 wt % to max. 34.8 wt %) in contrast to the underlying taberite where the range in LOI values is somewhat wider with 17.3 wt % (min. 1.2 wt % to max. 18.5 wt %), but the δ13CDOC values are closer to each other with a range of only 1.87 ‰ (min. −28.63 ‰ to max. −26.75 ‰). The two δ13CDOC outliers in the taberite are both based on a single sample that resulted in a considerably lower δ13CDOC value than all other samples from that unit (−30.74 ‰), the second outlier at −30.57 ‰ is the result of an interpolation with that data point.
3.4 Radiocarbon dating
All radiocarbon ages are listed in Table 2 and are displayed with rounded mean values in Figs. 1–4. One bulk sediment 14C sample stems from the base of an eroding shoreline (Fig. 1, ∼0.5 m above lake water level) and mainly contains plant detritus and peaty soil. The uncalibrated 14C age at this site is 8340±80 yr BP, demonstrating that early Holocene-aged permafrost OC is readily available at the land surface and is actively eroded along the shorelines of coastal Alaskan thermokarst lakes. Two more bulk sediment 14C samples were analyzed from the top surfaces of core E3 with 3400±70 yr BP (Fig. 2) and core U2 with 2785±70 yr BP (Fig. 3). These bulk 14C ages differ from one another by 615 years but are in the same order of magnitude. The age difference between lake surface sediment and eroding shoreline shows that despite the supply of older permafrost OC by erosion, large amounts of contemporary carbon turnover must still take place in these lakes and contribute substantially to the overall lake sedimentation.
Table 2Details of radiocarbon data from sediment cores E3 and U2 and one shoreline sample. The calibrated age ranges were calculated with IntCal20 (Reimer et al., 2020).
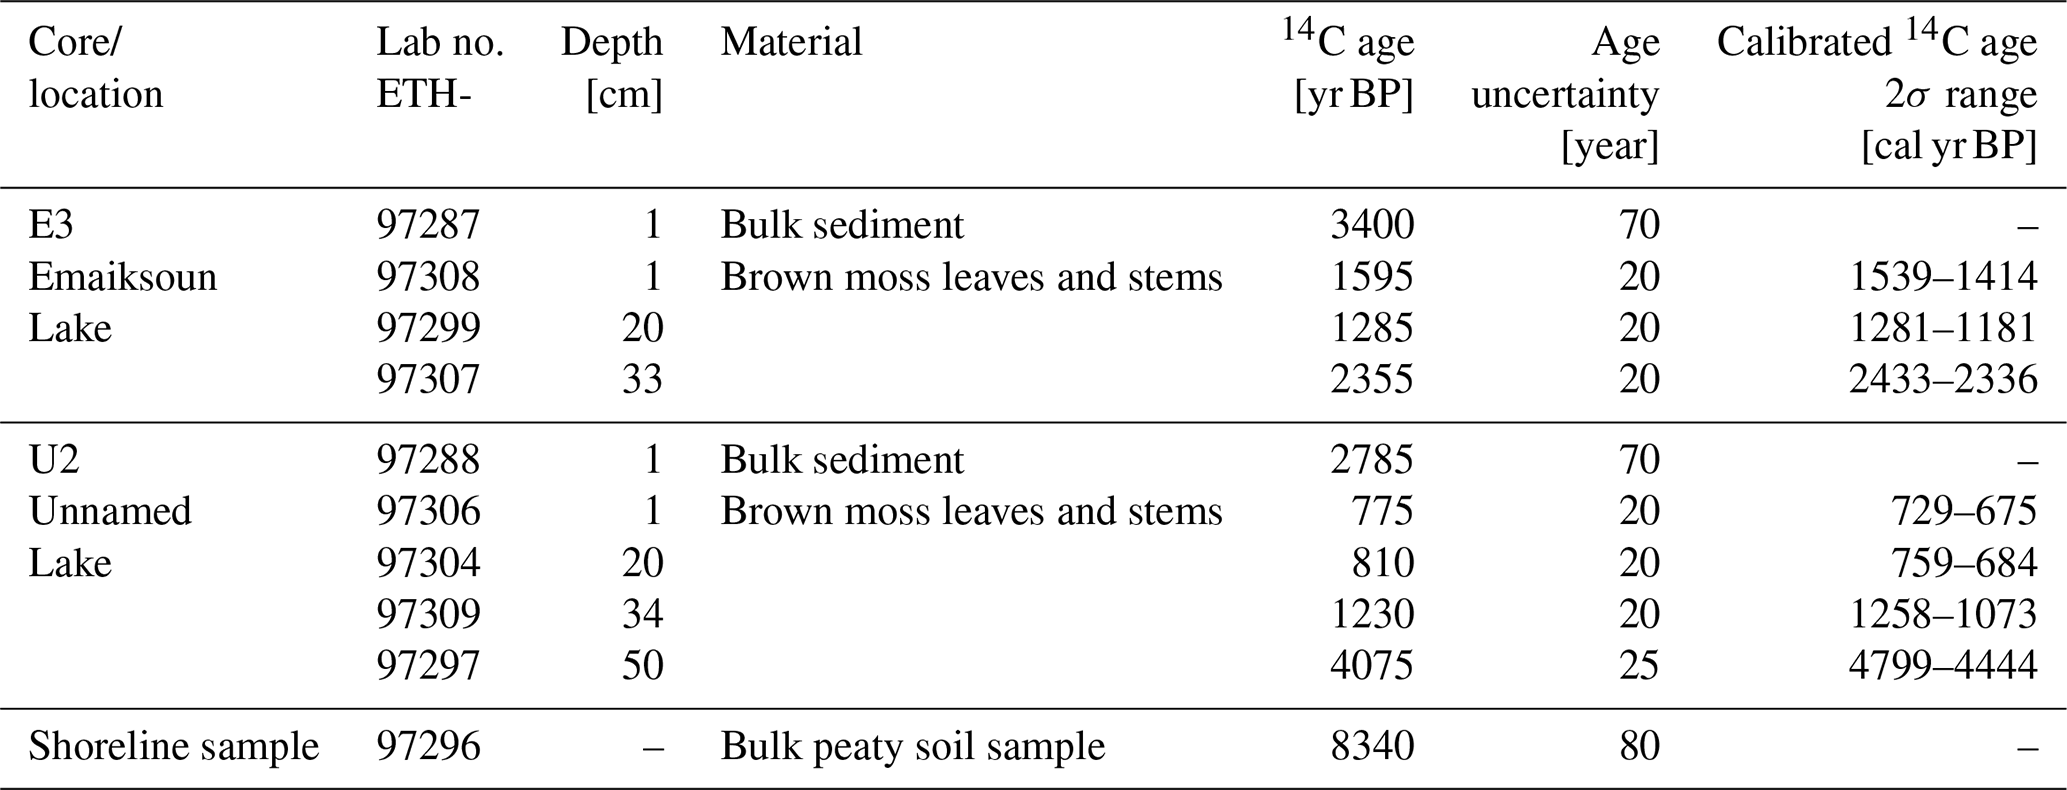
In order to create age profiles of the lake sedimentation and determine the lake ages, macrofossil samples were collected at the deepest and potentially oldest sections of the two lakes from the cores E3 and U2. The radiocarbon samples of E3 from Emaiksoun Lake were exclusively collected in the lake sediment and resulted in a mixed age profile (Table 2) with the succession of 1539–1414 cal yr BP (1 cm), 1281–1181 cal yr BP (20 cm), and 2433–2336 cal yr BP (33 cm).
The average age difference of 1923 years between the much older bulk sample (3400±70 yr BP) and the macrofossil sample (1539–1414 cal yr BP) at the top is noteworthy, although both were taken at the same core depth of 1 cm (Fig. 2).
In contrast to E3 the 14C age profile of U2 is chronological, the first three samples were also taken from the lake sediment, but here a fourth sample was analyzed from the taberite. The succession of the calibrated age ranges in core U2 is 729–675 cal yr BP (1 cm), 759–684 cal yr BP (20 cm), 1258–1073 cal yr BP (34 cm), and 4799–4444 cal yr BP (50 cm) (Figs. 3–4). The 14C ages from the lake sediment in core U2 are considerably younger than in nearby Emaiksoun Lake. The bulk radiocarbon age and the macrofossil sample from the top of core U2 differ by 2083 years resulting in a similar age difference as the equivalent sample pair in core E3.
The taberite facies were identified as marine deposits allocated to the Barrow Unit of the Gubik Formation in both lakes. They can therefore also be identified as part of the former permafrost ground which did not form through the means of lake sedimentation. With that distinction as a premise, we can address our main question of whether the relative degree of carbon degradation differs between the taberite and the lake sediment by comparison.
4.1 Lake formation and sedimentation
Radiocarbon dating of thermokarst lake sediment is challenging for a number of reasons. Firstly, the lakes are shallow and often do not exceed a water depth of 2 m, allowing for wind-induced wave action to affect the water column until the lake bed and thereby repeatedly suspend and redeposit the sediment, which results in mixing of the uppermost sediment layer. This wave-induced mixing particularly applies to lakes in the flat, wind-exposed Arctic Coastal Plain of Alaska (Lenz et al., 2016). Secondly, the variable input of OC from shoreline permafrost erosion (old) and tundra vegetation (young) creates an inconsistent and mixed 14C signal in the lake deposits. As a result of this continuous reworking, the lake sediment is not reliably layered or varved, which is a prerequisite for chronological radiocarbon profiles. The drastic age differences of 1923 years (E3) and 2083 years (U2) between the bulk sediment and macrofossil sample pairs from the tops of both cores (1 cm) are a good display of the sediment mixing and redeposition effects in thermokarst lakes as they show the dependency of 14C ages on the origin of their source material (bulk sediment vs. macrofossils).
Although the exact chronology of the 14C age profiles remains somewhat unclear due to mixing and reworking of the sediment (including macro-fossils), it is clear that the lakes are several hundred to a few thousand years old. The calendar ages from the bases of the lake sediment further suggest that Emaiksoun Lake (2433–2336 cal yr BP, 33 cm) is older than Unnamed Lake (1258–1073 cal yr BP, 34 cm) as these basal ages indicate the onset of lake formation. Due to the mixing of old and recent OC in thermokarst lakes, the true beginning of lake formation cannot be derived from these 14C ages though. Potentially the lakes could be appreciably younger or older than indicated, depending on the lateral inputs involved and changes therein through mixing processes. Even lake ages of only a few hundred years are not unusual in Arctic permafrost regions as these landscapes can undergo abrupt changes, for example, through sudden lake drainage and subsequent reflooding of nearby drained lake basins (Jones and Arp, 2015). The outlines of remnant shorelines of both lakes in Fig. 1 also show that they possibly had larger total lake surface areas in the past or refilled pre-existing drained lake basins.
In core U2 of Unnamed Lake, an additional sample was 14C-dated in the taberite of Unit B (50 cm depth). The measured age range of 4799–4444 cal yr BP (Figs. 3–4, Table 2) is considerably older than the age at the base of the lake sediment at 34 cm with 1258–1073 cal yr BP. Nevertheless, the taberite age range at 50 cm (Unit B) of 4799–4444 cal yr BP is much younger though than the Pleistocene-aged Barrow Unit of the Gubik Formation (Repenning, 1983). This can be seen as an indication for partial reworking of the Pleistocene deposits at least towards its top during the past 4799–4444 cal yr BP and mixing with material from aquatic production, eroded shoreline permafrost, or tundra vegetation.
4.2 Carbon degradation
The measured DOC concentrations of the taberite are higher than in the lake sediment (Fig. 4). The circumstance that the taberite is of marine origin and contains Ca (Figs. 2–3), hence also carbonates, likely leads to a higher pH in the taberite compared to the lake sediment. It is known that SOM extractability is highly dependent on pH and that a higher pH enhances the solution of dissolved organic matter (Curtin et al., 1998, 2016). Consequently, the high DOC concentrations in the taberite might be largely pH-driven. However, once DOC concentrations are normalized and expressed as DOCnorm in mass units of milligrams, it becomes apparent that the total amount of DOC in the lake sediment is actually higher than in the underlying facies of the taberite (Fig. 5a). Interestingly, when normalizing SOM, both facies appear to contain equal amounts of SOM (Fig. 5a). In other words, both the lake sediment and the taberite facies contain approximately the same amount of SOM at a given depth. However, in the lake sediment the DOC leaches into the sediment porewater more effectively than in the taberite (visible as higher DOC yields, Fig. 5a); this might be due to the presence of younger more reactive SOC in the lake sediment in comparison to the older taberite.
In Fig. 5a we also show that the formation of porewater DOC is directly linked to the availability of SOM and/or SOC in the surrounding sediment, as yields of DOC (as DOCnorm) increase with increases in SOMnorm content, although the total amount of DOC yield is significantly higher in the lake sediment. This is the case for the taberite and the lake sediment alike, showing that the process of DOC formation in the talik itself appears comparable throughout its individual facies (Fig. 5a). From these correlations we can also deduce that DOC formation in these thermokarst lake systems appears to mostly take place in situ in the talik through direct contact of porewater with adjacent SOC in the sediment and is less likely to be affected by vertical or lateral hydrological transport across or within the talik facies. Another feature common to both units is the trend of higher δ13CDOC values with higher DOC concentrations (Fig. 5b). This is expressed in a notable correlation across all talik facies (R2=0.60, P<0.001). The taberite generally has considerably higher DOC concentrations and higher δ13CDOC values compared to the lake sediment where DOC concentrations are lower and δ13CDOC values more negative (Fig. 5b).
The δ13CSOC values of the taberite facies and the lake sediment (Fig. 6a) differ considerably from one another, which also likely impacts the δ13CDOC signatures since SOC is the source material for in situ DOC formation. The differing δ13CSOC values in the two main talik facies could be an expression of the difference in the sediment source of the two facies. The taberite facies are composed of reworked Pleistocene deposits which contain both terrestrial and marine components. The lake sediment on the other hand consists mainly of eroded organic-rich terrestrial material from the surrounding tundra landscape. As Arctic plants are solely made up by 12C-enriched C3 plants, the terrestrial δ13C values in the lake sediment are more negative than the marine-influenced δ13C values in the taberite (Tieszen, 1973). In addition to a different source, the older sediment of the taberite might have undergone degradation over a longer period of time than the younger lake sediment, further altering its δ13CSOC signature towards higher values (Blair et al., 1985). In sum, the difference in δ13CSOC values between lake sediment and taberite alone cannot be used to assess the level of degradation in the individual facies as their stable carbon isotope signatures might be largely source-driven. The changes from δ13CSOC to δ13CDOC, however, are more appropriate to assess degradation states as this transition involves microbial and biogeochemical processes. This assumption is also based on the fact that certain DOC compounds can be highly bioavailable, as they are quickly consumed by microorganisms and transformed by biochemical degradation (Battin et al., 2008), thereby making changes from δ13CSOC to δ13CDOC a more sensitive indicator for the degree of OC degradation than δ13CSOC or δ13CDOC by itself.
Ågren et al. (1996) described how DOC degradation can lead to both an increase and decrease in δ13CDOC values in the remaining porewater DOC after degradation. Microbial degradation of OC usually coincides with an increase in δ13CDOC values as 12C is preferentially used during microbial respiration and thereby leaves the remaining OC enriched in the heavier 13C (Ågren et al., 1996; Blair et al., 1985). At the same time, biochemical degradation can lead to more negative δ13C values in the remaining carbon pool. Preferential removal of the most labile carbon compounds such as simple polysaccharides which are naturally enriched in 13C leads to an accumulation of less degradable compounds like lignin (Catalán et al., 2016), which are naturally more depleted in 13C (Ågren et al., 1996; Benner et al., 1987).
Another process to potentially have an impact on δ13CDOC signatures is the selective sorption of specific DOC compounds to mineral surfaces in the soil. Certain DOC compounds can be naturally enriched (carboxyl groups) or depleted (lignin, lipids) in 13C, and their preferential removal through sorption can change the δ13CDOC value of the remaining DOC pool depending on the compositional change (Kaiser et al., 2001). Based on the assumption that the sum of all these degradation processes leads to an overall more variable range in δ13CDOC values, the values of the lake sediment may be interpreted as an indicator for ongoing degradation. The DOC samples from the taberite appear to be less affected by (recent) degradation as their δ13CDOC values stay within a considerably narrower range as visualized in Fig. 6a. This could also be related to the older age of this facies, likely leading to a relatively larger proportion of recalcitrant compounds remaining upon long-term in situ degradation of OC. In contrast, the lake sediment is replenished with 13C-depleted fresh terrestrial OM as illustrated by an average core top δ13CSOC value of ‰ (1σ, n=7).
Which mechanisms cause the limited variability in δ13CDOC values in the taberite remains uncertain. Likely, sorption processes would be expected to have the strongest impact in the taberite due to its mineral-rich soil and relative abundance in clay particles which provide high mineral surface areas for DOC sorption. An increase in δ13CDOC values relative to δ13CSOC can be caused by the preferential sorption of isotopically lighter and hydrophobic compounds to mineral surfaces (Kaiser et al., 2001). But based on our data, the process of sorption does not appear to outweigh changes in δ13CDOC through microbial degradation as most of the points in Fig. 6a fall below the 1 : 1 line. Overall, the above arguments suggest that DOC in the lake sediment facies is subjected to active processing whereas DOC in the taberite appears to be more resistant to ongoing and recent degradation.
In Fig. 6b we additionally show that a higher SOM content (LOI) does not automatically result in a more variable δ13CDOC value range in the taberite. Hence, other factors than OC content alone must account for the low degradation rates in the taberite. The strong variability in δ13CDOC values in the lake sediment in contrast to the taberite is also well displayed.
De Jong et al. (2018) analyzed the microbial communities in the lake sediment (Unit C) of the same cores analyzed in this study. They confirmed the presence of a diverse and active microbial community with high specimen numbers including productive methanogens and methanotrophs, further emphasizing the observation of a highly active lake sediment facies. This microbial activity may also be methanogenic due to the generally high rates of methane release from Alaskan thermokarst lakes (Elder et al., 2018).
4.3 Implications
Based on these findings, we hypothesize that the formation of DOC in the studied thermokarst lake taliks occurs in the individual sedimentary facies without indications of noteworthy DOC exchange between the taberite and lake sediment. The main difference is that the lake sediment shows signs of stronger isotopic DOC alteration (“active” DOC) in comparison to the surrounding SOC source material, whereas the taberite contains DOC with less indication of isotopic alteration (“inactive” DOC) by comparison to its ambient SOC source material (Fig. 7). Nevertheless, the soil of the taberite still experiences more favorable conditions for microbial activity and degradation than the frozen permafrost soil of the surrounding tundra overall. Year-round above-zero conditions in the taberite as well as the lake sediment mean both carbon stocks are part of the active carbon cycle. This can ultimately lead to increased greenhouse gas emissions from thermokarst lake taliks from both vertical and horizontal talik expansion, especially as the permafrost landscape of the Arctic is currently warming faster than any other region on the planet (Biskaborn et al., 2019; Box et al., 2019). Changing climatic conditions in an increasingly warming Arctic (Kaufman et al., 2009) with retreating Arctic sea ice (Kinnard et al., 2011) can accelerate thermokarst lake talik formation and degradation in multiple ways. Firstly, increased winter snowfall (Liu et al., 2012) leads to earlier onset of the spring melt through insulation of the land surface and delays freezing of the lakes, impacting maximum winter ice thickness. Secondly, longer, warmer summers and shorter, less cold winters lead to lower maxima in lake ice thickness. This thinning of maximum winter ice on thermokarst lakes results in a regime shift from bedfast-ice lakes, which freeze down to the lake bed in winter, to floating-ice lakes, which maintain a partially unfrozen water column even in winter. These regime shifts lead to an overall rise in the number and extent of taliks under thermokarst lakes (Arp et al., 2012; Engram et al., 2018). Additionally, ongoing Arctic warming also exacerbates the levels of degradation in thermokarst lake taliks, even in its deeper facies, by creating increasingly favorable conditions through increasing water, soil, and sediment temperatures for microbial activity as tested by the temperature sensitivity experiments carried out by de Jong et al. (2018). They showed that a temperature rise from 4 to 10 ∘C resulted in significantly increased greenhouse gas production from thermokarst lake sediments. To what extent, or whether at all, the taberite facies would experience stronger degradation and ultimately emit more greenhouse gases is currently unknown and needs to be the subject of further temperature sensitivity studies of taberite facies under realistic in situ conditions.

Figure 7Conceptual model of DOC dynamics in coastal Alaskan floating-ice thermokarst lake taliks. The uppermost facies of organic-rich lake sediments is an active part of the carbon cycle and appears to undergo high levels of degradation (active DOC). The taberite facies of the former permafrost soil also build up high DOC concentrations but appear to be less affected by degradation (inactive DOC).
Here we used sedimentological and geochemical methods to distinguish and characterize talik layers (facies) of different origin below two coastal Alaskan thermokarst lakes. We identified two main units: a young organic-rich lake sediment of mostly terrestrial origin on top of an older mineral-rich thawed permafrost subsoil (taberite) of marine origin. We found the lake sediment has a SOC source pool with a narrow δ13C range and a concurrent δ13CDOC range that is considerably wider. In contrast, the taberite facies have a broad range in δ13CSOC values but a narrow δ13CDOC value range. We interpret these opposing trends as an indication for limited levels of DOC degradation in the taberite soils and therefore describe its DOC as inactive compared to the active DOC in the lake sediment (Fig. 7). In future studies this finding needs to be further verified by additional analysis, for example of C : N ratios, dark incubations, or humification measurements of the SOM to back up the conclusions based on the δ13CDOC data and to rule out that the observed trends in carbon isotopes are not solely driven by the sources of sediment but degradation processes. Whether these different degrees of degradation in taberite vs. lake sediment facies are also expressed as different levels of greenhouse gas emissions is not known. Nor do we know whether the level of degradation in taberite facies will increase with rising temperatures, along with a potential increase in greenhouse gas production and emissions. We do know that the current rate of lake ice regime shifts from bedfast- to floating-ice lakes will have thermal impacts on the underlying soil, and enhanced talik formation will take place in the Arctic during the next decades (Arp et al., 2012). As a result, levels of soil degradation in taliks will increase overall through rising numbers of taliks and overall larger talik volumes regardless of the different OC degradation levels in their individual facies.
The data presented in this study are available on DataverseNL at https://doi.org/10.34894/XK4LSU (Meisel, 2021).
OHM and HD carried out the fieldwork and sample collection. The XRF analysis and core splitting were carried out by OHM at NIOZ under the supervision of GJR. The samples for the radiocarbon dating were prepared by OHM and analyzed by LW. All other sample preparations, analysis, data collection, and processing were carried out by OHM. The interpretation was realized by OHM, JFD, JEV, and HD. The manuscript was written by OHM with contributions from all co-authors.
The authors declare that they have no conflict of interest.
Facilities for magnetic susceptibility, gamma-ray density, TGA, and grain size analysis were provided by the Vrije Universiteit Amsterdam; the latter two were supported by Unze van Buuren and Martine Hagen from the sediment laboratory. Thanks are due to UIC Science, especially Nagruk Harcharek in Utqiaġvik, Alaska, for the support during both field trips. The DOC and δ13CDOC analyses were carried out by Steven Bouillon and Cedric Morana from KU Leuven, Belgium. The δ13C analyses of the refiltered samples were measured by Richard van Logtestijn at the Department of Systems Ecology of the Vrije Universiteit Amsterdam. The δ13CSOC analyses were carried out by Suzan Verdegaal-Warmerdam from the Stable Isotope Laboratory of the Vrije Universiteit Amsterdam. Core splitting and XRF scanning of the cores were done at the NIOZ, Texel, Netherlands, with the help of Rineke Gieles and Piet van Gaever. We thank the editor Yakov Kuzyakov and the two anonymous referees for the improvement of this paper.
This work was carried out under the program of the Netherlands Earth System Science Centre (NESSC), which was funded by the Dutch Ministry of Education, Culture and Science (OCW) (grant no. 024.002.001).
This paper was edited by Yakov Kuzyakov and reviewed by two anonymous referees.
Ackroyd, T. N. W.: Laboratory testing in soil engineering, Soil Mechanics Ltd., Foulis, London, UK, 1957.
Ågren, G. I., Bosatta, E., and Balesdent, J.: Isotope Discrimination during Decomposition of Organic Matter: A Theoretical Analysis, Soil Sci. Soc. Am. J., 60, 1121–1126, https://doi.org/10.2136/sssaj1996.03615995006000040023x, 1996.
Arp, C. D., Jones, B. M., Lu, Z., and Whitman, M. S.: Shifting balance of thermokarst lake ice regimes across the Arctic Coastal Plain of northern Alaska, Geophys. Res. Lett., 39, 1–5, https://doi.org/10.1029/2012GL052518, 2012.
Battin, T. J., Kaplan, L. A., Findlay, S., Hopkinson, C. S., Marti, E., Packman, A. I., Newbold, J. D., and Sabater, F.: Biophysical controls on organic carbon fluxes in fluvial networks, Nat. Geosci., 1, 95–100, https://doi.org/10.1038/ngeo101, 2008.
Benner, R., Fogel, M. L., Sprague, E. K., and Hodson, R. E.: Depletion of C in lignin and its implications for stable carbon isotope studies, Nature, 329, 708–710, https://doi.org/10.1038/329708a0, 1987.
Biskaborn, B. K., Smith, S. L., Noetzli, J., Matthes, H., Vieira, G., Streletskiy, D. A., Schoeneich, P., Romanovsky, V. E., Lewkowicz, A. G., Abramov, A., Allard, M., Boike, J., Cable, W. L., Christiansen, H. H., Delaloye, R., Diekmann, B., Drozdov, D., Etzelmüller, B., Grosse, G., Guglielmin, M., Ingeman-Nielsen, T., Isaksen, K., Ishikawa, M., Johansson, M., Johannsson, H., Joo, A., Kaverin, D., Kholodov, A., Konstantinov, P., Kröger, T., Lambiel, C., Lanckman, J. P., Luo, D., Malkova, G., Meiklejohn, I., Moskalenko, N., Oliva, M., Phillips, M., Ramos, M., Sannel, A. B. K., Sergeev, D., Seybold, C., Skryabin, P., Vasiliev, A., Wu, Q., Yoshikawa, K., Zheleznyak, M., and Lantuit, H.: Permafrost is warming at a global scale, Nat. Commun., 10, 1–11, https://doi.org/10.1038/s41467-018-08240-4, 2019.
Black, R. F.: Gubik Formation Quaternary Age Northern Alaska, Exploration of Naval Petroleum Reserve No. 4 and Adjacent Areas, Northern Alaska, Part 2, Regional Studies, Geological Survey Professional Paper 302-C, 59–91, https://doi.org/10.3133/pp302C, 1964.
Black, R. F. and Barksdale, W. L.: Oriented Lakes of Northern Alaska, J. Geol., 57, 105–118, https://doi.org/10.1086/625590, 1949.
Blair, N., Leu, A., Muñoz, E., Olsen, J., Kwong, E., and Des Marais, D.: Carbon isotopic fractionation in heterotrophic microbial metabolism, Appl. Environ. Microbiol., 50, 996–1001, https://doi.org/10.1128/AEM.50.4.996-1001.1985, 1985.
Boike, J., Georgi, C., Kirilin, G., Muster, S., Abramova, K., Fedorova, I., Chetverova, A., Grigoriev, M., Bornemann, N., and Langer, M.: Thermal processes of thermokarst lakes in the continuous permafrost zone of northern Siberia – observations and modeling (Lena River Delta, Siberia), Biogeosciences, 12, 5941–5965, https://doi.org/10.5194/bg-12-5941-2015, 2015.
Box, J. E., Colgan, W. T., Christensen, T. R., Schmidt, N. M., Lund, M., Parmentier, F. J. W., Brown, R., Bhatt, U. S., Euskirchen, E. S., Romanovsky, V. E., Walsh, J. E., Overland, J. E., Wang, M., Corell, R. W., Meier, W. N., Wouters, B., Mernild, S., Mård, J., Pawlak, J., and Olsen, M. S.: Key indicators of Arctic climate change: 1971–2017, Environ. Res. Lett., 14, https://doi.org/10.1088/1748-9326/aafc1b, 2019.
Brigham-Grette, J. and Carter, L. D.: Pliocene marine transgressions of northern Alaska: circumarctic correlations and paleoclimatic interpretations, Arctic, 45, 74–89, https://doi.org/10.14430/arctic1375, 1992.
Catalán, N., Marcé, R., Kothawala, D. N., and Tranvik, L. J.: Organic carbon decomposition rates controlled by water retention time across inland waters, Nat. Geosci., 9, 501–504, https://doi.org/10.1038/ngeo2720, 2016.
Christensen, B. and Malmros, P.: Loss-on-ignition and carbon content in a beech forest soil profile, Ecography (Cop.)., 5, 376–380, https://doi.org/10.1111/j.1600-0587.1982.tb01051.x, 1982.
Coplen, T. B.: New guidelines for reporting stable hydrogen, carbon, and oxygen isotope-ratio data, Geochim. Cosmochim. Ac., 60, 3359–3360, https://doi.org/10.1016/0016-7037(96)00263-3, 1996.
Curtin, D., Campbell, C. A., and Jalil, A.: Effects of acidity on mineralization: pH-dependence of organic matter mineralization in weakly acidic soils, Soil Biol. Biochem., 30, 57–64, https://doi.org/10.1016/S0038-0717(97)00094-1, 1998.
Curtin, D., Peterson, M. E., and Anderson, C. R.: pH-dependence of organic matter solubility: Base type effects on dissolved organic C, N, P, and S in soils with contrasting mineralogy, Geoderma, 271, 161–172, https://doi.org/10.1016/j.geoderma.2016.02.009, 2016.
Dean, J. F., Middelburg, J. J., Röckmann, T., Aerts, R., Blauw, L. G., Egger, M., Jetten, M. S. M., de Jong, A. E. E., Meisel, O. H., Rasigraf, O., Slomp, C. P., in't Zandt, M. H., and Dolman, A. J.: Methane Feedbacks to the Global Climate System in a Warmer World, Rev. Geophys., 56, 207–250, https://doi.org/10.1002/2017RG000559, 2018.
Dean, J. F., Meisel, O. H., Martyn Rosco, M., Marchesini, L. B., Garnett, M. H., Lenderink, H., van Logtestijn, R., Borges, A. V, Bouillon, S., Lambert, T., Röckmann, T., Maximov, T., Petrov, R., Karsanaev, S., Aerts, R., van Huissteden, J., Vonk, J. E., and Dolman, A. J.: East Siberian Arctic inland waters emit mostly contemporary carbon, Nat. Commun., 11, 1627, https://doi.org/10.1038/s41467-020-15511-6, 2020.
de Jong, A. E. E., in't Zandt, M. H., Meisel, O. H., Jetten, M. S. M., Dean, J. F., Rasigraf, O., and Welte, C. U.: Increases in temperature and nutrient availability positively affect methane-cycling microorganisms in Arctic thermokarst lake sediments, Environ. Microbiol., 20, 4314–4327, https://doi.org/10.1111/1462-2920.14345, 2018.
Elder, C. D., Xu, X., Walker, J., Schnell, J. L., Hinkel, K. M., Townsend-Small, A., Arp, C. D., Pohlman, J. W., Gaglioti, B. V., and Czimczik, C. I.: Greenhouse gas emissions from diverse Arctic Alaskan lakes are dominated by young carbon, Nat. Clim. Chang., 8, 166–171, https://doi.org/10.1038/s41558-017-0066-9, 2018.
Engram, M., Arp, C. D., Jones, B. M., Ajadi, O. A., and Meyer, F. J.: Analyzing floating and bedfast lake ice regimes across Arctic Alaska using 25 years of space-borne SAR imagery, Remote Sens. Environ., 209, 660–676, https://doi.org/10.1016/j.rse.2018.02.022, 2018.
Farquharson, L., Walter Anthony, K. W., Bigelow, N., Edwards, M., and Grosse, G.: Facies analysis of yedoma thermokarst lakes on the northern Seward Peninsula, Alaska, Sediment. Geol., 340, 25–37, https://doi.org/10.1016/j.sedgeo.2016.01.002, 2016.
Grosse, G., Schirrmeister, L., Siegert, C., Kunitsky, V. V., Slagoda, E. A., Andreev, A. A., and Dereviagyn, A. Y.: Geological and geomorphological evolution of a sedimentary periglacial landscape in Northeast Siberia during the Late Quaternary, Geomorphology, 86, 25–51, https://doi.org/10.1016/j.geomorph.2006.08.005, 2007.
Hennekam, R., Sweere, T., Tjallingii, R., de Lange, G. J., and Reichart, G. J.: Trace metal analysis of sediment cores using a novel X-ray fluorescence core scanning method, Quaternary Int., 514, 55–67, https://doi.org/10.1016/j.quaint.2018.10.018, 2019.
Heslop, J. K., Walter Anthony, K. M., Sepulveda-Jauregui, A., Martinez-Cruz, K., Bondurant, A., Grosse, G., and Jones, M. C.: Thermokarst lake methanogenesis along a complete talik profile, Biogeosciences, 12, 4317–4331, https://doi.org/10.5194/bg-12-4317-2015, 2015.
Hinkel, K. M., Eisner, W. R., Bockheim, J. G., Nelson, F. E., Peterson, K. M., and Dai, X.: Spatial Extent, Age, and Carbon Stocks in Drained Thaw Lake Basins on the Barrow Peninsula, Alaska, Arctic, Antarct. Alp. Res., 35, 291–300, https://doi.org/10.1657/1523-0430(2003)035[0291:SEAACS]2.0.CO;2, 2003.
Hinkel, K. M., Sheng, Y., Lenters, J. D., Lyons, E. A., Beck, R. A., Eisner, W. R., and Wang, J.: Thermokarst Lakes on the Arctic Coastal Plain of Alaska: Geomorphic Controls on Bathymetry, Permafrost Periglac., 23, 218–230, https://doi.org/10.1002/ppp.1744, 2012.
Hugelius, G., Strauss, J., Zubrzycki, S., Harden, J. W., Schuur, E. A. G., Ping, C.-L., Schirrmeister, L., Grosse, G., Michaelson, G. J., Koven, C. D., O'Donnell, J. A., Elberling, B., Mishra, U., Camill, P., Yu, Z., Palmtag, J., and Kuhry, P.: Estimated stocks of circumpolar permafrost carbon with quantified uncertainty ranges and identified data gaps, Biogeosciences, 11, 6573–6593, https://doi.org/10.5194/bg-11-6573-2014, 2014.
Jones, B. M. and Arp, C. D.: Observing a Catastrophic Thermokarst Lake Drainage in Northern Alaska, Permafrost Periglac., 26, 119–128, https://doi.org/10.1002/ppp.1842, 2015.
Kaiser, K., Guggenberger, G., and Zech, W.: Isotopic fractionation of dissolved organic carbon in shallow forest soils as affected by sorption, Eur. J. Soil Sci., 52, 585–597, https://doi.org/10.1046/j.1365-2389.2001.00407.x, 2001.
Kanevskiy, M., Shur, Y., Jorgenson, M. T., Ping, C. L., Michaelson, G. J., Fortier, D., Stephani, E., Dillon, M., and Tumskoy, V.: Ground ice in the upper permafrost of the Beaufort Sea coast of Alaska, Cold Reg. Sci. Technol., 85, 56–70, https://doi.org/10.1016/j.coldregions.2012.08.002, 2013.
Kaufman, D. S., Schneider, D. P., McKay, N. P., Ammann, C. M., Bradley, R. S., Briffa, K. R., Miller, G. H., Otto-Bliesner, B. L., Overpeck, J. T., Vinther, B. M., Abbott, M., Axford, Y., Bird, B., Birks, H. J. B., Bjune, A. E., Briner, J., Cook, T., Chipman, M., Francus, P., Gajewski, K., Geirsddttir, Á., Hu, F. S., Kutchko, B., Lamoureux, S., Loso, M., MacDonald, G., Peros, M., Porinchu, D., Schiff, C., Seppä, H., and Thomas, E.: Recent warming reverses long-term arctic cooling, Science, 325, 1236–1239, https://doi.org/10.1126/science.1173983, 2009.
Kindler, R., Siemens, J., Kaiser, K., Walmsley, D. C., Bernhofer, C., Buchmann, N., Cellier, P., Eugster, W., Gleixner, G., Grunwald, T., Heim, A., Ibrom, A., Jones, S. K., Jones, M., Klumpp, K., Kutsch, W., Larsen, K. S., Lehuger, S., Loubet, B., Mckenzie, R., Moors, E., Osborne, B., Pilegaard, K., Rebmann, C., Saunders, M., Schmidt, M. W. I., Schrumpf, M., Seyfferth, J., Skiba, U., Soussana, J. F., Sutton, M. A., Tefs, C., Vowinckel, B., Zeeman, M. J., and Kaupenjohann, M.: Dissolved carbon leaching from soil is a crucial component of the net ecosystem carbon balance, Glob. Change Biol., 17, 1167–1185, https://doi.org/10.1111/j.1365-2486.2010.02282.x, 2011.
Kinnard, C., Zdanowicz, C. M., Fisher, D. A., Isaksson, E., De Vernal, A., and Thompson, L. G.: Reconstructed changes in Arctic sea ice over the past 1,450 years, Nature, 479, 509–512, https://doi.org/10.1038/nature10581, 2011.
Lehner, B. and Döll, P.: Development and validation of a global database of lakes, reservoirs and wetlands, J. Hydrol., 296, 1–22, https://doi.org/10.1016/j.jhydrol.2004.03.028, 2004.
Lenz, J., Jones, B. M., Wetterich, S., Tjallingii, R., Fritz, M., Arp, C. D., Rudaya, N., and Grosse, G.: Impacts of shore expansion and catchment characteristics on lacustrine thermokarst records in permafrost lowlands, Alaska Arctic Coastal Plain, Arktos, 2, 1–15, https://doi.org/10.1007/s41063-016-0025-0, 2016.
Ling, F. and Zhang, T.: Numerical simulation of permafrost thermal regime and talik development under shallow thaw lakes on the Alaskan Arctic Coastal Plain, J. Geophys. Res.-Atmos., 108, https://doi.org/10.1029/2002jd003014, 2003.
Liu, J., Curry, J. A., Wang, H., Song, M., and Horton, R. M.: Impact of declining Arctic sea ice on winter snowfall, P. Natl. Acad. Sci., 109, 4074–4079, https://doi.org/10.1073/pnas.1114910109, 2012.
Livingstone, D. A.: On the orientation of lake basins [Alaska], Am. J. Sci., 252, 547–554, https://doi.org/10.2475/ajs.252.9.547, 1954.
McCullough, I. M., Dugan, H. A., Farrell, K. J., Morales-Williams, A. M., Ouyang, Z., Roberts, D., Scordo, F., Bartlett, S. L., Burke, S. M., Doubek, J. P., Krivak-Tetley, F. E., Skaff, N. K., Summers, J. C., Weathers, K. C., and Hanson, P. C.: Dynamic modeling of organic carbon fates in lake ecosystems, Ecol. Modell., 386, 71–82, https://doi.org/10.1016/j.ecolmodel.2018.08.009, 2018.
Meisel, O.: Porewater δ13CDOC Indicates Variable Extent Of Degradation In Different Talik Layers Of Coastal Alaskan Thermokarst Lakes, https://doi.org/10.34894/XK4LSU, DataverseNL, V1, 2021.
Morana, C., Darchambeau, F., Roland, F. A. E., Borges, A. V., Muvundja, F., Kelemen, Z., Masilya, P., Descy, J.-P., and Bouillon, S.: Biogeochemistry of a large and deep tropical lake (Lake Kivu, East Africa: insights from a stable isotope study covering an annual cycle, Biogeosciences, 12, 4953–4963, https://doi.org/10.5194/bg-12-4953-2015, 2015.
Nelson, C. E. and Wear, E. K.: Microbial diversity and the lability of dissolved organic carbon, P. Natl. Acad. Sci. USA, 111, 7166–7167, https://doi.org/10.1073/pnas.1405751111, 2014.
Peter, S., Isidorova, A., and Sobek, S.: Enhanced carbon loss from anoxic lake sediment through diffusion of dissolved organic carbon, J. Geophys. Res.-Biogeo., 121, 1959–1977, https://doi.org/10.1002/2016JG003425, 2016.
Qi, H., Coplen, T. B., Geilmann, H., Brand, W. A., and Böhlke, J. K.: Two new organic reference materials for δ13C and δ15N measurements and a new value for the δ13C of NBS 22 oil, Rapid Commun. Mass Sp., 17, 2483–2487, https://doi.org/10.1002/rcm.1219, 2003.
Reimer, P. J., Austin, W. E. N., Bard, E., Bayliss, A., Blackwell, P. G., Bronk Ramsey, C., Butzin, M., Cheng, H., Edwards, R. L., Friedrich, M., Grootes, P. M., Guilderson, T. P., Hajdas, I., Heaton, T. J., Hogg, A. G., Hughen, K. A., Kromer, B., Manning, S. W., Muscheler, R., Palmer, J. G., Pearson, C., Van Der Plicht, J., Reimer, R. W., Richards, D. A., Scott, E. M., Southon, J. R., Turney, C. S. M., Wacker, L., Adolphi, F., Büntgen, U., Capano, M., Fahrni, S. M., Fogtmann-Schulz, A., Friedrich, R., Köhler, P., Kudsk, S., Miyake, F., Olsen, J., Reinig, F., Sakamoto, M., Sookdeo, A., and Talamo, S.: The IntCal20 Northern Hemisphere Radiocarbon Age Calibration Curve (0–55 cal kBP), Radiocarbon, 62, 725–757, https://doi.org/10.1017/RDC.2020.41, 2020.
Repenning, C. A.: New evidence for the age of the Gubik Formation Alaskan North Slope, Quaternary Res., 19, 356–372, https://doi.org/10.1016/0033-5894(83)90041-8, 1983.
Roiha, T., Peura, S., Cusson, M., and Rautio, M.: Allochthonous carbon is a major regulator to bacterial growth and community composition in subarctic freshwaters, Sci. Rep.-UK, 6, 1–12, https://doi.org/10.1038/srep34456, 2016.
Schwamborn, G., Andreev, A., Rachold, V., Hubberten, H.-W., Grigoriev, M., Tumskoy, V., Pavlova, E. Y., and Dorozkhina, M. V: Evolution of Lake Nikolay, Arga Island, western Lena River delta, during late Pleistocene and Holocene time, Polarforschung, 70, 69–82, https://doi.org/10.2312/polarforschung.70.69, 2002.
Sellmann, P. V., Brown, J., Lewellen, R. I., McKim, H., and Merry, C.: The Classification and Geomorphic Implications of Thaw Lakes on the Arctic Coastal Plain, Alaska, US Army Cold Regions Research and Engineering Laboratory, Hanover, New Hampshire, Research Report 344, 21 pp., 1975.
Silveira, M. L. A.: Dissolved organic carbon and bioavailability of N and P as indicators of soil quality, Sci. Agric., 62, 502–508, https://doi.org/10.1590/s0103-90162005000500017, 2005.
Spencer, R. G. M., Mann, P. J., Dittmar, T., Eglinton, T. I., McIntyre, C., Holmes, R. M., Zimov, N., and Stubbins, A.: Detecting the signature of permafrost thaw in Arctic rivers, Geophys. Res. Lett., 42, 2830–2835, https://doi.org/10.1002/2015GL063498, 2015.
Tieszen, L. L.: Photosynthesis and Respiration in Arctic Tundra Grasses: Field Light Intensity and Temperature Responses, Arct. Alp. Res., 5, 239–251, https://doi.org/10.1080/00040851.1973.12003703, 1973.
van Buuren, U., Prins, M. A., Wang, X., Stange, M., Yang, X., and van Balen, R. T.: Fluvial or aeolian? Unravelling the origin of the silty clayey sediment cover of terraces in the Hanzhong Basin (Qinling Mountains, central China), Geomorphology, 367, 107294, https://doi.org/10.1016/j.geomorph.2020.107294, 2020.
van Huissteden, J., Berrittella, C., Parmentier, F. J. W., Mi, Y., Maximov, T. C., and Dolman, A. J.: Methane emissions from permafrost thaw lakes limited by lake drainage, Nat. Clim. Change, 1, 119–123, https://doi.org/10.1038/nclimate1101, 2011.
Vonk, J. E., Mann, P. J., Davydov, S., Davydova, A., Spencer, R. G. M., Schade, J., Sobczak, W. V., Zimov, N., Zimov, S., Bulygina, E., Eglinton, T. I., and Holmes, R. M.: High biolability of ancient permafrost carbon upon thaw, Geophys. Res. Lett., 40, 2689–2693, https://doi.org/10.1002/grl.50348, 2013.
Wacker, L., Bonani, G., Friedrich, M., Hajdas, I., Kromer, B., Němec, M., Ruff, M., Suter, M., Synal, H. A., and Vockenhuber, C.: Micadas: Routine and high-precision radiocarbon dating, Radiocarbon, 52, 252–262, https://doi.org/10.1017/S0033822200045288, 2010.
Wacker, L., Fahrni, S. M., Hajdas, I., Molnar, M., Synal, H. A., Szidat, S., and Zhang, Y. L.: A versatile gas interface for routine radiocarbon analysis with a gas ion source, Nucl. Instrum. Meth. B, 294, 315–319, https://doi.org/10.1016/j.nimb.2012.02.009, 2013.
Walter, K. M., Zimov, S. A., Chanton, J. P., Verbyla, D., and Chapin, F. S.: Methane bubbling from Siberian thaw lakes as a positive feedback to climate warming, Nature, 443, 71–75, https://doi.org/10.1038/nature05040, 2006.
Walter, K. M., Edwards, M. E., Grosse, G., Zimov, S. A., and Chapin, F. S.: Thermokarst lakes as a source of atmospheric CH4 during the last deglaciation, Science, 318, 633–636, https://doi.org/10.1126/science.1142924, 2007.
Walter Anthony, K. M. W., Zimov, S. A., Grosse, G., Jones, M. C., Anthony, P. M., Iii, F. S. C., Finlay, J. C., Mack, M. C., Davydov, S., Frenzel, P., and Frolking, S.: A shift of thermokarst lakes from carbon sources to sinks during the Holocene epoch, Nature, 511, 452–456, https://doi.org/10.1038/nature13560, 2014.
Walvoord, M. A., Voss, C. I., Ebel, B. A., and Minsley, B. J.: Development of perennial thaw zones in boreal hillslopes enhances potential mobilization of permafrost carbon, Environ. Res. Lett., 14, 1, https://doi.org/10.1088/1748-9326/aaf0cc, 2019.
West, J. J. and Plug, L. J.: Time-dependent morphology of thaw lakes and taliks in deep and shallow ground ice, J. Geophys. Res.-Earth, 113, 1–14, https://doi.org/10.1029/2006JF000696, 2008.
Witak, M., Wachnicka, A., Kuijpers, A., Troelstra, S., Prins, M. A., and Witkowski, A.: Holocene North Atlantic surface circulation and climatic variability: Evidence from diatom records, Holocene, 15, 85–96, https://doi.org/10.1191/0959683605hl768rp, 2005.