the Creative Commons Attribution 4.0 License.
the Creative Commons Attribution 4.0 License.
 | 08 Apr 2021
Divergent climate feedbacks on winter wheat growing and dormancy periods as affected by sowing date in the North China Plain
Fengshan Liu
Ying Chen
Nini Bai
Dengpan Xiao
Huizi Bai
Fulu Tao
Quansheng Ge
Crop phenology exerts measurable impacts on soil surface properties, biophysical processes and climate feedbacks, particularly at local or regional scales. Nevertheless, the response of surface biophysical processes to climate feedbacks as affected by sowing date in winter wheat croplands has been overlooked, especially during winter dormancy. The dynamics of leaf area index (LAI), surface energy balance and canopy temperature (Tc) were simulated by a modified SiBcrop (Simple Biosphere) model under two sowing date scenarios (early sowing, EP; late sowing, LP) at 10 stations in the North China Plain. The results showed that the SiBcrop model with a modified crop phenology scheme well simulated the seasonal dynamic of LAI, Tc, phenology and surface heat fluxes. An earlier sowing date had a higher LAI with earlier development than a later sowing date. But the response of Tc to the sowing date exhibited opposite patterns during the dormancy and active-growth periods: EP led to higher Tc (0.05 K) than LP in the dormancy period and lower Tc (−0.2 K) in the growth period. The highest difference (0.6 K) between EP and LP happened at the time when wheat was sown in EP but was not in LP. The higher LAI captured more net radiation with a warming effect but partitioned more energy into latent heat flux with cooling. The climate feedback of the sowing date, which was more obvious in winter in the northern areas and in the growing period in the southern areas, was determined by the relative contributions of the albedo radiative process and partitioning non-radiative process. The study highlights the surface biophysical process of land management in modulating climate.
- Article
(1943 KB) - Full-text XML
-
Supplement
(344 KB) - BibTeX
- EndNote


Land–atmosphere interactions are key components of the climate system. The land cover and management changes have strong feedbacks with climate through surface biophysical and biochemical processes (Mahmood et al., 2014). Cropland surface characteristics have been and will continue to be changed through crop management, such as the cropping system (Jeong et al., 2014; Cui et al., 2018), sowing date and phenology shifts (Sacks and Kucharik, 2011; Richardson et al., 2013), and cultivar selection (Seneviratne et al., 2018), to keep a high yield under climate change conditions. The changed cropland properties further generate feedback to regional climate through surface energy partitioning and albedo (α) mechanisms (Cooley et al., 2005; Zhang et al., 2015). It is important to quantify the climate feedback of crop phenology for regional climate prediction and sustainable agriculture development.
There is evidence that crop phenology has been shifted substantially in the major cultivation areas worldwide (Sacks and Kucharik, 2011; Tao et al., 2012, 2014; Z. Liu et al., 2017). In the North China Plain (NCP), the dates of sowing, dormancy, re-greening, anthesis and maturity in the wheat system were changed by 1.5, 1.5, −1.1, −2.7 and −1.4 d per decade (a positive value indicates delay, and a negative value indicates advance), respectively (Xiao et al., 2013). The vegetative stages (including periods from dormancy to re-greening and re-greening to anthesis) were shortened, and the reproductive stage was prolonged (Xiao et al., 2013). Global-warming-induced higher temperatures resulted in a longer photosynthetic-active period but a faster development rate and shorter growth stages. Crop management, including sowing date adjustment and varietal change, reduced the length of the vegetative stage but increased the length of the reproductive stage (Liu et al., 2010, 2018). The management-induced phenology dynamics are intended to increase yield. The strategies for adapting to a warmer environment include adopting cultivars with higher accumulated growing degree days (GDDs) and later planting. The prolonged grain-filling period of winter wheat benefits the accumulation of carbohydrates in grain (Reynolds et al., 2012; Liu et al., 2018), and the adjusted sowing date reduces the risks such as insect and viral infection, adverse meteorological conditions, and soil water depletion (Sacks et al., 2010). Model simulation indicated that a yield increase of winter wheat benefitted from cultivar renewal by 12.2 %–22.6 % and fertilization management by 2.1 %–3.6 %; climate change damaged yields by −15.0 % for the rain-fed type, in the NCP (Xiao and Tao, 2014).
The crop phenology affects the seasonal rhythm of surface greenness and energy and water exchanges in the boundary layer. For example, the maize growth duration prolonged and reached maturity and senesced a couple of weeks later, and the maximum change can reach 47 and −20 W m−2 for latent heat flux (LH) and sensible heat flux (SH), respectively, when the NDVI (normalized difference vegetation index) is increased by 0.1 in the Agro-IBIS model (agricultural version of the Integrated BIosphere Simulator; Bagley et al., 2015). An earlier planting date and longer grain-filling period increased the LH by 3 W m−2, decreased SH by 2.5 W m−2 in June and enhanced the net radiation (Rn) by 1.2 W m−2 in October by reducing the interval time from maturity to harvest in American Corn Belt (Sacks and Kucharik, 2011). The change of surface coverage also showed regional climate feedback. The increased spring surface greenness of farmland, due to the advanced re-greening stage of winter wheat (Xiao et al., 2013; Z. Liu et al., 2017), significantly impacted the patterns of LH and SH and then the changes of moderate to light rainfall (Zhang et al., 2015). Harvest shifted the key influence factors of the radiative balance and evaporative fraction from leaf area and soil–atmosphere temperature difference to soil moisture in US winter wheat (Bagley et al., 2017) and shifted radiative forcing with the potential to warm the atmosphere by 1–1.4 ∘C through declining LH in the NCP (Cho et al., 2014). The influence of phenology on climate feedback through surface biophysical process at the local or regional scale is worthy of further studies (F. Liu et al., 2017).
Despite previous studies showing the critical role of crop phenology in surface energy and water balance, there is an important potential sensitive period that has been ignored in the winter wheat system. During the dormancy period in winter, the aboveground canopy of winter wheat remained constant for more than 2 months (Xiao et al., 2013). In view of the close relationships between surface biophysical processes and the aboveground canopy (Boisier et al., 2012; Chen et al., 2015; F. Liu et al., 2017), the length from the sowing date to start of dormancy would be the determinant factor at surface biophysical processes in winter where winter wheat is widely distributed, such as the NCP, Pacific Northwest (Wuest, 2010) and southern Great Plains of the USA (Bagley et al., 2017), Australia, and numerous countries surrounding the Mediterranean Sea (Mahdi et al., 1998; Schillinger, 2011). Compared with other phenology dynamics, such as an earlier re-greening stage (Xiao et al., 2013; Zhang et al., 2013), longer reproductive period (Sacks and Kucharik, 2011) and inter-cropping period (Cho et al., 2014; Bagley et al., 2017), the climate feedback of the sowing date emerges gradually with crop development. Particularly, winter wheat grows faster in early stages and slower as winter approaches; a smaller change in the sowing date could lead to larger and longer climate feedback in the dormancy period. Recognition of the impacts of the sowing date on land surface characteristics and climate feedback would be beneficial to the understanding of human influence on climate change. Therefore, it is necessary to investigate whether the dormancy period of winter wheat is sensitive to the sowing date and how sensitivities are surface biophysical process and climate effect.
2.1 Study stations
The NCP, with an area of 4×10⁵ km2, is the largest winter wheat production region in China, including the provinces of Hebei, Henan, Shandong, Jiangsu and Anhui and municipalities of Beijing and Tianjin (Fig. 1). The rotation of summer maize and winter wheat is the main cropping system, except in Anhui and Jiangsu, where a rotation system of winter wheat and rice is dominant. The satellite data showed a high cropland density above 70 % with flat and relatively homogeneous agricultural practices (Liu et al., 2005; Ho et al., 2012). The soil type is classified as sandy loam according to the seven soil textures typified in the model (Sellers et al., 1996). Two stations with surface fluxes were used for model calibration (Fig. 1, blue triangles); 10 randomly distributed stations with complete meteorology and phenology information were selected for simulation in this study (Fig. 1, green dots). The details of fluxes, meteorology and phenology were further exhibited below.
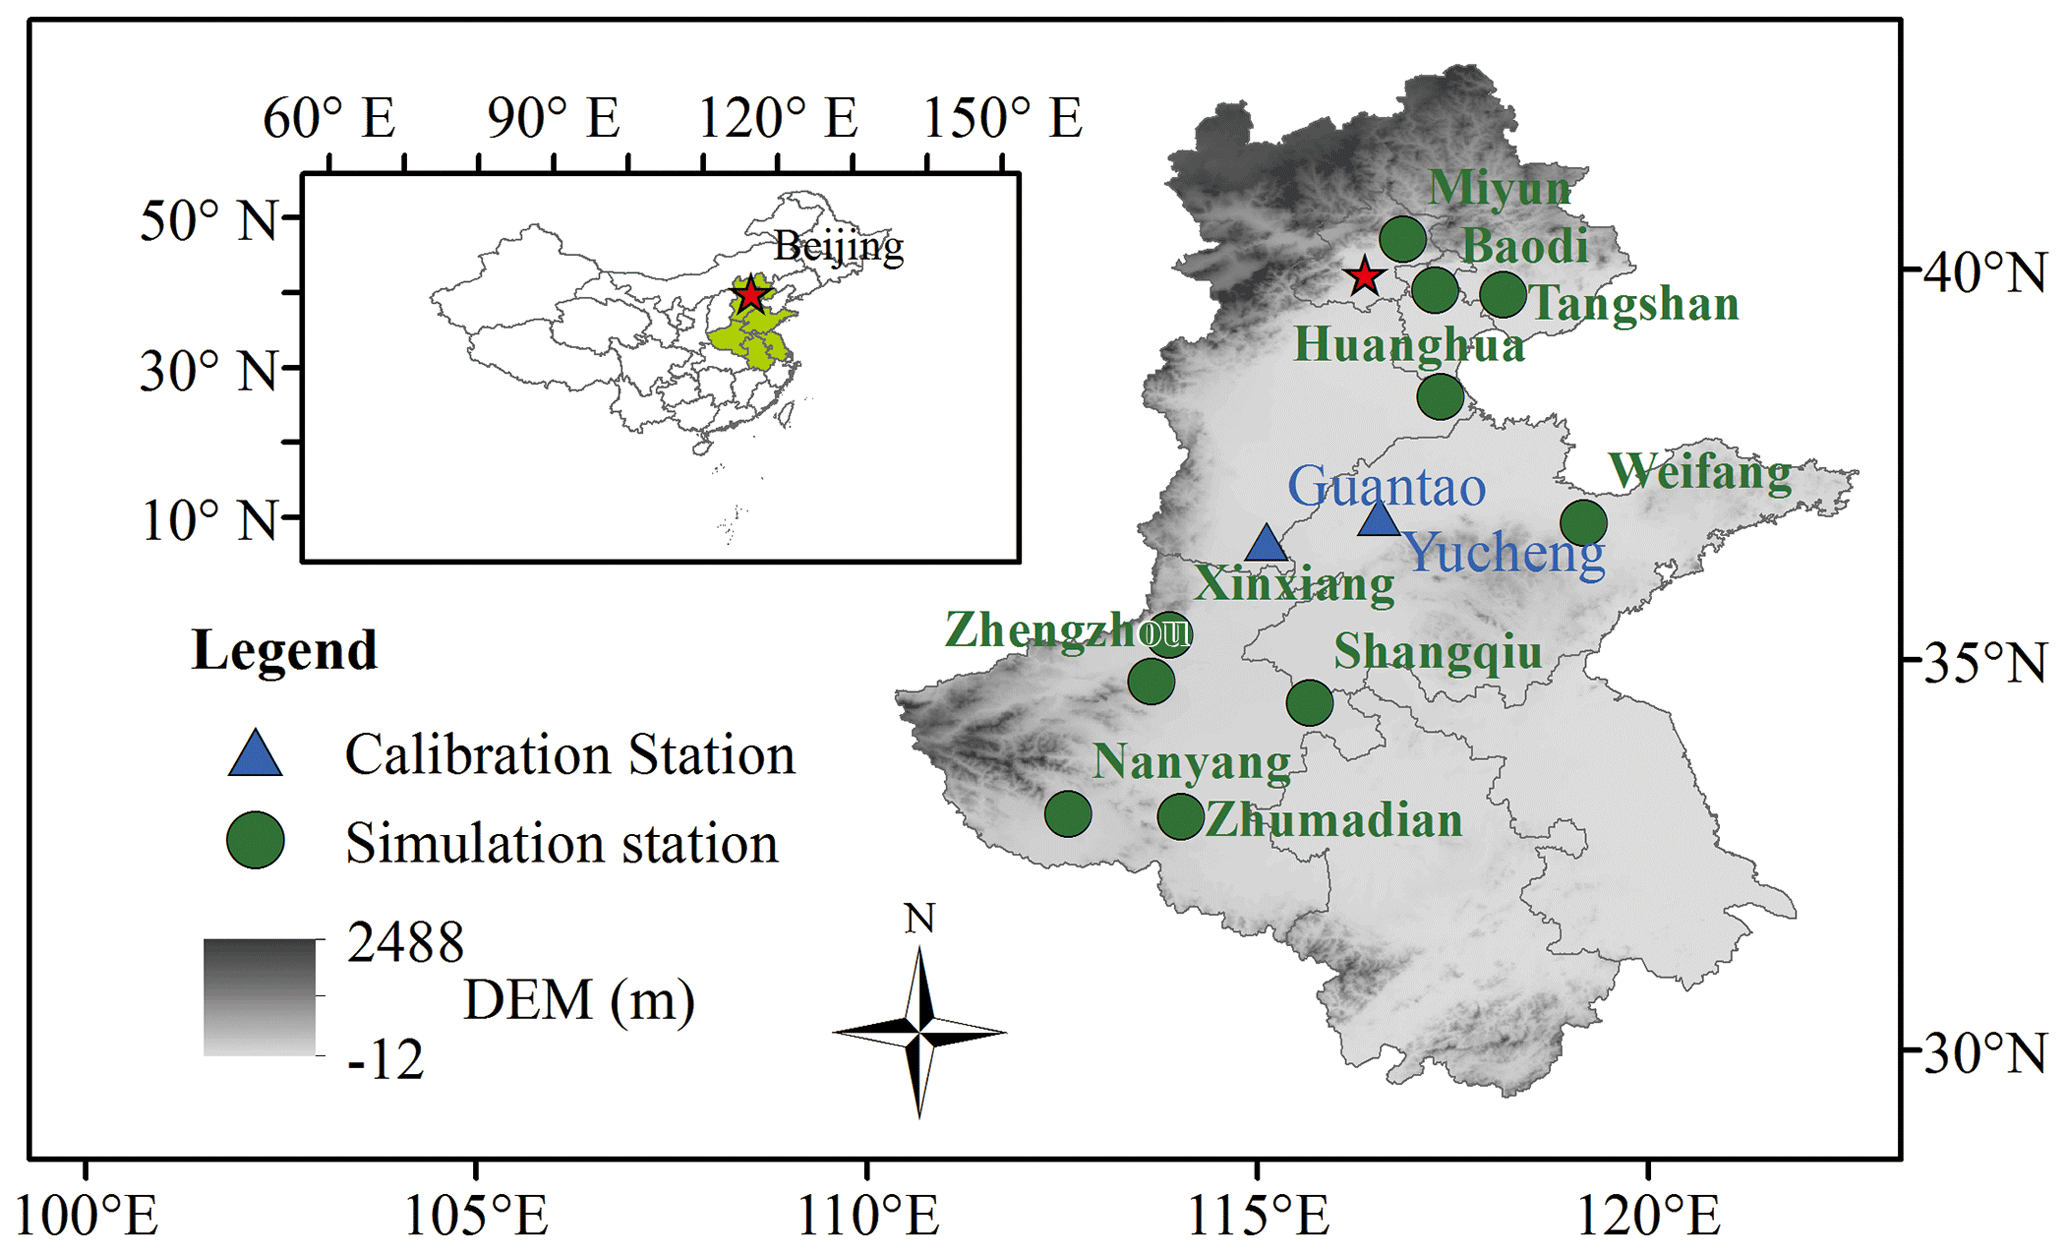
The 30 m resolution digital elevation model (DEM) was provided by the GlobeLand30 in 2010, and the administrative map was downloaded from the National Catalogue Service for Geographic Information.
2.2 Data
2.2.1 Meteorology
The quality-controlled meteorological data, including air temperature (Ta), precipitation (P), atmospheric pressure, relative humidity and wind speed, were obtained from the China Meteorological Administration. The summer monsoon climate dominates the region with an uneven distribution of annual precipitation (Table 1). In 1980–2012, the average annual P at the selected stations ranged between 550 and 990 mm, which mainly happened in summer. The mean yearly Ta varied between 11 and 15 ∘C. In the growing season of winter wheat (11–12 and 1–6 months), the Ta varied between 7 and 11 ∘C among stations, and P ranged between 170 and 420 mm, which is consistent with the average climatic conditions in the NCP (A et al., 2016). Climatological mean Ta and accumulated P during the wheat growth period were calculated in the 10 stations and were linearly regressed with the simulated differences between scenarios. Meteorological data were also used to drive the model.
Table 1Climate conditions of the selected stations in 1980–2012.
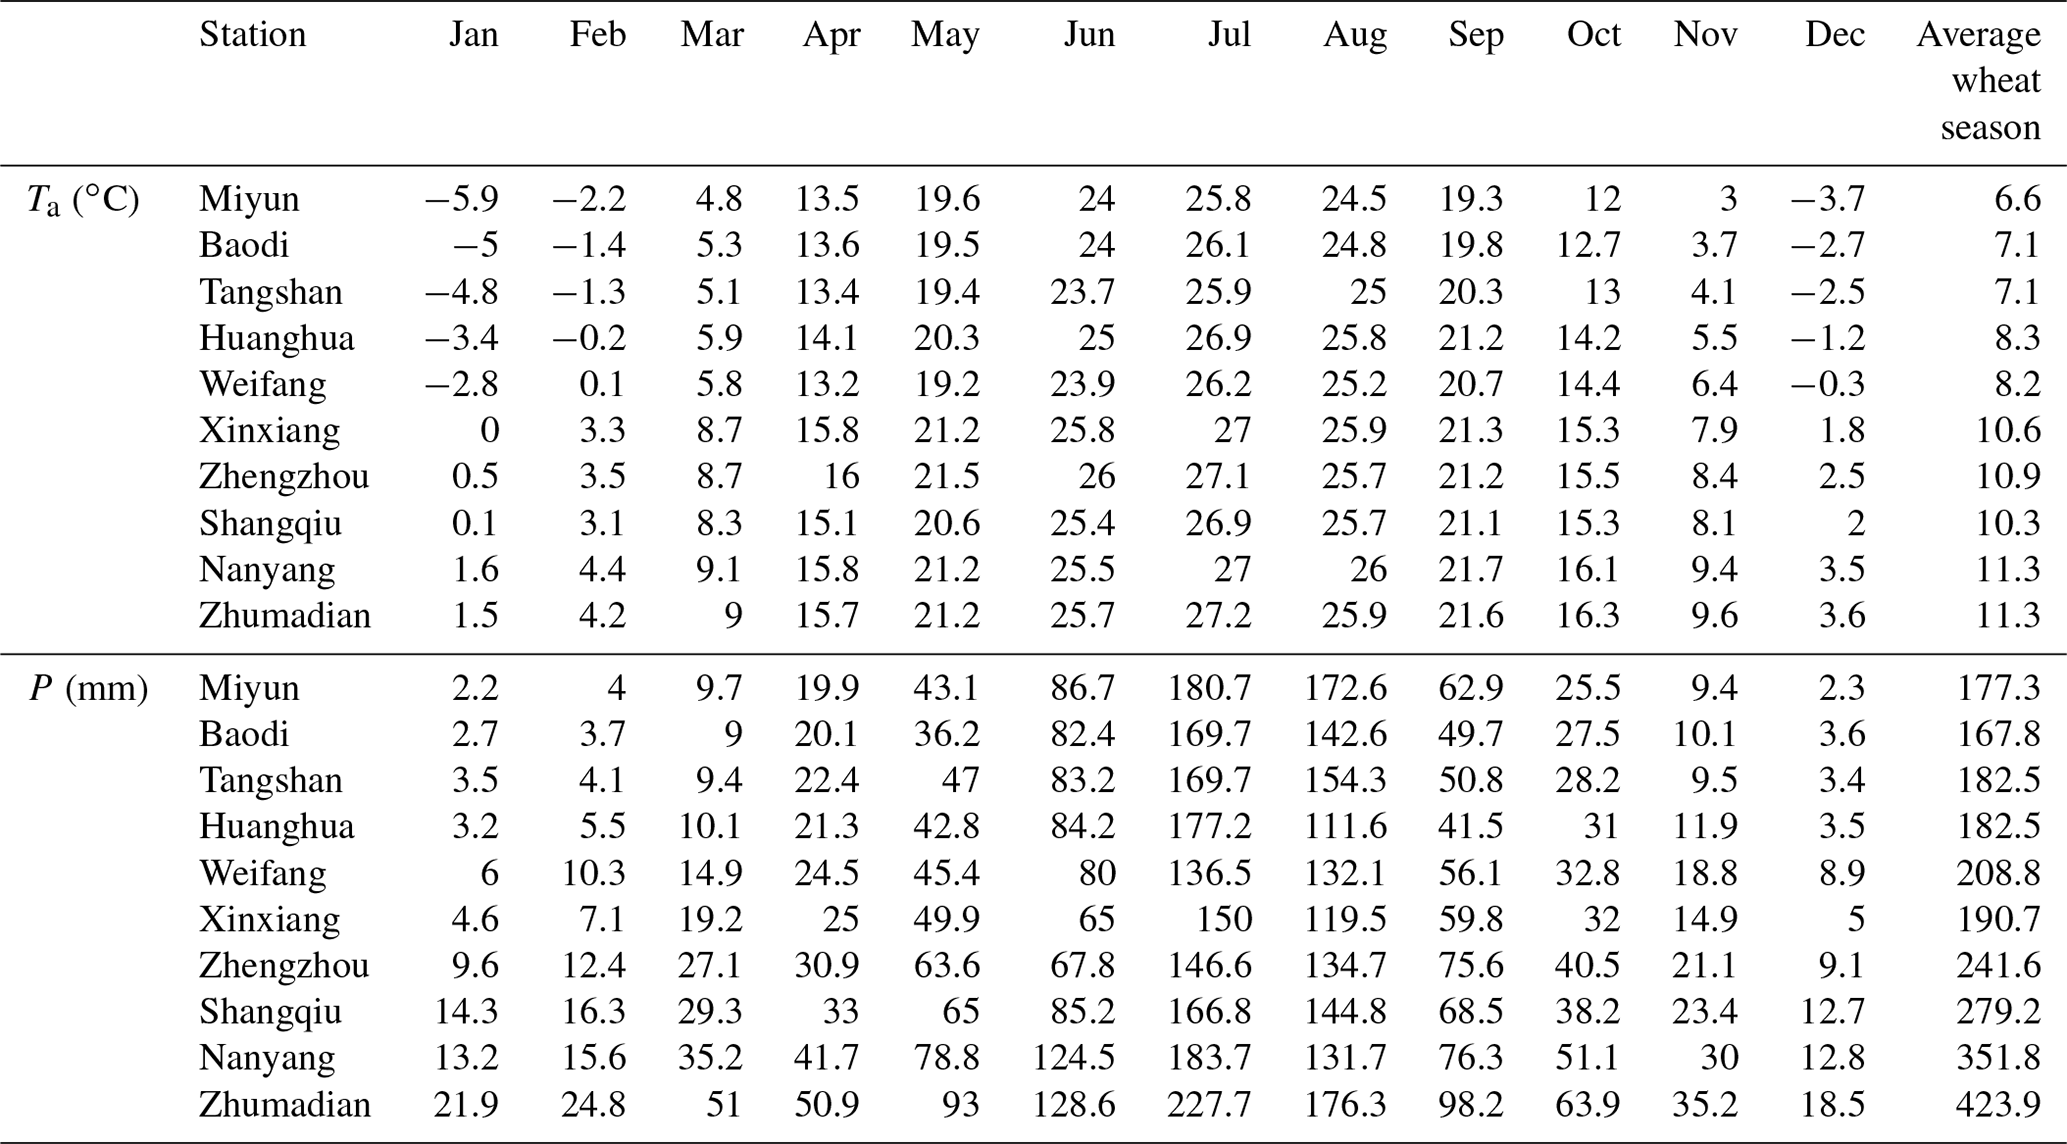
Ta means air temperature, and P means precipitation.
2.2.2 Verification data
To verify the applicability of the model, surface flux data were collected from Yucheng and Guantao stations (Fig. 1; Table 2). The two stations used the same eddy covariance instruments to measure the surface latent heat flux (LI-7500, LI-COR Inc., Lincoln, NE, USA) and sensible heat flux (CSAT3, Campbell Scientific Inc., Logan, UT, USA) but at different heights (Yucheng: 3.3 m; Guantao: 15.6 m). The post-processing software (Yucheng: EddyPro; Guantao: EdiRe) was used to process the raw data such as spike detection, lag correction of relative to the vertical wind component, sonic virtual temperature correction, coordinating rotation using the planar fit method, corrections for density fluctuation (WPL correction) and frequency response correction (Liu et al., 2011). The REddyProc software was used for gap filling by using a lookup table and mean diurnal variations (Falge et al., 2001; Wutzler et al., 2018). More details can be found in Lei et al. (2010) and Liu et al. (2013). In total 10 complete winter wheat season flux datasets were used to validate the model (Table 2).
The meteorology conditions were also synchronously measured during flux observation (Table 2). The measurement included Ta, P, atmospheric pressure, relative humidity, wind speed and sunshine. These data were the inputs of the model. According to Ta and P, the meteorological conditions were similar between the 10 stations for simulation and the two stations for calibration. More variables were observed at Yucheng station, such as wheat phenology and leaf area index (LAI) and canopy temperature (Tc). The observed durations of phenology, LAI and fluxes at Yucheng station were in 2003–2006, 2004–2006 and 2003–2010, respectively.
Table 2General information about model verification data.

Ta means air temperature. P means precipitation. LAI means leaf area index (m2 m−2). LH means latent heat flux (W m−2). SH means sensible heat flux (W m−2). Tc means simulated canopy temperature (∘C).
2.2.3 Phenology of winter wheat
The phenology information was obtained from Chinese agro-meteorological experiment stations and is available for the period of 1981–2009, except for 2003 at Zhumadian and 1986 and 1988 at Miyun station (Table 3). Phenological statistics showed that the sowing time of winter wheat is generally between DOY (day of year) 270 and 290 (early and middle October) in the NCP. After sowing, it generally takes about 6–10 d for germination. The winter wheat dormancy stage generally begins on DOY 330–360 (December), ends on DOY 40–70 (late February and early March) and reaches maturity on DOY 150–160 (mid-June). The standard deviation shows that the inter-annual fluctuations of the dormant and re-greening period is larger, and the harvest period is relatively stable.
For the past 30 years, winter wheat phenology at some stations showed a significant linear trend (Table 4). The sowing and germination periods were significantly delayed in 4 out of 10 stations, and the trend in the dormant and re-greening period was not obvious. Winter wheat matured significantly earlier at five stations. Generally, the autumn and winter phenophases, including sowing, germination and dormancy, are mainly delayed, while spring and summer phenophases, including re-greening and maturity, are primarily advanced. According to the fitting coefficient (a), the duration was changed by 5.7, 8.1, 4.9, −3.5 and −5.5 in the period of 1981–2009, respectively, for the stages of sowing, germination, dormancy, re-greening and maturity of winter wheat. These results were consistent with our previous studies (Tao et al., 2012; Xiao et al., 2013, 2015).
Table 3General information on the phenology of winter wheat in the selected stations (unit: DOY).
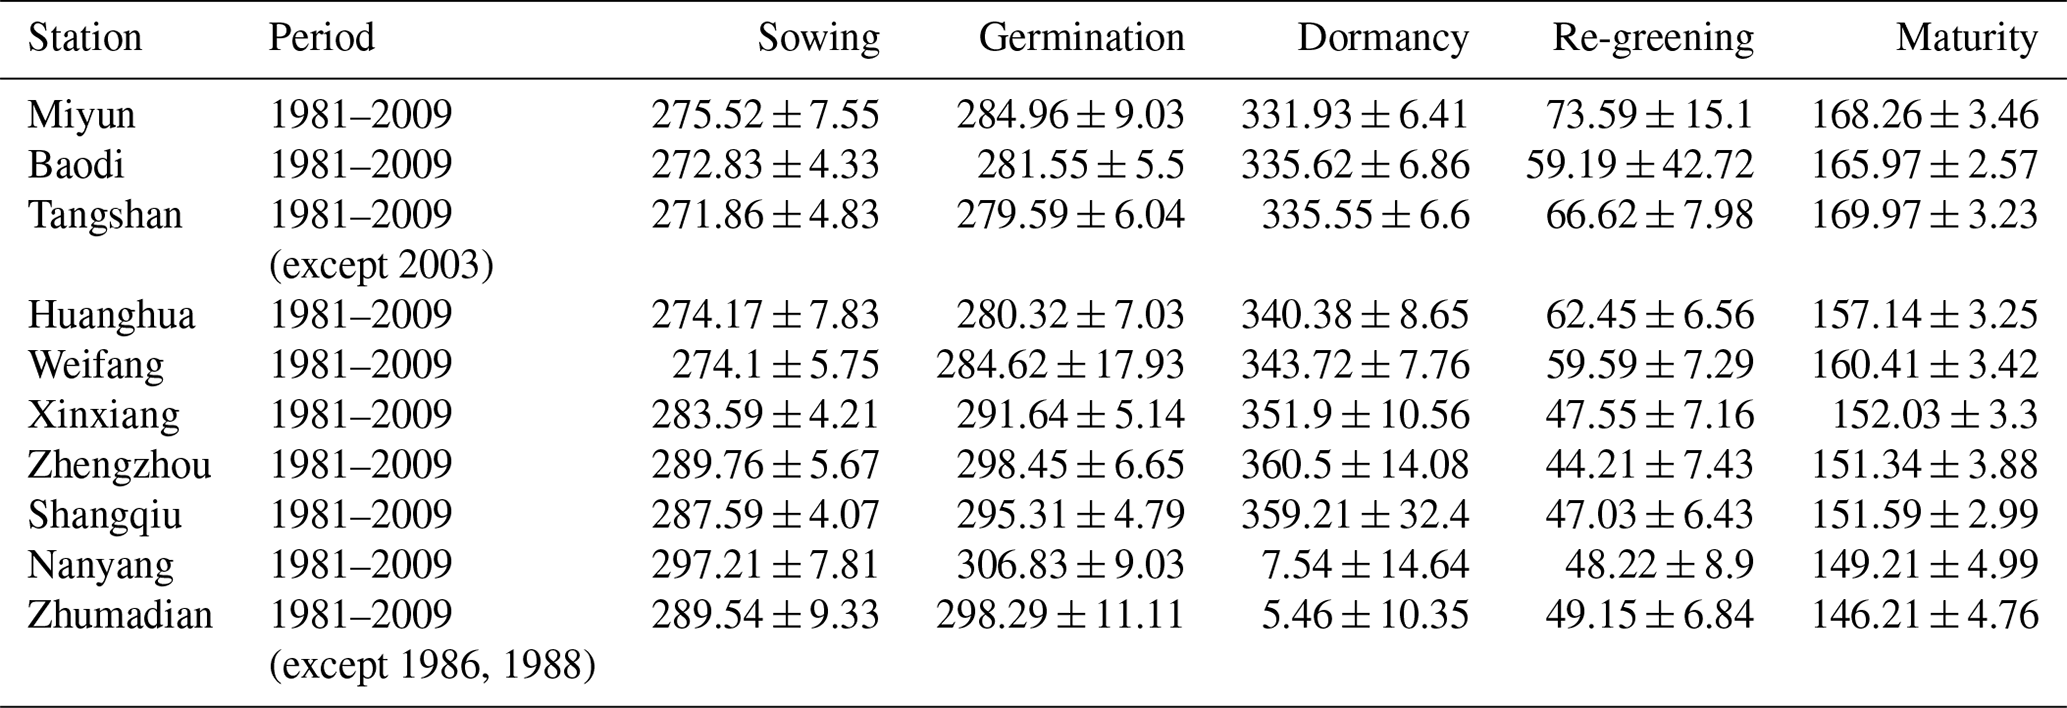
Data are shown as the average ± standard deviation.
Table 4Linear trends in winter wheat phenology.
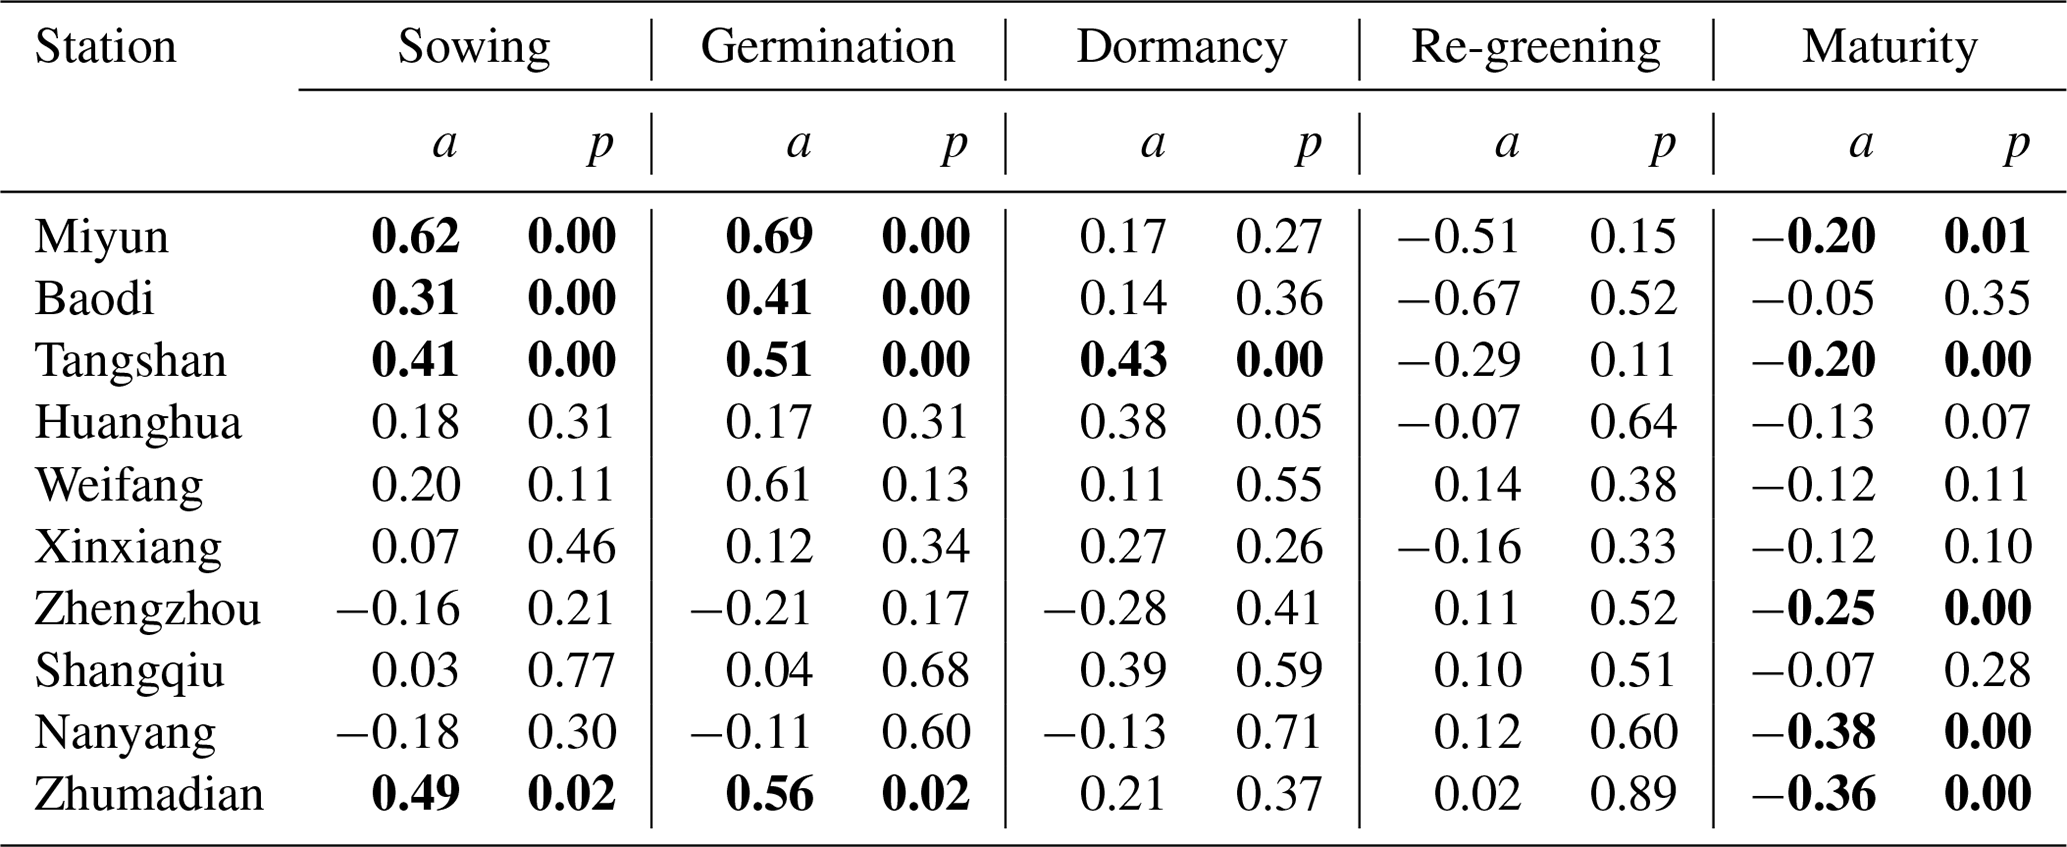
a is the coefficient of the linear fitting equation (d yr−1). p is the significance level. A bold number means p<0.05.
2.3 Methods
2.3.1 Model calibration and verification
The SiBcrop (Simple Biosphere) model was selected in this study. SiBcrop is a process-based land surface model adapted from the Simple Biosphere model version 3 (Lokupitiya et al., 2009). The SiB series models (versions 1, 2 and 3 refers to SiB1, SiB2 and SiB3, respectively) are widely adopted land surface models for computing surface energy, water, momentum and CO2 exchange in the boundary layer. The SiBcrop version added the crop-specific submodels of maize, soybean, and winter and spring wheats, which was simple and detailed enough in predicting LAI (Lokupitiya et al., 2009). The submodel replaces remotely sensed NDVI information by simulated LAI. SiBcrop simulated fast response processes that vary sub-hourly such as energy, water, carbon, and momentum balance of the canopy and soil, as well as the processes that vary daily such as LAI. Surface energy and water fluxes are calculated at each time step on a grid cell basis according to physiologically based formulations of leaf-level photosynthesis, stomatal conductance and respiration (Farquhar et al., 1980; Collatz et al., 1990).
The model was first modified according to the actual situation of winter wheat in the NCP (Chen et al., 2020). The SiBcrop model was originally calibrated in winter wheat – a summer fallow system in which the growth time of wheat is relatively abundant (Lokupitiya et al., 2009). However, the NCP is dominated by winter wheat – a summer maize system in which the development of wheat is strictly restricted. There are great differences in the varieties, planting date, growth environment and physiological characteristics of winter wheat between the two systems. The modifications include the following. (1) The sowing date was postponed to October from its original date in August. (2) The cold tolerance was reduced to 8 ∘C from its original temperature of 18 ∘C, above which the 7 consecutive days for wheat sowing were counted. (3) The harsh condition of delayed sowing also reduced the daily growth rate, which was modified from 0.07 to 0.03 g m−2 when the GDD value was 105–310 ∘C d. (4) Wheat grows faster when the GDD value is 769–1074 ∘C d, with its maximum dry weight increasing from 8 to 12 g and daily rate enlarging from 0.015 to 0.15 g m−2. (5) The specific leaf area was changed from 0.02 to 0.025 m2 g−1 (Najeeb et al., 2016). (6) A subroutine was added to describe the senescence process of the canopy when the GDD value was larger than 1074 ∘C d according to Tao et al. (2009). More details can be found in Chen et al. (2020).
After modifications, the simulated biases were within 10 d for wheat emergency and harvest dates; the determination coefficient, root mean square error and agreement index between simulated and observed LAI were obviously improved from 0.26, 1.89 and 0.7 to 0.80, 0.99 and 0.91 m2 m−2, respectively. And they were 0.66, 32.37 W m−2 and 0.84, respectively, for the simulated LH (Chen et al., 2020).
2.3.2 Model simulation
Two simulations with different sowing dates were performed to examine the responses of surface biophysical processes at the selected 10 stations (Fig. 1). The planting date was classified into two scenarios: after DOY 265 (early-sowing scenario, EP) and after DOY 275 (late-sowing scenario, LP). The early- and late-sowing scenarios were established by artificially limiting the starting time of the sowing date. The early-sowing scenario means that the sowing will not be allowed until DOY 265. Similarly, the late-sowing scenario is only allowed after DOY 275. In both scenarios, wheat was sowed for 7 consecutive days when temperature ranged from 8 to 25 ∘C, which means the real sowing date was 7 d later. The winter wheat submodel in the SiBcrop model was modified to be more cold tolerance (Sect. 2.3.1), which caused the sowing date to be less controlled by temperature. Therefore, the sowing dates were less constrained by climate difference among widely distributed stations. Our previous study showed that the delayed sowing date of winter wheat was mainly caused by the delayed harvest of maize (Xiao et al., 2013), which means the phenology of winter wheat was more affected by the previous crop than the climate in the NCP. The sowing dates in the two scenarios are within the climatological average of the region, indicating the reasonable choice of simulation scenarios.
The simulations were driven by the same meteorological data, initial conditions and soil texture from 1980 to 2009. The 1980–1984 was not analyzed as the spin-up time. The difference in the simulation results was mainly ascribed to the sowing date. The analyses focused on the dynamics of LAI and Tc and the surface energy balance components, such as Rn, LH and SH, which were used to explain the climate feedback mechanism.
2.3.3 Methods to relate the surface energy balance components with Tc
The Boisier method (Boisier et al., 2012) was adopted to relate the surface energy balance components with Tc. The energy partitioning of a terrestrial surface is expressed as
where Sd, Ld and Lu are the downward shortwave radiation, downward longwave radiation and upward longwave radiation, respectively. In order to have a closed surface energy balance, the residual term R was derived explicitly from the other terms in Eq. (1) and principally accounts for the soil heat flux and canopy storage flux.
The Tc change simulated by the model is affected by both radiative (surface albedo effect) and non-radiative processes (surface energy partitioning effect). In order to separate temperature variation caused by the sole change in absorbed shortwave radiation (radiative process), the following equation (Boisier et al., 2012) was used:
where ΔTc is the anomaly of canopy temperature (K), σ is the Stefan–Boltzmann constant ( W m−2 K−4) and ε is surface emissivity (=1). A disturbance in Sd, Ld, LH, SH or R can be expressed as ΔLu by fixing non-perturbed terms using Eq. (1). More details can be found in Boisier et al. (2012).
3.1 SiBcrop simulation accuracy
The simulation accuracy for Tc was analyzed by comparing the observation with a simulation at Yucheng station over 2003–2010 (Fig. S1 in the Supplement). The linear regression equation (simulated Tc=1.02 ⋅ measured Tc−4.22, R2=0.91, p<0.001) showed a good linear relationship between the simulated Tc and the observed Tc. The coefficients of linear fitting equations indicate that the simulated Tc was slightly higher than the measured value (slope = 1.02) and was negatively deviated (intercept = −4.22).
The simulation error for wheat phenology at Yucheng station was within 10 d (Chen et al., 2020). The sowing time under the two sowing scenarios was further compared with observations at the selected 10 stations. The simulated sowing date was stable, generally around DOY 278.66 ± 1.15 and DOY 290.34 ± 2.08 for the EP and LP scenarios, respectively. The observed phenology fluctuated greatly. Wheat was prone to sow later or early generally due to geographical location at some specific stations. In the EP scenario, the stations in the north had a positive difference (delayed sowing date relative to the actual date) compared to the actual phenological period, whereas the stations in the south had a negative difference (advanced sowing date relative to the actual date), because the stations in the north had an earlier sowing date than those in the south. In the LP scenario, the stations in the south were relatively close to the actual phenology, but the stations near the north had a larger positive difference. Overall, the simulation difference of phenology was within 15 d.
Table 5The difference between simulated and observed sowing dates under two scenarios at each station.
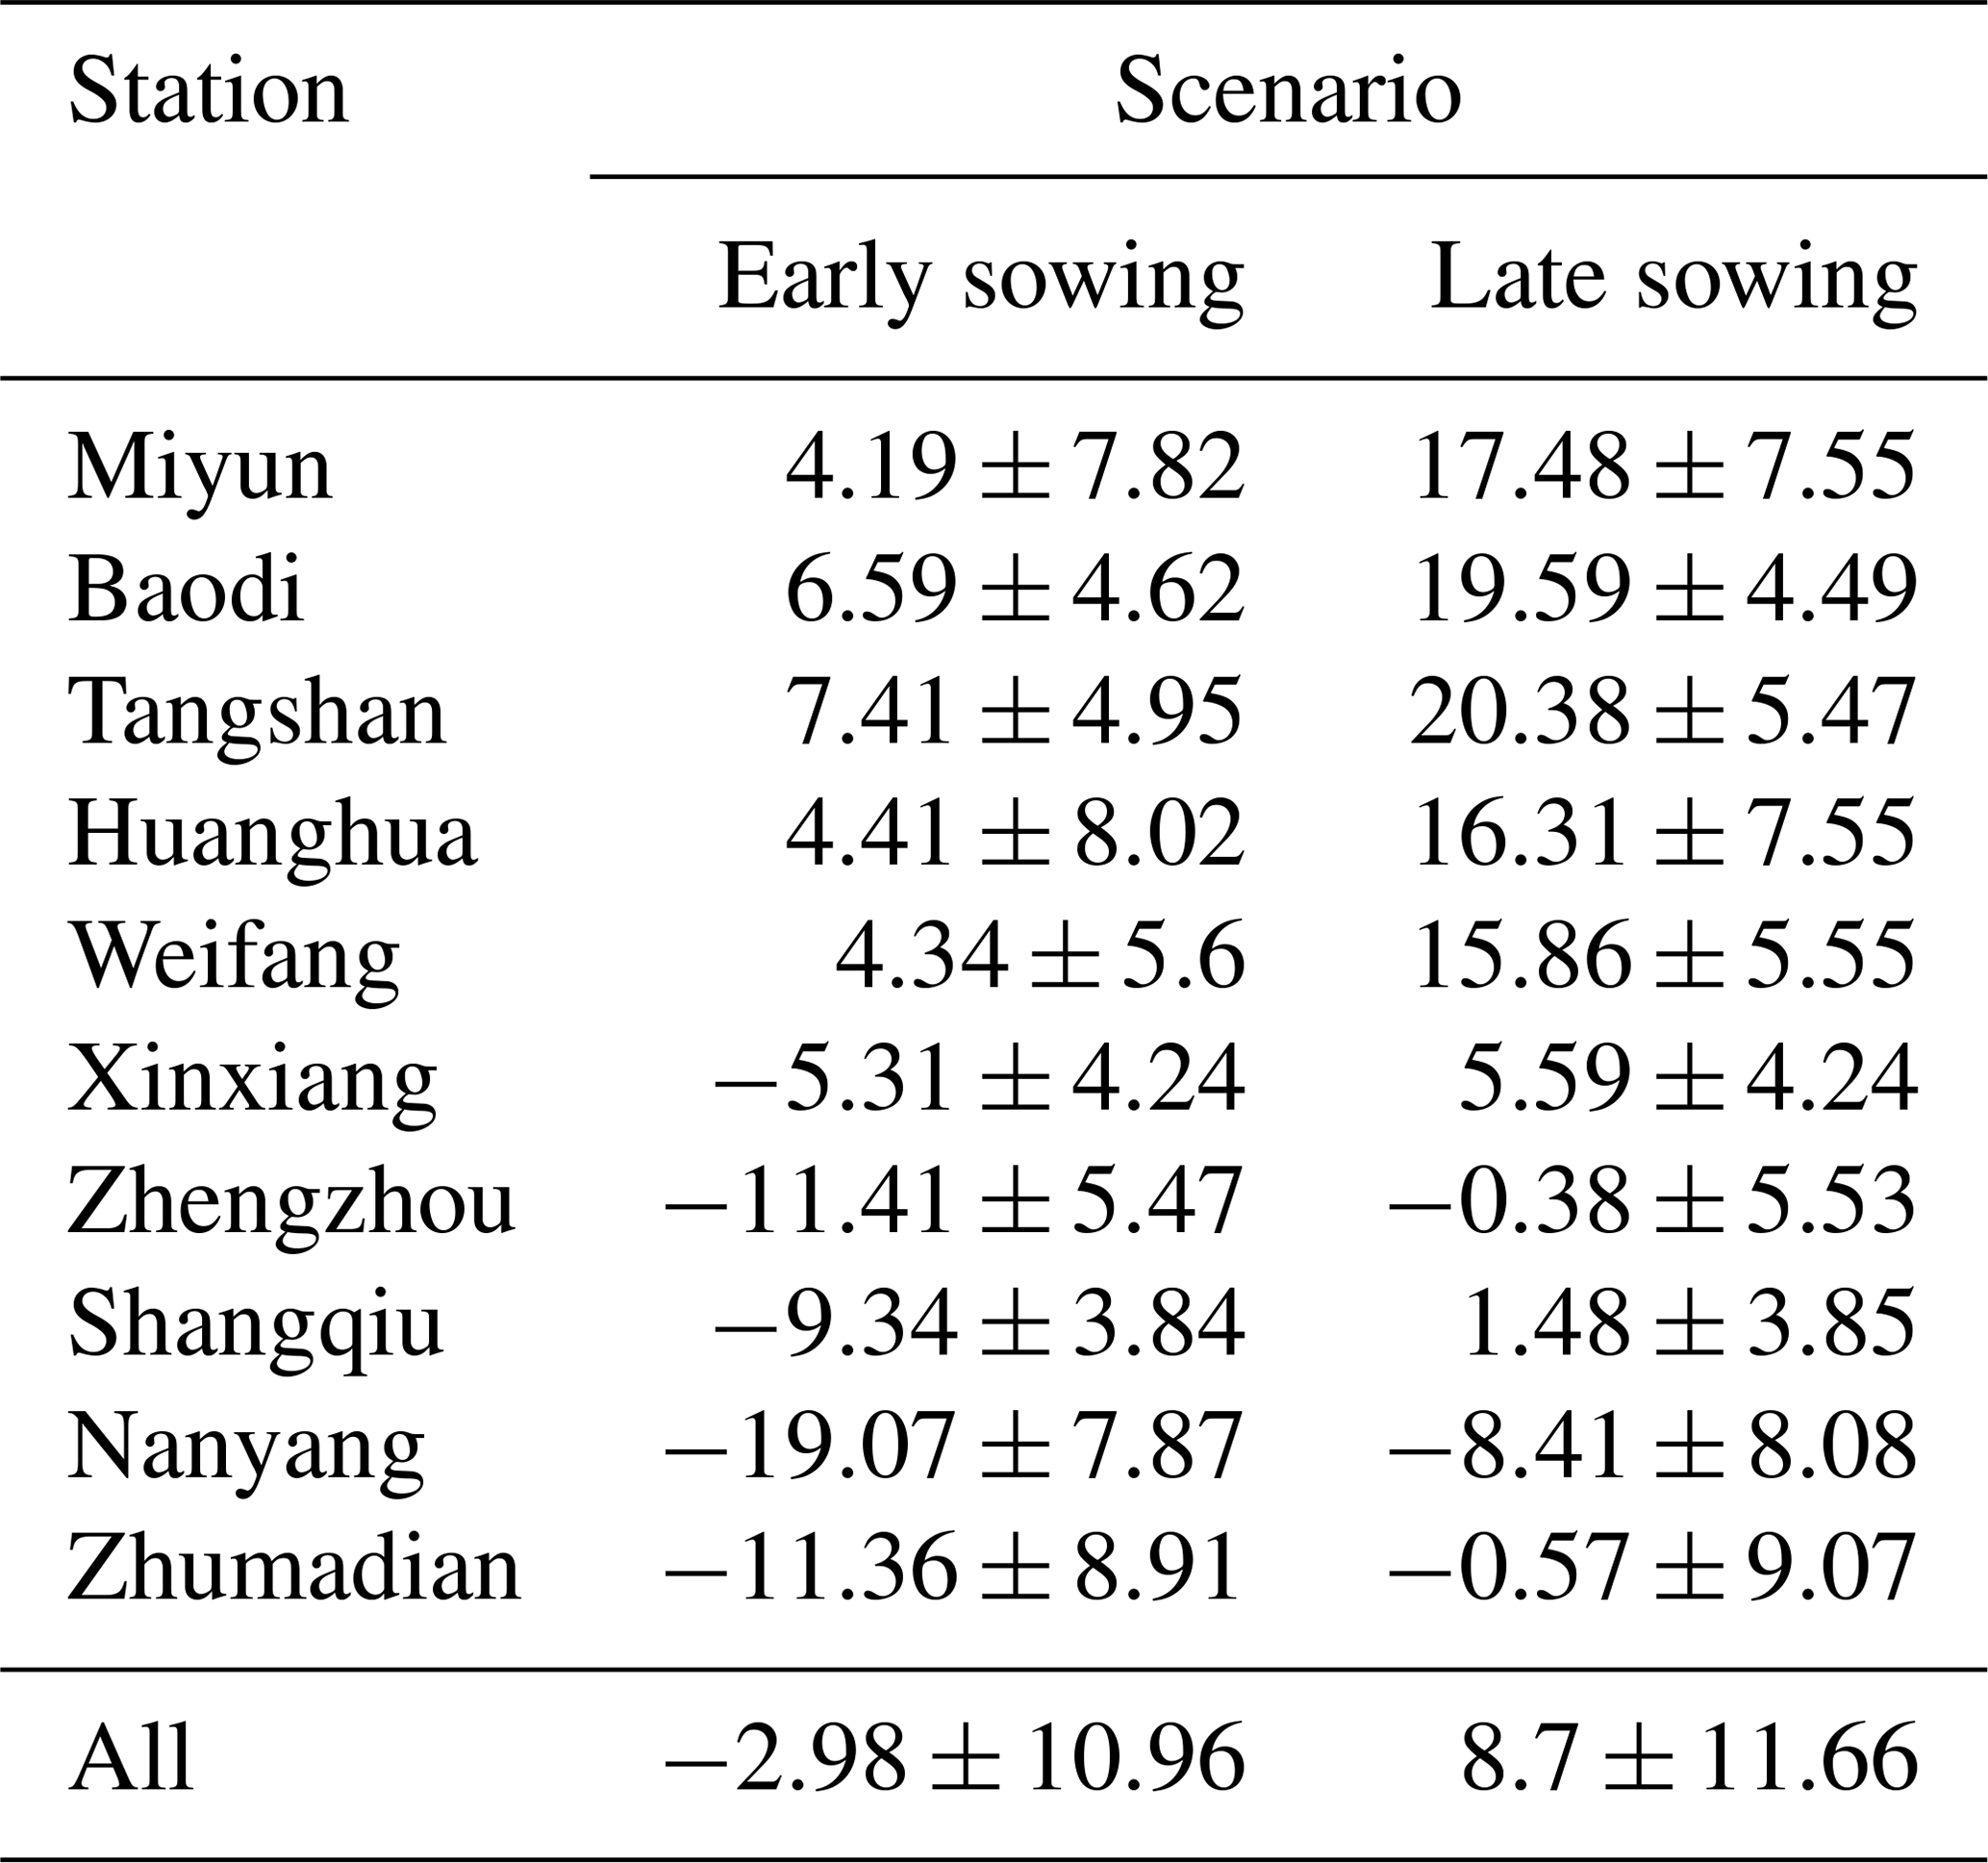
Data are shown as the average ± standard deviation.
3.2 Seasonal dynamics of LAI and Tc in scenarios
Wheat LAI curves for the two sowing dates did not overlap (Fig. 2a). The LAI in the EP scenario was larger with earlier development. With the sowing in the LP scenario, the LAI difference between the two scenarios gradually narrowed until the spring of the next year when the disparity increased again (Fig. 3a). The LAI difference between two scenarios had a valley after the reproductive period. With the approaching of harvest, the difference gradually decreased to 0.
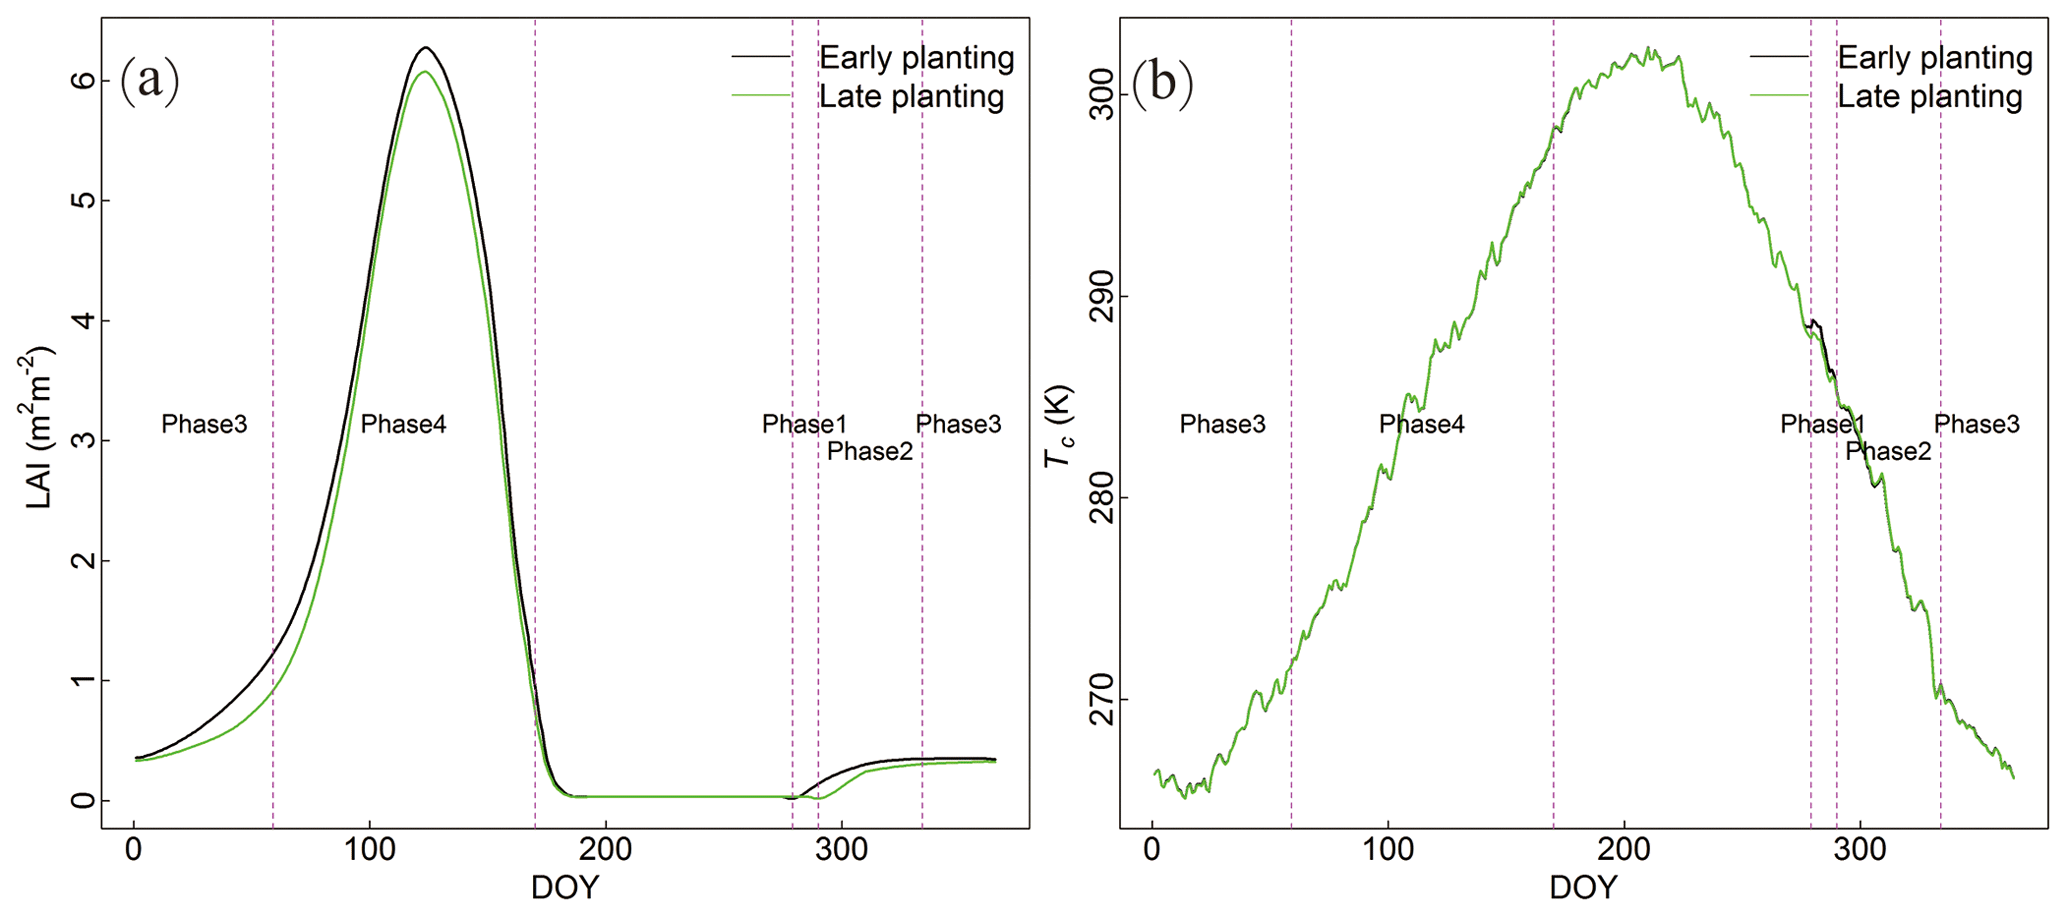
Figure 2Dynamics of (a) LAI and (b) Tc under two sowing scenarios in the winter wheat growing season.
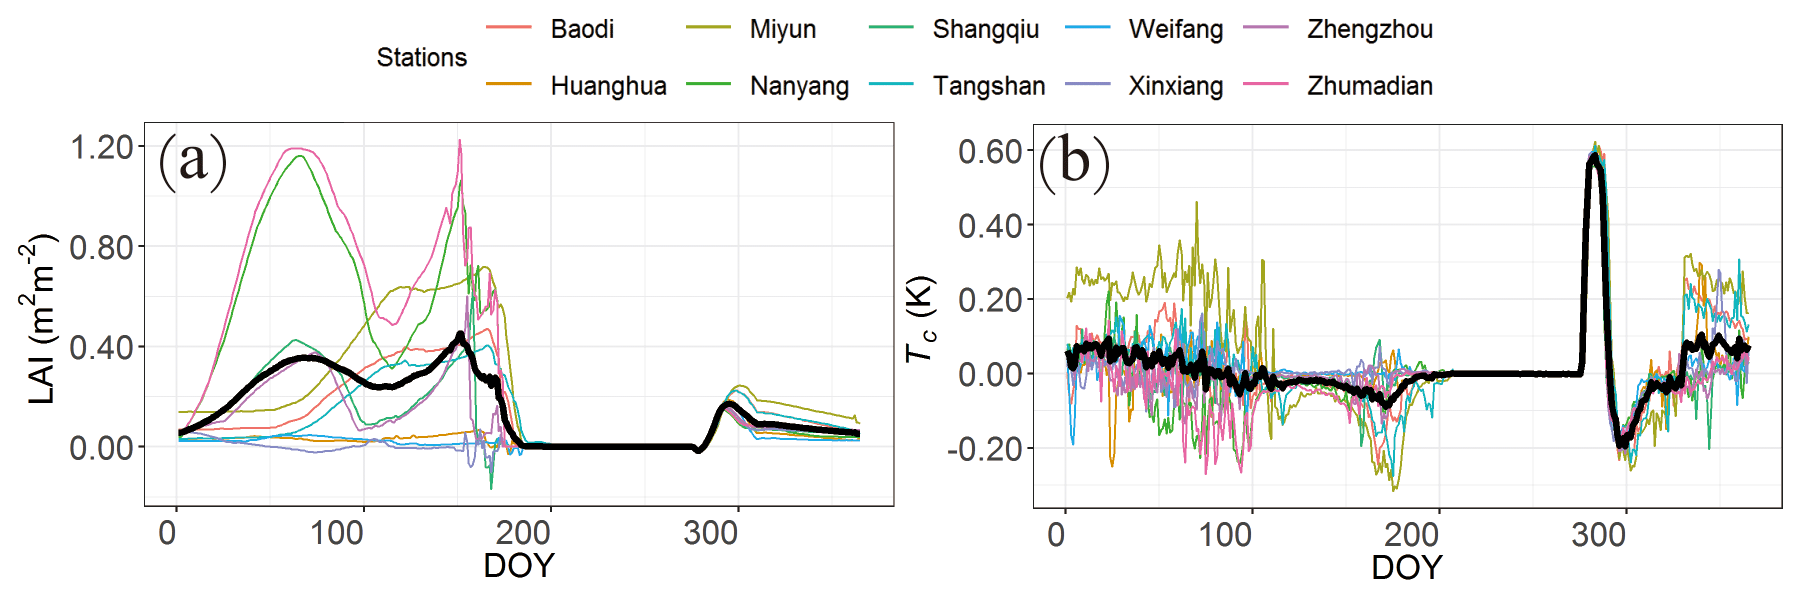
Figure 3Seasonal differences in (a) LAI and (b) Tc of EP−LP at each station. The average across the stations is shown as a bold black line.
The LAI difference of winter wheat in two scenarios is mainly attributed to the difference in the accumulation of biomass. In the EP scenario, earlier sowing means an advanced assimilation process and better temperature conditions; more photosynthetic carbon was produced and distributed into the leaf. The impact of sowing time on LAI displayed great dissimilarity among stations (Fig. 3a). Based on linear regression, the seasonal average of wheat LAI difference between scenarios was highly related with precipitation in the growth period (LAI anomaly = 0.0011 ⋅ P − 0.12, R2=0.59). The more precipitation there was, the greater was the influence of the sowing date on growth. The Ta contributed little to the LAI difference between the two scenarios.
According to the Tc difference between scenarios, the following phenologies of winter wheat were relatively important: sowing date, dormancy date, re-greening date and maturity date. Based on the simulation results, the phenological dates used here are as follows: EP sowing date, DOY 279; LP sowing date, DOY 290; dormancy date, DOY 334; re-greening date, DOY 59; and maturity date, DOY 170 (Fig. 2a). The Tc difference between scenarios was separated into four phases: phase 1 – inter-sowing period, when wheat had been sown in EP but had not in LP; phase 2 – early growing period, from the sowing date of LP to the dormancy date; phase 3 – dormancy period, from the dormancy date to the re-greening date; and phase 4 – late growing period, from the re-greening date to the maturity date (Fig. 2b).
The most obvious disparity in Tc between two scenarios occurred in the inter-sowing period (Fig. 2b). The development of early-sown winter wheat resulted in higher Tc, with a peak of up to 0.6 K. The growth of wheat in LP sharply reduced the warming effect in EP, and eventually the EP scenario had a lower temperature (−0.2 K) before entering the dormancy period. The temperature change process during this period was relatively consistent across the selected stations (Fig. 3b). In the late growing period, EP had a lower temperature (−0.1 K) than LP. In particular, the LAI difference varied greatly between stations (Fig. 3a); the Tc difference was relatively stable (Fig. 3b).
Another special period is the dormancy period, when EP had higher Tc than LP with an average of 0.05 K (Fig. 3b). With the start of the re-greening period, the EP Tc was gradually lower than the LP Tc and dropped to 0 at the harvest time. The Tc dynamics during this period were highly heterogeneous among the stations, varying between −0.25 and 0.25 K.
In the dormancy period, the Tc anomaly between scenarios was significantly affected by the Ta in winter (Tc anomaly = , R2=0.6, p=0.005). The lower the Ta is, the bigger is the Tc difference, which indicates that the influence of the sowing date is more important in northern farmland. The linear relationship between the P and Tc difference in winter was not obvious. The linear fitting equation between the P and Tc anomaly in the growing period is the following: Tc anomaly = , R2=0.8, p<0.001. More rainfall increased the Tc anomaly in the growing period. The linear fitting equation between the Ta and Tc anomaly in the growing period is the following: Tc anomaly = , R2=0.53, p=0.01. Since the Tc anomaly was negative, the higher the Ta is, the greater the Tc anomaly is. Considering the low temperature and less precipitation at the northern stations and the high temperature and more precipitation at the southern stations, the climate feedback of the sowing date was more obvious in winter in the northern areas and in the growing period in the southern areas.
The following phases were defined: phase 1 – inter-sowing period, when wheat had been sown in EP but had not in LP; phase 2 – early growing period, from the sowing date of LP to the dormancy date; phase 3 – dormancy period, from the dormancy date to the re-greening date; and phase 4 – late growing period, from the re-greening date to the maturity date.
3.3 Contributions of surface energy balance components to the scenario difference in Tc
According to the seasonal dynamics of LAI and Tc, winter wheat growth could not explain the difference in the climate effect of the sowing time. Specifically, the Tc anomaly between the two scenarios was reversed between the dormancy (phase 3) and active-growth periods (phase 2 and phase 4) but both with positive LAI differences (Fig. 3). In this section, surface energy balance was used to explain the response of Tc to the sowing date.
The flux anomalies of Rn, LH, SH and R were shown in Fig. 4a. The EP scenario always maintained higher Rn and LH. Especially winter-wheat-covered ground captured more than 10 W m−2 Rn than bare land. The anomaly of Rn in different sowing dates was maintained within 2 W m−2. LH generally was covariant with the change in Rn. However, the anomaly of LH in the late-growth period was greater than that of Rn, resulting in negative SH, indicating that the EP scenario had a stronger LH distribution tendency and that less SH was partitioned. A bigger anomaly of SH happened in the initial and dormant stages. R anomaly fluctuated obviously only in the initial phase.
The contributions of surface energy balance components to Tc were shown in Fig. 4b. Stronger radiation absorption provided more energy for the thermal motion of air, causing positive Tc differences of EP−LP. Correspondingly, higher distribution into LH, SH and R was conducive to cooling Tc. Therefore, positive LH and SH differences of EP−LP showed negative Tc effects, and the negative R difference of EP−LP showed a positive Tc effect. The positive Tc anomaly of EP−LP reflected that the radiative process played the major role in the dormancy period. In the active-growth time, the cooling effect of LH partitioning dominated the Tc anomaly.
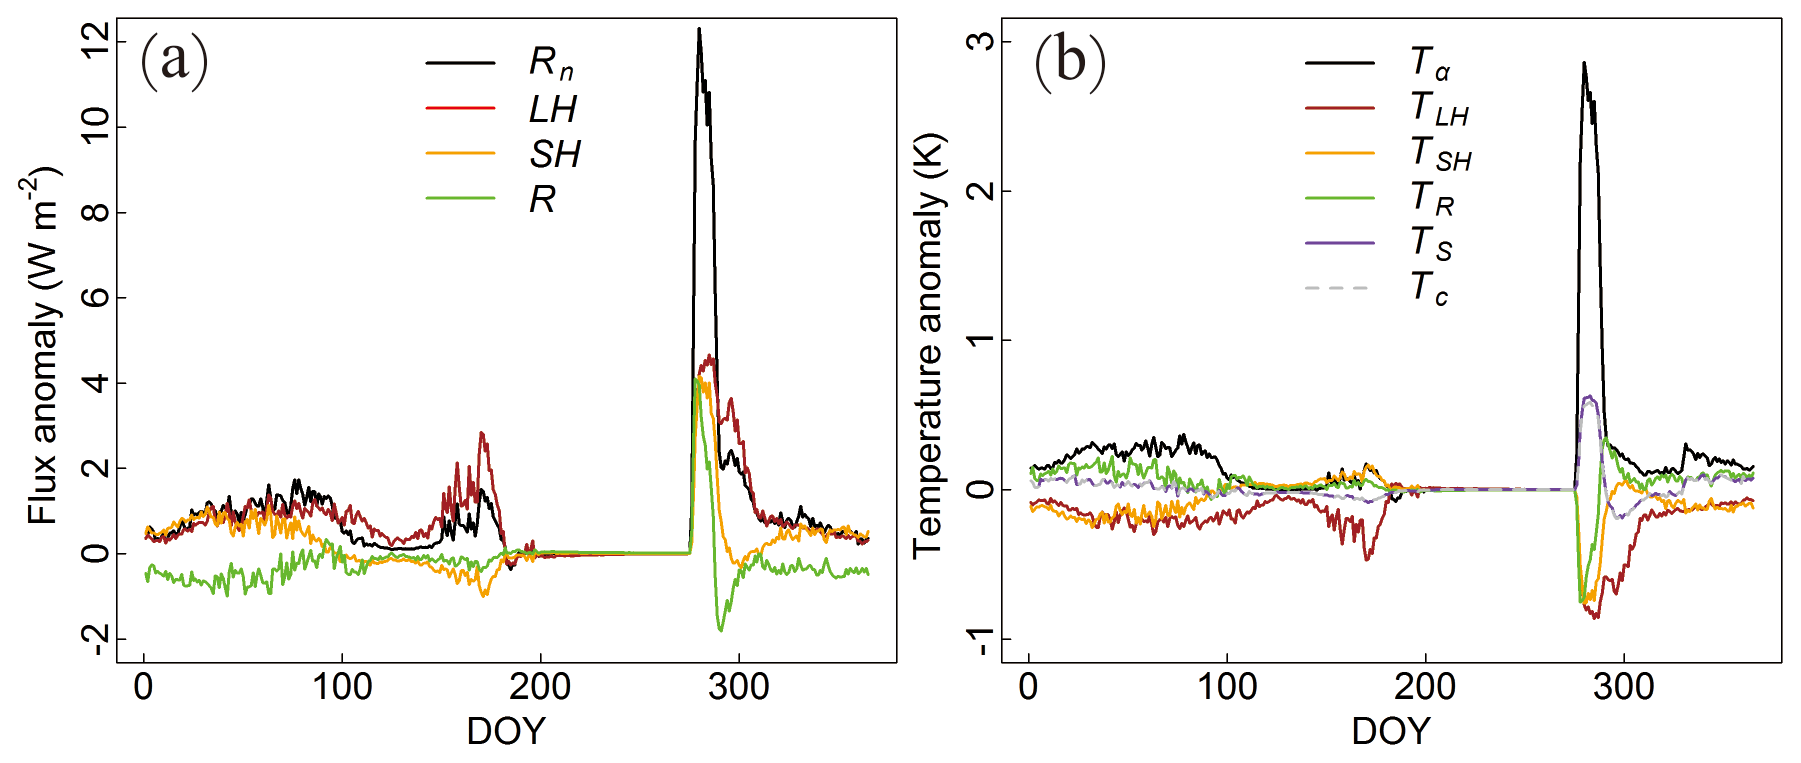
Figure 4(a) The differences in the surface fluxes between the sowing scenarios of EP and LP. (b) Its contributions to Tc anomaly.
Rn means net radiation; Tα represents the temperature anomaly induced by changes in absorbed solar radiation. TLH represents the temperature anomaly induced by changes in latent flux. TSH represents the temperature anomaly induced by changes in sensible flux. TR represents the temperature anomaly induced by changes in the residual term. TS represents the temperature anomaly induced by changes in solar radiation and latent, sensible and residual fluxes.
4.1 The diverse trends in sowing date of winter wheat in the NCP
The spatiotemporal changes of winter wheat phenology had been extensively examined in the NCP. In the period of 1981–2009, the sowing date was on average delayed by 1.5 d per decade, but 8 out of the 36 agro-meteorological experiment stations were advanced (Xiao et al., 2013). The diverse trends in sowing date also existed at the national scale, where 6 stations significantly advanced by up to 9.1 d per decade and 11 stations were significantly delayed by up to 10 d per decade (Tao et al., 2012).
The main reasons for crop phenology include climate warming and variety renewal (Mirschel et al., 2005; Eyshi Rezaei et al., 2017; F. Liu et al., 2017). Climate warming mainly leads to the delay of sowing date, and variety renewal is more likely to affect the length of the reproductive period. The management practices, photoperiod and time of the summer maize harvest also contributed to the shift of the winter wheat sowing date (Yuan et al., 2010).
The proper sowing date is key to ensure winter wheat survives through winter and reduces the freezing injury, insect pests and other harmful conditions (Sacks et al., 2010; Zhang et al., 2012; Newbery et al., 2016). With faster growth in a warmer environment, the sowing date should be postponed to maintain a proper coverage of winter wheat in the dormancy period. The warming of the NCP is regionally consistent (Shi et al., 2014), and the diverse change of the sowing date will affect the coverage of winter wheat, especially for one-fifth of the stations which advanced their sowing date. Earlier sowing may also benefit from the reduction in freezing damage and the increase in pest diseases caused by higher minimum temperature, since more aboveground biomass will not be subject to lethal freezing damage and will resist more harms from pests and diseases. There are also management practices to counteract the effects of advanced sowing date, such as deep tillage and delayed irrigation, which reduce the development of leaves and stems. Until now, few studies had focused on the phenomenon of the early-sowing date and its underlying causes and countermeasures.
The sowing date significantly affected land surface characteristic. There were differences several times in surface coverage between two sowing dates (Fig. S2). Differences in spectral characteristics, canopy structure and physiological activities between soil and winter wheat can significantly affect surface biophysical processes such as surface reflectivity, roughness, canopy resistance and surface energy budget (Richardson et al., 2013). In this study, the two sowing scenarios showed a clear disparity in LAI (Fig. 2a).
4.2 Warming effect of EP−LP in the dormancy period
Although there were studies reporting that the albedo process in winter is relatively important (Richardson et al., 2013; Lombardozzi et al., 2018), few studies directly addressed the influence of different surface characteristics and climate effect through biophysical processes in the dormancy period. In Oklahoma's winter wheat belt, the rapid crop growth during November exhibited a distinct cool anomaly against adjacent regions of dormant grassland. Over the period of December through April, the cool bias was visibly diminished, although the greenness difference between grassland and wheat was more distinct (McPherson et al., 2004). The biophysical impacts between maize and perennial grass were simulated using the Agro-IBIS model in US Corn Belt (Bagley et al., 2015). The results showed that a much higher LAI of a perennial scenario existed in winter, December–February (3 vs. 0 m2 m−2), and in summer, June–August (10 vs. 4 m2 m−2). Perennial grass had a smaller surface albedo (coupling snow effect) than maize in winter but showed quite a small difference in summer. During winter and summer, the perennial scenario had slightly higher LH than the maize scenario, but the difference in Rn between two scenarios was more than 10 W m−2 in winter (Bagley et al., 2015). The above studies indicated that the cooling effect of a higher LAI was inhibited in winter. The results of this current study indicate that higher LAI in winter has a warming effect. The main reason was due to the relative contributions of the surface albedo mechanism and surface flux distribution process.
The simple increased crop coverage on the bare ground would substantially alter surface albedo results from the decreasing contribution of the soil to the canopy reflectance (Hammerle et al., 2008). In the SiBcrop model, the reflectivity of different surface coverings varies greatly in the visible band (Table 6). The germination of winter wheat immediately changed the bare soil into soil with crops, which is favorable to the sharp reduction after crops covered. The measured surface albedo in winter could drop to 0.14 (Liu et al., 2019). The surface albedo was computed based on the surface energy budget at Weishan station; the bare-ground albedo can be higher than 0.3, and the winter wheat can be lower than 0.15 (data not shown). Therefore, early sowing in the EP scenario results in a higher LAI, which can significantly affect the surface albedo at the initial stage and continuously have a lower albedo than that in the LP scenario. The effect of the soil on the canopy reflectance is negligible at LAI > 2 m2 m−2 (Goudriaan, 1977), which explained why the Rn anomaly of EP−LP was small after the re-greening stage. In the model, the senescence of winter wheat is a process in which LAI decreases rapidly, and the disparity in LAI variations between the two scenarios further led to the difference in surface albedo and Rn during the late-growth period.
The strong climate feedback in the inter-sowing period, when wheat had been sown in EP but had not in LP, was related to the effect of tillage on maize stubble. The NCP is dominated by a rotation system of summer maize and winter wheat in which the ground is covered with maize stubble before wheat is sown. The damage of sowing to stubble is conducive to the reduction of albedo, since stubble has a larger surface reflectivity than soil (O'Brien and Daigh, 2019). The 0.1 increase of surface albedo caused by no-till management, which was also the magnitude of our simulation (Table 6), cools the hottest summer days by 2 ∘C or more (Davin et al., 2014). The inter-sowing period is equivalent to the no-tillage period, when early-sown wheat absorbed more net radiation with lower albedo by destroying stubble and causing a higher temperature (Figs. 3b and 4a).

Figure 5Dynamics of (a) surface albedo and (b) surface soil moisture content under two sowing scenarios in the winter wheat growing season.
Previous studies showed that the increase of vegetation cover caused warming feedback by destroying the high albedo of snow in the case of snow cover (Richardson et al., 2013; Bagley et al., 2015; Lombardozzi et al., 2018). In our simulation, except for the large difference in crop coverage in phase 1, the snow and crop had consistent coverage in other phases (Table S1 in the Supplement), which means the albedo difference between the two scenarios was not caused by snow. Low soil water content contributed to the high surface albedo (Seneviratne et al., 2010) (Fig. 5b). With the decrease of surface soil moisture, surface albedo increased in winter, which explained why albedo in the winter was higher than that in the growth period. The increase in soil reflectivity caused by soil drying enhanced the role of low winter wheat reflectivity in surface albedo; the albedo disparity between the two scenarios increased in winter, which strengthened the albedo radiative mechanism. Low soil moisture also contributed to the disparity in the warming effect between EP and LP during dormancy period (Fig. 5b). The lack of precipitation in winter made soil moisture unable to be replenished effectively, thus reducing soil evaporation and crop transpiration. But during the growing season, soil moisture is high enough to supply transpiration. The lower the Ta is, the lower the transpiration vitality is, thus making it unable to offset the warming effect of increased Rn absorption, which explained why the winter Tc disparity among stations was controlled by Ta.
Table 6The reflectivity of different surface coverings in the near-infrared and visible bands in the SiBcrop model.

4.3 Cooling effect of EP−LP during the growing period
The phenological shifts such as earlier leaf unfolding, delayed leaf fall and lengthening of the green-cover season have feedbacks on climate through biophysical and biogeochemical processes (Penuelas et al., 2009). Previous studies showed a cooling effect in the photosynthetic active period through surface biophysical mechanisms in the cropland (e.g., Sacks and Kucharik, 2011; Zhang et al., 2013; Bohm et al., 2020).
In the NCP, the increased spring surface greenness of farmland benefited from the advanced re-greening stage of winter wheat (Xiao et al., 2013; Z. Liu et al., 2017), had cooling and wetting effects (Zhang et al., 2013), and suppressed the moderate to light rainfall (Zhang et al., 2015). The analysis found that surface greening increased the partitioning into LH and reduced SH to cooling surface air and suppressing rainfall (Zhang et al., 2013, 2015). A distinguished difference between early-covering crops (winter wheat, winter rapeseed and winter barley) and late-covering crops (corn, silage maize and sugar beet) in central Europe caused impacts on simulated surface energy fluxes and temperature in the Noah-MP (Multiparameterization) model; the higher LAI led to an increase in LH, decrease in SH and eventually surface cooling in May–September (Bohm et al., 2020). The Agro-IBIS model was used to study the impacts on the surface energy balance of the advanced corn sowing date (10 d): early sowing means earlier development and senescence of LAI, causing a stronger disparity of LH than Rn with bigger LAI and probably a slight cooling of Ta in June (Sacks and Kucharik, 2011). Similar conclusions were presented based on simulated Tc results with the modified SiBcrop model.
The dynamics of winter wheat LAI and Tc under two sowing date scenarios were simulated by the SiBcrop model in the NCP, and the Tc disparity between the two scenarios was explained by the surface energy balance. The findings include the following:
-
An earlier sowing date of winter wheat had a higher LAI than a later sowing date.
-
The Tc disparity between EP and LP is divided into two periods: a warming effect in the dormancy period and a cooling effect in the active-growth period.
-
The surface energy balance can interpret the climate feedback mechanism of sowing date; that is, the dominated role of the albedo radiative process in the dormancy period is surpassed by the LH partitioning non-radiative process in the growth period.
-
The responses of LAI and Tc to the sowing date at station scale were divergent: controlled by Ta in the dormancy period and influenced by P and Ta in the growth period.
The study had some shortcomings. The single model simulation was highly dependent on the structure and parameterization scheme of the model. The climate feedback was reflected by the canopy temperature. In the SiBcrop model, the spatial distribution of stations was not fully considered in the determination of sowing date, which resulted in sowing too early or too late at some stations. Nevertheless, the study highlighted the divergent climate feedbacks on winter wheat dormancy as affected by sowing date. The simulation error of sowing date in land surface models is commonly higher than 10 d (Song et al., 2013; Chen et al., 2020), which may produce a detectable climate effect especially in northern winters and then misestimate the variation of minimum temperatures. The crop management changes should be considered a potential way to mitigate climate warming. In the cold dry north, delayed sowing and reduced irritation would alleviate the temperature increase in winter, whereas in the south, with better hydrothermal conditions, enhanced vegetation coverage would be beneficial.
The SiBcrop code can be downloaded at http://sib.atmos.colostate.edu/ (Denning Research Group, 2021). The modified crop subroutine code in this study is available from the corresponding author upon request.
Data sets are available from the corresponding author upon request.
The supplement related to this article is available online at: https://doi.org/10.5194/bg-18-2275-2021-supplement.
FL, YC, FT and QG designed and conceptualized the study. FL and FT contributed to the model modifications. FL, YC and NB analyzed data, prepared figures, wrote the manuscript and interpreted results. DX, HB and FT processed the phenology dynamic. FL, NB and FT reviewed and edited the paper. All the authors commented on the manuscript.
The authors declare that they have no conflict of interest.
This research has been supported by the National Natural Science Foundation of China (grant nos. 41801020 and 41801078).
This paper was edited by Paul Stoy and reviewed by two anonymous referees.
A, D., Xiong, K., Zhao, W., Gong, Z., Jing, R., and Zhang, L.: Temporal trend of climate change and mutation analysis of North China Plain during 1960 to 2013, Scientia Geographica Sinica, 36, 1555–1564, 2016 (in Chinese).
Bagley, J. E., Miller, J., and Bernacchi, C. J.: Biophysical impacts of climate – smart agriculture in the Midwest United States, Plant Cell Environ., 38, 1913–1930, 2015.
Bagley, J. E., Kueppers, L. M., Billesbach, D. P., Williams, I. N., Biraud, S. C., and Torn, M. S.: The influence of land cover on surface energy partitioning and evaporative fraction regimes in the US Southern Great Plains, J. Geophys. Res.-Atmos., 122, 5793–5807, 2017.
Bohm, K., Ingwersen, J., Milovac, J., and Streck, T.: Distinguishing between early- and late-covering crops in the land surface model Noah-MP: impact on simulated surface energy fluxes and temperature, Biogeosciences, 17, 2791–2805, https://doi.org/10.5194/bg-17-2791-2020, 2020.
Boisier, J. P., de Noblet-Ducoudre, N., Pitman, A. J., Cruz, F. T., Delire, C., van den Hurk, B. J. J. M., van der Molen, M. K., Müller, C., and Voldoire, A.: Attributing the impacts of land-cover changes in temperate regions on surface temperature and heat fluxes to specific causes: Results from the first LUCID set of simulations, J. Geophys. Res.-Atmos., 117, D12116, https://doi.org/10.1029/2011JD017106, 2012.
Chen, M., Griffis, T. J., Baker, J., Wood, J. D., and Xiao, K.: Simulating crop phenology in the Community Land Model and its impact on energy and carbon fluxes, J. Geophys. Res.-Biogeo., 120, 310–325, 2015.
Chen, Y., Liu, F., Tao, F., Ge, Q., Jiang, M., Wang, M., and Zhao, F.: Calibration and validation of SiBcrop Model for simulating LAI and surface heat fluxes of winter wheat in the North China Plain, J. Integr. Agr., 19, 2–11, 2020.
Cho, M. H., Boo, K. O., Lee, J., Cho, C., and Lim, G. H.: Regional climate response to land surface changes after harvest in the North China Plain under present and possible future climate conditions, J. Geophys. Res.-Atmos., 119, 4507–4520, 2014.
Collatz, G. J., Berry, J. A., Farquhar, G. D., and Pierce, J.: The relationship between the Rubisco reaction mechanism and models of photosynthesis, Plant Cell Environ., 13, 219–225, 1990.
Cooley, H. S., Riley, W. J., Torn, M. S., and He, Y.: Impact of agricultural practice on regional climate in a coupled land surface mesoscale model, J. Geophys. Res.-Atmos., 110, D03113, https://doi.org/10.1029/2004JD005160, 2005.
Cui, J., Yan, P., Wang, X., Yang, J., Li, Z., Yang, X., Sui, P., and Chen, Y.: Integrated assessment of economic and environmental consequences of shifting cropping system from wheat-maize to monocropped maize in the North China Plain, J. Clean. Prod., 193, 524–532, 2018.
Davin, E. L., Seneviratne, S. I., Ciais, P., Olioso, A., and Wang, T.: Preferential cooling of hot extremes from cropland albedo management, P. Natl. Acad. Sci. USA, 111, 9757–9761, 2014.
Denning Research Group: Simple Biosphere Model, available at: http://sib.atmos.colostate.edu/, last access: 31 March 2021.
Eyshi Rezaei, E., Siebert, S., and Ewert, F.: Climate and management interaction cause diverse crop phenology trends, Agr. Forest Meteorol., 233, 55–70, 2017.
Falge, E., Baldocchi, D., Olson, R., Anthoni, P., Aubinet, M., Bernhofer, C., Burba, G., Ceulemans, R., Clement, R., Dolman, H., Granier, A., Gross, P., Grünwald, T., Hollinger, D., Jensen, N.-O., Katul, G., Keronen, P., Kowalski, A., Lai, C., Law, B., Meyers, T., Moncrieff, J., Moors, E., Munger, J., Pilegaard, K., Rannik, Ü., Rebmann, C., Suyker, A., Tenhunen, J., Tu, K., Verma, S., Vesala, T., Wilson, K., and Wofsy, S.: Gap filling strategies for defensible annual sums of net ecosystem exchange, Agr. Forest Meteorol., 107, 43–69, 2001.
Farquhar, G. D., von Caemmerer, S., and Berry, J. A.: A biochemical model of photosynthetic CO2 assimilation in leaves of C3 species, Planta, 149, 78–90, 1980.
Goudriaan, J.: Crop micrometeorology: a simulation study, Pudoc., available at: https://edepot.wur.nl/166537 (last access: 29 March 2021), 15 pp., 1977.
Hammerle, A., Haslwanter, A., Tappeiner, U., Cernusca, A., and Wohlfahrt, G.: Leaf area controls on energy partitioning of a temperate mountain grassland, Biogeosciences, 5, 421–431, https://doi.org/10.5194/bg-5-421-2008, 2008.
Ho, C.-H., Park, S.-J., Jeong, S.-J., Kim, J., and Jhun, J.-G.: Observational Evidences of Double Cropping Impacts on the Climate in the Northern China Plains, J. Climate, 25, 4721–4728, 2012.
Jeong, S.-J., Ho, C.-H., Piao, S., Kim, J., Ciais, P., Lee, Y.-B., Jhun, J.-G., and Park, S. K.: Effects of double cropping on summer climate of the North China Plain and neighbouring regions, Nat. Clim. Change, 4, 615–619, 2014.
Lei, H., Yang, D., Lokupitiya, E., and Shen, Y.: Coupling land surface and crop growth models for predicting evapotranspiration and carbon exchange in wheat-maize rotation croplands, Biogeosciences, 7, 3363–3375, https://doi.org/10.5194/bg-7-3363-2010, 2010.
Liu, C., Gao, Z., Li, Y., Gao, C. Y., Su, Z., and Zhang, X.: Surface Energy Budget Observed for Winter Wheat in the North China Plain During a Fog-Haze Event, Bound.-Lay. Meteorol., 170, 489–505, 2019.
Liu, F., Chen, Y., Shi, W., Zhang, S., Tao, F., and Ge, Q.: Influences of agricultural phenology dynamic on land surface biophysical process and climate feedback, J. Geogr. Sci., 27, 1085–1099, 2017.
Liu, J., Liu, M., Tian, H., Zhuang, D., Zhang, Z., Zhang, W., Tang, X., and Deng, X.: Spatial and temporal patterns of China's cropland during 1990–2000: An analysis based on Landsat TM data, Remote Sens. Environ., 98, 442–456, 2005.
Liu, S., Xu, Z., Zhu, Z., Jia, Z., and Zhu, M.: Measurements of evapotranspiration from eddy-covariance systems and large aperture scintillometers in the Hai River Basin, China, J. Hydrol., 487, 24–38, 2013.
Liu, S. M., Xu, Z. W., Wang, W. Z., Jia, Z. Z., Zhu, M. J., Bai, J., and Wang, J. M.: A comparison of eddy-covariance and large aperture scintillometer measurements with respect to the energy balance closure problem, Hydrol. Earth Syst. Sci., 15, 1291–1306, https://doi.org/10.5194/hess-15-1291-2011, 2011.
Liu, Y. A., Wang, E. L., Yang, X. G., and Wang, J.: Contributions of climatic and crop varietal changes to crop production in the North China Plain, since 1980's, Global Change Biol., 16, 2287–2299, 2010.
Liu, Y. J., Chen, Q. M., Ge, Q. S., Dai, J. H., Qin, Y., Dai, L., Zou, X. T., and Chen, J.: Modelling the impacts of climate change and crop management on phenological trends of spring and winter wheat in China, Agr. Forest Meteorol., 248, 518–526, 2018.
Liu, Z., Wu, C., Liu, Y., Wang, X., Fang, B., Yuan, W., and Ge, Q.: Spring green-up date derived from GIMMS3g and SPOT-VGT NDVI of winter wheat cropland in the North China Plain, ISPRS J. Photogramm., 130, 81–91, 2017.
Lokupitiya, E., Denning, S., Paustian, K., Baker, I., Schaefer, K., Verma, S., Meyers, T., Bernacchi, C. J., Suyker, A., and Fischer, M.: Incorporation of crop phenology in Simple Biosphere Model (SiBcrop) to improve land-atmosphere carbon exchanges from croplands, Biogeosciences, 6, 969–986, https://doi.org/10.5194/bg-6-969-2009, 2009.
Lombardozzi, D. L., Bonan, G. B., Wieder, W., Grandy, A. S., Morris, C., and Lawrence, D. M.: Cover Crops May Cause Winter Warming in Snow-Covered Regions, Geophys. Res. Lett., 45, 9889–9897, 2018.
Mahdi, L., Bell, C. J., and Ryan, J.: Establishment and yield of wheat (Triticum turgidum L.) after early sowing at various depths in a semi-arid Mediterranean environment, Field Crop. Res., 58, 187–196, 1998.
Mahmood, R., Pielke, R. A., Hubbard, K. G., Niyogi, D., Dirmeyer, P. A., McAlpine, C., Carleton, A., Hale, R., Gameda, S., Beltran-Przekurat A., Baker, B., McNider, R., Legates, D., Shepherd, M., Du, J., Blanken, P., Frauenfeld, O., Nair, U., and Fall, S.: Land cover changes and their biogeophysical effects on climate, Int. J. Climatol., 34, 929–953, 2014.
McPherson, R. A., Stensrud, D. J., and Crawford, K. C.: The Impact of Oklahoma's Winter Wheat Belt on the Mesoscale Environment, Mon. Weather Rev., 132, 405–421, 2004.
Mirschel, W., Wenkel, K.-O., Schultz, A., Pommerening, J., and Verch, G.: Dynamic phenological model for winter rye and winter barley, Eur. J. Agron., 23, 123–135, 2005.
Najeeb, U., Bange, M. P., Atwell, B. J., and Tan, D. K. Y.: Low Incident Light Combined with Partial Waterlogging Impairs Photosynthesis and Imposes a Yield Penalty in Cotton, J. Agron. Crop Sci., 202, 331–341, 2016.
Newbery, F., Qi, A., and Fitt, B. D.: Modelling impacts of climate change on arable crop diseases: progress, challenges and applications, Curr. Opin. Plant Biol., 32, 101–109, 2016.
O’Brien, P. and Daigh, A.: Tillage practices alter the surface energy balance – A review, Soil Till. Res., 195, 104354, https://doi.org/10.1016/j.still.2019.104354, 2019
Penuelas, J., Rutishauser, T., and Filella, I.: Phenology Feedbacks on Climate Change, Science, 324, 887–888, 2009.
Reynolds, M., Foulkes, J., Furbank, R., Griffiths, S., King, J., Murchie, E., Parry, M., and Slafer, G.: Achieving yield gains in wheat, Plant Cell Environ., 35, 1799–1823, 2012.
Richardson, A. D., Keenan, T. F., Migliavacca, M., Ryu, Y., Sonnentag, O., and Toomey, M.: Climate change, phenology, and phenological control of vegetation feedbacks to the climate system, Agr. Forest Meteorol., 169, 156–173, 2013.
Sacks, W. J. and Kucharik, C. J.: Crop management and phenology trends in the US Corn Belt: Impacts on yields, evapotranspiration and energy balance, Agr. Forest Meteorol., 151, 882–894, 2011.
Sacks, W. J., Deryng, D., Foley, J. A., and Ramankutty, N.: Crop planting dates: an analysis of global patterns, Global Ecol. Biogeogr., 19, 607–620, 2010.
Schillinger, W. F.: Rainfall Impacts Winter Wheat Seedling Emergence from Deep Planting Depths, Agron. J., 103, 730, https://doi.org/10.2134/agronj2010.0442, 2011.
Sellers, P. J., Tucker, C. J., Collatz, G. J., Los, S. O., Justice, C. O., Dazlich, D. A., and Randall, D. A.: A Revised Land Surface Parameterization (SiB2) for Atmospheric GCMS, Part II: The Generation of Global Fields of Terrestrial Biophysical Parameters from Satellite Data, J. Climate, 9, 706–737, 1996.
Seneviratne, S. I., Corti, T., Davin, E. L., Hirschi, M., Jaeger, E. B., Lehner, I., Orlowsky, B., and Teuling, A.: Investigating soil moisture–climate interactions in a changing climate: A review, Earth-Sci. Rev., 99, 125–161, 2010.
Seneviratne, S. I., Phipps, S. J., Pitman, A. J., Hirsch, A. L., Davin, E. L., Donat, M. G., Hirschi, M., Lenton, A., Wilhelm, M., and Kravitz, B.: Land radiative management as contributor to regional-scale climate adaptation and mitigation, Nat. Geosci., 11, 88–96, 2018.
Shi, P., Sun, S., Wang, M., Li, N., Wang, J., Jin, Y., Gu, X., and Yin, W.: Climate change regionalization in China (1961–2010), Sci. China Earth Sci., 44, 2294–2306, 2014 (in Chinese).
Song, Y., Jain, A. K., and McIsaac, G. F.: Implementation of dynamic crop growth processes into a land surface model: evaluation of energy, water and carbon fluxes under corn and soybean rotation, Biogeosciences, 10, 8039–8066, https://doi.org/10.5194/bg-10-8039-2013, 2013.
Tao, F., Yokozawa, M., and Zhang, Z.: Modelling the impacts of weather and climate variability on crop productivity over a large area: A new process-based model development, optimization, and uncertainties analysis, Agr. Forest Meteorol., 149, 831–850, 2009.
Tao, F. L., Zhang, S. A., and Zhang, Z.: Spatiotemporal changes of wheat phenology in China under the effects of temperature, day length and cultivar thermal characteristics, Eur. J. Agron., 43, 201–212, 2012.
Tao, F. L., Zhang, S., Zhang, Z., and Rotter, R. P.: Maize growing duration was prolonged across China in the past three decades under the combined effects of temperature, agronomic management, and cultivar shift, Global Change Biol., 20, 3686–3699, 2014.
Wuest, S. B.: Tillage depth and timing effects on soil water profiles in two semiarid soils, Soil Sci. Soc. Am. J., 74, 1701–1711, 2010.
Wutzler, T., Lucas-Moffat, A., Migliavacca, M., Knauer, J., Sickel, K., Šigut, L., Menzer, O., and Reichstein, M.: Basic and extensible post-processing of eddy covariance flux data with REddyProc, Biogeosciences, 15, 5015–5030, https://doi.org/10.5194/bg-15-5015-2018, 2018.
Xiao, D. P. and Tao, F. L.: Contributions of cultivars, management and climate change to winter wheat yield in the North China Plain in the past three decades, Eur. J. Agron., 52, 112–122, 2014.
Xiao, D. P., Tao, F. L., Liu, Y. J., Shi, W. J., Wang, M., Liu, F. S., Zhang, S., and Zhu, Z.: Observed changes in winter wheat phenology in the North China Plain for 1981–2009, Int. J. Biometeorol., 57, 275–285, 2013.
Xiao, D. P., Moiwo, J. P., Tao, F. L., Yang, Y. H., Shen, Y. J., Xu, Q. H., Liu, J. F., Zhang, H., and Liu, F. S.: Spatiotemporal variability of winter wheat phenology in response to weather and climate variability in China, Mitig. Adapt. Strat. Gl., 20, 1191–1202, 2015.
Yuan, L., Wang, E., Yang, X., and Jing, W.: Contributions of climatic and crop varietal changes to crop production in the North China Plain, since 1980's, Global Change Biol., 16, 2287–2299, 2010.
Zhang, X., Huang, G., Huang, Z., Bian, X., and Jiang, X.: Effects of low temperature on freezing injury of various winter wheat cultivars at different sowing time, Agricultural Science & Technology, 13, 2332–2337, 2012.
Zhang, X., Tang, Q., Zheng, J., Ge, Q., and Mao, R.: Suppression of spring rain by surface greening over North China Plain, Int. J. Climatol., 35, 2752–2758, 2015.
Zhang, X. Z., Tang, Q. H., Zheng, J. Y., and Ge, Q. S.: Warming/cooling effects of cropland greenness changes during 1982–2006 in the North China Plain, Environ. Res. Lett., 8, 024038, https://doi.org/10.1088/1748-9326/8/2/024038, 2013.