the Creative Commons Attribution 4.0 License.
the Creative Commons Attribution 4.0 License.
 | 14 Jan 2021
Variable particle size distributions reduce the sensitivity of global export flux to climate change
Thomas Weber
Jacob A. Cram
Curtis Deutsch
Recent earth system models predict a 10 %–20 % decrease in particulate organic carbon export from the surface ocean by the end of the 21st century due to global climate change. This decline is mainly caused by increased stratification of the upper ocean, resulting in reduced shallow subsurface nutrient concentrations and a slower supply of nutrients to the surface euphotic zone in low latitudes. These predictions, however, do not typically account for associated changes in remineralization depths driven by sinking-particle size. Here we combine satellite-derived export and particle size maps with a simple 3-D global biogeochemical model that resolves dynamic particle size distributions to investigate how shifts in particle size may buffer or amplify predicted changes in surface nutrient supply and therefore export production. We show that higher export rates are empirically correlated with larger sinking particles and presumably larger phytoplankton, particularly in tropical and subtropical regions. Incorporating these empirical relationships into our global model shows that as circulation slows, a decrease in export is associated with a shift towards smaller particles, which sink more slowly and are thus remineralized shallower. This shift towards shallower remineralization in turn leads to greater recycling of nutrients in the upper water column and thus faster nutrient recirculation into the euphotic zone. The end result is a boost in productivity and export that counteracts the initial circulation-driven decreases. This negative feedback mechanism (termed the particle-size–remineralization feedback) slows export decline over the next century by ∼ 14 % globally (from −0.29 to −0.25 GtC yr−1) and by ∼ 20 % in the tropical and subtropical oceans, where export decreases are currently predicted to be greatest. Our findings suggest that to more accurately predict changes in biological pump strength under a warming climate, earth system models should include dynamic particle-size-dependent remineralization depths.
- Article
(6342 KB) - Full-text XML
-
Supplement
(2689 KB) - BibTeX
- EndNote


A key mechanism that controls the partitioning of carbon dioxide (CO2) between the atmosphere and ocean is the biological pump, in which CO2 is fixed into phytoplankton organic matter via photosynthesis and is then exported from the surface to the deep ocean as sinking particles (e.g., Ducklow et al., 2001). Decomposition of this particulate organic carbon (POC) in the ocean interior maintains a reservoir of respired CO2 that is sequestered out of contact with the atmosphere, thus exerting an important control on long-term atmospheric CO2 concentrations and global climate (e.g., Martínez-García et al., 2014; Passow and Carlson, 2012; Sarmiento and Siegenthaler, 1992). Carbon exported out of the surface euphotic zone also fuels the metabolism of organisms in the mesopelagic zone, sustaining economically and socially important fisheries, as well as ecologically important zooplankton and micronekton communities (e.g., Boyd et al., 2019; Friedland et al., 2012). POC export is also an important driver of dissolved oxygen concentrations in the water column. Where sinking POC fluxes are particularly high and supply of oxygen via physical transport is low, enhanced bacterial degradation of particles can deplete available oxygen and create hypoxic or even suboxic conditions in which many organisms cannot survive (e.g., Deutsch et al., 2015, 2020; Hofmann and Schellnhuber, 2009). Given the critical role of POC export in driving ocean carbon sequestration, the global climate system, fisheries productivity, and dissolved oxygen availability, there is a growing need to better understand how export will respond to future climate warming.
Recent earth system models (ESMs) that are part of the Coupled Model Intercomparison Project 5 (CMIP5) predict decreases in global export production (defined as the sinking POC flux at 100 m) of ∼ 10 %–20 % by 2100 (Bopp et al., 2013; Cabré et al., 2015a) and ∼ 30 % by 2300 (Moore et al., 2018). In many of these models, primary production and subsequent carbon export are largely limited by the physical supply of nutrients to the surface ocean, which is predicted to slow with future warming (Cabré et al., 2015a; Fu et al., 2016; Laufkötter et al., 2015; Moore et al., 2018). Mechanisms driving this nutrient supply slowdown include (i) surface warming-induced stratification of the water column, which will shoal winter mixed layers, limit vertical exchange, and “trap” nutrients in the ocean interior (Bopp et al., 2013; Cabré et al., 2015a; Capotondi et al., 2012; Moore et al., 2018), and (ii) a weakening of the trade winds, which will reduce upwelling rates and vertical nutrient supply in tropical oceans (Bopp et al., 2001; Collins et al., 2010), as well as lateral Ekman-driven nutrient supply into the subtropics (Letscher et al., 2016).
Changes in the POC flux itself, however, also have the potential to modulate nutrient supply to the surface ocean and therefore impact export. Because particles release nutrients when they decompose, the depth scale of particle remineralization determines the proximity of these nutrients to the surface and their resupply rate to the euphotic zone (Kwon et al., 2009; Yamanaka and Tajika, 1996). Shallow remineralization in mesopelagic waters, especially above the permanent pycnocline, drives rapid nutrient recirculation to the surface; nutrients remineralized in deeper waters, on the other hand, can take hundreds of years to re-emerge at the surface (Martin et al., 1987; Matsumoto, 2007b). This raises the possibility of feedback loops in which changes in particle remineralization depth might either dampen (negative feedback) or enhance (positive feedback) circulation-driven decreases in primary production and export. For instance, increasing ocean temperatures may speed up bacterial remineralization rates (Cavan et al., 2019; Cram et al., 2018; John et al., 2014; Laufkötter et al., 2017; Marsay et al., 2015; Matsumoto, 2007a) and enhance recycling of nutrients near the surface, which would dampen physically driven decreases in surface nutrient concentrations and result in a negative feedback on export. Oxygen concentrations, on the other hand, are predicted to decrease with future warming (Bopp et al., 2002; Cabré et al., 2015b; Keeling et al., 2010; Long et al., 2016; Matear and Hirst, 2003; Schmidtko et al., 2017) and slow bacterial remineralization and zooplankton-mediated particle disaggregation rates (Cavan et al., 2017; Devol and Hartnett, 2001; Hartnett and Devol, 2003; Laufkötter et al., 2017; Van Mooy et al., 2002). This would result in deeper particle remineralization and further exacerbate circulation-driven nutrient supply decreases, leading to a positive feedback on export production. A decrease in mineral ballasting and protection of particles with ocean acidification may also feedback negatively on export decreases by shoaling remineralization depths (Hofmann and Schellnhuber, 2009).
Future changes in sinking-particle size may also lead to strong feedbacks on export. Recent work has shown that particle size, through its influence on sinking speed (Alldredge and Gotschalk, 1988; Smayda, 1971), plays a paramount role in determining remineralization length scales and carbon transfer efficiency to depth (Cram et al., 2018; Kriest and Oschlies, 2008; Weber et al., 2016). Potential mechanisms that could drive changing particle sizes include changes in underlying phytoplankton community structure and organic matter packaging processes at higher trophic levels. Whatever the mechanism, the direction and magnitude of the particle-size–remineralization feedback in a warming ocean will depend on how particle sizes change as export declines in the future. If the export decline is associated with a shift towards larger organic particles that sink more quickly, remineralization depths will deepen and further reduce surface nutrient supply and export in a positive feedback. If, on the other hand, export decreases are associated with a shift towards smaller sinking particles, shallower remineralization will allow for faster nutrient recirculation to the surface and dampen stratification-driven decreases in nutrient supply and export in a negative feedback.
Despite the potential importance of particle size, CMIP5 models do not resolve dynamic particle size distributions and so cannot fully capture biological feedbacks driven by particle size (Laufkötter et al., 2016; Le Quéré et al., 2005; Séférian et al., 2020). More complex models that resolve aggregation–disaggregation transformations and/or particle size distributions have been developed (Gehlen et al., 2006; Jokulsdottir and Archer, 2016; Kriest and Oschlies, 2008; Niemeyer et al., 2019; Schwinger et al., 2016), but they have not been used to examine the interactions between climate change, particle size, and export production. Furthermore, parameters and processes in most previous models are not constrained by observations of particle size distributions or the relationships between particle size and export.
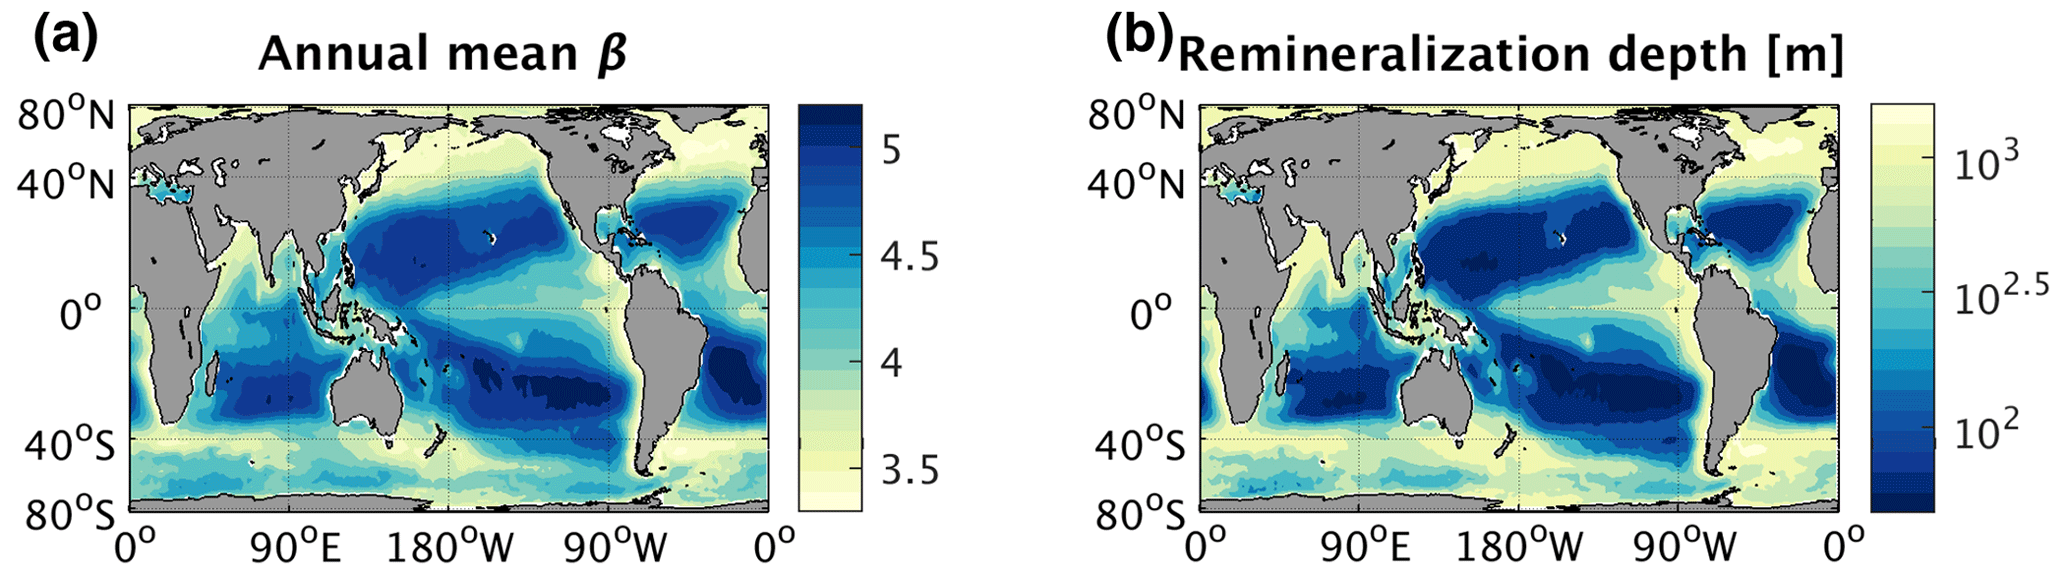
Figure 1Global maps of annual mean (a) particle size distribution slope (β) measured by remotely sensed particulate backscatter and reproduced from Kostadinov et al. (2009) and (b) remineralization depth, defined as the depth at which particulate flux out of the euphotic zone is decreased by a factor of e assuming β in (a) at the surface, calculated using a particle remineralization and sinking model (PRiSM, described in Sect. 2.1.1). Larger values of β are associated with smaller particles, while smaller values of β are associated with larger particles.
Here we combine new data analyses and idealized model experiments to assess the potential impact of feedbacks induced by dynamic particle-size-dependent remineralization depths on future export changes. We use remotely sensed datasets to empirically constrain the relationship between export rates and sinking-particle size and then implement this relationship in a 3-D global biogeochemical model that resolves particle size distributions. Together, these analyses reveal a negative particle-size–remineralization (PSR) feedback effect on export, suggesting that ESMs lacking these interactions may overestimate the decrease in ocean carbon export during the 21st century.
2.1 Ocean biogeochemical and particle remineralization model
2.1.1 Model setup
We quantified the particle size remineralization (PSR) feedback using an idealized ocean biogeochemical model, which comprises a simple nutrient cycle (DeVries et al., 2014) embedded within the observationally constrained Ocean Circulation Inverse Model (OCIM) (DeVries, 2014). OCIM assimilates passive and transient tracer data to generate an annual mean circulation that realistically reproduces water mass distributions and ventilation rates at 2∘ horizontal resolution on 24 vertical layers. The circulation rates are stored in a transport matrix (A) that quantifies physical exchanges between every grid cell in our model. Thus, all physical (advective and diffusive) fluxes of tracer X in our model are represented by the matrix–vector product A∗[X]. OCIM has previously been used successfully for high-fidelity simulation of nutrients (DeVries, 2014) and oxygen (DeVries and Weber, 2017) and does not suffer from the equatorial biases often evident in dynamical models with the same resolution. Nutrient cycling comprises phytoplankton phosphate () uptake and export as sinking organic particles out of the surface ocean (< 75 m), particle remineralization in the subsurface (> 75 m), and production and decomposition of dissolved organic phosphorus (DeVries et al., 2014). Nutrient concentrations in the ocean interior represent the sum of preformed nutrients, transported from regions of incomplete utilization in the ocean surface, and the accumulated product of particulate and dissolved organic matter remineralization.
Vertical particle fluxes are simulated by the 1-D mechanistic Particle Remineralization and Sinking Model (PRiSM) (DeVries et al., 2014). PRiSM computes particle flux profiles as a function of particle size distribution at the surface, microbial remineralization rate, and empirical relationships between particle size, mass, and sinking velocity. These empirical relationships are in some cases derived from measurements of sinking phytoplankton and in other cases from those of sinking particles or porous aggregates. PRiSM therefore implicitly assumes that phytoplankton and smaller particles behave similarly as they sink down the water column.
Particle abundances in the ocean tend to follow a power-law distribution, with many more small particles than large ones (Boss et al., 2001; Buonassissi and Dierssen, 2010; Cael and White, 2020; Sheldon et al., 1972; White et al., 2015). Thus, PRiSM produces particles in the surface euphotic zone (< 75 m) following a power-law size spectrum, in which the log of the particle number density declines linearly with the log of the particle diameter, between the sizes of 20 and 2000 µm in diameter. Accordingly, the relative abundance of small and large particles is controlled by the slope of the spectrum on a log–log scale (β): a shallower slope (small β) indicates a greater proportion of large particles relative to small ones, while a steeper slope (large β) indicates a smaller proportion of large particles. This surface particle size distribution slope is defined via specification of a global β map. Previous work with PRiSM has demonstrated that spatial variations in annual mean β of the magnitude observed by satellite can lead to large differences in particle fluxes at depth (Fig. S1 in the Supplement; Fig. 1a and b; DeVries et al., 2014).
Following export, the simulated particle size spectrum evolves through the water column due to remineralization and size-dependent sinking. Remineralization is represented by first-order mass loss from particles, such that each individual particle shrinks and sinks more slowly with depth. Because smaller, slower-sinking particles reside for longer within any given depth interval and therefore have more time to remineralize, they are preferentially lost from the particle population over depth. A constant rate of microbial respiration is used, optimized to fit global in situ phosphate distributions (DeVries et al., 2014). There are therefore no temporal changes in bacterial respiration due to warming, for example, which allows us to isolate changes in export that stem from the PSR feedback alone. While PRiSM has recently been expanded to include temperature and oxygen effects on bacterial respiration and remineralization (Cram et al., 2018), as well as to represent particle disaggregation (Bianchi and Weber et al., 2018), here we use the original version described in DeVries et al. (2014), which can be solved analytically and has previously undergone parameter optimization to best fit global phosphate distributions.
The model configuration and parameter values used here are outlined in Table S1 in the Supplement. Further model details and validation are described in DeVries et al. (2014). Here we extend the original PRiSM-enabled biogeochemical model in DeVries et al. (2014) in two important ways:
-
The original diagnostic nutrient uptake term (i.e., nutrient-restoring production) is replaced by the prognostic organic matter production scheme developed by Weber and Deutsch (2012) with minor parameter updates (see Table S2 in the Supplement). This scheme calculates phytoplankton growth, in terms of uptake, as a function of observed annual mean temperatures (Locarnini et al., 2010) and solar radiation levels (Rossow and Schiffer, 1999), along with modeled []. This formulation successfully reproduces the broad spatial patterns of surface [] (Weber and Deutsch, 2012), suggesting that our model accurately captures the balance between preformed and remineralized nutrients in the ocean interior. Of the organic phosphorus produced by uptake in the euphotic zone, 10 % is routed to dissolved organic matter, which circulates and degrades over time, with the remainder being routed to particulate organic matter (Thornton, 2014). An empirical, spatially variable relationship between particulate C-to-P ratios and phosphate concentrations (Galbraith and Martiny, 2015) is then used to convert particulate organic phosphorus fluxes into POC fluxes.
-
We add the ability to enable or disable the PSR feedback by implementing an empirical relationship that links changes in particle size spectrum slope (β) to changes in carbon export out of the surface ocean (< 75 m) (see Sect. 2.1.2).
2.1.2 Model representation of the PSR feedback
When the PSR feedback is disabled within our model, circulation-driven changes in the nutrient supply to the euphotic zone (see Sect. 2.3) will lead to changes in POC export, but β (and therefore particle remineralization depths) remains constant over time. With the PSR feedback enabled, any change in POC export is accompanied by a change in β, the direction and magnitude of which is specified using the empirical relationships discussed in Sect. 2.2. We note that, by design, this modeling approach makes no assumptions about the mechanisms driving shifts in the particle size distribution; rather, it merely stipulates that β changes in tandem with POC export, in a manner that is consistent with observations. Mathematically, β is updated at a given grid point as follows between time steps t and t+1:
where E is the modeled export rate and is the empirical time-independent fractional change in satellite-derived β (βsat) per change in satellite-derived time-mean normalized export (En, sat, defined as absolute export divided by time-mean export calculated between 1997 and 2010 at a given grid point – see Sect. 2.2.2 for details).
To disable the feedback, is set equal to zero so that modeled β remains constant over time. To enable the feedback, is set equal to the linear temporal regression coefficient between βsat and En, sat, which is computed from remotely sensed time series of the two variables at each grid cell over the global ocean (Sect. 2.2). Thus, when the feedback is enabled, changes in modeled β over time are dictated by the magnitude of modeled export change as well as the strength and direction of the relationship between observed β and export, which can vary spatially.
2.2 Empirical analyses of phytoplankton size, β, and export from satellite data
Because the strength and direction of our modeled PSR feedback depend strongly on the observed relationship between β and export ( in Eq. 1), we sought a robust empirical constraint on this relationship. Section 2.2.1 and 2.2.2 describe the global satellite-derived time series maps of β and export used here, respectively. Section 2.2.3 then describes how these monthly-mean β and export maps are used to compute a range of possible global relationships.
2.2.1 Global satellite-derived particle size distribution map
Global 1∕12∘ by 1∕12∘ monthly maps of β observed by the satellite Sea-viewing Wide Field-of-view Sensor (SeaWiFS, in operation from September 1997 to December 2010) were downloaded from ftp://ftp.oceancolor.ucsb.edu//pub/org/oceancolor/MEaSUREs/PSD/ (last access: 2 May 2012). These β maps were derived from remotely sensed particulate backscattering measurements, which were previously validated with in situ near-surface Coulter counter measurements (Kostadinov et al., 2009). To enable more efficient computation, we reduced the resolution of the original monthly β maps to 1∘ by 1∘ via spatial averaging. At this resolution, time-mean β ranges from ∼ 3.3 in coastal high-latitude regions (where high nutrient conditions favor larger phytoplankton) to ∼ 5.3 in the subtropics (where low macronutrient concentrations favor small phytoplankton) (Fig. 1a). Although β from Kostadinov et al. (2009) is computed only over particle sizes ranging from 0.002 to 63 µm, we assume that the same β continues to hold for larger particles up to 2000 µm (the largest particle size in PRiSM), as supported by prior research (e.g., Durkin et al., 2015). Ideally, measurements of β would be computed over the same particle size range as simulated in PRiSM (20–2000 µm); however, such a dataset was not readily available. Indeed, the Kostadinov et al. (2009) observations of β were the only readily available measurements spanning long enough timescales, with high enough spatiotemporal resolution to compute the relationships between β and POC export needed for this study.
2.2.2 Global satellite-derived export maps
POC export was computed as the product of net primary production (NPP) and the particle export ratio (export/NPP or e ratio), both of which can be derived from satellite data. To create a range of plausible global monthly export maps, we multiplied all possible permutations of the three monthly NPP estimates and e-ratio algorithms, yielding nine distinct monthly datasets of global export spanning > 10 years (Fig. S2 in the Supplement). All three sets of monthly satellite NPP maps were downloaded from http://sites.science.oregonstate.edu/ocean.productivity/ (last access: 2011) and derived from SeaWiFS observations processed through the following algorithms: (i) the chlorophyll-based Vertically Generalized Production Model (VGPM) (Behrenfeld and Falkowski, 1997); (ii) the Eppley-VGPM model (VGPME), containing a modified relationship between temperature and production compared to the original VGPM (Carr et al., 2006); and (iii) the Carbon-based Production Model (CbPM), which uses particulate backscatter-derived carbon rather than chlorophyll to measure phytoplankton biomass (Behrenfeld et al., 2005). The three e-ratio algorithms we used were the ecosystem-model-based relationship of Laws et al. (2000) and the empirical relationships of Dunne et al. (2005) and Laws et al. (2011). All three of these algorithms link e ratio to sea surface temperature (SST) and NPP. The in situ, statistically interpolated SST dataset used here was NOAA's Extended Reconstructed Sea Surface Temperature (ERSST) v3b, downloaded from https://www1.ncdc.noaa.gov/pub/data/cmb/ersst/v3b/netcdf/ (last access: 13 November 2020) (Smith et al., 2008). Euphotic zone depths needed to compute D2005 e ratios were derived from SeaWiFS-sensed chlorophyll concentrations (downloaded from the same website as NPP) according to Eq. (10) in Lee et al. (2007). As with β, all variables were computed and stored on a 1∘ by 1∘ grid over the entirety of the SeaWiFS period (September 1997–December 2010, i.e., 160 months long).
In the following computations of (Sect. 2.2.3), we employed all nine sets of global monthly export maps to propagate uncertainty into our assessment of the PSR feedback. When computing most likely values, we weighted the nine export map sets according to how well each map set's annual mean export matches in situ oxygen and mass-balance-based observations (Emerson, 2014; Reuer et al., 2007) within each region defined here (Table S3 in the Supplement; see Weber et al. (2016) for derivation of weighting factors). Figure 2 shows the weighted annual mean carbon export flux over the nine map sets, as well as the regions used for weighting, which are delineated based on biogeochemical characteristics such as sea surface temperature and surface phosphate concentrations (Weber et al., 2016). The Atlantic and Pacific oceans are divided into warm subtropics dominated by smaller picophytoplankton (STA, STP), cold subarctic regions dominated by blooms of larger microphytoplankton in the north (NA, NP), and cool tropical upwelling zones dominated by larger phytoplankton in the east (ETA, ETP). The Indian Ocean is kept intact (IND), while the Southern Ocean is divided into the productive, diatom-dominated Subantarctic zone (SAZ) and the high-nutrient, low-chlorophyll Antarctic zone (AAZ). The Indian Ocean region (IND) did not contain a sufficient number of in situ observations of export to enable comparison to the satellite export maps, so all nine maps are weighted equally there.
2.2.3 Regionally variable empirical β vs. export relationships
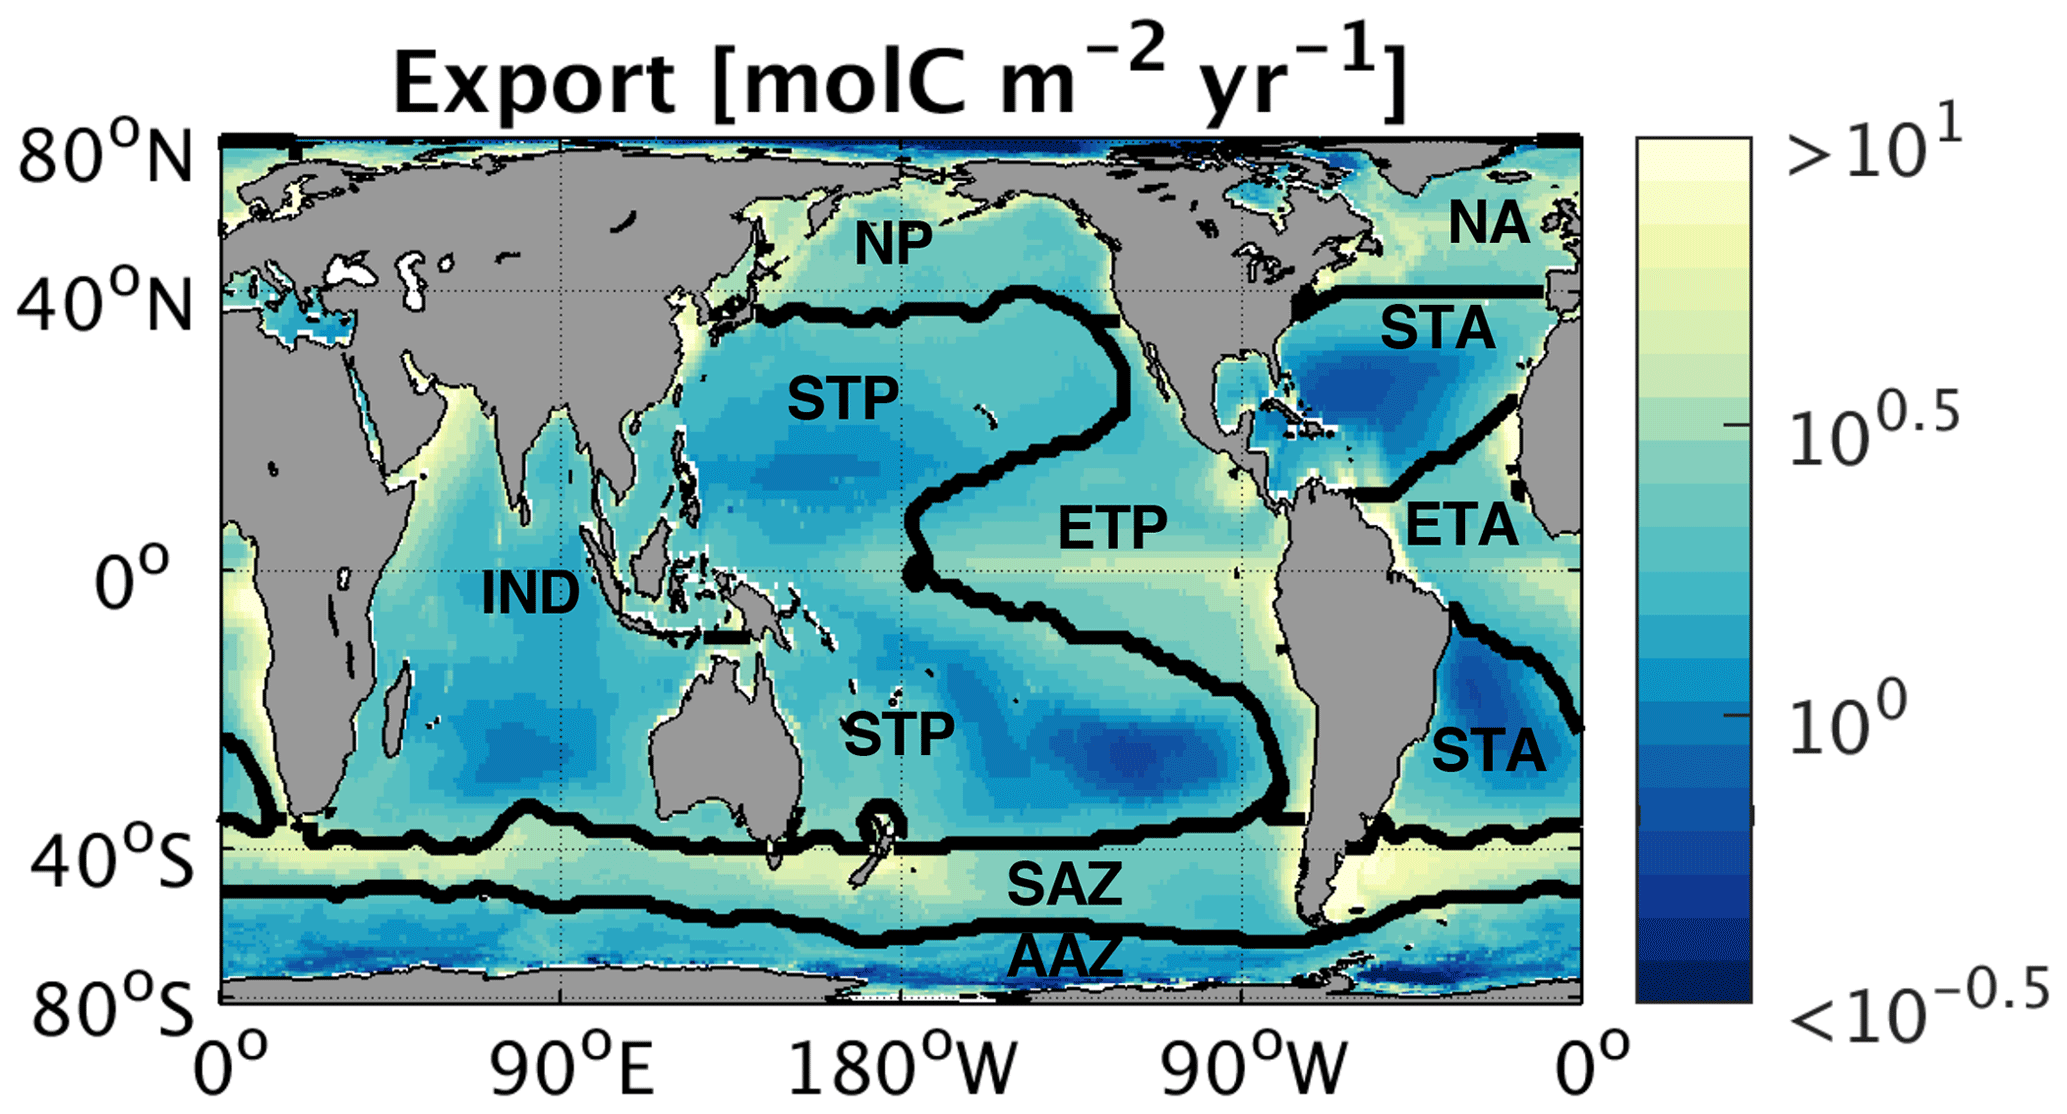
Figure 2Global map of regionally weighted annual mean export, averaged over nine different export maps (detailed in Sect. 2.2.2). Contours indicate biogeochemical regions used for weighting and spatial averaging.
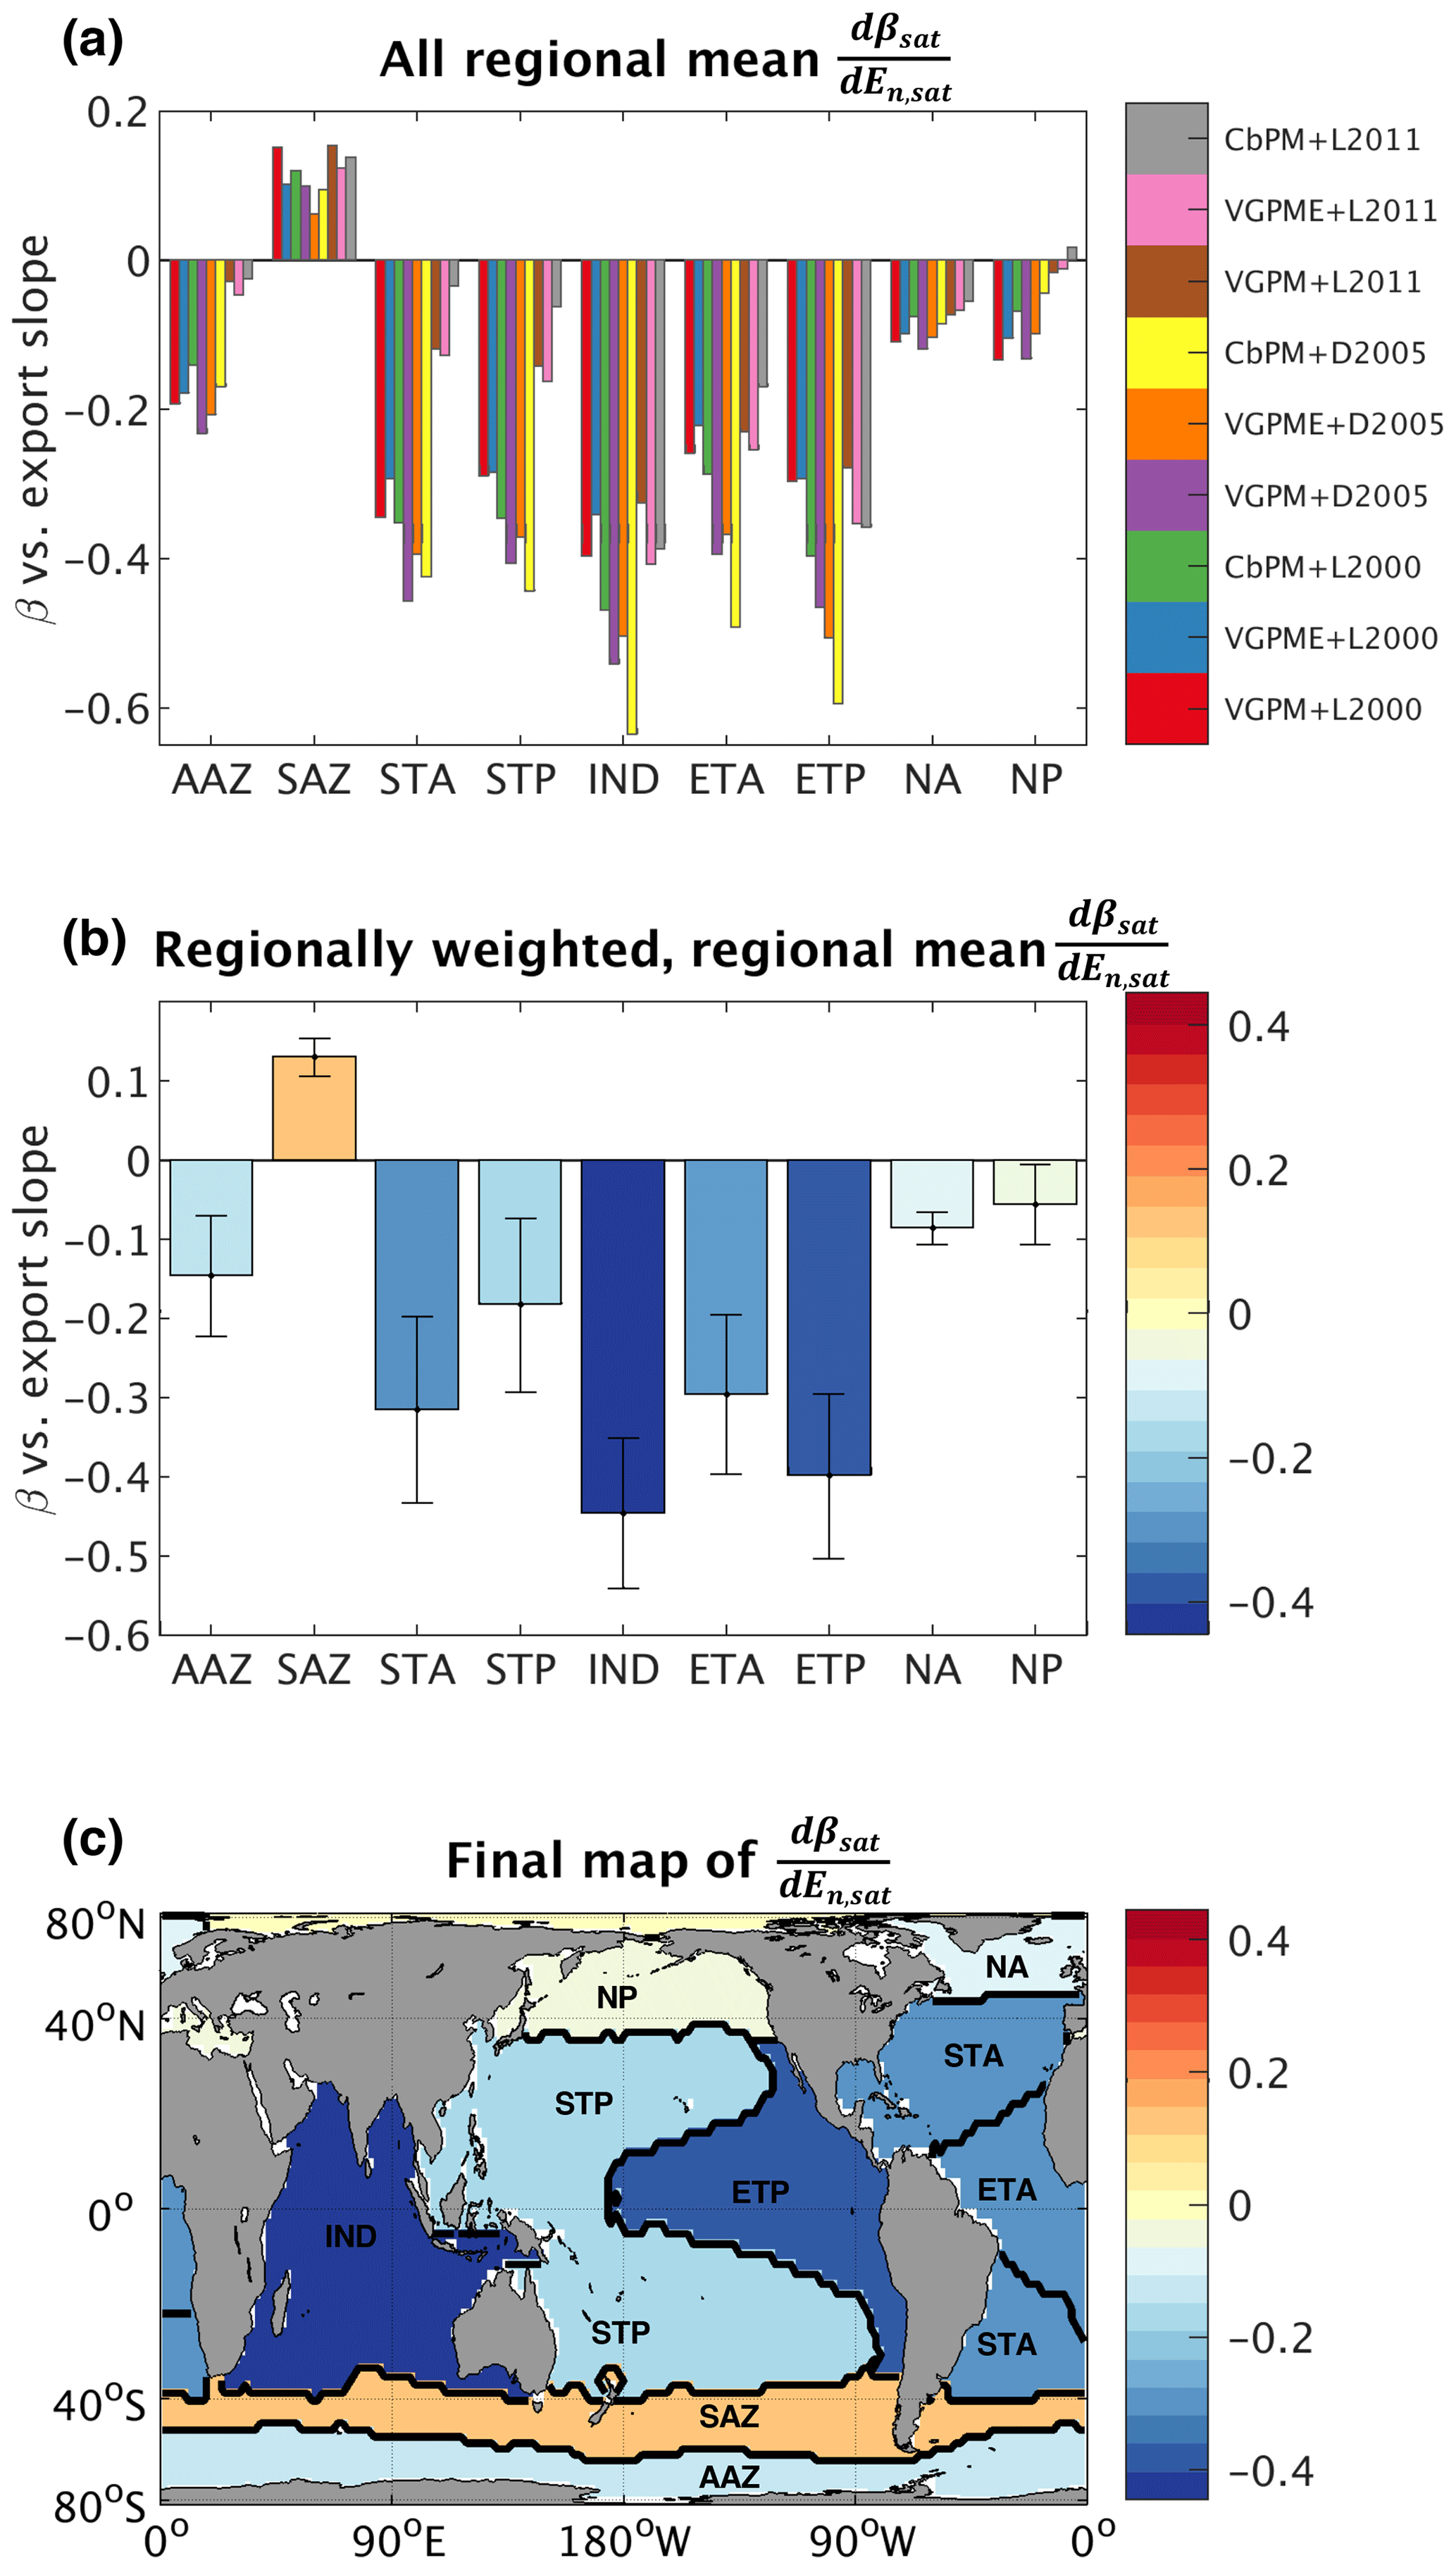
Figure 3(a) All regional mean changes in particle size slope for a given change in time-mean normalized export, values (i.e., spatial averages of each map in Fig. S3 over regions shown in Fig. 2), colored by corresponding export map. Color bar labels indicate the NPP and e-ratio algorithms used to generate the given export map (see Sect. 2.2.2 for full descriptions of the algorithms). NPP algorithm key: VGPM represents the Vertically Generalized Production Model (VGPM) (Behrenfeld and Falkowski, 1997); VGPME represents the Eppley-VGPM model (Carr et al., 2006); and CbPM represents the Carbon-based Production Model (Behrenfeld et al., 2005). E-ratio algorithm key: L2000 represents Laws et al. (2000); D2005 represents Dunne et al. (2005); and L2011 represents Laws et al. (2011). (b) Regionally weighted mean , averaged over the nine possibilities for each region shown in Fig. 3a. Error bars represent 1 weighted SD. (c) Global map of regionally variable used in model runs with the PSR feedback on.
We quantified the empirical relationship between β and export individually for each grid cell by extracting the monthly time series (September 1997–December 2010) of β and normalized export (En) from the satellite products described above and then applying linear regression. This process produced a spatially variable, 1∘ by 1∘ global map of the best-fit linear slopes () relating β and En. To capture the range of plausible maps, we repeated this process for each of the nine export products to generate nine distinct global maps (Fig. S3 in the Supplement). To smooth out small-scale noise and illuminate large-scale patterns in the β vs. export relationship, we spatially averaged the slopes over the ocean biogeochemical regions defined in Fig. 2 (Fig. 3a). Finally, we set all grid points within a given region equal to that region's weighted (Table S3; Sect. 2.2.2) mean value (Fig. 3b) to generate the final map used in our PSR feedback-on runs (Fig. 3c).
To quantify the sensitivity of to the choice of export map used, we computed upper- and lower-bound maps by adding and subtracting 1 SD (error bars in Fig. 3b) to the weighted regional mean values. Conducting PSR feedback-on runs using upper- and lower-bound maps establishes the range of PSR feedback strengths we can reasonably expect from our model forced with empirically derived relationships.
2.3 Model runs to simulate future ocean warming and quantify the PSR feedback effect
To represent present-day conditions, we run a baseline simulation with modern-day circulation rates to steady state. To simulate increased water column stratification and reduced vertical exchange due to warming in an idealized way, we uniformly and instantaneously reduce circulation and diffusion rates by 10 % throughout the ocean (i.e., we multiply the tracer transport matrix A by 0.9, such that circulation patterns remain unchanged, but the absolute exchange rates between all grid cells are scaled down by 10 %). For comparison, observations show that the Atlantic Meridional Overturning Circulation (AMOC) has weakened by about 15 % since the mid-20th century due to anthropogenic warming (Caesar et al., 2018), while ESMs project that AMOC will weaken by 11 %–34 % over the 21st century, depending on the chosen radiative forcing scenario (11 % assumes the “high mitigation” RCP2.6 scenario, while 34 % assumes the “business-as-usual” RCP8.5 scenario) (Collins et al., 2019). A 10 % decrease in circulation rates is therefore a relatively conservative estimate of the effects of anthropogenic warming. Although modulation of ocean circulation rates in response to climate change will be more complicated and variable than the uniform 10 % decrease applied here (e.g., Toggweiler and Russell, 2008), we seek only a simple, idealized way to approximate the reduced surface nutrient supply that is expected in a warmer future ocean. Although we use a simplified representation of future changes in ocean circulation, the exact same simplified representation is implemented in both PSR feedback-on and feedback-off simulations. We are thus isolating the effects of the PSR feedback from the effects of the circulation change. It is therefore not unreasonable to assume that our calculated PSR feedback strength would be comparable to that computed from a physical model with a more complex representation of future circulation changes, as long as that model also applied identical circulation changes in PSR feedback-on and feedback-off scenarios.
To quantify the impact of the global PSR feedback on export changes with future warming, we run the slower-circulation rate simulation with and without the PSR feedback effect enabled. In feedback-off runs, β is set equal to annual mean values (Fig. 1a) for the entire duration of the run. In feedback-on runs, β is initially set equal to annual mean values but is allowed to change according to Eq. (1), with defined as in Fig. 3c for the entire duration of the run. Additional feedback-on runs were conducted using the upper- and lower-bound maps (described in Sect. 2.2.3).
All of the above-described runs were also repeated with 10 % faster circulation rates to determine whether the PSR feedback strength is symmetrical with regard to the direction of circulation change. Within all runs, β is constrained to realistically remain between 2 and 6.5 at all grid points, although these extremes are rarely reached. We run all experimental simulations for 100 years (initializing with conditions from the end of the present-day spin-up) to study near-future changes in export production and nutrient distributions and to facilitate comparison with 100-year changes projected by the state-of-the-art earth system models discussed above.
3.1 Empirically derived spatially resolved β vs. export relationships
No matter which export datasets are used (Sect. 2.2), satellite-derived β and export are strongly negatively correlated (Figs. 3, S3 and S4 in the Supplement). The vast majority of variance in both β and export occurs over seasonal (rather than interannual or longer) timescales; therefore, the coincident seasonal cycles of β and export account for much of the relationship between the two variables (Figs. S3 and S4). Because β and export are negatively correlated, export tends to be high when β is small (particles are large) and low when β is large (particles are small). These empirical findings are in agreement with Cram et al. (2018), who observed that large particles tend to comprise a larger fraction of the sinking flux where productivity and carbon export are high.
While our analysis does not provide mechanistic insights into the roots of the negative correlation between β and export, a plausible explanation for the direction of this relationship is as follows. Low-nutrient conditions select for small phytoplankton with high surface area to volume ratios, such that smaller phytoplankton are more abundant in low-nutrient conditions (Litchman et al., 2007). In these nutrient-limited regions of the ocean, productivity and export are also suppressed. Thus, nutrient availability controls both the export rate and the size structure of the phytoplankton community over much of the ocean. Assuming that phytoplankton size in turn controls the size of sinking particles, as suggested by past research (e.g., Guidi et al., 2007, 2008, 2009), the availability of nutrients then ultimately controls sinking-particle size as well. This potentially explains why small particles (large β) are associated with reduced export rates and low-nutrient conditions, while large particles (small β) are associated with increased export rates and high-nutrient conditions.
This line of reasoning may also explain why more nutrient-limited regions (i.e., the subtropics) exhibit especially strong negative relationships between β and export (Figs. 3, S3 and S4); both β and export are likely predominantly driven (in opposite directions) by surface nutrient supply in these areas. Where light or temperature take over as the dominant factors limiting phytoplankton productivity, the relationships between β and export are weakened, as in the higher-latitude regions (Figs. 3, S3 and S4). The counterintuitive weakly positive relationship between β and export in the Subantarctic zone (SAZ) of the Southern Ocean (Fig. S5 in the Supplement) is in line with findings from Lam and Bishop (2007), who showed that areas in the Southern Ocean with higher biomass and larger particles at the surface were actually associated with lower rates of export out of the euphotic zone. In these diatom-dominated regions, zooplankton may be more active and have higher particle grazing efficiencies, leading to faster attenuation of particulate carbon fluxes with depth. The unique relationship between β and export in the SAZ is worth further exploration and may be further elucidated by NPP datasets that are specifically calibrated for the Southern Ocean (e.g., Johnson et al., 2013), but this is beyond the scope of the current study.
3.2 An empirical negative global particle-size–remineralization (PSR) feedback
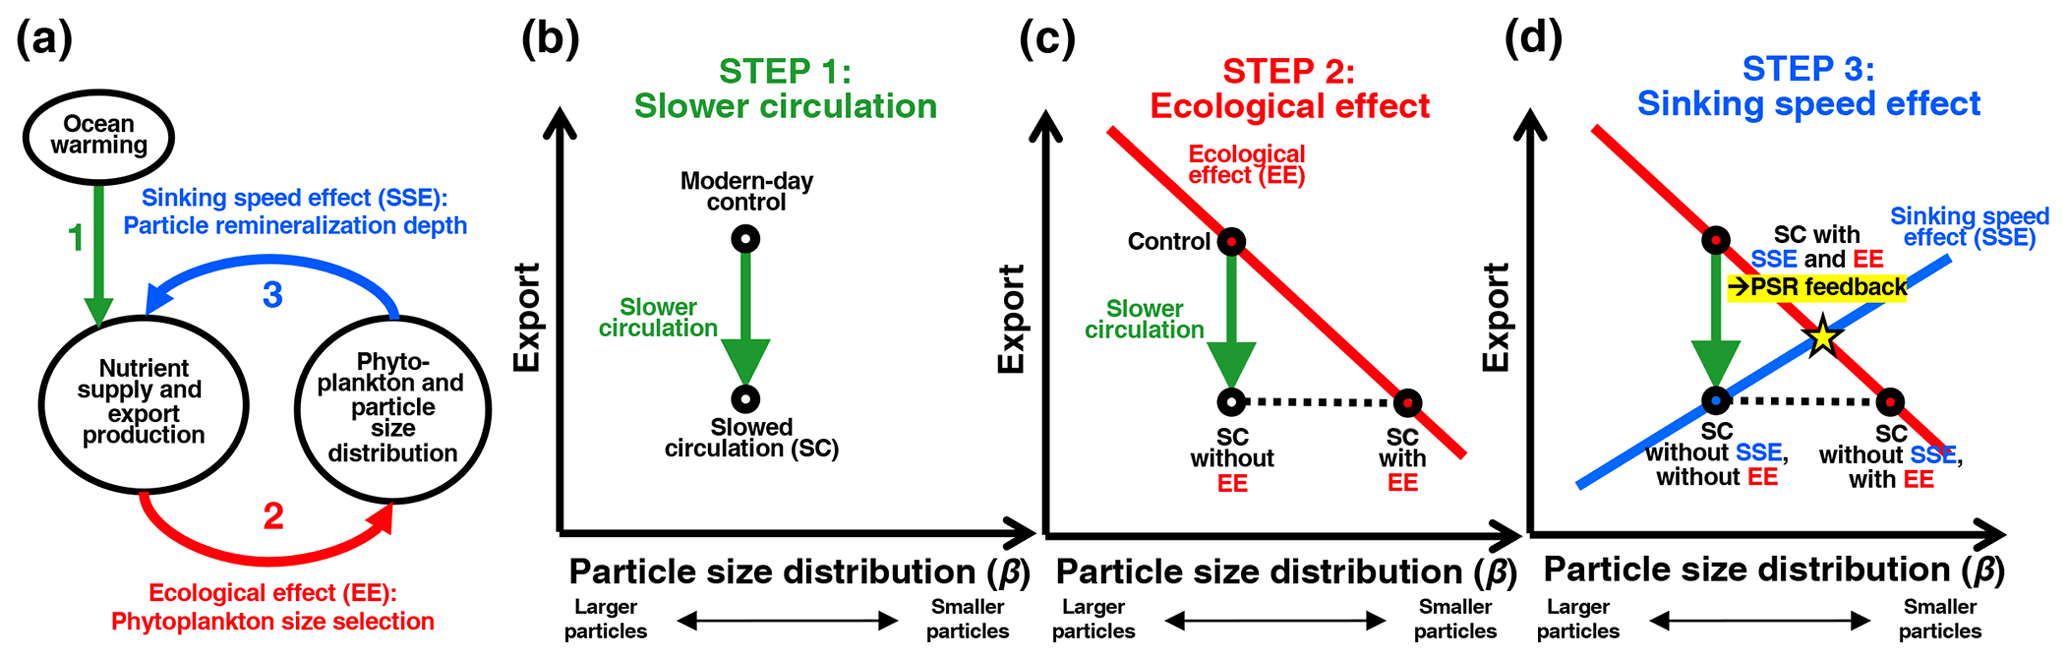
Figure 4(a) Schematic diagram of the particle-size–remineralization (PSR) negative feedback on export production. A change in circulation rates induced by climate change alters surface nutrient supply and subsequent export production (green arrow). Changes in surface nutrient supply also drive changes in phytoplankton and resultant sinking-particle sizes (red arrow). Changes in sinking-particle sizes in turn alter remineralization depth and consequently surface nutrient supply and export (blue arrow). (b) Schematic depicting decreased export production with decreases in circulation rates and surface nutrient supply. (c) Schematic depicting a theoretical relationship between export and β, here termed the phytoplankton size selection ecological effect (EE), in which smaller phytoplankton dominate in low-nutrient low-export conditions. (d) Schematic depicting all previous components of the PSR feedback, in addition to the crucial final component: the particle remineralization depth sinking speed effect (SSE), in which smaller particles tend to get remineralized shallower, leading to a greater recycled surface nutrient supply and therefore greater export.
To determine how the empirically derived relationships between β and export ultimately affect the direction and strength of the PSR feedback effect on a global scale, we must first understand the effects of β on sinking-particle speeds and remineralization depths. Past work has broadly established a positive relationship between particle size and sinking speed in the ocean (Alldredge and Gotschalk, 1988; Smayda, 1971; Iversen and Ploug, 2010) – although there are exceptions to these rules (Cael and White, 2020; Laurenceau-Cornec et al., 2020), particularly in the Southern Ocean (McDonnell and Buesseler, 2010). The characteristic depth scale of particle remineralization is proportional to this sinking speed divided by a microbially mediated remineralization rate (Kwon et al., 2009; McDonnell et al., 2015). Here we define remineralization depth as the depth at which POC flux out of the euphotic zone is reduced by a factor of e or 63 % (i.e., the e-folding depth of the flux) (Fig. 1b). The dominance of smaller sinking particles in the water column results in a shallower remineralization depth, as bacteria have more time to decompose these slow-sinking particles into nutrients and CO2 as they pass through the upper layers of the water column (Bach et al., 2016). Together with the empirical relationships we found between POC export and particle size (Sect. 3.1), this points towards a predominantly negative feedback loop that would dampen the response of POC export to physically induced changes in nutrient supply. In a warming and stratifying ocean, this hypothesized particle-size–remineralization feedback would theoretically proceed through the following steps at any given location, which are illustrated schematically in Fig. 4:
-
Slower circulation (SC) – First, stratification of the water column and slowing trade winds with climate warming will reduce shallow subsurface nutrient concentrations and vertical exchange or upwelling rates. This slows nutrient supply into the euphotic zone, which in turn decreases phytoplankton productivity and resultant export production (Fig. 4a and b, green arrows).
-
Ecological effect (EE) – A decrease in surface nutrient supply also selects for smaller phytoplankton, which presumably leads to a larger proportion of small particles in the export flux. The net result of this ecological effect (EE) (Fig. 4a, red arrow) is captured in a predominantly negative relationship between export and β (Fig. 4c, red line). Constrained by this empirical relationship, changes in export and β under slowed circulation (SC) must fall along the red line in Fig. 4c (“SC with EE” point). In the absence of the ecological effect (i.e., phytoplankton and particle sizes are not affected by changes in the nutrient supply), there is no such requirement and β would remain unchanged under a slowed circulation scenario (“SC without EE” point in Fig. 4c).
-
Sinking speed effect (SSE) – Smaller particles resulting from the ecological response to a reduced nutrient supply would sink more slowly and therefore remineralize shallower in the water column. More regenerated nutrients would then accumulate within shallower waters and thus recirculate more quickly to the surface. In isolation, a shift to smaller particles would therefore ultimately lead to greater surface nutrient availability and larger export rates (Fig. 4a, blue arrow), represented by the positive slope of the blue export-vs.-β line in Fig. 4d. In the presence of this sinking speed effect (SSE), changes in export and β under slowed circulation must fall along the blue sinking speed-related export-vs.-β line (Fig. 4d). In the absence of this sinking speed effect (i.e., particle size does not affect sinking rates or remineralization depths), there is no such requirement, and the initial stratification-induced export decrease would remain unaltered (“SC without SSE, with EE” point in Fig. 4d).
Only in the presence of both the ecological and sinking speed effects does the PSR feedback function in full; in this case, after circulation is slowed, export and β must reach a new steady state at the intersection of the red and blue lines (“SC with SSE and EE” yellow star in Fig. 4d). Thus, the overall decrease in POC export would be smaller than predicted from decreased circulation rates and surface nutrient supply alone. That is, the net effect of phytoplankton selection and particle-size-dependent remineralization depths provide a negative feedback on, or dampening of, changes in export, due to the empirically derived negative relationship between β and export. While we have assumed that phytoplankton community structure is the underlying mechanism linking POC export and particle size, the PSR feedback would operate in the same direction discussed here if another mechanism were ultimately responsible for the empirical negative relationship between these two factors. Though the above description focuses on export decreases under decreased circulation rates, the PSR feedback would result in an analogous dampening of export increases under increased circulation rates and surface nutrient supply.
3.3 Predicted export changes in the presence of the global negative PSR feedback effect
In this section, we discuss how predicted future changes in export production and mesopelagic POC flux differ between biogeochemical model simulations with and without the PSR feedback effect applied globally. Section 3.3.1 examines global mean changes in export with and without the PSR feedback applied globally. Section 3.3.2 and 3.3.3 then zoom into zonal and regional mean export changes with and without the global PSR feedback. Finally, Sect. 3.3.4 examines changes in deeper mesopelagic POC fluxes with and without the global PSR feedback.
3.3.1 Predicted global mean export changes with and without the global PSR feedback
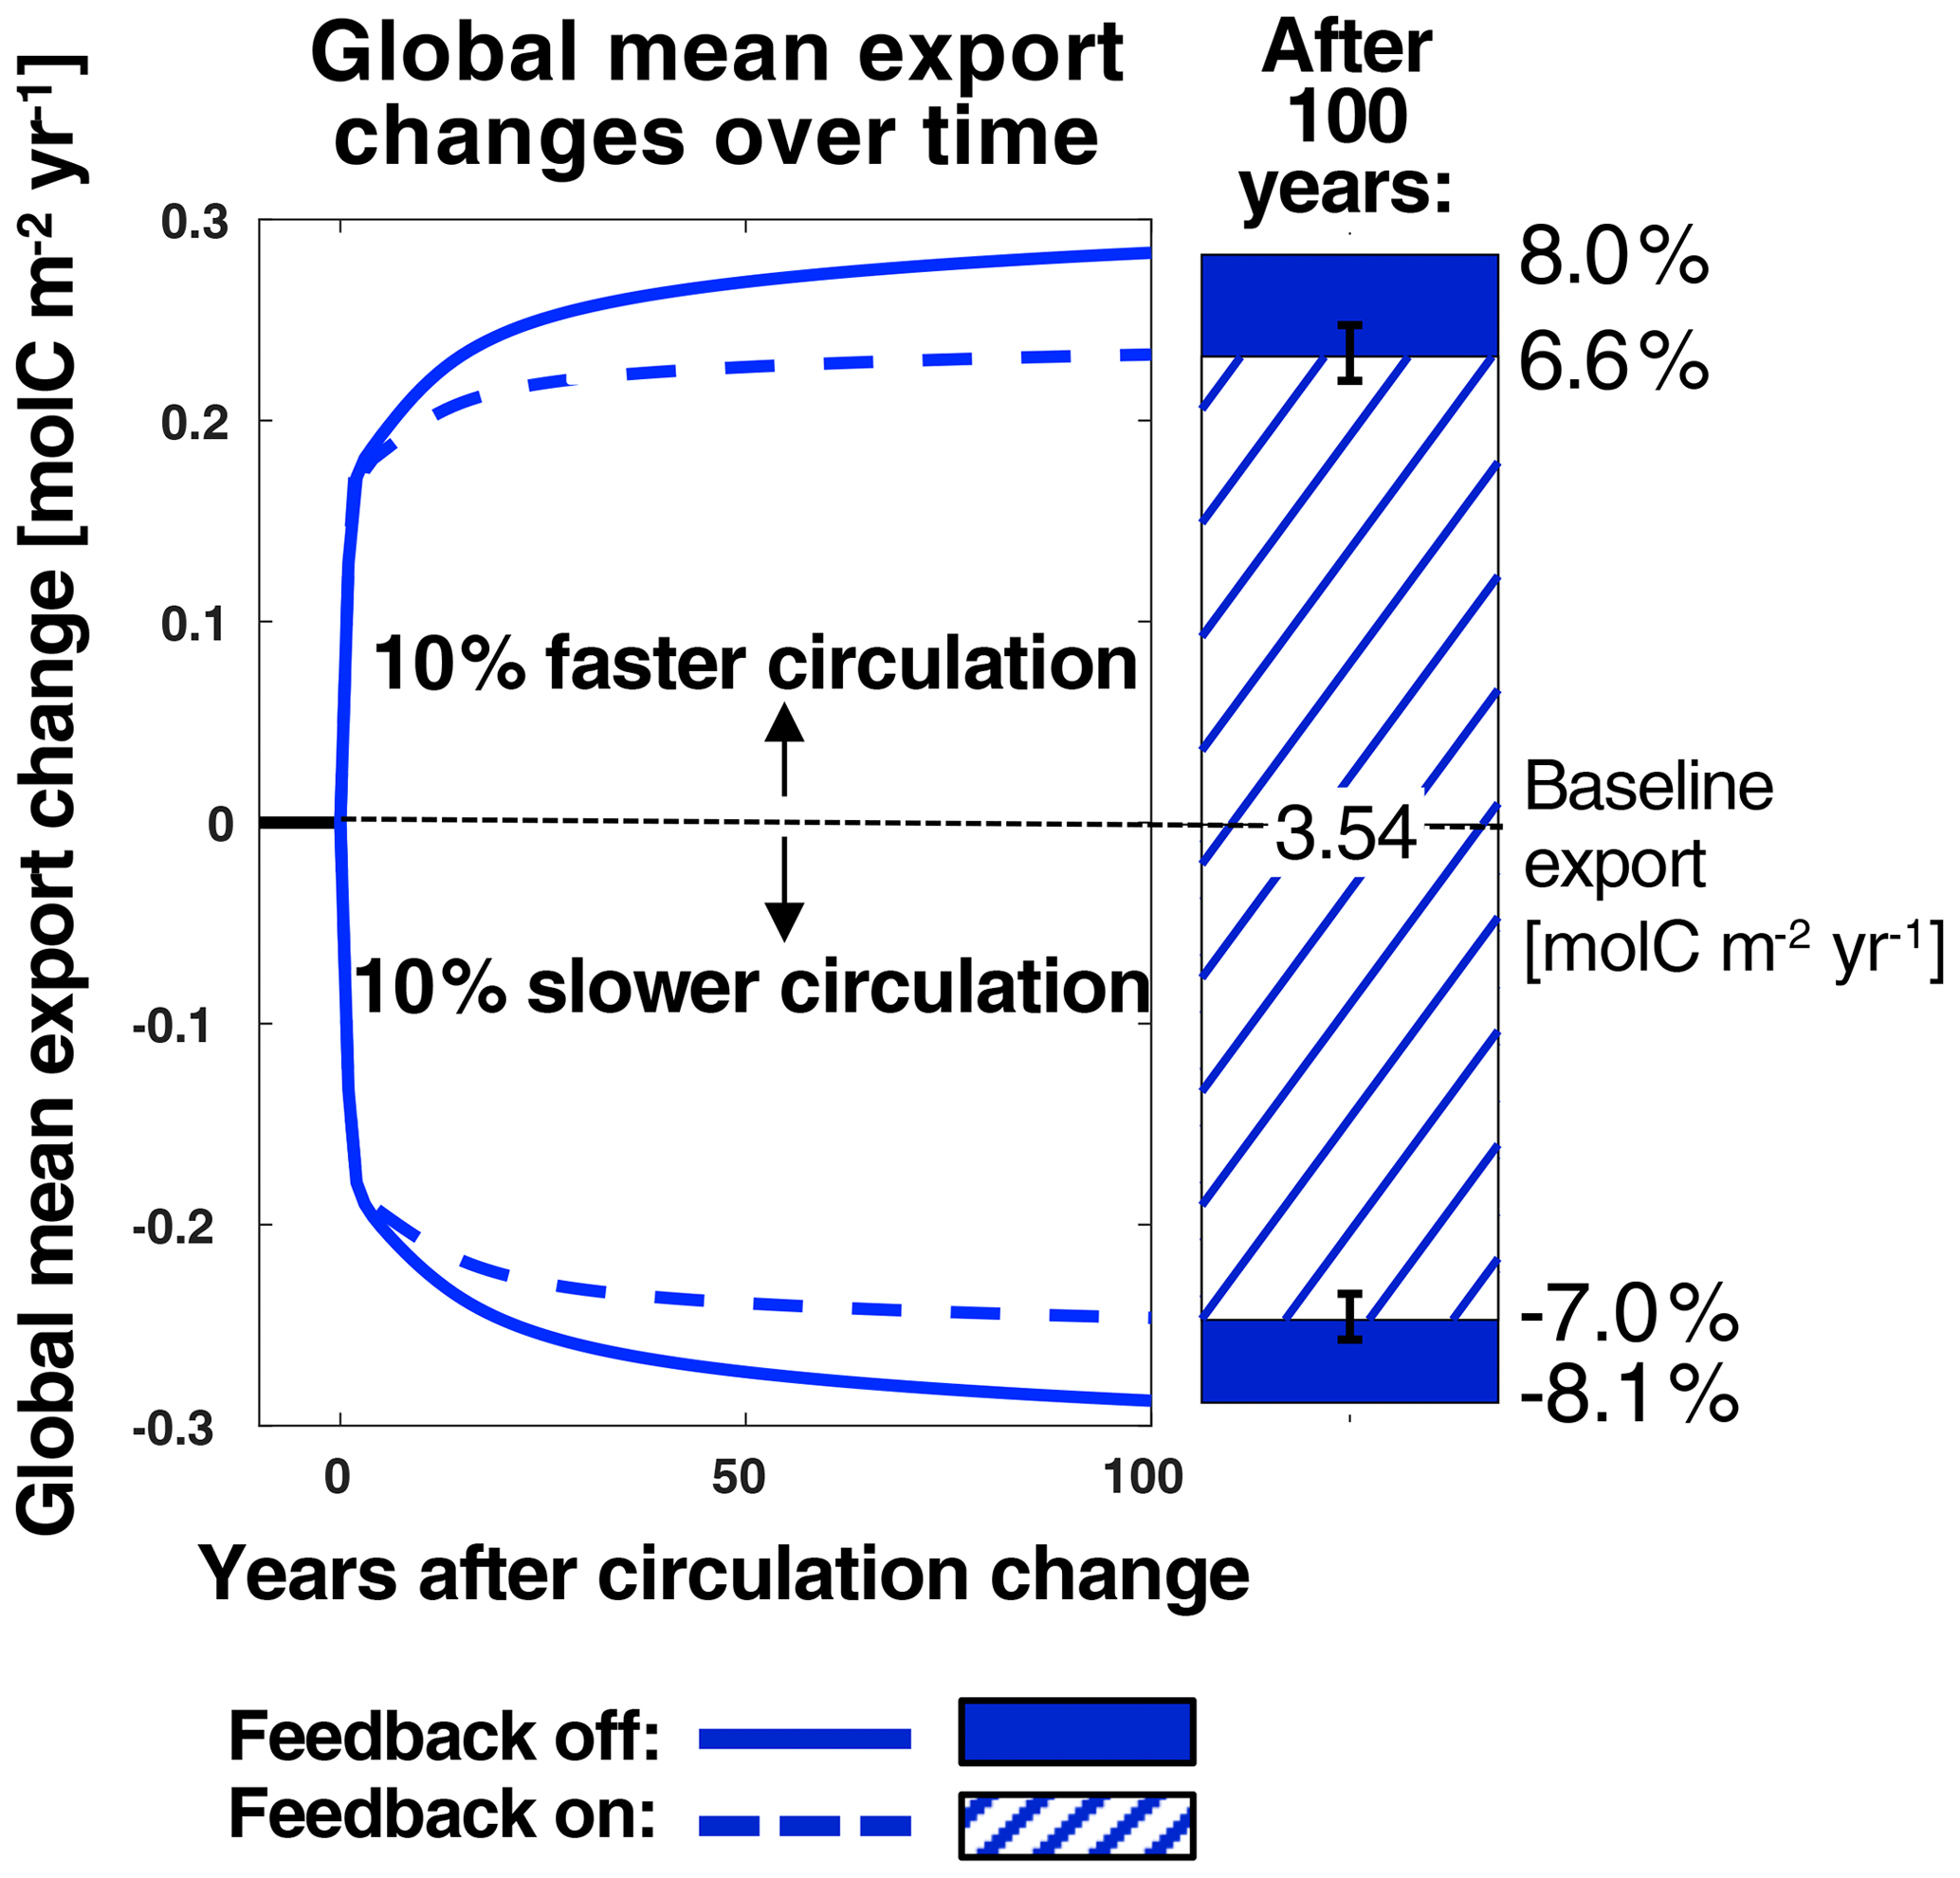
Figure 5Changes in global mean export over time from baseline conditions (current-day circulation, ran to steady state) after increasing or decreasing circulation rates by 10 %. Dashed and solid lines represent runs with the PSR feedback turned off and on, respectively. The bars on the right show absolute changes in global mean export from the baseline case 100 years after changing circulation rates. Corresponding relative changes (calculated as absolute changes from the baseline over the baseline mean) are listed in black. Global mean export in the baseline case is listed on the zero line. Hatching and solid patterns represent runs with the PSR feedback turned off and on, respectively. The error bars represent export decreases generated when employing the upper- and lower-bound maps described in Sect. 2.2.3.
To examine the global strength of the PSR feedback within our model under an idealized climate change scenario, we compare global mean export changes over time in the PSR feedback-on and feedback-off runs after a 10 % decrease in circulation rates (Fig. 5, comparing slower-circulation dashed and solid lines). In both the feedback-on and feedback-off cases, instantaneously decreasing circulation rates reduces surface nutrient supply and immediately leads to a sharp decrease in global mean export of ∼ 0.2 from 3.54 . After this initial plunge, global mean export declines by an additional 0.09 over the next 100 years with the feedback off (for a total decrease of 0.29 or 8.1 %) vs. an additional 0.05 with the feedback on (for a total decrease of 0.25 or 7.0 %) (Fig. 5, slower-circulation lines and bars).
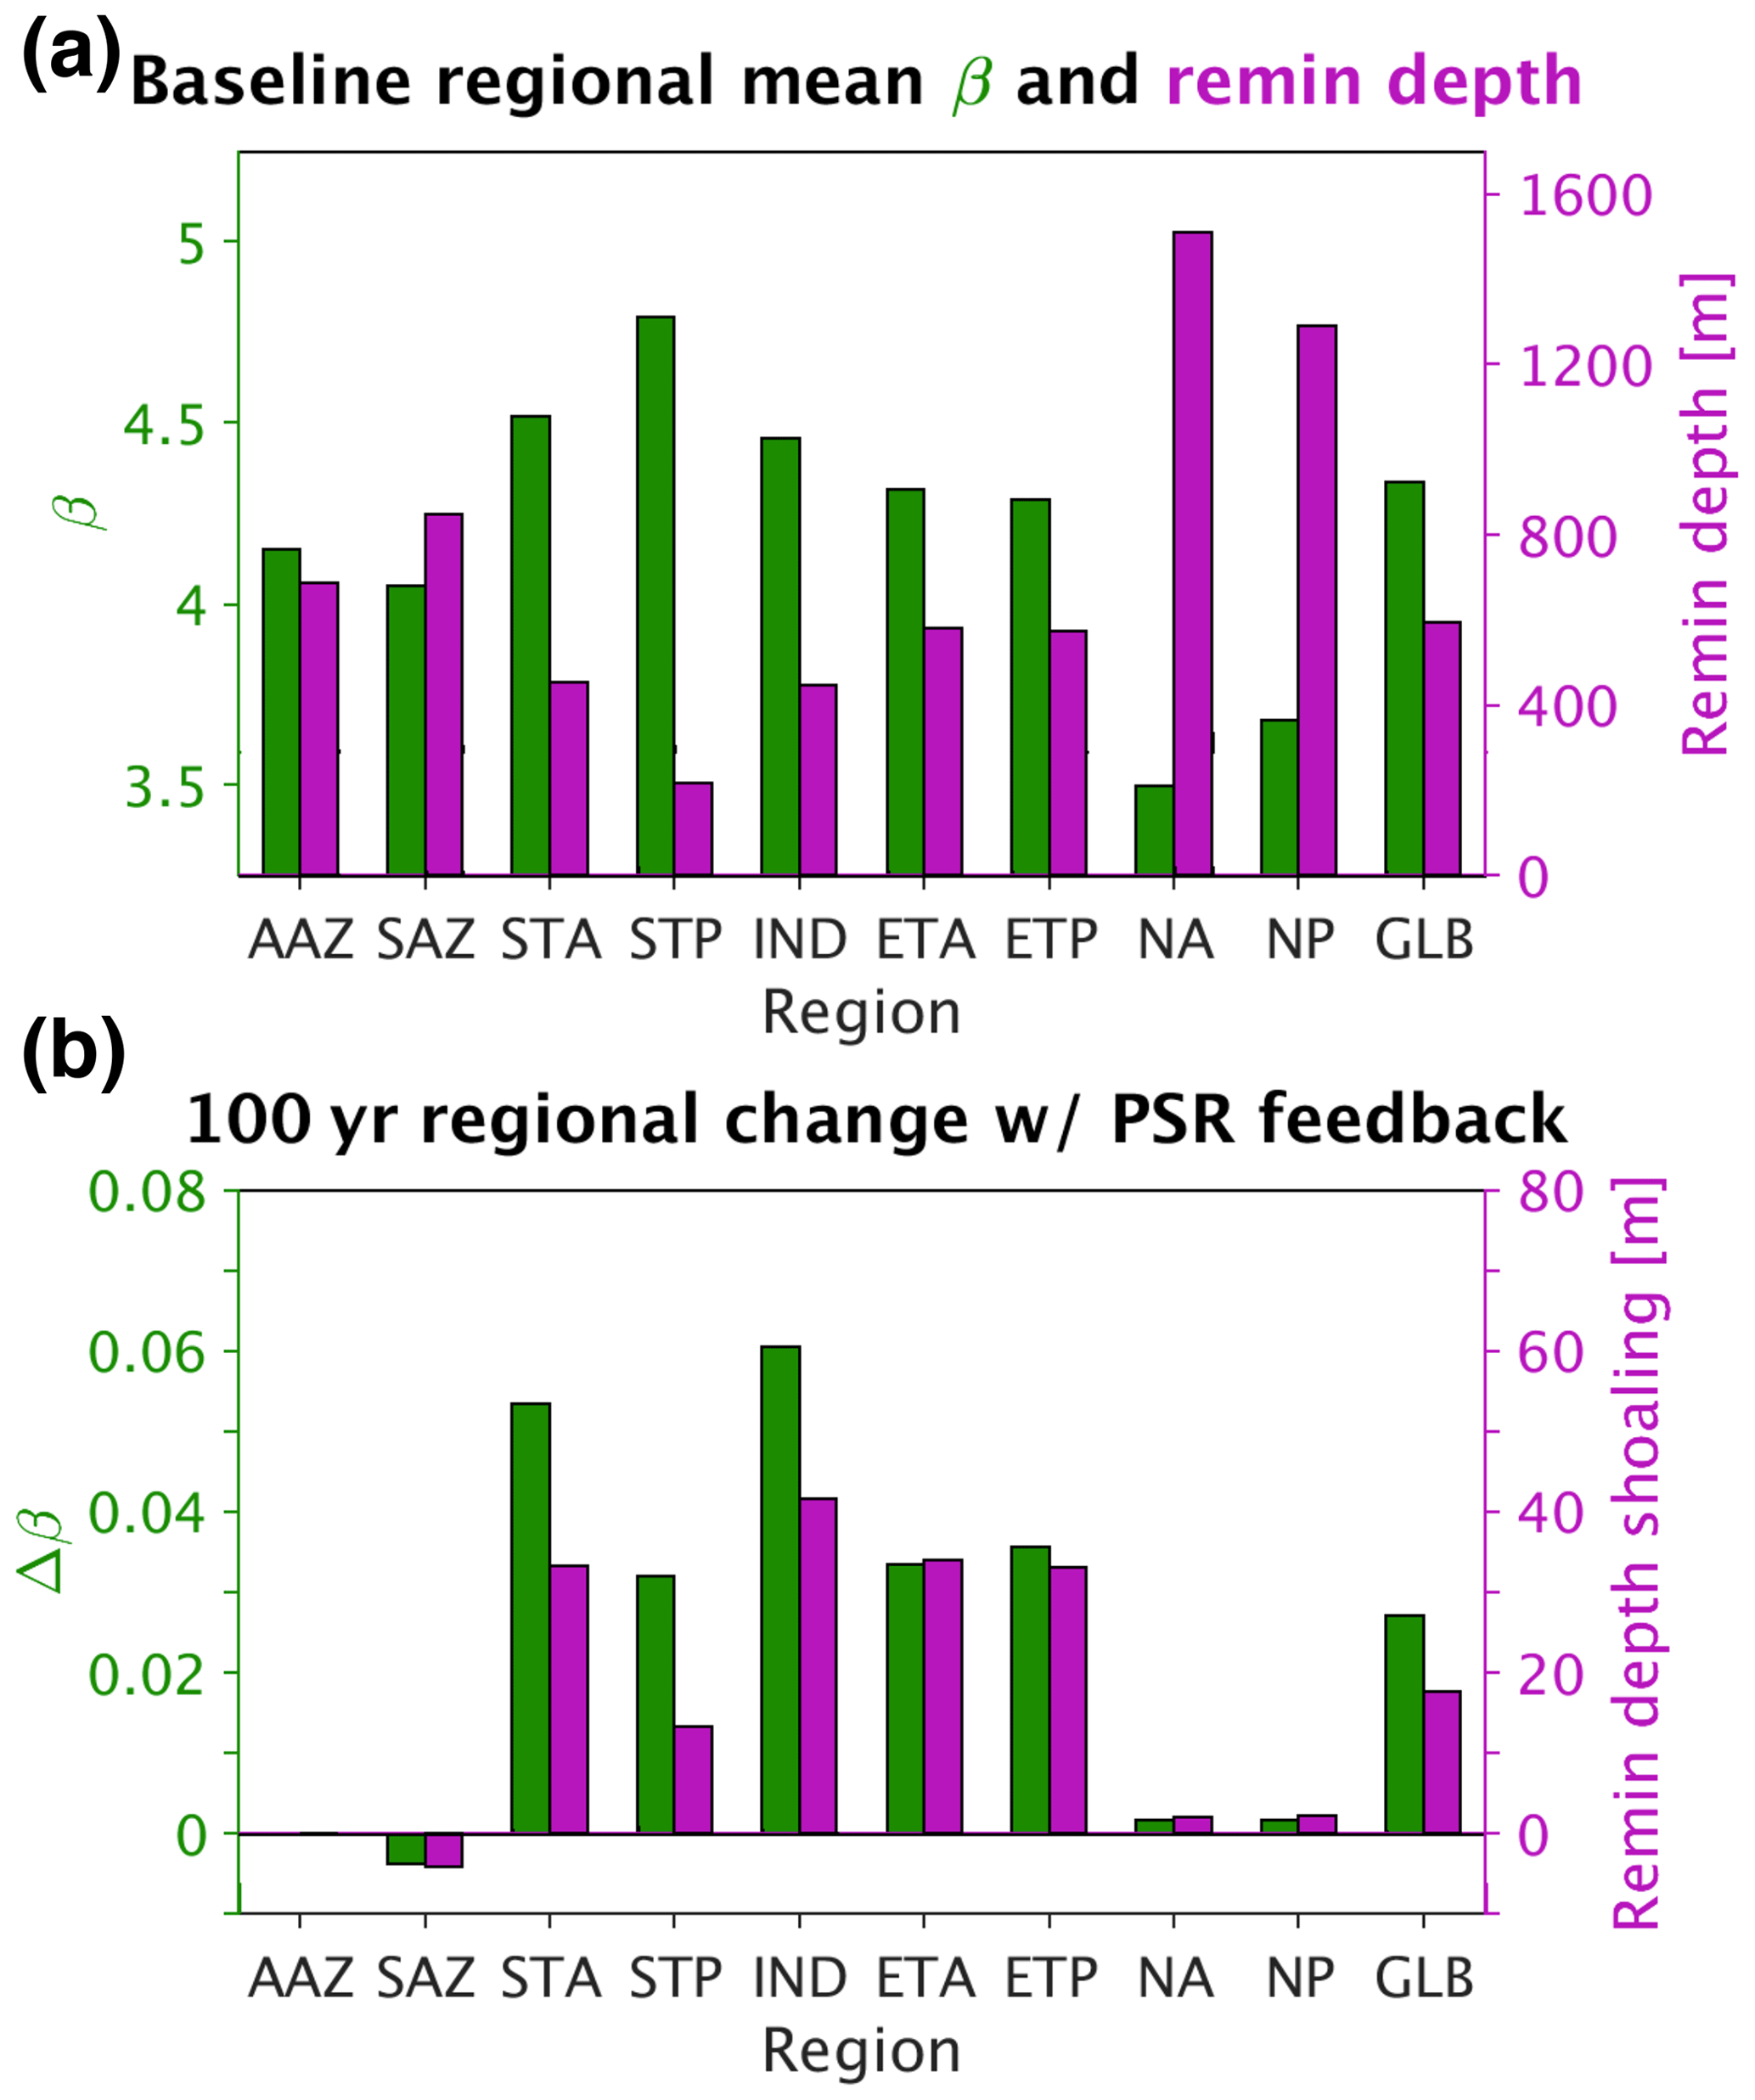
Figure 6(a) Baseline (current-day circulation, ran to steady state) regional mean β (shown in green) and e-folding remineralization (remin) depth (shown in purple). (b) Absolute change in regional mean β (shown in green) and absolute shoaling of regional mean remineralization depth (shown in purple) 100 years after decreasing circulation rates by 10 % with the PSR feedback turned on. GLB stands for global mean.
Turning the PSR feedback on in our model reduced the total 100-year predicted decrease in export by ∼ 14 % relative to the PSR feedback-off scenario (the ratio of the solid colored bar length to the full bar length below zero in Fig. 5. At equilibrium (when global mean export stabilizes ∼ 500 years after decreasing circulation rates), this feedback effect increases to ∼ 16 %. With the feedback turned on, particle sizes shrink and remineralization depths shoal in response to an initial circulation-driven decrease in surface nutrient supply, thereby moderating this initial decrease by keeping more recycled nutrients at the surface. In particular, global mean β increases by 0.03 (from 4.34 to 4.37) under 10 % decreased circulation rates after 100 years with the PSR feedback on (Fig. 6a and b), corresponding to a 17 m global mean shoaling (from 595 to 578 m) of e-folding remineralization depths (Fig. 6b). The greatest regional mean β increase of 0.06 occurs in the Indian Ocean (IND), resulting in a 41 m shoaling of remineralization depths there (Fig. 6b). Results from runs employing upper- and lower-bound maps (defined in Sect. 2.2.3, represented by the error bars in Fig. 4b) lend further support to our findings and indicate that the modeled global PSR feedback effect size is relatively insensitive to the choice of export maps used to compute (Fig. 5, black error bars).
The PSR feedback also dampens the response of global-mean carbon export to an instantaneous increase in ocean circulation rates (Fig. 5). One hundred years after circulation rates are increased by 10 %, global mean carbon export increases from 3.54 by 0.28 (8.0 %) with the feedback off, whereas it increases by ∼ 0.23 (6.6 %) with the feedback on (Fig. 5, faster-circulation lines and bars). Thus, increasing circulation rates by 10 % with the PSR feedback on reduces the 100-year increase in export production by ∼ 18 % (the ratio of the solid colored bar length to the full bar length above zero in Fig. 5). At equilibrium, this feedback effect increases to ∼ 20 %. With the feedback turned on, particle sizes grow and remineralization depths deepen in response to an initial circulation-driven increase in surface nutrient supply, thereby moderating this initial increase by transferring more nutrients to deeper waters where they recirculate more slowly to the surface. In particular, global mean β decreases by 0.03 units (from 4.34 to 4.31) under 10 % increased circulation rates, corresponding to a 20 m global mean deepening (from 595 to 615 m) of e-folding remineralization depths (not shown). The greatest regional mean β decrease of 0.07 occurs in the Indian Ocean (IND), resulting in a 54 m shoaling of remineralization depths there. Compared with the decreased circulation case, absolute changes in remineralization depths are slightly larger under increased circulation rates because remineralization depth changes are more sensitive to variations in β when particles are larger (that is, at smaller values of β). Because remineralization depth changes are greater under increased circulation rates, so too is the global PSR feedback strength (14 % with decreased circulation rates vs. 18 % with increased circulation rates). Again, results from PSR feedback-on runs constrained by upper- and lower-bound maps further support the notion that the PSR feedback size is relatively insensitive to the choice of export maps used to compute (Fig. 5, error bars). Thus, the effect of the PSR feedback is to buffer changes in export production in response to any physical perturbation in nutrient supply, regardless of the direction.
The strength of the PSR feedback also does not depend on the size of circulation rate changes. Indeed, we observed that PSR feedback strength remains constant whether circulation rates are increased or decreased by 10 % or 50 %. Thus, the percentage difference in projected export change between PSR feedback-on and feedback-off cases is relatively uniform even under quite different changes in circulation rates.
3.3.2 Predicted zonal and regional mean export changes without the global PSR feedback
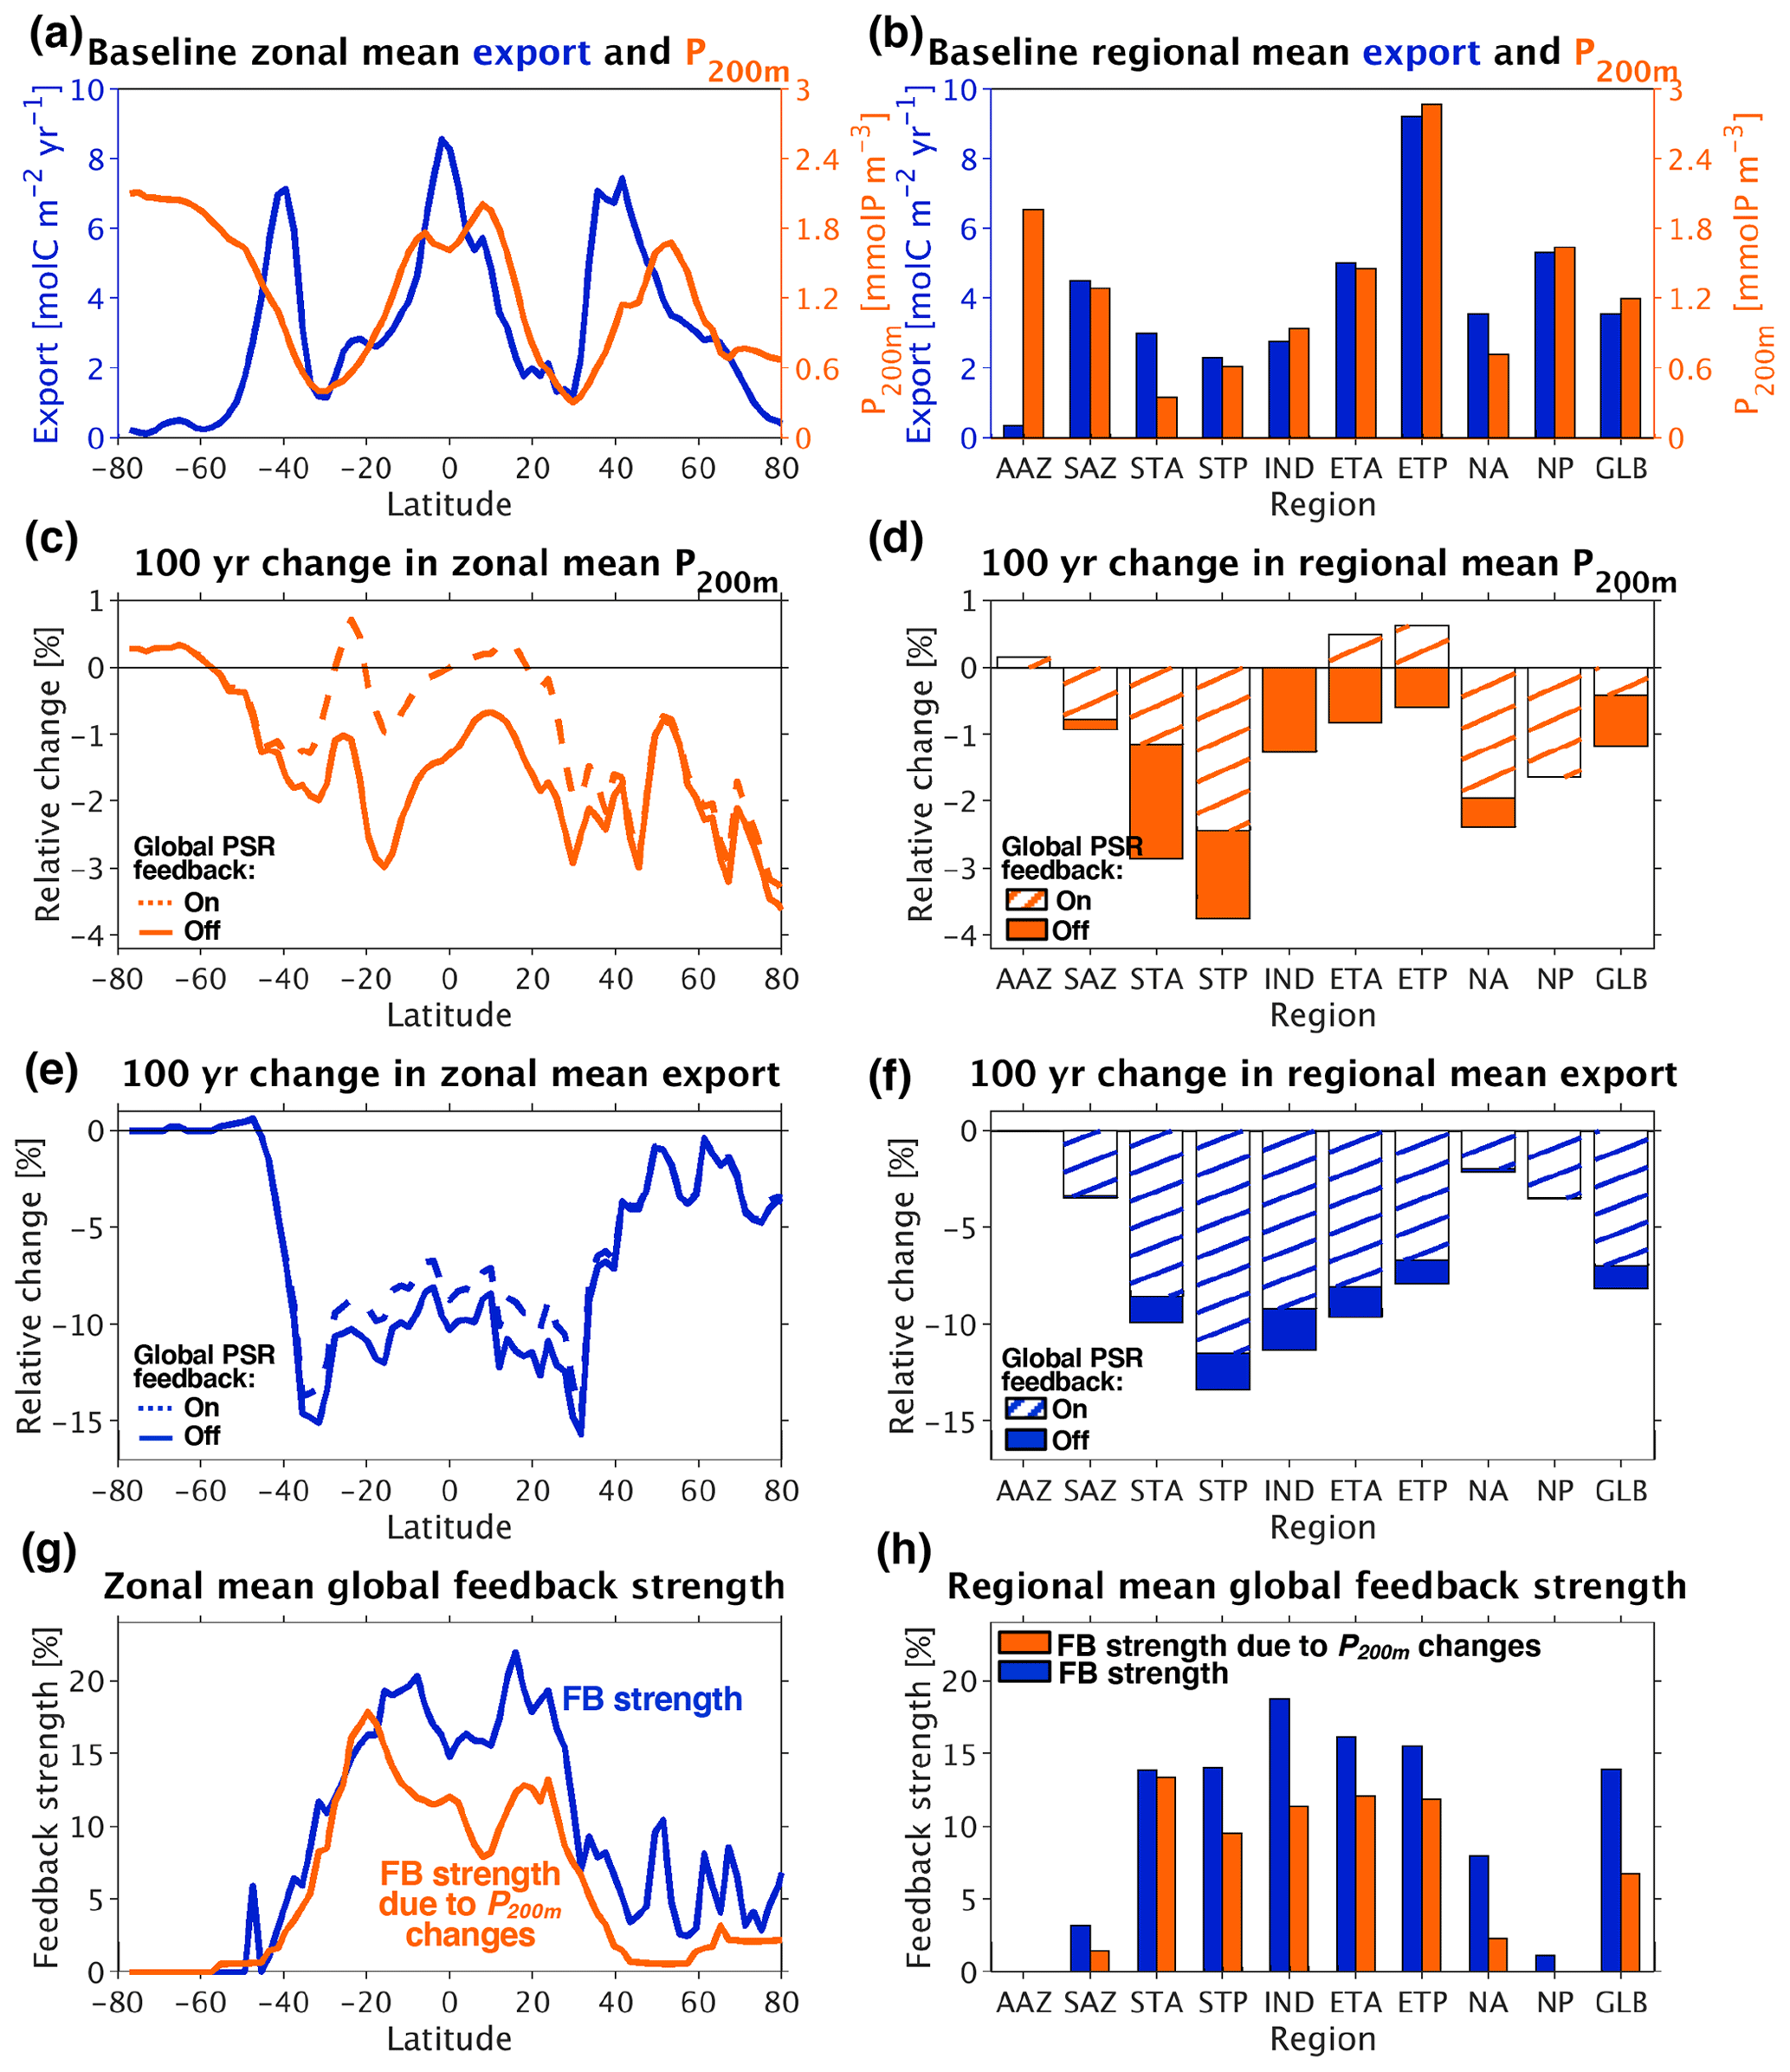
Figure 7(a) Baseline (current-day circulation, ran to steady state) zonal mean export and shallow subsurface (200 m) phosphate concentration. (b) Same as (a) but with regional and global (GLB) rather than zonal means. (c) Relative changes (calculated as absolute changes from the baseline over the baseline mean) in zonal mean phosphate concentration at 200 m depth 100 years after decreasing circulation rates by 10 %. (d) Same as (c) but with regional and global means. (e) Relative changes in zonal mean export 100 years after decreasing circulation rates by 10 %. (f) Same as (e) but with regional and global means. (g) Zonal mean PSR feedback (FB) strength, calculated as the difference in zonal mean export change from baseline between the feedback-off and feedback-on cases divided by the zonal mean export change in the feedback-off case alone (left-hand side of Eq. 4; shown in blue). Predicted zonal mean PSR feedback strength from changes in circulation and shallow subsurface phosphate concentration (right-hand side of Eq. (4); shown in orange). (h) Same as (g) but with regional and global means.
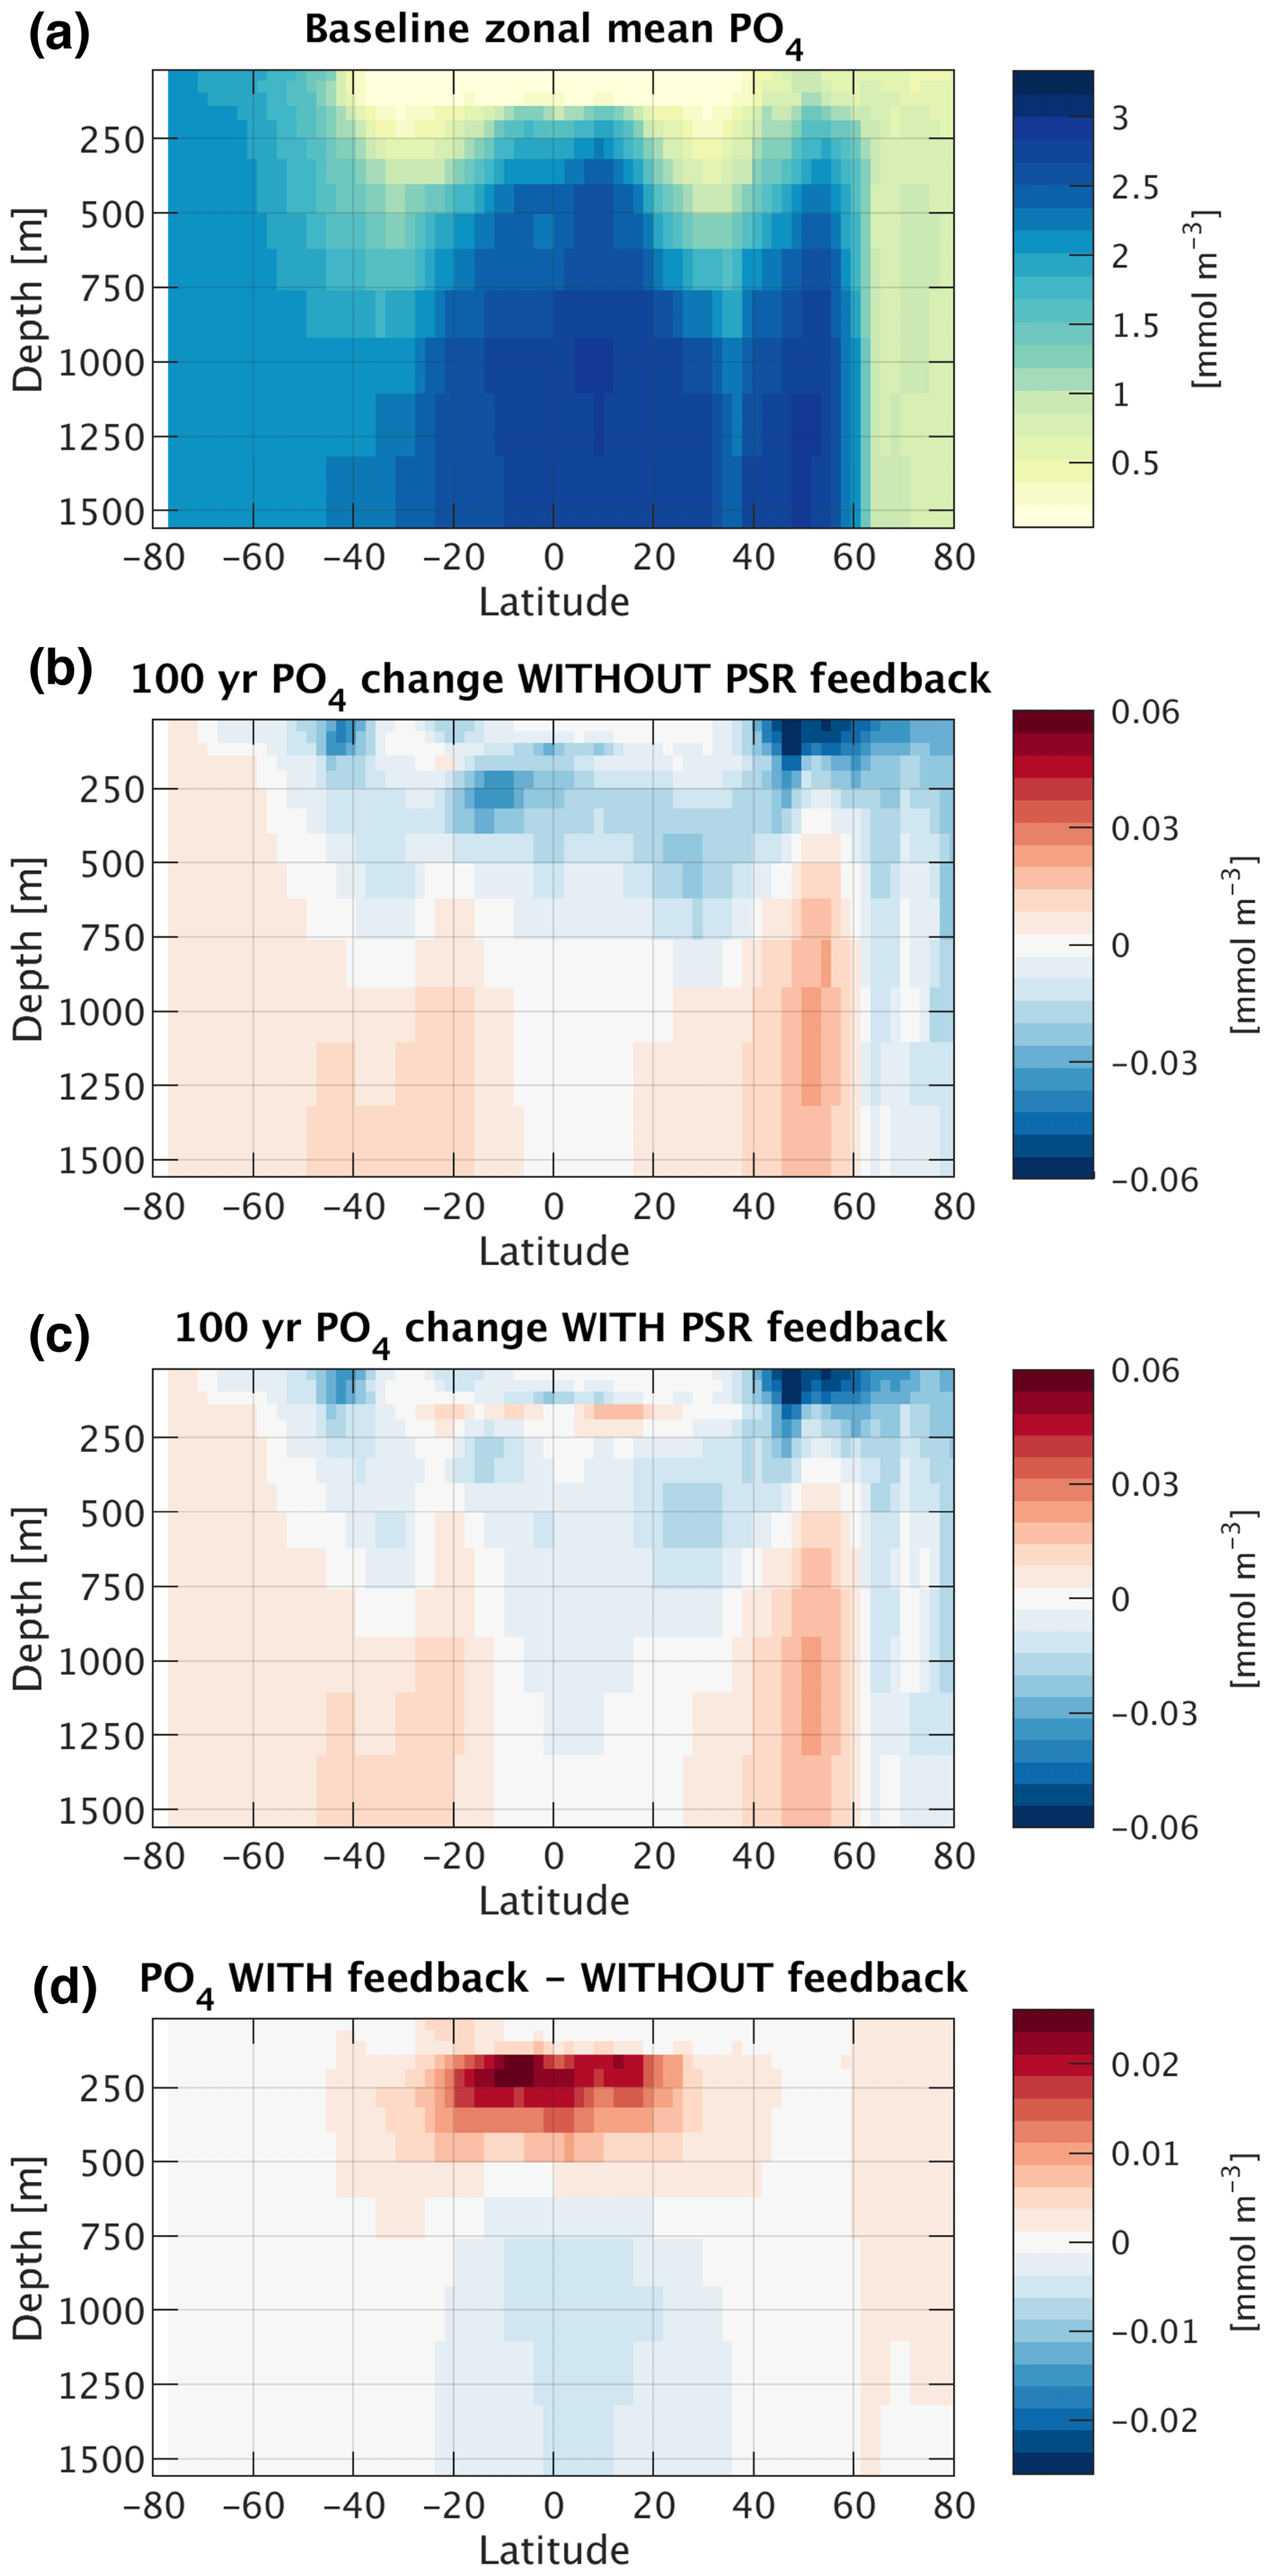
Figure 8(a) Baseline (current-day circulation, ran to steady state) zonal mean phosphate concentration. (b) Absolute change in zonal mean phosphate concentration 100 years after decreasing circulation rates by 10 % with the PSR feedback turned off. (c) Same as (b) but with the PSR feedback turned on. (d) Difference in zonal mean phosphate concentration between PSR feedback-on and feedback-off runs (i.e., b minus c).
In our baseline simulation under current-day circulation rates, POC export covaries tightly throughout the low-to-mid latitudes with nutrient concentrations in shallow subsurface waters beneath the euphotic zone, quantified here as [PO4] at 200 m depth (P200 m) (Figs. 7a and b and 8a). South of ∼ 40∘ S and north of ∼ 40∘ N, other factors such as light and/or temperature become limiting; as a result, export does not vary as tightly with P200 m in these higher-latitude regions. The spatial structure of the relationship between export and P200 m confirms that nutrient supply from subsurface layers is the primary driver of export rates throughout the nutrient-limited low-to-mid latitudes. Therefore, in these regions, the following balance approximately holds:
where w is the local upwards nutrient supply velocity, which represents the net effect of all vertical exchange processes, including diffusion, upwelling, entrainment, and mixing. This relationship between export, upwelling, and subsurface nutrient concentrations reflects the common assumption that, at steady state, export flux out of the euphotic zone must approximately balance the supply of nutrients into the euphotic zone by upwelling (e.g., Ducklow et al., 2001; Passow and Carlson, 2012). This balance can in turn be used to derive (via perturbation analysis) a simple, approximate diagnostic for understanding changes in export under altered circulation rates at any given location:
where baseline denotes variables from the baseline simulation ran to steady state with current-day circulation rates and Δ denotes change from the baseline simulation under altered circulation rates. (Note that we ignore the “perturbation product” term, Δw⋅ΔP200 m, because it is negligible.)
Though Eqs. (2) and (3) are not mathematically equivalent to the full model solution, they explain much of the full model's behavior and provide us with a tool to simplify, deconvolve, and better understand the different mechanisms leading to export changes. In particular, when ocean circulation is slowed, Eq. (3) allows us to identify two different contributions to the resultant reduction in export through the low-to-mid latitudes. First, and most intuitively, when circulation rates are uniformly decreased, w is reduced across the entire ocean (Δw<0) and the supply of “baseline” nutrients is curtailed. Second, a decrease in circulation rates also reduces phosphate concentrations throughout the shallow subsurface layer in the low-to-mid latitudes (ΔP200 m<0) (solid lines and bars in Figs. 7c and d and 8b). This decrease in P200 m is likely largely driven by enhanced biological nutrient utilization in the surface of the Southern Ocean in response to slower circulation, which is then propagated into the low-to-mid-latitude interior through Antarctic Intermediate Water and Subantarctic Mode Water (e.g., Sarmiento et al., 2004; Marinov et al., 2006), as observed in future climate simulations by more complex ESMs (e.g., Moore et al., 2018).
Together, the decreases in shallow subsurface nutrient concentrations (P200 m) and vertical exchange rates (w) result in substantial reductions in export throughout most of the ocean under our decreased circulation simulations as dictated by Eq. (3), with the greatest reductions occurring in nutrient-limited areas. In the absence of the PSR feedback, the 10 % decrease we imposed on circulation rates leads to 100-year zonal mean export decreases of > 15 % at 35∘ N and S and ∼ 10 % between 35∘ N and S (solid line in Fig. 7e). Regionally, the oligotrophic subtropics (especially the STP) exhibit the largest relative decreases in export (∼ 10 %–13 %), followed closely by the tropics (ETA, ETP) with export decreases around 8 %–10 % (solid bars in Fig. 7f). As expected, the decrease in export mirrors the pattern of ΔP200 m in low-to-mid-latitude regions due to a strong dependence of export on nutrient supply from the shallow subsurface here.
3.3.3 Predicted zonal and regional mean export changes with the global PSR feedback
As with the global mean (Sect. 3.3.1), we quantify zonal and regional mean PSR feedback strength as the difference in circulation-driven export change from baseline between the feedback-on and feedback-off runs, normalized by the change from baseline in the feedback-off run. In other words, the PSR feedback strength is the percentage by which turning on the PSR feedback reduces (dampens) the response of carbon export to changes in ocean circulation (blue line and bars in Fig. 7g and h). Thus, the zonal mean feedback strength (blue line in Fig. 7g) is equal to the difference between the dashed and solid lines divided by the solid line in Fig. 7e, while the regional mean PSR feedback strength (blue bars in Fig. 7h) is equal to the length of the solid colored portion of the bars divided by the entire length of the bars in Fig. 7f. The PSR feedback strength is greatest (most strongly damping) in the low-to-mid latitudes and in the tropics (ETA, ETP) and subtropics (STA, STP, IND), with the feedback able to reduce zonal and regional mean export changes by up to 20 % in these regions (blue lines and bars in Fig. 7g and h). To understand this spatial pattern, we combine Eq. (3) with our definition of PSR feedback strength to yield the following diagnostic, which can help separate out the various determinants of PSR feedback strength:
where on or off denotes whether the PSR feedback was turned on or off under the altered circulation rates. This expression reveals that the PSR feedback effect is strongest wherever activating the feedback leads to the greatest dampening of changes in P200 m compared to the changes that occur in the feedback-off case. In the decreased circulation simulations , the low-to-mid-latitude regions display the greatest differences in P200 m changes between feedback-on and feedback-off runs (Figs. 7c and d and 8b–d); these regions undergo the greatest reductions in circulation-driven export change due to the PSR feedback (Fig. 7e and f) and thus exhibit the largest PSR feedback effects (blue lines and bars in Fig. 7g and h).
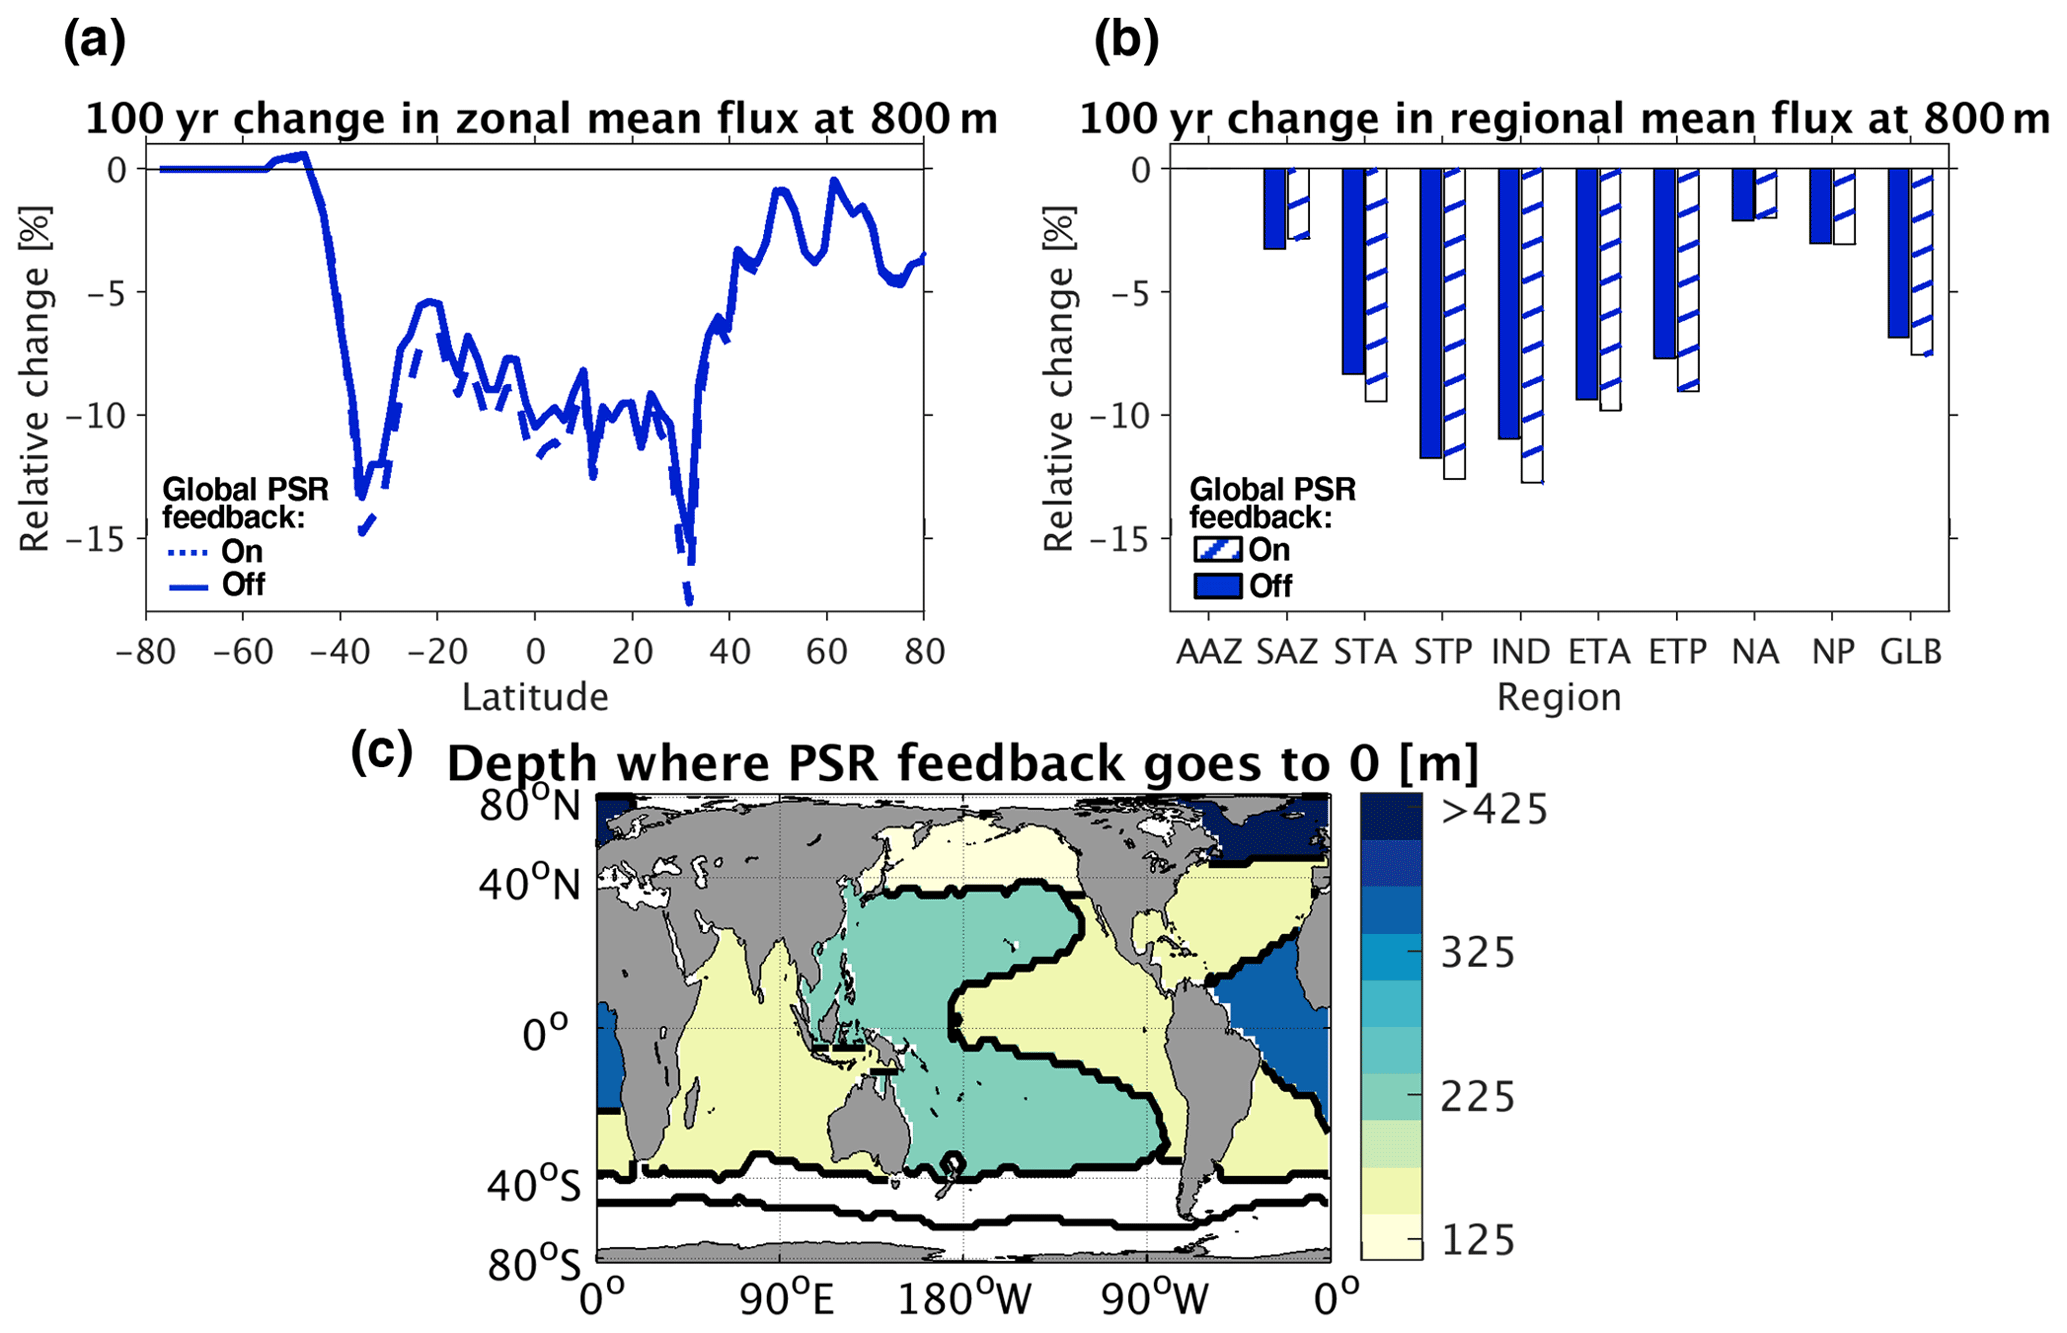
Figure 9(a) Relative changes in zonal mean particulate organic carbon (POC) flux at 800 m depth (725 m below the bottom of the euphotic zone) 100 years after decreasing circulation rates by 10 %. (b) Same as (a) but with regional and global (GLB) means. (c) Map of regional mean depths below the surface at which the PSR feedback effect flips from negative to positive. In the North Atlantic, the regional mean PSR feedback effect flips from negative to positive at ∼ 2100 m depth, which is off the color scale.
The degree to which the PSR feedback dampens P200 m changes is in turn driven by the strength of the relationship between β and export. The low-to-mid latitudes exhibit the most negative values and therefore the tightest coupling between β and export (Fig. 3c). In these regions, where macronutrient limitation is the dominant constraint on productivity, a given circulation-driven decrease in surface nutrient supply causes a relatively large drop in both export and particle size (leading to an increase in β) in the presence of the PSR feedback. This then allows for significantly more nutrients to be recycled at the surface, resulting in greatly dampened decreases in P200 m and subsequent export production.
Our simple diagnostic (Eq. 4, derived from Eqs. 2 and 3) can explain PSR feedback strengths quite well over much of the global ocean, as can be seen by comparing total feedback strengths (blue lines and bars in Fig. 7g and h) with our diagnostic-derived feedback strengths (right-hand side of Eq. 4, represented by orange lines and bars in Fig. 7g and h), which were calculated under the assumption that export is nearly equal to the supply of nutrients into the euphotic zone via upwelling (Eq. 2). In other words, Eqs. (2)–(4) are a good approximation to the full model solution where the orange lines and bars lie relatively close to the blue lines and bars in Fig. 7g and h. However, new production can be fed by local upwelling as well as lateral advection, such that changes in P200 m and vertical exchange rates alone (orange lines and bars in Fig. 7g and h) cannot perfectly predict all changes in export (blue lines and bars in Fig. 7g and h), especially in regions where lateral advection plays a relatively large role in supplying nutrients to the surface.
3.3.4 Vertical reorganization of POC fluxes induced by the PSR feedback
Up to this point, the effect of the PSR feedback effect has been analyzed solely for carbon exported out of the surface euphotic zone (< 75 m depth here). We largely focus on export out of the bottom of the euphotic zone rather than on POC fluxes at greater depths, because export, by definition, is a measure of the total organic carbon supply that feeds subsurface heterotrophic communities. Thus, the PSR feedback effect buffers the productivity of mesopelagic communities as a whole by damping changes in export.
This buffering of the food supply, however, does not occur uniformly through the water column. While shallower particle remineralization helps maintain the nutrient supply to the surface and buffers the POC export rate, it also means that fewer particles persist at depth. Indeed, the PSR feedback on export has the opposite effect on POC fluxes in the lower mesopelagic zone (for example, at 800 m depth, equivalent to 725 m below the bottom of the euphotic zone – Fig. 9a and b). This results in a vertical reorganization of particle fluxes, with more food available in the upper mesopelagic and less in the lower mesopelagic when the PSR feedback is activated. In particular, by 350 m depth (225 m below the bottom of the euphotic zone), the PSR feedback effect on POC flux has changed sign from negative to positive across all ocean regions except for the SAZ, AAZ, and NA (Fig. 9c). In regions where the negative PSR feedback effect is strongest, vertical reorganization is more extreme and the sign of the PSR feedback flips from negative to positive shallower in the water column. The PSR feedback effect becomes positive below depths as shallow as 125, 148, 158, and 165 m (50, 73, 83, and 90 m below the euphotic zone) in the NP, ETP, STA, and IND regions, respectively, for example (Fig. 9c).
A negative PSR feedback effect dampens predicted circulation-driven changes in global export out of the euphotic zone, while a positive PSR feedback effect amplifies predicted changes in lower mesopelagic global POC fluxes. It follows that global models without the PSR feedback effect would overestimate changes in export but underestimate changes in POC fluxes at deeper depths in a future warming or slowed circulation scenario. This vertical reorganization of POC flux changes brought about by the PSR feedback effect, leading to greater-than-expected fluxes in the upper mesopelagic and lower-than-expected fluxes in the lower mesopelagic under future warming, has the potential to alter follow-on predictions of vertical ecological community organization as well. Importantly, however, the net effect of the PSR feedback is still a buffering of the total food supply to subsurface heterotrophic communities.
3.4 Predicted export changes in the presence of regional PSR feedback effects
In this section, we discuss each individual ocean region's contribution to the global PSR feedback effect. To isolate the PSR feedback effect coming from each region, we conduct a set of model runs in which we decrease the circulation rate globally but only activate the PSR feedback within one region at a time. In these feedback-on runs, we set in Eq. (1) equal to zero at all grid points outside of the region we are isolating; within the isolated region, we set equal to the corresponding empirically derived value (as shown in Fig. 3b). These simulations are then compared to the same feedback-off run discussed in Sect. 3.3 (i.e., no changes in β anywhere) to determine the impact of enabling the feedback within one region at a time. Section 3.4.1 and 3.4.2 describe the global and regional mean export changes, respectively, resulting from this set of experiments.
3.4.1 Predicted global mean export changes with and without regional PSR feedbacks
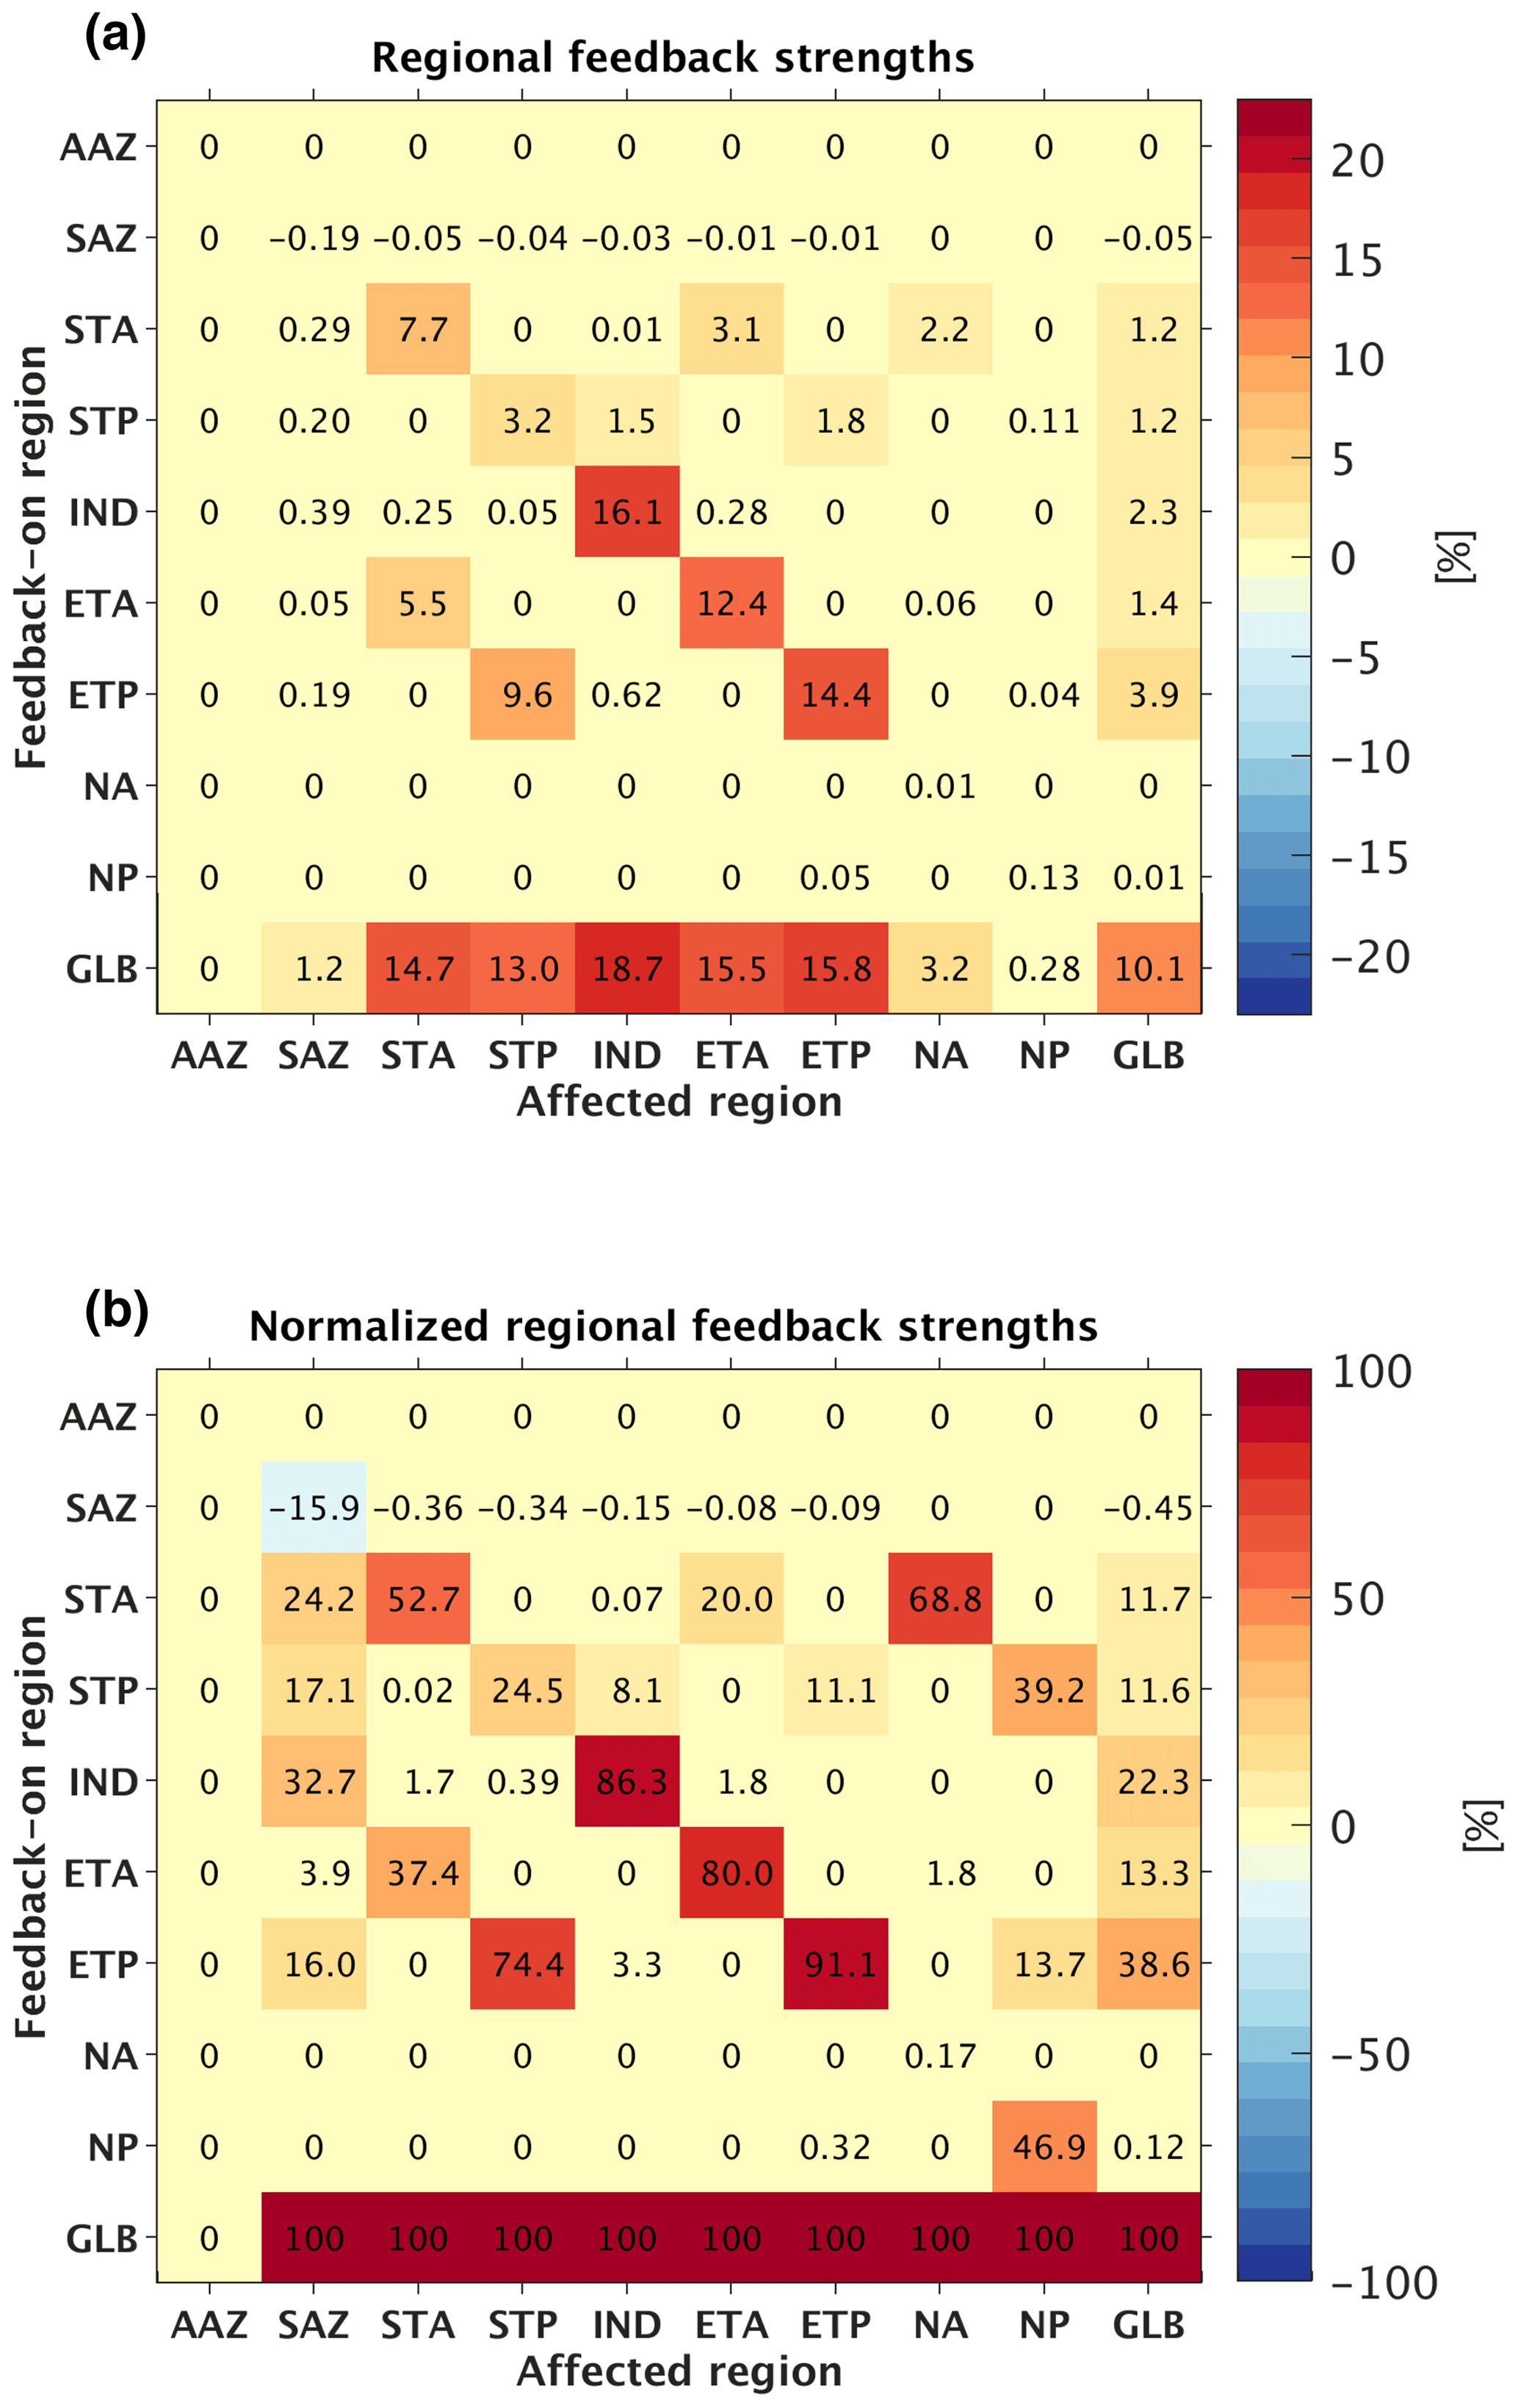
Figure 10(a) Regional mean feedback strength due to the PSR negative feedback effect within each individual region. The y axis denotes the single region (or the entire ocean in the case of “GLB” meaning global) within which the PSR feedback was turned on, while the x axis denotes the region affected. A feedback strength above 0 indicates a negative PSR feedback effect (i.e., a reduction in export change when the PSR feedback is applied). (b) Percent contribution of each individual region to each region's total PSR feedback strength, computed as the regionally derived feedback strength within an affected region divided by the globally derived feedback strength in the same affected region (i.e., each given grid cell in (a) is divided by the corresponding column's bottommost grid cell).
Analysis of the regional feedback-on runs shows that tropical (ETA, ETP) and subtropical (STA, STP, IND) regions contribute most significantly to the global PSR feedback (Fig. 10). Turning the feedback on in the ETP alone, for instance, leads to a 3.9 % reduction in global mean export change compared to the feedback-off case (Fig. 10a – row 7, last column); the ETP alone thus accounts for 38.6 % of the global PSR feedback strength (Fig. 10b – row 7, last column), while spanning only 10.3 % of total ocean area. Turning the feedback on in the subtropical (STA, STP, IND) and tropical (ETA, ETP) regions one at a time and then summing their individual contributions (11.7 %, 11.6 %, 22.3 %, 13.3 %, 38.6 %, respectively; Fig. 10b – last column) accounts for 97.5 % of the global PSR feedback effect, while all other regions (AAZ, SAZ, NA, NP) account for only a negligible fraction of the effect (or even act to decrease the overall effect in the case of the SAZ) (Fig. 10b – last column). The dominant contributions of the tropical and subtropical regions to the global PSR feedback can once again be understood via spatial patterns in (Fig. 3c), with large changes in β and remineralization depth associated with relatively small changes in export in the nutrient-limited tropical and subtropical regions.
3.4.2 Predicted regional mean export changes with and without regional PSR feedbacks
The significant tropical and subtropical contribution to the PSR feedback can also be seen by examining export changes within individual regions. Activating the PSR feedback in the STA, for example, dampens regional mean export decreases within the STA, the ETA, and the NA by 7.7 %, 3.1 %, and 2.2 %, respectively (Fig. 10a – row 3). Turning on the feedback in the STP (Fig. 10a – row 4), ETA (Fig. 10a – row 6), or ETP (Fig. 10a – row 7) alone has similarly large effects on surrounding regions. In contrast, activating the feedback within higher-latitude regions (AAZ, SAZ, NA, NP) does not significantly moderate export decreases in any individual region nor globally (Fig. 10a – rows 1–2, 8–9). The AAZ uniquely undergoes near-zero decreases in export for all runs with the feedback on or off; PSR feedback strength here is therefore negligible (Fig. 10a and b – row 1).
When the PSR feedback is turned on within a given region, the effect is typically felt most strongly within that same region, as would reasonably be expected given that export production and resultant remineralization are spatially co-occurring (Fig. 10a and b – diagonal going from upper left to lower right corner). However, depending on the local magnitude of compared to that of neighboring regions, as well as the connectivity of nutrient supplies between them, there can be substantial PSR feedback effects originating from afar. For example, in the Pacific basin, switching on the PSR feedback in the ETP has a stronger buffering effect on export in the STP region than switching on the feedback in the STP itself (Fig. 10b – row 7, column 4). This is because the relationship between β and export is much stronger in the ETP (with a regional mean of −0.40; see Fig. 3c) than in the STP (with a regional mean of −0.18; see Fig. 3c) and because remineralized surface nutrients in the ETP are readily carried into the STP by wind-driven Ekman transport. In this way, PSR feedback-driven buffering of surface nutrient supply changes within the ETP indirectly buffers surface nutrient supply changes in the STP as well. This indirect effect also operates in the reverse direction, in that activating the PSR feedback in the STP also has a relatively strong impact back on the ETP (Fig. 10b – row 4, column 7). In this case, nutrients remineralized shallower in the STP thermocline are directed along sloping isopycnals that eventually upwell into the ETP surface, thus buffering decreases in export there. The STP also has a relatively large PSR feedback effect on the subpolar NP (Fig. 10b – row 4, column 9), due to the intense flow of the Kuroshio Current, which carries surface nutrients from the STP northward.
Similar relationships hold in the Atlantic basin between the tropics, subtropics, and subpolar regions. However, the PSR feedback effect of the ETA on the STA is smaller (Fig. 10b – row 6, column 3), while the effect of the STA on the ETA is larger (Fig. 10b – row 3, column 6) compared to their Pacific counterparts, presumably due to less pronounced Ekman divergence along the equatorial Atlantic. The STA's PSR feedback effect on the subpolar NA (Fig. 10b – row 3, column 8) is also substantially more pronounced than the STP's effect on the NP, indicating a stronger nutrient supply pathway between subtropical and subpolar gyres in the Atlantic Ocean via the Gulf Stream.
An interesting phenomenon that arises in the Southern Ocean is the negative (dampening) overall PSR feedback effect on the SAZ (Fig. 10a – row 10, column 2), despite a positive (amplifying) local feedback effect (Fig. 10a and b – row 2, column 2) and relationship between β and export here (regional mean of +0.13; see Fig. 3c). Additive negative (dampening) PSR feedback effects from surrounding regions (STA, STP, IND, ETA, ETP) (Fig. 10a and b – rows 3–7, column 2) overcome the small positive (amplifying) local feedback effect here (Fig. 10a and b – row 2, column 2), such that the total feedback effect still reduces the magnitude of the regional mean export decrease by 1.2 % compared to the feedback-off case (Fig. 10a – last row, column 2). Because the SAZ spans the entire width of the ocean and touches every other basin, additional remineralized surface nutrients collected in the many connected regions are quickly and easily circulated into the SAZ when the global PSR feedback is active, thus buffering larger would-be decreases in export here.
3.5 Comparison with CMIP5 models
In the absence of the PSR feedback, our model predicts a 100-year global mean export decrease of 8.1 % (0.29 ). With the PSR feedback on, this export decrease is reduced to 7.0 % (0.25 ). Meanwhile, CMIP5 models project global mean export decreases of around 7 %–18 % between 2090–2099 and 1990–1999 under a business-as-usual radiative forcing scenario (RCP8.5), with an ensemble mean of 13 % (Bopp et al., 2013). Assuming that none of the CMIP5 models are currently able to simulate the PSR feedback, our results therefore suggest that accounting for the feedback would alter the CMIP5 range of projections from a 7 %–18 % to a 6 %–15.5 % decline in export and the CMIP5 ensemble mean projection from a 13 % to an 11 % decline in export. However, many of the CMIP5 models may be capable of capturing some semblance of a PSR feedback effect, thus necessitating smaller corrections.
All CMIP5 models simulate various processes that have the potential to change POC export fluxes in a warming future ocean, including zooplankton grazing and fecal pellet formation, phytoplankton aggregation, phytoplankton and/or zooplankton mortality, and variations in phytoplankton community structure (which provide the source material for sinking particles) based on changing nutrient, temperature, and light conditions. However, 7 of 17 total CMIP5 models with ocean biogeochemistry simulate only one class or type of particulate organic matter (Ilyina et al., 2013; Tjiputra et al., 2013; Tsujino et al., 2010; Watanabe et al., 2011; Zahariev et al., 2008) and therefore cannot capture changes in the nature of sinking POC with future warming. The other 10 CMIP5 models can simulate changes in the nature of sinking particulate organic matter with future warming, either through the amount of associated ballasting (3 models) (Dunne et al., 2013; Moore et al., 2004) or through particle size (7 models).
Of the seven models that simulate changes in particle size and could thus potentially capture the PSR feedback effect, three of these models resolve two particle sizes (small and large) with different sinking speeds (3 m d−1 for the small particles and 50 to 200 m d−1 for the large particles) (Aumont and Bopp, 2006). Another two of these seven models also resolve two size-based particle types (diatoms and detritus) with different sinking speeds (1 m d−1 for diatoms and 10 m d−1 for detritus) (Totterdell, 2019). The final two of these seven models simulate five different organic particle sinking speeds based on size, one for each different phytoplankton type in the model (for a total of four) and one for carbon detritus (Romanou et al., 2013). In summary, out of the 17 CMIP5 models described here, only 7 resolve particles of more than one size that sink down the water column at different speeds and therefore have the potential to capture some part of the PSR feedback effect.
If all the CMIP5 models differed only in their resolution of sinking-particle sizes, then we would expect the seven models with more than one particle size to project the smallest decreases in export with future warming. In reality, however, the models differ in too many other ways to isolate potential impacts of the PSR feedback when comparing between them. For example, three of the models that resolve more than one sinking-particle size (IPSL-CM5A-LR, IPSL-CM5A-MR, and HadGEM2-ES) predict some of the largest decreases in export production by 2100 (Fig. 9b in Bopp et al., 2013), contrary to what would be expected given the potential presence of a PSR feedback in these models. Indeed, the models that can simulate changes in the nature of sinking particles project changes in export that span the entire range of CMIP5 model predictions (Fig. 9b in Bopp et al., 2013). The reasons for these differences in projected export decreases is difficult to disentangle and would require examining the effects of one mechanism at a time on export in each model.
Simply representing differently sized particles also does not ensure that a model will adequately represent the negative PSR feedback quantified in this study. To adequately represent the negative PSR feedback, a given model would need to contain mechanisms that give rise to the same strong, empirically derived relationships between POC export and particle size that we specify here. Within the models that resolve particle size to some degree, the relative proportion of large and small particles is determined by internal model dynamics and are not prescribed empirically. Furthermore, these models do not resolve a particle size spectrum over a wide range of sizes as is done here. Therefore, CMIP5 models that dynamically resolve two to five different particle size classes with different sinking speeds might qualitatively reproduce the same feedback, but it is not clear whether the magnitude or even the sign of the feedback would be accurately captured. We argue that our model, which resolves particle size spectra over a wide range of sizes and employs empirical export–particle-size relationship constraints, is most likely to accurately capture the true magnitude of the PSR feedback. We thus suggest that our study provides a reasonable baseline against which more complex earth system models can assess their ability to reproduce particle-size–remineralization feedbacks.
3.6 Caveats and future work
The exact strength of the PSR feedback hinges on the empirical relationship between carbon export and particle size, which may differ depending on the datasets used to constrain it. To address this uncertainty, we correlated β against a range of different global export datasets and found that our results were relatively insensitive to the choice of export dataset. Unfortunately, well-grounded alternative global and temporally resolved datasets for β were not readily available, so uncertainty in the PSR feedback strength due to uncertainties in observed β could not be quantified here. Analysis of in situ underwater vision profiler (UVP) data suggests that β may actually be smaller (thus particles larger) and less variable (Cram et al., 2018) than the backscatter-derived values (Kostadinov et al., 2009) used in this study. This would potentially imply less variability in particle-size-driven remineralization depths, weakening the PSR feedback strength calculated here. On the other hand, differences in remineralization depths are greater at smaller values of β (Fig. S1; Fig. 2 in Devries et al., 2014), such that any given increase in β associated with a decrease in export would lead to greater shoaling of remineralization depths and a larger PSR feedback effect than calculated here. More in situ observations of β are clearly needed to better resolve these competing effects. One potential explanation for these β discrepancies is that the algorithm used to derive β from remotely sensed particulate backscatter sometimes misses the largest particles in high-productivity areas such as the Southern Ocean (Kostadinov et al., 2009). In addition to the mechanisms proposed in Lam and Bishop (2007), this may partly explain why is weakly positive in the Subantarctic zone (SAZ); particles may actually get larger with increasing export here, but because they are already quite large, the satellite β sensor and algorithm may not be able to capture the particles becoming any larger. The result would be an underestimation of the negative (dampening) PSR feedback effect in this region.
Another caveat of our study is that very simple phytoplankton biology and growth dependent on only one macronutrient was assumed. Furthermore, particle fragmentation – via processes such as zooplankton grazing, microbial degradation, or ocean turbulence (e.g., Cavan et al., 2017; Briggs et al., 2020) – was not included in our model nor was particle aggregation – via processes such as transparent exopolymer particles production (e.g., Passow, 2002; Mari et al., 2017) or fecal pellet generation (e.g., Steinberg et al., 2012; Turner, 2015, and references therein). Despite the aforementioned shortcomings, the results presented here represent a reasonable first attempt to quantify the strength of the PSR feedback effect on export changes within a global model. Future work should test the PSR feedback effect in more complex models that better resolve phytoplankton and/or zooplankton biology, particle dynamics, and circulation changes. These models could include particle aggregation–disaggregation with prognostic sinking speeds (Gehlen et al., 2006), empirically driven food webs (Siegel et al., 2014), explicit phytoplankton and grazers of different sizes (Buesseler and Boyd, 2009), and/or spatiotemporally resolved circulation changes that respond directly to atmospheric forcing.
Additionally, future work should analyze the downstream effects of the PSR feedback on climate-driven projections of fisheries productivity, dissolved oxygen availability, and carbon sequestration in the deep ocean over centennial to millennial timescales. A smaller-than-currently-projected decrease in surface nutrient supply and export rates would be beneficial for maintaining fisheries, for example. On the other hand, predicted increases in deep ocean carbon sequestration may be reduced by the PSR feedback. In particular, a decrease in circulation rates should enable enhanced carbon sequestration, as nutrients and CO2 collect in the deep ocean (Fig. 8), but the PSR feedback may potentially moderate this increased sequestration effect by shoaling remineralization and forcing a shorter carbon sequestration timescale. We focused solely on 100-year changes in POC export, to the exclusion of potential longer-term changes in deep ocean carbon storage, because it is a critical energy source to the mesopelagic twilight zone and therefore determines the productivity of heterotrophic communities, including commercial fisheries. Furthermore, while changes in the biological pump may also drive changes in ocean carbon storage, these will manifest over longer timescales than changes in export and will likely be overwhelmed on short timescales by the effects of anthropogenic CO2 uptake and solubility-driven outgassing. A detailed exploration of changes in carbon storage is therefore beyond the scope of the current paper but could be a fruitful avenue for future work.
Other remineralization depth-related feedbacks induced by changes in temperature, oxygen, particle density, and mineral ballasting (among others) not studied here may also be important for modulation of future changes in carbon export and its downstream effects. Ensuring that the PSR and other remineralization feedbacks are adequately represented in ESMs should be a priority of the modeling community to enable robust predictions of carbon export fluxes in the future ocean.
In this study, we used remotely sensed data to show that sinking-particle size is empirically correlated with the rate of particulate organic carbon export out of the euphotic zone across the global ocean, such that larger particles tend to dominate when export is high. This empirical relationship between particle size and export likely emerges due to the dependence of both variables on surface nutrient supply. Indeed, nutrient limitation both curtails productivity and selects for smaller phytoplankton that likely aggregate into smaller sinking particles (Litchman et al., 2007; Guidi et al., 2007, 2008, 2009). A reduction in surface nutrient supply stemming from increased water column stratification in a warming ocean (Bopp et al., 2013; Cabré et al., 2015a; Capotondi et al., 2012) should thus lead to a decrease in global export production (Fig. 4, green arrows; Fig. 5, slower-circulation solid lines and bars) and sinking-particle size (Fig. 4a, red arrow; Fig. 4c and d, red line; Fig. 6b). Smaller particles in turn drive shallower nutrient remineralization and thus faster resupply of those nutrients to the surface, dampening the initial circulation-driven change in export (Fig. 4a, blue arrow; Fig. 4d, blue line; Fig. 5, slower-circulation dashed lines and hatching bars; Figs. 6b, 7c–f and 8b and c). Regardless of the mechanism linking export and particle size, implementing the empirical relationships between the two in an idealized global biogeochemical model revealed the presence of a negative particle-size–remineralization feedback effect that moderates circulation-driven changes in export.
Many earth system models ignore the effects of nutrient supply on particle size and/or the effects of particle size on remineralization depths. Within our model, including these effects reduces the magnitude of predicted 100-year changes in global export production by ∼ 14 % (Fig. 5). This implies that in isolation of other mechanisms, ESMs without the PSR feedback may be projecting 100-year climate-driven export decreases that are ∼ 1.16 times too large. Under a relatively extreme ESM-projected decrease of 18 % by 2100 (Bopp et al., 2013), absolute global export would be reduced by ∼ 0.7–2.9 GtC yr−1, assuming a present rate in the range of 4–16 GtC yr−1 (Boyd and Trull, 2007; DeVries and Weber, 2017; Dunne et al., 2005, 2007; Falkowski et al., 1998; Henson et al., 2011; Laws et al., 2000; Siegel et al., 2014; Yamanaka and Tajika, 1996); with the PSR feedback in effect, this predicted decrease would be reduced by ∼ 14 % to ∼ 0.6–2.3 GtC yr−1.
The PSR feedback is strongest in low-latitude tropical and subtropical regions (moderating export changes by up to 20 %; Fig. 7g and h, Fig. 10), where ESMs also predict some of the largest future export decreases (Bopp et al., 2013; Cabré et al., 2015a). Within these regions, primary and export production are highly nutrient limited, such that a given stratification-induced decrease in nutrient supply leads to relatively large decreases in export and sinking-particle size (Fig. 3), with correspondingly large effects on remineralization depth (Fig. 6) and surface nutrient recycling. Because these regions exhibit the greatest projected decreases in export as well as the strongest PSR feedback effects, spatial variations in projected export decrease may also be less pronounced than currently expected.
The PSR feedback operates on increases in surface nutrient supply as well. Under surface nutrient supply increases, phytoplankton and particles grow larger and remineralization depths deepen, which sends more nutrients out of the shallow subsurface and thereby moderates initial circulation-driven increases in export. This PSR feedback reduces the magnitude of predicted 100-year changes in global export production by about 18 % when circulation rates are increased by 10 % (Fig. 5, faster-circulation dashed lines and hatching bars). In scenarios of global cooling (resulting in water column destratification, enhanced mixing, and increased surface nutrient supply), centennial-scale projections of export increase in models lacking the PSR feedback would therefore be > 1.2 times too big, again with the largest overestimates in the low-to-mid-latitude regions. The PSR feedback thus moderates export changes in response to any physical perturbation to surface nutrient supply, whether driven by increasing or decreasing circulation rates.
The MATLAB code required to make the figures generated here can be found at https://doi.org/10.5281/zenodo.4117382, (last access: 5 May 2020, Leung, 2020).
Data in the form of *.mat files required to make the figures generated here can be found at http://doi.org/10.5281/zenodo.3785724 (last access: 5 May 2020, Leung, 2020).
The supplement related to this article is available online at: https://doi.org/10.5194/bg-18-229-2021-supplement.
SL and CD designed the model experiments. SL developed the model code and performed the simulations. SL prepared the article with contributions from all co-authors.
The authors declare that they have no conflict of interest.
This study was supported by a NASA Earth and Space Science Fellowship to SL.
This paper was edited by Christoph Heinze and reviewed by three anonymous referees.
Alldredge, A. L. and Gotschalk, C.: In situ settling behavior of marine snow, Limnol. Oceanogr., 33, 339–351, https://doi.org/10.4319/lo.1988.33.3.0339, 1988.
Aumont, O. and Bopp, L.: Globalizing results from ocean in situ iron fertilization studies, Global Biogeochem. Cy., 20, https://doi.org/10.1029/2005GB002591, 2006.
Bach, L. T., Boxhammer, T., Larsen, A., Hildebrandt, N., Schulz, K. G., and Riebesell, U.: Influence of plankton community structure on the sinking velocity of marine aggregates, Global Biogeochem. Cy., 30, 1145–1165, https://doi.org/10.1002/2016GB005372, 2016.
Behrenfeld, M. J. and Falkowski, P. G.: Photosynthetic rates derived from satellite-based chlorophyll concentration, Limnol. Oceanogr., 42, 1–20, https://doi.org/10.4319/lo.1997.42.1.0001, 1997.
Behrenfeld, M. J., Boss, E., Siegel, D. A., and Shea, D. M.: Carbon-based ocean productivity and phytoplankton physiology from space, Global Biogeochem. Cy., 19, https://doi.org/10.1029/2004GB002299, 2005.
Bianchi, D., Weber, T. S., Kiko, R., and Deutsch, C.: Global niche of marine anaerobic metabolisms expanded by particle microenvironments, Nat. Geosci., 11, 263–268, https://doi.org/10.1038/s41561-018-0081-0, 2018.
Bopp, L., Monfray, P., Aumont, O., Dufresne, J.-L., Treut, H. L., Madec, G., Terray, L., and Orr, J. C.: Potential impact of climate change on marine export production, Global Biogeochem. Cy., 15, 81–99, https://doi.org/10.1029/1999GB001256, 2001.
Bopp, L., Quéré, C. L., Heimann, M., Manning, A. C., and Monfray, P.: Climate-induced oceanic oxygen fluxes: Implications for the contemporary carbon budget, Global Biogeochem. Cy., 16, 6-1–6-13, https://doi.org/10.1029/2001GB001445, 2002.
Bopp, L., Resplandy, L., Orr, J. C., Doney, S. C., Dunne, J. P., Gehlen, M., Halloran, P., Heinze, C., Ilyina, T., Séférian, R., Tjiputra, J., and Vichi, M.: Multiple stressors of ocean ecosystems in the 21st century: projections with CMIP5 models, Biogeosciences, 10, 6225–6245, https://doi.org/10.5194/bg-10-6225-2013, 2013.
Boss, E., Twardowski, M. S., and Herring, S.: Shape of the particulate beam attenuation spectrum and its inversion to obtain the shape of the particulate size distribution, Appl. Optics, 40, 4885–4893, https://doi.org/10.1364/AO.40.004885, 2001.
Boyd, P. W. and Trull, T. W.: Understanding the export of biogenic particles in oceanic waters: Is there consensus?, Prog. Oceanogr., 72, 276–312, https://doi.org/10.1016/j.pocean.2006.10.007, 2007.
Boyd, P. W., Claustre, H., Levy, M., Siegel, D. A., and Weber, T.: Multi-faceted particle pumps drive carbon sequestration in the ocean, Nature, 568, 327–335, https://doi.org/10.1038/s41586-019-1098-2, 2019.
Briggs, N., Dall'Olmo, G., and Claustre, H.: Major role of particle fragmentation in regulating biological sequestration of CO2 by the oceans, Science, 367, 791–793, https://doi.org/10.1126/science.aay1790, 2020.
Buesseler, K. O. and Boyd, P. W.: Shedding light on processes that control particle export and flux attenuation in the twilight zone of the open ocean, Limnol. Oceanogr., 54, 1210–1232, https://doi.org/10.4319/lo.2009.54.4.1210, 2009.
Buonassissi, C. J. and Dierssen, H. M.: A regional comparison of particle size distributions and the power law approximation in oceanic and estuarine surface waters, J. Geophys. Res.-Oceans, 115, https://doi.org/10.1029/2010JC006256, 2010.
Cabré, A., Marinov, I., and Leung, S.: Consistent global responses of marine ecosystems to future climate change across the IPCC AR5 earth system models, Clim. Dyn., 45, 1253–1280, https://doi.org/10.1007/s00382-014-2374-3, 2015a.
Cabré, A., Marinov, I., Bernardello, R., and Bianchi, D.: Oxygen minimum zones in the tropical Pacific across CMIP5 models: mean state differences and climate change trends, Biogeosciences, 12, 5429–5454, https://doi.org/10.5194/bg-12-5429-2015, 2015b.
Cael, B. B. and White, A. E.: Sinking Versus Suspended Particle Size Distributions in the North Pacific Subtropical Gyre, Geophys. Res. Lett., 47, e2020GL087825, https://doi.org/10.1029/2020GL087825, 2020.
Caesar, L., Rahmstorf, S., Robinson, A., Feulner, G., and Saba, V.: Observed fingerprint of a weakening Atlantic Ocean overturning circulation, Nature, 556, 191–196, https://doi.org/10.1038/s41586-018-0006-5, 2018.
Capotondi, A., Alexander, M. A., Bond, N. A., Curchitser, E. N., and Scott, J. D.: Enhanced upper ocean stratification with climate change in the CMIP3 models, J. Geophys. Res.-Oceans, 117, https://doi.org/10.1029/2011JC007409, 2012.
Carr, M.-E., Friedrichs, M. A. M., Schmeltz, M., Noguchi Aita, M., Antoine, D., Arrigo, K. R., Asanuma, I., Aumont, O., Barber, R., Behrenfeld, M., Bidigare, R., Buitenhuis, E. T., Campbell, J., Ciotti, A., Dierssen, H., Dowell, M., Dunne, J., Esaias, W., Gentili, B., Gregg, W., Groom, S., Hoepffner, N., Ishizaka, J., Kameda, T., Le Quéré, C., Lohrenz, S., Marra, J., Mélin, F., Moore, K., Morel, A., Reddy, T. E., Ryan, J., Scardi, M., Smyth, T., Turpie, K., Tilstone, G., Waters, K., and Yamanaka, Y.: A comparison of global estimates of marine primary production from ocean color, Deep-Sea Res. Pt. II, 53, 741–770, https://doi.org/10.1016/j.dsr2.2006.01.028, 2006.
Cavan, E. L., Trimmer, M., Shelley, F., and Sanders, R.: Remineralization of particulate organic carbon in an ocean oxygen minimum zone, Nat. Commun., 8, 1–9, https://doi.org/10.1038/ncomms14847, 2017.
Cavan, E. L., Henson, S. A., and Boyd, P. W.: The Sensitivity of Subsurface Microbes to Ocean Warming Accentuates Future Declines in Particulate Carbon Export, Front. Ecol. Evol., 6, https://doi.org/10.3389/fevo.2018.00230, 2019.
Collins, M., An, S.-I., Cai, W., Ganachaud, A., Guilyardi, E., Jin, F.-F., Jochum, M., Lengaigne, M., Power, S., Timmermann, A., Vecchi, G., and Wittenberg, A.: The impact of global warming on the tropical Pacific Ocean and El Niño, Nat. Geosci., 3, 391–397, https://doi.org/10.1038/ngeo868, 2010.
Collins, M., Sutherland, M., Bouwer, L., Cheong, S.-M., Frölicher, T., Jacot Des Combes, H., Koll Roxy, M., Losada, I., McInnes, K., Ratter, B., Rivera-Arriaga, E., Susanto, R. D., Swingedouw, D., and Tibig, L.: Chapter 6: Extremes, Abrupt Changes and Managing Risks – IPCC Special Report on the Ocean and Cryosphere in a Changing Climate, available at:: https://www.ipcc.ch/srocc/chapter/chapter-6/ (last access 15 April 2020), 2019.
Cram, J. A., Weber, T., Leung, S. W., McDonnell, A. M. P., Liang, J.-H., and Deutsch, C.: The Role of Particle Size, Ballast, Temperature, and Oxygen in the Sinking Flux to the Deep Sea, Global Biogeochem. Cy., 32, 858–876, https://doi.org/10.1029/2017GB005710, 2018.
Deutsch, C., Ferrel, A., Seibel, B., Pörtner, H.-O., and Huey, R. B.: Climate change tightens a metabolic constraint on marine habitats, Science, 348, 1132–1135, https://doi.org/10.1126/science.aaa1605, 2015.
Deutsch, C., Penn, J. L., and Seibel, B.: Metabolic trait diversity shapes marine biogeography, Nature, 585, 557–562, https://doi.org/10.1038/s41586-020-2721-y, 2020.
Devol, A. H. and Hartnett, H. E.: Role of the oxygen-deficient zone in transfer of organic carbon to the deep ocean, Limnol. Oceanogr., 46, 1684–1690, https://doi.org/10.4319/lo.2001.46.7.1684, 2001.
DeVries, T.: The oceanic anthropogenic CO2 sink: Storage, air-sea fluxes, and transports over the industrial era, Global Biogeochem. Cy., 28, 631–647, https://doi.org/10.1002/2013GB004739, 2014.
DeVries, T. and Weber, T.: The export and fate of organic matter in the ocean: New constraints from combining satellite and oceanographic tracer observations, Global Biogeochem. Cy., 31, 535–555, https://doi.org/10.1002/2016GB005551, 2017.
DeVries, T., Liang, J.-H., and Deutsch, C.: A mechanistic particle flux model applied to the oceanic phosphorus cycle, Biogeosciences, 11, 5381–5398, https://doi.org/10.5194/bg-11-5381-2014, 2014.
Ducklow, H., Steinberg, D., and Buesseler, K.: Upper Ocean Carbon Export and the Biological Pump, Oceanography, 14, 50–58, https://doi.org/10.5670/oceanog.2001.06, 2001.
Dunne, J. P., Armstrong, R. A., Gnanadesikan, A., and Sarmiento, J. L.: Empirical and mechanistic models for the particle export ratio, Global Biogeochem. Cy., 19, https://doi.org/10.1029/2004GB002390, 2005.
Dunne, J. P., Sarmiento, J. L., and Gnanadesikan, A.: A synthesis of global particle export from the surface ocean and cycling through the ocean interior and on the seafloor, Global Biogeochem. Cy., 21, https://doi.org/10.1029/2006GB002907, 2007.
Dunne, J. P., John, J. G., Shevliakova, E., Stouffer, R. J., Krasting, J. P., Malyshev, S. L., Milly, P. C. D., Sentman, L. T., Adcroft, A. J., Cooke, W., Dunne, K. A., Griffies, S. M., Hallberg, R. W., Harrison, M. J., Levy, H., Wittenberg, A. T., Phillips, P. J., and Zadeh, N.: GFDL's ESM2 Global Coupled Climate–Carbon Earth System Models. Part II: Carbon System Formulation and Baseline Simulation Characteristics, J. Climate, 26, 2247–2267, https://doi.org/10.1175/JCLI-D-12-00150.1, 2013.
Durkin, C. A., Estapa, M. L., and Buesseler, K. O.: Observations of carbon export by small sinking particles in the upper mesopelagic, Mar. Chem., 175, 72–81, https://doi.org/10.1016/j.marchem.2015.02.011, 2015.
Emerson, S.: Annual net community production and the biological carbon flux in the ocean, Global Biogeochem. Cy., 28, 14–28, https://doi.org/10.1002/2013GB004680, 2014.
Falkowski, P. G., Barber, R. T., and Smetacek, V.: Biogeochemical Controls and Feedbacks on Ocean Primary Production, Science, 281, 200–206, https://doi.org/10.1126/science.281.5374.200, 1998.
Friedland, K. D., Stock, C., Drinkwater, K. F., Link, J. S., Leaf, R. T., Shank, B. V., Rose, J. M., Pilskaln, C. H., and Fogarty, M. J.: Pathways between Primary Production and Fisheries Yields of Large Marine Ecosystems, PLoS One, 7, https://doi.org/10.1371/journal.pone.0028945, 2012.
Fu, W., Randerson, J. T., and Moore, J. K.: Climate change impacts on net primary production (NPP) and export production (EP) regulated by increasing stratification and phytoplankton community structure in the CMIP5 models, Biogeosciences, 13, 5151–5170, https://doi.org/10.5194/bg-13-5151-2016, 2016.
Galbraith, E. D. and Martiny, A. C.: A simple nutrient-dependence mechanism for predicting the stoichiometry of marine ecosystems, P. Natl. Acad. Sci. USA, 112, 8199–8204, https://doi.org/10.1073/pnas.1423917112, 2015.
Gehlen, M., Bopp, L., Emprin, N., Aumont, O., Heinze, C., and Ragueneau, O.: Reconciling surface ocean productivity, export fluxes and sediment composition in a global biogeochemical ocean model, Biogeosciences, 3, 521–537, https://doi.org/10.5194/bg-3-521-2006, 2006.
Guidi, L., Stemmann, L., Legendre, L., Picheral, M., Prieur, L., and Gorsky, G.: Vertical distribution of aggregates (> 110 µm) and mesoscale activity in the northeastern Atlantic: Effects on the deep vertical export of surface carbon, Limnol. Oceanogr., 52, 7–18, https://doi.org/10.4319/lo.2007.52.1.0007, 2007.
Guidi, L., Jackson, G. A., Stemmann, L., Miquel, J. C., Picheral, M., and Gorsky, G.: Relationship between particle size distribution and flux in the mesopelagic zone, Deep-Sea Res. Pt. I, 55, 1364–1374, https://doi.org/10.1016/j.dsr.2008.05.014, 2008.
Guidi, L., Stemmann, L., Jackson, G. A., Ibanez, F., Claustre, H., Legendre, L., Picheral, M., and Gorskya, G.: Effects of phytoplankton community on production, size, and export of large aggregates: A world-ocean analysis, Limnol. Oceanogr., 54, 1951–1963, https://doi.org/10.4319/lo.2009.54.6.1951, 2009.
Hartnett, H. E. and Devol, A. H.: Role of a strong oxygen-deficient zone in the preservation and degradation of organic matter: a carbon budget for the continental margins of northwest Mexico and Washington State, Geochim. Cosmochim. Ac., 67, 247–264, https://doi.org/10.1016/S0016-7037(02)01076-1, 2003.
Henson, S. A., Sanders, R., Madsen, E., Morris, P. J., Moigne, F. L., and Quartly, G. D.: A reduced estimate of the strength of the ocean's biological carbon pump, Geophys. Res. Lett., 38, https://doi.org/10.1029/2011GL046735, 2011.
Hofmann, M. and Schellnhuber, H.-J.: Oceanic acidification affects marine carbon pump and triggers extended marine oxygen holes, P. Natl. Acad. Sci. USA, 106, 3017–3022, https://doi.org/10.1073/pnas.0813384106, 2009.
Ilyina, T., Six, K. D., Segschneider, J., Maier-Reimer, E., Li, H., and Núñez-Riboni, I.: Global ocean biogeochemistry model HAMOCC: Model architecture and performance as component of the MPI-Earth system model in different CMIP5 experimental realizations, J. Adv. Model. Earth Sy., 5, 287–315, https://doi.org/10.1029/2012MS000178, 2013.
Iversen, M. H. and Ploug, H.: Ballast minerals and the sinking carbon flux in the ocean: carbon-specific respiration rates and sinking velocity of marine snow aggregates, Biogeosciences, 7, 2613–2624, https://doi.org/10.5194/bg-7-2613-2010, 2010.
John, E. H., Wilson, J. D., Pearson, P. N., and Ridgwell, A.: Temperature-dependent remineralization and carbon cycling in the warm Eocene oceans, Palaeogeogr. Palaeocl., 413, 158–166, https://doi.org/10.1016/j.palaeo.2014.05.019, 2014.
Johnson, R., Strutton, P. G., Wright, S. W., McMinn, A., and Meiners, K. M.: Three improved satellite chlorophyll algorithms for the Southern Ocean, J. Geophys. Res.-Oceans, 118, 3694–3703, https://doi.org/10.1002/jgrc.20270, 2013.
Jokulsdottir, T. and Archer, D.: A stochastic, Lagrangian model of sinking biogenic aggregates in the ocean (SLAMS 1.0): model formulation, validation and sensitivity, Geosci. Model Dev., 9, 1455–1476, https://doi.org/10.5194/gmd-9-1455-2016, 2016.
Keeling, R. F., Körtzinger, A., and Gruber, N.: Ocean Deoxygenation in a Warming World, Annu. Rev. Mar. Sci., 2, 199–229, https://doi.org/10.1146/annurev.marine.010908.163855, 2010.
Kostadinov, T. S., Siegel, D. A., and Maritorena, S.: Retrieval of the particle size distribution from satellite ocean color observations, J. Geophys. Res.-Oceans, 114, https://doi.org/10.1029/2009JC005303, 2009.
Kriest, I. and Oschlies, A.: On the treatment of particulate organic matter sinking in large-scale models of marine biogeochemical cycles, Biogeosciences, 5, 55–72, https://doi.org/10.5194/bg-5-55-2008, 2008.
Kwon, E. Y., Primeau, F., and Sarmiento, J. L.: The impact of remineralization depth on the air–sea carbon balance, Nat. Geosci., 2, 630–635, https://doi.org/10.1038/ngeo612, 2009.
Lam, P. J. and Bishop, J. K. B.: High biomass, low export regimes in the Southern Ocean, Deep-Sea Res. Pt. II, 54, 601–638, https://doi.org/10.1016/j.dsr2.2007.01.013, 2007.
Laufkötter, C., Vogt, M., Gruber, N., Aita-Noguchi, M., Aumont, O., Bopp, L., Buitenhuis, E., Doney, S. C., Dunne, J., Hashioka, T., Hauck, J., Hirata, T., John, J., Le Quéré, C., Lima, I. D., Nakano, H., Seferian, R., Totterdell, I., Vichi, M., and Völker, C.: Drivers and uncertainties of future global marine primary production in marine ecosystem models, Biogeosciences, 12, 6955–6984, https://doi.org/10.5194/bg-12-6955-2015, 2015.
Laufkötter, C., Vogt, M., Gruber, N., Aumont, O., Bopp, L., Doney, S. C., Dunne, J. P., Hauck, J., John, J. G., Lima, I. D., Seferian, R., and Völker, C.: Projected decreases in future marine export production: the role of the carbon flux through the upper ocean ecosystem, Biogeosciences, 13, 4023–4047, https://doi.org/10.5194/bg-13-4023-2016, 2016.
Laufkötter, C., John, J. G., Stock, C. A., and Dunne, J. P.: Temperature and oxygen dependence of the remineralization of organic matter, Global Biogeochem. Cy., 31, 1038–1050, https://doi.org/10.1002/2017GB005643, 2017.
Laurenceau-Cornec, E. C., Moigne, F. A. C. L., Gallinari, M., Moriceau, B., Toullec, J., Iversen, M. H., Engel, A., and Rocha, C. L. D. L.: New guidelines for the application of Stokes' models to the sinking velocity of marine aggregates, Limnol. Oceanogr., 65, 1264–1285, https://doi.org/10.1002/lno.11388, 2020.
Laws, E. A., Falkowski, P. G., Smith, W. O., Ducklow, H., and McCarthy, J. J.: Temperature effects on export production in the open ocean, Global Biogeochem. Cy., 14, 1231–1246, https://doi.org/10.1029/1999GB001229, 2000.
Laws, E. A., D'Sa, E., and Naik, P.: Simple equations to estimate ratios of new or export production to total production from satellite-derived estimates of sea surface temperature and primary production, Limnol. Oceanogr.-Meth., 9, 593–601, https://doi.org/10.4319/lom.2011.9.593, 2011.
Le Quéré, C., Harrison, S. P., Prentice, I. C., Buitenhuis, E. T., Aumont, O., Bopp, L., Claustre, H., Cunha, L. C. D., Geider, R., Giraud, X., Klaas, C., Kohfeld, K. E., Legendre, L., Manizza, M., Platt, T., Rivkin, R. B., Sathyendranath, S., Uitz, J., Watson, A. J., and Wolf-Gladrow, D.: Ecosystem dynamics based on plankton functional types for global ocean biogeochemistry models, Glob. Change Biol., 11, 2016–2040, https://doi.org/10.1111/j.1365-2486.2005.1004.x, 2005.
Lee, Z., Weidemann, A., Kindle, J., Arnone, R., Carder, K. L., and Davis, C.: Euphotic zone depth: Its derivation and implication to ocean-color remote sensing, J. Geophys. Res.-Oceans, 112, https://doi.org/10.1029/2006JC003802, 2007.
Letscher, R. T., Primeau, F., and Moore, J. K.: Nutrient budgets in the subtropical ocean gyres dominated by lateral transport, Nat. Geosci., 9, 815–819, https://doi.org/10.1038/ngeo2812, 2016.
Leung, S.: Data and model output for figures, in: Variable particle size distributions reduce the sensitivity of global export flux to climate change, available at: https://doi.org/10.5281/zenodo.4117382, last access: 5 May 2020.
Litchman, E., Klausmeier, C. A., Schofield, O. M., and Falkowski, P. G.: The role of functional traits and trade-offs in structuring phytoplankton communities: scaling from cellular to ecosystem level, Ecol. Lett., 10, 1170–1181, https://doi.org/10.1111/j.1461-0248.2007.01117.x, 2007.
Locarnini, R. A., Mishonov, A. V., Antonov, J. I., Boyer, T. P., Garcia, H. E., Baranova, O. K., Zweng, M. M., and Johnson, D. R.: World Ocean Atlas 2009, Volume 1: Temperature, edited by: Levitus, S., NOAA Atlas NESDIS 68, U.S. Government Printing Office, Washington, D.C., 184 pp., 2010.
Long, M. C., Deutsch, C., and Ito, T.: Finding forced trends in oceanic oxygen, Global Biogeochem. Cy., 30, 381–397, https://doi.org/10.1002/2015GB005310, 2016.
Mari, X., Passow, U., Migon, C., Burd, A. B., and Legendre, L.: Transparent exopolymer particles: Effects on carbon cycling in the ocean, Prog. Oceanogr., 151, 13–37, https://doi.org/10.1016/j.pocean.2016.11.002, 2017.
Marinov, I., Gnanadesikan, A., Toggweiler, J. R., and Sarmiento, J. L.: The Southern Ocean biogeochemical divide, Nature, 441, 964–967, https://doi.org/10.1038/nature04883, 2006.
Marsay, C. M., Sanders, R. J., Henson, S. A., Pabortsava, K., Achterberg, E. P., and Lampitt, R. S.: Attenuation of sinking particulate organic carbon flux through the mesopelagic ocean, P. Natl. Acad. Sci. USA, 112, 1089–1094, https://doi.org/10.1073/pnas.1415311112, 2015.
Martin, J. H., Knauer, G. A., Karl, D. M., and Broenkow, W. W.: VERTEX: carbon cycling in the northeast Pacific, Deep-Sea Res., 34, 267–285, https://doi.org/10.1016/0198-0149(87)90086-0, 1987.
Martínez-García, A., Sigman, D. M., Ren, H., Anderson, R. F., Straub, M., Hodell, D. A., Jaccard, S. L., Eglinton, T. I., and Haug, G. H.: Iron Fertilization of the Subantarctic Ocean During the Last Ice Age, Science, 343, 1347–1350, https://doi.org/10.1126/science.1246848, 2014.
Matear, R. J. and Hirst, A. C.: Long-term changes in dissolved oxygen concentrations in the ocean caused by protracted global warming, Global Biogeochem. Cy., 17, https://doi.org/10.1029/2002GB001997, 2003.
Matsumoto, K.: Biology-mediated temperature control on atmospheric pCO2 and ocean biogeochemistry, Geophys. Res. Lett., 34, https://doi.org/10.1029/2007GL031301, 2007a.
Matsumoto, K.: Radiocarbon-based circulation age of the world oceans, J. Geophys. Res.-Oceans, 112, https://doi.org/10.1029/2007JC004095, 2007b.
McDonnell, A. M. P. and Buesseler, K. O.: Variability in the average sinking velocity of marine particles, Limnol. Oceanogr., 55, 2085–2096, https://doi.org/10.4319/lo.2010.55.5.2085, 2010.
McDonnell, A. M. P., Boyd, P. W., and Buesseler, K. O.: Effects of sinking velocities and microbial respiration rates on the attenuation of particulate carbon fluxes through the mesopelagic zone, Global Biogeochem. Cy., 29, 175–193, https://doi.org/10.1002/2014GB004935, 2015.
Moore, J. K., Doney, S. C., and Lindsay, K.: Upper ocean ecosystem dynamics and iron cycling in a global three-dimensional model, Global Biogeochem. Cy., 18, https://doi.org/10.1029/2004GB002220, 2004.
Moore, J. K., Fu, W., Primeau, F., Britten, G. L., Lindsay, K., Long, M., Doney, S. C., Mahowald, N., Hoffman, F., and Randerson, J. T.: Sustained climate warming drives declining marine biological productivity, Science, 359, 1139–1143, https://doi.org/10.1126/science.aao6379, 2018.
Niemeyer, D., Kriest, I., and Oschlies, A.: The effect of marine aggregate parameterisations on nutrients and oxygen minimum zones in a global biogeochemical model, Biogeosciences, 16, 3095–3111, https://doi.org/10.5194/bg-16-3095-2019, 2019.
Passow, U.: Transparent exopolymer particles (TEP) in aquatic environments, Prog. Oceanogr., 55, 287–333, https://doi.org/10.1016/S0079-6611(02)00138-6, 2002.
Passow, U. and Carlson, C. A.: The biological pump in a high CO2 world, Mar.-Ecol. Prog. Ser., 470, 249–271, https://doi.org/10.3354/meps09985, 2012.
Reuer, M. K., Barnett, B. A., Bender, M. L., Falkowski, P. G., and Hendricks, M. B.: New estimates of Southern Ocean biological production rates from O2∕Ar ratios and the triple isotope composition of O2, Deep-Sea Res. Pt. I, 54, 951–974, https://doi.org/10.1016/j.dsr.2007.02.007, 2007.
Romanou, A., Gregg, W. W., Romanski, J., Kelley, M., Bleck, R., Healy, R., Nazarenko, L., Russell, G., Schmidt, G. A., Sun, S., and Tausnev, N.: Natural air–sea flux of CO2 in simulations of the NASA-GISS climate model: Sensitivity to the physical ocean model formulation, Ocean Model., 66, 26–44, https://doi.org/10.1016/j.ocemod.2013.01.008, 2013.
Rossow, W. B. and Schiffer, R. A.: Advances in Understanding Clouds from ISCCP, B. Am. Meteorol. Soc., 80, 2261–2288, https://doi.org/10.1175/1520-0477(1999)080<2261:AIUCFI>2.0.CO;2, 1999.
Sarmiento, J. L. and Siegenthaler, U.: New Production and the Global Carbon Cycle, in: Primary Productivity and Biogeochemical Cycles in the Sea, edited by: Falkowski, P. G., Woodhead, A. D., and Vivirito, K., Springer US, Boston, MA, 317–332, 1992.
Sarmiento, J. L., Gruber, N., Brzezinski, M. A., and Dunne, J. P.: High-latitude controls of thermocline nutrients and low latitude biological productivity, Nature, 427, 56–60, https://doi.org/10.1038/nature02127, 2004.
Schmidtko, S., Stramma, L., and Visbeck, M.: Decline in global oceanic oxygen content during the past five decades, Nature, 542, 335–339, https://doi.org/10.1038/nature21399, 2017.
Schwinger, J., Goris, N., Tjiputra, J. F., Kriest, I., Bentsen, M., Bethke, I., Ilicak, M., Assmann, K. M., and Heinze, C.: Evaluation of NorESM-OC (versions 1 and 1.2), the ocean carbon-cycle stand-alone configuration of the Norwegian Earth System Model (NorESM1), Geosci. Model Dev., 9, 2589–2622, https://doi.org/10.5194/gmd-9-2589-2016, 2016.
Séférian, R., Berthet, S., Yool, A., Palmiéri, J., Bopp, L., Tagliabue, A., Kwiatkowski, L., Aumont, O., Christian, J., Dunne, J., Gehlen, M., Ilyina, T., John, J. G., Li, H., Long, M. C., Luo, J. Y., Nakano, H., Romanou, A., Schwinger, J., Stock, C., Santana-Falcón, Y., Takano, Y., Tjiputra, J., Tsujino, H., Watanabe, M., Wu, T., Wu, F., and Yamamoto, A.: Tracking Improvement in Simulated Marine Biogeochemistry Between CMIP5 and CMIP6, Current Climate Change Reports, 6, 95–119, https://doi.org/10.1007/s40641-020-00160-0, 2020.
Sheldon, R. W., Prakash, A., and Sutcliffe, W. H.: The Size Distribution of Particles in the Ocean, Limnol. Oceanogr., 17, 327–340, https://doi.org/10.4319/lo.1972.17.3.0327, 1972.
Siegel, D. A., Buesseler, K. O., Doney, S. C., Sailley, S. F., Behrenfeld, M. J., and Boyd, P. W.: Global assessment of ocean carbon export by combining satellite observations and food-web models, Global Biogeochem. Cy., 28, 181–196, https://doi.org/10.1002/2013GB004743, 2014.
Smayda, T. J.: Normal and accelerated sinking of phytoplankton in the sea, Mar. Geol., 11, 105–122, https://doi.org/10.1016/0025-3227(71)90070-3, 1971.
Smith, T. M., Reynolds, R. W., Peterson, T. C., and Lawrimore, J.: Improvements to NOAA's Historical Merged Land–Ocean Surface Temperature Analysis (1880–2006), J. Climate, 21, 2283–2296, https://doi.org/10.1175/2007JCLI2100.1, 2008.
Steinberg, D. K., Lomas, M. W., and Cope, J. S.: Long-term increase in mesozooplankton biomass in the Sargasso Sea: Linkage to climate and implications for food web dynamics and biogeochemical cycling, Global Biogeochem. Cy., 26, https://doi.org/10.1029/2010GB004026, 2012.
Thornton, D. C. O.: Dissolved organic matter (DOM) release by phytoplankton in the contemporary and future ocean, Eur. J. Phycol., 49, 20–46, https://doi.org/10.1080/09670262.2013.875596, 2014.
Tjiputra, J. F., Roelandt, C., Bentsen, M., Lawrence, D. M., Lorentzen, T., Schwinger, J., Seland, Ø., and Heinze, C.: Evaluation of the carbon cycle components in the Norwegian Earth System Model (NorESM), Geosci. Model Dev., 6, 301–325, https://doi.org/10.5194/gmd-6-301-2013, 2013.
Toggweiler, J. R. and Russell, J.: Ocean circulation in a warming climate, Nature, 451, 286–288, https://doi.org/10.1038/nature06590, 2008.
Totterdell, I. J.: Description and evaluation of the Diat-HadOCC model v1.0: the ocean biogeochemical component of HadGEM2-ES, Geosci. Model Dev., 12, 4497–4549, https://doi.org/10.5194/gmd-12-4497-2019, 2019.
Tsujino, H., Motoi, T., Ishikawa, I., Hirabara, M., Nakano, H., Yamanaka, G., Yasuda, T., and Ishizaki, H.: Reference manual for the Meteorological Research Institute Community Ocean Model (MRI.COM) version 3., 2010.
Turner, J. T.: Zooplankton fecal pellets, marine snow, phytodetritus and the ocean's biological pump, Prog. Oceanogr., 130, 205–248, https://doi.org/10.1016/j.pocean.2014.08.005, 2015.
Van Mooy, B. A. S., Keil, R. G., and Devol, A. H.: Impact of suboxia on sinking particulate organic carbon: Enhanced carbon flux and preferential degradation of amino acids via denitrification, Geochim. Cosmochim. Ac., 66, 457–465, https://doi.org/10.1016/S0016-7037(01)00787-6, 2002.
Watanabe, S., Hajima, T., Sudo, K., Nagashima, T., Takemura, T., Okajima, H., Nozawa, T., Kawase, H., Abe, M., Yokohata, T., Ise, T., Sato, H., Kato, E., Takata, K., Emori, S., and Kawamiya, M.: MIROC-ESM 2010: model description and basic results of CMIP5-20c3m experiments, Geosci. Model Dev., 4, 845–872, https://doi.org/10.5194/gmd-4-845-2011, 2011.
Weber, T. and Deutsch, C.: Oceanic nitrogen reservoir regulated by plankton diversity and ocean circulation, Nature, 489, 419–422, https://doi.org/10.1038/nature11357, 2012.
Weber, T., Cram, J. A., Leung, S. W., DeVries, T., and Deutsch, C.: Deep ocean nutrients imply large latitudinal variation in particle transfer efficiency, P. Natl. Acad. Sci. USA, 113, 8606–8611, https://doi.org/10.1073/pnas.1604414113, 2016.
White, A. E., Letelier, R. M., Whitmire, A. L., Barone, B., Bidigare, R. R., Church, M. J., and Karl, D. M.: Phenology of particle size distributions and primary productivity in the North Pacific subtropical gyre (Station ALOHA), J. Geophys. Res.-Oceans, 120, 7381–7399, https://doi.org/10.1002/2015JC010897, 2015.
Yamanaka, Y. and Tajika, E.: The role of the vertical fluxes of particulate organic matter and calcite in the oceanic carbon cycle: Studies using an ocean biogeochemical general circulation model, Global Biogeochem. Cy., 10, 361–382, https://doi.org/10.1029/96GB00634, 1996.
Zahariev, K., Christian, J. R., and Denman, K. L.: Preindustrial, historical, and fertilization simulations using a global ocean carbon model with new parameterizations of iron limitation, calcification, and N2 fixation, Prog. Oceanogr., 77, 56–82, https://doi.org/10.1016/j.pocean.2008.01.007, 2008.