the Creative Commons Attribution 4.0 License.
the Creative Commons Attribution 4.0 License.
 | 19 Apr 2021
Drivers and impact of the seasonal variability of the organic carbon offshore transport in the Canary upwelling system
Elisa Lovecchio
Nicolas Gruber
Matthias Münnich
Simona Masina
Doroteaciro Iovino
The Canary upwelling system (CanUS) is a productive coastal region characterized by strong seasonality and an intense offshore transport of organic carbon (Corg) to the adjacent oligotrophic offshore waters. There, the respiration of this Corg substantially modifies net community production (NCP). While this transport and the resulting coupling of the biogeochemistry between the coastal and open ocean has been well studied in the annual mean, the temporal variability, and especially its seasonality, has not yet been investigated. Here, we determine the seasonal variability of the offshore transport of Corg, its mesoscale component, latitudinal differences, and the underlying physical and biological drivers. To this end, we employ the Regional Ocean Modeling System (ROMS) coupled to a nutrient–phytoplankton–zooplankton–detritus (NPZD) ecosystem model. Our results reveal the importance of the mesoscale fluxes and of the upwelling processes (coastal upwelling and Ekman pumping) in modulating the seasonal variation of the offshore Corg transport. We find that the region surrounding Cape Blanc (21∘ N) hosts the most intense Corg offshore flux in every season, linked to the persistent, and far reaching Cape Blanc filament and its interaction with the Cape Verde Front. Coastal upwelling filaments dominate the seasonality of the total offshore flux up to 100 km from the coast, contributing in every season at least 80 % to the total flux. The seasonality of the upwelling modulates the offshore Corg seasonality hundreds of kilometers from the CanUS coast via lateral redistribution of nearshore production. North of 24.5∘ N, the sharp summer–fall peak of coastal upwelling results in an export of more than 30 % of the coastal Corg at 100 km offshore due to a combination of intensified nearshore production and offshore fluxes. To the south, the less pronounced upwelling seasonality regulates an overall larger but farther-reaching and less seasonally varying lateral flux, which exports between 60 % and 90 % of the coastal production more than 100 km offshore. Overall, we show that the temporal variability of nearshore processes modulates the variability of Corg and NCP hundreds of kilometers offshore from the CanUS coast via the offshore transport of the nearshore production.
- Article
(4709 KB) - Full-text XML
- BibTeX
- EndNote


Eastern boundary upwelling systems (EBUSs) are coastal regions of immense socioeconomic value for human communities, as they constitute some of the most important fisheries yields worldwide, fueled by the high productivity that characterizes these systems (Pauly and Christensen, 1995; Chavez and Toggweiler, 1995). The high nearshore productivity of these regions is sustained by the upwelling of nutrient-rich waters, primarily impacting the first 100 km from the coast (Mackas et al., 2006; Carr, 2001). The main driver of this upwelling are trade winds blowing towards the Equator which, combined with the Coriolis effect, induce an offshore Ekman transport of the near-surface waters. This forces a surfacing of thermocline waters along the coast and a net upward transport, i.e., upwelling (Carr and Kearns, 2003). Additional upwelling is induced by curl of wind stress that occurs in many offshore regions of the EBUSs (Messié et al., 2009).
Both the large-scale circulation and the coastal upwelling in EBUSs are characterized by substantial temporal variability. The temporal scales vary from the decadal and interannual timescales associated with phenomena such as the Atlantic Multidecadal Oscillation and the El Niño Southern Oscillation (ENSO) to weekly or daily variations associated with short-lived wind anomalies (Bonino et al., 2019a; Jacox et al., 2015; Desbiolles et al., 2014). Global climate change further affects the dynamics of these systems (Bonino et al., 2019a; Wang et al., 2015). These processes induce strong modulations of biological production, biogeochemical activity, and ecosystem structure and composition (Pradhan et al., 2006; Rykaczewski and Checkley, 2008; Frischknecht et al., 2018). Among the four major EBUSs, the Canary upwelling system (CanUS) is characterized by the most intense seasonal variations, which drive the majority of the observed physical and biogeochemical fluctuations in the region (Chavez and Messié, 2009).
The CanUS is located along the northwestern African coast and constitutes the eastern boundary of the North Atlantic subtropical and tropical circulation (Pelegrí and Peña-Izquierdo, 2015; Mittelstaedt, 1991). The Iberian upwelling coast is often also included in the definition of the CanUS (Arístegui et al., 2009), although in this paper we only focus on the northwestern African sector. A combination of elevated light and nutrient availability, high iron supply, and long residence time of the upwelled waters in the nearshore areas makes the CanUS the second most productive EBUS (Lachkar and Gruber, 2011; Carr, 2001). Together with a complex coastal pattern of capes and embayments, the CanUS is characterized by substantial latitudinal variations in coastal inclination and topography, which allow us to define zonal subregions that are distinct in terms of seasonality of upwelling, biological production, and circulation (Pelegrí and Peña-Izquierdo, 2015; Pelegrí and Benazzouz, 2015).
The northern portion of the CanUS, located roughly between 25 and 32∘ N, is dominated by the alongshore southward flow of the Canary Current (CC) and the Canary Upwelling Current (CUC) (Fig. 1), which constitute the easternmost component of the North Atlantic Subtropical Gyre (NASG) (Pelegrí and Peña-Izquierdo, 2015; Arístegui et al., 2009). The CC is characterized by pronounced seasonal variability, including a summer intensification and a temporary reversal in fall (Mason et al., 2011; Hernández-Guerra et al., 2002). The northern CanUS is home to multiple semi-recurrent upwelling filaments associated with the many capes. This region is also characterized by intense mesoscale activity in the form of coastal and island generated eddies (Sangrà et al., 2009; Garcìa-Muñoz et al., 2004). At these latitudes, the coastally confined upwelling signature in temperature and surface chlorophyll is characterized by a sharp peak during late summer to early fall. Offshore, the negative wind stress curl deepens the nutricline in the open waters (Lathuilière et al., 2008; Pelegrí and Benazzouz, 2015). The combination of these two processes gives rise to very strong offshore gradients in tracer concentrations of carbon and nutrients (Arístegui et al., 2009).
South of 25∘ N, we find the convergence zone of the southward flowing CC and of the northward flowing Mauritanian Current (MC), the latter being characterized by a summer–fall intensification (Lázaro et al., 2005). The two currents merge and detach from the coastline at Cape Blanc (21∘ N), continuing offshore along the Cape Verde frontal zone (Pelegrí and Peña-Izquierdo, 2015; Arístegui et al., 2009). Associated with this offshore flow is the near-permanent Cape Blanc filament, which stretches up to 700 km into the open waters (Gabric et al., 1993; Ohde et al., 2015). The size of this Cape Blanc filament is enormous, making it one of the biggest filaments among all EBUSs. Cape Blanc also defines the boundary between the northern portion of the coastline (>21∘ N), characterized by a slight east–west tilt and nearly continuous upwelling, and the southern (<21∘ N) north–south oriented coastline, characterized by spring-intensified upwelling (Benazzouz et al., 2014). While the tropical circulation found south of Cape Blanc is relatively weak with small and highly seasonal coastal filaments (Peña-Izquierdo et al., 2012; Menna et al., 2016), high upwelled nutrient concentrations and a widespread positive wind stress curl signature fuel high productivity both at the coast and offshore (Arístegui et al., 2006).
Owing to the simultaneous presence of cross-shore mass fluxes and of tracer gradients, EBUSs laterally export large amounts of organic and inorganic material properties to the adjacent oligotrophic waters (Nagai et al., 2015; Lachkar and Gruber, 2011; Amos et al., 2019). Among these fluxes, the offshore transport of coastally produced organic carbon (Corg) is especially important, as this might help to explain the purported net heterotrophy of some oligotrophic open waters that are located adjacent to some of these EBUSs (Burd et al., 2010; Arístegui et al., 2003; Pelegrí et al., 2005). For example, the CanUS was shown to transport more than one-third of its coastal net community production (NCP) toward the offshore, reaching as far as 2000 km from the coast (Lovecchio et al., 2017). This enhanced supply of Corg to the North Atlantic Subtropical Gyre increases respiration there, pushing vertically integrated net community production to become negative. Over a year, narrow coastal filaments are, on average, responsible for about 80 % of this offshore flux at 100 km from the coast, while coastally generated mesoscale eddies dominate this transport further offshore (Lovecchio et al., 2018).
In contrast to the relatively well studied annual mean offshore transport, substantially less is known about its seasonal nature and how this impacts biological activity in the open waters. Given the intensity of this transport, it is very likely that the strong seasonal variability of coastal upwelling and production is readily transferred towards the open ocean, albeit with some temporal delay. There, and especially in the nutrient deprived subtropical gyres, the seasonality of the lateral supply may be rather critical, especially when this lateral supply occurs during the summer when the nutrient deficiency is most acute. In this paper, we quantify the seasonal variability of the offshore flux of Corg in the CanUS. In particular, we analyze the relative role of the mean and mesoscale circulation in each season, we study the role of upwelling seasonality as physical drivers of the offshore fluxes and we discuss the impact of these offshore flux changes on the ecosystem of the open waters.
2.1 Model setup and output
Our analysis of the seasonality of the offshore transport in the CanUS is based on the results from a CanUS model simulation undertaken and described by Lovecchio et al. (2018). This simulation used the UCLA-ETH version of the Regional Ocean Modeling System (ROMS) (Shchepetkin and McWilliams, 2005) coupled with a nutrient–phytoplankton–zooplankton–detritus (NPZD) ecosystem model (Gruber et al., 2006). This coupled model was run with monthly climatological forcing derived from ERA-Interim (Dee et al., 2011) on an Atlantic telescopic grid. This grid combines a full Atlantic basin perspective with a mesoscale-resolving resolution in the region of study, achieved through a strong grid refinement towards the northwestern African coast. We refer to Lovecchio et al. (2017) and Lovecchio et al. (2018) for further details on the model, on its forcing, and for providing a careful evaluation against a large range of observational constraints.
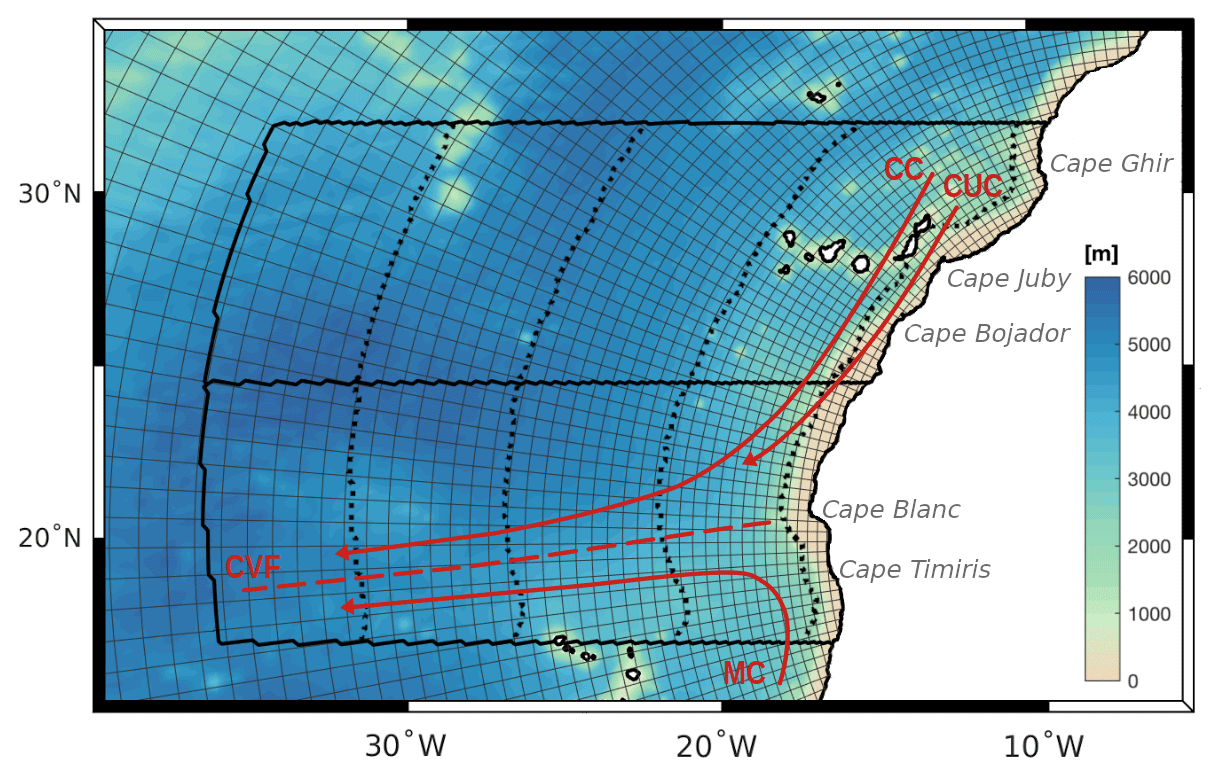
Figure 1Atlantic telescopic grid zoomed around the region of study with every fifth grid line plotted. Black solid contours highlight the northern and central subregions of study. Black dotted lines indicate the offshore boundaries at 100, 500, 1000, and 1500 km from the coast. Red lines provide a simplified scheme of the mean regional pattern of currents: Canary Current (CC), Canary Upwelling Current (CUC), Mauritanian Current (MC), and Cape Verde Front (CVF). Shading: depth of topography [meters].
The simulation we are analyzing was run for 53 years, of which we use the last 24 years for our analyses. We use data in the form of 2 d means (2 day means). On top of the necessary state variables, i.e., temperature, sea surface height (SSH), velocity fields and Corg concentration, the model was set up to also output net community production (NCP) calculated at run time for each grid cell from total biological production minus all respiration fluxes. The lateral fluxes of Corg were calculated from the model output as the product of the horizontal velocities and the tracer concentration. Throughout this paper, we focus on the 100 m depth, which corresponds to the mean depth of the euphotic layer (i.e., the productive layer) in the region of study.
In our employed NPZD model, Corg corresponds to the sum of non-sinking zooplankton, sinking phytoplankton, and a small detritus pool that sinks slowly and a large detritus pool that sinks fast. No dissolved organic pool (DOC) is included in the model; we address this shortcoming in the Discussion (Sect. 5.2 “Model limitations”). For the purpose of our model evaluation and analysis, we define the four seasons as follows: spring is the mean of March, April, and May (MAM), summer is the mean of June, July, and August (JJA), fall is the mean of September, October, and November (SON), and winter is the mean of December, January, and February (DJF). Since one year of model output consists of 360 d, we define the unit “season” (seas) as 90 d of simulation.
2.2 Region of study
We analyze both the entire CanUS system from 17 to 32∘ N, and its central and northern subregions separately, with the subregional border located at 24.5∘ N. The central subregion (CSR) thus extends from 17 to 24.5∘ N and the northern subregion (NSR) from 24.5 to 32∘ N (Fig. 1). This corresponds to the two homonym subregions studied in Lovecchio et al. (2018). Our main motivation for restricting our analyses on the CSR and NSR is that the model performs well in these two regions, especially compared to the southern CanUS subregion (<17∘ N) where the model biases tend to be much larger (Lovecchio et al., 2017, 2018).
We study tracer concentrations and fluxes from the northwestern African coast out to an offshore distance of 2000 km, corresponding to the middle of the North Atlantic Gyre. We divide the offshore region of the upwelling system in five bands having the following boundaries defined as isolines of offshore distance from the CanUS coast: (1) [0, 100 km] (offshore band directly impacted by the coastal upwelling); (2) [100, 500 km]; (3) [500, 1000 km]; (4) [1000, 1500 km]; and (5) [1500, 2000 km]. In the region of study, up to 2000 km offshore, the model grid has a resolution of between (4) 7 and 19 km, with the highest resolution found at the upwelling coast.
2.3 Upwelling estimation
To diagnose the potential drivers of the flux variability, we estimate the magnitudes of the offshore coastal transport (U) and of Ekman pumping (wE) from the forcing. The offshore coastal transport is obtained from the “classical” Ekman transport:
where τas is the alongshore wind stress, ρ is the density of sea water, and f is the Coriolis parameter. U (m2 s−1 or m3 s−1 per m of coast) is calculated as result of the mean τas in the first 100 km from the coast in order to be consistent with the calculated offshore fluxes. Then, it is integrated along the coast in order to obtain the vertical transport. U units are m3 s−1 or Sverdrup (Sv) (1 Sv =106 m3 s−1). Ekman pumping is estimated from
where curl(τ) is the wind stress curl, ρ is the density of sea water, and f is the Coriolis parameter. wE (m s−1) is integrated offshore in the first 100 km (to obtain m2 s−1 or m3 s−1 m of coast) and along the coast in order to obtain the vertical transport (wE in m3 s−1 or Sv). Following Messié et al. (2009), all negative values are set to 0 before integrating wE (m s−1). This is done to reflect an asymmetry in the transport of nutrients. When the Ekman pumping is positive (upward), nutrients are brought from the thermocline to the surface and stimulate biological production. In contrast, when the Ekman pumping is negative (downward), essentially no nutrients are transported downwards, since most of them have already been consumed.
2.4 Eddy and filament budgets and fluxes
The contribution of mesoscale eddies and upwelling filaments to the Corg budget and fluxes is calculated using the same structure identification algorithms as those employed in Lovecchio et al. (2018). Cyclonic eddies (CEs) and anticyclonic eddies (AEs) are separately found using the SSH-based identification algorithm developed by Faghmous et al. (2015). This algorithm retrieves the exact contour of each eddy at each time step according to the shape of the SSH. At each time step, the CE and AE masks are defined as 2D fields of zeros and ones, with ones corresponding to the surfaces of the retrieved eddies on the grid. Upwelling filaments are found through the use of the identification algorithm based on the sea surface temperature (SST) fully described and evaluated in the supplement to Lovecchio et al. (2018). In analogy with the eddy identification routine, this algorithm builds a zero–one filament mask for each time step, with the ones identifying the filaments. The upwelling filament identification algorithm reads at each time step the locations of the previously identified eddies (both CEs and AEs) and excludes their surfaces from the filament mask. This makes sure that the filament and eddy masks never overlap. At each time step, the area that is not covered by either the eddy field or the filament field is defined as non-eddy–non-filament (NE–NF) field.
Although the algorithms identify the structures at the surface only, we assume that the eddies and filaments have a vertical prismatic structure, i.e., they occupy the same i,j grid points at each depth. We consider this a good approximation as we only focus on fluxes and budgets in the euphotic layer (defined as the first 100 m depth). Fluxes and budgets for each type of structure are calculated by multiplying at each time step the eddy and filament masks by the 2D fields of concentrations or fluxes integrated vertically over the euphotic layer depth.
We summarize here the main relevant findings of the model evaluation for the CanUS in the region [17, 32∘ N]. We refer the reader to Lovecchio et al. (2017) and Lovecchio et al. (2018) for additional details.
In the annual mean, the model-observation misfits (biases) of SST and sea surface salinity (SSS) are smaller than 0.75 ∘C and 0.2, respectively. The regional pattern of currents including the alongshore flowing Canary Current and Mauritanian Current and the Cape Verde Front are well reproduced by the model. The regional pattern and offshore gradient of net primary production (NPP) as well as surface particulate organic carbon (POC) correlate well with satellite derived estimates (correlation >0.7) even though the model is biased slightly low at latitudes <25∘ N.
The model represents the observed seasonal variability of currents and biological activity in the region of study reasonably well (Lovecchio et al., 2017). Modeled horizontal velocities in each season reproduce in both magnitude and pattern those obtained from drifter data (Lumpkin and Johnson, 2013), with an intensification of the Canary Current in summer and a more intense Mauritanian Current circulation in fall and winter. The Ekman offshore transport is maximum in summer north of Cape Blanc (21∘ N) and in winter–spring south of it. Biological activity also follows such a seasonal pattern, with coastal NPP showing a peak in summer and spring, respectively, north and south of 21∘ N. As expected, between 21 and 25∘ N, in the proximity of Cape Blanc, coastal NPP remains quite high in all seasons compared to the surrounding latitudes. The absolute value of NPP is biased low when compared to satellite derived products such as SeaWiFS VGPM and CbPM (Behrenfeld and Falkowski, 1997; Westberry et al., 2008), reaching one-third and two-thirds of their magnitude, respectively. However, its pattern correlates well with SeaWiFS VGPM (0.8) and CbPM (0.7) in all seasons, giving us confidence that the relative impact of the Corg fluxes on the offshore biological activity is well represented in the model. Absolute Corg fluxes, however, may be biased low. Further discussion of these strengths and limitations are provided in the model evaluation and discussion of Lovecchio et al. (2017).
Both the modeled turbulent kinetic energy and the standard deviation of SSH are especially close in both pattern and magnitude to the ones derived from the AVISO satellite products (Maheu et al., 2014), confirming that the model provides a good representation of the highly variable and small-scale flow in the region (Lovecchio et al., 2018). In the region of study, differences between the modeled and the satellite-derived turbulent kinetic energy consist mostly of higher modeled values in the nearshore, likely due to small-scale coastal filaments that are resolved by the model but are not captured by the lower resolution satellite data. The regional pattern of large eddy (>50 km diameter) density retrieved by the identification algorithm (Faghmous et al., 2015) in model and satellite data are also especially similar in both offshore gradient and absolute value, with peaks in the eddy density in the proximity of the coast and of the Canary archipelago. The portion of time occupied by filaments for each grid point according to our identification algorithm is highest in correspondence with capes that are known to be associated to recurrent upwelling filaments. We therefore expect our filament field to reproduce quite well the known regional pattern of these structures.
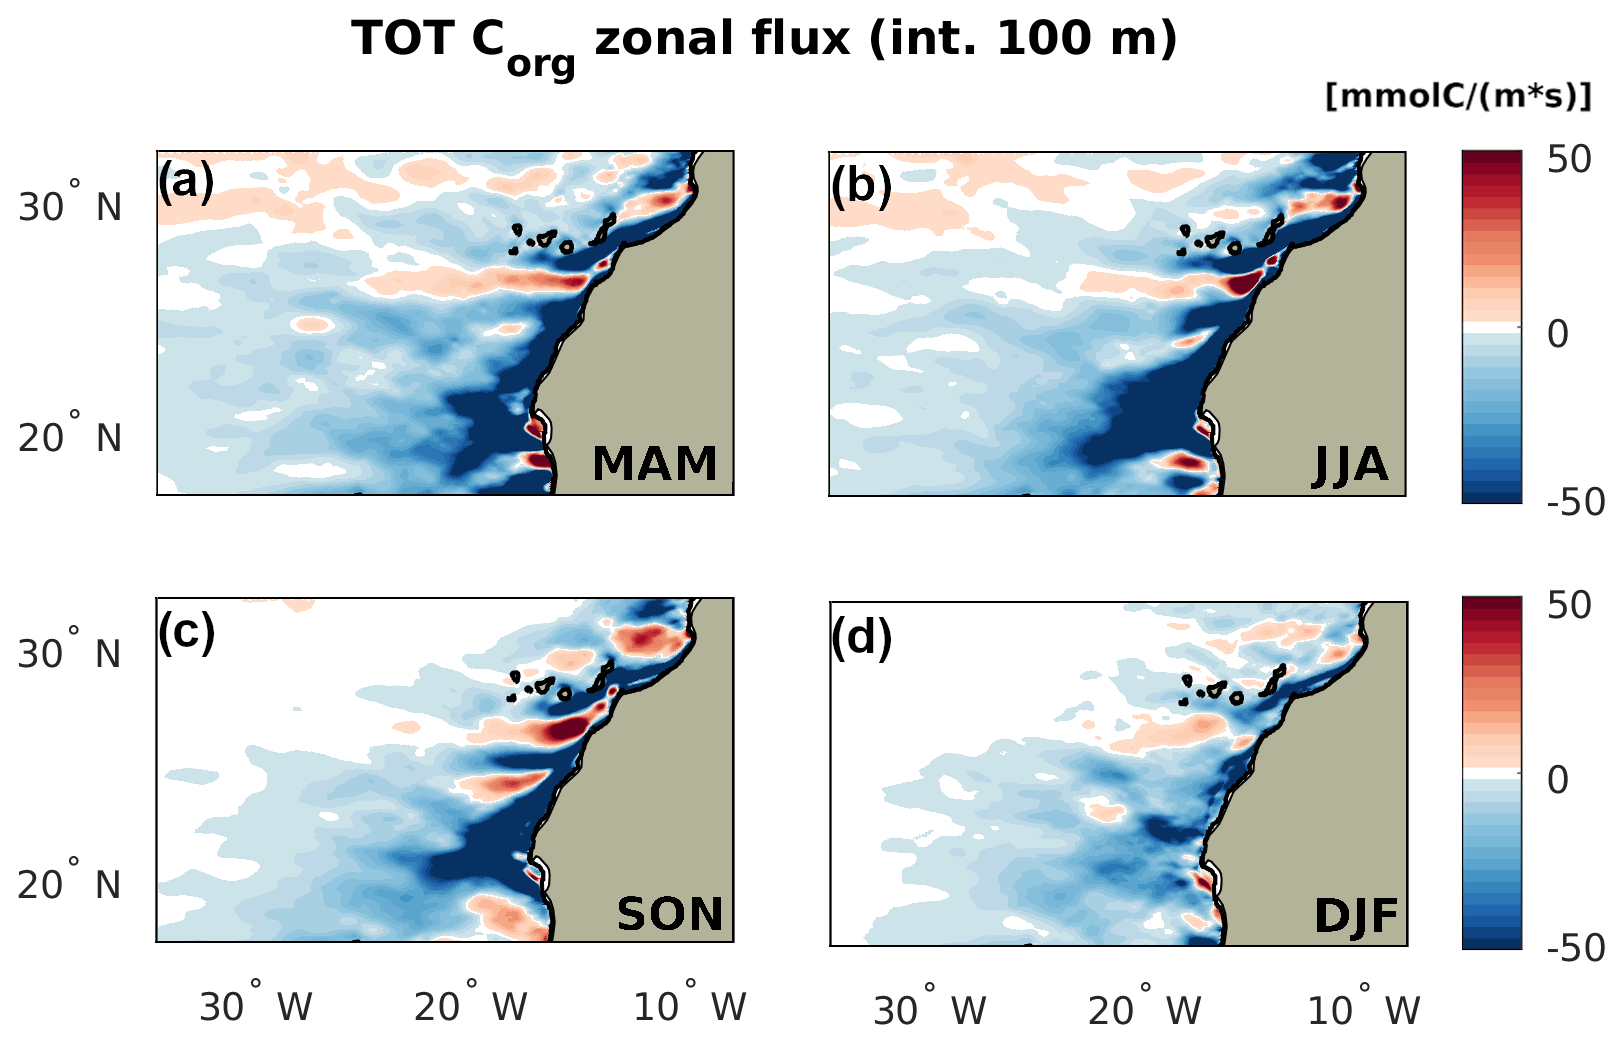
Figure 2Seasonality of the total zonal transport of Corg by season, with positive indicating eastward. The flux is integrated over the top 100 m depth. Subpanels: (a) spring (MAM), (b) summer (JJA), (c) fall (SON), and (d) winter (DJF).
4.1 Seasonality of the total offshore transport of Corg
The model-simulated Corg offshore flux, marked by a negative (westward) signature of the 100 m integrated zonal flux (Fig. 2), varies seasonally in offshore extension and intensity. Summer is characterized by the most intense offshore flux in the nearshore at all latitudes. The flux reaches farther into the open NASG in spring and summer, when it is clearly visible up to the offshore boundary of our analysis domain, at about 2000 km from the northwestern African coast.
In fall and winter, the Corg offshore flux has a more limited extent at all latitudes, with the CSR maintaining the farthest reaching offshore flux. The intensity of the offshore transport close to the coast remains high in fall. Winter shows the weakest lateral Corg redistribution also close to the coast at all latitudes. This reduced signal is a result of a combination of weaker currents and lower near-surface Corg concentrations, the latter being especially small offshore in the NSR (see Fig. B1).
The most intense offshore signature in the flux in all seasons is found in the nearshore CSR, associated with the Cape Blanc filament. The contribution of this hotspot of offshore Corg flux is highest in summer and significantly reduced (even though still dominant) in winter. Positive and negative zonal flux striations emerge in the NSR in every season. These may be linked to the presence of recurrent mesoscale eddies forming in the proximity of the Canary Islands (Sangrà et al., 2009).

Figure 3Seasonality of the eddy (cyclonic + anticyclonic) and filament offshore transport of Corg. The first column represents the filament transport. The second column represents the eddy transport. The flux is integrated over the top 100 m depth. Subpanels: (a) and (b) spring (MAM), (c) and (d) summer (JJA), (e) and (f) fall (SON), and (g) and (h) winter (DJF).
4.2 Seasonality of the eddy and filament offshore transport
The mesoscale eddy and filament components of the Corg zonal transport not only have different offshore extensions and signatures but also a different seasonality (Fig. 3). The filament transport is intense but only spans about half of our analysis domain; the eddy transport is weaker due to low drifting speeds but more far-reaching. In every season the filament flux is dominated by a negative (and therefore offshore-directed) Corg flux, with only a minor contribution to the onshore Corg recirculation. This is due to the faster offshore flow that characterizes the northern edge of a filament compared to the southern onshore filament transport (Álvarez-Salgado et al., 2001; Sánchez et al., 2008), combined with the fact that a portion of the Corg transported offshore may be exported below the euphotic layer before being recirculated onshore. On the contrary, in every season the mesoscale eddy flux is characterized by striations in the form of alternate positive and negative bands of zonal Corg transport.
The filament transport has a strong seasonal character. In the nearshore, the filament transport is maximum in summer and very intense in fall. In these two seasons, this flux component also shows its maximum offshore extension at every latitude and especially in the CSR around Cape Blanc. Spring sees a smoothing of the zonal gradients in the filament flux, with a more homogeneous intensity at all latitudes, especially in the nearshore. In winter, the filament transport reaches its minimum intensity, with a sharp drop in the nearshore compared to the other seasons
The total (cyclonic + anticyclonic) eddy contribution to the Corg offshore flux has a very similar intensity in all seasons. A moderate intensification in the nearshore eddy transport is visible in summer and fall in the NSR and in spring and summer in the CSR. In terms of the offshore extension, the eddy flux reaches its maximum in spring, when the Corg distribution also reaches its maximum value in the offshore waters.
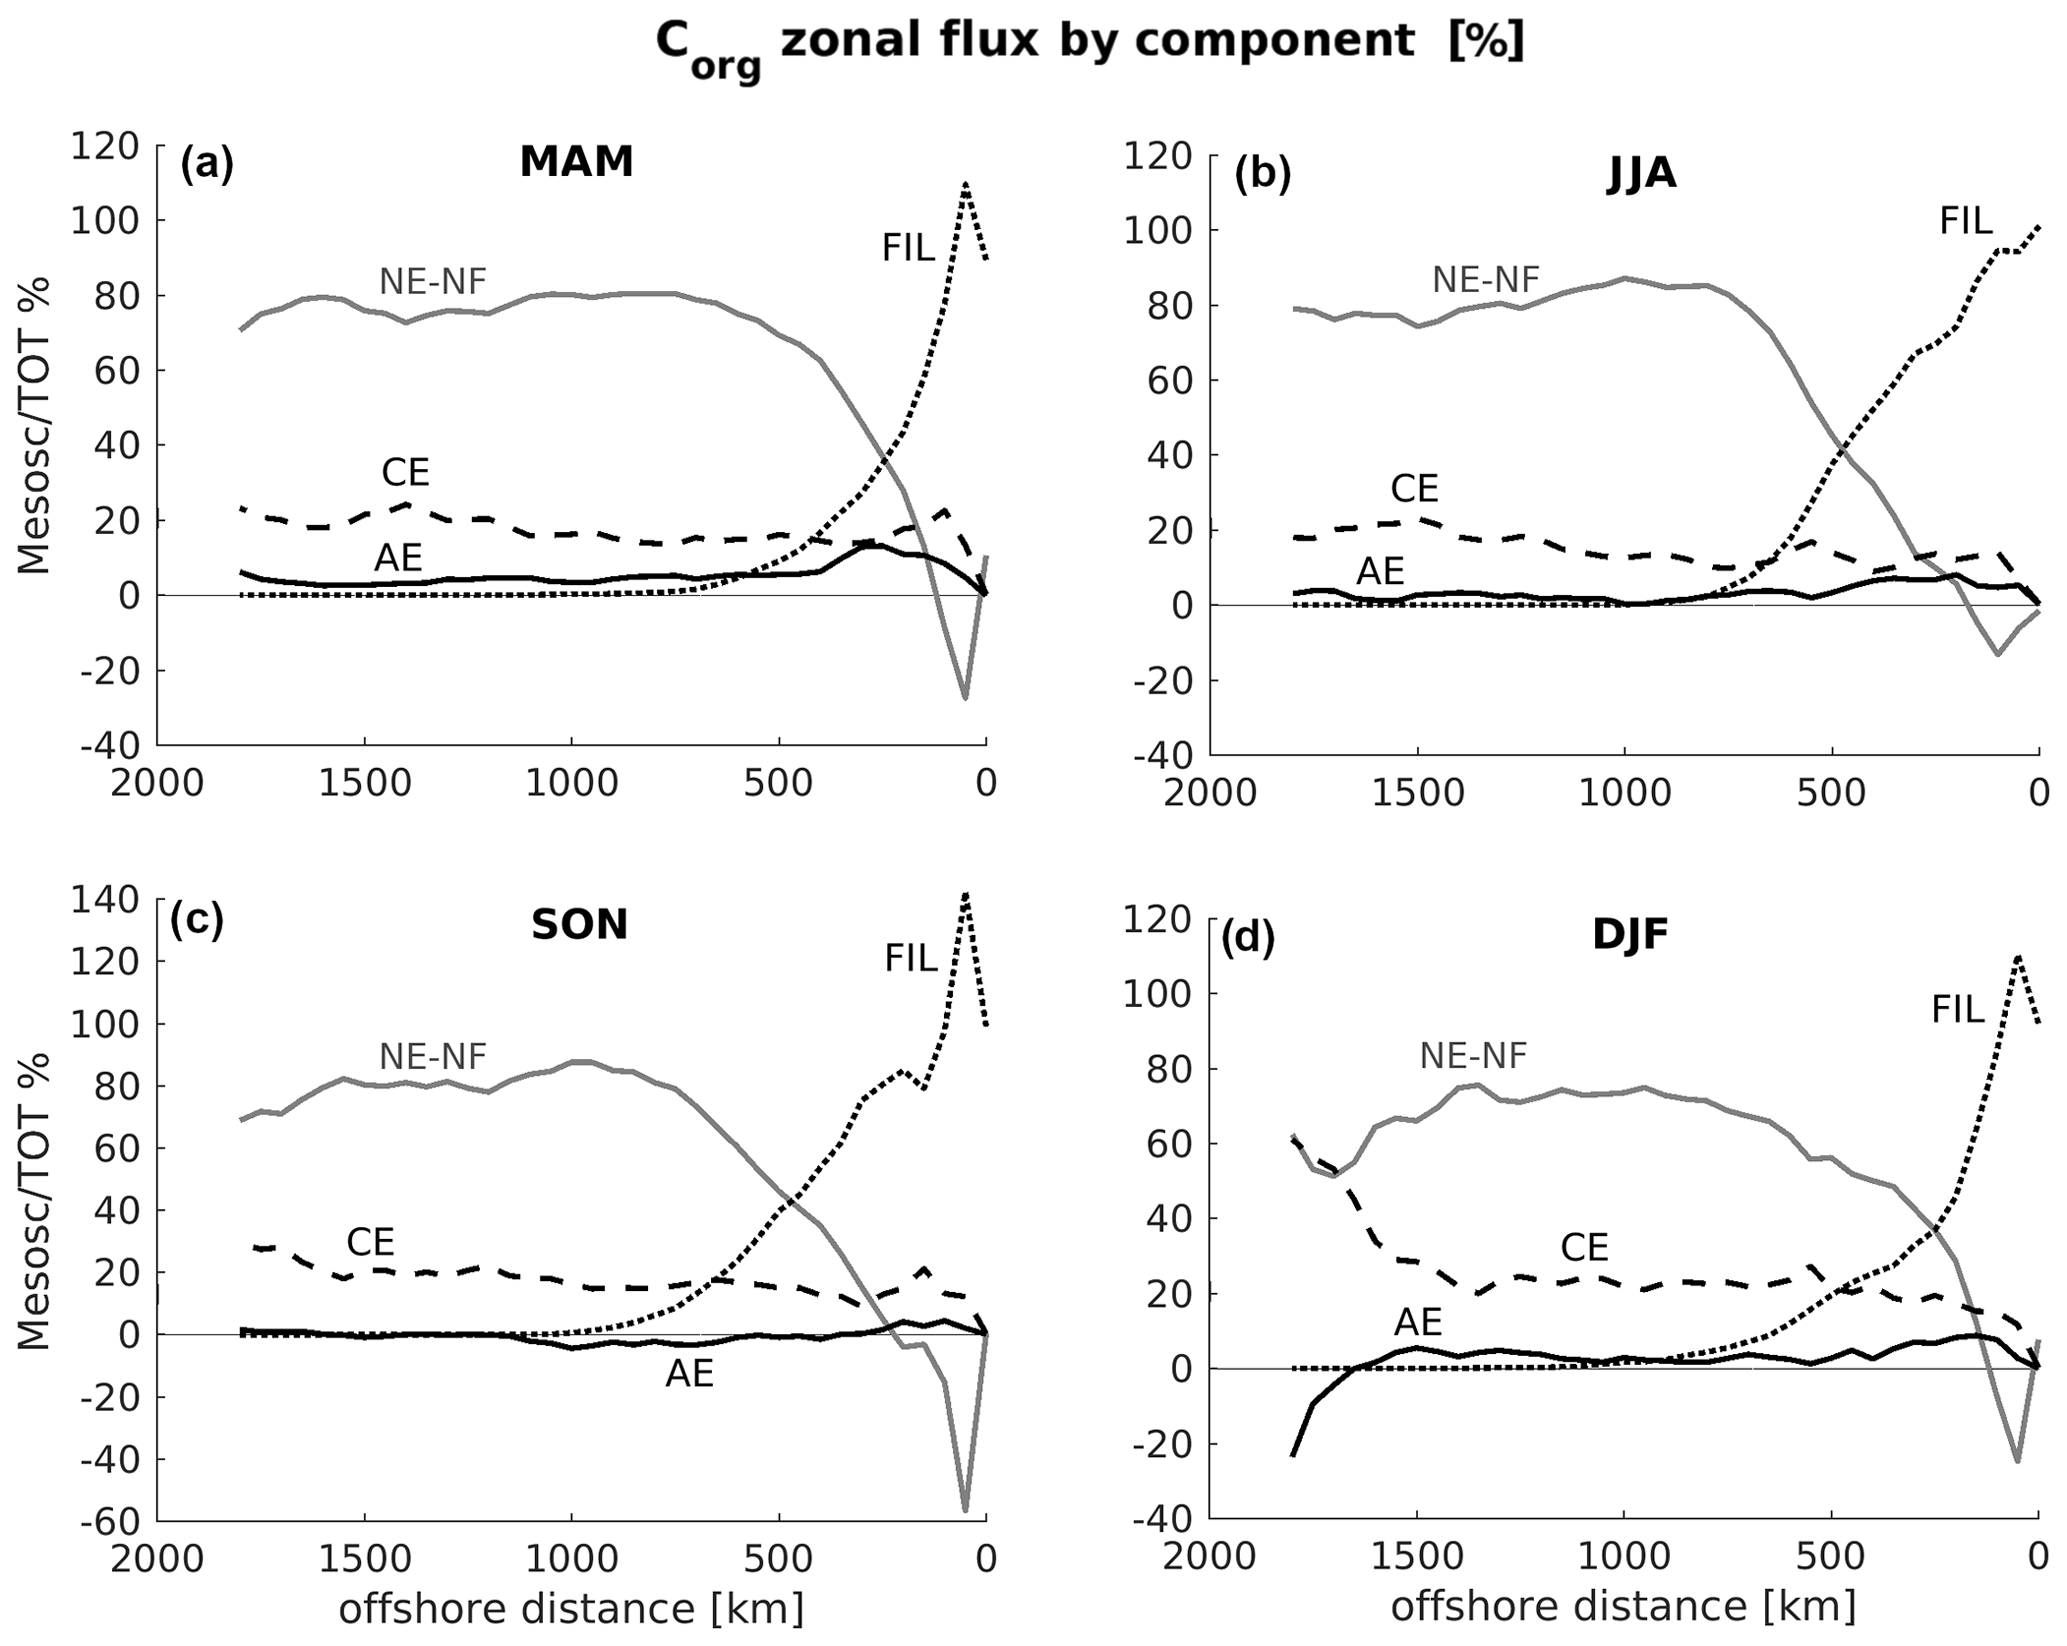
Figure 4Seasonality of eddy, filament, and non-eddy–non-filament contribution to the total offshore transport of Corg over CanUS integrated throughout the first 100 m depth. The plots show the percentage of the total offshore Corg flux represented by the filament flux (FIL), the cyclonic eddy flux (CE), the anticyclonic eddy flux (AE) and the non-eddy–non-filament flux (NE–NF). Percentages can go above 100 % when one flux component is negative, i.e., directed onshore. Subpanels: (a) spring (MAM), (b) summer (JJA), (c) fall (SON), and (d) winter (DJF). Please, note that the y axis scale of SON differs from the other subpanels.
The filament flux is always the dominant flux in the nearshore, often exceeding the total offshore transport between 100 and 200 km offshore. This is possible when the non-eddy–non-filament flux is directed onshore and therefore has a negative contribution to the total offshore flux. The maximum relative contribution to the total flux by filaments both in terms of maximum flux share and in terms of offshore extension is found in fall. In fact, even though filaments are intense in summer, this season is also characterized by a widespread peak of the upwelling, triggered by the mean (largely NE–NF) offshore Ekman transport, which clearly reaches its maximum intensity in this season.
The CE flux contribution constitutes the largest mesoscale eddy contribution to the total flux in all seasons (Fig. 4). Over the CanUS as a whole, the CE flux contributes between 15 % and 25 % to the total Corg flux, with a contribution that peaks in winter, likely due to a reduced non-mesoscale and filament transport. The weaker AE flux has maximum contribution in the first 500 km from the coast, and its flux share peaks at 15 % of the total offshore transport in spring. In fall, the AE flux is slightly negative, i.e., anticyclones weakly recirculate the Corg towards the coast in this season, likely due to stirring.
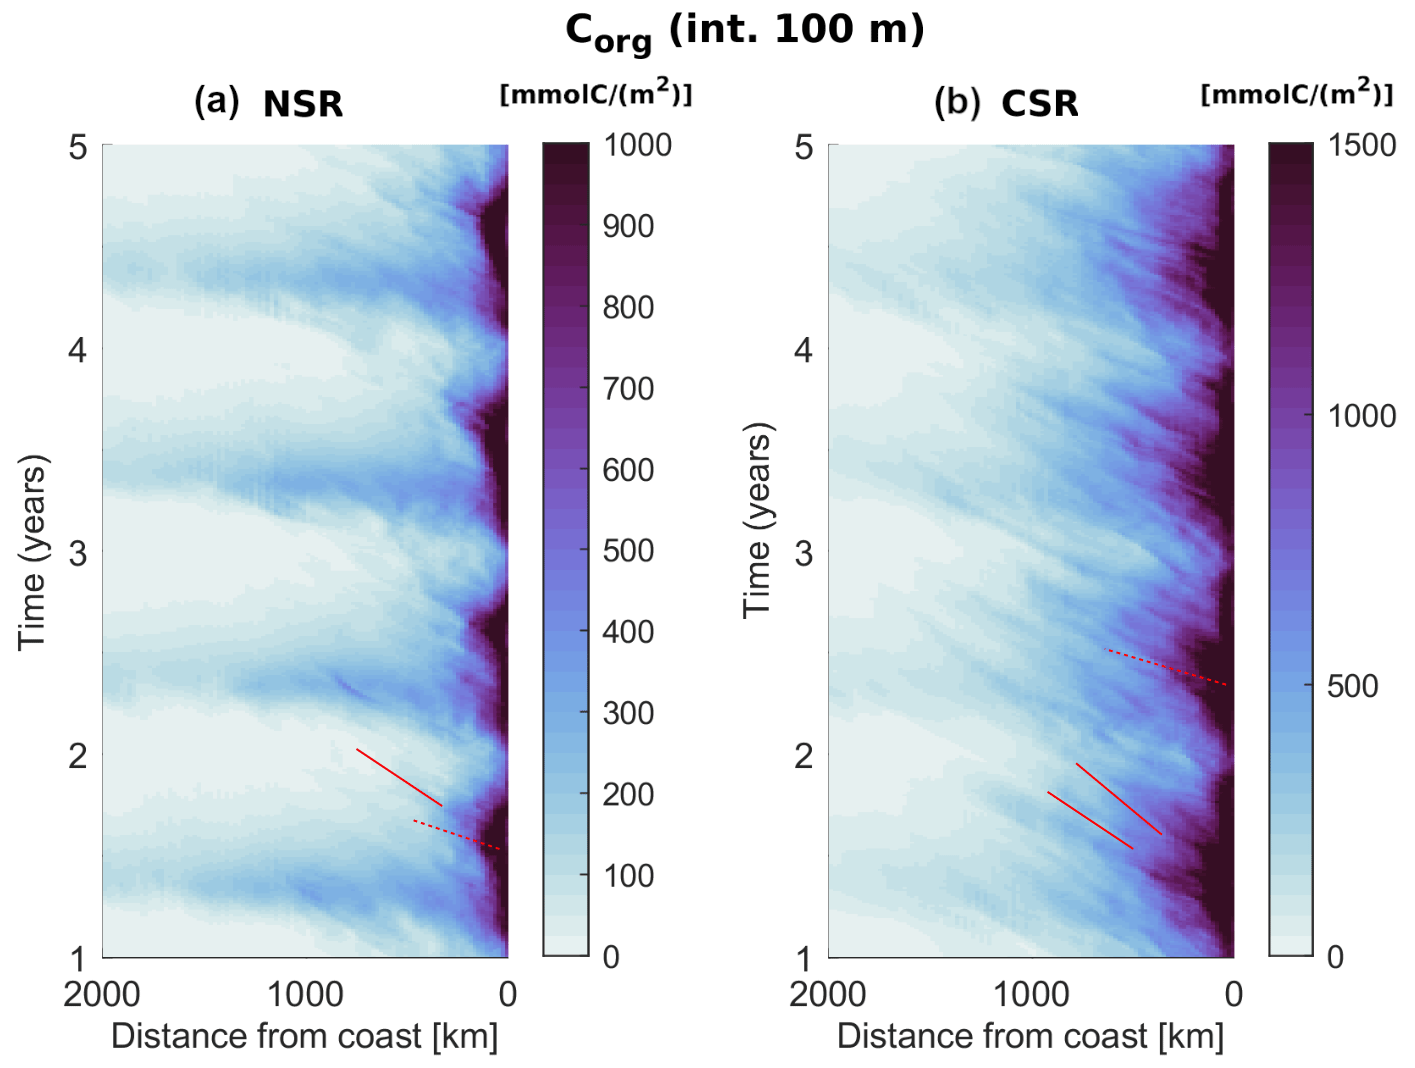
Figure 5Hovmöller diagrams of the Corg integrated across the euphotic layer (100 m depth) and averaged across each subregional domain in the first 4 years of analysis data (2 d means). Dotted red lines highlight fast propagating Corg signals in the nearshore, while solid red lines highlight slower propagating Corg signals offshore.
Hovmöller diagrams allow us to better assess the propagative nature of the offshore transport and quantify the time it takes for the seasonal Corg variations to reach and therefore impact the open waters (Fig. 5). As expected, nearshore Corg concentrations peak in summer in the NSR and in spring in the CSR, while the widespread spring offshore maximum in Corg in the NSR is linked to the North Atlantic bloom dynamics. Both regions show the clear signature of offshore propagating signals in the form of stripes of elevated Corg concentrations. In the nearshore, fast signals span roughly the first 250 km offshore in the NSR and the first 500 km offshore in the CSR. Their offshore reach as well as their propagation speed of about 500 km in less than one season reflects the filament dynamics (Lovecchio et al., 2018) and constitute a fast link between the nearshore temporal variations in biological activity and the adjacent open waters. Farther offshore, slower propagating signals visibly cross the entire domain of interest, spanning about 1000 km in 1 year (3 cm s−1), in line with the eddy propagation speed at these latitudes (Chelton et al., 2011). These slow propagating signals are likely responsible for a lag in the response of the offshore biological activity to the nearshore seasonal dynamics of upwelling and production.
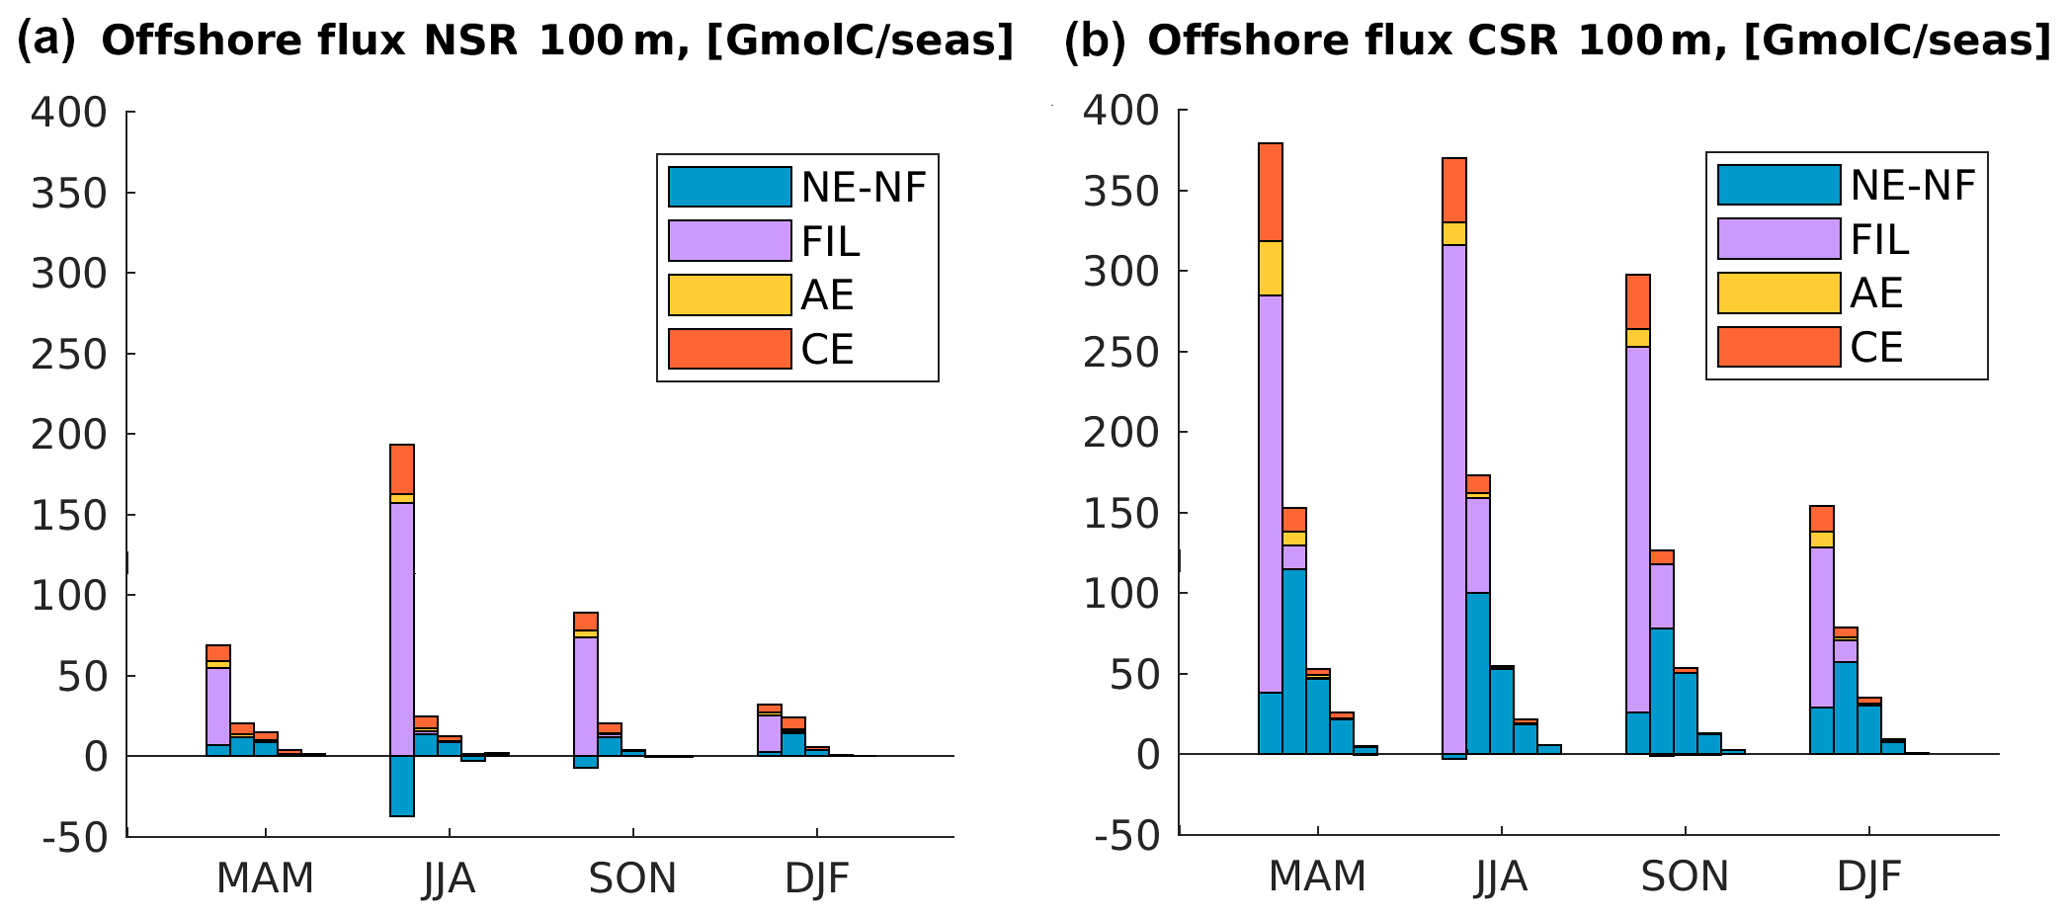
Figure 6Magnitude of the offshore flux of Corg integrated in the first 100 m of depth in (a) northern and (b) central CanUS. Each group of bars represents a different season. For each season, each one of the five bars represents the flux through a specific offshore boundary, i.e., an isoline of distance from the coast. From left to right in each group: 100 km offshore, 500 km offshore, 1000 km offshore, 1500 km offshore, and 2000 km offshore. Colors in each bar represent the flux contribution by a certain type of structure: non-eddy–non-filament (NE–NF), filaments (FIL), anticyclones (AEs), and cyclones (CEs). Positive and negative contributions to the flux through each boundary are plotted separately in order to make them clearly visible.
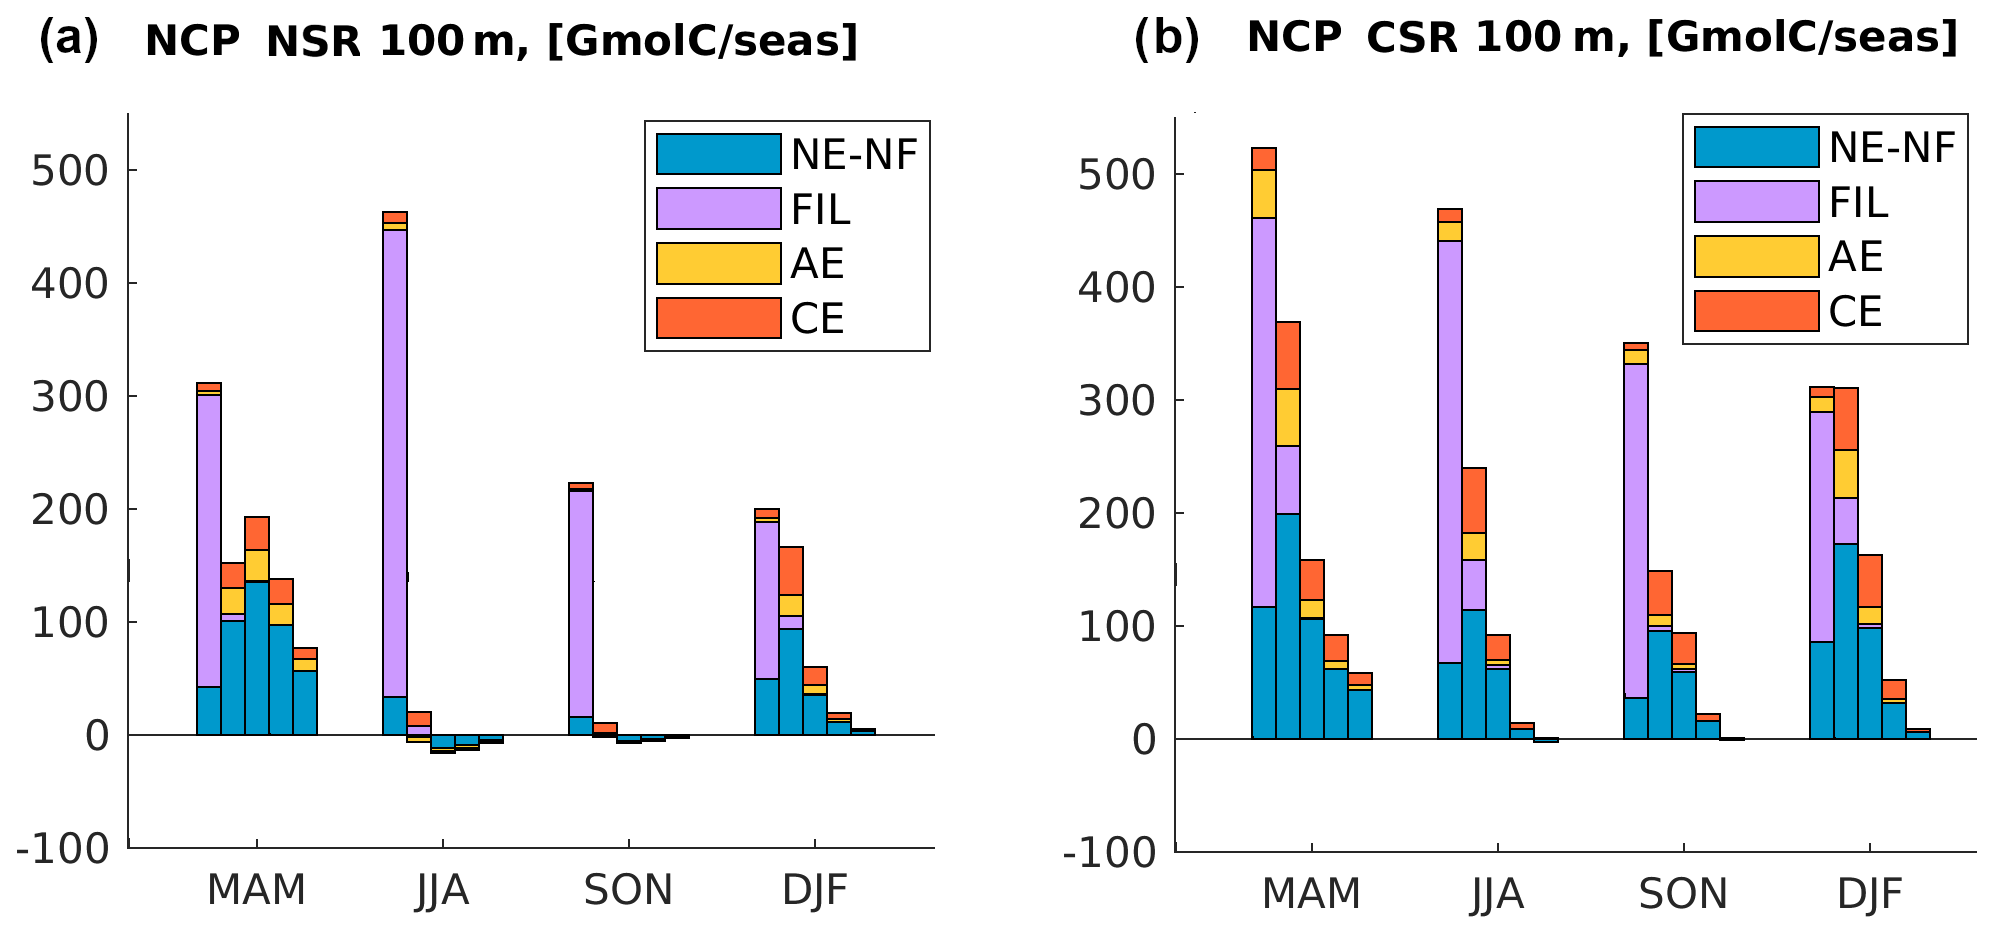
Figure 7NCP in (a) northern and (b) central CanUS integrated in the first 100 m depth and in each offshore region by season. Each group of bars represents a different season. For each season, each one of the five bars represents the difference between the input and the output of offshore flux within two specific offshore boundaries (divergence) or the NCP integrated in the area contained within those two boundaries, i.e., isolines of distance from the coast. From left to right in each group: 0 to 100 km offshore, 100 to 500 km offshore, 500 to 1000 km offshore, 1000 to 1500 km offshore, and 1500 to 2000 km offshore. Colors in each bar represent the contribution by a certain type of structure: non-eddy–non-filament (NE–NF), filaments (FIL), anticyclones (AEs), and cyclones (CEs). Positive and negative contributions to the flux through each boundary are plotted separately in order to make them clearly visible.
4.3 Quantification of the seasonal variability of the offshore flux by subregion and offshore distance
Our analysis highlights important differences between NSR and CSR in terms of the seasonal and spatial variability of the offshore flux of Corg, as well as in terms of the magnitude of the contribution of each structure to the total flux (Fig. 6). Overall, offshore fluxes in the CSR are higher and have a larger offshore extension than in the NSR.
The NSR shows a pronounced seasonal variability in the fluxes, especially in the nearshore, at the boundary of the coastal region directly influenced by the upwelling. The flux at 100 km offshore peaks in summer, when the upwelling strength is maximum. In summer, a total of about 160 Gmol C are exported laterally away from the first 100 km from the coast, corresponding to about of local nearshore NCP (Fig. 7). This maximum in the offshore flux is driven by filaments and eddies and accompanied by a negative onshore recirculation by the non-eddy–non-filament flux. In both summer and fall, when the NSR upwelling is active, the offshore flux decreases quickly moving away from the coast to the 500 km offshore boundary. At 500 km offshore, the filament contribution is negligible due to the small extension of the northern filaments (<300 km) and their flux magnitude at 500 km offshore is only between and of their flux at 100 km offshore. In the offshore NSR, however, eddies (especially CEs) contribute importantly to the total flux, with a share that ranges between 30 % and 40 % of the offshore transport, significantly more than in the CanUS as a whole. Beyond 1000 km, the offshore flux decreases to near-zero values, with an inversion of sign at 1500 km from the coast in summer, likely due to the influence of the onshore flowing Azores current at the northernmost boundary (see also Fig. 2b). In winter and spring, when the upwelling is not active, the offshore flux is smaller near the coast, but it is characterized by a smoother offshore gradient. This is likely due to the time it takes for the nearshore seasonal peak in the Corg flux to propagate offshore beyond the range of distances covered by the filaments. Moreover, in spring, Corg concentrations are also higher in the open NSR thanks to the North Atlantic bloom.
The offshore flux of Corg in the CSR is characterized by moderate seasonal variability and intense fluxes. The offshore gradient in the intensity of the flux is less dramatic than in the NSR. The flux at 100 km peaks with nearly equal values in spring and summer, but it is still intense in fall and, to a lower extent, in winter. In spring, summer, and fall, this flux exceeds 70 % of the NCP produced in the first 100 km from the coast, therefore constituting an extremely large lateral redistribution of organic material produced at the coast. At 100 km, filaments are responsible for the large majority of the offshore flux, while eddies often exceed the rather small contribution of the non-eddy–non-filament flux. Differently from what we find in the NSR, AEs have a significant positive contribution to the offshore transport in the nearshore CSR, especially in spring, when the upwelling is strongest south of Cape Blanc. This can be explained by the fact that some southern eddies may be shed by the northward-flowing MC, which likely generates Corg-rich AE. At 500 km offshore, the filament flux is still important, differently from what we found in the NSR. This is due to the large extension of the Cape Blanc filament, which is located just in the middle of the CSR. At distances larger than 500 km from the coast, the non-eddy–non-filament flow, likely in the form of the Cape Verde frontal circulation, is responsible for the majority of the offshore flux.
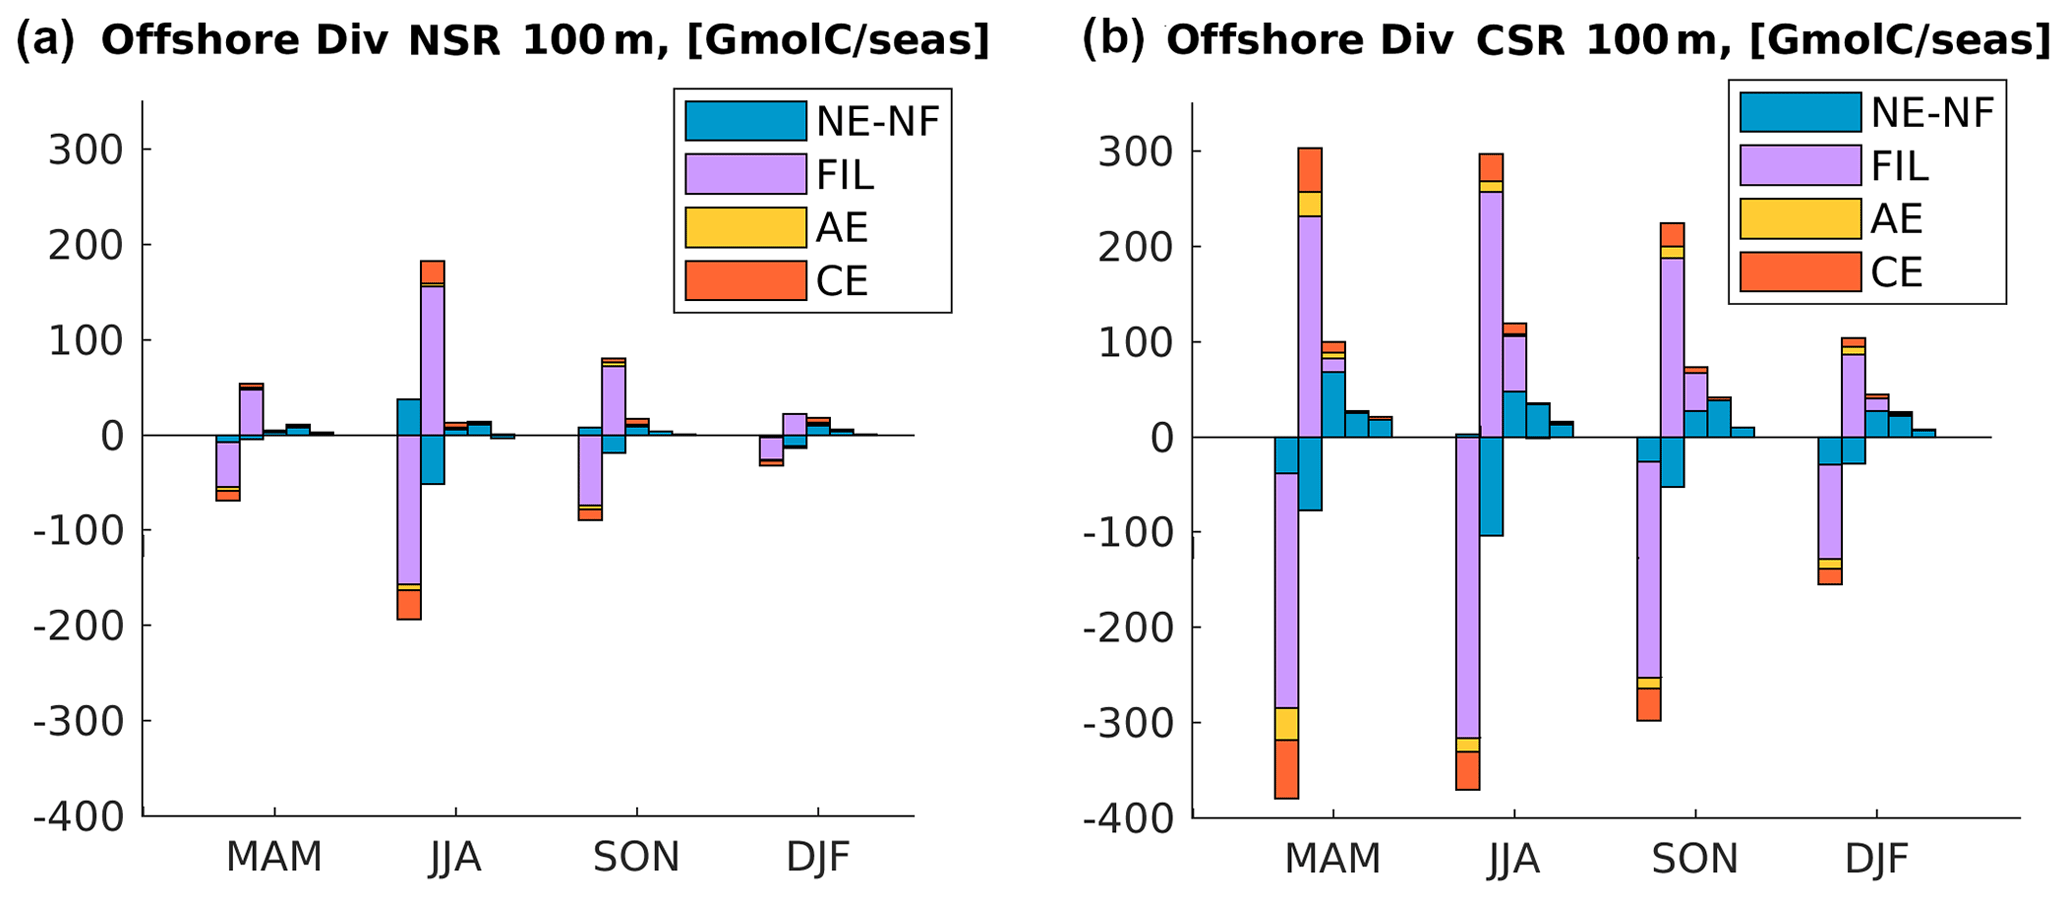
Figure 8Divergence of the offshore flux of Corg integrated in the first 100 m of depth in (a) northern and (b) central CanUS. Each group of bars represents a different season. For each season, each one of the five bars represents the difference between the input and the output of offshore flux within two specific offshore boundaries (divergence), i.e., isolines of distance from the coast. From left to right in each group: 0 to 100 km offshore, 100 to 500 km offshore, 500 to 1000 km offshore, 1000 to 1500 km offshore, and 1500 to 2000 km offshore. Colors in each bar represent the contribution by a certain type of structure: non-eddy–non-filament (NE–NF), filaments (FIL), anticyclones (AEs), and cyclones (CEs). Positive and negative contributions to the flux through each boundary are plotted separately in order to make them clearly visible.
4.4 Offshore flux divergence variability and its impact on the open waters
The divergence (div) of the offshore flux quantifies is the net amount of Corg that is added (div >0) or removed (div <0) by the offshore flux from each offshore domain. In steady-state, this divergence is balanced by the local balance between production and remineralization (net community production) or vertical exchange fluxes. Our results (Fig. 8) show that in both subregions and in every season div <0 in the 0–100 km offshore domain, the most productive coastal band. This means that the cross-shore flux always removes Corg from this nearshore region and transports it offshore towards the open waters. However, the absolute magnitude of this Corg transport out of the 0–100 km offshore domain differs between NSR and CSR and changes substantially between seasons in the NSR. Further away from the 100 km offshore boundary, subregional differences in the lateral relocation of Corg are even more striking both in sign and in seasonality.
In line with all the previous findings, the NSR shows a sharp peak in the summer fluxes. In this season, the amount of Corg removed from the 0–100 km offshore domain by the offshore flux (div <0) is at least twice as large than that in all the other seasons. Compared to the winter, when its value is minimum, the divergence is four times larger. At 100 km off the coast, the offshore flux relocates about of the entire nearshore NCP towards the open waters in both summer and fall. The amount of Corg deposited in the range of 100–500 km (div >0) by the offshore flux also peaks in summer and, to a lower extent, in fall, confirming that this range of distances is directly impacted by the seasonality of the nearshore fluxes. This local enhancement of Corg availability is especially large if compared to the very low values of summer and fall NCP in the same offshore domain. An analysis of the alongshore fluxes of Corg (see Fig. B2) show a large southward flow of organic material in the range of 100–500 km offshore as the southern boundary of the NSR in summer, which indicates that in this range of distances part of the Corg is further displaced towards the CSR before sinking. This alongshore displacement is connected to the intense southward flow of the Canary Current, which is maximum at distances larger than 100 km from the coast (Pelegrí and Peña-Izquierdo, 2015). Offshore of 500 km from the coast, the NSR shows a weakly negative summer and fall mean of NCP in the euphotic layer, meaning that the surface waters must rely on the lateral input of Corg in order to sustain the excess heterotrophic activity (see also Fig. B3). This input of Corg offshore results from a combination of several lateral fluxes: the delayed signal of the seasonal nearshore flux reaching the open waters in nearly a year time (Fig. 5a), the spring relocation of the Corg produced locally in the open waters by the North Atlantic spring bloom and nevertheless transported further offshore by the currents (Fig. 6a), and, potentially, any additional alongshore input of Corg connected to the gyre circulation. Further, an analysis of the model generated eddy tracks (not shown) and meridional fluxes reveals that a significant northwards Corg influx happens at the southern NSR boundary. Here the long and farthermost tail of the giant Cape Blanc filament oscillates and sheds Corg-rich eddies, which drift northwards while moving away from the coast. This is also visible in the Hovmöller diagram of Corg in the NSR (Fig. 5a) in the form of high concentration signals that seemingly form at about 1000 km from the coast and continue to propagate offshore. The picture is extremely different in spring and winter, when the deepening of the North Atlantic mixed layer enhances productivity offshore, therefore turning NCP positive in the open waters. This increased local productivity of the open waters, combined with a weakening of the offshore flux, reduces the impact of the lateral Corg transport on the NSR offshore ecosystem between December and May.
In the CSR, both the seasonal variations and the offshore gradient in the horizontal divergence of the zonal fluxes are less pronounced compared to the NSR. Spring and summer show remarkably similar patterns of the divergence, with the offshore flux transporting away from the first 100 km from the coast at least 60 % of the nearshore production. In fall, the offshore flux at 100 km offshore is as large as about 90 % of the coastal production at these latitudes. This extremely large offshore relocation of coastal-derived Corg is also possible thanks to the lateral convergence of organic material into the CSR from both northern and southern latitudes of the CanUS: the southward flowing CC and CUC and the northward flowing MC contribute to displacing and accumulating Corg towards Cape Blanc (Lovecchio et al., 2017). The alongshore influx of Corg into the CSR was demonstrated to represent on average about 30 % of the annual mean coastal production. In this sense, the CSR exports offshore not only its local production but also a fraction of the Corg produced in the adjacent CanUS subregions. Most of this Corg is added to the 100–500 km offshore domain. However, differently from what we found for the northern latitudes, the divergence decreases smoothly offshore, possibly due to the combined influence of the Cape Blanc filament and of the Cape Verde Front, which extend far into the open Atlantic. For this reason, the horizontal divergence approaches and sometimes exceeds the magnitude of the local NCP also at the farthest offshore boundary of the CSR. Despite this lateral influx of Corg, we do not find significant levels of net heterotrophy in the near-surface euphotic layer at these latitudes (see also Fig. B3). This may be due to the positive signature of the wind stress curl, especially south of the Cape Verde Front, associated with the anticyclonic tropical circulation. This positive wind stress curl contributes to sustaining high levels of offshore primary production.
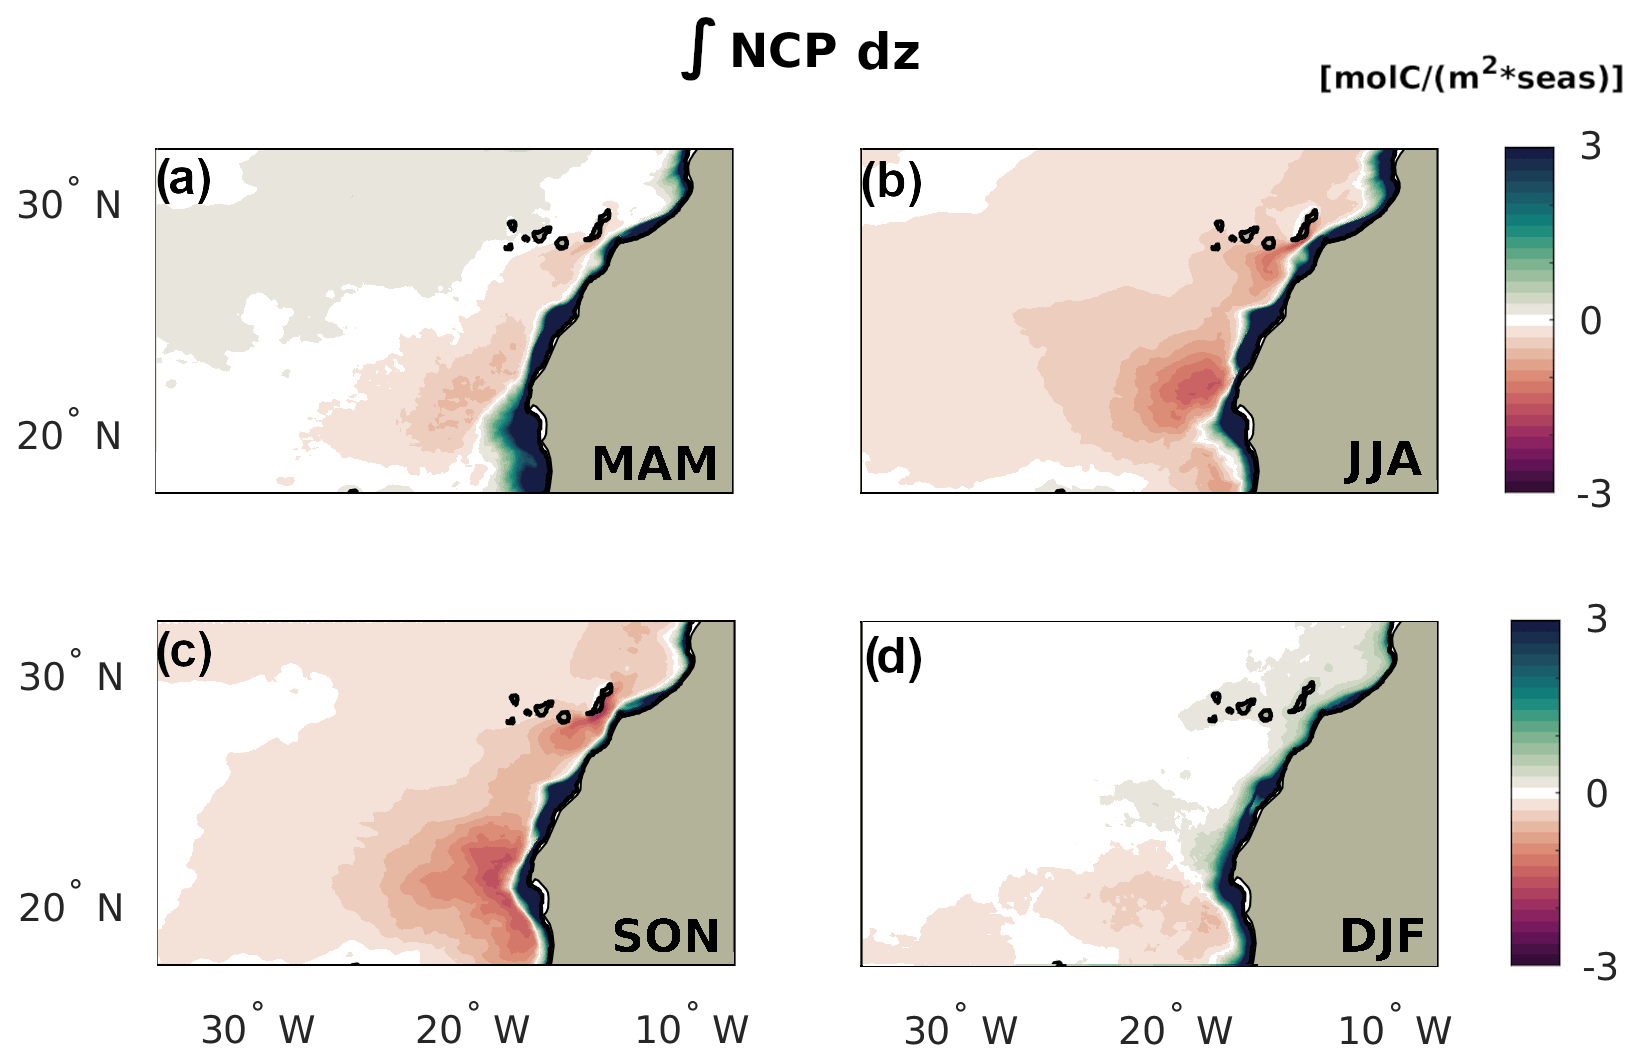
Figure 9NCP by season integrated across the entire water column. Positive regions are net sources of organic carbon, permitting these regions to export Corg. Negative regions remineralize more organic carbon than what they produce throughout the water column, requiring a net transport convergence of Corg.
The spatiotemporal variability of the lateral fluxes of Corg in the nearshore and the associated delay in the relocation of the coastal Corg at large offshore distances determines the seasonal and zonal variations in net community production integrated over the entire water column of the adjacent offshore waters (Fig. 9). While the coastal upwelling band has a positive water-column NCP at all latitudes, i.e., represents a net source of organic carbon, beyond 100 km from the coast, the picture becomes more complex. In the NSR, the magnitude of the seasonal fluxes is reflected in the pattern of negative water-column NCP, i.e., water-column net heterotrophy. During summer and fall, this offshore heterotrophy is widespread and far reaching, even though values remain low beyond 500 km from the coast. This reflects the limited offshore reach of the quick Corg transport by upwelling filaments at these latitudes. In spring, the North Atlantic bloom induces high levels of offshore production in the open waters of the northern CanUS. Therefore, the offshore water-column heterotrophy of the NSR is confined strictly to the first 500 km from the coast. In winter, the weakening of the offshore transport combined to a deepening of the mixed layer depth and therefore high euphotic layer production offshore (see also Fig. B3) result in a neutral water-column NCP.
In the CSR, the intense Corg offshore fluxes are reflected in a persistent water-column heterotrophy offshore, even though there exists substantial seasonal variations in the intensity and spatial distribution of the water-column NCP. Despite the intense lateral fluxes in spring, the excess consumption of Corg by remineralization is maximum in summer and fall in the offshore regions, which are reached by the coastal Corg signal with a delay of at least one season. Moreover, while offshore fluxes are large in spring, so is offshore production, especially away from the first 500 km offshore (Fig. 7). Since the ratio between the organic carbon released by the lateral fluxes offshore and local offshore production determines the net heterotrophic activity, spring only shows significant negative water-column NCP between roughly 100 and 700 km offshore, where the intense filament transport is still relevant. In winter, the offshore water column of the CSR is weakly heterotrophic, showing that at these latitudes the deepening of the mixed layer depth (and therefore increase in surface production) is not enough to compensate the intense and far-reaching offshore transport of Corg.
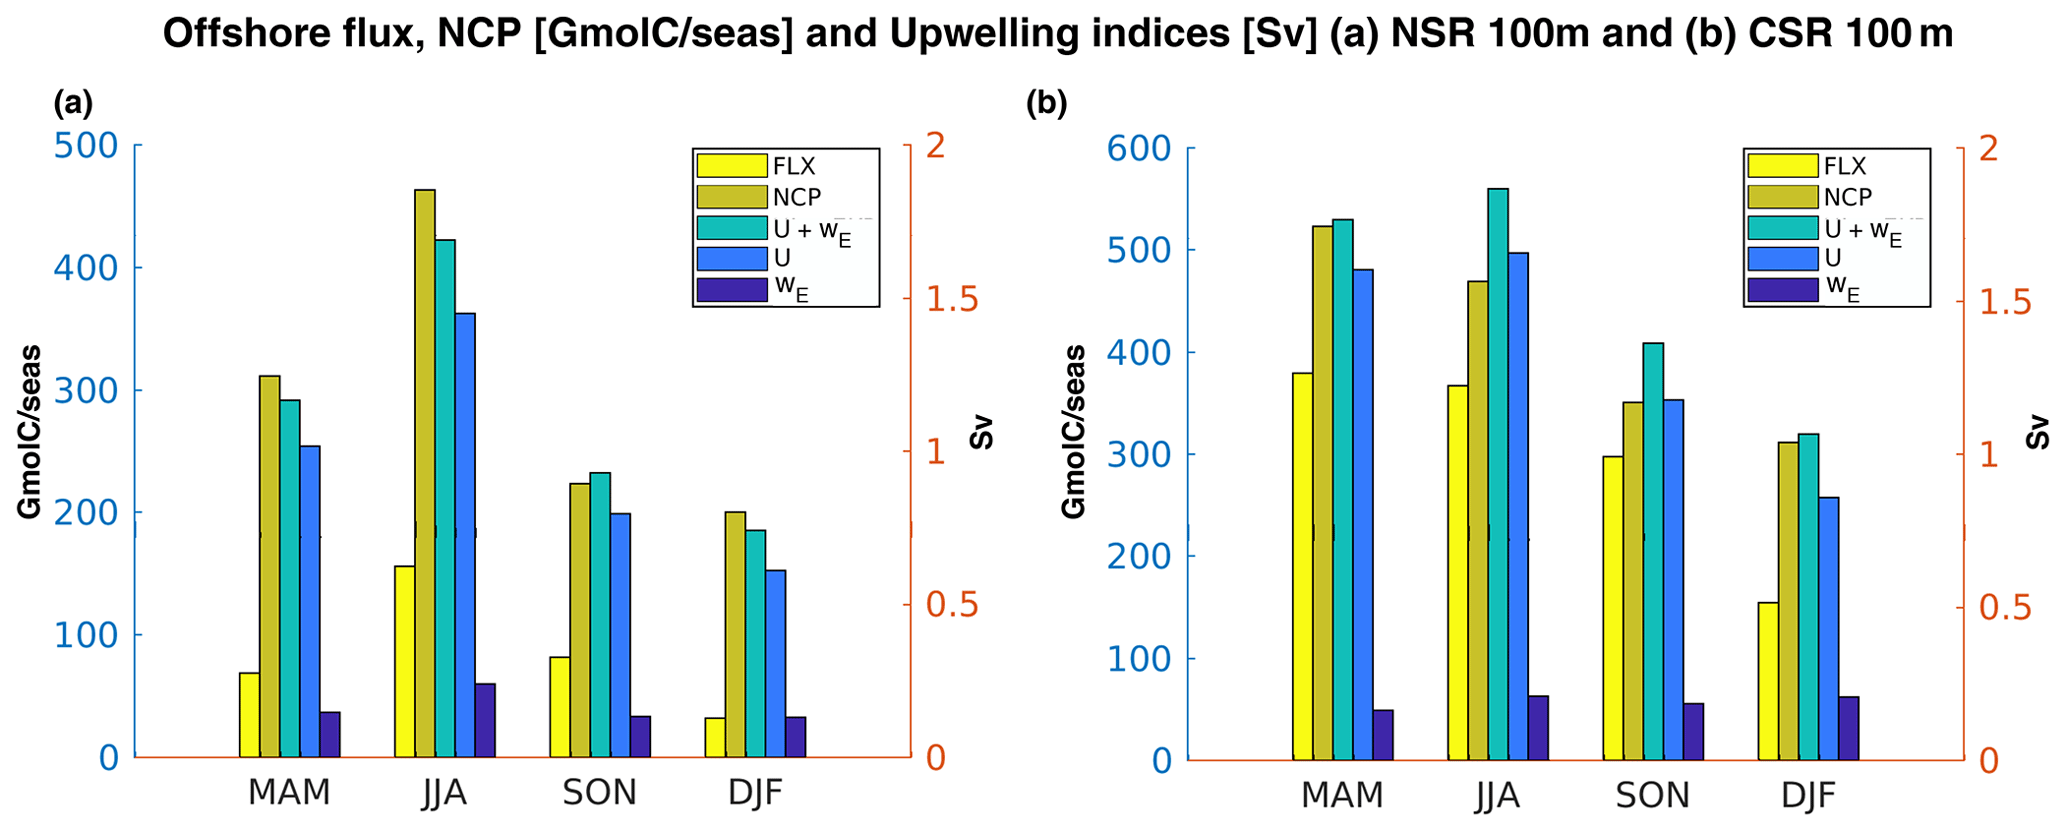
Figure 10Corg offshore Fluxes (FLX), NCP fluxes (NCP), upwelling transport (U+wE), coastal upwelling (U), and Ekman pumping (wE) in (a) northern and (b) central CanUS by season. Fluxes are integrated along the coast and in the first 100 m and they represent the flux through the 100 km offshore boundary. U is integrated along the coast and wE is integrated along the latitude and in the 100 km offshore (see Sect. 2.3 for upwelling estimations definition). Each group of bars represents a different season.

Figure 11(a) Latitudinal distribution of annual mean total upwelling (red line) and Ekman transport (blue line). The difference between the two represents Ekman pumping. Units are in m3 s−1 per latitude meter. Hovmöller diagram (season–latitude diagram) of Coastal upwelling transport (b) and Ekman pumping transport (c) in the first 100 km offshore. See Sect. 2.3 for the upwelling estimations definition.
4.5 Physical and biological drivers of the nearshore flux variability
The efficiency of the offshore transport of organic carbon is strongly dependent on the coastal production of Corg, which is sustained by the local upwelling of nutrient-rich deep water via Ekman transport and Ekman pumping. Overall, our results show that over the entire CanUS, the Corg offshore flux at 100 km from the coast varies seasonally and in phase with both NCP and total upwelling (sum of coastal upwelling, U, and Ekman pumping, wE) (Fig. 10).
Comparing the two sub-regions, the ratio of offshore transport at 100 km offshore to NCP in the first 100 km from the coast is higher in the CSR in all seasons, due to the presence of the giant Cape Blanc filament (Fig. 3; see also Fig. B6). However, the seasonal variation of the upwelling processes is more pronounced in the NSR, similarly to the fluxes (e.g., offshore flux and NCP flux; see Sect. 4.3). Nevertheless, the yearly mean upwelled volume in the two regions is comparable: the NSR supplies 1.2 Sverdrup (Sv) of upwelled water at surface while the CSR supplies 1.5 Sv.
In the NSR, the total upwelling (U+wE) peaks in summer and is still intense in spring, similarly to the other biological and lateral transport fluxes in the subregion (Fig. 10a). Upwelling brings up to the surface an estimated volume of 1.8 and 1.2 Sv in summer and spring, respectively. Weak wind stress and wind stress curl at the coast during winter (see Figs. B4c and B5c) induce a weaker upwelling of about 0.8 Sv, while NCP and spatially integrated offshore fluxes show their minimum values of 200 and 32 GMolC/seas. Autumn is characterized by a more efficient offshore flux of Corg away from the coast compared to spring, despite the weaker total upwelling (1.0 Sv) and NCP. This can be explained by the fact that the filaments during fall are more intense and persistent along the coast with respect to spring, especially near Cape Juby (see Fig. B6).
The fluxes and the upwelling processes in the CSR are characterized by moderate seasonal variability (Fig. 10b). The total upwelling peaks in summer (1.8 Sv) and it shows nearly equal values in spring (1.7 Sv). It is still intense in fall (1.3 Sv) and, to a lower extent, in winter (1 Sv). Even though the upwelling maximum is in summer, the NCP flux, and in turn the Corg flux, are slightly more intense in spring. This could be explained, as presented before, by the Corg sinks in summer, characterized by nearly neutral or slightly heterotrophic water column near the coast (e.g., north of Cape Blanc, Fig. B3b). In contrast to what we find for NSR, the two upwelling processes show different seasonality. Either the coastal upwelling (U) and the Ekman pumping (wE) peak during summer, but the latter is still strong in winter (0.22 Sv) without showing a maximum in spring (Fig. 10b). The reason for this discrepancy and for the moderate seasonal variability of the upwelling is embedded in the definition of the CSR sub-region. The CSR expands from 17 to 22∘ N and it includes a large portion of ocean around Cape Blanc (21∘ N). This choice was made in order to properly evaluate the offshore transport by the giant Cape Blanc filament, which accounts for a large amount of lateral export of particulate matter (Gabric et al., 1993). Nevertheless, Cape Blanc bounds two zonal bands of the CanUS, which are characterized by different seasonality of alongshore winds and, in turn, of the upwelling (Arístegui et al., 2009). Hovmöller diagrams of coastal upwelling (Fig. 11b) and Ekman pumping (Fig. 11c) reveal pronounced upwelling north of Cape Blanc in summer and spring. By contrast, south of Cape Blanc, the upwelling processes are more robust in winter and spring. The combination of these two different upwelling peaks results in a mixed seasonal character for the CSR. In particular, the seasonality of the coastal upwelling is dominated by the strong alongshore winds (Fig. B4) during summer north of Cape Blanc, while the Ekman pumping seasonality, which depends on the gradient of the winds, is affected by the winter to spring upwelling variability south of Cape Blanc.
Hovmöller diagrams and annual mean upwelling estimations along latitude (Fig. 11a) allow the comparison between the two different upwelling processes along the coast. In particular, coastal upwelling is the dominant mechanism along the latitudes, accounting for up to 80% of the total upwelling. A local exception is found south of Cape Ghir (31∘ N) where Ekman pumping plays a crucial role likely due to the coastline geometry; the bay south of Cape Ghir prevents the direct effect of the alongshore winds (see Fig. B4).
5.1 Comparison with previous studies
Seasonality in the CanUS varies substantially with latitude, allowing one to identify a set of subregions with distinct peaks in upwelling and production and distinct levels of mesoscale activity (Arístegui et al., 2009; Pelegrí and Peña-Izquierdo, 2015). Our model agrees with previous studies that distinguished between a northern region of summer upwelling intensification, a central zone of semi-permanent upwelling, and the southern latitudes characterized by a late winter to spring peak of upwelling. In the Moroccan sector (21–34∘ N), permanent equatorward winds and positive wind stress curl sustain Ekman transport and Ekman pumping with a summer intensification. An inversion of the alongshore flow in the proximity of the Canary Islands (Lanzarote passage) is visible from Fig. B2 and was previously described (Machín et al., 2010; Mason et al., 2011). In the northern part of the Mauritanian–Senegalese sector (17–21∘ N), the meridional shift of the trade winds causes seasonal upwelling with a late winter to spring peak (Lathuilière et al., 2008; Hagen, 2001). The magnitude of the coastal upwelling transport and its latitudinal and seasonal variability (Fig. 11) are consistent with previous studies, such as Benazzouz et al. (2014) and Desbiolles et al. (2014). Seasonality in the offshore flux gets smoother at lower latitudes, where a combination of both mean and mesoscale flow extend the impact of the transport up to the farthest offshore boundary of our analysis domain.
Previous literature on the offshore transport of Corg in the CanUS based on in situ observations provided some estimates of the offshore transport in the CanUS, with most of the studies being focused on the NSR range of latitudes. Many of these studies used a box-model approach and refer to a specific time and sub-sector of the CanUS coastline, therefore integrating the lateral Corg flux over domains of different meridional extension. In order to provide a fair comparison, we discuss here our results and previous results in terms of fluxes per degree of coastline. Both Garcìa-Muñoz et al. (2004) and Santana-Falcón et al. (2016) provided estimates of the Corg flux for sub-sectors of the NSR in August 1999 and August 2009, respectively. Our summer Corg flux in the NSR at 100 km offshore corresponds to an average 32.9 kgC s−1 per degree, compared to 75.2 kgC s−1 per degree (Garcìa-Muñoz et al., 2004) and 20.9 kgC s−1 per degree (Santana-Falcón et al., 2016). Referring to September–October 1997, García-Muñoz et al. (2005) calculated 7.0 kgC s−1 per degree; in comparison, we obtain a mean fall flux of 16.4 kgC s−1 per degree at 100 km offshore. Considering the different averaging times, lateral extension of the sampled area, and the substantial small-scale variability affecting the nearshore CanUS, our results fall close to what was found by in situ observations.
A recent modeling-based study by Santana-Falcón et al. (2020) focuses on the offshore transport of Corg by the Cape Ghir and Cape Juby filaments, inferring an annual net filament flux in the range between 9.5 and 24.3 kgC s−1 per degree for Cape Ghir and between 17.1 and 104.9 kgC s−1 per degree for Cape Juby. These high-end estimates of the filament offshore flux include DOC, which accounts for as much as 90 % of the transported Corg in Santana-Falcón et al. (2020). Since our NPZD model does not explicitly include a DOC pool (see also “Model limitations” below), this suggests that the filament transport may be even more relevant when DOC is considered.
Messié and Chavez (2015) studied the seasonal variability of net primary production in the EBUSs and they identified the wind driven nutrient supply (e.g., calculated using upwelling indices) as the major driver of the seasonal variability of net primary production. In agreement with the findings by Messié and Chavez (2015), our results indicate a strong overall positive correlation between the magnitude of the upwelled water volume and the strength of net community production in both sub-regions. Likewise, high NCP is strongly correlated with high offshore fluxes of Corg. Thus, upwelling processes are the primary drivers of Corg variability. In agreement with Messié et al. (2009), coastal upwelling results the dominant process in CanUS along all latitudes, except north of Cape Sim (31∘ N) where Ekman pumping gets stronger. The relative importance of the two upwelling components, is a function of coastal topography and therefore there is strong latitudinal variability. Ekman transport is higher next to capes (31, 21∘ N) or just downstream due to alongshore wind acceleration, whereas Ekman pumping is stronger in the lee of the capes (29∘ N) where winds weaken while remaining high offshore, increasing the cyclonic curl (Bakun and Nelson, 1991; Pickett and Paduan, 2003; Koračin et al., 2004).
Our seasonal analysis of the impact of the offshore transport of Corg onto the open waters of the NASG provides further insight about the net metabolic state of the near-surface open waters in low productive areas (Williams et al., 2013; Duarte et al., 2013; Ducklow and Doney, 2013). Even though in the annual mean CanUS euphotic layer was proven to be net autotrophic (Lovecchio et al., 2017), our new results show that in summer and fall the offshore waters of the NSR present weak levels of net heterotrophy in the first 100 m depth (Figs. 7 and B3). This excess heterotrophy is fueled by the lateral redistribution of Corg in the offshore and alongshore directions combined with lower offshore productivity driven by the shoaling of the mixed layer depth in the warm seasons and is maximum in specific hotspots located in the offshore region adjacent to the coastal upwelling band (roughly between 100 and 200 km offshore). When compared to the net autotrophic activity of the spring–winter season and to the intense autotrophy of the upwelling area, these spots of near-surface net heterotrophy are weak. However, they may indicate that measurements made in the summer and fall in the offshore NSR could highlight weak levels of excess remineralization, i.e., negative NCP.
5.2 Model limitations
Our climatological run was forced with monthly mean winds derived from ERA-Interim (Dee et al., 2011), which, at the time of testing, provided an overall better performance of the model compared to other QuikSCAT products (Risien and Chelton, 2008). Despite the well-known biases of Era-Interim product at coast (Bonino et al., 2019b; Taboada et al., 2019), our upwelling estimations are in agreement with Messié et al. (2009) estimations, which compute vertical transports from QuikSCAT winds. This is likely due to the fact that we computed the coastal upwelling transport from the winds interpolated on the Atlantic telescopic grid and we considered the mean value of the alongshore winds within 100 km from the coast in order to be consistent with the computation of the fluxes, which are estimated at the 100 km offshore boundary. Nevertheless, a higher resolution global data set of winds would allow for a more accurate assessment of the relative proportion of transport and pumping over CanUS.
Both non-sinking and dissolved organic material are expected to play an important role in the lateral Corg fluxes, given that they are subject to little vertical export. In fact, even though only a small fraction of DOC (the labile fraction) is expected to play a significant role in fueling heterotrophic activity, this fraction of DOC can have concentrations that exceed the particulate Corg pool by several times (Hansell et al., 2009). This may be especially relevant in small-scale structures such as filaments, which are known to contain very high percentages of DOC (Santana-Falcón et al., 2016, 2020; García-Muñoz et al., 2005). The NPZD model employed in the present study does not include a DOC pool, meaning that we may be underestimating the total lateral transport of organic material in the euphotic layer. Furthermore, since we demonstrate that filaments have a key role in driving the seasonal variations of the offshore transport near the coast, a prevalence of DOC in these type of structures may further exacerbate their role in driving the total Corg offshore flux.
In our model, the slow sinking rate of the small particle pool (1 m s−1) means that small POC behaves quite similarly to a suspended pool, therefore allowing significant lateral transport and potentially compensating the lack of a DOC pool. However, in order to better explore the potential impact of this model limitation, Lovecchio et al. (2017) presented the results of a key sensitivity experiment in which the small detritus sinking speed was set to zero, while strongly limiting its coagulation rate. The results of this experiment showed that even though the absolute value of the offshore flux of Corg increased in the presence of a non-sinking Corg pool, the divergence of the flux remained nearly unchanged at every offshore distance. This suggests that including non-sinking Corg in the model increases the lateral flux, potentially resulting in an increased accumulation and recycling of Corg in the euphotic layer of the open waters, especially at large distances from the coast. However, it does not critically modify our understanding of the impact of the offshore flux on the biological activity of the deep open waters and may therefore have a minor impact on the resulting regional pattern of heterotrophy. We refer the reader to Lovecchio et al. (2017, 2018) for further discussion of the strengths and weaknesses of quantifying the Corg lateral transport in the absence of a modeled DOC pool.
The CanUS is characterized by the most intense seasonal fluctuations in physical and biogeochemical fluxes among all EBUSs (Chavez and Messié, 2009) and by an offshore transport of Corg that determines Corg availability in the adjacent open waters. Upwelling processes, driven by the surface alongshore winds, play a crucial role in determining the seasonal variations and latitudinal changes of the nearshore Corg fluxes.
Our results show that in the CanUS, small-scale upwelling filaments dominate the total flux at 100 km from the coast in each season and at all latitudes, and are therefore responsible for the seasonal fluctuations of the Corg offshore flux in the nearshore. A combination of eddy and non-mesoscale lateral fluxes extends the Corg transport farther away from the coast. The eddy flux, driven by cyclones, has a maximum offshore extension in spring and summer and maximum relative contribution in winter during moderate upwelling. In the northern subregion, eddies contribute up to 40 % to the total flux offshore of 500 km. Anticyclones contribute significantly to the Corg transport only in the nearshore 100 km of the central CanUS in spring, i.e., when the upwelling is maximum south of Cape Blanc. Additional seasonal variability in the alongshore displacement of Corg depicts a dynamic and fully 3D biological pump.
Our results also highlight that temporal variations in nearshore processes such as upwelling, production, and coastal circulation determine analogous temporal variations in the magnitude and spatial extension of the Corg offshore flux, which is an essential component of the coastal–open ocean biological coupling. In the northern CanUS, the total upwelling shows strong seasonal variability, peaking in summer due to the coastal upwelling. In the central CanUS, the total upwelling shows moderate seasonal variability, peaking in summer and spring due to a combination of coastal upwelling and Ekman pumping. This is reflected in the seasonality of the Corg offshore flux, which in turn contributes to modulate the seasonal changes in the trophic state of the open waters at several hundreds of kilometers off the northwestern African coast, albeit with some temporal delay. This delay is shorter than a season only in the nearshore range covered by the intense filament transport. As the dominant scales of temporal variability differ for different EBUSs (Chavez and Messié, 2009; Frischknecht et al., 2018), further studies are needed to investigate the repercussions for the open ocean biological activity in regions others than the CanUS.
| AC | Azores Current |
| AE | anticyclonic eddy |
| AMO | Atlantic Multidecadal Oscillation |
| CanUS | Canary upwelling system |
| CC | Canary Current |
| CE | cyclonic eddy |
| Corg | organic carbon |
| CSR | central subregion of the CanUS |
| CUC | Canary Upwelling Current |
| CVF | Cape Verde Front |
| DJF | December January February (winter) |
| EBUS | Eastern boundary upwelling system |
| ENSO | El Niño Southern Oscillation |
| FIL | filaments |
| JJA | June July August (summer) |
| MC | Mauritanian Current |
| MAM | March April May (spring) |
| NASG | North Atlantic Subtropical Gyre |
| NCP | net community production |
| NE–NF | non-eddy–non-filament |
| NPP | net primary production |
| NPZD | nutrient–phytoplankton–zooplankton–detritus ecosystem model |
| NSR | northern subregion of the CanUS |
| ROMS | Regional Ocean Modeling System |
| SON | September October November (fall) |
| SSH | sea surface height |
| SST | sea surface temperature |
| U | Ekman transport or coastal upwelling |
| wE | Ekman pumping |
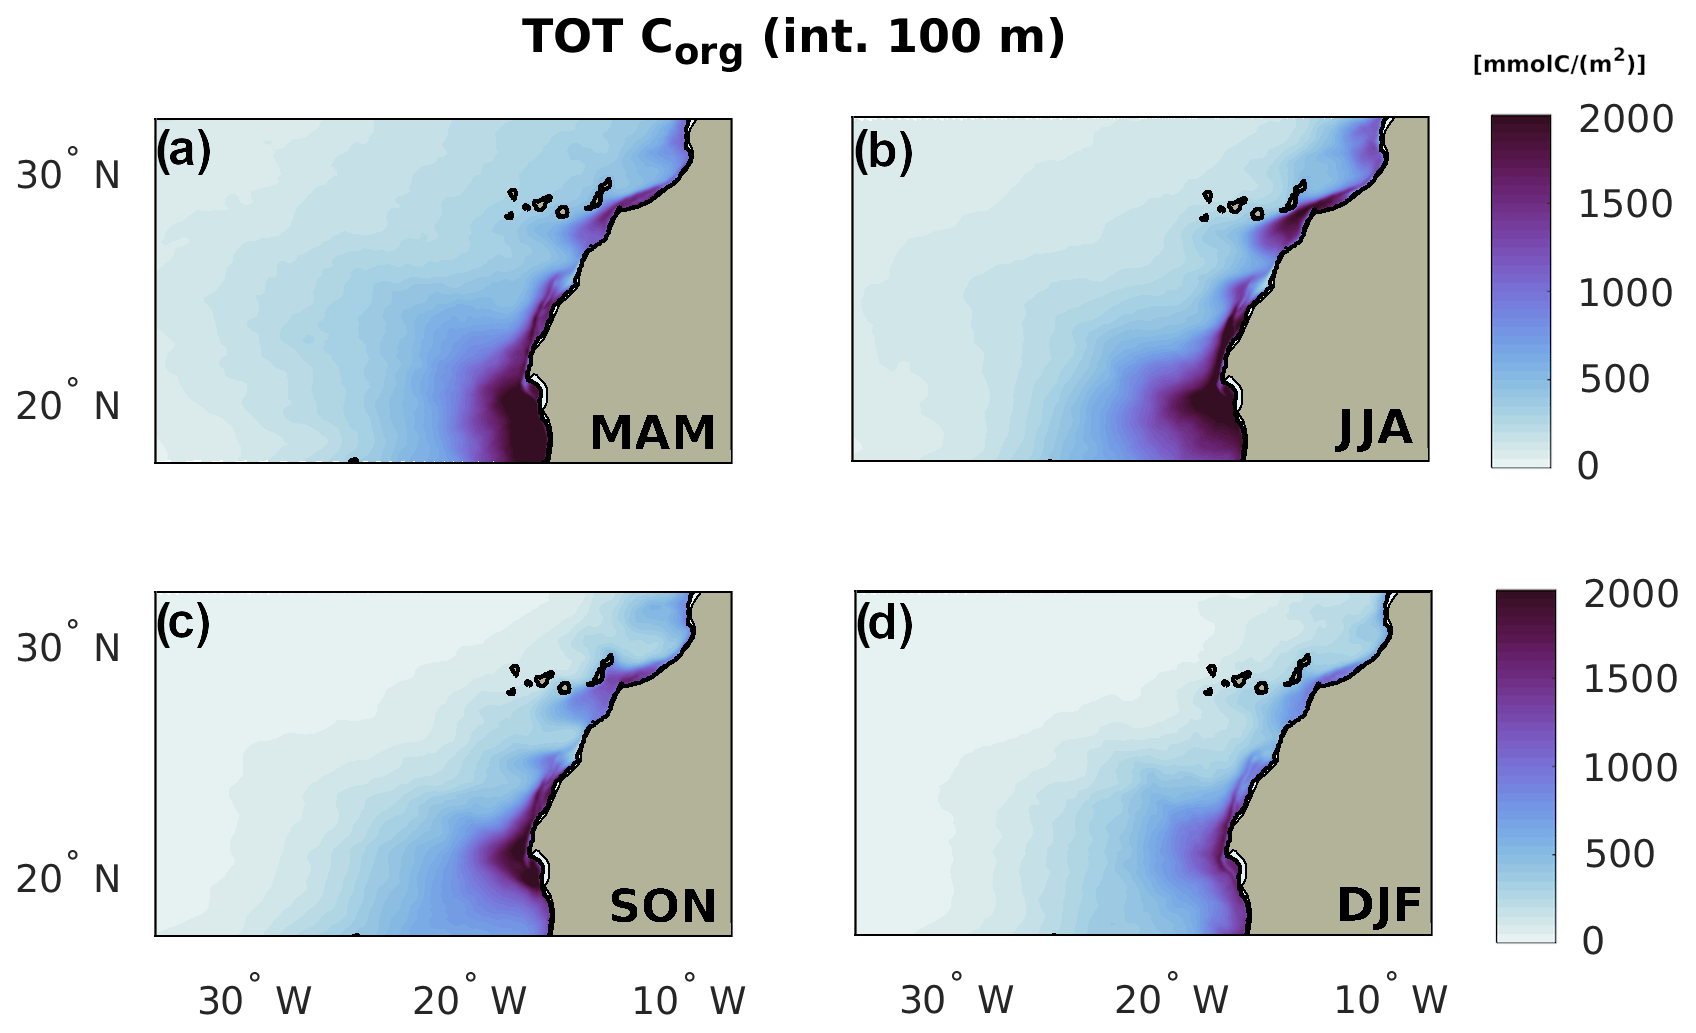
Figure B1Total Corg by season in the euphotic layer (100 m depth).
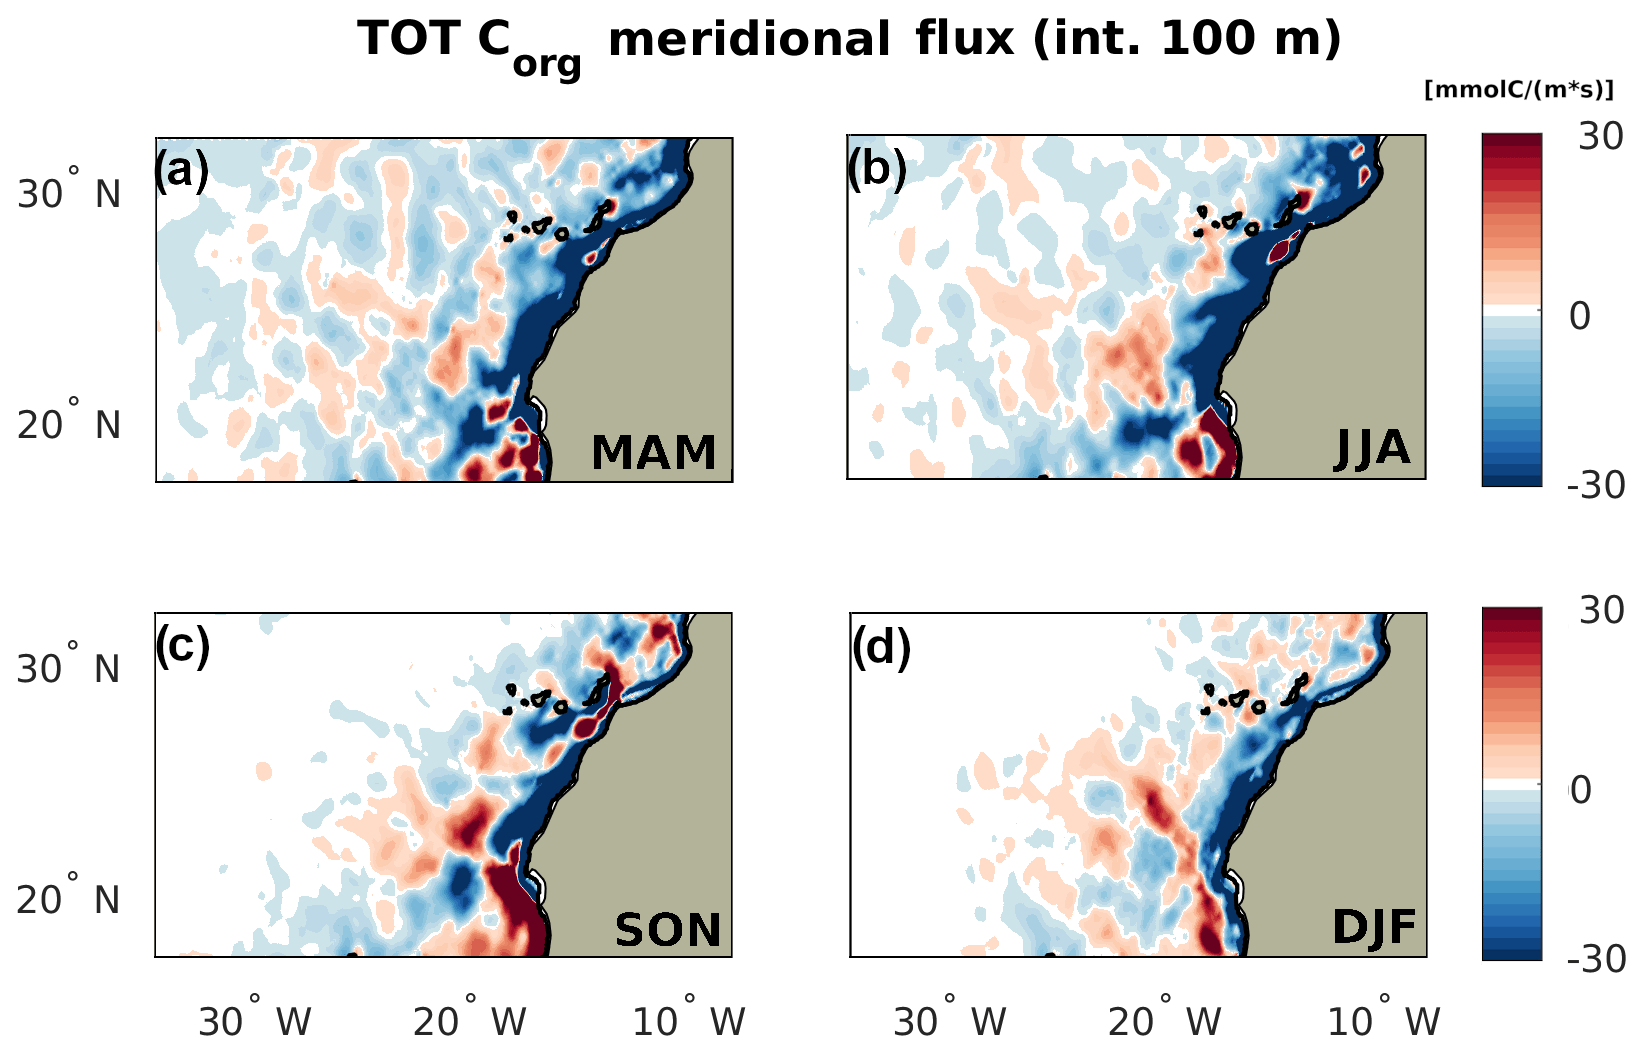
Figure B2Seasonality of the total meridional transport of Corg by season, with positive meaning northward. The flux is integrated throughout the first 100 m depth.

Figure B3Total NCP by season integrated across the euphotic layer (100 m depth).
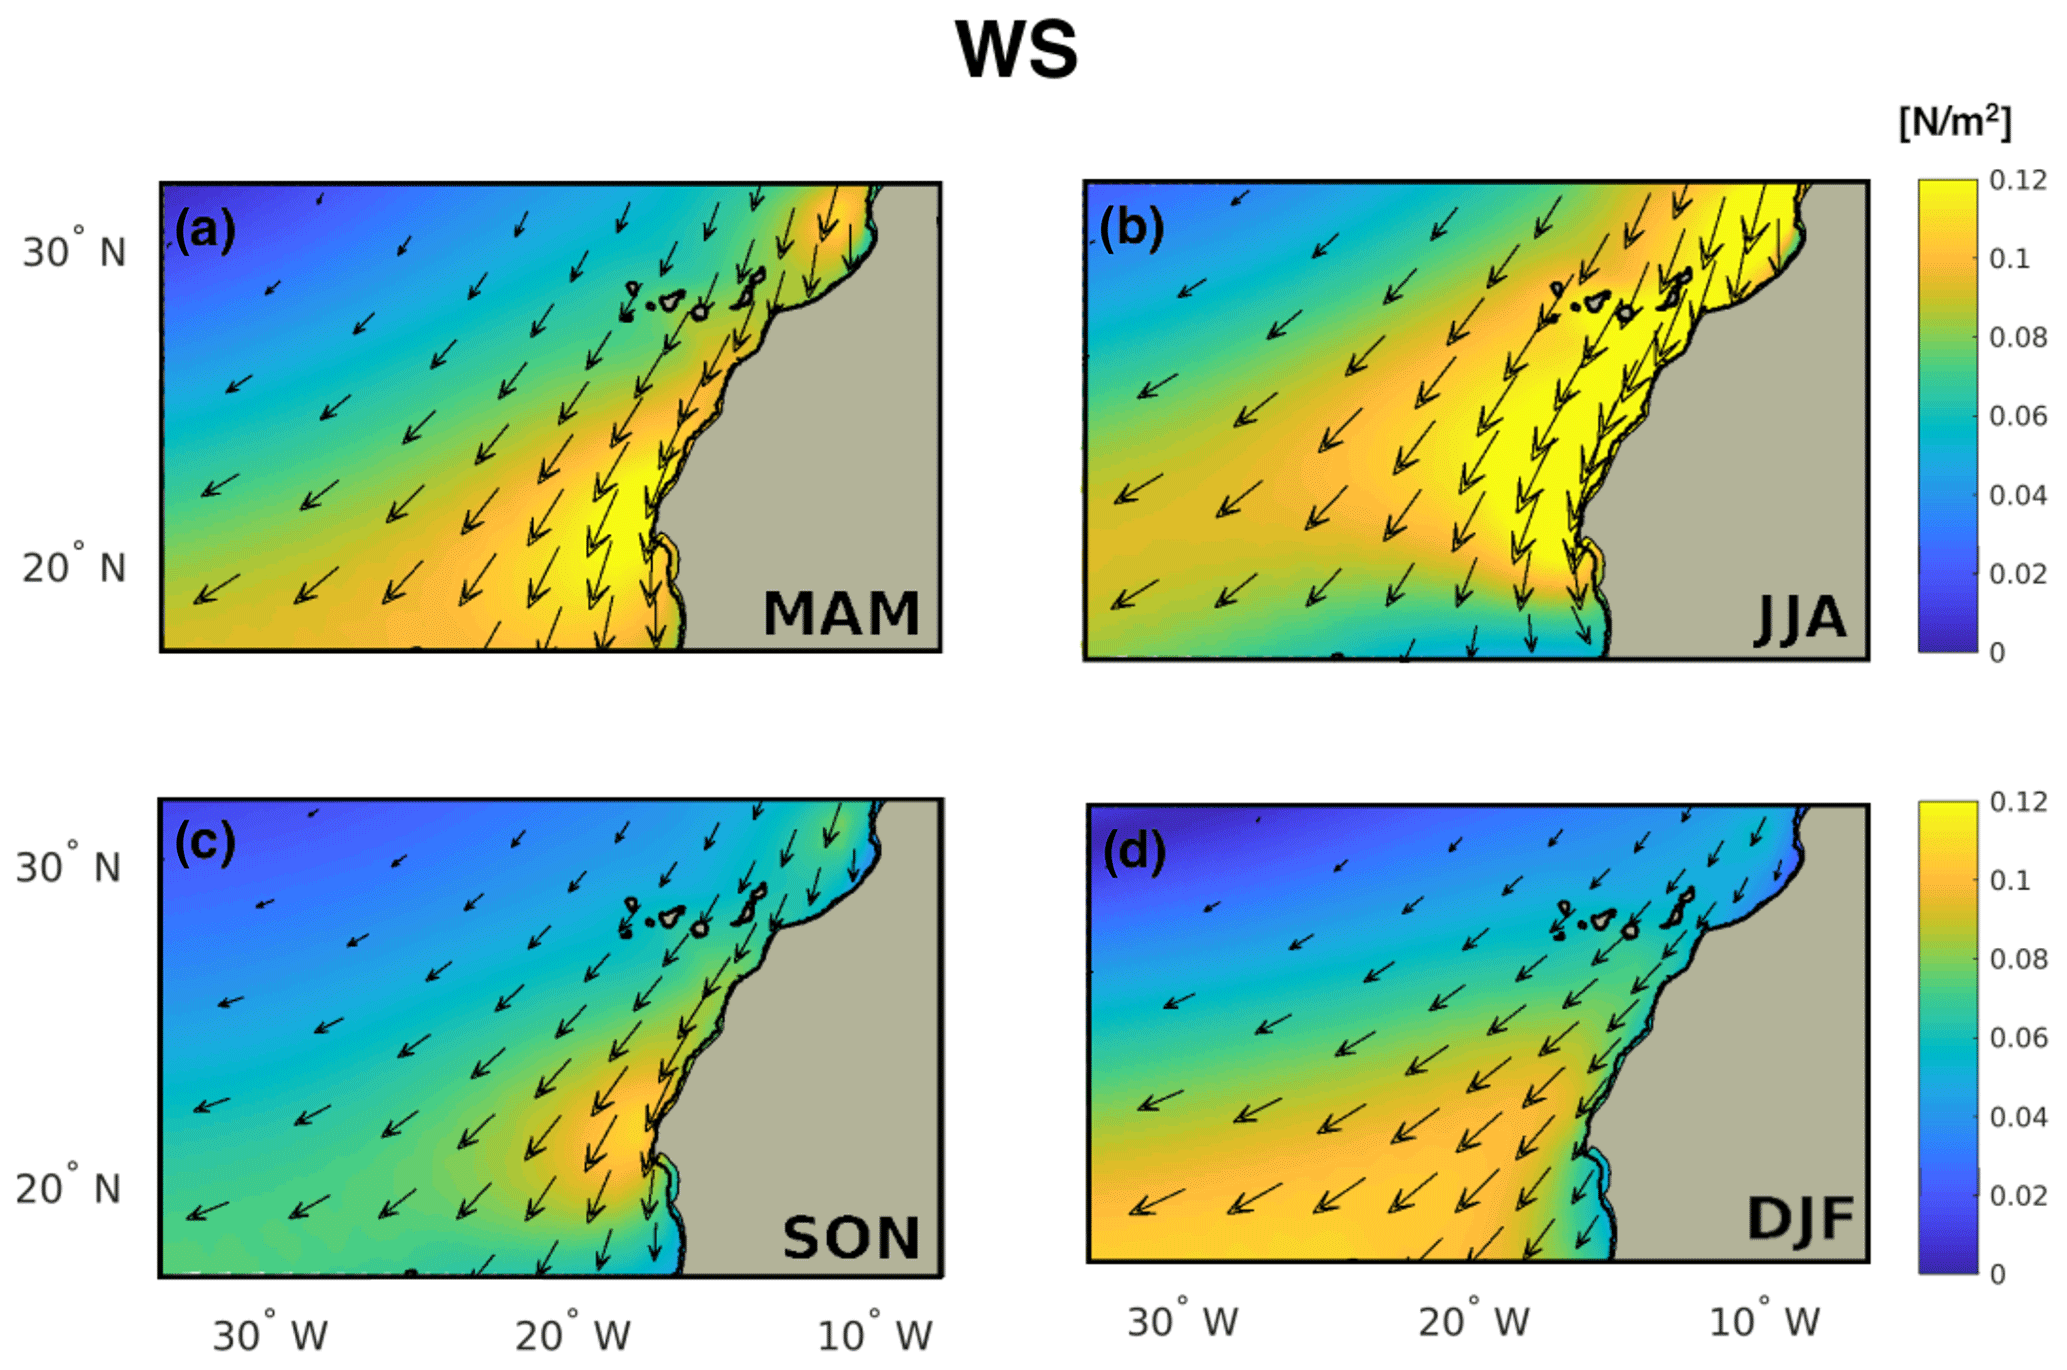
Figure B4Seasonality of the wind stress.
Figure B5Seasonality of wind stress curl.
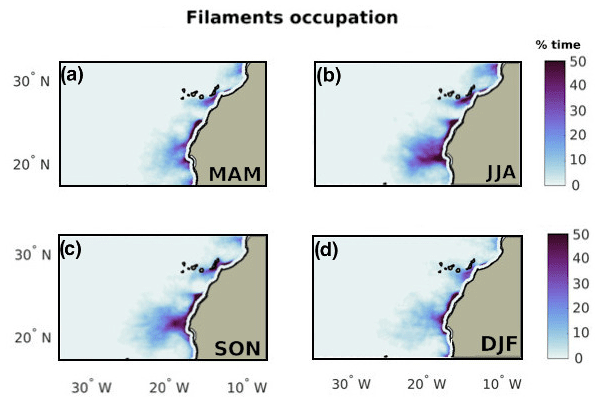
Figure B6Filament occupation by season. The first 50 km from the northwestern African coast have been shaded as, by definition, filaments always cover this range of distances.
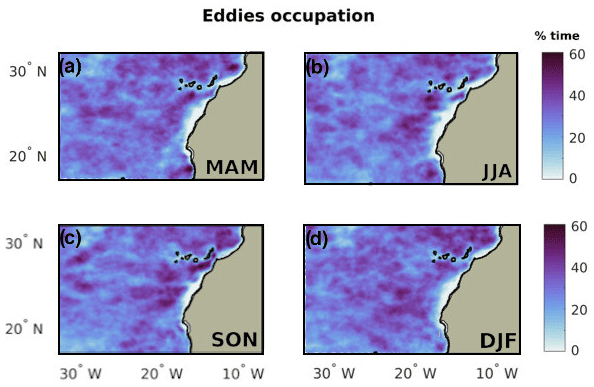
Figure B7Eddies occupation by season.
Model output is available upon request from Giulia Bonino (giulia.bonino@cmcc.it) or Elisa Lovecchio (elisa.lovecchio@noc.ac.uk). The data have been registered at the ETH library archive and are available at: https://www.research-collection.ethz.ch/handle/20.500.11850/278536 (Lovecchio, 2018, last access: 23 October 2020)
GB, EL, DI, and NG conceived the study. EL and MM set up the experiment and improved the model. GB and EL performed the analysis, interpreted the results, and wrote the manuscript. All authors contributed to improving the manuscript.
The authors declare that they have no conflict of interest.
The model simulations were performed at the HPC cluster of ETH Zurich, Euler, which is located in the Swiss Supercomputing Center (CSCS) in Lugano and operated by ETH ITS Scientific IT Services in Zurich.
This research has been supported by the Euro-Mediterranean Center on Climate Change (CMCC, Bologna, Italy) and by the Swiss National Science Foundation (Project CALNEX, grant no. 149384).
This paper was edited by Emilio Marañón and reviewed by Takeyoshi Nagai and one anonymous referee.
Álvarez-Salgado, X., Doval, M., Borges, A., Joint, I., Frankignoulle, M., Woodward, E., and Figueiras, F.: Off-shelf fluxes of labile materials by an upwelling filament in the NW Iberian Upwelling System, Prog. Oceanogr., 51, 321–337, https://doi.org/10.1016/S0079-6611(01)00073-8, 2001. a
Amos, C. M., Castelao, R. M., and Medeiros, P. M.: Offshore transport of particulate organic carbon in the California Current System by mesoscale eddies, Nat. Commun., 10, 1–8, 2019. a
Arístegui, J., Barton, E. D., Montero, M. F., Nos, M. G.-M., and Escánez, J.: Organic carbon distribution and water column respiration in the NW African-Canaries Coastal Transition Zone, Aquat. Microb. Ecol., 33, 289–301, https://doi.org/10.3354/ame033289, 2003. a
Arístegui, J., Alvarez-Salgado, X. A., Barton, E. D., Figueiras, F. G., Hernandez-Leon, S., Roy, C., and Santos, A.: Oceanography and fisheries of the Canary Current/Iberian region of the Eastern North Atlantic (18a, E), The global coastal ocean: interdisciplinary regional studies and syntheses, Harvard University Press, ISBN: 0–674–01527-4, 14, 877–931, 2006. a
Arístegui, J., Barton, E. D., Álvarez-Salgado, X. A., Santos, M. P., Figueiras, F. G., Kifani, S., Hernández-León, S., Mason, E., Machú, E., and Demarq, H.: Sub-regional ecosystem variability in the Canary Current upwelling, Prog. Oceanogr., 83, 33–48, https://doi.org/10.1016/j.pocean.2009.07.031, 2009. a, b, c, d, e, f
Bakun, A. and Nelson, C. S.: The seasonal cycle of wind-stress curl in subtropical eastern boundary current regions, J. Phys. Oceanogr., 21, 1815–1834, 1991. a
Behrenfeld, M. J. and Falkowski, P. G.: Photosynthetic rates derived from satellite-based chlorophyll concentration, Limnol. Oceanogr., 42, 1–20, https://doi.org/10.4319/lo.1997.42.1.0001, 1997. a
Benazzouz, A., Mordane, S., Orbi, A., Chagdali, M., Hilmi, K., Atillah, A., Pelegrí, J. L., and Hervé, D.: An improved coastal upwelling index from sea surface temperature using satellite-based approach – The case of the Canary Current upwelling system, Cont. Shelf Res., 81, 38–54, 2014. a, b
Bonino, G., Di Lorenzo, E., Masina, S., and Iovino, D.: Interannual to decadal variability within and across the major Eastern Boundary Upwelling Systems, Sci. Rep.-UK, 9, 1–14, 2019a. a, b
Bonino, G., Masina, S., Iovino, D., Storto, A., and Tsujino, H.: Eastern Boundary Upwelling Systems response to different atmospheric forcing in a global eddy-permitting ocean model, J. Marine Syst., 197, 103178, https://doi.org/10.1016/j.jmarsys.2019.05.004, 2019b. a
Burd, A. B., Hansell, D. A., Steinberg, D. K., Anderson, T. R., Arístegui, J., Baltar, F., Beaupre, S. R., Buesseler, K. O., DeHairs, F., Jackson, G. A., Kadko, D. C., Koppelmann, R., Lampitt, R. S., Nagata, T., Reinthaler, T., Robinson, C., Robison, B. H., Tamburini, C., and Tanaka, T.: Assessing the apparent imbalance between geochemical and biochemical indicators of meso-and bathypelagic biological activity: What the @#! is wrong with present calculations of carbon budgets?, Deep-Sea Res. Pt. II, 57, 1557–1571, https://doi.org/10.1016/j.dsr2.2010.02.022, 2010. a
Carr, M.-E.: Estimation of potential productivity in Eastern Boundary Currents using remote sensing, Deep-Sea Res. Pt. II, 49, 59–80, https://doi.org/10.1016/S0967-0645(01)00094-7, 2001. a, b
Carr, M.-E. and Kearns, E. J.: Production regimes in four Eastern Boundary Current Systems, Deep-Sea Res. Pt. II, 50, 3199–3221, https://doi.org/10.1016/j.dsr2.2003.07.015, 2003. a
Chavez, F. and Toggweiler, J.: Modern Processes and Ancient Records, 1995. a
Chavez, F. P. and Messié, M.: A comparison of Eastern Boundary Upwelling Ecosystems, Prog. Oceanogr., 83, 80–96, https://doi.org/10.1016/j.pocean.2009.07.032, 2009. a, b, c
Chelton, D. B., Schlax, M. G., and Samelson, R. M.: Global observations of nonlinear mesoscale eddies, Prog. Oceanogr., 91, 167–216, https://doi.org/10.1016/j.pocean.2011.01.002, 2011. a
Dee, D. P., Uppala, S. M., Simmons, A. J., Berrisford, P., Poli, P., Kobayashi, S., Andrae, U., Balmaseda, M. A., Balsamo, G., Bauer, P., Bechtold, P., Beljaars, A. C. M., van de Berg, L., Bidlot, J., Bormann, N., Delsol, C., Dragani, R., Fuentes, M., Geer, A. J., Haimberger, L., Healy, S. B., Hersbach, H., Hólm, E. V., Isaksen, L., Kållberg, P., Köhler, M., Matricardi, M., McNally, A. P., Monge-Sanz, B. M., Morcrette, J.-J., Park, B.-K., Peubey, C., de Rosnay, P., Tavolato, C., Thépaut, J.-N. and Vitart, F.: The ERA-Interim reanalysis: configuration and performance of the data assimilation system, Q. J. Roy. Meteor. Soc., 137, 553–597, https://doi.org/10.1002/qj.828, 2011. a, b
Desbiolles, F., Blanke, B., and Bentamy, A.: Short-term upwelling events at the western African coast related to synoptic atmospheric structures as derived from satellite observations, J. Geophys. Res.-Oceans, 119, 461–483, https://doi.org/10.1002/2013JC009278, 2014. a, b
Duarte, C. M., de Gioux, A. R., Arrieta, J. M., Delgado-Huertas, A., and Augustí, S.: The Oligotrophic Ocean is Heterotrophic, Annu. Rev. Mar. Sci., 5, 551–569, 2013. a
Ducklow, H. W. and Doney, S. C.: What is the metabolic state of the oligotrophic ocean? A Debate, Annu. Rev. Mar. Sci., 5, 525–533, https://doi.org/10.1146/annurev-marine-121211-172331, 2013. a
Faghmous, J. H., Frenger, I., Yao, Y., Warmka, R., Lindell, A., and Kumar, V.: A daily global mesoscale ocean eddy dataset from satellite altimetry, Scientific Data, 2, 150028, https://doi.org/10.1038/sdata.2015.28, 2015. a, b
Frischknecht, M., Münnich, M., and Gruber, N.: Origin, Transformation, and Fate: The Three-Dimensional Biological Pump in the California Current System, J. Geophys. Res.-Oceans, 123, 7939–7962, https://doi.org/10.1029/2018JC013934, 2018. a, b
Gabric, A. J., Garcia, L., Camp, L. V., Nykjaer, L., Eifler, W., and Schrimpf, W.: Offshore export of shelf production in the Cape Blanc (Mauritania) giant filament as derived from coastal zone color scanner imagery, J. Geophys. Res.-Oceans, 98, 4697–4712, https://doi.org/10.1029/92JC01714, 1993. a, b
Garcìa-Muñoz, M., Arístegui, J., Montero, M. F., and Barton, E. D.: Distribution and transport of organic matter along a filament-eddy system in the Canaries – NW Africa coastal transition zone region, Prog. Oceanogr., 62, 115–129, https://doi.org/10.1016/j.pocean.2004.07.005, 2004. a, b, c
García-Muñoz, M., Arístegui, J., Pelegrí, J. L., Antoranz, A., Ojeda, A., and Torres, M.: Exchange of carbon by an upwelling filament off Cape Ghir (NW Africa), J. Marine Syst., 54, 83–95, https://doi.org/10.1016/j.jmarsys.2004.07.005, 2005. a, b
Gruber, N., Frenzel, H., Doney, S. C., Marchesiello, P., McWilliams, J. C., Oram, J. R., Plattner, G. K., and Stolzenbach, K. D.: Eddy-resolving simulation of plankton ecosystem dynamics in the California Current System, Deep-Sea Res. Pt. I, 53, 1483–1516, https://doi.org/10.1016/j.dsr.2006.06.005, 2006. a
Hagen, E.: Northwest African upwelling scenario, Oceanol. Acta, 24, 113–128, 2001. a
Hansell, D. A., Carlson, C. A., Repeta, D., and Schlitzer, R.: Dissolved Organic Matter in the Ocean: a controversy stimulates new insights, Oceanography, 22, 202–211, https://doi.org/10.5670/oceanog.2009.109, 2009. a
Hernández-Guerra, A., Machın, F., Antoranz, A., Cisneros-Aguirre, J., Gordo, C., Marrero-Dıaz, A., Martınez, A., Ratsimandresy, A., Rodrıguez-Santana, A., Sangrá, P., López-Laazen, F., Parrilla, G., and Pelegrıá, J. L.: Temporal variability of mass transport in the Canary Current, Deep-Sea Res. Pt. II, 49, 3415–3426, 2002. a
Jacox, M. G., Fiechter, J., Moore, A. M., and Edwards, C. A.: ENSO and the California Current coastal upwelling response, J. Geophys. Res.-Oceans, 120, 1691–1702, https://doi.org/10.1002/2014JC010650, 2015. a
Koračin, D., Dorman, C. E., and Dever, E. P.: Coastal perturbations of marine-layer winds, wind stress, and wind stress curl along California and Baja California in June 1999, J. Phys. Oceanogr., 34, 1152–1173, 2004. a
Lachkar, Z. and Gruber, N.: What controls biological production in coastal upwelling systems? Insights from a comparative modeling study, Biogeosciences, 8, 2961–2976, https://doi.org/10.5194/bg-8-2961-2011, 2011. a, b
Lathuilière, C., Echevin, V., and Lévy, M.: Seasonal and intraseasonal surface chlorophyll – a variability along the northwest African coast, J. Geophys. Res.-Oceans, 113, C5, https://doi.org/10.1029/2007JC004433, 2008. a, b
Lázaro, C., Fernandes, M. J., Santos, A. M. P., and Oliveira, P.: Seasonal and interannual variability of surface circulation in the Cape Verde region from 8 years of merged T/P and ERS-2 altimeter data, Remote Sens. Environ., 98, 45–62, 2005. a
Lovecchio, E.: ROMS+NPZD model data: turbulent and mesoscale contribution to the transport of organic carbon in the Canary Upwelling System [dataset], ETH Zurich, Switzerland, available at: https://doi.org/10.3929/ethz-b-000278536, 2018.
Lovecchio, E., Gruber, N., Münnich, M., and Lachkar, Z.: On the long-range offshore transport of organic carbon from the Canary Upwelling System to the open North Atlantic, Biogeosciences, 14, 3337–3369, https://doi.org/10.5194/bg-14-3337-2017, 2017. a, b, c, d, e, f, g, h, i, j
Lovecchio, E., Gruber, N., and Münnich, M.: Mesoscale contribution to the long-range offshore transport of organic carbon from the Canary Upwelling System to the open North Atlantic, Biogeosciences, 15, 5061–5091, https://doi.org/10.5194/bg-15-5061-2018, 2018. a, b, c, d, e, f, g, h, i, j, k
Lumpkin, R. and Johnson, G. C.: Global Ocean Surface Velocities from Drifters: Mean, Variance, ENSO Response, and Seasonal Cycle, J. Geophys. Res.-Oceans, 118, 2992–3006, https://doi.org/10.1002/jgrc.20210, 2013. a
Machín, F., Pelegrí, J. L., Fraile-Nuez, E., Vélez-Belchí, P., López-Laatzen, F., and Hernández-Guerra, A.: Seasonal flow reversals of Intermediate Waters in the Canary Current System east of the Canary Islands, J. Phys. Oceanogr., 40, 1902–1909, 2010. a
Mackas, D. L., Strub, P. T., Thomas, A., and Montecino, V.: Eastern Ocean Boundaries: Pan-Regional Overview, in: The Sea, The Global Coastal Ocean, Harvard University Press, 14, 2006. a
Maheu, C., Pujol, M., and Faugère, Y.: Change of the Ssalto/Duacs reference period, Tech. Rep., CNES, AVISO+, available at: https://www.aviso.altimetry.fr/fileadmin/documents/newsstand/Newsletter/aviso_users_news09.pdf (last access: 13 April 2021), 2014. a
Mason, E., Colas, F., Molemaker, J., Shchepetkin, A. F., Troupin, C., McWilliams, J. C., and Sangrà, P.: Seasonal variability of the Canary Current: A numerical study, J. Geophys. Res.-Oceans, 116, C6, https://doi.org/10.1029/2010JC006665, 2011. a, b
Menna, M., Faye, S., Poulain, P. M., Centurioni, L., Lazar, A., Gaye, A., Sow, B., and Dagorne, D.: Upwelling features off the coast of north-western Africa in 2009–2013, B. Geofis. Teor. Appl., 57, 71–86, https://doi.org/10.4430/bgta0164, 2016. a
Messié, M. and Chavez, F. P.: Seasonal regulation of primary production in eastern boundary upwelling systems, Prog. Oceanogr., 134, 1–18, 2015. a, b
Messié, M., Ledesma, J., Kolber, D. D., Michisaki, R. P., Foley, D. G., and Chavez, F. P.: Potential new production estimates in four eastern boundary upwelling ecosystems, Prog. Oceanogr., 83, 151–158, https://doi.org/10.1016/j.pocean.2009.07.018, 2009. a, b, c, d
Mittelstaedt, E.: The ocean boundary along the northwest African coast: Circulation and oceanographic properties at the sea surface, Prog. Oceanogr., 26, 307–355, https://doi.org/10.1016/0079-6611(91)90011-A, 1991. a
Nagai, T., Gruber, N., Frenzel, H., Lachkar, Z., McWilliams, J. C., and Plattner, G.-K.: Dominant role of eddies and filaments in the offshore transport of carbon and nutrients in the California Current System, J. Geophys. Res.-Oceans, 120, 5318–5341, https://doi.org/10.1002/2015JC010889, 2015. a
Ohde, T., Fiedler, B., and Körtzinger, A.: Spatio-temporal distribution and transport of particulate matter in the eastern tropical North Atlantic observed by Argo floats, Deep-Sea Res. Pt. I, 102, 26–42, https://doi.org/10.1016/j.dsr.2015.04.007, 2015. a
Pauly, D. and Christensen, V.: Primary production required to sustain global fisheries, Nature, 374, 255–257, 1995. a
Pelegrí, J. L. and Benazzouz, A.: Coastal Upwelling off Northwest Africa, in: Oeanographic and biological features in the Canary Current Large Marine Ecosystem, edited by: Váldes, L. and Déniz-González, I., IOC-UNESCO Technical Series 115, Intergovernmental Oceanographic Commission, 2015. a, b
Pelegrí, J. L. and Peña-Izquierdo, J.: Eastern Boudary Currents off Northwest Africa, in: Oeanographic and biological features in the Canary Current Large Marine Ecosystem, edited by: Váldes, L. and Déniz-González, I., IOC-UNESCO Technical Series 115, Intergovernmental Oceanographic Commission, 2015. a, b, c, d, e, f
Pelegrí, J. L., Arístegui, J., Cana, L., González-Dávila, M., Hernández-Guerra, A., Hernández-León, S., Montero, M. F., Sangrá, P., and Santana-Casiano, M.: Coupling between the open ocean and the coastal upwelling region off northwest Africa: water recirculation and offshore pumping of organic matter, J. Marine Syst., 54, 3–37, https://doi.org/10.1016/j.jmarsys.2004.07.003, 2005. a
Peña-Izquierdo, J., Pelegrí, J. L., Pastor, M. V., Castellanos, P., Emelianov, M., Gasser, M., Salvador, J., and Vázquez-Domínguez, E.: The continental slope current system between Cape Verde and the Canary Islands, Sci. Mar., 76, 65–78, https://doi.org/10.3989/scimar.03607.18C, 2012. a
Pickett, M. H. and Paduan, J. D.: Ekman transport and pumping in the California Current based on the US Navy's high-resolution atmospheric model (COAMPS), J. Geophys. Res.-Oceans, 108, C10, https://doi.org/10.1029/2003JC001902, 2003. a
Pradhan, Y., Lavender, S. J., Hardman-Mountford, N. J., and Aiken, J.: Seasonal and inter-annual variability of chlorophyll – a concentration in the Mauritanian upwelling: Observation of an anomalous event during 1998–1999, Deep-Sea Res. Pt. II, 53, 1548–1559, https://doi.org/10.1016/j.dsr2.2006.05.016, 2006. a
Risien, C. M. and Chelton, D. B.: A global climatology of surface wind and wind stress fields from eight years of QuikSCAT scatterometer data, J. Phys. Oceanogr., 38, 2379–2413, 2008. a
Rykaczewski, R. R. and Checkley, D. M.: Influence of ocean winds on the pelagic ecosystem in upwelling regions, P. Natl. Acad. Sci. USA, 105, 1965–1970, https://doi.org/10.1073/pnas.0711777105, 2008. a
Sánchez, R. F., Relvas, P., Martinho, A., and Miller, P.: Physical description of an upwelling filament west of Cape St. Vincent in late October 2004, J. Geophys. Res.-Oceans, 113, C7, https://doi.org/10.1029/2007JC004430, 2008. a
Sangrà, P., Pascual, A., Rodríguez-Santana, Á., Machín, F., Mason, E., McWilliams, J., Pelegrí, J., Dong, C., Rubio, A., Arístegui, J., Marrero-Díaz, Á., Hernández-Guerra, A., Martínez-Marrero, A., and Auladell, M.: The Canary Eddy Corridor: A major pathway for long-lived eddies in the subtropical North Atlantic, Deep-Sea Res. Pt. I, 56, 2100–2114, https://doi.org/10.1016/j.dsr.2009.08.008, 2009. a, b
Santana-Falcón, Y., Benavides, M., Sangrà, P., Mason, E., Barton, E. D., Orbi, A., and Arístegui, J.: Coastal-offshore exchange of organic matter across the Cape Ghir filament (NW Africa) during moderate upwelling, J. Marine Syst., 154, 233–242, https://doi.org/10.1016/j.jmarsys.2015.10.008, 2016. a, b, c
Santana-Falcón, Y., Mason, E., and Arístegui, J.: Offshore transport of organic carbon by upwelling filaments in the Canary Current System, Prog. Oceanogr., 186, 102322, https://doi.org/10.1016/j.pocean.2020.102322, 2020. a, b, c
Shchepetkin, A. F. and McWilliams, J. C.: The regional oceanic modeling system (ROMS): a split-explicit, topographic-following-coordinate oceanic model, Ocean Model., 9, 347–404, https://doi.org/10.1016/j.ocemod.2004.08.002, 2005. a
Taboada, F. G., Stock, C. A., Griffies, S. M., Dunne, J., John, J. G., Small, R. J., and Tsujino, H.: Surface winds from atmospheric reanalysis lead to contrasting oceanic forcing and coastal upwelling patterns, Ocean Model., 133, 79–111, 2019. a
Wang, D., Gouhier, T. C., Menge, B. A., and Ganguly, A. R.: Intensification and spatial homogenization of coastal upwelling under climate change, Nature, 518, 390–394, 2015. a
Westberry, T., Behrenfeld, M. J., Siegel, D. A., and Boss, E.: Carbon-based primary productivity modeling with vertically resolved photoacclimation, Global Biogeochem. Cy., 22, GB2024, https://doi.org/10.1029/2007GB003078, 2008. a
Williams, P. J. L. B., Quay, P. D., Westberry, T. K., and Behrenfeld, M. J.: The Oligotrophic Ocean Is Autotrophic, Annu. Rev. Mar. Sci., 5, 535–549, https://doi.org/10.1146/annurev-marine-121211-172335, 2013. a