the Creative Commons Attribution 4.0 License.
the Creative Commons Attribution 4.0 License.
 | 19 Apr 2021
Biogeochemical and plant trait mechanisms drive enhanced methane emissions in response to whole-ecosystem warming
J. Patrick Megonigal
Climate warming perturbs ecosystem carbon (C) cycling, causing both positive and negative feedbacks on greenhouse gas emissions. In 2016, we began a tidal marsh field experiment in two vegetation communities to investigate the mechanisms by which whole-ecosystem warming alters C gain, via plant-driven sequestration in soils, and C loss, primarily via methane (CH4) emissions. Here, we report the results from the first 4 years. As expected, warming of 5.1 ∘C more than doubled CH4 emissions in both plant communities. We propose this was caused by a combination of four mechanisms: (i) a decrease in the proportion of CH4 consumed by CH4 oxidation, (ii) more C substrates available for methanogenesis, (iii) reduced competition between methanogens and sulfate-reducing bacteria, and (iv) indirect effects of plant traits. Plots dominated by Spartina patens consistently emitted more CH4 than plots dominated by Schoenoplectus americanus, indicating key differences in the roles these common wetland plants play in affecting anaerobic soil biogeochemistry and suggesting that plant composition can modulate coastal wetland responses to climate change.
- Article
(1347 KB) - Full-text XML
-
Supplement
(657 KB) - BibTeX
- EndNote


Methane (CH4) is a potent greenhouse gas that contributes to 15 %–19 % of total greenhouse gas radiative forcing (IPCC, 2013) and has a sustained-flux global warming potential that is 45 times that of CO2 on a 100-year timescale (Neubauer and Megonigal, 2015). Wetlands are the largest natural source of CH4 to the atmosphere and were recently identified as the largest source of uncertainty in the global CH4 budget (Saunois et al., 2016). Recent estimates calculate that CH4 emissions from vegetated coastal wetlands offset 3.6 of the 12.2 million metric tons (MMT) of CO2 equivalents accumulated by these ecosystems each year (EPA, 2017). Despite this, there is still a substantial knowledge gap regarding how global change factors, such as climate warming, will alter coastal wetland CH4 emissions (Mcleod et al., 2011) even though these feedbacks have the potential to shift coastal wetlands from being a net sink of C to a net source (Al-Haj and Fulweiler, 2020; Bridgham et al., 2006).
The net flux of CH4 to the atmosphere from any ecosystem represents the balance between the amount of CH4 produced (methanogenesis), the amount of CH4 oxidized (methanotrophy), and the rate of CH4 transport from the soil. In coastal wetlands, methanogenesis occurs through three pathways: (i) hydrogenotrophic methanogenesis (i.e., CO2 reduction) in which H2 is the electron donor and CO2 is the electron acceptor; (ii) acetoclastic methanogenesis, in which acetate (CH4COOH) is split into CH4 and CO2; and (iii) methylotrophic methanogenesis in which methylated compounds are converted to CH4 and CO2 (Conrad, 2020; Oremland et al., 1982; Schlesinger and Bernhardt, 2020). Rates of methanogenesis are driven by low-redox conditions and substrate availability, while aerobic CH4 oxidation requires both O2 and CH4 as substrates. Roots and rhizomes in wetland ecosystems influence methane-related substrates through at least two mechanisms: (i) deposition of organic compounds that support multiple pathways of heterotrophic microbial respiration, including methanogenesis, and (ii) release of O2 that simultaneously promotes CH4 oxidation and regeneration of competing electron acceptors such as Fe(III) and SO4 (Philippot et al., 2009; Stanley and Ward, 2010). Root exudates, which typically include low-molecular-weight compounds, may either be more readily used by microbes than existing soil C (Kayranli et al., 2010; Megonigal et al., 1999) or prime microbial use of soil C (Basiliko et al., 2012; Philippot et al., 2009; Robroek et al., 2016; Waldo et al., 2019). Root exudates can also decrease CH4 oxidation by stimulating use of O2 by other aerobic microbes (Lenzewski et al., 2018; Mueller et al., 2016). Consequently, wetland CH4 emissions are strongly linked to a wide variety of plant traits that govern the supply of reductive (organic carbon) and oxidative (O2) substrates to soils (Moor et al., 2017; Mueller et al., 2020).
Although it is understood that wetland plants are a primary control on CH4 emissions and that much of their influence is mediated through conditions in the rhizosphere (Waldo et al., 2019), there are surprisingly few data, especially from coastal wetlands, that couple plant responses to the dynamics of electron donors (organic C), electron acceptors (O2, SO4), and the rates of competing (sulfate reduction vs. methanogenesis) or opposing (CH4 production vs. CH4 oxidation) microbial processes. The general lack of process data on wetland CH4 cycling makes it difficult to forecast ecosystem responses to climate change. For example, the well-documented observation that warming increases wetland methane emissions can be either amplified or dampened depending on changes in plant activity (e.g., primary production) or plant traits (e.g., community composition) (Mueller et al., 2020). Vegetation composition has been shown to be a stronger control on CH4 emissions than ∼ 1 ∘C of warming in northern peatlands (Ward et al., 2013), and Chen et al. (2017) proposed that warming effects on plant functional types can drive C flux responses that cannot otherwise be explained by abiotic conditions. In freshwater marshes, plant species and growth trends have also been linked to seasonal shifts in pools of dissolved CH4 and dissolved inorganic carbon (DIC; Ding et al., 2005; Stanley and Ward, 2010) and methanogenesis dynamics (Sorrell et al., 1997).
Tidal wetlands are particularly good model systems for determining the mechanisms by which warming alters CH4 emissions. Not only will the CH4 cycle respond to the direct effects of warming, but the temperature effects on the outcome of competition for electron acceptors are relatively easily observed because of the abundance of SO4. Thermodynamic theory in which terminal electron acceptors (TEAs) are used in order of decreasing thermodynamic yield is commonly interpreted to mean that a system will support only one form of anaerobic respiration at a time, with acetoclastic and hydrogenotrophic methanogenesis occurring only when pools of more energetically favorable TEAs have been depleted (Conrad, 2020; Schlesinger and Bernhardt, 2020). However, in real systems with spatial and temporal variability in the supply of electron donor substrates and TEAs, all forms of anaerobic metabolism occur simultaneously (Megonigal et al., 2004; Bridgham et al., 2013). Much of this spatial and temporal variation arises from the distribution and activity of roots and rhizomes as mediated by the rhizosphere (Neubauer et al., 2008). Global change factors such as warming will further affect the spatial distribution of key metabolic substrates. In addition, the relatively limited species diversity in saline tidal wetlands allows species-level effects on CH4 cycling to be delineated more easily than in diverse freshwater wetlands.
Methane flux measurements are a metric of broader shifts in redox potential and biogeochemical cycling, as they are sensitive to virtually all processes that regulate availability of electron donors and electron acceptors. Emissions are commonly predicted to increase with future climate warming, including from coastal wetlands (Al-Haj and Fulweiler, 2020), but there is minimal prior understanding of the underlying mechanisms, which was the focus of this study. Our objectives were to explore the mechanisms that drive enhanced CH4 emissions under warming. To accomplish this, we measured monthly CH4 emissions from 2016 through 2019 and coupled these flux measurements with analysis of porewater biogeochemistry and vegetation biomass and composition.
2.1 Site description and experimental design
The Salt Marsh Accretion Response to Temperature eXperiment (SMARTX) was established in the Smithsonian's Global Change Research Wetland (GCReW) in 2016. GCReW is part of Kirkpatrick Marsh, a microtidal, brackish high marsh on the western shore of the Chesapeake Bay, USA (38∘53′ N, 76∘33′ W). Soils are organic (> 80 % organic matter) to a depth of 5 m, which is typical of high marshes in the Chesapeake Bay and elsewhere. The very low mineral content (< 20 %) affects methane dynamics because negligible competition between methanogens and iron-reducing bacteria for electron donors is expected in the absence of a significant pool of poorly crystalline iron oxides (Roden and Wetzel, 1996), as has been documented previously at this site (Weiss et al., 2004). Soil bulk density in the upper 60 cm averages 0.124 g cm3 and ranges from 0.079 to 0.180 g cm3. The relatively uniform bulk density of the soil profile reflects the uniform soil organic matter content and the fact that bulk density becomes largely independent of organic matter and mineral content once organic matter content exceeds 50 % (Holmquist et al., 2018). The marsh is typically saturated to within 5–15 cm of the soil surface, but inundation frequency varies across the site, from 10 %–20 % of high tides in high-elevation areas to 30 %–60 % of high tides in low-elevation areas.
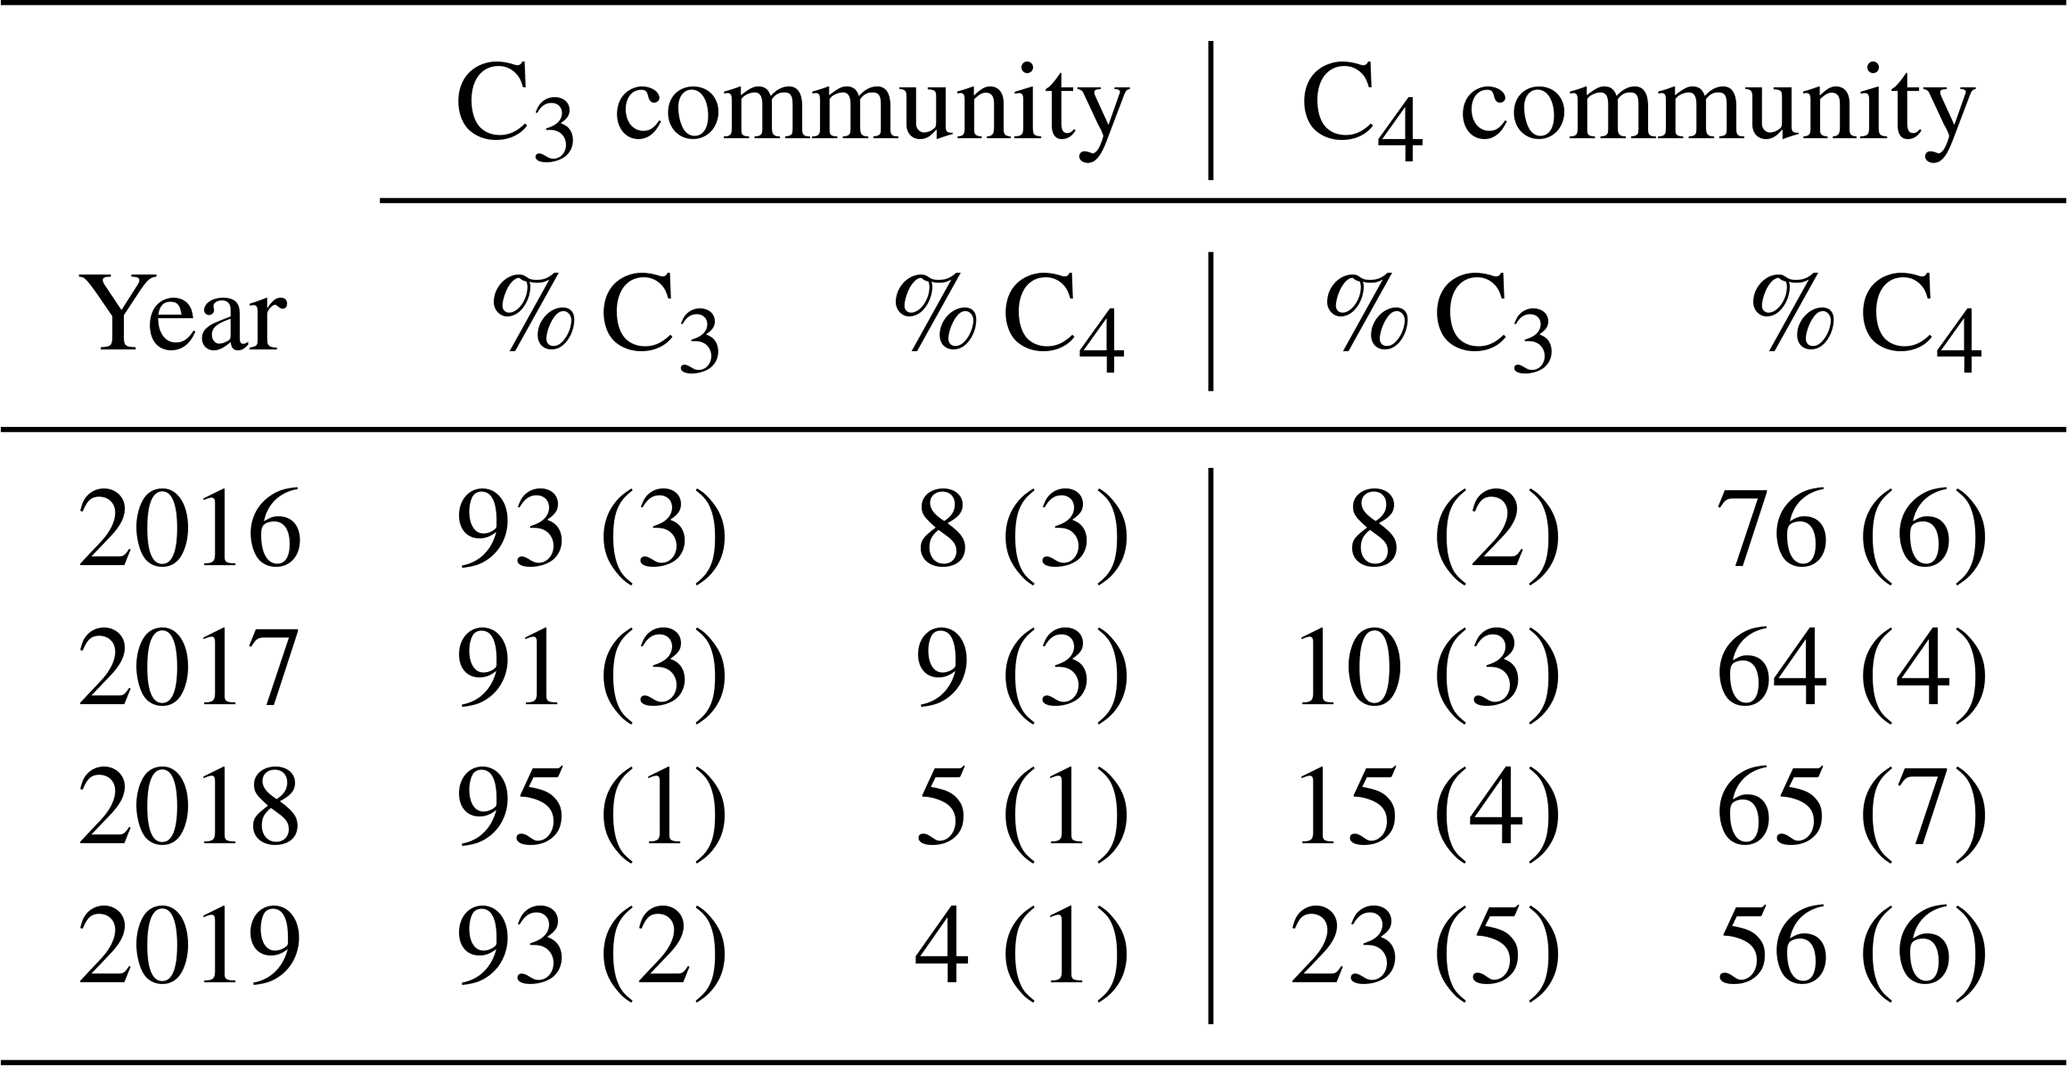
SMARTX consists of six replicate transects, three located in each of the two dominant annual plant communities (Fig. S1). In the C3-dominated community (herein the “C3 community”) the C3 sedge Schoenoplectus americanus (herein Schoenoplectus) composes more than 90 % of the aboveground biomass (Table 1). In the C4-dominated community (herein the “C4 community”), 75 % of the aboveground biomass was initially composed of two C4 grasses (Spartina patens and Distichlis spicata, herein Spartina and Distichlis, respectively). However, by 2019, Spartina and Distichlis declined to 56 % of the aboveground biomass (Table 1).
Table 1Relative contribution to total aboveground biomass from C3 sedges (Schoenoplectus americanus) and C4 grasses (Spartina patens and Distichlis spicata) in each plant community. Values are means and SE (n = 12).
Each transect is an active warming gradient consisting of unheated ambient plots and plots that are heated to 1.7, 3.4, and 5.1 ∘C above ambient. All plots are 2 m× 2 m with a 20 cm-wide buffer around the perimeter. Aboveground plant-surface temperature is elevated via infrared heaters, and soil temperature is elevated via vertical resistance cables (Rich et al., 2015). Soils are heated to a depth of 1.5 m, which is the depth most vulnerable to climate or human disturbance (Pendleton et al., 2012). Aboveground and belowground temperature variation are assessed via thermocouples embedded in acrylic plates at plant canopy level and inserted into the soil, respectively, and the temperature gradient is maintained by integrated microprocessor-based feedback control (Rich et al., 2015). Noyce et al. (2019) provide additional details of the heating system. Warming began on 1 June 2016 and has continued year-round.
2.2 Methane flux measurements
Methane emissions were measured monthly year-round from May 2016 to December 2019 using a static chamber system. One permanent 160 cm2 aluminum base was inserted 10 cm into the soil in each plot in April 2016. On each measurement date, clear chambers (40 cm × 40 cm × 40 cm) were gently placed on top of each base and secured with compression clips. Chambers consisted of an aluminum frame with transparent sides made of polychlorotrifluoroethylene film (Honeywell International) and closed-cell foam on the base. Depending on the height of the vegetation at the time of measurement, chambers were stacked up to four high (total height of 40–160 cm) (Fig. S2). The advantage of this stacking method is that it uses the minimal chamber volume necessary, while also allowing for plant growth. After placement, the chambers were left open for at least 10 min, to minimize disturbance effects and allow air inside the chamber to return to ambient conditions. During data collection, chambers were covered with a transparent polycarbonate top equipped with sampling tubes, a fan to circulate air inside the chambers, a PAR sensor, and thermocouples. The sealed chamber was covered with a foil shroud to block out all light and to minimize changes in temperature and relative humidity during the measurement period. An Ultraportable Greenhouse Gas Analyzer (Los Gatos Research, CA) was used to measure headspace CH4 concentrations for 5 min. Plots were accessed from permanent boardwalks elevated 15 cm above the soil surface to avoid compressing the surrounding peat and altering diffusive CH4 emissions. Fluxes were calculated as the slope of the linear regression of CH4 concentration over time. The 40 fluxes where p > 0.05 were assigned a value of one-half the limit of detection of the system (Wassmann et al., 2018; Table S1). This was 1 % of fluxes during the growing season and 4.5 % of fluxes over the remaining months. For 2017–2019, monthly measurements were scaled to annual estimates by regressing CH4 emissions against daily mean soil temperature and day of year (as a proxy for phenological status). Annual estimates were not calculated for 2016 because flux measurements did not start until May.
2.3 Porewater sampling and analysis
Porewater samples were collected in May, July, and September of each year using stainless-steel “sippers” permanently installed in each plot. Each sipper consisted of a length of stainless-steel tubing, crimped and sealed at the end, with several slits (approximate width 0.8 mm) cut in the bottom 2 cm. The aboveground portion of each sipper was connected to Tygon Masterflex® tubing capped with a two-way stopcock. In May 2016, duplicate clusters of sippers were installed in each of the 30 plots at 20, 40, 80, and 120 cm below the soil surface. An additional set of 10 cm deep sippers was installed in 2017. In this study we defined samples from 10–20 cm as “rooting zone” samples and samples from 40–120 cm as “deep peat” samples. On sampling dates, porewater sitting in the sippers was drawn up and discarded, after which 60 mL of porewater from each depth (30 mL from each sipper) was withdrawn and stored in syringes equipped with three-way stopcocks. A 10 mL aliquot of each sample was filtered through a pre-leached 0.45 µm syringe-mounted filter, preserved with 5 % zinc acetate and sodium hydroxide, and frozen for future SO4 and Cl analysis. Dissolved CH4 was extracted from 15 mL of porewater in the syringe by drawing 15 mL of ambient air and shaking vigorously for 2 min to allow the dissolved CH4 to equilibrate with the headspace. Headspace subsamples were then immediately analyzed on a Shimadzu GC-14A gas chromatograph equipped with a flame ionization detector. A total of 3 mL of porewater was used to measure pH using a Fisher Scientific accumet electrode (13-620-290). The remaining porewater was used to measure H2S and NH4; those data are not reported here.
SO4 and Cl were measured on a Dionex ICS-2000 ion chromatography system (2016–2018) or a Dionex Integrion (2019). On the Dionex ICS-2000 samples were separated using an A11 column with 30 mM of KOH as eluent; on the Dionex Integrion samples were separated using an A11 4 µm fast column with 35 mM KOH. Sulfate depletion (SulfateDep) was calculated based on measured porewater concentrations of SO4 (SO4pw) and Cl (Clpw) and the constant molar ratio of Cl to SO4 in surface seawater (Rsw=19.33; Bianchi, 2006) using the following equation: SulfateDep= Cl − SO4pw. If driven only by seawater inputs, the ratio of Cl to SO4 would remain constant, but under anaerobic conditions SO4 can be reduced by sulfate-reducing bacteria, altering this ratio. As a result, SO4 depletion can be used as a proxy for SO4 reduction rates.
2.4 Plant biomass measurements
Measurements of Schoenoplectus, Spartina, and Distichlis biomass were conducted during peak biomass of each year (29 July–2 August) as described by Noyce et al. (2019). Schoenoplectus biomass was estimated using non-destructive allometric techniques (Lu et al., 2016) in 900 cm2 quadrats, and Spartina and Distichlis biomass were estimated through destructive harvest of 25 cm2 subplots.
2.5 Data analysis
Statistics were conducted in R (version 3.6.3). Methane flux (Fig. S3) and porewater data were log transformed to become normally distributed prior to statistical analyses. The “growing season” was defined as May through September based on Schoenoplectus growth trends (Fig. S4). Pearson's correlations were used to test the relationships between CH4 flux and soil temperature as well as CH4 flux and plant biomass. Responses of CH4 emissions to vegetation type and warming treatment were analyzed using linear mixed models with vegetation community and warming treatment as categorical variables and plot and year as random effects. P values were calculated using Satterthwaite's method, and Tukey's post hoc tests were used to compare individual means. Porewater data were averaged per year and then analyzed using one-way ANOVAs to determine the effects of warming treatment or plant community, applying Tukey's HSD test for post hoc analyses.
3.1 Environmental conditions, site characteristics, and experiment performance
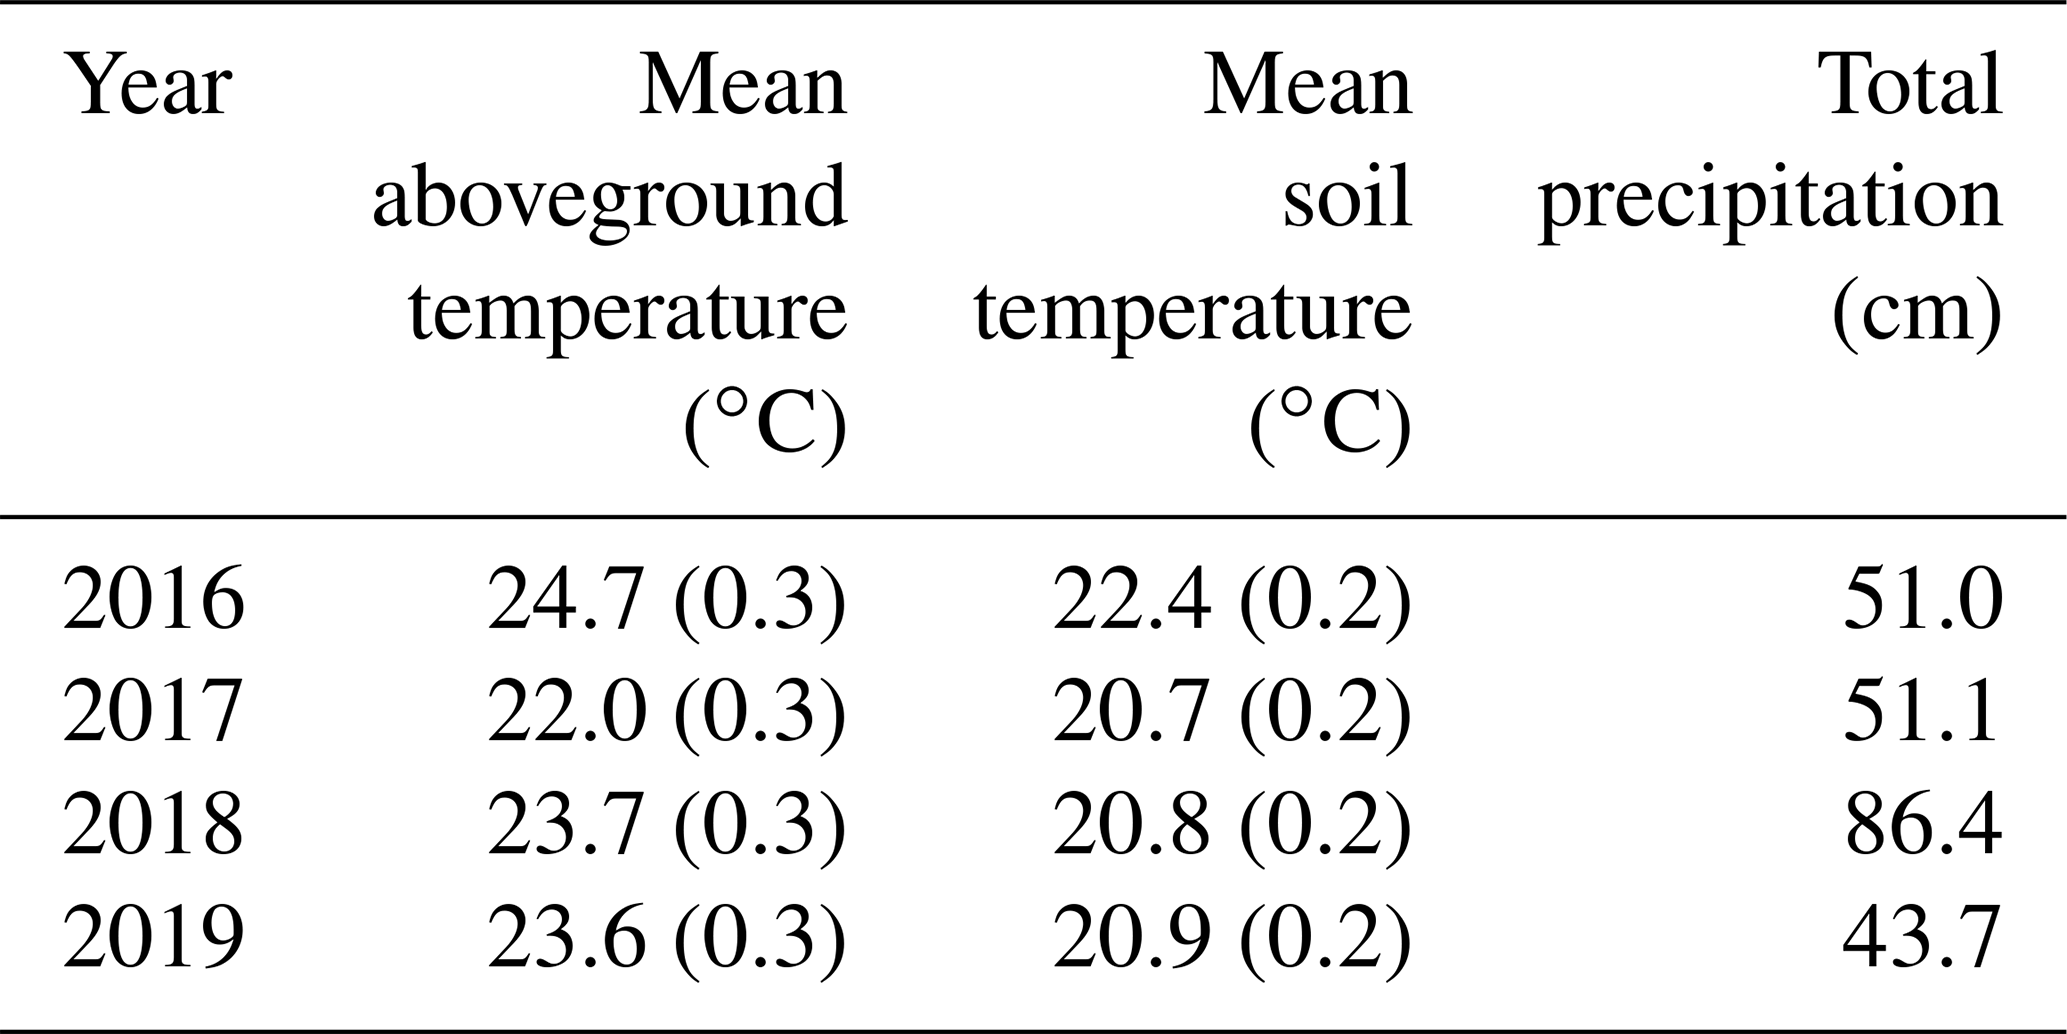
The growing season of 2016 was the hottest of the 4 years, with growing season temperatures averaging > 1 ∘C above the other 3 years (Table 2). While 2017 through 2019 had similar summer temperatures, they had very different precipitation regimes: 2018 was much wetter on average and 2019 was slightly drier (Table 2). During all years, temperatures in the experimental plots were successfully shifted by the target differentials of +1.7, +3.4, and +5.1 ∘C above the ambient plots (Fig. 1 (top); Noyce et al., 2019). Porewater pH ranged from 6.4 to 6.8 across the measurement period, with no effect of temperature treatment (p > 0.1; data not shown). There was no difference in soil bulk density between the ambient and +5.1 ∘C plots after 4.5 years of warming (p=0.54; data not shown).
Table 2Growing season (May–September) temperature and precipitation. Temperature data are means (SE) of daily averages from ambient plots, and precipitation is the total from May through September.
3.2 Methane fluxes
Methane emissions increased with soil temperature (R2= 0.41, p<0.001) (Fig. 1). Emissions from all treatments had strong seasonal trends; fluxes were highest in the C3 community in June through August and peak fluxes in the C4 community were shifted about a month later to July through September (Fig. S3). Whole-ecosystem warming increased CH4 emissions throughout the growing season ( 5.1, p= 0.002; Fig. 2). Across all 4 years, 5.1 ∘C of warming more than doubled growing season emissions, from 624 to 1413 µmol CH4 m−2 d (padj= 0.02; Fig. 2).
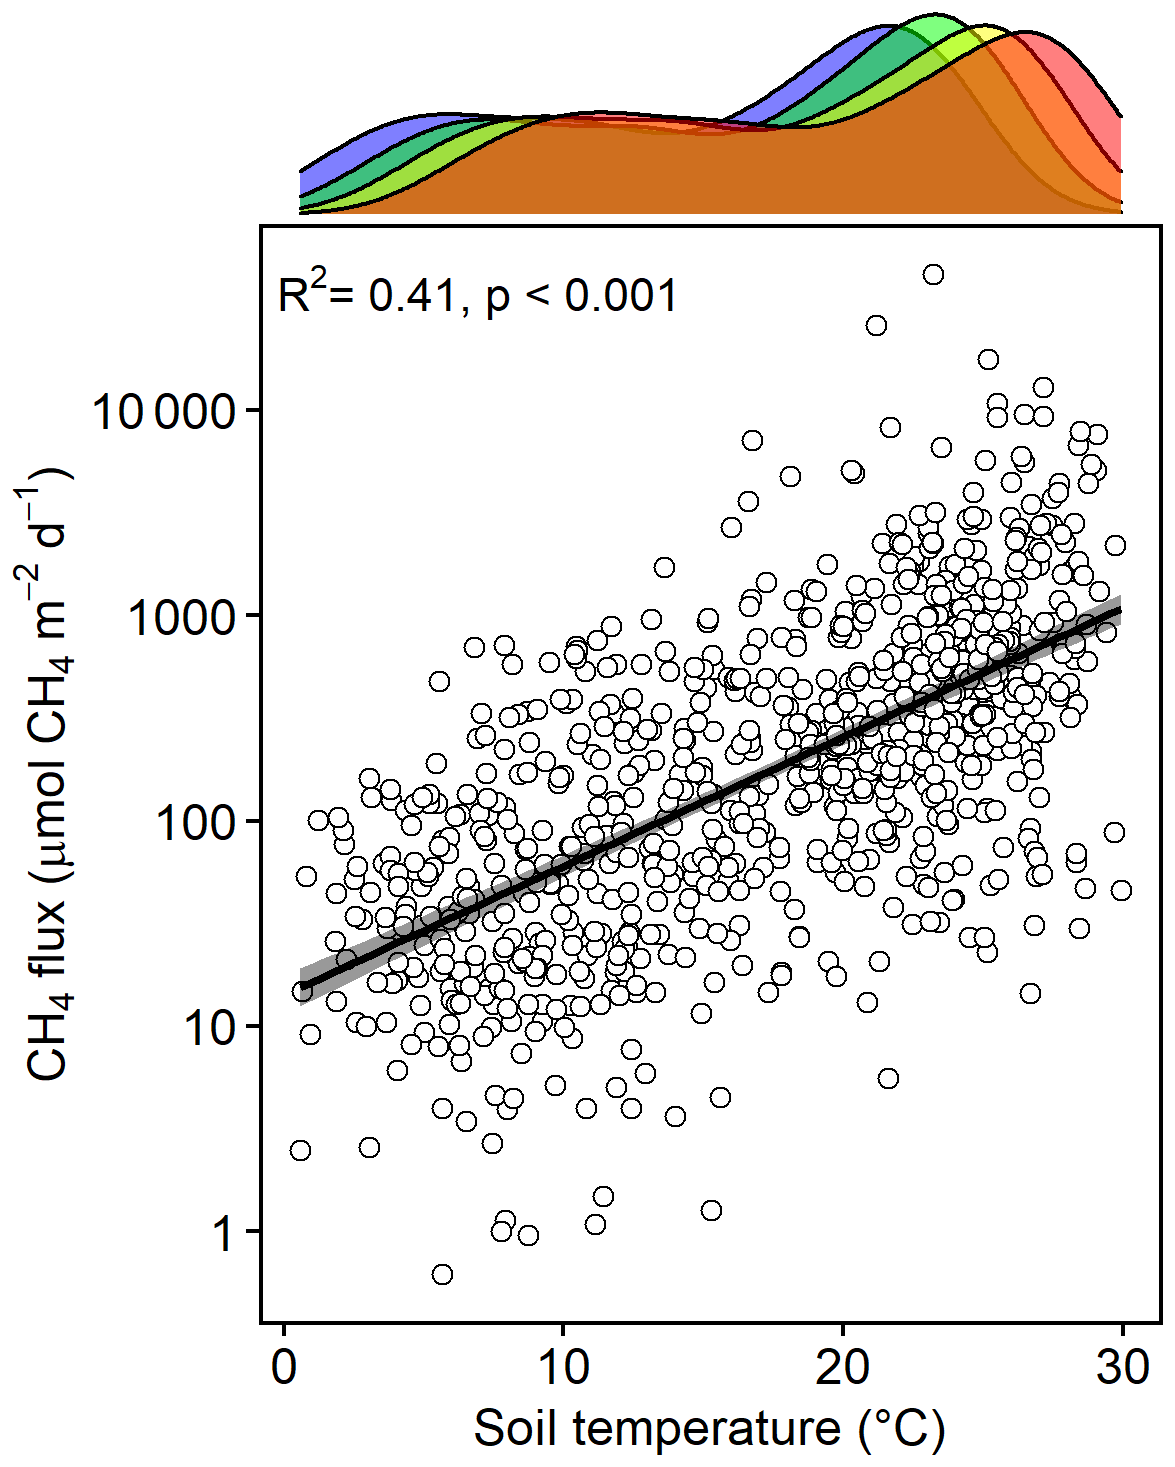
Figure 1Bottom: CH4 emissions from each plot versus the soil temperature at the time of measurement. Top: density plot depicting the range of soil temperatures in each treatment, delineated by color: ambient (blue), +1.7 (green), +3.4 (yellow), and +5.1 ∘C (red).
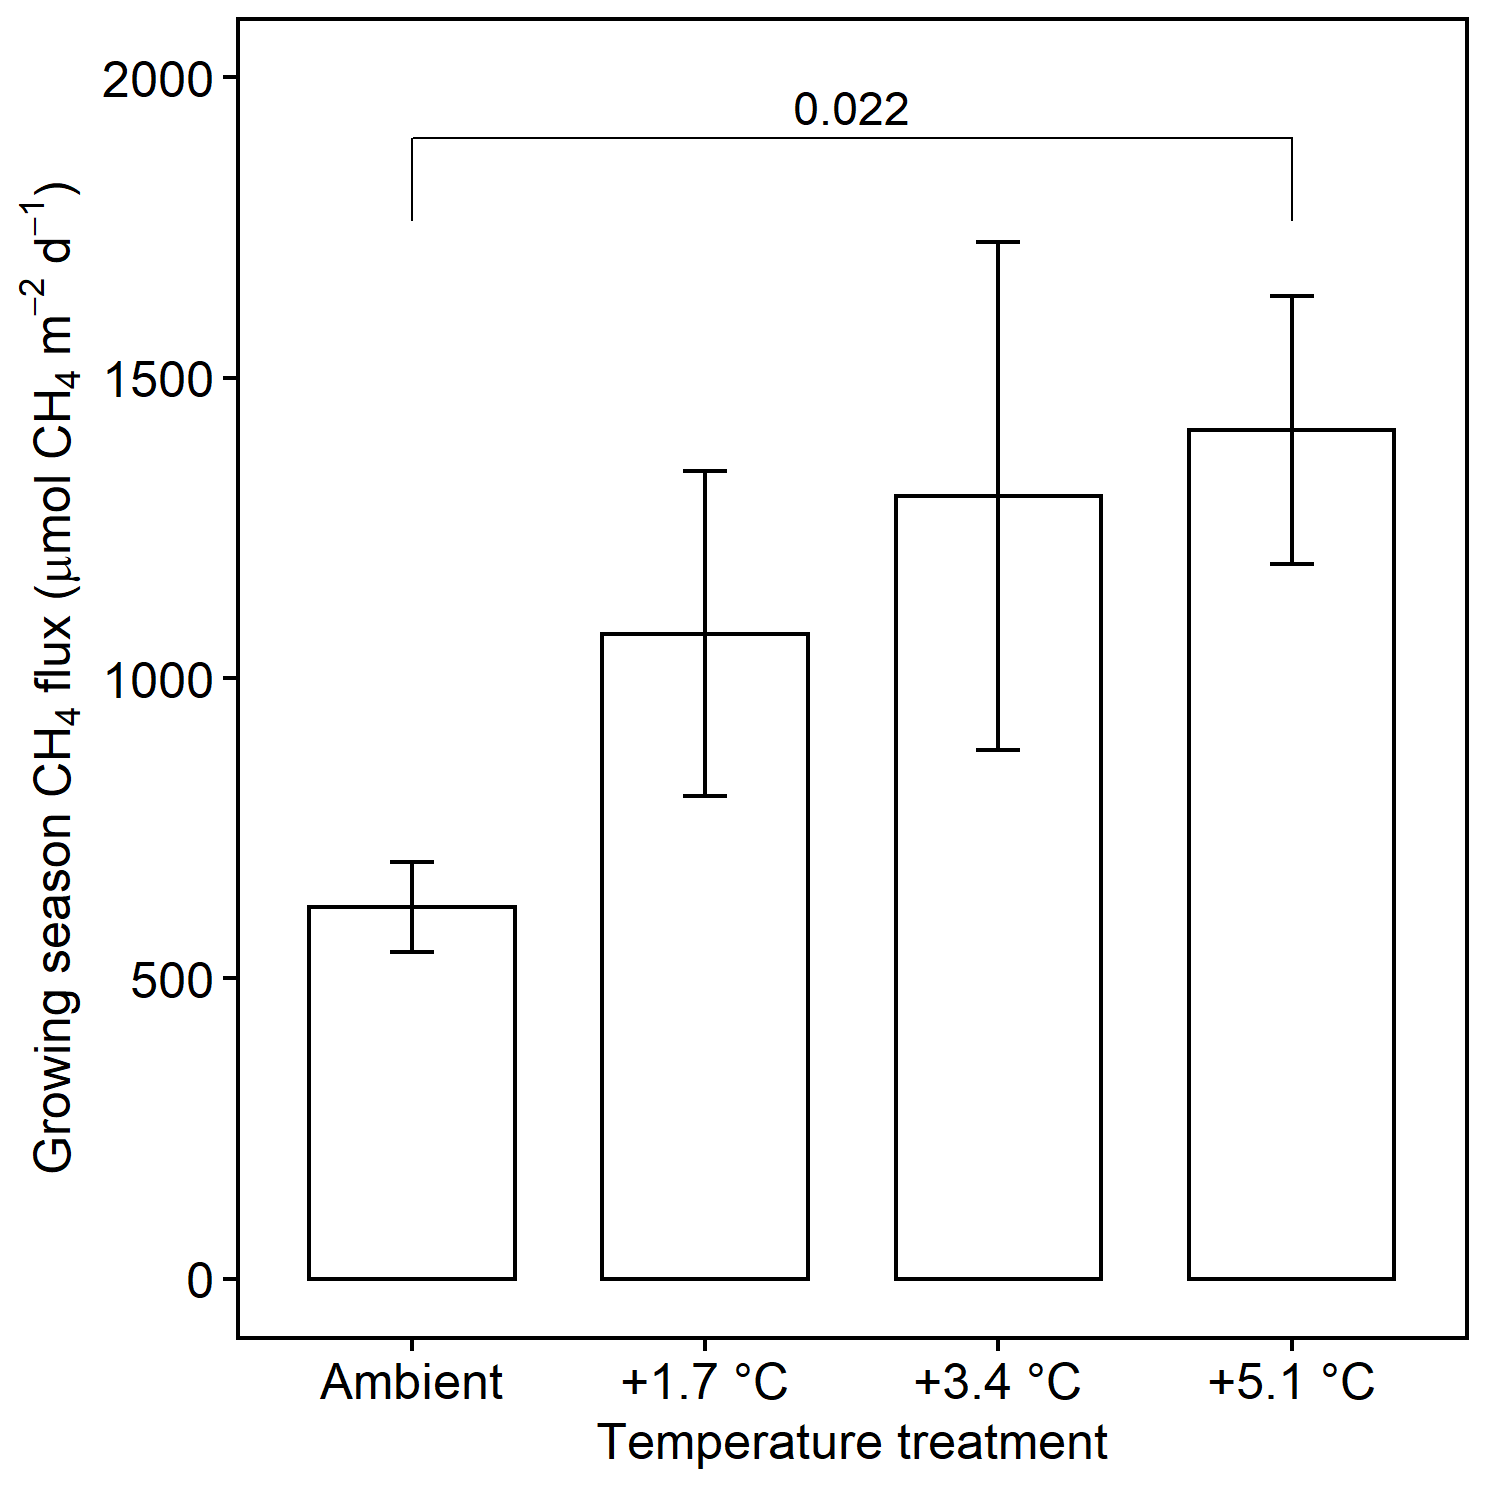
Figure 2Comparison of CH4 emissions from each warming treatment during the growing season (May–September). Means include both the C3 and C4 community and all years of measurement. Error bars indicate SE. Horizonal bars indicate means that are significantly different and the corresponding padj.
Mean CH4 emissions were higher from the C4 community than from the C3 community both during the growing season ( 13.6, p= 0.001; Fig. 3a) and on an annual basis ( 8.5, p= 0.008; Fig. 3b). Mean annual CH4 emissions ranged from 58 mmol CH4 (ambient) to 343 mmol CH4 m−2 yr−1 (+5.1 ∘C) in the C3 community and from 55 mmol CH4 (ambient) to 879 mmol CH4 m−2 yr−1 (+5.1 ∘C) in the C4 community (Table S2). Under ambient conditions, growing season CH4 fluxes were almost twice as large from C4 plots, whereas under low warming (1.7 to 3.4 ∘C) this difference increased to more than 3 times as large (Fig. 3a). From 2017–2019, CH4 emissions were positively related to Spartina and Distichlis aboveground biomass across all warming treatments and negatively related to Schoenoplectus biomass (Fig. 4a, b). In 2016, however, the direction of those relationships in both plant communities were the exact opposite, with Spartina and Distichlis biomass negatively related, and Schoenoplectus biomass positively related, to CH4 emissions (Fig. 4a, b).
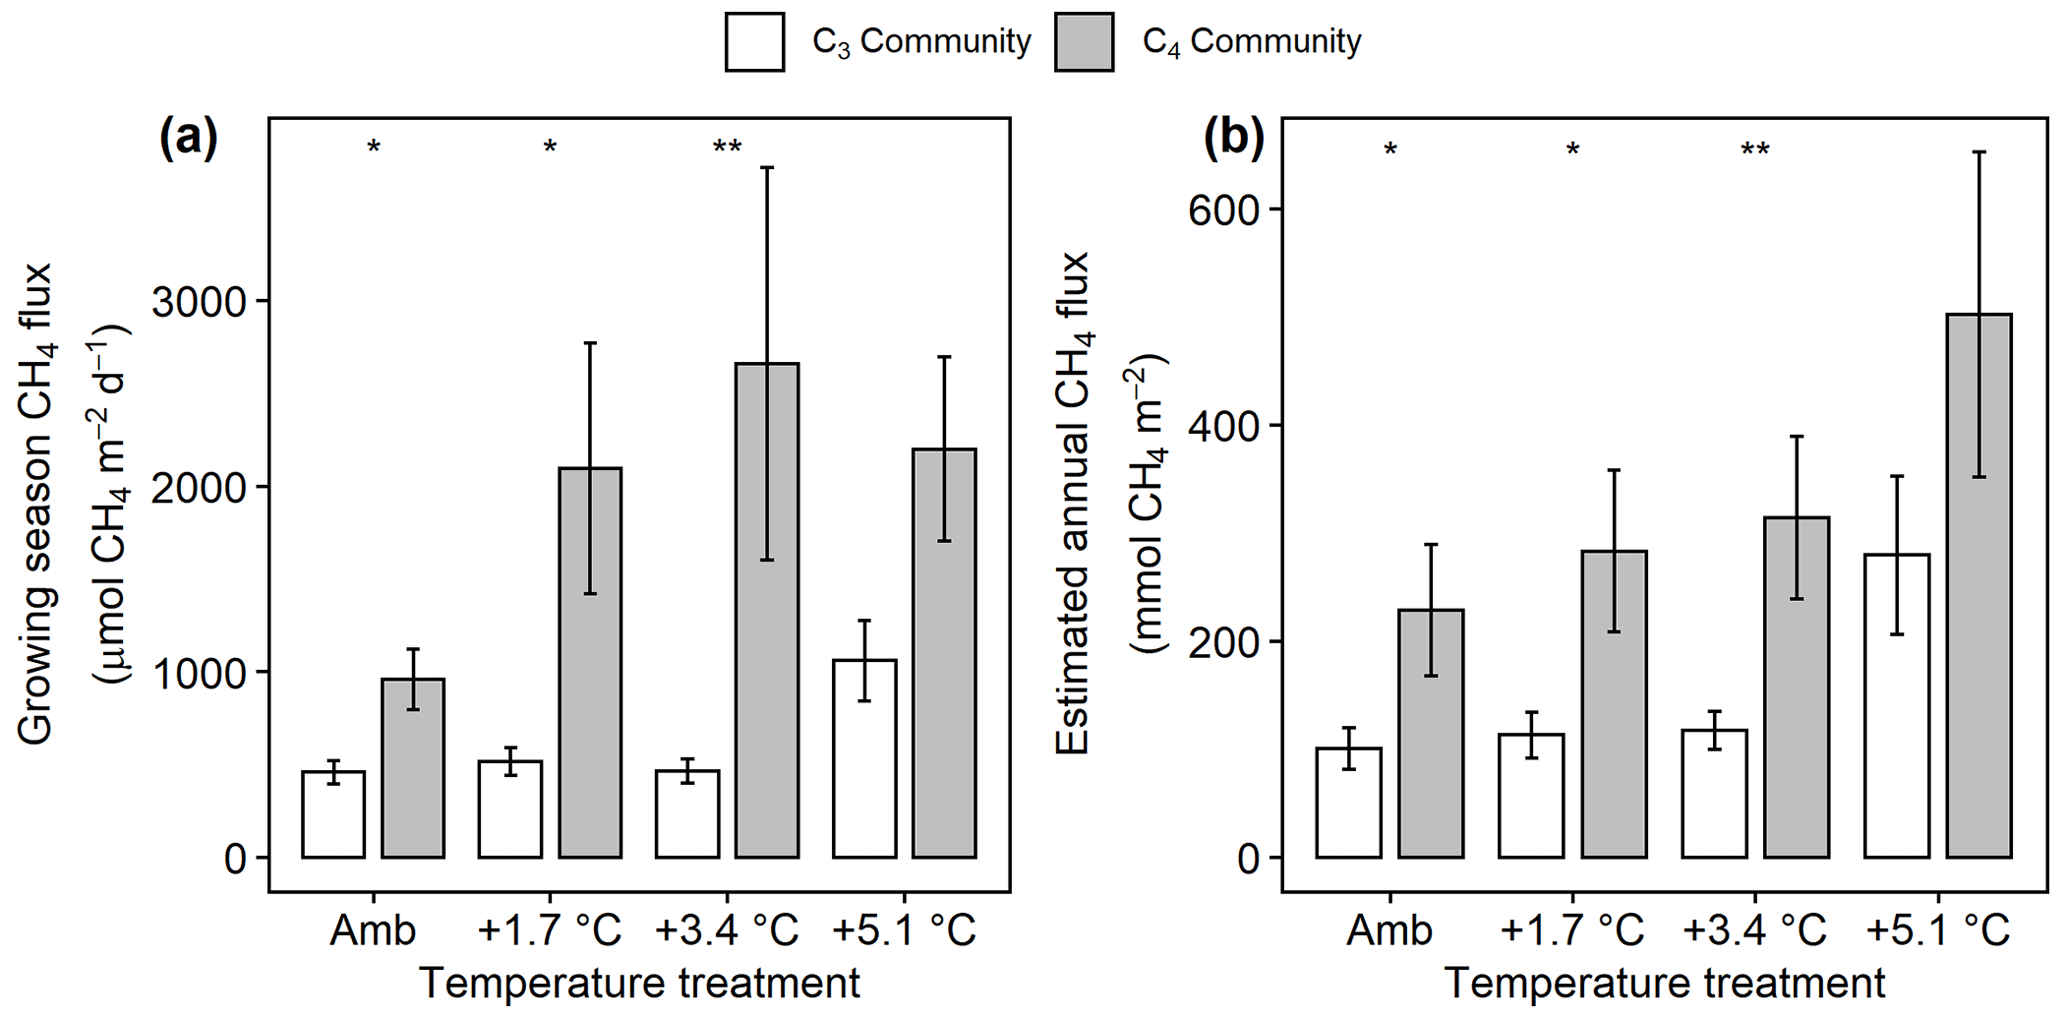
Figure 3Comparison of CH4 emissions from the C3 community dominated by Schoenoplectus (open bars) and the C4 community dominated by Spartina and Distichlis (grey bars). (a) During the growing season (May–September) and (b) scaled to a year. Means are averaged across all sampling dates for 2017–2019. Error bars indicate SE. Asterisks indicate significant differences between C3 and C4 means at a given temperature (* padj<0.05, padj<0.01).
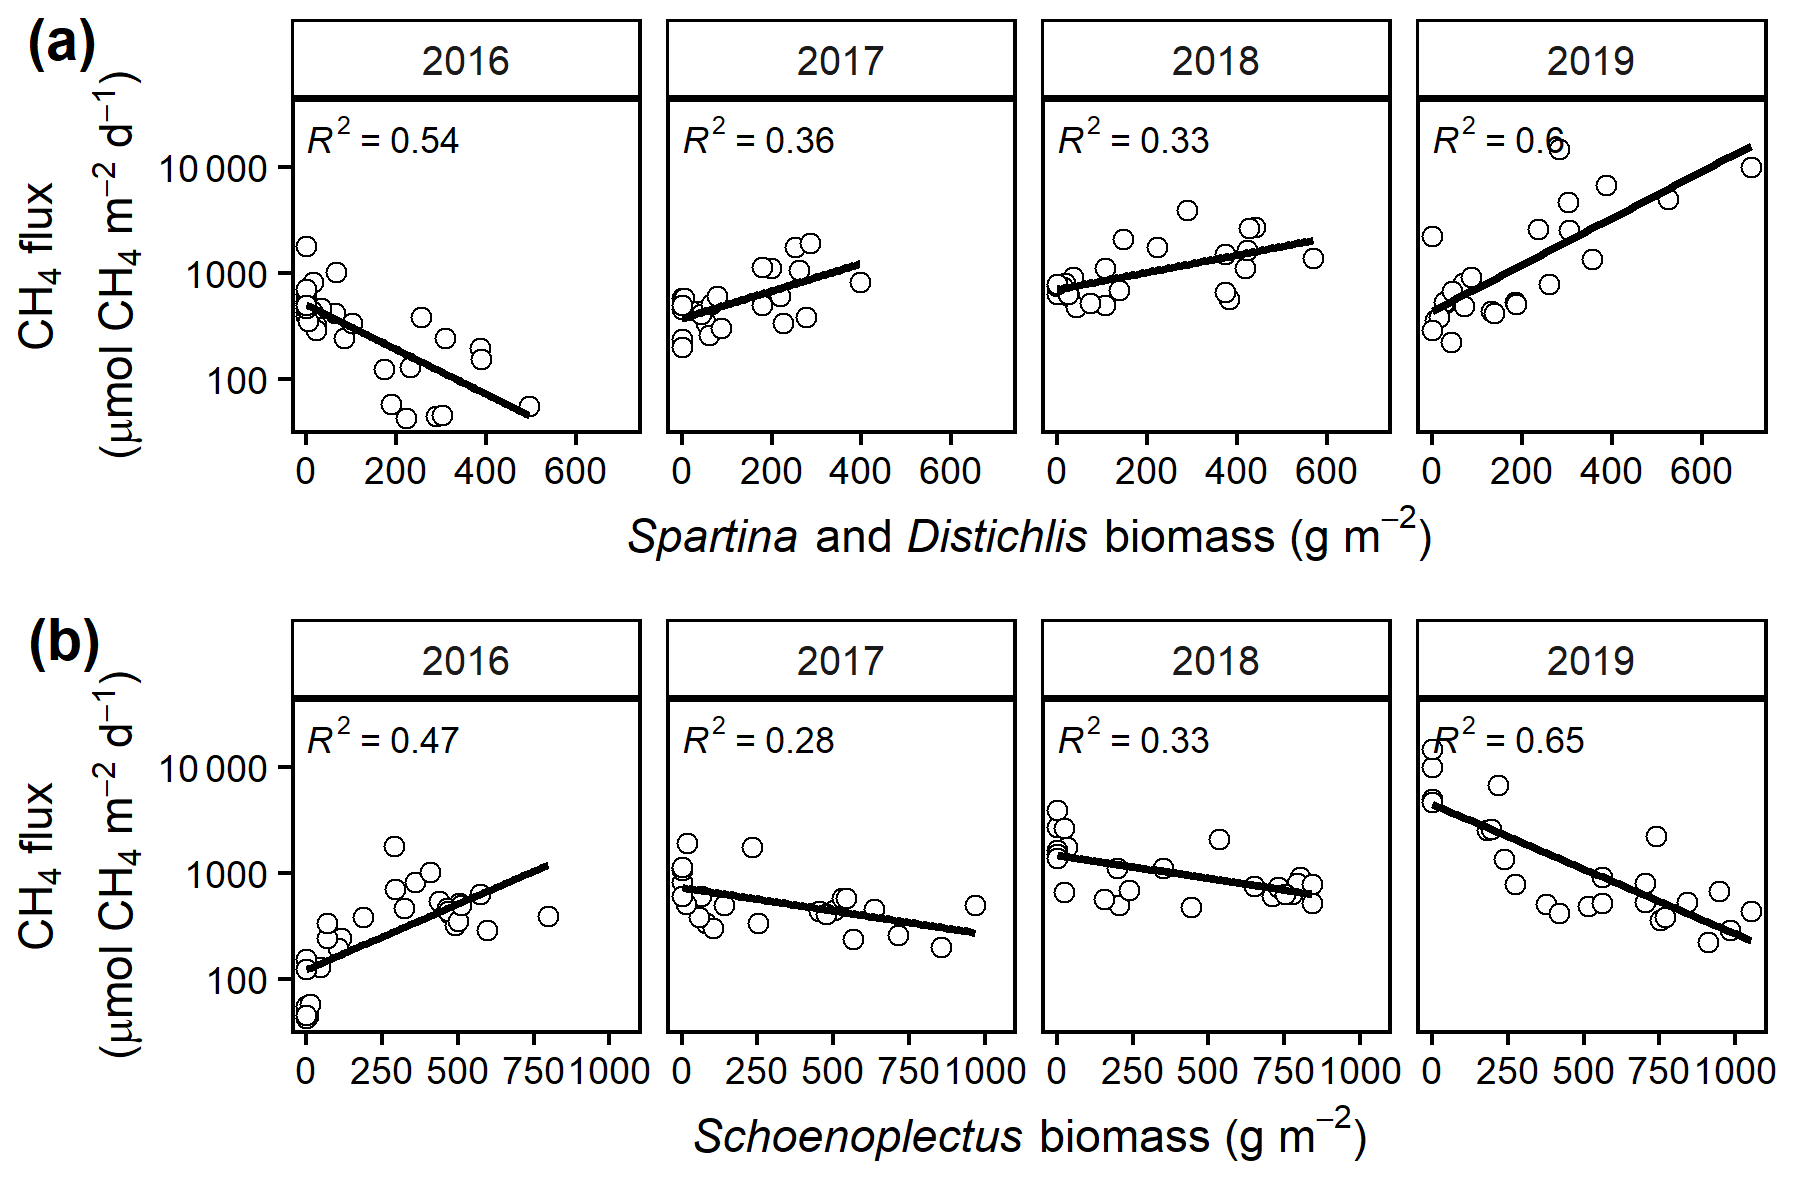
Figure 4Mean growing season (May–September) CH4 emissions from each plot versus the biomass of (a) C3 (Schoenoplectus) and (b) C4 (Spartina and Distichlis) plants. All regressions are significant at p= 0.05.
3.3 Porewater chemistry
Under ambient conditions, porewater collected from the C4 community had more dissolved CH4 ( 18.4, p<0.001; Fig. 5a, b), less SO4 ( 29.1, p<0.001; Fig. 6a), and similar salinity (p= 0.068) compared to the C3 community. In the C3 community, warming increased dissolved CH4 in both the rooting zone porewater (10–20 cm) ( 2.85, p= 0.048; Fig. 5a) and in the deep peat (40–120 cm) ( 6.23, p= 0.001; Fig. 5b). Dissolved CH4 concentrations were relatively similar in the ambient, +1.7, and +3.4 ∘C treatments but more than doubled with +5.1 ∘C of warming in both the rooting zone (59 to 125 µmol CH4 L−1, padj<0.001) and the deeper porewater (43 to 1254 µmol CH4 L−1, padj<0.001). In the C4 community there was minimal effect of warming treatment on porewater in the rooting zone ( 0.442, p= 0.72; Fig. 5a), but all levels of warming decreased dissolved CH4 below 40 cm ( 129.3, p<0.001), with concentrations in the +3.4 and +5.1 plots less than a third of the concentrations in the ambient plots (155 vs. 56 and 40 µmol CH4 L−1, padj<0.001; Fig. 5b).
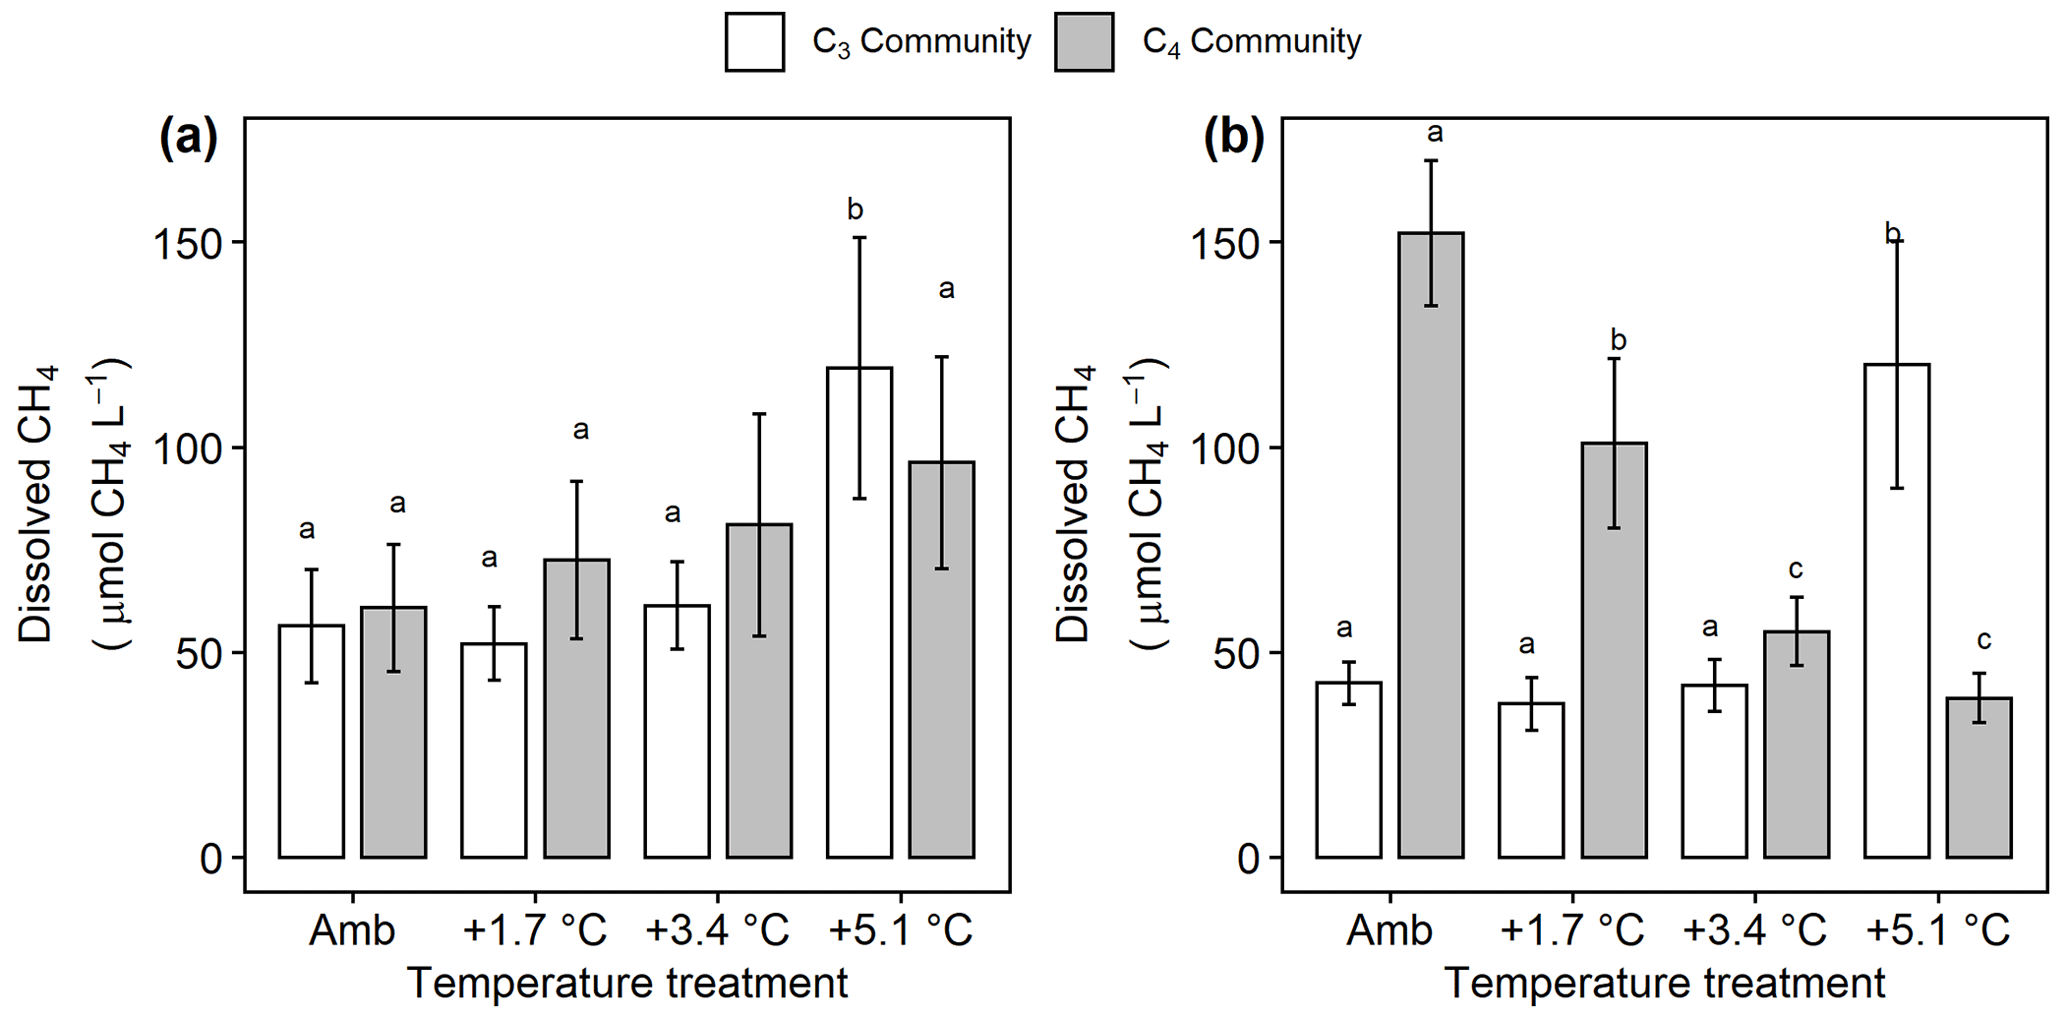
Figure 5Comparison of dissolved CH4 from the C3 community dominated by Schoenoplectus (open bars) and the C4 community dominated by Spartina and Distichlis (grey bars). (a) In the dominant rooting zone (10–20 cm) and (b) below the rooting zone (40–120 cm). Means are averaged across all sampling dates for 2016–2019. Error bars indicate SE. Letters indicate temperature treatments that are significantly different from each other (padj<0.05) within the same plant community.
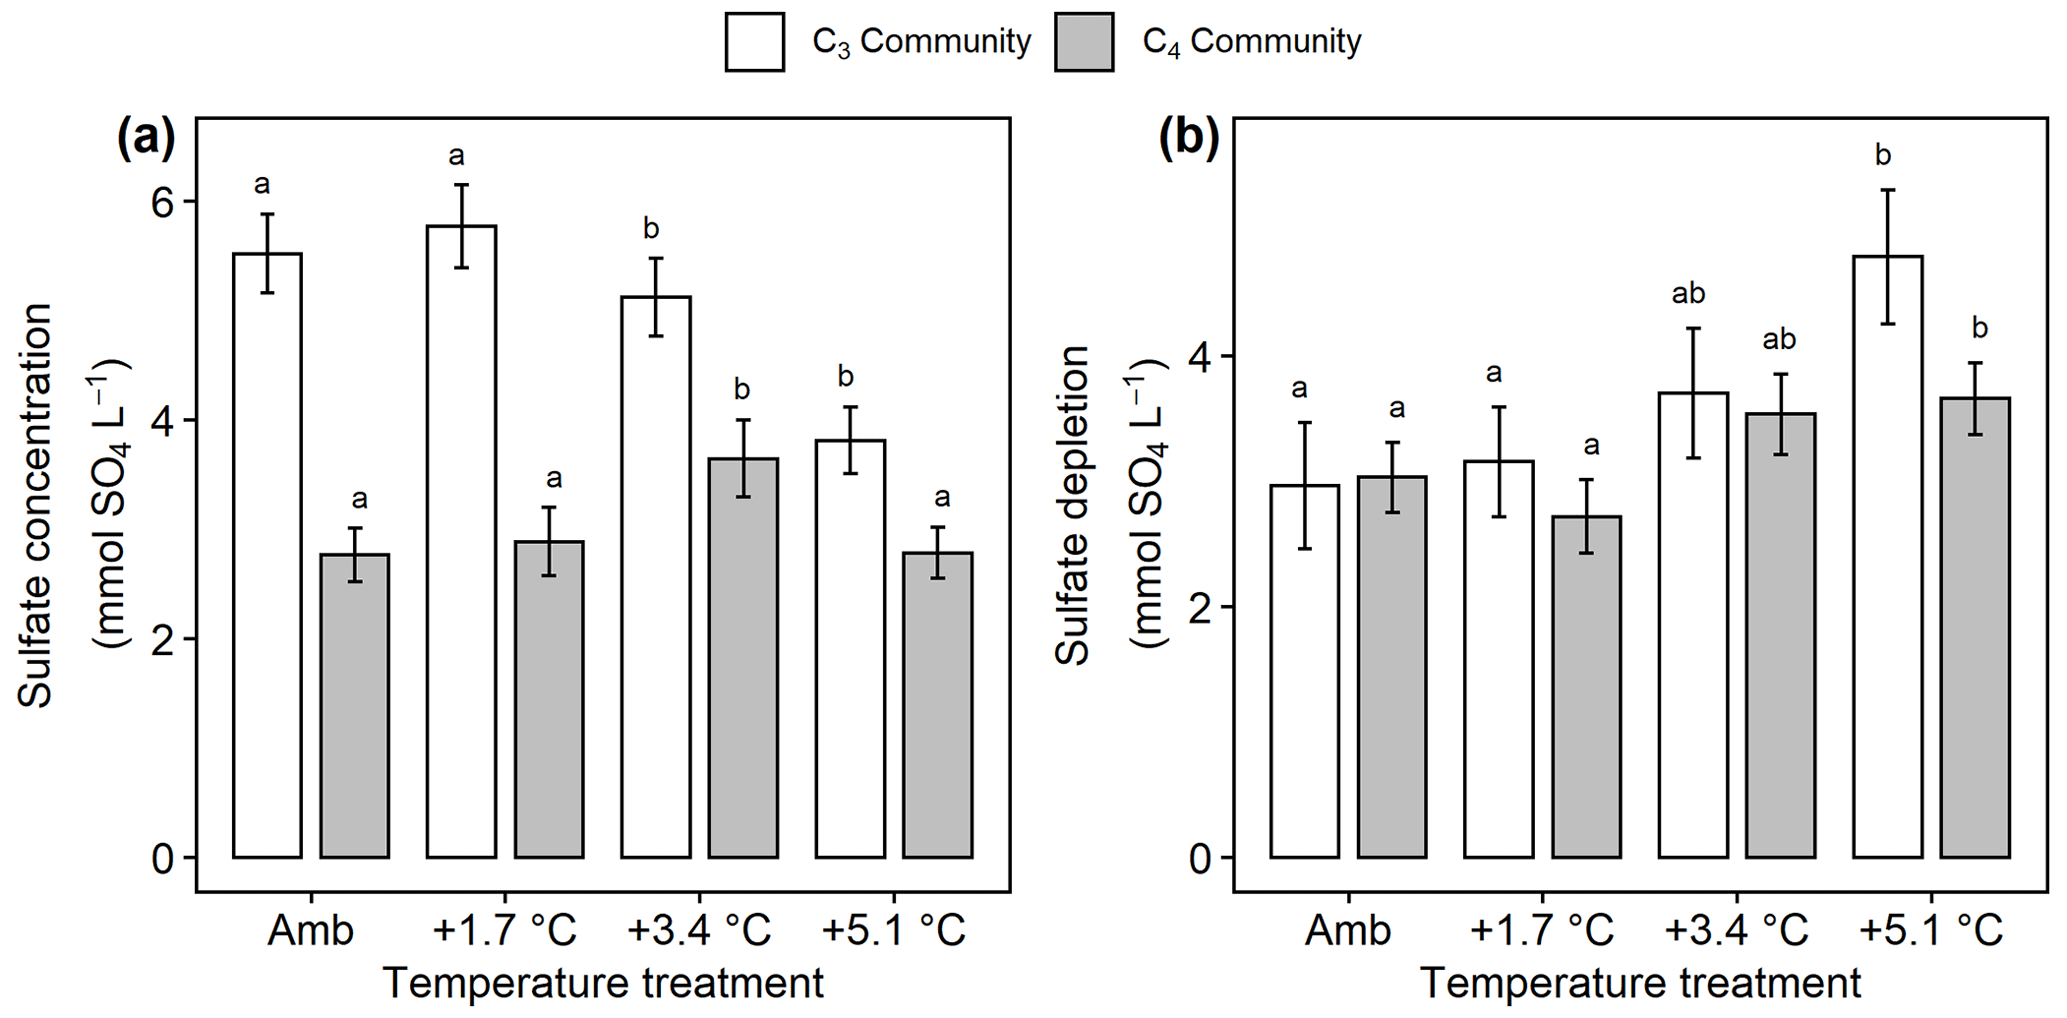
Figure 6Comparison of sulfate concentrations and estimated sulfate depletion from the C3 community dominated by Schoenoplectus (open bars) and the C4 community dominated by Spartina and Distichlis (grey bars). (a) Sulfate availability throughout the entire soil profile and (b) sulfate depletion in the rooting zone. Means are averaged across all sampling dates for 2016–2019. Error bars indicate SE. Letters indicate temperature treatments that are significantly different from each other (padj<0.05) within the same plant community.
In the C3 community, SO4 concentrations decreased with warming ( 3.76, p= 0.017), but warming effects on SO4 cycling in the C4 community were more mixed with +3.4 ∘C increasing SO4 (padj= 0.048) but no other treatments having large effects (Fig. 6a). In all plots, the measured concentrations of rooting-zone SO4 were lower than expected based on salinity (Fig. 6b), indicating that SO4 reduction occurred. In both plant communities, the +5.1 ∘C treatments increased this SO4-depletion effect compared to ambient, though the effect was stronger in the C3 community (p<0.001) than the C4 community (p= 0.04) (Fig. 6b). Dissolved CH4 was highest in both plant communities when SO4 concentrations were <5 mmol SO4 L−1 (Fig. S5).
Soil temperature (both seasonal and experimental) and plant traits were both strong drivers of CH4 emissions from this site. This follows prior field, mesocosm, and incubation studies across a variety of wetlands, in which temperature has been shown to be a strong predictor of CH4 emissions (e.g., Al-Haj and Fulweiler, 2020; van Bodegom and Stams, 1999; Christensen et al., 2003; Dise et al., 1993; Fey and Conrad, 2000; Liu et al., 2019; Ward et al., 2013; Yang et al., 2019; Yvon-Durocher et al., 2014) and in which plant functional type has an interacting effect (e.g., Chen et al., 2017; Duval and Radu, 2018; Liu et al., 2019; Mueller et al., 2020; Ward et al., 2013). Methane emissions are a function of the balance between methanogenesis, CH4 oxidation, and CH4 transport, so explaining these results requires some combination of stimulation of methanogenesis, reduction of CH4 oxidation, or increase in CH4 transport.
Prior data from brackish wetlands are limited, but incubation studies of freshwater wetland soils typically show large increases in CH4 fluxes with warming (van Bodegom and Stams, 1999; Duval and Radu, 2018; Hopple et al., 2020; Inglett et al., 2012; Sihi et al., 2017; Wilson et al., 2016), indicating that warming alters belowground processes. Though there is some evidence that rhizosphere temperature alters CH4 transport through rice aerenchyma (Hosono and Nouchi, 1997), any transport-driven effects in this ecosystem would be transient unless there were a simultaneous increase in net CH4 production (i.e., an increase in methanogenesis that was not completely offset by methanotrophy). Instead, we observed a sustained increase in CH4 emissions, suggesting large shifts in anaerobic metabolism, especially with +5.1 ∘C of warming. We propose four potential and non-exclusive mechanisms to explain the temperature-driven increase in CH4 emissions: (1) shifted ratios of CH4 production to oxidation, (2) increased substrate availability, (3) reduced competition with sulfate reducers for H2 and organic C, and (4) indirect plant trait effects (Fig. 7).
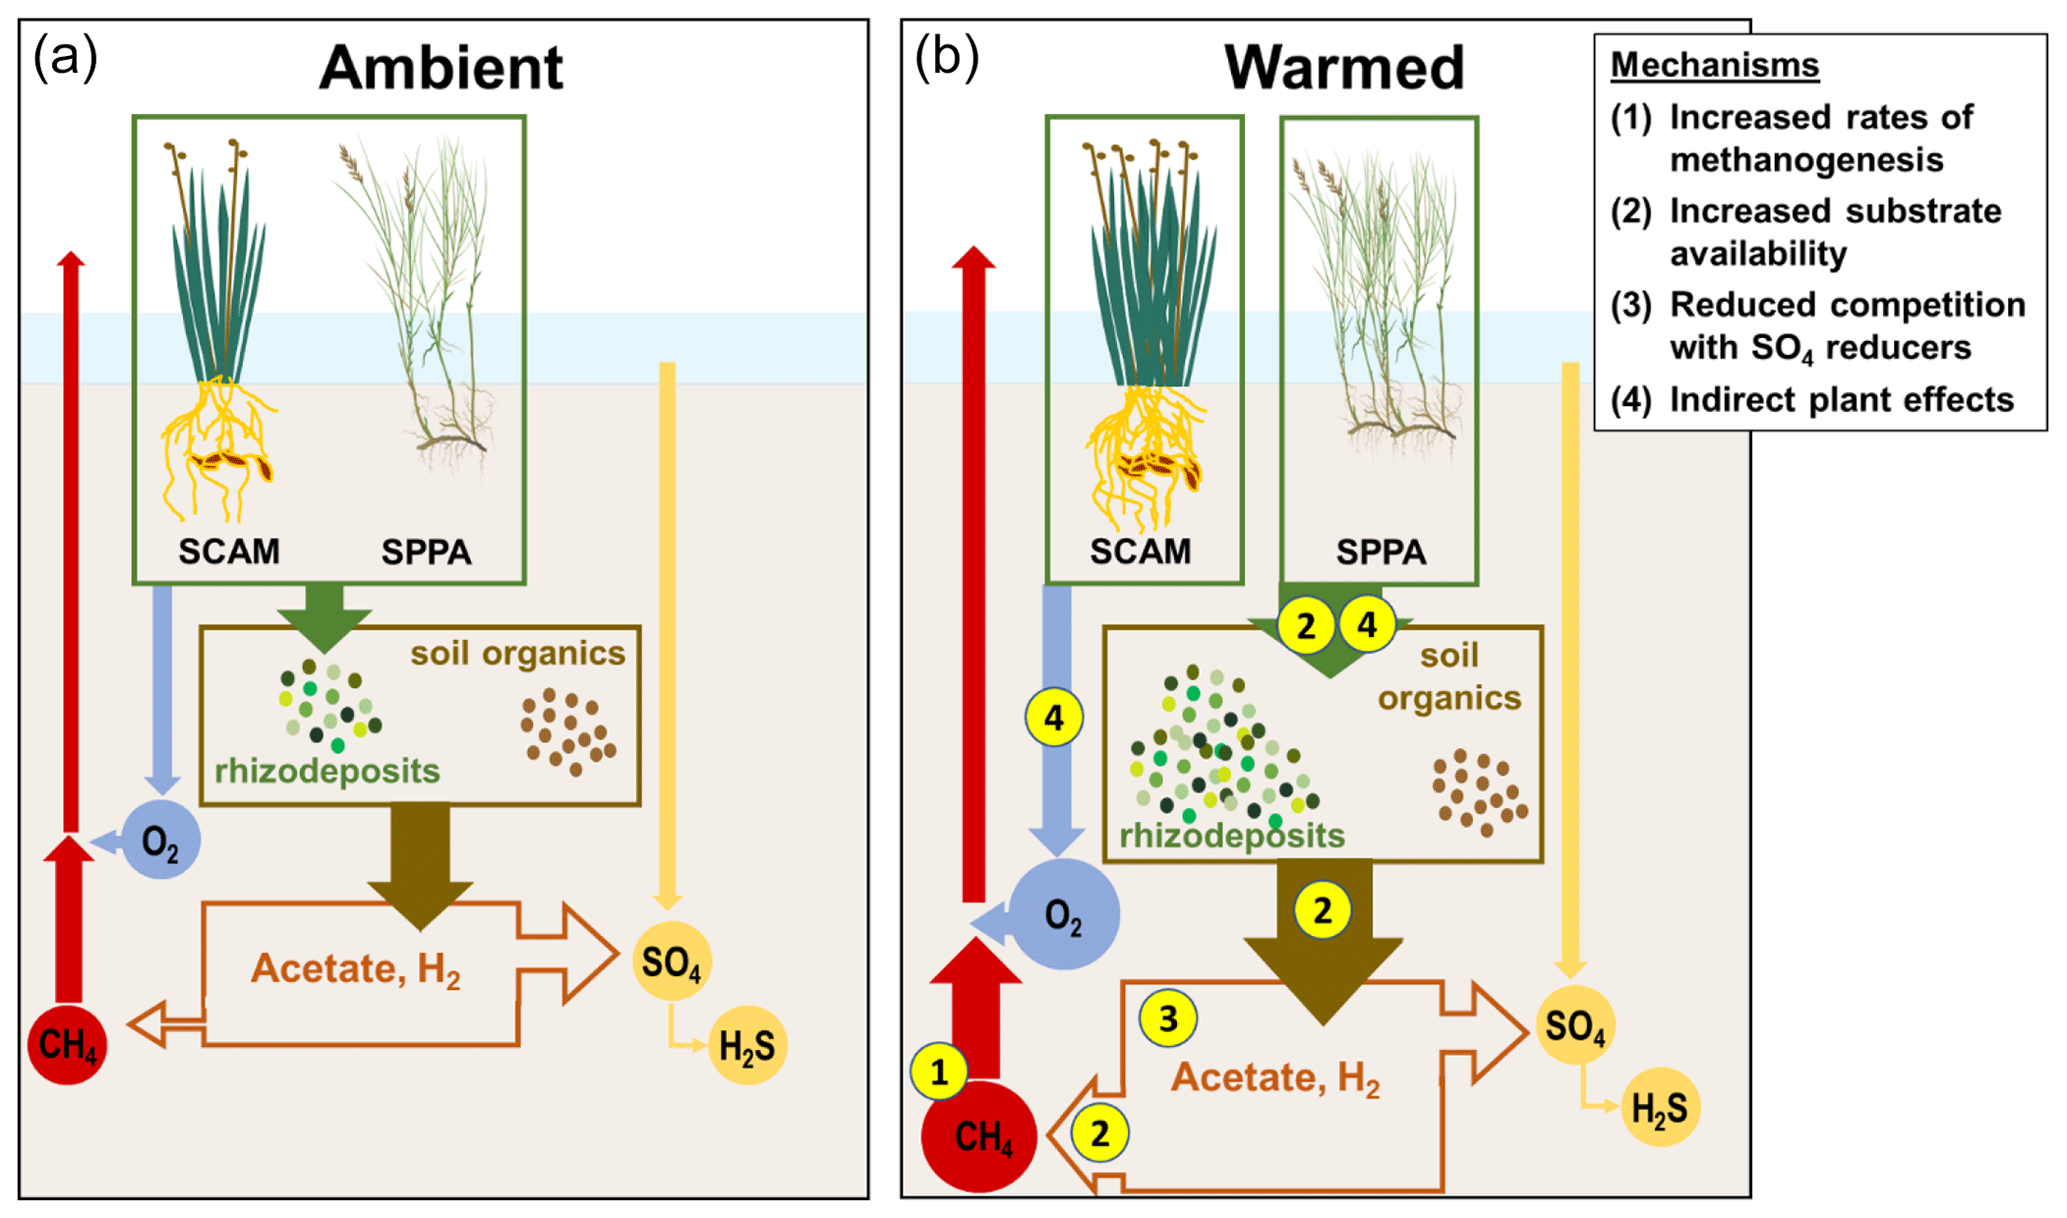
Figure 7Schematic of mechanisms driving enhanced CH4 emissions in response to warming. SCAM: Schoenoplectus americanus. SPPA: Spartina patens. (a) Processes under ambient conditions. Plants add organic compounds to the soil, which are transformed into other low-molecular-weight organic compounds. This pool, and processed soil organic matter, support terminal respiration processes dominated by SO4 reduction over CH4 production in organic-rich brackish marsh soils. Plants also transport O2, which supports oxidation of a fraction of the CH4 before it can be transported out of the soil. (b) Processes under warmed conditions. (1) Rates of CH4 production increase more than rates of CH4 oxidation. (2) Substrate availability increases as plants add more rhizodeposits and organic matter is more rapidly fermented to low-molecular-weight organic compounds and H2. (3) The pool of electron donors available to methanogens increases as SO4 reducers become SO4 limited. (4) The dominant plant species have different effects on these processes, with S. americanus driving a net increase in O2 transport and S. patens driving a net increase in rhizodeposits.
4.1 Whole-ecosystem warming promotes methanogenesis over CH4 oxidation
Holding the supply of substrates and transport properties of the system constant, warming is expected to increase rates of CH4 production relative to CH4 oxidation due solely to differences in the temperature dependence of each process (Megonigal et al., 2016). In wetland soils, the average Q10 of methanogenesis is 4.1 compared to 1.9 for aerobic CH4 oxidation (Segers, 1998), which means that a system starting with a given initial ratio between the two processes will become increasingly dominated by methanogenesis as soils warm. A corollary to this expected pattern is that the ratio of the two processes should be constant if the Q10 responses are similar, an outcome that was supported with in situ measurements of the two processes in a tidal freshwater forested wetland (Megonigal and Schlesinger, 2002). We did not quantify the temperature dependence of CH4 production and oxidation in the present study, but based on the literature (Segers, 1998) it is likely that methanogenic activity increased more than aerobic methanotrophic activity in direct response to warming (Fig. 7, mechanism 1). Evidence for this is that rhizosphere pools of porewater CH4 were highest in the warmest treatment (Fig. 5a); because this occurred despite either no change or an increase in aboveground biomass (Noyce et al., 2019), which would by itself have lowered porewater CH4 due to venting (plant transport), it indicates that CH4 production increased relative to the sum of aerobic and anaerobic methane oxidation.
4.2 Whole-ecosystem warming increases substrate availability for methanogens
Methanogenesis can be the terminal step of anaerobic decomposition, but a consortium of microbes is required to break down soil organic matter to electron donor substrates that methanogens can metabolize. The final step in any decomposition pathway involves the flow of electrons from organic matter (electron donors) to a TEA. Under anaerobic conditions, this is accomplished by microbes that tend to specialize in one TEA and compete for organic C as an electron donor (Megonigal et al., 2004). Consequently, the supply of both electron donors and TEAs regulates the multi-step process of anaerobic decomposition and thus ultimately controls CH4 emissions. For all pathways, methanogenic activity is typically limited by the supply of electron donors, including low-molecular-weight organic compounds (e.g., acetate; Neubauer and Craft, 2009) and H2, a product of organic matter fermentation. We propose that whole-ecosystem warming increases the availability of previously limited C substrates in two aspects (Fig. 7, mechanism 2).
First, warming may directly influence C availability through biochemical kinetics. Even if organic inputs remained constant, warming likely accelerates fermentation of soil organic matter, increasing substrate availability for methanogens. Second, the warmed plots had longer growing seasons than the unheated controls (Noyce et al., 2019). This presumably increased inputs of root exudates and fresh detritus, accelerating all forms of heterotrophic microbial respiration by providing organic material that is decomposed into low-molecular-weight organic C compounds and H2 (Philippot et al., 2009), stimulating growing season CH4 emissions from warmed plots. In 2017, we observed that gross primary production was positively correlated with CH4 emissions and that this effect increased with warming (Fig. S6). Prior studies have also linked CH4 production or emissions to rates of photosynthesis (Vann and Megonigal, 2003), periods of active growth (Chen et al., 2017; Ward et al., 2013), and plant senescence, which coincides with a pulse input of labile C from plants to soils (Bardgett et al., 2005).
Temperature-accelerated biochemical kinetics and increased electron donor supply are mechanisms that can increase methanogenesis without necessarily shifting methanogenic pathways. However, shifts in the balance between hydrogenotrophic, acetoclastic, and methylotrophic methanogenesis pathways can be expected with warming. For example, in Arctic permafrost, methylotrophic methanogenesis was found to be more sensitive to warming than the other pathways (de Jong et al., 2018). Such shifts can be quantified with future analyses of H2 and low-molecular-weight organic compounds (e.g., Bridgham et al., 2013; Yang et al., 2016), isotopic tracing of specific methanogenic pathways (e.g., Blaser and Conrad, 2016; Conrad, 2005; Neumann et al., 2016; Whiticar, 1999), and molecular community analyses (e.g., Bridgham et al., 2013; He et al., 2015; Wilson et al., 2016).
4.3 Whole-ecosystem warming reduces competition with sulfate reducers
While low-molecular-weight organic compounds are electron donors for acetoclastic methanogenic respiration, they are also substrates for other microbial groups such as SO4 reducers (Megonigal et al., 2004; Ye et al., 2014). As a result, consumption of the limited organic carbon supply by SO4 reducers should (and often does) limit methanogenic activity, such that terminal microbial respiration is typically dominated by SO4 reduction in brackish marshes (Sutton-Grier et al., 2011). Similarly, SO4 reducers are more efficient than methanogens at competing for the H2 required for CO2 reduction (Kristjansson et al., 1982). We did not measure rates of SO4 reduction in this study but can use SO4 depletion as a proxy; more SO4 depletion indicates that more SO4 reduction has occurred. Warming generally increased SO4 depletion, especially in the plots dominated by Schoenoplectus (Fig. 6b). Differences in SO4 depletion between plots are not driven by SO4 inputs because the only supply of SO4 is the tidal flow, which is the same for all plots in each community of the experiment. Instead, higher rates of SO4 reduction are most likely driven by some combination of electron donor supply and kinetics. While SO4 reducers likely benefited from the increased availability of electron donors, as described above, the kinetics of SO4 reduction also respond strongly to temperature (Weston and Joye, 2005).
When SO4 concentrations drop below a threshold concentration, SO4 reduction becomes SO4-limited, rather than electron-donor-limited (Megonigal et al., 2004). A review of the coastal wetland CH4 literature estimated this threshold at 4 mmol SO4 (Poffenbarger et al., 2011), a value that is consistent with patterns of porewater CH4 and SO4 at the GCReW site (Keller et al. 2009). As SO4 and O2 are the dominant electron-accepting compounds that suppress methanogenesis in this organic soil, this drawdown then releases the methanogens from substrate competition (Fig. 7, mechanism 3). Here, we show that SO4 is typically below 4 mmol in the +5.1 plots in the C3 community and in all plots in the C4 community (Figs. 6, S5). The drawdown of SO4 may also reduce rates of anaerobic CH4 oxidation (Hinrichs and Boetius, 2003). Van Hulzen et al. (1999) proposed a multi-phase system in a warming incubation experiment, observing that first methanogens are outcompeted for substrates by other microbes, next CH4 production increases as the supply of inhibiting TEA decreases, and finally TEA availability is reduced to the point that methanogenesis is controlled only by the supply of electron donors. Warming in this study decreased the time required for the system to pass through the first two phases (van Hulzen et al., 1999). In our experiment, this final phase of increased methanogenic activity occurs when SO4 concentrations dip below 4 mmol SO4 L−1, which occurs most often in the +5.1 ∘C plots, especially in the C3 community. This interpretation is also supported by the long-term record of porewater chemistry from an allied experiment at the site, demonstrating that porewater CH4 concentrations increase as SO4 concentrations decrease (Keller et al., 2009).
Methanogens may also have a competitive advantage over SO4 reducers for electron donor consumption at warmer temperatures (van Hulzen et al., 1999). Sulfate reducers and methanogens have very similar KM values for acetate, but the KM for acetoclastic methanogenesis may decrease with temperature whereas KM values for SO4 reducers increase with temperature (van Bodegom and Stams, 1999). If this is the case in our system, then warming would allow methanogens to use a greater proportion of the available substrates.
4.4 Plant traits modify warming effects on CH4 cycling
The three biogeochemical mechanisms we propose to explain a warming-induced increase in CH4 emissions should interact strongly with plant responses to warming. Relationships between plant functional groups and CH4 emissions have been demonstrated through field studies in other wetland ecosystems such as peatlands (Bubier et al., 1995; Ward et al., 2013) and in tidal wetland mesocosms (Liu et al., 2019; Martin and Moseman-Valtierra, 2017; Mueller et al., 2020). We provide field evidence that two species with distinct plant traits – Schoenoplectus and Spartina – have strikingly different effects on CH4 emissions from brackish wetlands. Spartina-dominated communities had consistently higher CH4 emissions under both ambient and warmed conditions (Fig. 3). In most years, Schoenoplectus biomass was negatively correlated with CH4 emissions, while Spartina and Distichlis biomass was positively correlated. Vegetation effects are typically strongest during the growing season, when the plants are actively altering rhizosphere biogeochemistry (van der Nat and Middelburg, 1998b; Ward et al., 2013), which is consistent with our observations in this study.
As with warming effects, plant-driven shifts in CH4 emissions are the result of differing rates of CH4 production, oxidation, transport, or a combination of these processes, but sustained differences in emissions cannot be attributed only to transport, as discussed previously. Instead, the stimulation of CH4 emissions is likely due to changes in the plant-mediated supply of electron acceptors and electron donors. In a field environment, differentiating between species-specific effects and underlying environmental conditions can be difficult, but mesocosm studies that control all environmental factors have also found species-specific effects on CH4 cycling (e.g., Liu et al., 2014). Plants can alter CH4 cycling by adding O2 (electron acceptor) or C substrates (electron donors) to the rhizosphere, altering the redox state. We propose that Schoenoplectus is a net oxidizer of the rhizosphere and that Spartina is a net reducer, and thus their presence and productivity have opposing effects on CH4 emissions (Fig. 7, mechanism 4).
4.4.1 Schoenoplectus oxidizes the rhizosphere, increasing CH4 oxidation
Species vary in their capacity to support aerobic CH4 oxidation (van der Nat and Middelburg, 1998b), and Schoenoplectus appears to support higher rates of aerobic CH4 oxidation than Spartina (Mueller et al., 2020). Scirpus lacustris is morphologically similar to Schoenoplectus americanus studied here and has been demonstrated to have substantial rhizosphere oxidation capacity, especially during the growing season (van der Nat and Middelburg, 1998b). Consequently, these plants likely exert stronger control on rates of CH4 oxidation than rates of methanogenesis (van der Nat and Middelburg, 1998a). We hypothesize that the relatively high capacity of Schoenoplectus to transport O2 held the CH4 emissions stimulation caused by modest levels of warming (+1.7 to +3.4 ∘C) to rates similar to under ambient conditions (Fig. 3). At high warming (+5.1 ∘C), however, Schoenoplectus community CH4 emissions drastically increase (Fig. 3). We suggest that this is due to the combined effects of the three mechanisms discussed previously, namely the differences in the Q10 values of CH4 production and CH4 oxidation, the increased supply of organic substrate through plant productivity, and the decrease in competition for electron donors due to SO4 depletion. Collectively, when the ecosystem is warmed above current ambient conditions by 5 ∘C or more, enhanced stimulation of CH4 production starts to offset some of the Schoenoplectus oxidation effect. This also offers an explanation for the positive correlation between Schoenoplectus biomass and CH4 emissions observed in 2016 as that was the hottest of the 4 years in this study.
4.4.2 Spartina reduces the rhizosphere, increasing CH4 production
The variability in quality and quantity of root exudates between plant functional types is well known to affect microbial community composition and activity (Deyn et al., 2008). Methanogenesis responses to warming in incubation studies are related to the lignin and cellulose content of the peat, which in turn depends on the plant functional type from which the peat developed (Duval and Radu, 2018). Although warming likely increases substrate availability across the whole experiment, the production of labile, low-molecular-weight C substrates through fermentation is less sensitive to temperature above 25 ∘C than below this threshold (Neubauer and Craft, 2009; Weston and Joye, 2005). Microorganisms may also preferentially use freshly produced (i.e., labile) organic carbon compounds as electron donors (DeLaune et al., 2014), and consequently warming effects on CH4 production should be strongest in a system where rates of root exudation and turnover are most rapid. We propose that root exudation and turnover explain the positive correlation between plant biomass and CH4 emissions that we observed in the C4 community. Multiple years of porewater chemistry at this site show that Spartina-dominated communities have higher DOC and dissolved CH4 than adjacent Schoenoplectus communities (Keller et al., 2009; Marsh et al., 2005). Though we did not directly measure root exudation, porewater DOC is partially derived from root exudates and has been used as a proxy to understand the responses of root exudates to global change factors (Dieleman et al., 2016; Fenner et al., 2007; Jones et al., 2009).
We observed a simultaneous increase in dissolved CH4 at the soil surface and a decrease in dissolved CH4 at depth in the warmed C4 plots. As with the observed trends in CH4 emissions, there are multiple mechanisms that could cause a shift in porewater CH4 concentrations. Of the four mechanisms outlined above, perhaps the simplest explanation is an increase in labile C at shallow depths and a decrease in deeper soil. This is consistent with DOC depth profiles from this C4 community in which porewater DOC increases with warming in shallow samples but decreases with warming in deep samples (Fig. S7). This shallowing of peak DOC concentrations could be due to a warming-induced increase in evapotranspiration, leading to slower downward hydrologic transport of DOC-rich surface porewater to lower depths, or a warming-induced shallowing of the root system, leading to a shift in the location of root exudates.
In most years, Spartina biomass was positively correlated with CH4 emissions, supporting our hypothesis that Spartina favors net CH4 production. However, in 2016 Spartina biomass and CH4 emissions were negatively correlated. Prior work at this site has indicated that Spartina and Distichlis biomass is more negatively affected by hot and dry growing conditions than Schoenoplectus (Noyce et al., 2019) due in part because the Spartina and Distichlis (C4) communities are less frequently inundated. The 2016 growing season was substantially warmer than average (Table 2), and the heating treatments were initialized on 1 June of that year, after the annual plants had already established and may have developed adaptations to ambient, rather than elevated, temperature conditions. The combination of these two effects likely led to heat stress, reducing the root exudates supplied to the rhizosphere microbial community (Heckathorn et al., 2013) and thus minimizing the Spartina stimulation effect.
4.5 Comparisons with prior data
Methane emissions have been measured at the GCReW site previously, but this study represents the most comprehensive dataset collected to date and is thus particularly useful for advancing the process-based understanding needed to improve prognostic models. Overall, our flux estimates are lower than those reported previously. The earliest CH4 fluxes were measured in a single month (July) in Schoenoplectus-dominated plots and reported to be 331 to 6883 µmol m−2 d−1 (Dacey et al., 1994), much higher than our range of 359 to 1651 µmol m−2 d−1 for ambient temperature Schoenoplectus plots in July. Similarly, Marsh et al. (2005) reported mean growing season (May–October) CH4 emissions from this site of 846 ± 111 µmol CH4 m−2 d−1, whereas we measured 656 ± 79 µmol CH4 m−2 d−1 over the same months. Finally, Pastore et al. (2017) estimated average annual fluxes in their Schoenoplectus-dominated ambient CO2 plots as 3.1 ± 1.7 g CH4 m−2 yr−1, compared to our estimates of 1.6 ± 0.3 g CH4 m−2 yr−1 for Schoenoplectus plots. The different estimates by these studies may be partly due to interannual variability as demonstrated in our data where 2018 had substantially higher fluxes than any of the surrounding years (Table S2).
The annual estimates reported here for ambient temperature plots trended lower than published mean CH4 emissions for mesohaline tidal marshes. Our plots ranged from 0.7 to 9.3 g CH4 m−2 yr−1 (mean = 9.3), compared to the range of 3.3 to 16.4 g CH4 m−2 yr−1 (mean = 16.4) reported by Poffenbarger et al. (2011). This difference may be explained by the fact that there was significant within-class variation in the oligohaline and mesohaline salinity classes that was unexplained, and their assessment was based on too few data points to fully capture the variation that is expected to exist in the mesohaline class. Indeed, subsequent studies have documented fluxes well below 3 g CH4 m−2 yr−1 (Krauss and Whitbeck, 2012) and even negative fluxes (Al-Haj and Fulweiler, 2020). We hypothesize that the low fluxes measured at our site reflect Schoenoplectus americanus traits that favor CH4 oxidation more than CH4 production and that the high end of our range was limited by the high soil elevation (i.e., deep water table) of areas dominated by Spartina patens, offsetting the influence of S. patens traits that favor CH4 production.
4.6 Implications for tidal wetland carbon cycling
Warming accelerates rates of CH4 emissions from brackish marshes, especially during the growing season. This is driven by both direct and indirect warming effects and mediated by soil biogeochemistry, but the magnitude of the warming effect is also dependent on traits of the plant species that dominate the plant community. Communities dominated by Spartina patens increase net CH4 emissions in response to smaller increments of warming than communities dominated by Schoenoplectus americanus. Spartina-dominated sites may thus have a higher likelihood of shifting from a net C sink to a net C source under future warming conditions, due to this increased loss of C as CH4. However, this effect could be mitigated if these high-elevation Spartina marshes become dominated by Schoenoplectus in response to predicted accelerated sea-level rise (Kirwan and Guntenspergen, 2012). In addition, Spartina traits are plastic and influenced by factors such as soil redox conditions (Kludze and DeLaune, 1994), salinity (Crozier and DeLaune, 1996), and water level (Liu et al., 2019), all of which can be expected to change plant-mediated effects on CH4 biogeochemistry. Further studies are needed to thoroughly assess the range of environmental conditions under which Spartina is a net reducer and Schoenoplectus is a net oxidizer as proposed by the present study.
All data are available from the corresponding author upon request.
The supplement related to this article is available online at: https://doi.org/10.5194/bg-18-2449-2021-supplement.
GLN and JPM designed the study, GLN collected and analyzed the data, and GLN and JPM wrote the paper.
The authors declare that they have no conflict of interest.
Roy Rich designed the warming infrastructure and maintains it with the assistance of Gary Peresta. We also thank the technicians in the SERC Biogeochemistry Lab for assistance with porewater collection and analysis.
This research has been supported by the US Department of Energy, Office of Science, Office of Biological and Environmental Research program (grant nos. DE-SC0014413 and DE-SC0019110); the National Science Foundation Long-Term Research in Environmental Biology program (grant nos. DEB-0950080, DEB-1457100, and DEB-1557009); and the Smithsonian Institution.
This paper was edited by Edzo Veldkamp and reviewed by two anonymous referees.
Al-Haj, A. N. and Fulweiler, R. W.: A synthesis of methane emissions from shallow vegetated coastal ecosystems, Global Change Biol., 26, 2988–3005, https://doi.org/10.1111/gcb.15046, 2020.
Bardgett, R. D., Bowman, W. D., Kaufmann, R., and Schmidt, S. K.: A temporal approach to linking aboveground and belowground ecology, Trends Ecol. Evol., 20, 634–641, https://doi.org/10.1016/j.tree.2005.08.005, 2005.
Basiliko, N., Stewart, H., Roulet, N. T., and Moore, T. R.: Do root exudates enhance peat decomposition?, Geomicrobiol. J., 29, 374–378, https://doi.org/10.1080/01490451.2011.568272, 2012.
Bianchi, T. S.: Biogeochemistry of Estuaries, Oxford University Press, New York, USA, 720 pp., 2006.
Blaser, M. and Conrad, R.: Stable carbon isotope fractionation as tracer of carbon cycling in anoxic soil ecosystems, Curr. Opin. Biotech., 41, 122–129, https://doi.org/10.1016/j.copbio.2016.07.001, 2016.
Bridgham, S. D., Megonigal, J. P., Keller, J. K., Bliss, N. B., and Trettin, C.: The carbon balance of North American wetlands, Wetlands, 26, 889–916, https://doi.org/10.1672/0277-5212(2006)26[889:TCBONA]2.0.CO;2, 2006.
Bridgham, S. D., Cadillo-Quiroz, H., Keller, J. K., and Zhuang, Q.: Methane emissions from wetlands: biogeochemical, microbial, and modeling perspectives from local to global scales, Global Change Biol., 19, 1325–1346, https://doi.org/10.1111/gcb.12131, 2013.
Bubier, J. L., Moore, T. R., Bellisario, L., Comer, N. T., and Crill, P. M.: Ecological controls on methane emissions from a Northern Peatland Complex in the zone of discontinuous permafrost, Manitoba, Canada, Global Biogeochem. Cy., 9, 455–470, https://doi.org/10.1029/95GB02379, 1995.
Chen, J., Luo, Y., Xia, J., Wilcox, K. R., Cao, J., Zhou, X., Jiang, L., Niu, S., Estera, K. Y., Huang, R., Wu, F., Hu, T., Liang, J., Shi, Z., Guo, J., and Wang, R.-W.: Warming effects on ecosystem carbon fluxes are modulated by plant functional types, Ecosystems, 20, 515–526, https://doi.org/10.1007/s10021-016-0035-6, 2017.
Christensen, T. R., Ekberg, A., Ström, L., Mastepanov, M., Panikov, N., Öquist, M., Svensson, B. H., Nykänen, H., Martikainen, P. J., and Oskarsson, H.: Factors controlling large scale variations in methane emissions from wetlands, Geophys. Res. Lett., 30, 1414, https://doi.org/10.1029/2002GL016848, 2003.
Conrad, R.: Quantification of methanogenic pathways using stable carbon isotopic signatures: a review and a proposal, Org. Geochem., 36, 739–752, https://doi.org/10.1016/j.orggeochem.2004.09.006, 2005.
Conrad, R.: Importance of hydrogenotrophic, aceticlastic and methylotrophic methanogenesis for methane production in terrestrial, aquatic and other anoxic environments: A mini review, Pedosphere, 30, 25–39, https://doi.org/10.1016/S1002-0160(18)60052-9, 2020.
Crozier, C. R. and DeLaune, R. D.: Methane production by soils from different Louisiana marsh vegetation types, Wetlands, 16, 121–126, https://doi.org/10.1007/BF03160685, 1996.
Dacey, J. W. H., Drake, B. G., and Klug, M. J.: Stimulation of methane emission by carbon dioxide enrichment of marsh vegetation, Nature, 370, 47–49, https://doi.org/10.1038/370047a0, 1994.
de Jong, A. E. E., in't Zandt, M. H., Meisel, O. H., Jetten, M. S. M., Dean, J. F., Rasigraf, O., and Welte, C. U.: Increases in temperature and nutrient availability positively affect methane-cycling microorganisms in Arctic thermokarst lake sediments, Environ. Microbiol., 20, 4314–4327, https://doi.org/10.1111/1462-2920.14345, 2018.
Delarue, F., Gogo, S., Buttler, A., Bragazza, L., Jassey, V. E. J., Bernard, G., and Laggoun-Défarge, F.: Indirect effects of experimental warming on dissolved organic carbon content in subsurface peat, J. Soils Sediments, 14, 1800–1805, https://doi.org/10.1007/s11368-014-0945-x, 2014.
Deyn, G. B. D., Cornelissen, J. H. C., and Bardgett, R. D.: Plant functional traits and soil carbon sequestration in contrasting biomes, Ecol. Lett., 11, 516–531, https://doi.org/10.1111/j.1461-0248.2008.01164.x, 2008.
Dieleman, C. M., Lindo, Z., McLaughlin, J. W., Craig, A. E., and Branfireun, B. A.: Climate change effects on peatland decomposition and porewater dissolved organic carbon biogeochemistry, Biogeochemistry, 128, 385–396, https://doi.org/10.1007/s10533-016-0214-8, 2016.
Ding, W., Cai, Z., and Tsuruta, H.: Plant species effects on methane emissions from freshwater marshes, Atmos. Environ., 39, 3199–3207, https://doi.org/10.1016/j.atmosenv.2005.02.022, 2005.
Dise, N. B., Gorham, E., and Verry, E. S.: Environmental factors controlling methane emissions from peatlands in northern Minnesota, J. Geophys. Res.-Atmos., 98, 10583–10594, https://doi.org/10.1029/93JD00160, 1993.
Duval, T. P. and Radu, D. D.: Effect of temperature and soil organic matter quality on greenhouse-gas production from temperate poor and rich fen soils, Ecol. Eng., 114, 66–75, https://doi.org/10.1016/j.ecoleng.2017.05.011, 2018.
Environmental Protection Agency: Inventory of US Greenhouse Gas Emissions and Sinks: 1990–2015, Environmental Protection Agency, 633 pp., Washington, DC, USA, 2017.
Fenner, N., Freeman, C., Lock, M. A., Harmens, H., Reynolds, B., and Sparks, T.: Interactions between elevated CO2 and warming could amplify DOC exports from peatland catchments, Environ. Sci. Technol., 41, 3146–3152, https://doi.org/10.1021/es061765v, 2007.
Fey, A. and Conrad, R.: Effect of temperature on carbon and electron flow and on the archaeal community in methanogenic rice field soil, Appl. Environ. Microb., 66, 4790–4797, https://doi.org/10.1128/AEM.66.11.4790-4797.2000, 2000.
He, S., Malfatti, S. A., McFarland, J. W., Anderson, F. E., Pati, A., Huntemann, M., Tremblay, J., del Rio, T. G., Waldrop, M. P., Windham-Myers, L., and Tringe, S. G.: Patterns in wetland microbial community composition and functional gene repertoire associated with methane emissions, mBio, 6, e00066-15, https://doi.org/10.1128/mBio.00066-15, 2015.
Heckathorn, S. A., Giri, A., Mishra, S., and Bista, D.: Heat Stress and Roots, in: Climate Change and Plant Abiotic Stress Tolerance, John Wiley & Sons Ltd., Weinheim, Germany, 109–136, https://doi.org/10.1002/9783527675265.ch05, 2013.
Hinrichs, K.-U. and Boetius, A.: The Anaerobic Oxidation of Methane: New Insights in Microbial Ecology and Biogeochemistry, in: Ocean Margin Systems, edited by: Wefer, G., Billett, D., Hebbeln, D., Jørgensen, B. B., Schlüter, M., and van Weering, T. C. E., Springer, Berlin, Heidelberg, Germany, 457–477, https://doi.org/10.1007/978-3-662-05127-6_28, 2003.
Holmquist, J. R., Windham-Myers, L., Bliss, N., Crooks, S., Morris, J. T., Megonigal, J. P., Troxler, T., Weller, D., Callaway, J., Drexler, J., Ferner, M. C., Gonneea, M. E., Kroeger, K. D., Schile-Beers, L., Woo, I., Buffington, K., Breithaupt, J., Boyd, B. M., Brown, L. N., Dix, N., Hice, L., Horton, B. P., MacDonald, G. M., Moyer, R. P., Reay, W., Shaw, T., Smith, E., Smoak, J. M., Sommerfield, C., Thorne, K., Velinsky, D., Watson, E., Grimes, K. W., and Woodrey, M.: Accuracy and precision of tidal wetland soil carbon mapping in the conterminous United States, Sci. Rep.-UK, 8, 9478, https://doi.org/10.1038/s41598-018-26948-7, 2018.
Hopple, A. M., Wilson, R. M., Kolton, M., Zalman, C. A., Chanton, J. P., Kostka, J., Hanson, P. J., Keller, J. K., and Bridgham, S. D.: Massive peatland carbon banks vulnerable to rising temperatures, Nat. Commun., 11, 2373, https://doi.org/10.1038/s41467-020-16311-8, 2020.
Hosono, T. and Nouchi, I.: The dependence of methane transport in rice plants on the root zone temperature, Plant Soil, 191, 233–240, https://doi.org/10.1023/A:1004203208686, 1997.
Inglett, K. S., Inglett, P. W., Reddy, K. R., and Osborne, T. Z.: Temperature sensitivity of greenhouse gas production in wetland soils of different vegetation, Biogeochemistry, 108, 77–90, https://doi.org/10.1007/s10533-011-9573-3, 2012.
IPCC: Climate Change 2013: The Physical Science Basis, Working Group I Contribution to the Fifth Assessment Report of the Intergovernmental Panel on Climate Change, Cambridge University Press, Cambridge, UK, 2013.
Jones, T. G., Freeman, C., Lloyd, A., and Mills, G.: Impacts of elevated atmospheric ozone on peatland below-ground DOC characteristics, Ecol. Eng., 35, 971–977, https://doi.org/10.1016/j.ecoleng.2008.08.009, 2009.
Kayranli, B., Scholz, M., Mustafa, A., and Hedmark, Å.: Carbon storage and fluxes within freshwater wetlands: A critical review, Wetlands, 30, 111–124, https://doi.org/10.1007/s13157-009-0003-4, 2010.
Keller, J. K., Wolf, A. A., Weisenhorn, P. B., Drake, B. G., and Megonigal, J. P.: Elevated CO2 affects porewater chemistry in a brackish marsh, Biogeochemistry, 96, 101–117, https://doi.org/10.1007/s10533-009-9347-3, 2009.
Kirwan, M. L. and Guntenspergen, G. R.: Feedbacks between inundation, root production, and shoot growth in a rapidly submerging brackish marsh, J. Ecol., 100, 764–770, https://doi.org/10.1111/j.1365-2745.2012.01957.x, 2012.
Kludze, H. K. and DeLaune, R. D.: Methane emissions and growth of Spartina patens in response to soil redox intensity, Soil Sci. Soc. Am. J., 58, 1838–1845, https://doi.org/10.2136/sssaj1994.03615995005800060037x, 1994.
Krauss, K. W. and Whitbeck, J. L.: Soil greenhouse gas fluxes during wetland forest retreat along the Lower Savannah River, Georgia (USA), Wetlands, 32, 73–81, https://doi.org/10.1007/s13157-011-0246-8, 2012.
Kristjansson, J. K., Schönheit, P., and Thauer, R. K.: Different Ks values for hydrogen of methanogenic bacteria and sulfate reducing bacteria: An explanation for the apparent inhibition of methanogenesis by sulfate, Arch. Microbiol., 131, 278–282, https://doi.org/10.1007/BF00405893, 1982.
Lenzewski, N., Mueller, P., Meier, R. J., Liebsch, G., Jensen, K., and Koop-Jakobsen, K.: Dynamics of oxygen and carbon dioxide in rhizospheres of Lobelia dortmanna – a planar optode study of belowground gas exchange between plants and sediment, New Phytol., 218, 131–141, https://doi.org/10.1111/nph.14973, 2018.
Liu, D., Ding, W., Yuan, J., Xiang, J., and Lin, Y.: Substrate and/or substrate-driven changes in the abundance of methanogenic archaea cause seasonal variation of methane production potential in species-specific freshwater wetlands, Appl. Microbiol. Biot., 98, 4711–4721, https://doi.org/10.1007/s00253-014-5571-4, 2014.
Liu, L., Wang, D., Chen, S., Yu, Z., Xu, Y., Li, Y., Ge, Z., and Chen, Z.: Methane emissions from estuarine coastal wetlands: Implications for global change effect, Soil Sci. Soc. Am. J., 83, 1368–1377, https://doi.org/10.2136/sssaj2018.12.0472, 2019.
Lu, M., Caplan, J. S., Bakker, J. D., Langley, J. A., Mozdzer, T. J., Drake, B. G., and Megonigal, J. P.: Allometry data and equations for coastal marsh plants, Ecology, 97, p. 3554, https://doi.org/10.1002/ecy.1600, 2016.
Marsh, A. S., Rasse, D. P., Drake, B. G., and Patrick Megonigal, J.: Effect of elevated CO2 on carbon pools and fluxes in a brackish marsh, Estuaries, 28, 694–704, https://doi.org/10.1007/BF02732908, 2005.
Martin, R. M. and Moseman-Valtierra, S.: Different short-term responses of greenhouse gas fluxes from salt marsh mesocosms to simulated global change drivers, Hydrobiologia, 802, 71–83, https://doi.org/10.1007/s10750-017-3240-1, 2017.
Mcleod, E., Chmura, G. L., Bouillon, S., Salm, R., Björk, M., Duarte, C. M., Lovelock, C. E., Schlesinger, W. H., and Silliman, B. R.: A blueprint for blue carbon: toward an improved understanding of the role of vegetated coastal habitats in sequestering CO2, Front. Ecol. Environ., 9, 552–560, https://doi.org/10.1890/110004, 2011.
Megonigal, J. P. and Schlesinger, W. H.: Methane-limited methanotrophy in tidal freshwater swamps, Global Biogeochem. Cy., 16, 1088, https://doi.org/10.1029/2001GB001594, 2002.
Megonigal, J. P., Whalen, S. C., Tissue, D. T., Bovard, B. D., Allen, A. S., and Albert, D. B.: A plant-soil-atmosphere microcosm for tracing radiocarbon from photosynthesis through methanogenesis, Soil Sci. Soc. Am. J., 63, 665–671, https://doi.org/10.2136/sssaj1999.03615995006300030033x, 1999.
Megonigal, J. P., Hines, M. E., and Visscher, P. T.: Anaerobic metabolism: linkages to trace gases and aerobic processes, in: Biogeochemistry, edited by: Schlesinger, W. H., Elsevier-Pergamon, Oxford, UK, 317–424, 2004.
Megonigal, J. P., Chapman, S., Crooks, S., Dijkstra, P., Kirwan, M., and Langley, A.: 3.4 Impacts and effects of ocean warming on tidal marsh and tidal freshwater forest ecosystems, in: Explaining Ocean Warming: Causes, scale, effects, and consequences, IUCN, Gland, Switzerland, 2016.
Moor, H., Rydin, H., Hylander, K., Nilsson, M. B., Lindborg, R., and Norberg, J.: Towards a trait-based ecology of wetland vegetation, J. Ecol., 105, 1623–1635, https://doi.org/10.1111/1365-2745.12734, 2017.
Mueller, P., Jensen, K., and Megonigal, J. P.: Plants mediate soil organic matter decomposition in response to sea level rise, Global Change Biol., 22, 404–414, https://doi.org/10.1111/gcb.13082, 2016.
Mueller, P., Mozdzer, T. J., Langley, J. A., Aoki, L. R., Noyce, G. L., and Megonigal, J. P.: Plants determine methane response to sea level rise, Nat. Commun., https://doi.org/10.1038/s41467-020-18763-4, 2020.
Neubauer, S. C. and Craft, C. B.: Global Change and Tidal Freshwater Wetlands: Scenarios and Impacts, in: Tidal Freshwater Wetlands, edited by: Barendregt, A., Whigham, D., and Baldwin, A., Margraf Publishers, Weikersheim, Germany, 253–310, 2009.
Neubauer, S. C. and Megonigal, J. P.: Moving beyond global warming potentials to quantify the climatic role of ecosystems, Ecosystems, 18, 1000–1013, https://doi.org/10.1007/s10021-015-9879-4, 2015.
Neubauer, S. C., Emerson, D., and Megonigal, J. P.: Microbial oxidation and reduction of Iron in the root zone and influences on metal mobility, in: Biophysico-Chemical Processes of Heavy Metals and Metalloids in Soil Environments, John Wiley & Sons Ltd., Hoboken, New Jersey, 339–371, https://doi.org/10.1002/9780470175484.ch9, 2008.
Neumann, R. B., Blazewicz, S. J., Conaway, C. H., Turetsky, M. R., and Waldrop, M. P.: Modeling CH4 and CO2 cycling using porewater stable isotopes in a thermokarst bog in Interior Alaska: results from three conceptual reaction networks, Biogeochemistry, 127, 57–87, https://doi.org/10.1007/s10533-015-0168-2, 2016.
Noyce, G. L., Kirwan, M. L., Rich, R. L., and Megonigal, J. P.: Asynchronous nitrogen supply and demand produce non-linear plant allocation responses to warming and elevated CO2, P. Natl. Acad. Sci. USA, 116, 21623–21628, https://doi.org/10.1073/pnas.1904990116, 2019.
Oremland, R. S., Marsh, L. M., and Polcin, S.: Methane production and simultaneous sulphate reduction in anoxic, salt marsh sediments, Nature, 296, 143–145, https://doi.org/10.1038/296143a0, 1982.
Pastore, M. A., Megonigal, J. P., and Langley, J. A.: Elevated CO2 and nitrogen addition accelerate net carbon gain in a brackish marsh, Biogeochemistry, 133, 73–87, https://doi.org/10.1007/s10533-017-0312-2, 2017.
Pendleton, L., Donato, D. C., Murray, B. C., Crooks, S., Jenkins, W. A., Sifleet, S., Craft, C., Fourqurean, J. W., Kauffman, J. B., Marbà, N., Megonigal, P., Pidgeon, E., Herr, D., Gordon, D., and Baldera, A.: Estimating global “blue carbon” emissions from conversion and degradation of vegetated coastal ecosystems, PloS One, 7, e43542, https://doi.org/10.1371/journal.pone.0043542, 2012.
Philippot, L., Hallin, S., Börjesson, G., and Baggs, E. M.: Biochemical cycling in the rhizosphere having an impact on global change, Plant Soil, 321, 61–81, https://doi.org/10.1007/s11104-008-9796-9, 2009.
Poffenbarger, H. J., Needelman, B. A., and Megonigal, J. P.: Salinity influence on methane emissions from tidal marshes, Wetlands, 31, 831–842, https://doi.org/10.1007/s13157-011-0197-0, 2011.
Rich, R. L., Stefanski, A., Montgomery, R. A., Hobbie, S. E., Kimball, B. A., and Reich, P. B.: Design and performance of combined infrared canopy and belowground warming in the B4WarmED (Boreal Forest Warming at an Ecotone in Danger) experiment, Global Change Biol., 21, 2334–2348, https://doi.org/10.1111/gcb.12855, 2015.
Robroek, B. J. M., Albrecht, R. J. H., Hamard, S., Pulgarin, A., Bragazza, L., Buttler, A., and Jassey, V. E.: Peatland vascular plant functional types affect dissolved organic matter chemistry, Plant Soil, 407, 135–143, https://doi.org/10.1007/s11104-015-2710-3, 2016.
Roden, E. E. and Wetzel, R. G.: Organic carbon oxidation and suppression of methane production by microbial Fe(III) oxide reduction in vegetated and unvegetated freshwater wetland sediments, Limnol. Oceanogr., 41, 1733–1748, https://doi.org/10.4319/lo.1996.41.8.1733, 1996.
Saunois, M., Bousquet, P., Poulter, B., Peregon, A., Ciais, P., Canadell, J. G., Dlugokencky, E. J., Etiope, G., Bastviken, D., Houweling, S., Janssens-Maenhout, G., Tubiello, F. N., Castaldi, S., Jackson, R. B., Alexe, M., Arora, V. K., Beerling, D. J., Bergamaschi, P., Blake, D. R., Brailsford, G., Brovkin, V., Bruhwiler, L., Crevoisier, C., Crill, P., Covey, K., Curry, C., Frankenberg, C., Gedney, N., Höglund-Isaksson, L., Ishizawa, M., Ito, A., Joos, F., Kim, H.-S., Kleinen, T., Krummel, P., Lamarque, J.-F., Langenfelds, R., Locatelli, R., Machida, T., Maksyutov, S., McDonald, K. C., Marshall, J., Melton, J. R., Morino, I., Naik, V., O'Doherty, S., Parmentier, F.-J. W., Patra, P. K., Peng, C., Peng, S., Peters, G. P., Pison, I., Prigent, C., Prinn, R., Ramonet, M., Riley, W. J., Saito, M., Santini, M., Schroeder, R., Simpson, I. J., Spahni, R., Steele, P., Takizawa, A., Thornton, B. F., Tian, H., Tohjima, Y., Viovy, N., Voulgarakis, A., van Weele, M., van der Werf, G. R., Weiss, R., Wiedinmyer, C., Wilton, D. J., Wiltshire, A., Worthy, D., Wunch, D., Xu, X., Yoshida, Y., Zhang, B., Zhang, Z., and Zhu, Q.: The global methane budget 2000–2012, Earth Syst. Sci. Data, 8, 697–751, https://doi.org/10.5194/essd-8-697-2016, 2016.
Schlesinger, W. H. and Bernhardt, E. S.: Biogeochemistry: An Analysis of Global Change, edn. 4, Academic Press, Waltham, Massachusetts, USA, 2020.
Segers, R.: Methane production and methane consumption: A review of processes underlying wetland methane fluxes, Biogeochemistry, 41, 23–51, https://doi.org/10.1023/A:1005929032764, 1998.
Sihi, D., Inglett, P. W., Gerber, S., and Inglett, K. S.: Rate of warming affects temperature sensitivity of anaerobic peat decomposition and greenhouse gas production, Global Change Biol., 24, 259–274, https://doi.org/10.1111/gcb.13839, 2017.
Sorrell, B. K., Brix, H., Schierup, H.-H., and Lorenzen, B.: Die-back of Phragmites australis: Influence on the distribution and rate of sediment methanogenesis, Biogeochemistry, 36, 173–188, https://doi.org/10.1023/A:1005761609386, 1997.
Stanley, E. H. and Ward, A. K.: Effects of vascular plants on seasonal pore water carbon dynamics in a lotic wetland, Wetlands, 30, 889–900, https://doi.org/10.1007/s13157-010-0087-x, 2010.
Sutton-Grier, A. E., Keller, J. K., Koch, R., Gilmour, C., and Megonigal, J. P.: Electron donors and acceptors influence anaerobic soil organic matter mineralization in tidal marshes, Soil Biol. Biochem., 43, 1576–1583, https://doi.org/10.1016/j.soilbio.2011.04.008, 2011.
van Bodegom, P. M. and Stams, A. J. M.: Effects of alternative electron acceptors and temperature on methanogenesis in rice paddy soils, Chemosphere, 39, 167–182, https://doi.org/10.1016/S0045-6535(99)00101-0, 1999.
van der Nat, F.-J. W. A. and Middelburg, J. J.: Effects of two common macrophytes on methane dynamics in freshwater sediments, Biogeochemistry, 43, 79–104, https://doi.org/10.1023/A:1006076527187, 1998a.
van der Nat, F.-J. W. A. and Middelburg, J. J.: Seasonal variation in methane oxidation by the rhizosphere of Phragmites australis and Scirpus lacustris, Aquat. Bot., 61, 95–110, https://doi.org/10.1016/S0304-3770(98)00072-2, 1998b.
van Hulzen, J. B., Segers, R., van Bodegom, P. M., and Leffelaar, P. A.: Temperature effects on soil methane production: an explanation for observed variability, Soil Biol. Biochem., 31, 1919–1929, https://doi.org/10.1016/S0038-0717(99)00109-1, 1999.
Vann, C. D. and Megonigal, J. P.: Elevated CO2 and water depth regulation of methane emissions: Comparison of woody and non-woody wetland plant species, Biogeochemistry, 63, 117–134, https://doi.org/10.1023/A:1023397032331, 2003.
Waldo, N. B., Hunt, B. K., Fadely, E. C., Moran, J. J., and Neumann, R. B.: Plant root exudates increase methane emissions through direct and indirect pathways, Biogeochemistry, 145, 213–234, https://doi.org/10.1007/s10533-019-00600-6, 2019.
Ward, S. E., Ostle, N. J., Oakley, S., Quirk, H., Henrys, P. A., and Bardgett, R. D.: Warming effects on greenhouse gas fluxes in peatlands are modulated by vegetation composition, Ecol. Lett., 16, 1285–1293, https://doi.org/10.1111/ele.12167, 2013.
Wassmann, R., Alberto, M. C., Tirol-Padre, A., Hoang, N. T., Romasanta, R., Centeno, C. A., and Sander, B. O.: Increasing sensitivity of methane emission measurements in rice through deployment of “closed chambers” at nighttime, PloS One, 13, e0191352, https://doi.org/10.1371/journal.pone.0191352, 2018.
Weiss, J. V., Emerson, D., and Megonigal, J. P.: Geochemical control of microbial Fe(III) reduction potential in wetlands: comparison of the rhizosphere to non-rhizosphere soil, FEMS Microbiol. Ecol., 48, 89–100, https://doi.org/10.1016/j.femsec.2003.12.014, 2004.
Weston, N. B. and Joye, S. B.: Temperature-driven decoupling of key phases of organic matter degradation in marine sediments, P. Natl. Acad. Sci. USA, 102, 17036–17040, https://doi.org/10.1073/pnas.0508798102, 2005.
Whiticar, M. J.: Carbon and hydrogen isotope systematics of bacterial formation and oxidation of methane, Chem. Geol., 161, 291–314, https://doi.org/10.1016/S0009-2541(99)00092-3, 1999.
Wilson, R. M., Hopple, A. M., Tfaily, M. M., Sebestyen, S. D., Schadt, C. W., Pfeifer-Meister, L., Medvedeff, C., McFarlane, K. J., Kostka, J. E., Kolton, M., Kolka, R. K., Kluber, L. A., Keller, J. K., Guilderson, T. P., Griffiths, N. A., Chanton, J. P., Bridgham, S. D., and Hanson, P. J.: Stability of peatland carbon to rising temperatures, Nat. Commun., 7, 13723, https://doi.org/10.1038/ncomms13723, 2016.
Yang, P., Wang, M. H., Lai, D. Y. F., Chun, K. P., Huang, J. F., Wan, S. A., Bastviken, D., and Tong, C.: Methane dynamics in an estuarine brackish Cyperus malaccensis marsh: Production and porewater concentration in soils, and net emissions to the atmosphere over five years, Geoderma, 337, 132–142, https://doi.org/10.1016/j.geoderma.2018.09.019, 2019.
Yang, Z., Wullschleger, S. D., Liang, L., Graham, D. E., and Gu, B.: Effects of warming on the degradation and production of low-molecular-weight labile organic carbon in an Arctic tundra soil, Soil Biol. Biochem., 95, 202–211, https://doi.org/10.1016/j.soilbio.2015.12.022, 2016.
Ye, R., Jin, Q., Bohannan, B., Keller, J. K., and Bridgham, S. D.: Homoacetogenesis: A potentially underappreciated carbon pathway in peatlands, Soil Biol. Biochem., 68, 385–391, https://doi.org/10.1016/j.soilbio.2013.10.020, 2014.
Yvon-Durocher, G., Allen, A. P., Bastviken, D., Conrad, R., Gudasz, C., St-Pierre, A., Thanh-Duc, N., and del Giorgio, P. A.: Methane fluxes show consistent temperature dependence across microbial to ecosystem scales, Nature, 507, 488–491, https://doi.org/10.1038/nature13164, 2014.