the Creative Commons Attribution 4.0 License.
the Creative Commons Attribution 4.0 License.
 | 20 Apr 2021
Isoprene and monoterpene emissions from alder, aspen and spruce short-rotation forest plantations in the United Kingdom
Julia Drewer
Mathew R. Heal
Robert A. S. Sircus
Lara K. Dunn
James I. L. Morison
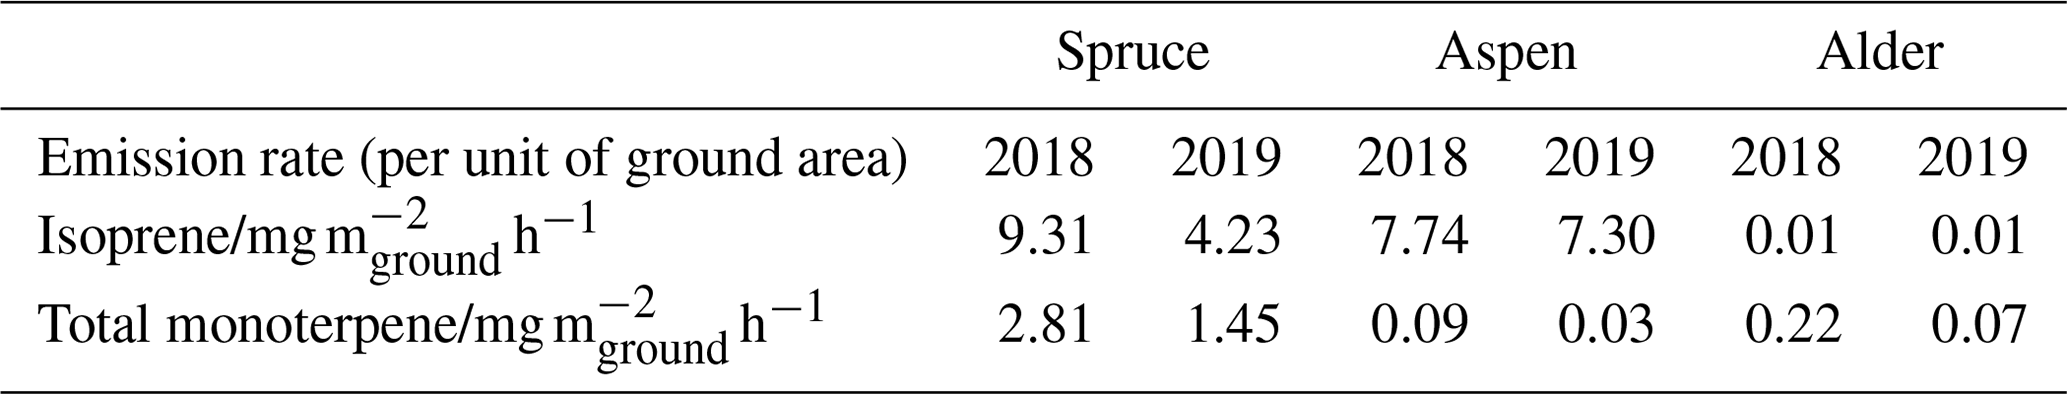
An expansion of bioenergy has been proposed to help reduce fossil-fuel greenhouse gas emissions, and short-rotation forestry (SRF) can contribute to this expansion. However, SRF plantations could also be sources of biogenic volatile organic compound (BVOC) emissions, which can impact atmospheric air quality. In this study, emissions of isoprene and 11 monoterpenes from the branches and forest floor of hybrid aspen, Italian alder and Sitka spruce stands in an SRF field trial in central Scotland were measured during two years (2018–2019) and used to derive emission potentials for different seasons. Sitka spruce was included as a comparison as it is the most extensive plantation species in the UK. Winter and spring emissions of isoprene and monoterpenes were small compared to those in summer. Sitka spruce had a standardised mean emission rate of 15 for isoprene in the dry and warm summer of 2018 – more than double the emissions in 2019. However, standardised mean isoprene emissions from hybrid aspen were similar across both years, approximately 23 , and standardised mean isoprene emissions from Italian alder were very low. Mean standardised total monoterpene emissions for these species followed a similar pattern of higher standardised emissions in the warmer year: Sitka spruce emitting 4.5 and 2.3 for 2018 and 2019, aspen emitting 0.3 and 0.09 , and Italian alder emitting 1.5 and 0.2 , respectively. In contrast to these foliage emissions, the forest floor was only a small source of monoterpenes, typically 1 or 2 orders of magnitude lower than foliage emissions on a unit of ground area basis. Estimates of total annual emissions from each plantation type per hectare were derived using the MEGAN 2.1 model. The modelled total BVOC (isoprene and monoterpenes) emissions of SRF hybrid aspen plantations were approximately half those of Sitka spruce for plantations of the same age. Italian alder SRF emissions were 20 times smaller than from Sitka spruce. The expansion of bioenergy plantations to 0.7 Mha has been suggested for the UK to help achieve net-zero greenhouse gas emissions by 2050. The model estimates show that, with such an expansion, total UK BVOC emissions would increase between <1 % and 35 %, depending on the tree species planted. Whereas increases might be small on a national scale, regional increases might have a larger impact on local air quality.
- Article
(3337 KB) - Full-text XML
-
Supplement
(668 KB) - BibTeX
- EndNote


The UK has committed to reducing its carbon dioxide (CO2) emissions to meet net-zero greenhouse gas emissions targets by 2050, and increasing bioenergy use is seen as a substantial pathway to this. Bioenergy was the largest contributor to renewable energy within the UK in 2018, accounting for 7 % of the primary energy supply (Renewable Energy Association, 2019), and it has been suggested that this could grow to 15 % by 2050 (Committee on Climate Change, 2019). Solid biomass, in the form of wood pellets, chips, and agricultural and forestry residues, is the primary type of biomass used to generate heat and electricity, accounting for 60 % of bioenergy in 2016 (IEA Bioenergy, 2018). However, the majority of the 7.2 million metric tonnes of wood pellets burned in the UK in 2018 came from imports from North America (Renewable Energy Association, 2019). However, importing biomass contributes higher carbon emissions than biomass grown in the UK (Ricardo, 2020), so a larger contribution from domestic supply of bioenergy in the UK is required if the UK is to achieve net-zero emissions.
Currently the most common bioenergy crops in the UK are coppiced willow (Salix spp.) and Miscanthus, a perennial grass. Only 1.6 % of arable land has been used in recent years for biomass in the UK (DEFRA, 2019), but this needs to increase (Committee on Climate Change, 2019). Short-rotation coppice (SRC), in which woody plants such as willow are grown on a 3–4-year cycle, provides high-volume short-term biomass yields but typically produces biomass of lower calorific value compared to short-rotation forest (SRF). In SRF, single stemmed trees are grown over 10–20 years for either biomass or timber. This produces a better timber-to-bark ratio for higher biomass yields, is easily harvested and offers increased flexibility to growers in times of uncertain biomass markets (Keith et al., 2015; Leslie et al., 2012; McKay, 2011). The recent Committee on Climate Change report (2020) suggested that 0.7 Mha of energy crops (Miscanthus, SRC or SRF) should be grown in the UK by 2050 as a “further ambition” scenario in order to achieve net-zero emissions and increase the domestic supply of biomass.
In 2010, Forest Research established SRF trials across the UK to determine biomass yields and assess the environmental impact of SRF (Harrison, 2010). The trials included a number of broadleaf tree species: hybrid aspen (Populus tremula L. × P. tremuloides Michx.), red alder (Alnus rubra Bong.), common alder (Alnus glutinosa (L.) Gaertn.), Italian alder (Alnus cordata Desf.), sycamore (Acer pseudoplatanus), Sweet chestnut (Castanea sativa Mill.), eucalyptus species (Eucalyptus gunnii, Eucalyptus nitens (Vic. nitens (NSW), Eucalyptus glaucescens) and the two conifer species Sitka spruce (Picea sitchensis (Bong.) Carr) and hybrid larch (Larix × marschlinsii Coaz) (Harrison, 2010). Sitka spruce is the most widely grown conifer tree species in the UK and a key plantation species. SRF plantations have previously been assessed for their environmental impact in the UK and Ireland (Keith et al., 2015; McKay, 2011; Tobin et al., 2016) but not for their potential future impacts on air quality in the UK, which is the focus of this work.
Trees are known sinks for CO2 but can also be sources of other trace gases such as volatile organic compounds (VOCs) (Monson and Fall, 1989; Went, 1960). VOCs are emitted by tree foliage as a means of communication, plant defence against herbivory and during environmental stress such as heat or drought. Other sources of VOCs within a forest may include wood, litter, soils, fruits, flowers and roots (Dudareva et al., 2006). Emitted VOCs include, in particular, isoprene and monoterpenes, as well as their aliphatic, aromatic and oxygenated derivatives. These compounds are highly reactive in the atmosphere and contribute to the formation of tropospheric ozone in the presence of nitric oxide (NO) (Atkinson and Arey, 2003). Terpene composition has been found to be an important factor in the magnitude of ozone production (Bonn et al., 2017). Ground-level ozone is a concern for agriculture and natural ecosystems as it causes leaf damage, reduced plant growth (Emberson, 2020; Fares et al., 2013; Felzer et al., 2007), and is also a pollutant with impacts on human health and as a greenhouse gas (UNEP/WMO, 2011). In addition, intermediates of VOC oxidation may act as condensation nuclei for the formation of secondary organic particles (Carlton et al., 2009), another atmospheric pollutant with detrimental effects on human health (Fuzzi et al., 2015).
The emissions of VOCs from plants are dependent upon a range of factors (which vary with emitting source and type of VOC) including species; plant age and environmental conditions such as light and temperature (Guenther et al., 1991; Monson and Fall, 1989); and, in the case of forest floor emissions, soil moisture, ambient temperature, soil type and the activity of the soil microbiome (Peñuelas et al., 2014). If the area of bioenergy crops expands, determining their VOC emissions becomes necessary for the wider assessment of air quality for a given region. Willow, a current UK bioenergy crop grown as SRC, is a known emitter of VOCs (Morrison et al., 2016), but there is a lack of literature data generally for VOC emissions from trees in SRF plantations and from the forest floor.
In this study we focus on determining the contribution of the biogenic volatile organic compound (BVOC) emissions from the two species with the largest growth in SRF trials in the UK: hybrid aspen and Italian alder (McEvoy, 2016; McKay, 2011; Parratt, 2018). In addition, we measured the BVOC emissions for young Sitka spruce plantations, also grown at the same location, as a comparison. Measurements were made in a plantation species trial in central Scotland. Using dynamic enclosure sampling of BVOCs onto absorbent cartridges, the contributions of both foliage and forest floor emissions were measured simultaneously on occasions to form a plantation-scale assessment of BVOC emissions. The data were then used with the MEGAN 2.1 model (Guenther et al., 2012) to derive an estimate of the potential total annual contribution of expanded SRF to UK BVOC emissions.
2.1 Field site description
2.1.1 Tree species and planting
Measurements were made at East Grange, Fife, Scotland (latitude–longitude (WGS84) N, W), elevation 45–60 m, one of the 16 SRF trial locations established by Forest Research (Harrison, 2010; Stokes, 2015). Soil type and texture at the site is surface-water gley and sandy silty loam, respectively, containing 4.9 % clay, 53.0 % silt and 42 % sand (Drewer et al., 2017; Keith et al., 2015). In 2010, the ex-agricultural site was planted with a single block of 40 randomised tree species plots and 8 control plots. Each plot (20 m×20 m) consisted of a single species containing 200 trees with a 2 m×1 m spacing arrangement (Harrison, 2010). Ten species were planted, and the two broadleaved species with the best survival and growth rates across the trials in the first 6 years, hybrid aspen (Populus tremula L. × P. tremuloides Michx.) and Italian alder (Alnus cordata Desf.), were selected for the measurements here, along with Sitka spruce (Picea sitchensis (Bong.) Carr, produced by vegetative propagation) (McEvoy, 2016; Parratt, 2018). After initial establishment of the young saplings, the site remained unmanaged. Branch and forest floor sampling chambers were installed in single south-facing plots of each species.
2.1.2 Meteorological data
Meteorological data were collected from an unplanted plot in the middle of the site between May 2018 and July 2019. Minimum and maximum soil temperature (T107, Campbell Scientific, Shepshed, Leics, UK), air temperature and relative humidity (HMP45C, Campbell Scientific) were monitored hourly. In addition, photosynthetic active radiation (PAR, SKP 215 quantum sensor, Skye Instruments, Llandrindod Wells, UK) was measured at the same site every 5 min. Monthly means and ranges are provided in Fig. S1 in the Supplement. Occasional power failure at the site led to some missing data. For the modelling of BVOC emissions using the Pocket MEGAN 2.1 excel beta 3 calculator (Guenther et al., 2012) the missing PAR and mean temperature data were replaced by measurements from the Easter Bush site of the UK Centre for Ecology & Hydrology lying 45 km to the south-east (latitude–longitude (WGS84) N, W). A summary of the combined East Grange and Easter Bush data used in the model can be found in Fig. S2 in the Supplement.
The climate in east Scotland is colder, with fewer sunshine hours than in the south of England. To encompass these climate differences, meteorological data from Alice Holt Forest ( N, W), Hampshire, in southern England recorded during 2018 and 2019 were also used for the modelling and scaling up of the measured BVOC emission potentials from this study. A summary of the PAR and air temperature data for this field site is given in Fig. S3 in the Supplement.
2.2 Sampling enclosures
Branch sampling was conducted on the spruce, aspen and alder plantation plots on a total of 16, 11 and 13 d respectively between March 2018 and July 2019. The plantation floor sampling was conducted on a total of 18 (spruce and alder) and 20 d (aspen) for the same plots during the same period.
2.2.1 Forest floor enclosures
Forest floor in this context includes soil, leaf litter, fallen small twigs/branches and flowers, understorey vegetation, microorganisms, and underground biomass that may all be sources of BVOC from the ground of the plantation. A static chamber method was used for the plantation floor enclosures. Polyvinyl chloride plastic soil collars (with a flange), 40 cm diameter×18 cm high, were installed per tree species plot prior to sampling (Asensio et al., 2007c, 2007b; Greenberg et al., 2012; Janson, 1993) and remained in the ground for the duration of the experiment. One or two collars were installed in 2017 and used during 2018. Additional collars were installed during 2018, resulting in a total of three soil collars per plot for the 2019 sampling. The collars were placed towards the centre of each plot to reduce the likelihood of plant debris from other plots contaminating them. Leaf litter and understorey vegetation were not removed from the collars prior to sampling to reflect actual changes in BVOC emissions with changes in the forest floor composition through the seasons.
A clear acrylic lid (with a foam lined flange), 40 cm diameter×22.5 cm high, was placed over the soil collar during sampling periods only, enclosing a total chamber volume of 51 L. The lid was sealed using clamps around the rim. A small 12 V axial fan (RS components Ltd, Colby, UK), , was attached to the chamber lid to mix the air inside the chamber (Janson, 1993). Samples of BVOC in the enclosed air were collected through PTFE tubing onto a 6 mm o.d. stainless-steel automated thermal desorption (ATD) cartridge (PerkinElmer, Waltham, MA, USA) packed with 200 mg Tenax TA 60/80 (11982 SUPELCO, Sigma-Aldrich, St Louis, MO, USA) and 100 mg Carbotrap 20/40 (20273 SUPELCO, Sigma-Aldrich) at a flow rate of 0.2 L min−1 using a handheld pump (210-1003MTX, SKC Ltd, Blandford Forum, UK). Samples were collected for 30 min after closure, equating to a total sample volume of 6 L. Pressure compensation was maintained through a small hole in the side of the chamber to prevent negative pressure inside the chamber and potential degassing of air from the soil pores. Ambient air samples were collected concurrently with the chamber sample in order to quantify BVOC emissions from the forest floor by difference. This is discussed further in Sect. 2.5.2. No ozone filter was used during sampling so amounts of some monoterpenes may have been reduced by reaction with ozone (Ortega et al., 2008). However, it has also been suggested that ozone may be lost by dry deposition onto the chamber walls in the first minute (Janson et al., 1999). Chamber air temperature (Electronic Temperature Instruments Ltd, Worthing, UK) and humidity (Fisherbrand™ Traceable™ humidity meter, Fisher Scientific, Loughborough, UK) were measured at the end of the 30 min sample collection period.
Volumetric soil moisture (ML3 ThetaProbe soil moisture sensor, Delta T, Cambridge, UK) was measured at three locations around each chamber, and soil temperature was measured at a single location at 7 cm depth close to but outside the soil collar to avoid disturbance of the forest floor. Both measurements were performed after sample collection to prevent perturbation of the ambient air sample.
2.2.2 Branch enclosure
A dynamic chamber method was used for branch enclosures. Three sample points were established per tree species plot and used to mount a removable flow-through acrylic chamber (Potosnak et al., 2013), 53 L in volume. The chambers were set up during each sampling visit and used to enclose a single branch, alternating between three similar branches per tree species. The branches were selected to be of similar size and in a similar position on the tree. All branches were approximately 1.5 m from the ground and in a south-facing position. Ambient airflow was delivered from an oil-free double-ended diaphragm pump (Capex V2, Charles Austen pumps Ltd, Surrey, UK) through PTFE tubing (Morrison et al., 2016; Purser et al., 2020) at a flow rate of 10 L min−1 to obtain the desirable air exchange rate of 4–5 min (Ortega and Helmig, 2008). In addition, the chamber contained a small 12 V axial fan (RS components Ltd, Colby, UK), , to ensure sufficient mixing of air inside the chamber.
After set-up, the branch enclosure was left for a period of 30 min to attain a steady state. Both the inside and outside of the enclosure were then sampled concurrently for 30 min at a flow rate of 0.2 L min−1 (total sample volume of 6 L) using a handheld pump (210-1003MTX, SKC Ltd, Blandford Forum, UK). In cases of low light levels, low temperatures or smaller volumes of foliage, the sampling time was sometimes extended (up to 60 min) to ensure sufficient sample was collected on the sample cartridge. Multiple sequential samples were taken over a given day. All enclosure sample tubes were stored in a fridge at 4 ∘C until analysis.
After BVOC sample collection, the leaves inside the chamber were counted, and a representative subsample of approximately 10 % of the total number of leaves on the measured branch were removed from a nearby branch. The leaves were dried at 70 ∘C until constant mass, typically after 48 h. In the case of the Sitka spruce, subsidiary branches were used. Measurements of chamber temperature and relative humidity (CS215, Campbell Scientific, Shepshed, UK) were made each minute during sampling. In addition, PAR (SKP 215 PAR quantum sensor, Skye Instruments, Llandrindod Wells, UK) was measured outside but next to the branch chamber, with measurements made every minute. The chambers had 85 % transparency to PAR (400–700 nm), so the measured PAR values were correspondingly adjusted to represent the illumination conditions inside the chamber.
2.3 BVOC analysis
The BVOC samples collected on the sorbent were analysed using gas chromatography–mass spectrometry (GC-MS) with a two-stage automatic thermal desorption unit (ATD 400, Perkin-Elmer, Wellesley, MA, USA) using the method described in Purser et al. (2020). Calibration was carried out using standards (from Sigma-Aldrich, Gillingham, UK) of the monoterpenes α-pinene, β-pinene, d-limonene, α-phellandrene, β-phellandrene, 3-carene, camphene, γ-terpinene, and β-myrcene and the monoterpenoids (monoterpene-based compounds with, for example, additional oxygen or missing a methyl group) eucalyptol and linalool prepared as a mixed stock solution of 3 ng µL−1 in methanol. Aliquots of 1, 2, 3 and 4 µL of the mixed monoterpene stock solution were pipetted directly onto sample tubes under a flow of helium to produce a range of mixed monoterpene standards of 3, 6, 9 and 12 ng. Isoprene standards were prepared by direct sampling onto a sorbent tube from a certified 700 ppbv gas standard (BOC, UK) for 10, 30, 45 and 60 s using a sample pump (210-1003MTX, SKC Ltd, Blandford Forum, UK) producing standards of 65, 198, 296 and 395 ng. Note that mass loadings of isoprene and monoterpene calibration standards were calculated to greater precision than quoted above but are shown here as nominal values for ease of discussion.
Unknown peaks in sample chromatograms were identified by comparison to the internal library of the GC-MS (National Institute of Standards and Technology) and by comparison with the retention time of the standard. The limit of detection (LOD) of the calculated measured emissions ranged from 0.12–0.35 for the branch chambers and 0.47–1.4 for the forest floor chambers. Uncertainties on individual calculated emission rates were 16 % for isoprene and 17 % for monoterpenes, which were derived via error propagation methods described in Purser et al. (2020).
2.4 Calculation of standardised emissions
2.4.1 Forest floor BVOC emissions
As no substantial isoprene emissions were observed during an initial assessment, only monoterpenes were quantified from the forest floor. Monoterpene emissions from the forest floor (Ffloor) were calculated as micrograms (µg) of carbon for a given compound per ground surface area () using Eq. (1), where Csample is the concentration of a monoterpene inside the chamber (µg C L−1), Cambient is the concentration of a monoterpene in the ambient air outside the chamber (µg C L−1), A is the area of forest floor inside the chamber (m2), V is the volume inside the chamber and t is the sampling duration (min).
In some cases, the concentration in ambient air was larger than inside, resulting in a negative emission value, i.e. a net uptake.
2.4.2 Branch-scale BVOC emissions
The isoprene or monoterpene emission (Fbranch) from an enclosed branch was calculated as micrograms of carbon (C) for a given compound per leaf dry mass basis, µg C g h−1, using Eq. (2), where f is the flow rate through the chamber (L min−1), and m is the dry mass (g) of foliage inside the chamber.
Isoprene emissions have previously been shown to be controlled by both light and temperature and were standardised to 30 ∘C and 1000 , respectively (Guenther et al., 1993). Mean chamber air temperature and PAR for each period of sample collection were therefore used to standardise the measured Fbranch emissions for isoprene (Eqs. 3–5) and monoterpenes (Eq. 6) to facilitate comparison between this study and previous literature. The algorithms developed in Guenther et al. (1993) are subsequently referred to as G93.
The standardised isoprene emission rate Fisoprene at 30 ∘C and 1000 PAR is a function of the measured emission Fbranch, a term CL to correct for the effect of light and a term CT to correct for the effect of temperature Eq. (3).
The light-correction term CL is calculated from Eq. (4), where α=0.0027 and CL1=1.066 are empirical coefficients in G93, and L is the experimentally measured mean PAR () during sampling.
The temperature-correction term CT is calculated using Eq. (5), in which the terms CT1 (95 000 J mol−1), CT2 (230 000 J mol−1) and TM (314 K) are all empirically derived coefficients from G93. R is the molar gas constant 8.314 , T is the mean air temperature (K) during sampling and Ts is the standardised temperature of 303.15 K, equivalent to 30 ∘C.
Monoterpene emissions from branch chambers, Fbranch, were standardised to temperature based on the calculations from G93 using Eq. (6). Ts is the standard temperature (303 K), and T is the mean air temperature during sampling. Fmonoterpene is the standardised monoterpene emission rate (), and Fbranch is the measured monoterpene emission rate ().
Standardised isoprene and monoterpene emission rates from sequential samples calculated for a given day were then averaged to give a single standardised branch emission rate per tree species per measurement day. In addition, daily measurements were grouped into seasons to give a standardised emission potential per season, Fb_season.
2.5 LAI determination
A leaf area index (LAI) meter (LAI-2000 plant canopy analyser, LI-COR, Inc., Lincoln, NE, USA) was used to provide data to estimate a density of foliage, , for each species during 2 separate days 2 weeks apart in July 2018, assumed to be the time of maximum foliage density (Ogunbadewa, 2012). LAI determinations were made in three hybrid aspen plots, two Sitka spruce plots and one Italian alder plot. Two above-canopy and eight below-canopy points were measured per plot, with a mixture of within and between row measurements. Where more than one plot was measured for a species, the mean LAI is reported.
2.6 Scaling up from emission per mass of foliage to an emission per area of ground of plantation
The standardised emissions of isoprene and monoterpenes from the canopy (), Ffoliage, were determined using Eq. (7), multiplying standardised summertime branch emission measurements (Fb_summer) calculated in Sect. 2.5.2 with literature values of the leaf mass per leaf area (LMA) for each tree species (Table 1) and the measured LAI. As there was limited LMA data for Italian alder under climate conditions relevant for the UK, additional values were taken from literature on common alder (Alnus glutinosa). The LMA multiplied by the LAI gives the mass of foliage per unit area of ground, known as the foliar biomass density. The calculated foliar biomass density values in Table 1 for hybrid aspen (329) and Italian alder (315) are very similar to the 320 (Karl et al., 2009) and 375 g m−2 (Geron et al., 2000) used in previous modelling studies for these two tree species. For Sitka spruce the foliage biomass density used here (619 g m−2) is about half that for the same species in previous modelling studies, 1500 g m−2 (Geron et al., 2000; Karl et al., 2009), and reflects the immature Sitka spruce stand not yet achieving a closed canopy.
For times when the plantation canopy consisted of flowers only (catkins) or early leaf emergence, during the months February to April on deciduous species, a different approach had to be applied. In these instances the LAI was either reduced to reflect the canopy during leaf emergence or the following estimate for catkins was applied. We assumed that there were approximately 66 catkins per square metre of ground area of the plantation canopy based on similar catkin-forming species (Boulanger-Lapointe et al., 2016). This equates to a catkin biomass density, for converting from branch-scale to canopy-scale purposes, of 8.98 based on the mean mass of an alder catkin measured during our study.
Table 1Leaf mass per area data for calculating foliage emission rates per plantation ground area.
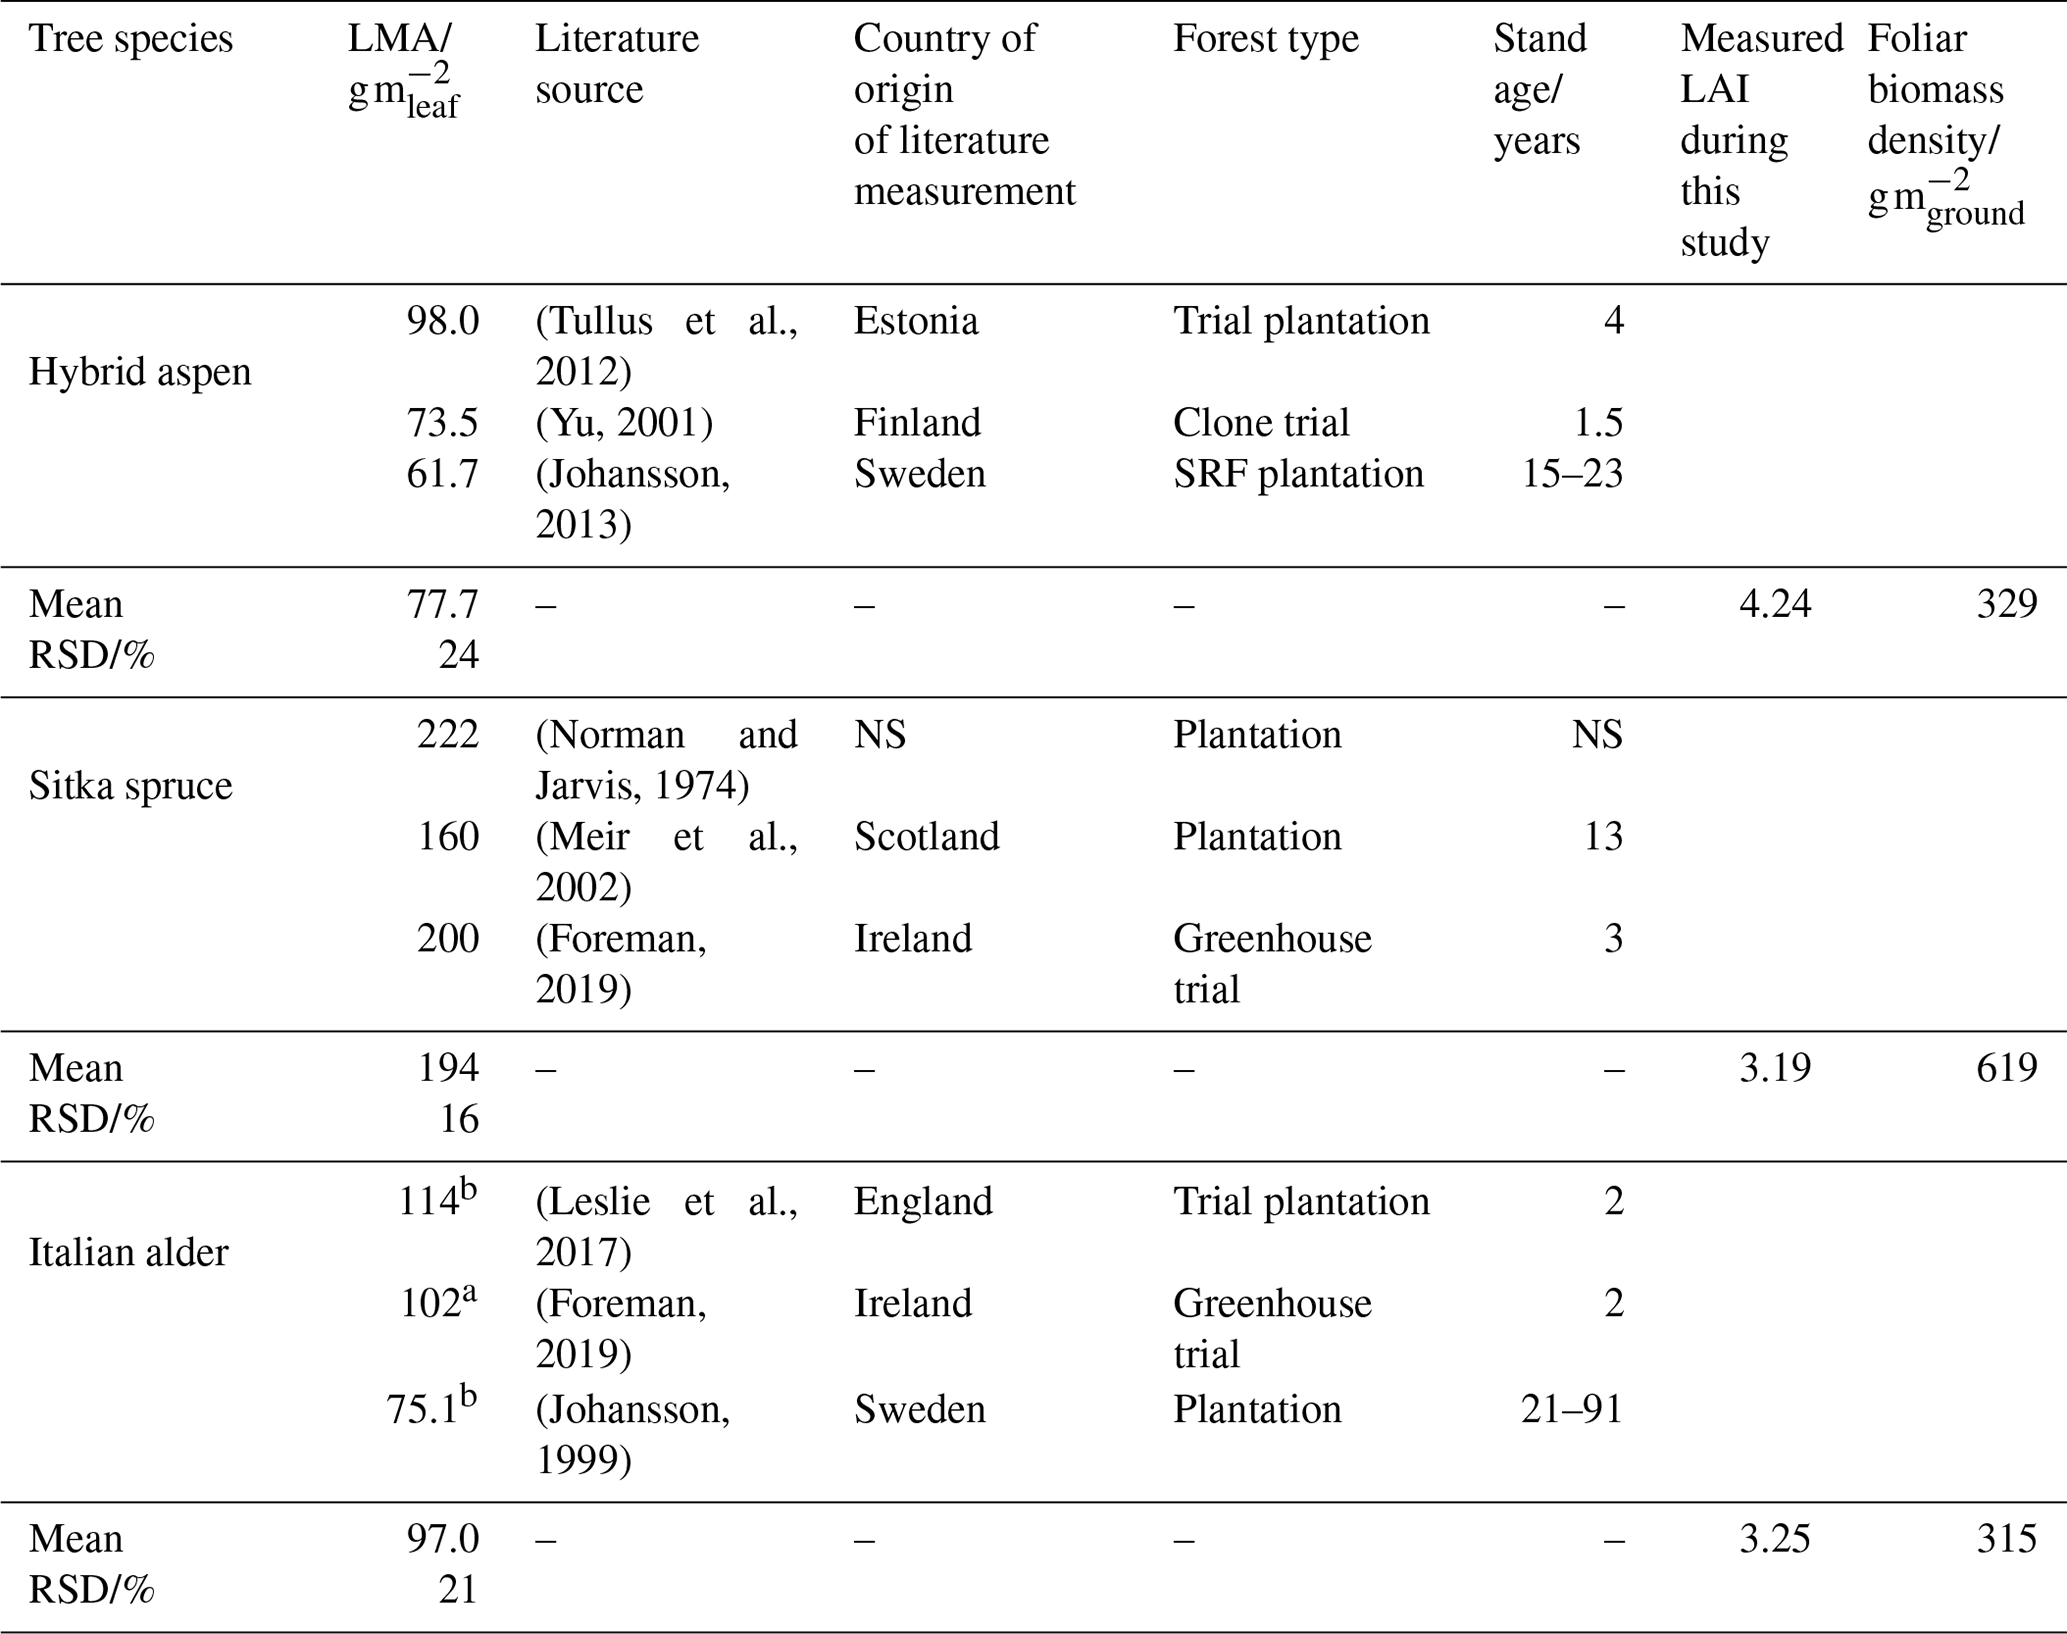
a Mean of sun and shade leaves. NS: not specified; RSD: relative standard deviation. b Measurements from common alder (Alnus glutinosa).
In measurements of LAI by Ogunbadewa et al. (2012), taken across a year in a deciduous forest in the UK, the LAI was at its maximum by July, and during spring the LAI increased such that it was around a quarter of the maximum by late April and around a half by mid-May. These seasonal changes in LAI were therefore adopted for use in the MEGAN 2.1 model (Table 2) in the absence of multiple seasonal LAI measurements taken at East Grange during our study.
Table 2Seasonal time course of leaf area index (LAI) for estimating annual VOC emissions for different species plots at East Grange, Fife, Scotland, using MEGAN 2.1 model.

2.7 From canopy emission to total annual emissions per hectare and the influence of increasing biomass planting on total UK BVOC emissions
Standardised foliage emission rates, Ffoliage, for summer 2018 and 2019 (Table 3) were input to the Pocket MEGAN 2.1 excel beta 3 calculator (Guenther et al., 2012) with hourly mean PAR and temperature data from East Grange (gap filled with UKCEH site data), LAI and the other variables given in Table 2. For a detailed description of the equations and algorithms used in MEGAN 2.1, see Guenther et al. (2006, 2012). The model adjusts the standardised emission rate input in accordance with air temperature and PAR from the meteorology inputs per hour to produce a likely emission rate for the plantation. Input LAI measurements for alder and aspen were scaled in spring and autumn by 25 % and 50 % to simulate leaf emergence and senescence (Table 2). The LAI of Sitka spruce was assumed to remain constant through the seasons, although it is recognised that there will be a small increase in the spring, and a later decline. No LAI measurements were made in 2019; therefore 2018 measurements were used. The function that accounts for the effect of both the previous 24 and 240 h of light on the calculated emissions was applied in the model. The latitude was set to 56∘ for Scotland and 51∘ for England, and the vegetation cover was set to 1. The functions in MEGAN2.1 that allow for consideration of soil moisture and CO2 concentrations were not used due to a lack of continuous data available for the field sites. The monoterpenes in the model were calculated using the single value for mean total monoterpene from East Grange and using the category named “other monoterpenes”. Although some individual monoterpene compounds may be produced in the leaves in response to light and temperature to varying degrees, due to the use of the collective “total monoterpenes” as a model input the simplification that monoterpene emissions were driven by temperature only and no light specific emission factor was applied (Guenther et al., 2006, 2012, 1993a). Any other model input parameters remained as default.
Table 3Input parameters for estimating annual BVOC emissions for different SRF species plots at East Grange, Fife, Scotland, using the MEGAN 2.1 model.
The model outputs of hourly isoprene and total monoterpene emissions were summed to give annual emissions per square metre of SRF plantation. The combined mean total annual emission rate encompassing both years of emission potentials (2018 and 2019) and meteorology from two contrasting UK sites (E. Scotland and S. E. England), for each SRF species, was then compared to literature values for the estimated annual UK isoprene and monoterpene emissions and combined total BVOC emissions.
3.1 Field observations of seasonality
The measured BVOC emissions were assigned to seasons as follows: winter (21 December–19 March), spring (20 March–7 June), summer (8 June–22 September) and autumn (23 September–20 December). Year 2018 is classified here as a dry year, being 25 % drier at the East Grange field site than the 30-year mean for the area (Met Office, 2020). In contrast, 2019 was 50 % wetter than the 30-year UK mean. In 2019, catkins were fully developed on the hybrid aspen and Italian alder branches by February, but bud burst and leaf emergence were not observed until mid-April (19th). This was 2 weeks later than in 2018. The first new growth on the Sitka spruce was observed at the end of April (29th). Based on these differences in phenology at the site, measurements taken on 7 June 2019 were still categorised as spring.
For the forest floor it was noted that the soil temperatures during summer 2018 were higher than in 2019. After several dry weeks in spring and summer in 2018, the first significant rainfall event since May was noted as 14 July, and some leaf fall in the Italian alder and hybrid aspen plots was observed by the end of July. By February 2019, no leaf litter from the previous autumn season was observed on the forest floor of the plots except for those of Sitka spruce. Rapid understorey growth identified as hogweed (Heracleum sp.) quickly developed from late April (29th) and by early June (7th) completely covered the forest floor in the alder plots. The hybrid aspen and Sitka spruce plots during both 2018 and 2019 had minimal understorey vegetation by comparison.
3.2 Leaf area index
The LAI of 3.19 for our 8-year-old Sitka spruce plantation (Table 1) is lower than the value of 4.33 predicted for a 10-year-old plantation from allometric relationships (Tobin et al., 2007). However, our measured LAI reflects a canopy not yet fully closed, and the differences in site conditions are likely to produce different growth rates.
A maximum LAI of 4 was reported for a 9-year-old aspen (Populus tremuloides Michx.) plantation in Canada (Pinno et al., 2001), which compares well with the LAI of 4.24 measured here (Table 1).
A 4-year-old SRF plantation of Italian alder established in Ireland that was also measured in July gave an LAI of 2.8 or 3.4 for a 2×2 m or a 1×1 m plant spacing respectively (Foreman, 2019). Other alder species such as common (or black) alder (Alnus glutinosa) and grey alder (Alnus incana) in Sweden had LAI values of 2.85 and 3.04, respectively – all comparable to the Italian alder LAI of 3.25 measured here (Table 1). A study of SRF planting density trials in Ireland found that above-ground biomass growth was similar for Italian alder compared to Sitka spruce (Foreman, 2019), which also aligns well with our observations.
3.3 BVOC emissions from tree branches
3.3.1 Italian alder
Italian alder (Alnus cordata) emitted very low amounts of isoprene, ranging between <0.0005–0.035 (standardised 0.017–0.037 ) depending on season (Table 4), comparable with previous standardised emission rates reported as <0.1–3 (0.09–2.64 ) (Calfapietra et al., 2009). The equivalent median and interquartile ranges for the data collected during this study can be found in Table S4 in the Supplement.
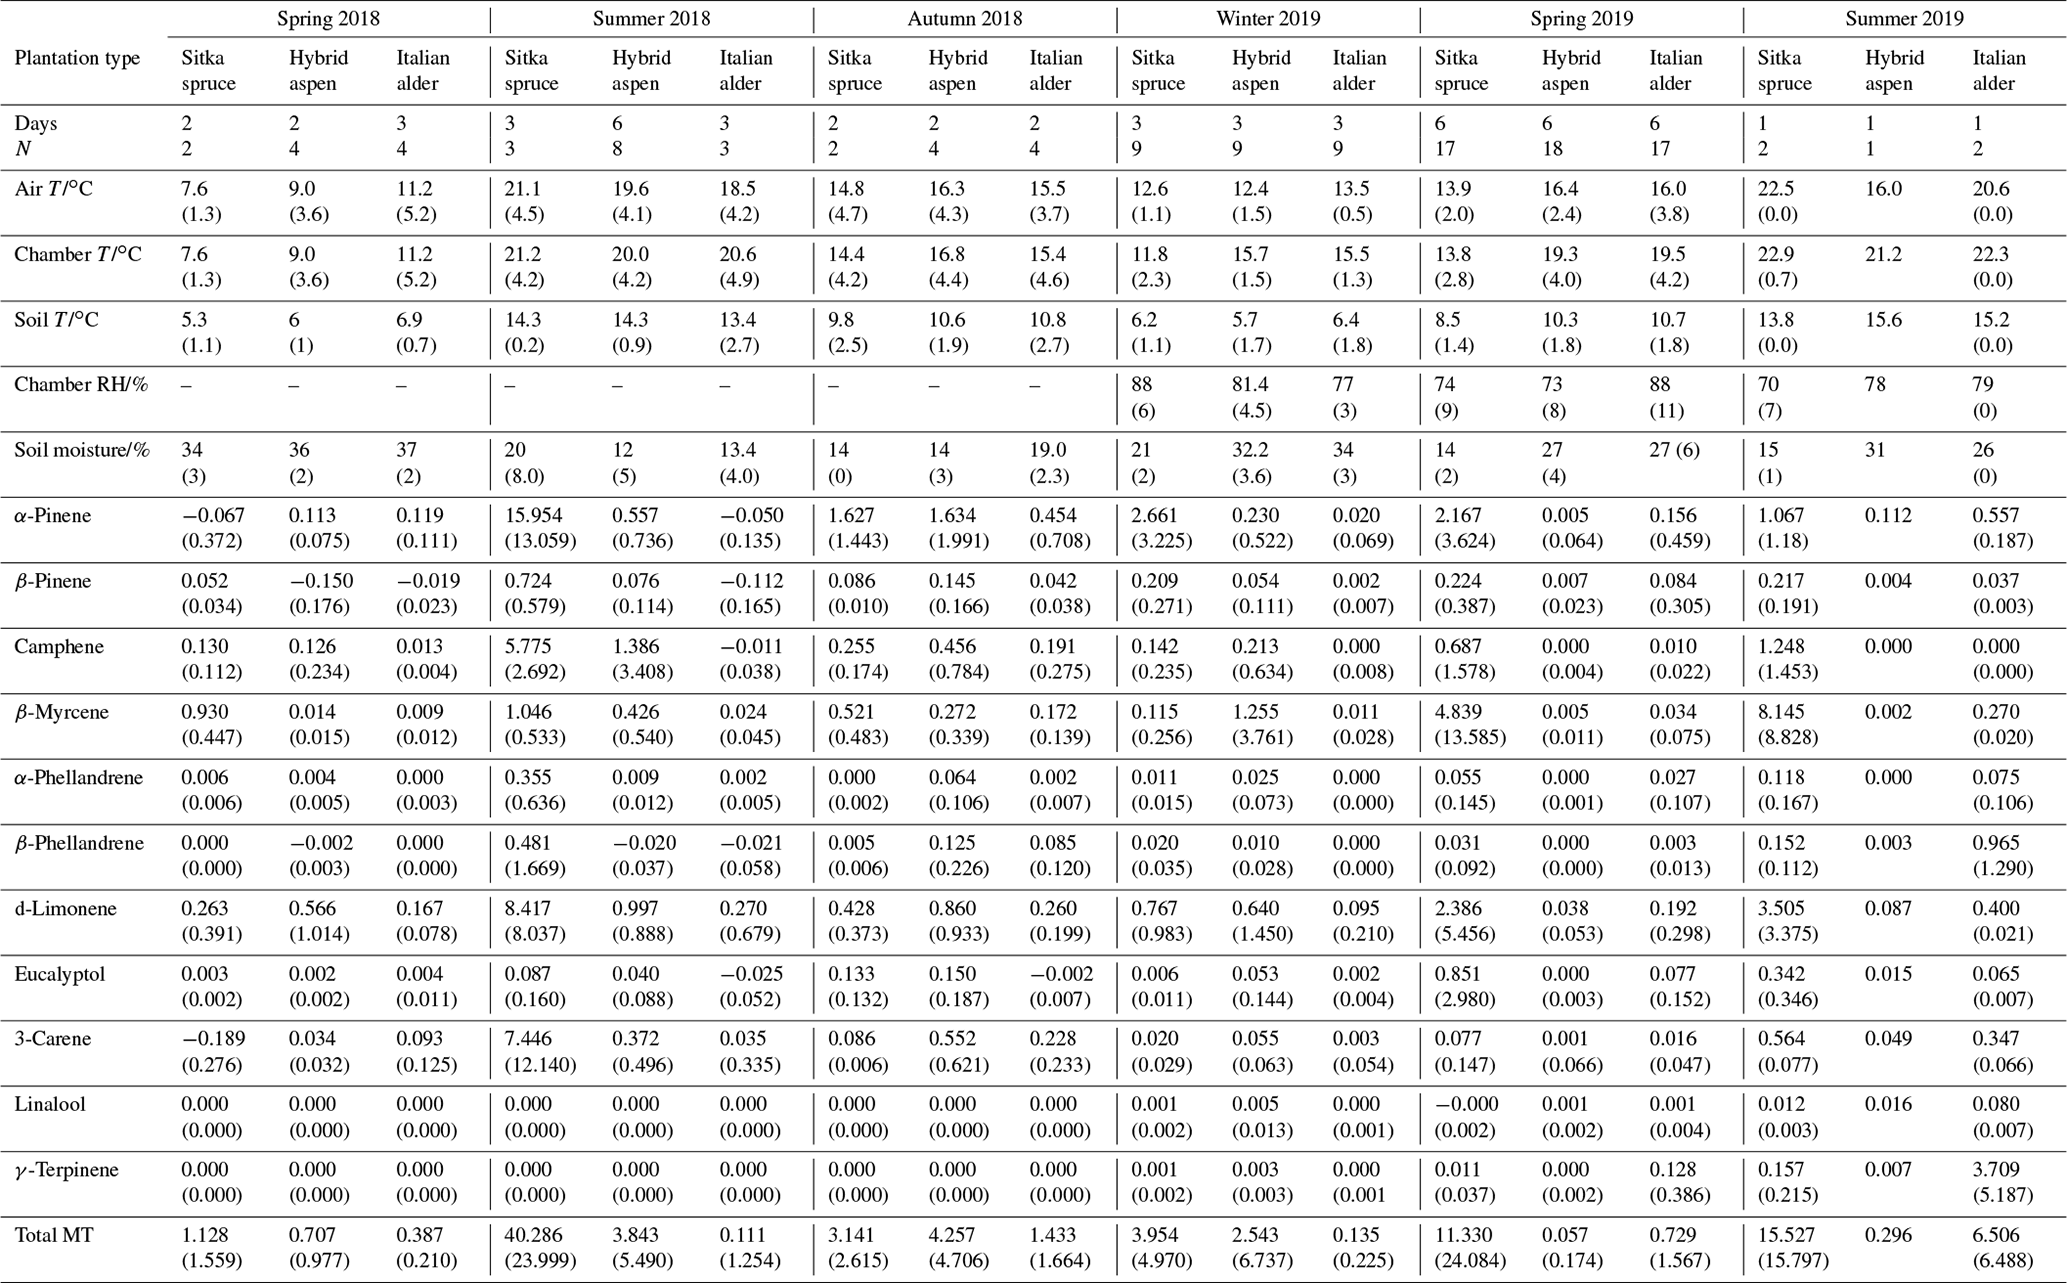
Table 4Mean seasonal BVOC emissions () from branches of Sitka spruce, hybrid aspen and Italian alder in SRF plantations, East Grange, Fife, Scotland. Figures in parentheses are standard deviations.
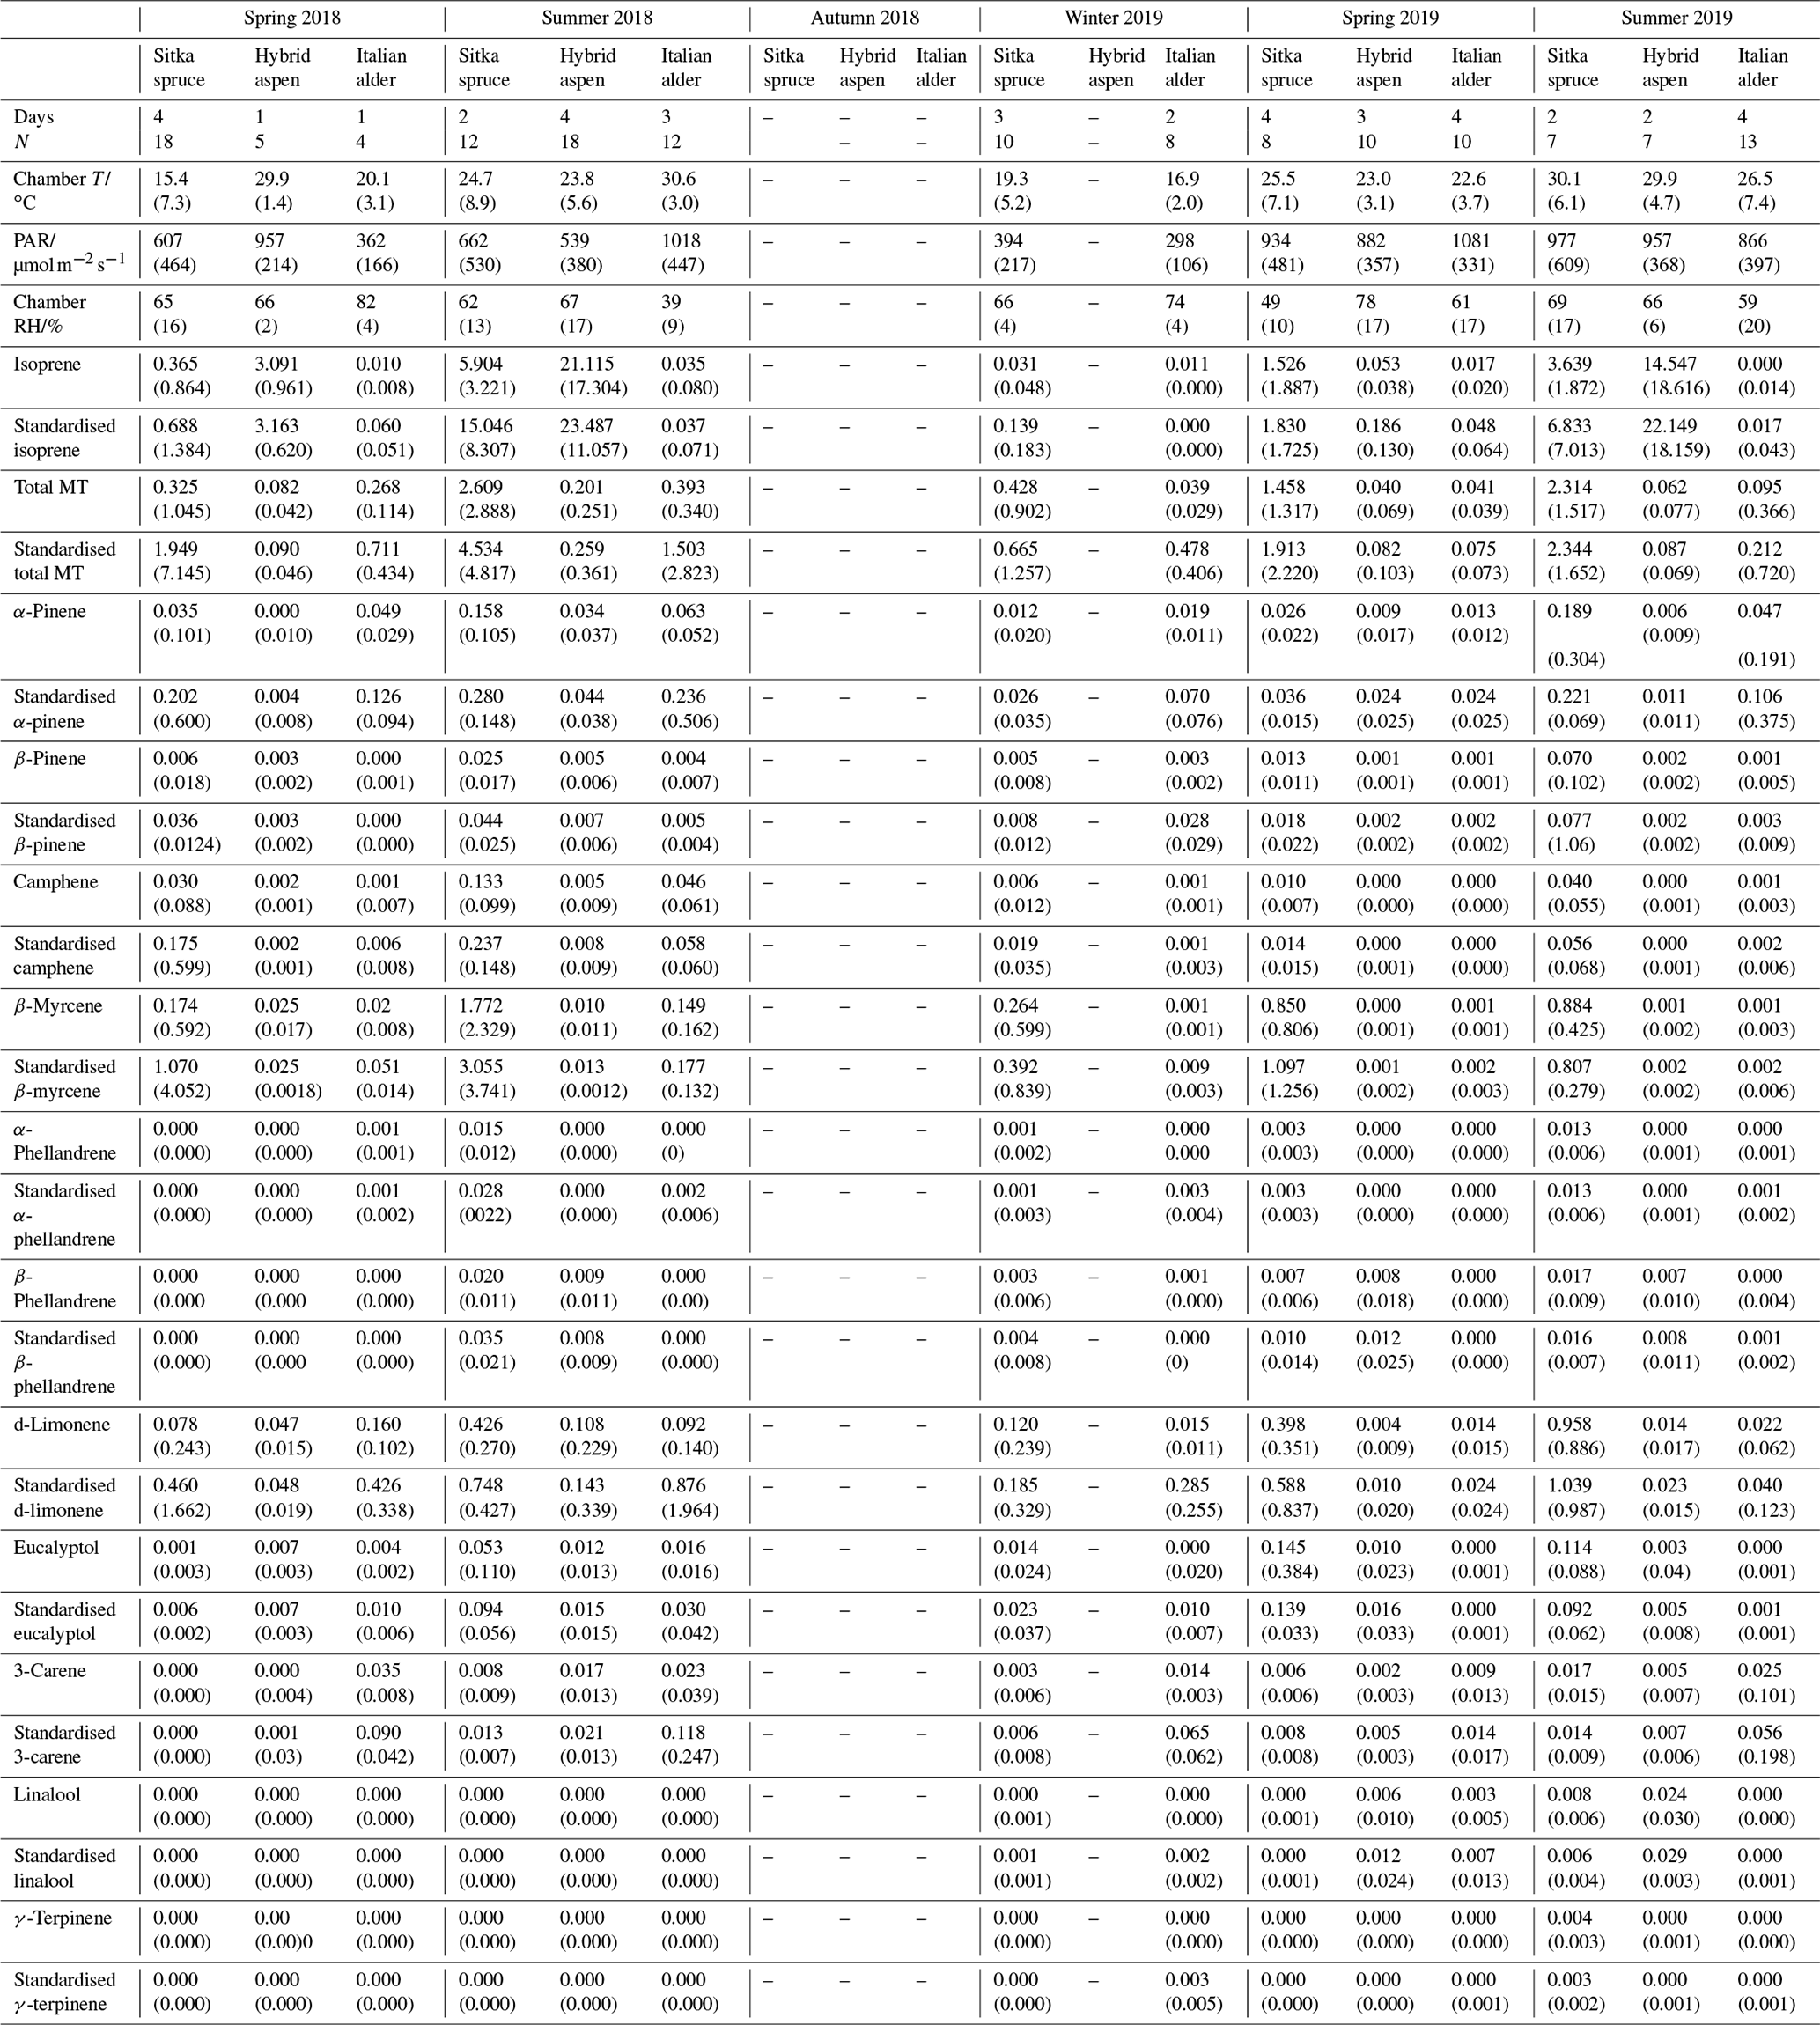
Values shown as . “–” indicates not measured; MT: monoterpene.
Mean measured emissions for total monoterpene ranged between 0.041–0.393 (standardised 0.073–1.5), with higher emission rates during spring and summer 2018 than in 2019. The major monoterpenes emitted were d-limonene, α-pinene, β-myrcene and β-pinene, which were consistently emitted through the spring and summer (Fig. 1). No previous data for total or speciated monoterpene emission rates from Italian alder could be found in the literature. However, other alder species have also been reported to be low emitters of monoterpenes and to emit slightly more monoterpenes than isoprene. Studies that report similar low levels of total monoterpene standardised emissions from alder include 0.8 from grey alder (Hakola et al., 1999), 0.13 from black (or common) alder (Aydin et al., 2014) and 1–2 from green alder (Alnus rugosa) (Isebrands et al., 1999). For speciated emissions, 3-carene, β-phellandrene, β-ocimene, p-cymene and sabinene have also been reported to be emitted from Alder spp. (Aydin et al., 2014; Copolovici et al., 2014; Hakola et al., 1999; Huber et al., 2000). Emissions of some monoterpenes such as β-myrcene are suggested to be induced by herbivory by aphids (Blande et al., 2010). However, since no data on the composition of monoterpenes under laboratory studies in the absence of herbivory are available for Italian alder, it is difficult to know which, if any, of the monoterpenes measured in our field study may have been induced by previous herbivory.
3.3.2 Hybrid aspen
Measured isoprene emissions from hybrid aspen ranged from 0.053 to 21 (standardised 0.19–23 ) (Table 4). No measurements were made during autumn senescence or in winter on the bare branches. Measured emissions were lower in spring for the newly emerged leaves compared to summer (Fig. 1). As noted in Sect. 3.1, the onset of spring at the field site was earlier in 2018 compared to 2019. European aspen (Populus tremula) measured in late spring (May) 2 weeks after bud burst has also previously been reported to have a lower emission rate than in summer (Hakola et al., 1998). Isoprene emission rates made on leaves (not branches) on aspen in spring in the boreal forest were also reported to be a third of the emission rate measured in the middle of summer (Fuentes et al., 1999). In our study, the hybrid aspen plantation showed signs of stress thought to be associated with lower rainfall and soil moisture locally during summer 2018, causing a yellowing of leaves and early leaf shedding in July. It is widely accepted that isoprene emissions increase with increases in temperature and PAR (Guenther et al., 1991; Monson and Fall, 1989) but that under stress during drought isoprene can be emitted at much higher rates than usual, only to eventually decline as resources are depleted in the leaves (Brilli et al., 2007; Seco et al., 2015). However, standardised isoprene emissions measured during this study on green aspen leaves did not differ between the two years, 2018 (23) and 2019 (22 ), despite the signs of stress in 2018 noted above. The standardised isoprene emissions for hybrid aspen reported here were much lower than those previously reported for European aspen, 51 (i.e. 45 ) (Hakola et al., 1998).
Total monoterpene emissions measured for hybrid aspen ranged from 0.040–0.20 (standardised 0.082–0.259 ), with substantially higher emissions occurring in summer 2018 (Table 4, Fig. 1). Increased emissions for some monoterpenes have been shown to be predominately driven by increases in temperature (Guenther et al., 1991). In particular d-limonene, the major monoterpene emitted here, was found to correlate with an increase in temperature, comparable to elevated temperature experiments for European aspen (Hartikainen et al., 2009). However, total monoterpene emission rates were an order of magnitude lower in summer during our study, which is closer to the findings of Brilli et al. (2014) from a SRC plantation of poplar and in contrast to the 4.6 (4.1 ) reported for European aspen by Hakola et al. (1998). d-Limonene, α-pinene, carene and β-phellandrene collectively accounted for 50 %–95 % of the total measured monoterpene emissions, although the composition for different days was highly variable (Fig. 1). Emissions of α-phellandrene peaked at 27 % of total monoterpenes measured in April when catkins were present but were otherwise <13 % (except on 6 June 2018).
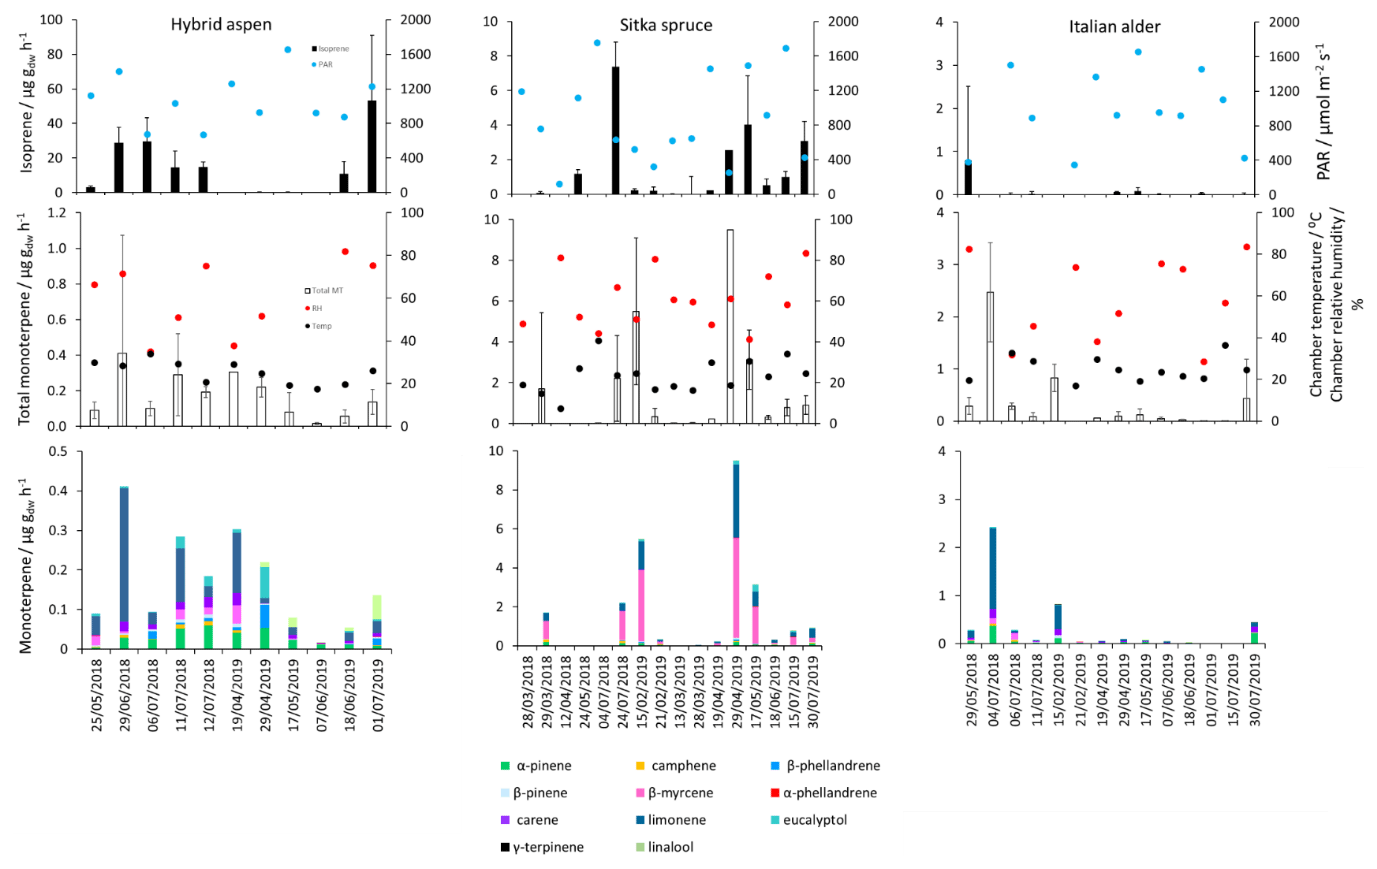
Figure 1Mean isoprene, total monoterpene and speciated standardised monoterpene emissions from branches of hybrid aspen, Italian alder and Sitka spruce trees in SRF plantations at the East Grange site, Fife, between March 2018 and July 2019. Error bars show standard deviation of all measurements made on a given day. Blue, red and black circles show mean PAR, chamber relative humidity and temperature, respectively. Note that emission scales differ between tree species.
Previously studies on European aspen report monoterpene emissions of 3-carene, limonene, α-pinene, trans-ocimene, eucalyptol, β-myrcene, and sabinene (Aydin et al., 2014; Hakola et al., 1998; Hartikainen et al., 2009) and on hybrid aspen (Populus tremula–Populus tremuloides) report α-pinene, β-pinene and β-ocimene, (Blande et al., 2007), although differences between clones were noted.
3.3.3 Sitka spruce
Mean measured isoprene emissions from Sitka spruce ranged from 0.031 (standardised 0.14) in winter to 5.9 (standardised 15.0 ) in summer (Table 4), which are comparable to the range of previously reported emissions from UK field measurements, 0.005–1.48 (standardised 0.88–14.1 ) (Street et al., 1996). Standardised isoprene emissions were lower in spring than summer during both years in our study (Fig. 1). Standardised isoprene emissions in summer 2018 (15.0) were more than twice those in summer 2019 (6.8 ), likely reflective of the wetter and cooler conditions in 2019. However, laboratory measurements using trees acclimatised at a constant laboratory temperature of 20 ∘C and PAR of 1000 for a week prior to sampling showed emission rates similar to summer 2018 emission rates, 13.4 (11.8 ) (Hayward et al., 2004). The measured isoprene emissions in our study declined dramatically at higher chamber temperatures, > 31 ∘C, despite the high PAR levels. An optimum of 33 ∘C for isoprene emissions from Sitka spruce was noted by Street et al. (1996), although a higher optimum of 39 ∘C was suggested by Hayward et al. (2004) based on a laboratory study. We therefore suggest that Sitka spruce trees acclimatised under field conditions in Scotland with variable day and night temperatures and light levels may have a lower optimum temperature than observed under laboratory conditions. The previous suggestion that Sitka spruce reaches maximum emissions of isoprene at a low level of PAR of 300 (Hayward et al., 2004) was difficult to confirm under field conditions as high PAR values were correlated with high temperatures (Fig. 2). However, it is worth noting that the majority of field emissions collected by Street et al. (1996) align well with the emissions measured at lower PAR and temperature in this study (Fig. 2).
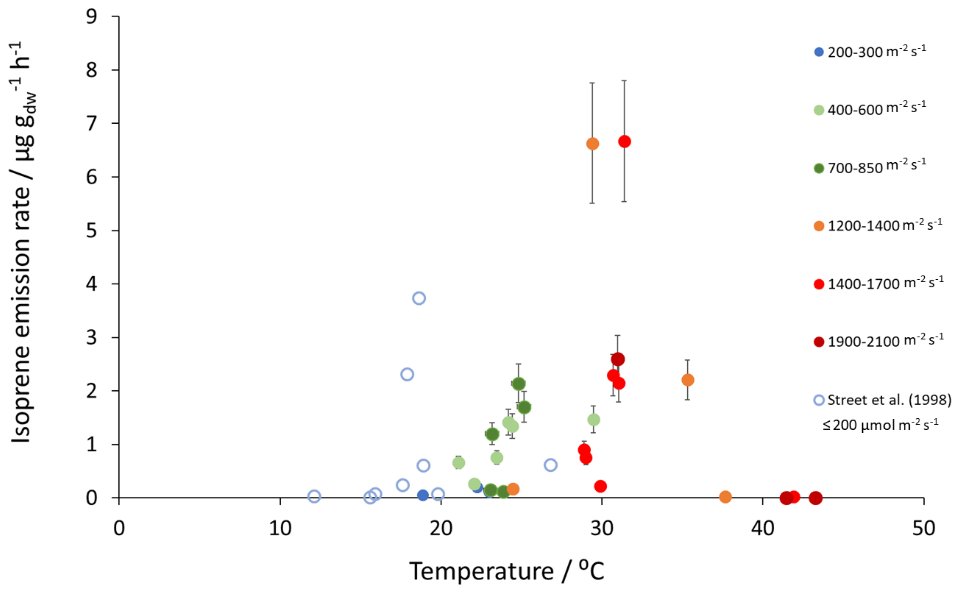
Figure 2Measured isoprene emissions as a function of PAR and temperature for Sitka spruce at the East Grange SRF site and from Street et al. (1996) at PAR≤200 .
Total monoterpene emissions measured from Sitka spruce peaked on the 29 April 2019 (9.5 ), coinciding with the new shoot extension growth on the branches (Fig. 1). Monoterpene emissions have shown to be present in spring in advance of isoprene emissions for Norway spruce (Picea abies) (Hakola et al., 2003). Overall, monoterpene emissions were generally higher in summer than in spring (Table 4). Total monoterpene emissions were still higher in 2018 (standardised 4.5) than in 2019 (2.3 ) even once standardised to 30 ∘C, which could indicate an increased release of monoterpenes in response to the drier warmer conditions. The total monoterpene emissions in 2019 are comparable to the previously reported total monoterpene emission of 3.0 (2.6 ) from a laboratory study (Hayward et al., 2004). Monoterpene emissions from Sitka spruce comprised predominately of β-myrcene, d-limonene, α-pinene and eucalyptol, collectively accounting for 83 %–97 % of total monoterpenes across all measurement days (Fig. 1).
β-Myrcene was the most abundant, consistent with the findings of Geron et al. (2000), and has been reported to be highest during spring in leaf oils, associated with new growth in this species, only to decline later in the growing season (Hrutfiord et al., 1974), but this was not evident during our study. d-Limonene emission rates reported during our study are comparable in size to Hayward et al. (2004), although it is not the dominant monoterpene as previously reported. Furthermore, other studies have also reported limonene to be present in smaller quantities than α-pinene and β-myrcene (Beverland et al., 1996; Hrutfiord et al., 1974). Monoterpene composition was generally consistent between measurements throughout our study even though different branches and trees were measured. This may reflect that the trees grown via vegetative propagation could be from a genetically similar source. However, the variability between the previous literature discussed here may point towards the potential for different chemotypes within Sitka spruce, as suggested by Forrest (2011) and similar to that of Norway spruce (Hakola et al., 2017) and Scots pine (Bäck et al., 2012). Norway spruce has also been found to be a significant emitter of sesquiterpenes (Hakola et al., 2017). Given the dominance of Sitka spruce plantations in the UK (and Ireland), the potential for variation within this species and the limited literature data on BVOC emissions, we suggest further measurements are needed at the branch and canopy level to fully assess the terpenoid species composition and their subsequent impact on air quality.
3.4 BVOC emissions from the forest floor
The forest floor has been reported as both a source of BVOCs (Asensio et al., 2007a, 2007b; Bourtsoukidis et al., 2018; Greenberg et al., 2012; Hayward et al., 2001; Insam and Seewald, 2010; Janson, 1993; Leff and Fierer, 2008; Mäki et al., 2019a; Peñuelas et al., 2014) and a sink, particularly for isoprene (Cleveland and Yavitt, 1997, 1998; Owen et al., 2007; Trowbridge et al., 2020). Leaf litter is a known source of forest floor BVOCs (Gray et al., 2010; Greenberg et al., 2012; Isidorov and Jdanova, 2012). Data discussed here are the net flux of the opposing processes of source and sink. Monoterpene emissions from the forest floor (Hayward et al., 2001) have previously been standardised using G93 (Eq. 3) on the assumption that air temperature is the main driver of emissions of monoterpenes. However, these algorithms are based on empirical data and were not designed to normalise negative emissions (uptake). In addition, what drives the sources and sinks of the forest floor is often more complex; and although some models have been developed from laboratory or field studies for litter, soils and the forest floor (Greenberg et al., 2012; Mäki et al., 2017, 2019b), the models may be difficult to apply outside of the studies in which they were developed. A process-based model applicable to a range of forest floor types is still lacking (Tang et al., 2019). We therefore did not standardise the BVOC emissions from the forest floor and present only measured fluxes in this section.
The total monoterpene emissions from the forest floor were highly variable between the three chambers within the plots as demonstrated by a relative standard deviation range of 35 % to 170 % for a given day, illustrating the highly heterogeneous soil and litter environment. All chamber measurements made on the same day were averaged per species, presented as a single flux value (Fig. 3) and then grouped according to season and year (Table 5).
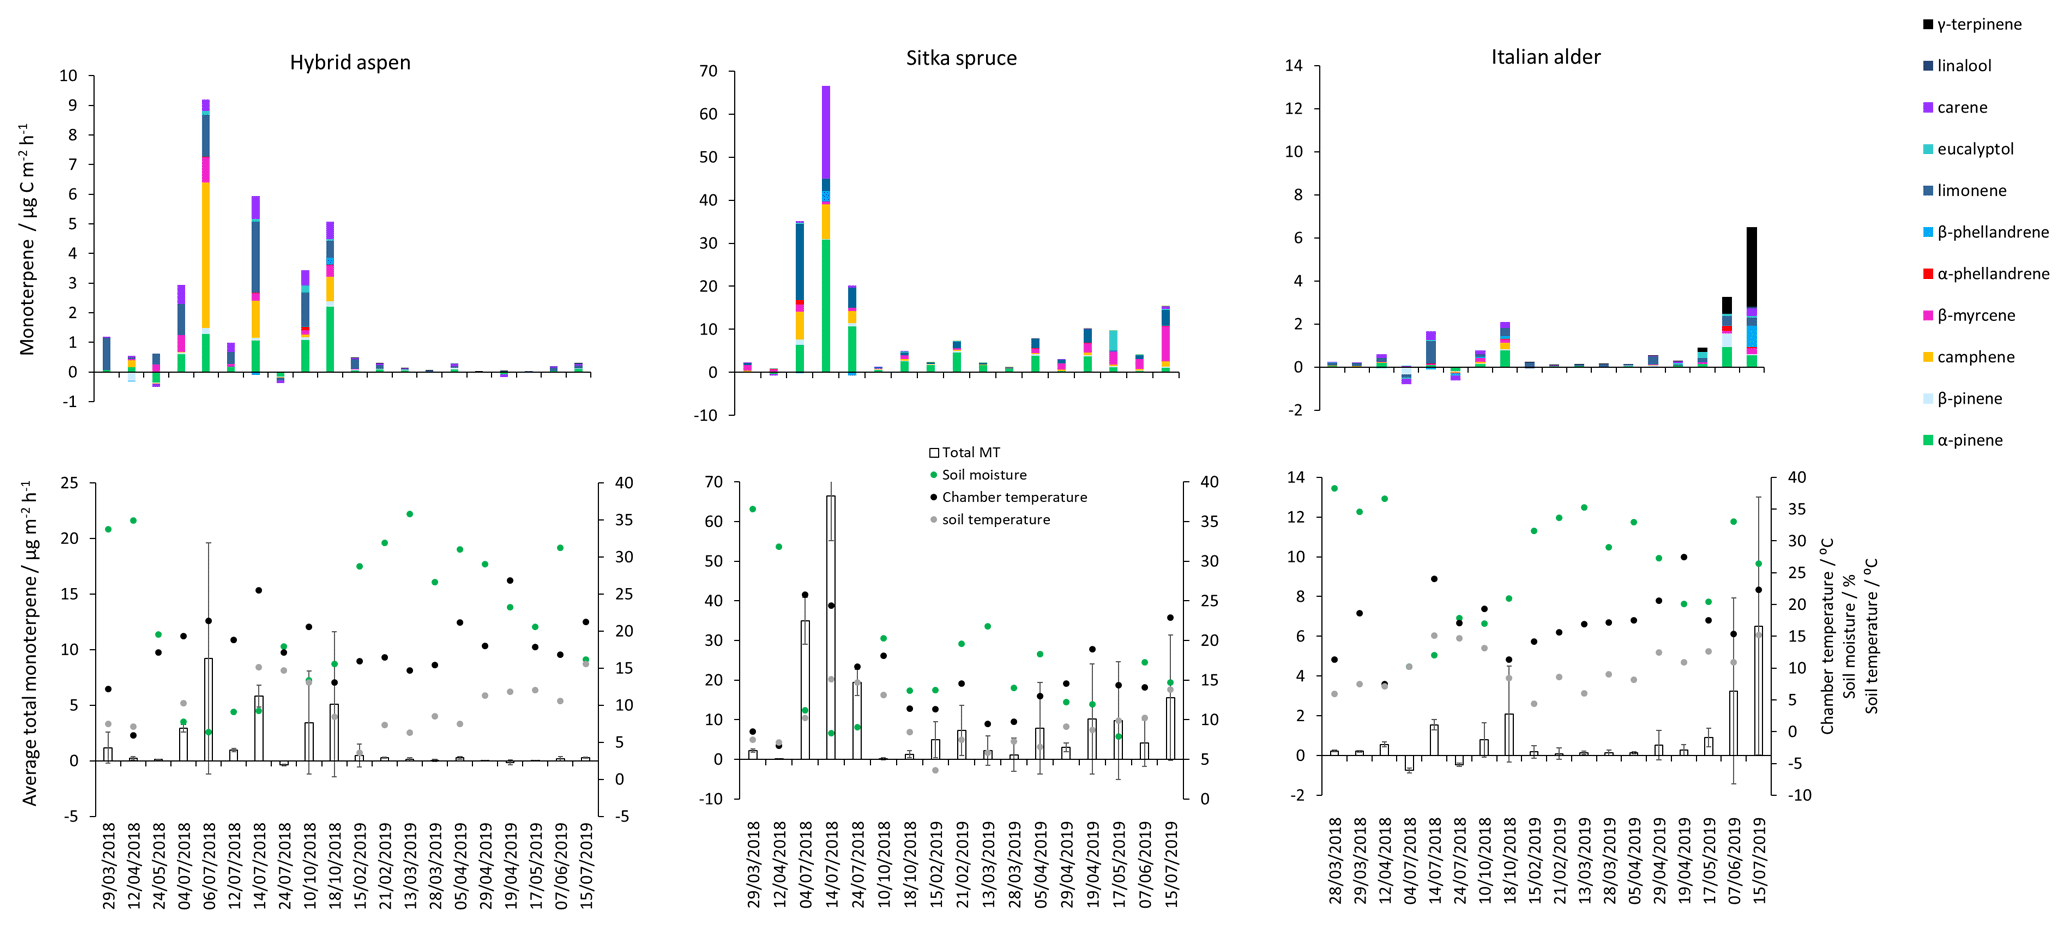
Figure 3Daily mean measured forest floor total monoterpene emissions from Sitka spruce, hybrid aspen and Italian alder SRF plots at East Grange, Fife, during 2018–2019. Error bars represent the standard deviation of three forest floor chamber measurements. Green circles are volumetric soil moisture (%), black circles are chamber temperature (∘C) and grey circles are soil temperature (∘C). Note that emission scales differ between tree species plots.
Table 5Seasonal variation in forest floor emissions () of monoterpenes from Sitka spruce, hybrid aspen and Italian alder SRF plots, at East Grange, Fife, Scotland, in 2018–19.
T: temperature; N: number of measurements; “–” indicates not measured; RH: relative humidity; ; MT: monoterpene.
3.4.1 Italian alder
Negative fluxes for total monoterpenes were measured on two occasions, 4 July and 24 July. The highest total monoterpene emissions were observed on 18 October 2018 (18) and 7 June 2019 (24 ) (Fig. 3). Day-to-day variations were associated to some degree with changes in chamber temperature and soil moisture (Fig. 3). Seasonal variations in mean emissions were also apparent (Table 5). The forest floor acted as a sink for monoterpenes during summer 2018 when there was bare soil inside the collars. During summer 2019 vegetation grew inside the soil collars and resulted in the forest floor being a more substantial source of monoterpenes (Fig. 4). Monoterpene composition reflected the seasonal changes that occurred on the forest floor. The monoterpenes emitted in autumn (October 2018) were dominated by d-limonene, α-pinene, 3-carene and some β-myrcene, consistent with the composition of Italian alder foliage and attributed to the accumulation of leaf litter. However, the profile in June 2019 during the highest total monoterpene emissions showed significant emissions of γ-terpinene and α-phellandrene and likely reflects the changing understorey vegetation, hogweed species, growing inside the chamber collars and which was only present in the alder plantations. The particular species at East Grange was not identified, but Heracleum mantegazzianum (giant hogweed) has been determined to be a substantial γ-terpinene emitter (Matoušková et al., 2019). This highlights the importance of the specific understorey vegetation to the overall monoterpene flux composition.
3.4.2 Hybrid aspen
The highest measured total monoterpene emissions, 9.18 and 5.83 , occurred in July 2018 and were associated with the lowest soil moisture and warm temperatures. In contrast, negative monoterpene emissions were also observed in July (24th) and seem to be associated with an increase in soil moisture (Fig. 3). Overall spring (0.30) and summer (0.06 ) total monoterpene emission rates in 2019 (Table 5) were smaller by an order of magnitude than in spring (0.71) and summer (3.84 ) 2018. Higher rainfall during 2019 (S1) resulted in increased soil moisture (Fig. 3), which may have suppressed some monoterpene emissions (Asensio et al., 2007b). In addition, during 2018, litterfall started in July and peaked in October, by which time the canopy had lost all its leaves.
The composition of the monoterpene emissions from the forest floor during 2018 was similar to those measured from the branch chambers (Fig. 1) and was consistent between days. The main monoterpenes comprised α-pinene, β-pinene, camphene, d-limonene and 3-carene. The contribution from the floor of an aspen plantation has not previously been investigated, although soils taken from underneath aspen (Populus tremula) trees showed d-limonene as the predominant monoterpene, with a maximum emission of 15.9 under laboratory conditions (Owen et al., 2007). Quantifiable emissions of monoterpene from the leaf litter of American aspen (Populus tremuloides) exist (Gray et al., 2010), although they are not chemically speciated
3.4.3 Sitka spruce
Total monoterpene emissions measured from the Sitka spruce forest floor peaked during July 2018 (66.5 ) and coincided with the highest chamber temperatures and the lowest soil moisture readings (Fig. 3). The lowest measured emissions (0.03 ) were observed on 12 April 2018 when the temperature was lowest (7.5 ∘C, Fig. 3), suggesting soil moisture and temperature are likely interacting controlling variables of monoterpene emissions. In addition, there were clear seasonal differences when measurement days were grouped. Mean measured summertime emissions of total monoterpenes from the forest floor in 2018 were larger than those measured in 2019 (Table 5). Temperatures measured in the chambers were 3 ∘C degrees higher on average during 2018 compared to 2019, which could have contributed to the higher observed emissions, although soil moisture at 7 cm depth was not significantly different. The young Sitka spruce plantation had litter present all year round unlike in the deciduous species plantations, but the covering was sparse (Fig. 4) compared to a mature plantation. Total monoterpene emissions measured in summer 2018 (40.3 ) were slightly higher but similar in magnitude to the 33.6 (29.6 ) previously reported for the upper-most layers of the floor in a mature Sitka spruce plantation (Hayward et al., 2001). Norway spruce plantation have also been reported to have a slightly higher emission rate at 50 (Janson et al., 1999).
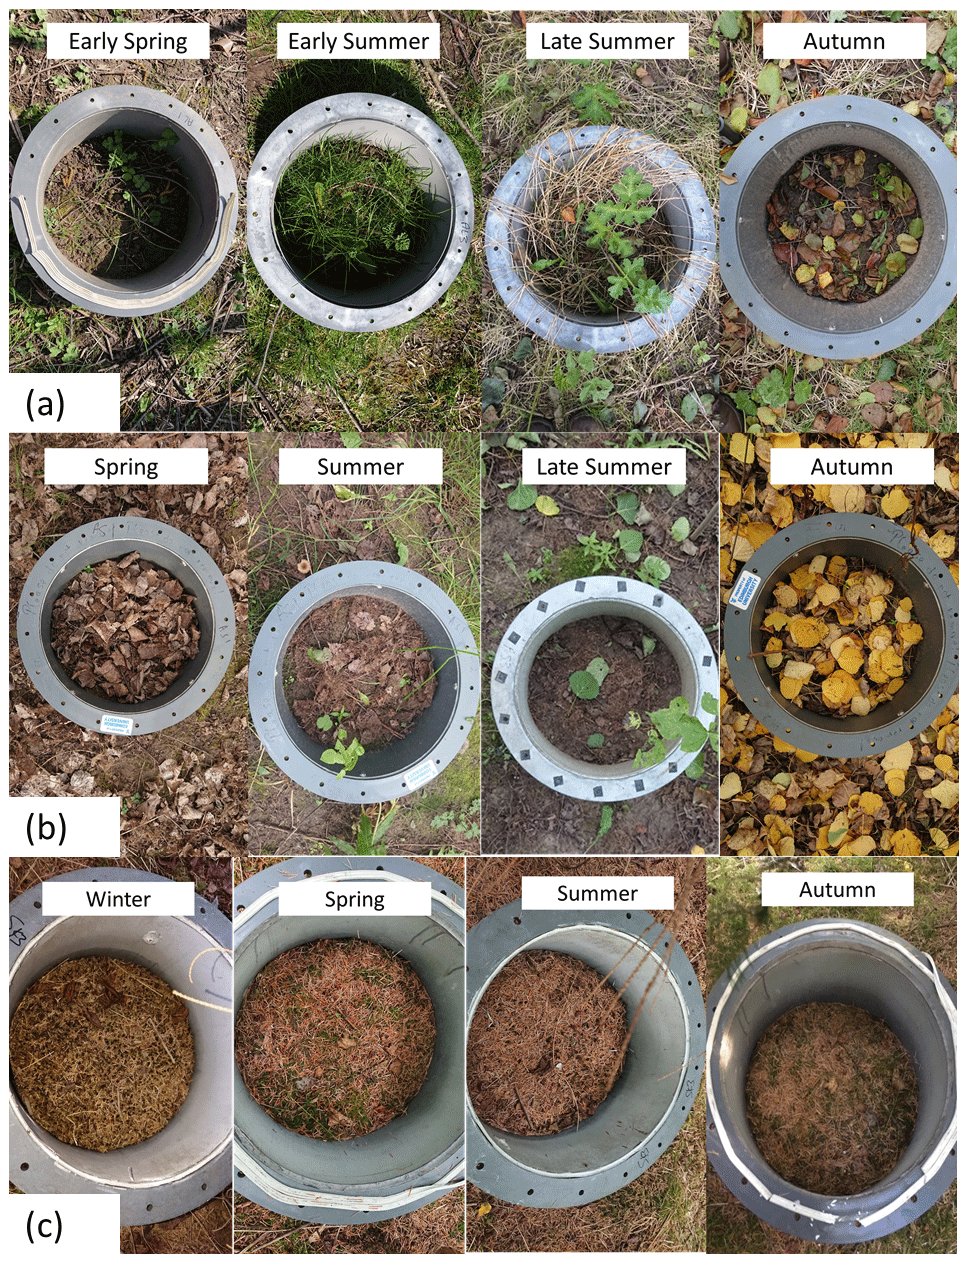
Figure 4Changes in the presence of leaf litter, herbaceous plants and grasses inside the forest floor chambers of (a) Italian alder (b) hybrid aspen and (c) Sitka spruce SRF plots at East Grange, Fife, during 2019.
The monoterpene composition profile in 2018 was comparable to 2019 and consistent with the branch emissions recorded during our study, with the major emitted monoterpenes being β-myrcene, α-pinene, β-pinene, d-limonene and camphene. β-Myrcene accounted for a larger percentage, 20 %–50 %, of emissions in summer 2019 compared to only 5 %–10 % in summer 2018 (Table 5), although there is no obvious explanation for this difference.
3.5 Plantation-scale isoprene and total monoterpene emissions
3.5.1 Relative contribution of forest floor and canopy emissions
Forest floor and branch emissions were sometimes measured on the same occasion, enabling calculation of the contribution of each source to the total monoterpene emissions of the plantation per square metre of ground (based on non-standardised data) (Fig. 5). In most cases, particularly in summer, emissions from the canopy dominated. For Sitka spruce, high monoterpene emissions from the plantation occurred when canopy emissions were high, which supports previous summertime observations on conifer species that the forest floor contributes little to the overall forest monoterpene emissions (Hayward et al., 2001; Janson, 1993). We found that in some instances, more often in spring when canopy foliage was sparse (alder and aspen) or dormant due to cold temperatures (spruce), the forest floor contributed the majority of the plantation monoterpene emissions. This trend was also reported for conifer species in the boreal forest (Mäki et al., 2019b).
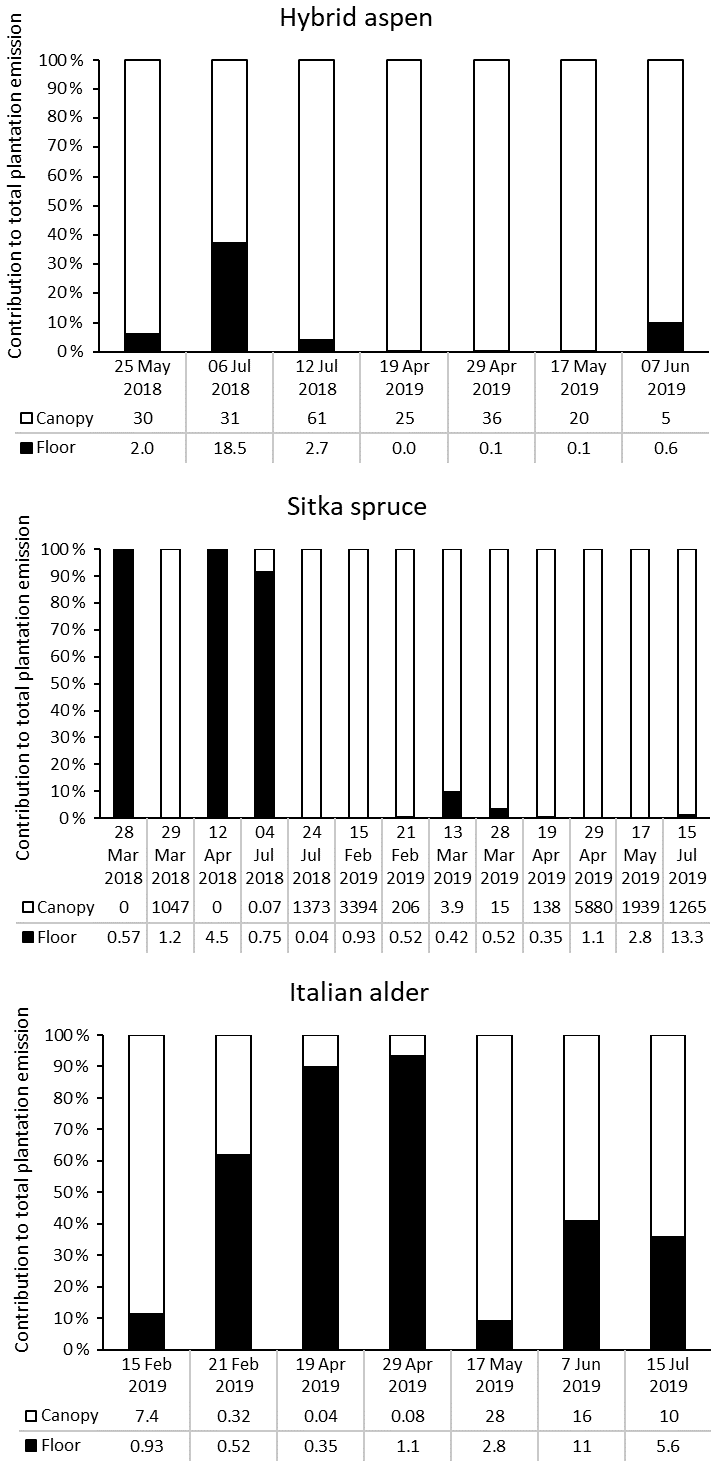
Figure 5Percentage contribution of canopy (white bar) and forest floor (black bar) emissions to the total monoterpene emissions from SRF plantations at East Grange, Fife, Scotland. Numbers below the bars are the total monoterpene emissions in .
For hybrid aspen the opposite was true, with the forest floor contributing more in the summer, as a result of understorey vegetation or early litter fall, contributing up to 40 % of the total monoterpene emissions of the plantation. In the Italian alder plantation the contribution was more mixed. Canopy emissions in late winter/early spring were only from the alder flowers (catkins). The low observed emissions at this time of year from the forest floor were likely caused by colder temperatures and high soil moisture. However, later in spring (April) monoterpene emissions came largely from the forest floor (90 %) as understorey vegetation began to grow and soil temperatures also increased. The canopy at this point was at the stage of leaf emergence when the foliage was sparse and so contributed little to the overall emissions. However, by summer just over half of the monoterpenes came from the canopy (now in full foliage), and the forest floor contributed around 40 % of the monoterpenes, related to the presence of understorey vegetation.
3.5.2 Modelled above-canopy fluxes
This section discusses modelled emissions of BVOC from the canopy per square metre of ground. The bottom-up approach of estimating BVOC emissions in this study using the chamber technique is useful for determining the contribution of different ecosystem components to BVOC emissions, but in this section emissions do not include modelled forest floor emissions. It is noted that forest floor processes are still being integrated into models in order to reliably capture the full complexity of the forest floor BVOC emissions for prediction purposes (Tang et al., 2019).
Mean standardised summertime emission factors for each tree species in Sect. 3.3 (derived using the simplified G93 algorithms) (Table 3) were adjusted on an hourly basis by the Pocket MEGAN 2.1 excel beta 3 calculator to derive hourly BVOC emissions per unit of ground area (Guenther et al., 2012). This allowed for a more advanced method of estimation of monthly and subsequent annual BVOC emissions from the canopy across two years (2018–2019) and two locations, East Grange (Scotland) and Alice Holt (England), for a given air temperature, PAR, and the influence of these parameters over the previous 24 and 240 h. In addition, changing LAI across the year (Table 2) had an influence on the biomass density of the canopy, which influenced the emission rate of BVOCs per unit area of ground. Similar to previous modelling studies (Ashworth et al., 2015; Zenone et al., 2016), standardised mean summertime measurements were used as the basis for this calculation.
Given the above, modelled mean diurnal canopy emissions of isoprene for hybrid aspen were calculated to be approximately 2, rising to a maximum of 7 in July, the warmest month, across both years (Fig. 6a). These modelled emissions for the UK are broadly comparable to those reported from measured eddy covariance flux measurements above a hardwood forest, comprising primarily of aspen (Populus tremuloides and Populus grandidentata, LAI: 3.24–3.75) in Michigan, USA, and the boreal forest in Canada (predominantly Populus tremuloides, LAI: 2.4), where the mean summertime emissions are reported to peak at 11 and 6.87 respectively (Fuentes et al., 1999; Pressley et al., 2006).
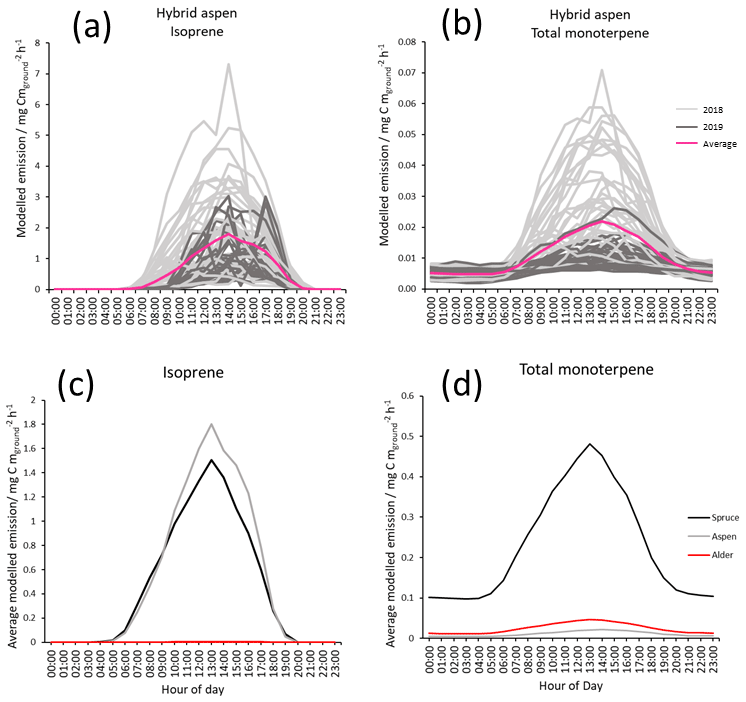
Figure 6Modelled diurnal canopy emissions for July using MEGAN 2.1 of (a) isoprene from hybrid aspen 2018 (light grey), 2019 (dark grey) and combined mean emission rate (pink); (b) total monoterpene hybrid aspen (light grey), 2019 (dark grey) and combined mean emission rate (pink); (c) mean modelled isoprene for three SRF species, spruce (Black), aspen (grey) and alder (red) for July 2018–2109; and (d) mean modelled total monoterpene for three SRF species, spruce (Black), aspen (grey) and alder (red) for July 2018–2109. Results used measured PAR, temperature and the mean summer branch emission potentials collected during this study (Table 3).
Mean total monoterpene emissions are 2 orders of magnitude smaller than isoprene (Fig. 6b) for hybrid aspen. Figure 6c and d highlight the difference in the relative magnitudes of emissions between the three SRF species. Mean emissions from the canopy of Italian alder for isoprene (0.002) and monoterpene (0.05 ) were very small, and no above-canopy measurements could be found in the literature for comparison. For Sitka spruce mean canopy-scale emissions for July in Scotland were modelled to be 1.5 and 0.5 for isoprene and total monoterpene respectively. There has only been one attempt in the UK to quantify BVOC directly above a Sitka spruce plantation (Beverland et al., 1996), where a relaxed eddy accumulation system was used and mean isoprene emissions were reported to be 0.146 in a 24 h period in early July (temperature range 7–19 ∘C). These emissions are much lower than our model estimates, although it was reported that there were analytical difficulties with the micrometeorological techniques and limited data which could account for this disparity.
3.5.3 Annual above-canopy fluxes per hectare for a UK planation
Table 6 shows the modelled annual BVOC emissions per hectare of plantation for each species for the two meteorological years (2018–2019) at East Grange in Scotland and for the contemporaneous meteorology experienced in southern England (at Alice Holt). The modelled annual fluxes of isoprene and total monoterpenes per hectare of Sitka spruce plantation averaged over the two contrasting years were roughly similar, at 13.8 and 15.7 , respectively. Hybrid aspen was modelled to emit only an average of 0.3 total monoterpene but much more isoprene (15.5 ), whereas the model estimated that Italian alder emitted minimal isoprene (0.02 on average) but larger monoterpene emissions of 0.81.
Table 6Modelled annual isoprene, total monoterpene and total BVOC emissions per hectare of SRF Sitka spruce, hybrid aspen and Italian alder plantations, using meteorology data from two locations, East Grange in east Scotland, and Alice Holt in south-east England.
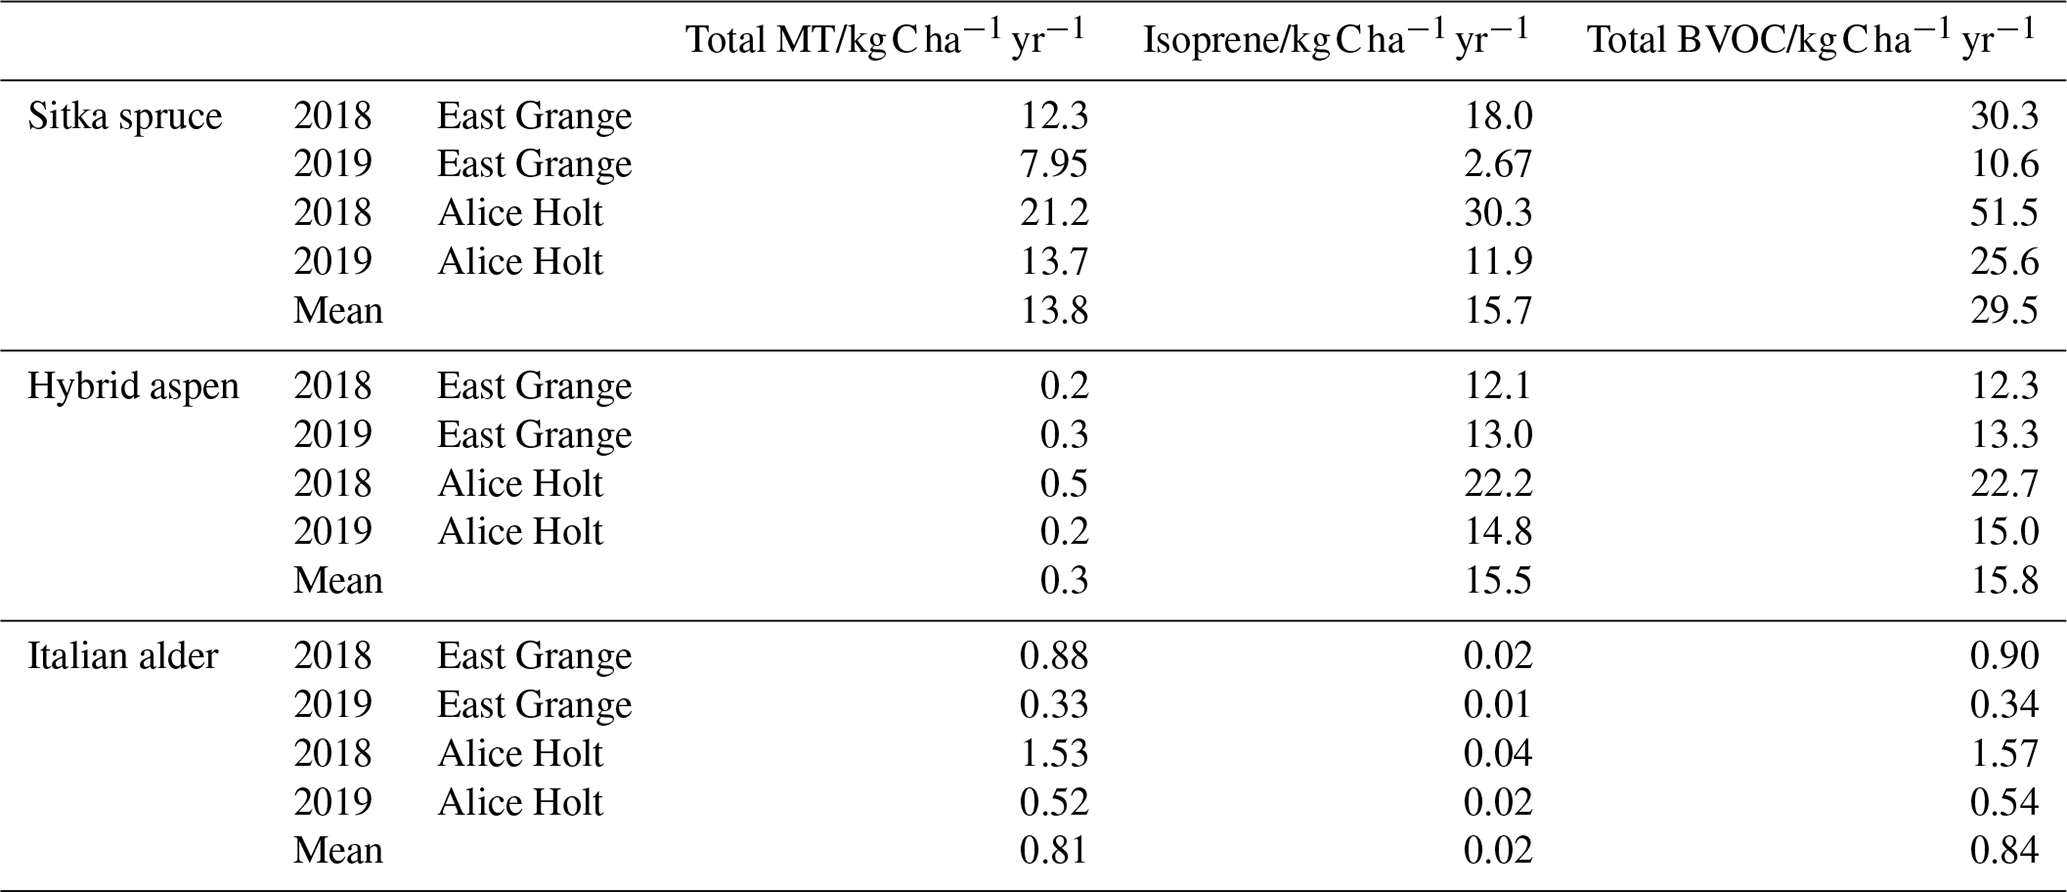
MT: monoterpene.
It is worth noting that use of an mean summer flux could lead to a potential overestimation of emissions during other seasons and the subsequent total annual flux. Modelled isoprene emissions from Sitka spruce during 2018 for both East Grange and Alice Holt were higher than monoterpene emissions. In 2019, however, monoterpene emissions were more abundant than isoprene emissions using the East Grange meteorology data and of the same magnitude using the Alice Holt meteorology data. The lower PAR during 2019, which was more pronounced for East Grange than Alice Holt, limited the isoprene emissions. Monoterpenes were less affected as these were only temperature driven. The relative proportions of isoprene and monoterpenes in the atmosphere are important since they have differing effects on the formation and concentration of atmospheric pollutants such as ozone and secondary organic aerosol (SOA) (Bonn et al., 2017; Heinritzi et al., 2020). Long-term BVOC emission measurement above Sitka spruce plantations is needed to confirm this model observation.
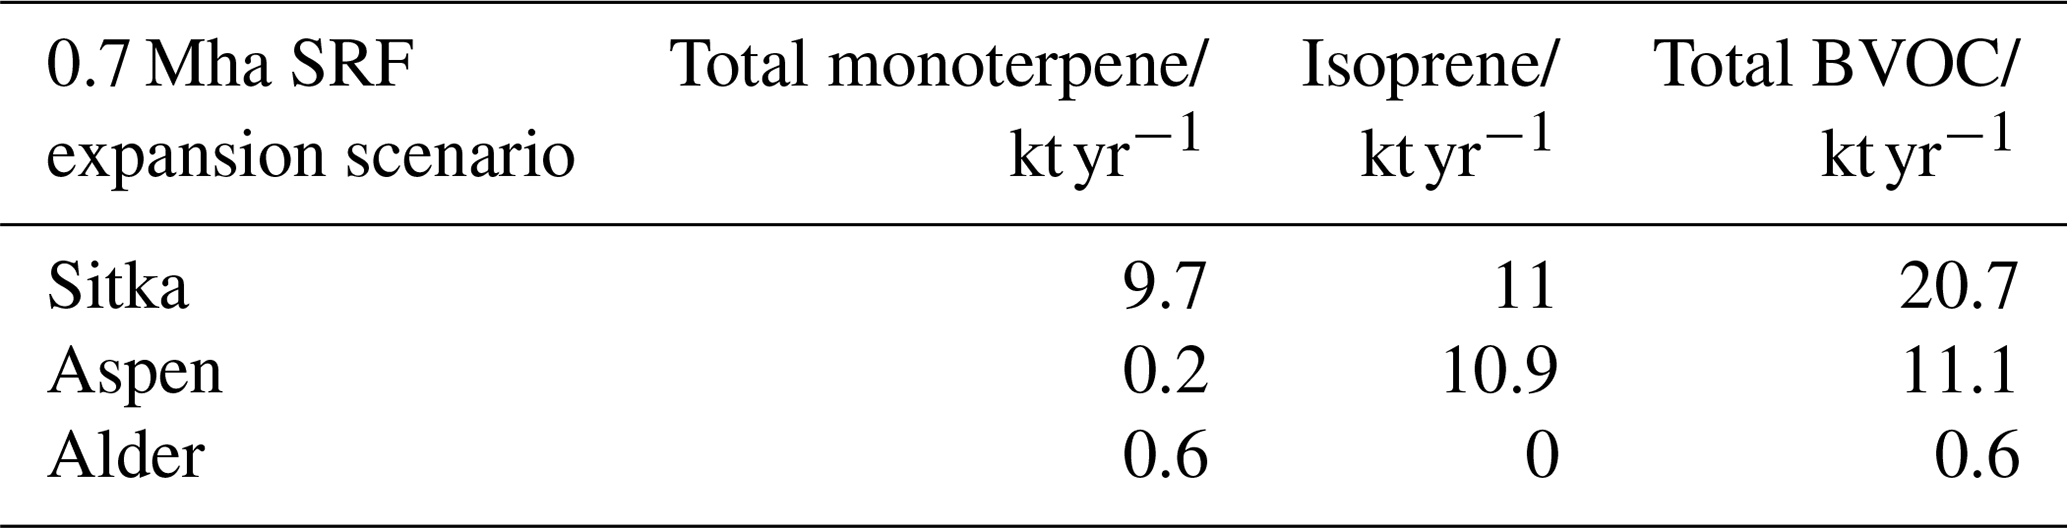
Table 7Modelled mean annual emissions from 0.7 Mha of SRF expansion.
3.6 Uncertainties in measured and modelled fluxes
There are several uncertainties and simplifications in our approach to scaling up from periodic branch chamber emission measurements to annual canopy-scale predictions. We suggest that uncertainties in the quantification of individual measurements of BVOC emissions are likely to be 16 %–17 % based on previous error propagation calculations (Purser et al., 2020). The nature of the chamber measurement technique is likely to have an impact upon the BVOC emissions due to the altered environmental conditions that may result. In addition, field-based measurements of emission rates, collected under natural conditions for the UK but far from standard conditions (PAR 1000 , temperature 30 ∘C), introduce an uncertainty when standardised to form emission potentials.
Table 8Potential increase in isoprene, total monoterpene and total BVOC emissions from an additional 0.7 Mha of SRF plantations compared to previous modelled estimates of total UK BVOC emissions.
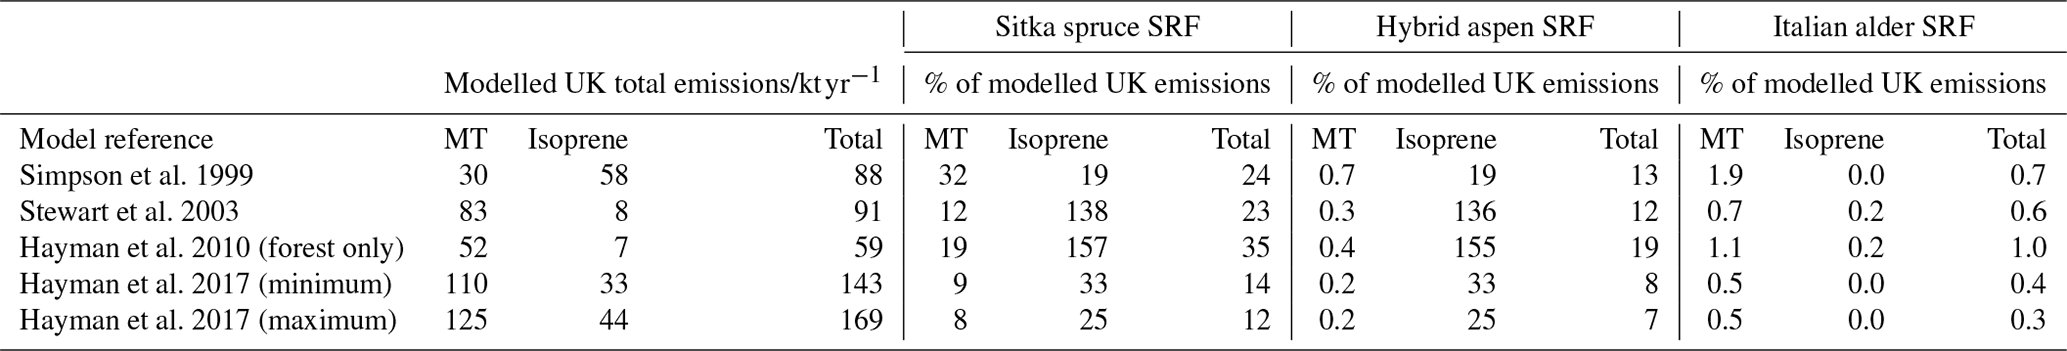
Values that are shown as 0.0 are <0.05 %; Hayman et al. (2017) (minimum) and (maximum) values are the upper and lower estimates of BVOC emissions published that account for yearly changes in meteorology in the model scenarios.
Further uncertainty may then come from extrapolating these emission potentials in models for the prediction of fluxes using measured meteorology for a given field site. The modelling undertaken here does not include parameters such as soil moisture, humidity and wind speed as no continuous data for these parameters were available, but it is noted these would further constrain the model estimate. In addition, there are uncertainties in collating data points to create seasonal means for each year, up to 25 %–50 % based on the relative standard deviation in this case. Converting from emissions per leaf mass to per leaf area also adds uncertainty since leaf mass area data is highly variable and dependent upon the tree species and sample location. However, we collected LMA data from a range of studies in areas close to the UK with a similar climate (Table 1), and the LMA uncertainty associated ranges from 16 % to 24 % RSD dependent upon tree species. The emissions predicted from the canopy are also lacking the influence of processes such as BVOC uptake by the forest floor, deposition to leaf surfaces and the influence of reactions with other atmospheric chemical species such as hydroxyl, ozone and nitrogen oxides.
Emissions in early spring measured in the chambers from flowers (catkins) were not included in this scale-up exercise since only emission rates from foliage were used in the model. It is noted that these floral emissions may contribute significantly to spring time BVOC emissions across a 2- or 3-week time period (Baghi et al., 2012) but become less significant relative to the yearly contribution. It should be noted that BVOC emissions are predicted by the model in winter for Sitka spruce, which maintains its canopy all year. However, this may be an over-prediction of the emissions as, on some occasions, demonstrated by our chamber measurements, winter BVOC emission may be very low or absent from this species. Similarly, rain events have been shown to alter BVOC emissions and may have different effects in the short term (increasing) and the longer term (decreasing), which are also not accounted for in the model (Holzinger et al., 2006). These factors are likely to lead to an overestimation of emissions from all species but in particular Sitka spruce on a per annum basis.
Finally, algorithms used to scale up branch chamber emissions to canopy-level emissions have also been suggested to give variable results, with MEGAN 2.1 typically producing lower (but perhaps more realistic) flux estimates (Langford et al., 2017). This is an important consideration when comparing annual estimates to total UK BVOC emissions in Sect. 3.7, where older, more simplified algorithms may have been applied.
3.7 Assessing potential impact of SRF plantation expansion on UK BVOC emissions
The annual mean BVOC emissions data from Sect. 3.5.3 (Table 6) were used to explore the possible impact on total UK BVOC emissions arising from increased SRF planting under a suggested bioenergy expansion in the UK (see introduction). The following estimates assume all bioenergy expansion is SRF. However it is more likely that a combination of SRC, SRF and Miscanthus could be used in the UK for biomass, and as such these estimates should be treated as a single extreme-case scenario. Meteorological data from Alice Holt and East Grange were used for model simulations as stated in Sect. 3.5.2. Isoprene and monoterpene emissions are reported separately in Table 7 but also combined to give a total BVOC emission.
In the scenario of an expansion of 0.7 Mha of SRF, the total BVOC emissions from Sitka spruce SRF could equate to 20.7 kt yr−1. For Aspen it could potentially be 11.1, whilst for Italian alder it is much smaller at 0.6 kt yr−1. These potential increases in BVOC emissions are compared in Table 8 to current predicted annual emissions of BVOCs from vegetation in the UK. Several air quality models have been used to estimate the total isoprene and total monoterpene emissions from UK vegetation (AQEG, 2020), with an earlier model (Simpson et al., 1999) determining isoprene to be the dominant BVOC emission, whilst later models suggest monoterpenes dominate (Hayman et al., 2017, 2010; Stewart et al., 2003). The meteorological data used in some of these models are limited to a single year, e.g. 1998, where the uncertainty in the model estimates could range by a factor of 4 (Stewart et al., 2003), whilst others are the mean emissions across many years and so report a range (Hayman et al., 2017). In addition, models of UK BVOC emissions are particularly reliant upon the emission potential attributed to Sitka spruce, as this accounts for nearly 21 % of UK forest cover and, as discussed in Sect. 3.3.3, only a limited number of studies have been conducted on Sitka spruce BVOC emissions. This simple impact assessment used a limited set of meteorological data to represent two contrasting years (one warmer drier year and one cooler wetter year, relative to the 30-year mean) and for two ends of the British climate range of temperature and PAR: north (East Grange, Scotland) and south (Alice Holt, England).
However, given these uncertainties, simulations of the impact of potential future land–use changes on atmospheric BVOC emissions are important first steps to gain a better understanding of any potential future impacts on air quality.
It is worth noting that currently the UK has an estimated 3.2 Mha of woodland, of which 0.67 Mha is covered by Sitka spruce (Forest Research, 2020) (similar in size to the future planting scenario used here), a small area of alder (0.053 Mha, Forestry Commission, 2012) and even smaller area of aspen. Comparing the total BVOC emissions for a 0.7 Mha SRF expansion scenario to the annual total BVOC emissions for the UK suggests that the Sitka spruce and hybrid aspen scenarios could potentially increase the total BVOC emissions in the ranges of 12 %–35 % and 7 %–19 % respectively, dependent upon the original BVOC emission model used for this comparison (Table 8). For Italian alder this increase in total BVOC is an order of magnitude smaller, ranging from 0.3 %–1 %. It can therefore be suggested that future hybrid aspen SRF plantations for bioenergy will likely emit no more BVOC than equivalent expansion of young Sitka spruce plantations. Expansion of SRF with Italian alder may bring about no significant changes to the UK BVOC emissions at the national level.
Any future distribution of bioenergy crops including SRF in the UK will depend on several factors, including available land, locations that are most suitable to obtain high biomass yields, locations that are close to energy-generation plants and locations close to opportunities for CO2 storage, in the case of using bioenergy with carbon capture and storage (BECCS) to reach net-zero targets (Donnison et al., 2020). Further work is needed to better understand how these changes in BVOC emissions may impact air chemistry and potentially air quality (in particular ozone and SOA) at local to UK national scale.
Winter and spring emissions of isoprene and monoterpenes in the three potential short-rotation forestry (SRF) species of Sitka spruce, hybrid aspen and Italian alder were 1 or 2 orders of magnitude smaller than their respective emissions in summer. There were large differences in the BVOC emission rates and compounds between the three species, with d-limonene, α-pinene and β-myrcene being the major monoterpenes across all three species.
Sitka spruce emitted more isoprene and monoterpenes during the warmer, drier 2018 than in the cooler, wetter 2019. Isoprene emissions for hybrid aspen were similar in both years but monoterpene emissions were higher in 2018 compared to 2019. Italian alder did not often emit detectable amounts of isoprene in either year and only a little monoterpene in 2018. The observed differences in emissions of the relative amounts of isoprene compared to monoterpenes in the case of Sitka spruce could lead to differences in SOA generation in warmer and cooler years.
Overall, forest floor emissions of monoterpenes were a factor 10 to 1000 times smaller than the canopy emissions. The forest floor emissions were more variable and acted as a source for most of the time, with occasional instances (<4 measurement occasions out of 20) when the forest floor acted as a sink for monoterpenes. Further work is necessary under controlled conditions to fully understand the drivers and components of forest floor emissions.
Total annual emissions per unit of ground area for each SRF species were derived using MEGAN 2.1 and scaled up to a 0.7 Mha future SRF expansion scenario for the UK. Under this scenario, total modelled UK BVOC emissions (the sum of isoprene and total monoterpene emissions) could increase by <1 %–35 % depending on the species planted and the UK BVOC emissions model used. Future work to understand how any increase in forest cover and BVOC emissions may impact the atmospheric chemistry in NOx-dominated regions is needed so that air quality impacts from pollutants such as ozone can be determined across the UK.
The Pocket MEGAN 2.1 excel beta 3 calculator spreadsheet was developed by Alex Guenther, and access is detailed at https://sites.google.com/uci.edu/bai/megan/history?authuser=0 (Guenther, 2019).
Data are available from the Environmental Information Data Centre (EIDC) part of the Natural Environment Research Council's (NERC) Environmental Data Service and are hosted by the UK Centre for Ecology & Hydrology (UKCEH) https://eidc.ac.uk/ (Purser et al., 2021).
The supplement related to this article is available online at: https://doi.org/10.5194/bg-18-2487-2021-supplement.
JILM, JD and MRH conceptualised the study, acquired funds for the study, supervised the study, and edited and reviewed the original draft. JILM gave permission for the use of the field site at East Grange. JD provided laboratory equipment. GP contributed to the conceptualisation of the study, developed the methodology, collected field samples and conducted the measurements and analysis and wrote the original draft. RASS assisted in collection of field samples, conducted measurements and analysis related to leaf area index at East Grange. LKD assisted with the collection of field samples and analysis.
The authors declare that they have no conflict of interest.
We would like to thank Adam Ash and Colin McEvoy of Forest Research for assistance with the meteorological station at East Grange. From UK CEH we thank Peter Levy and Nick Cowan for assistance with data loggers and Ben Langford for the use of the Pocket MEGAN 2.1 excel beta 3 calculator.
This research has been supported by the Natural Environment Research Council (grant no. NE/L002558/1) and the Forestry Commission contributed to the CASE award through the climate change research programmes of Forest Research.
This paper was edited by Paul Stoy and reviewed by Andrew Leslie and one anonymous referee.
AQEG: Non-methane Volatile Organic Compounds in the UK, Air Quality Expert Group (AQEG), DEFRA, online, available at: https://uk-air.defra.gov.uk/assets/documents/reports/cat09/2006240803_Non_Methane_Volatile_Organic_Compounds_in_the_UK.pdf (23 March 2021), 2020.
Asensio, D., Peñuelas, J., Llusià, J., Ogaya, R., and Filella, I.: Interannual and interseasonal soil CO2 efflux and VOC exchange rates in a Mediterranean holm oak forest in response to experimental drought, Soil Biol. Biochem., 39, 2471–2484, https://doi.org/10.1016/j.soilbio.2007.04.019, 2007a.
Asensio, D., Peñuelas, J., Filella, I., and Llusià, J.: On-line screening of soil VOCs exchange responses to moisture, temperature and root presence, Plant Soil, 291, 249–261, https://doi.org/10.1007/s11104-006-9190-4, 2007b.
Asensio, D., Peñuelas, J., Ogaya, R., and Llusià, J.: Seasonal soil VOC exchange rates in a Mediterranean holm oak forest and their responses to drought conditions, Atmos. Environ., 41, 2456–2466, https://doi.org/10.1016/j.atmosenv.2006.05.007, 2007c.
Ashworth, K., Wild, O., Eller, A. S. D. D., and Hewitt, C. N.: Impact of Biofuel Poplar Cultivation on Ground-Level Ozone and Premature Human Mortality Depends on Cultivar Selection and Planting Location, Environ. Sci. Technol., 49, 8566–8575, https://doi.org/10.1021/acs.est.5b00266, 2015.
Atkinson, R. and Arey, J.: Gas-phase tropospheric chemistry of biogenic volatile organic compounds: a review, Atmos. Environ., 37, 197–219, https://doi.org/10.1016/S1352-2310(03)00391-1, 2003.
Aydin, Y. M., Yaman, B., Koca, H., Dasdemir, O., Kara, M., Altiok, H., Dumanoglu, Y., Bayram, A., Tolunay, D., Odabasi, M., and Elbir, T.: Biogenic volatile organic compound (BVOC) emissions from forested areas in Turkey: Determination of specific emission rates for thirty-one tree species, Sci. Total Environ., 490, 239–253, https://doi.org/10.1016/j.scitotenv.2014.04.132, 2014.
Bäck, J., Aalto, J., Henriksson, M., Hakola, H., He, Q., and Boy, M.: Chemodiversity of a Scots pine stand and implications for terpene air concentrations, Biogeosciences, 9, 689–702, https://doi.org/10.5194/bg-9-689-2012, 2012.
Baghi, R., Helmig, D., Guenther, A., Duhl, T., and Daly, R.: Contribution of flowering trees to urban atmospheric biogenic volatile organic compound emissions, Biogeosciences, 9, 3777–3785, https://doi.org/10.5194/bg-9-3777-2012, 2012.
Beverland, I. J., Milne, R., Boissard, C., ÓNéill, D. H., Moncrieff, J. B., and Hewitt, C. N.: Measurement of carbon dioxide and hydrocarbon fluxes from a sitka spruce forest using micrometeorological techniques, J. Geophys. Res.-Atmos., 101, 22807–22815, https://doi.org/10.1029/96jd01933, 1996.
Blande, J. D., Tiiva, P., Oksanen, E., and Holopainen, J. K.: Emission of herbivore-induced volatile terpenoids from two hybrid aspen (Populus tremula x tremuloides) clones under ambient and elevated ozone concentrations in the field, Glob. Change Biol., 13, 2538–2550, https://doi.org/10.1111/j.1365-2486.2007.01453.x, 2007.
Blande, J. D., Korjus, M., and Holopainen, J. K.: Foliar methyl salicylate emissions indicate prolonged aphid infestation on silver birch and black alder, Tree Physiol., 30, 404–416, https://doi.org/10.1093/treephys/tpp124, 2010.
Bonn, B., Kreuzwieser, J., Sander, F., Yousefpour, R., Baggio, T., and Adewale, O.: The uncertain role of biogenic VOC for boundary-layer ozone concentration: Example investigation of emissions from two forest types with a box model, Climate, 5, https://doi.org/10.3390/cli5040078, 2017.
Boulanger-Lapointe, N., Lévesque, E., Baittinger, C., and Schmidt, N. M.: Local variability in growth and reproduction of Salix arctica in the High Arctic, Polar Res., 35, 24126, https://doi.org/10.3402/polar.v35.24126, 2016.
Bourtsoukidis, E., Behrendt, T., Yañez-Serrano, A. M., Hellén, H., Diamantopoulos, E., Catão, E., Ashworth, K., Pozzer, A., Quesada, C. A., Martins, D. L., Sá, M., Araujo, A., Brito, J., Artaxo, P., Kesselmeier, J., Lelieveld, J., and Williams, J.: Strong sesquiterpene emissions from Amazonian soils, Nat. Commun., 9, 1–11, https://doi.org/10.1038/s41467-018-04658-y, 2018.
Brilli, F., Barta, C., Fortunati, A., Lerdau, M., Loreto, F., and Centritto, M.: Response of isoprene emission and carbon metabolism to drought in white poplar (Populus alba) saplings, New Phytol., 175, 244–254, https://doi.org/10.1111/j.1469-8137.2007.02094.x, 2007.
Brilli, F., Gioli, B., Zona, D., Pallozzi, E., Zenone, T., Fratini, G., Calfapietra, C., Loreto, F., Janssens, I. A. and Ceulemans, R.: Simultaneous leaf- and ecosystem-level fluxes of volatile organic compounds from a poplar-based SRC plantation, Agric. For. Meteorol., 187, 22–35, https://doi.org/10.1016/j.agrformet.2013.11.006, 2014.
Calfapietra, C., Fares, S., and Loreto, F.: Volatile organic compounds from Italian vegetation and their interaction with ozone, Environ. Pollut., 157, 1478–1486, https://doi.org/10.1016/j.envpol.2008.09.048, 2009.
Carlton, A. G., Wiedinmyer, C., and Kroll, J. H.: A review of Secondary Organic Aerosol (SOA) formation from isoprene, Atmos. Chem. Phys., 9, 4987–5005, https://doi.org/10.5194/acp-9-4987-2009, 2009.
Cleveland, C. C. and Yavitt, J. B.: Consumption of atmospheric isoprene in soil, Geophys. Res. Lett., 24, 2379–2382, https://doi.org/10.1029/97GL02451, 1997.
Cleveland, C. C. and Yavitt, J. B.: Microbial consumption of atmospheric isoprene in a temperate forest soil, Appl. Environ. Microbiol., 64, 172–177, https://doi.org/10.1128/AEM.64.1.172-177.1998, 1998.
Committee on Climate Change: Net Zero – The UK's contribution to stopping global warming, Committee on Climate Change, online, available at: https://www.theccc.org.uk/publication/net-zero-the-uks-contribution-to-stopping-global-warming/ (last access: 23 March 2021), 2019.
Committee on Climate Change: Land use: Policies for a Net Zero UK, online, available at: https://www.theccc.org.uk/publication/land-use-policies-for-a-net-zero-uk/ (last access: 23 March 2021), 2020.
Copolovici, L., Kännaste, A., Remmel, T., and Niinemets, Ü.: Volatile organic compound emissions from Alnus glutinosa under interacting drought and herbivory stresses, Environ. Exp. Bot., 100, 55–63, https://doi.org/10.1016/j.envexpbot.2013.12.011, 2014.
DEFRA: Crops Grown For Bioenergy in the UK: 2018, Department for Environment, Food and Rural Affairs, online, available at: https://assets.publishing.service.gov.uk/government/uploads/system/uploads/attachment_data/file/856695/nonfood-statsnotice2018-08jan20.pdf (last access: 23 March 2021), 2019.
Donnison, C., Holland, R. A., Hastings, A., Armstrong, L. M., Eigenbrod, F., and Taylor, G.: Bioenergy with Carbon Capture and Storage (BECCS): Finding the win-wins for energy, negative emissions and ecosystem services—size matters, GCB Bioenergy, 12, 586–604, https://doi.org/10.1111/gcbb.12695, 2020.
Drewer, J., Yamulki, S., Leeson, S. R., Anderson, M., Perks, M. P., Skiba, U. M., and McNamara, N. P.: Difference in Soil Methane (CH4) and Nitrous Oxide (N2O) Fluxes from Bioenergy Crops SRC Willow and SRF Scots Pine Compared with Adjacent Arable and Fallow in a Temperate Climate, Bioenerg. Res., 10, 575–582, https://doi.org/10.1007/s12155-017-9824-9, 2017.
Dudareva, N., Negre, F., Nagegowda, D. A., and Orlova, I.: Plant Volatiles: Recent Advances and Future Perspectives, CRC Cr. Rev. Plant Sci., 25, 417–440, https://doi.org/10.1080/07352680600899973, 2006.
Emberson, L.: Effects of ozone on agriculture, forests and grasslands, Philos. Trans. R. Soc. A, 378, 20190327, https://doi.org/10.1098/rsta.2019.0327, 2020.
Fares, S., Vargas, R., Detto, M., Goldstein, A. H., Karlik, J., Paoletti, E., and Vitale, M.: Tropospheric ozone reduces carbon assimilation in trees: Estimates from analysis of continuous flux measurements, Glob. Change Biol., 19, 2427–2443, https://doi.org/10.1111/gcb.12222, 2013.
Felzer, B. S., Cronin, T., Reilly, J. M., Melillo, J. M., and Wang, X.: Impacts of ozone on trees and crops, C. R. Geosci., 339, 784–798, https://doi.org/10.1016/j.crte.2007.08.008, 2007.
Foreman, S.: Impact of competition on the early growth and physiological responses of potential short-rotation forestry species in Ireland, School of Agriculture and Food Science, College of Health and Agricultural Sciences, University College Dublin, PhD thesis, online, available at: https://core.ac.uk/download/pdf/324169592.pdf (last access: 23 March 2021), 2019.
Forest Research: Forestry Statistics 2020 Chapter 1: Woodland Area and Planting, online, available at: https://www.forestresearch.gov.uk/tools-and-resources/statistics/forestry-statistics/forestry-statistics-2020/ (last access: 23 March 2021), 2020.
Forestry Commission: National Forest Inventory – preliminary broadleaved and ash data GB 2011, 115, online, available at: (last access: 23 March 2021), 2012.
Forrest, G.: Geographic variation in the monoterpene composition of Sitka spruce cortical oleoresin, Can. J. For. Res., 10, 458–463, https://doi.org/10.1139/x80-075, 2011.
Fuentes, J. D., Wang, D., and Gu, L.: Seasonal variations in isoprene emissions from a boreal aspen forest, J. Appl. Meteorol., 38, 855–869, https://doi.org/10.1175/1520-0450(1999)038<0855:SVIIEF>2.0.CO;2, 1999.
Fuzzi, S., Baltensperger, U., Carslaw, K., Decesari, S., Denier van der Gon, H., Facchini, M. C., Fowler, D., Koren, I., Langford, B., Lohmann, U., Nemitz, E., Pandis, S., Riipinen, I., Rudich, Y., Schaap, M., Slowik, J. G., Spracklen, D. V., Vignati, E., Wild, M., Williams, M., and Gilardoni, S.: Particulate matter, air quality and climate: lessons learned and future needs, Atmos. Chem. Phys., 15, 8217–8299, https://doi.org/10.5194/acp-15-8217-2015, 2015.
Geron, C., Rasmussen, R., Arnts, R. R., and Guenther, A.: A review and synthesis of monoterpene speciation from forests in the United States, Atmos. Environ., 34, 1761–1781, https://doi.org/10.1016/S1352-2310(99)00364-7, 2000.
Gray, C. M., Monson, R. K., and Fierer, N.: Emissions of volatile organic compounds during the decomposition of plant litter, J. Geophys. Res.-Biogeosci., 115, https://doi.org/10.1029/2010JG001291, 2010.
Greenberg, J. P., Asensio, D., Turnipseed, A., Guenther, A. B., Karl, T., and Gochis, D.: Contribution of leaf and needle litter to whole ecosystem BVOC fluxes, Atmos. Environ., 59, 302–311, https://doi.org/10.1016/j.atmosenv.2012.04.038, 2012.
Guenther, A. B.: Biosphere Atmosphere Interactions Group: History, available at: https://sites.google.com/uci.edu/bai/megan/history?authuser=0 (last access: 23 March 2021), 2019.
Guenther, A. B., Monson, R. K., and Fall, R.: Isoprene and monoterpene emission rate variability: Observations with eucalyptus and emission rate algorithm development, J. Geophys. Res.-Atmos., 96, 10799–10808, https://doi.org/10.1029/91JD00960, 1991.
Guenther, A. B., Zimmerman, P. R., Harley, P. C., Monson, R. K., and Fall, R.: Isoprene and monoterpene emission rate variability: model evaluations and sensitivity analyses, J. Geophys. Res., 98, 12609–12617, https://doi.org/10.1029/93jd00527, 1993.
Guenther, A., Karl, T., Harley, P., Wiedinmyer, C., Palmer, P. I., and Geron, C.: Estimates of global terrestrial isoprene emissions using MEGAN (Model of Emissions of Gases and Aerosols from Nature), Atmos. Chem. Phys., 6, 3181–3210, https://doi.org/10.5194/acp-6-3181-2006, 2006.
Guenther, A. B., Jiang, X., Heald, C. L., Sakulyanontvittaya, T., Duhl, T., Emmons, L. K., and Wang, X.: The Model of Emissions of Gases and Aerosols from Nature version 2.1 (MEGAN2.1): an extended and updated framework for modeling biogenic emissions, Geosci. Model Dev., 5, 1471–1492, https://doi.org/10.5194/gmd-5-1471-2012, 2012.
Hakola, H., Rinne, J., and Laurila, T.: The hydrocarbon emission rates of tea-leafed willow (Salix phylicifolia), silver birch (Betula pendula) and European aspen (Populus tremula), Atmos. Environ., 32, 1825–1833, https://doi.org/10.1016/S1352-2310(97)00482-2, 1998.
Hakola, H., Rinne, J., and Laurila, T.: The VOC Emission Rates of Boreal Deciduous Trees, in European Commission: Biogenic VOC emissions and photochemistry in the boreal regions of Europe – Biphorep, edited by: Laurila, T. and Lindfors, V., 158, European Commission, Luxembourg, available at: https://op.europa.eu/en/publication-detail/-/publication/3fde6434-985d-4415-9be8-48ab60eb7e24/language-en (last access: 23 March 2021), 1999.
Hakola, H., Tarvainen, V., Laurila, T., Hiltunen, V., Hellén, H., and Keronen, P.: Seasonal variation of VOC concentrations above a boreal coniferous forest, Atmos. Environ., 37, 1623–1634, https://doi.org/10.1016/S1352-2310(03)00014-1, 2003.
Hakola, H., Tarvainen, V., Praplan, A. P., Jaars, K., Hemmilä, M., Kulmala, M., Bäck, J., and Hellén, H.: Terpenoid and carbonyl emissions from Norway spruce in Finland during the growing season, Atmos. Chem. Phys., 17, 3357–3370, https://doi.org/10.5194/acp-17-3357-2017, 2017.
Harrison, A.: Energy Forestry Exemplar Trials – Annual Update Report, online, available at: https://forestry.gov.scot/images/corporate/pdf/EnergyForestryGuidelinesFinal140809.pdf (last access: 23 March 2021), 2010.
Hartikainen, K., Nerg, A. M., Kivimenp, M., Kontunen-Soppela, S., Menp, M., Oksanen, E., Rousi, M., and Holopainen, T.: Emissions of volatile organic compounds and leaf structural characteristics of European aspen (Populus tremula) grown under elevated ozone and temperature, Tree Physiol., 29, 1163–1173, https://doi.org/10.1093/treephys/tpp033, 2009.
Hayman, G. D., Abbott, J., Davies, T. J., Thomson, C. L., Jenkin, M. E., Thetford, R. and Fitzgerald, P.: The ozone source–receptor model – A tool for UK ozone policy, Atmos. Environ., 44, 4283–4297, https://doi.org/10.1016/j.atmosenv.2010.06.013, 2010.
Hayman, G., Comyn-Platt, E., Langford, B., and Vieno, M.: Performance of the JULES land surface model for UK biogenic VOC emissions, JULES Annu. Sci. Meet., 27 June 2017, online, available at: http://jules.jchmr.org/sites/default/files/Talk_6_Biogeochemistry_6_Hayman.pdf (last access: 23 March 2021), 2017.
Hayward, S., Muncey, R. J., James, A. E., Halsall, C. J., and Hewitt, C. N.: Monoterpene emissions from soil in a Sitka spruce forest, Atmos. Environ., 35, 4081–4087, https://doi.org/10.1016/S1352-2310(01)00213-8, 2001.
Hayward, S., Tani, A., Owen, S. M., and Hewitt, C. N.: Online analysis of volatile organic compound emissions from Sitka spruce (Picea sitchensis), Tree Physiol., 24, 721–728, https://doi.org/10.1093/treephys/24.7.721, 2004.
Heinritzi, M., Dada, L., Simon, M., Stolzenburg, D., Wagner, A. C., Fischer, L., Ahonen, L. R., Amanatidis, S., Baalbaki, R., Baccarini, A., Bauer, P. S., Baumgartner, B., Bianchi, F., Brilke, S., Chen, D., Chiu, R., Dias, A., Dommen, J., Duplissy, J., Finkenzeller, H., Frege, C., Fuchs, C., Garmash, O., Gordon, H., Granzin, M., El Haddad, I., He, X., Helm, J., Hofbauer, V., Hoyle, C. R., Kangasluoma, J., Keber, T., Kim, C., Kürten, A., Lamkaddam, H., Laurila, T. M., Lampilahti, J., Lee, C. P., Lehtipalo, K., Leiminger, M., Mai, H., Makhmutov, V., Manninen, H. E., Marten, R., Mathot, S., Mauldin, R. L., Mentler, B., Molteni, U., Müller, T., Nie, W., Nieminen, T., Onnela, A., Partoll, E., Passananti, M., Petäjä, T., Pfeifer, J., Pospisilova, V., Quéléver, L. L. J., Rissanen, M. P., Rose, C., Schobesberger, S., Scholz, W., Scholze, K., Sipilä, M., Steiner, G., Stozhkov, Y., Tauber, C., Tham, Y. J., Vazquez-Pufleau, M., Virtanen, A., Vogel, A. L., Volkamer, R., Wagner, R., Wang, M., Weitz, L., Wimmer, D., Xiao, M., Yan, C., Ye, P., Zha, Q., Zhou, X., Amorim, A., Baltensperger, U., Hansel, A., Kulmala, M., Tomé, A., Winkler, P. M., Worsnop, D. R., Donahue, N. M., Kirkby, J., and Curtius, J.: Molecular understanding of the suppression of new-particle formation by isoprene, Atmos. Chem. Phys., 20, 11809–11821, https://doi.org/10.5194/acp-20-11809-2020, 2020.
Holzinger, R., Lee, A., McKay, M., and Goldstein, A. H.: Seasonal variability of monoterpene emission factors for a ponderosa pine plantation in California, Atmos. Chem. Phys., 6, 1267–1274, https://doi.org/10.5194/acp-6-1267-2006, 2006.
Hrutfiord, B. F., Hopley, S. M., and Gara, R. I.: Monoterpenes in sitka spruce: Within tree and seasonal variation, Phytochemistry, 13, 2167–2170, https://doi.org/10.1016/0031-9422(74)85021-1, 1974.
Huber, D. P. W., Gries, R., Borden, J. H., and Pierce, H. D.: A survey of antennal responses by five species of coniferophagous bark beetles (Coleoptera: Scolytidae) to bark volatiles of six species of angiosperm trees, Chemoecology, 10, 103–113, https://doi.org/10.1007/PL00001811, 2000.
IEA Bioenergy: Country reports: United Kingdom – 2018 update, 1–11, online, available at: https://www.ieabioenergy.com/iea-publications/country-reports/2018-country-reports/ (last access: 23 March 2021), 2018.
Insam, H. and Seewald, M. S. A.: Volatile organic compounds (VOCs) in soils, Biol. Fertil. Soils, 46, 199–213, https://doi.org/10.1007/s00374-010-0442-3, 2010.
Isebrands, J. G., Guenther, A. B., Harley, P., Helmig, D., Klinger, L., Vierling, L., Zimmerman, P., and Geron, C.: Volatile organic compound emission rates from mixed deciduous and coniferous forests in Northern Wisconsin, USA, Atmos. Environ., 33, 2527–2536, https://doi.org/10.1016/S1352-2310(98)00250-7, 1999.
Isidorov, V. and Jdanova, M.: Volatile Organic Compounds from leaves litter, Chemosph., 48, 2058–2072, https://doi.org/10.3390/molecules17022058, 2012.
Janson, R., De Serves, C., and Romero, R.: Emission of isoprene and carbonyl compounds from a boreal forest and wetland in Sweden, Agric. For. Meteorol., 98–99, 671–681, https://doi.org/10.1016/S0168-1923(99)00134-3, 1999.
Janson, R. W.: Monoterpene emissions from Scots pine and Norwegian spruce, J. Geophys. Res., 98, 2839–2850, https://doi.org/10.1029/92JD02394, 1993.
Johansson, T.: Dry matter amounts and increment in 21- to 91 year-old common alder and grey alder and some practical implications, Can. J. For. Res., 29, 1679–1690, https://doi.org/10.1139/x99-126, 1999.
Johansson, T.: Biomass production of hybrid aspen growing on former farm land in Sweden, J. For. Res., 24, 237–246, https://doi.org/10.1007/s11676-012-0305-x, 2013.
Karl, M., Guenther, A., Köble, R., Leip, A., and Seufert, G.: A new European plant-specific emission inventory of biogenic volatile organic compounds for use in atmospheric transport models, Biogeosciences, 6, 1059–1087, https://doi.org/10.5194/bg-6-1059-2009, 2009.
Keith, A. M., Rowe, R. L., Parmar, K., Perks, M. P., Mackie, E., Dondini, M., and Mcnamara, N. P.: Implications of land-use change to Short Rotation Forestry in Great Britain for soil and biomass carbon, GCB Bioenergy, 7, 541–552, https://doi.org/10.1111/gcbb.12168, 2015.
Langford, B., Cash, J., Acton, W. J. F., Valach, A. C., Hewitt, C. N., Fares, S., Goded, I., Gruening, C., House, E., Kalogridis, A.-C., Gros, V., Schafers, R., Thomas, R., Broadmeadow, M., and Nemitz, E.: Isoprene emission potentials from European oak forests derived from canopy flux measurements: an assessment of uncertainties and inter-algorithm variability, Biogeosciences, 14, 5571–5594, https://doi.org/10.5194/bg-14-5571-2017, 2017.
Leff, J. W. and Fierer, N.: Volatile organic compound (VOC) emissions from soil and litter samples, Soil Biol. Biochem., 40, 1629–1636, https://doi.org/10.1016/j.soilbio.2008.01.018, 2008.
Leslie, A. D., Mencuccini, M., and Perks, M.: The potential for Eucalyptus as a wood fuel in the UK, Appl. Energy, 89, 176–182, https://doi.org/10.1016/j.apenergy.2011.07.037, 2012.
Leslie, A. D., Mencuccini, M., and Perks, M. P.: A resource capture efficiency index to compare differences in early growth of four tree species in northern England, iForest, 2, 397–405, https://doi.org/10.3832/ifor2248-010, 2017.
Mäki, M., Heinonsalo, J., Hellén, H., and Bäck, J.: Contribution of understorey vegetation and soil processes to boreal forest isoprenoid exchange, Biogeosciences, 14, 1055–1073, https://doi.org/10.5194/bg-14-1055-2017, 2017.
Mäki, M., Aaltonen, H., Heinonsalo, J., Hellén, H., Pumpanen, J. and Bäck, J.: Boreal forest soil is a significant and diverse source of volatile organic compounds, Plant Soil, 441, 89–110, https://doi.org/10.1007/s11104-019-04092-z, 2019a.
Mäki, M., Aalto, J., Hellén, H., Pihlatie, M., and Bäck, J.: Interannual and Seasonal Dynamics of Volatile Organic Compound Fluxes From the Boreal Forest Floor, Front. Plant Sci., 10, 191, https://doi.org/10.3389/fpls.2019.00191, 2019b.
Matoušková, M., Jurová, J., Grul'ová, D., Wajs-Bonikowska, A., Renčo, M., Sedlák, V., Poráčová, J., Gogal'ová, Z., and Kalemba, D.: Phytotoxic Effect of Invasive Heracleum mantegazzianum Essential Oil on Dicot and Monocot Species, Molecules, 24, 3–11, https://doi.org/10.3390/molecules24030425, 2019.
McEvoy, C.: Short Rotation Forestry Trials in Scotland: Progress report 2015, Forest Research, Edinburgh, online, available at: https://forestry.gov.scot/publications/632-short-rotation-forestry-trials-in-scotland-progress-report-2016/viewdocument (last access: 23 March 2021), 2016.
McKay, H.: Short Rotation Forestry: Review of growth and environmental impacts, Forest Research Monograph, 2, Forest Research, Surrey, online, available at: https://www.forestresearch.gov.uk/research/short-rotation-forestry-review-of-growth-and-environmental-impacts/ (last access: 23 March 2021), 2011.
Meir, P., Kruijt, B., Broadmeadow, M., Barbosa, E., Kull, O., Carswell, F., Nobre, A., and Jarvis, P. G.: Acclimation of photosynthetic capacity to irradiance in tree canopies in relation to leaf nitrogen concentration and leaf mass per unit area, Plant, Cell Environ., 25, 343–357, https://doi.org/10.1046/j.0016-8025.2001.00811.x, 2002.
Met Office: UK actual and anomaly maps, online, available at: https://www.metoffice.gov.uk/research/climate/maps-and-data/uk-actual-and-anomaly-maps (last access: 23 March 2021), 2020.
Monson, R. K. and Fall, R.: Isoprene emission from aspen leaves: influence of environment and relation to photosynthesis and photorespiration., Plant Physiol., 90, 267–74, https://doi.org/10.1104/pp.90.1.267, 1989.
Morrison, E. C., Drewer, J., and Heal, M. R.: A comparison of isoprene and monoterpene emission rates from the perennial bioenergy crops short-rotation coppice willow and Miscanthus and the annual arable crops wheat and oilseed rape, GCB Bioenergy, 8, 211–225, https://doi.org/10.1111/gcbb.12257, 2016.
Norman, J. M. and Jarvis, P. G.: Photosynthesis in Sitka Spruce (Picea sitchensis (Bong.) Carr.). III. Measurements of Canopy Structure and Interception of Radiation, J. Appl. Ecol., 11, 375, https://doi.org/10.2307/2402028, 1974.
Ogunbadewa, E. Y.: Tracking seasonal changes in vegetation phenology with a SunScan canopy analyzer in northwestern England, Forest Sci. Technol., 8, 161–172, https://doi.org/10.1080/21580103.2012.704971, 2012.
Ortega, J. and Helmig, D.: Approaches for quantifying reactive and low-volatility biogenic organic compound emissions by vegetation enclosure techniques – Part A, Chemosphere, 72, 343–364, https://doi.org/10.1016/J.CHEMOSPHERE.2007.11.020, 2008.
Ortega, J., Helmig, D., Daly, R. W., Tanner, D. M., Guenther, A. B., and Herrick, J. D.: Approaches for quantifying reactive and low-volatility biogenic organic compound emissions by vegetation enclosure techniques – Part B: Applications, Chemosphere, 72, 365–380, https://doi.org/10.1016/j.chemosphere.2008.02.054, 2008.
Owen, S. M., Clark, S., Pompe, M., and Semple, K. T.: Biogenic volatile organic compounds as potential carbon sources for microbial communities in soil from the rhizosphere of Populus tremula, FEMS Microbiol. Lett., 268, 34–39, https://doi.org/10.1111/j.1574-6968.2006.00602.x, 2007.
Parratt, M.: Short Rotation Forestry Trials in Scotland: Progress Report 2017, Forest Research, Edinburgh, online, available at: https://forestry.gov.scot/publications/631-short-rotation-forestry-trials-in-scotland-progress-report-2017/viewdocument (last access: 23 March 2021), 2018.
Peñuelas, J., Asensio, D., Tholl, D., Wekne, K., Rosenkranz, M., Piechulla, B., and Schnitzler, J. P.: Biogenic volatile emissions from the soil, Plant. Cell Environ., 37, 1866–1891, https://doi.org/10.1111/pce.12340, 2014.
Pinno, B. D., Lieffers, V. J., and Stadt, K. J.: Measuring and modelling the crown and light transmission characteristics of juvenile aspen, Can. J. For. Res., 31, 1930–1939, https://doi.org/10.1139/x01-128, 2001.
Potosnak, M. J., Baker, B. M., LeStourgeon, L., Disher, S. M., Griffin, K. L., Bret-Harte, M. S., and Starr, G.: Isoprene emissions from a tundra ecosystem, Biogeosciences, 10, 871–889, https://doi.org/10.5194/bg-10-871-2013, 2013.
Pressley, S., Lamb, B., Westberg, H., and Vogel, C.: Relationships among canopy scale energy fluxes and isoprene flux derived from long-term, seasonal eddy covariance measurements over a hardwood forest, Agric. For. Meteorol., 136, 188–202, https://doi.org/10.1016/j.agrformet.2004.11.013, 2006.
Purser, G., Heal, M. R., White, S., Morison, J. I. L., and Drewer, J.: Differences in isoprene and monoterpene emissions from cold-tolerant eucalypt species grown in the UK, Atmos. Pollut. Res., 11, 2011–2021, https://doi.org/10.1016/j.apr.2020.07.022, 2020.
Purser, G., Drewer, J., Heal, M. R., Sircus, R. A. S., Dunn, L. K., and Morison, J. I. L.: Isoprene and monoterpene emissions from alder, aspen and spruce short-rotation forest plantations in the United Kingdom, Environmental Information Data Centre, available at: https://eidc.ac.uk/ (last access: 14 April 2021), 2021.
Renewable Energy Association: PHASE 1 Bioenergy in the UK-The state of play, 1–48, online, available at: https://www.r-e-a.net/wp-content/uploads/2019/10/REA-Bioenergy-Strategy-Phase-1-State-of-Play-Web.pdf, 2019.
Ricardo: Analysing the potential of bioenergy with carbon capture in the UK to 2050, online, available at: https://assets.publishing.service.gov.uk/government/uploads/system/uploads/attachment_data/file/911268/potential-of-bioenergy-with-carbon-capture.pdf (last access: 23 March 2021), 2020.
Seco, R., Karl, T., Guenther, A., Hosman, K. P., Pallardy, S. G., Gu, L., Geron, C., Harley, P., and Kim, S.: Ecosystem-scale volatile organic compound fluxes during an extreme drought in a broadleaf temperate forest of the Missouri Ozarks (central USA), Glob. Change Biol., 21, 3657–3674, https://doi.org/10.1111/gcb.12980, 2015.
Simpson, D., Winiwarter, W., Börjesson, G., Cinderby, S., Ferreiro, A., Guenther, A., Hewitt, C. N., Janson, R., Khalil, M. A. K., Owen, S., Pierce, T. E., Puxbaum, H., Shearer, M., Skiba, U., Steinbrecher, R., Tarrasón, L., and Öquist, M. G.: Inventorying emissions from nature in Europe, J. Geophys. Res.-Atmos., 104, 8113–8152, https://doi.org/10.1029/98JD02747, 1999.
Stewart, H. E., Hewitt, C. N., Bunce, R. G. H., Steinbrecher, R., Smiatek, G., and Schoenemeyer, T.: A highly spatially and temporally resolved inventory for biogenic isoprene and monoterpene emissions: Model description and application to Great Britain, J. Geophys. Res.-Atmos., 108, 4644, https://doi.org/10.1029/2002JD002694, 2003.
Stokes, V.: Short Rotation Forestry Trials in Scotland: Progress report 2014, online, available at: https://forestry.gov.scot/publications/forests-and-the-environment/climate-change/woodfuel-and-bio-energy/energy-forester-exemplar-trials/636-short-rotation-forestry-trials-in-scotland-progress-report-2010 (last access: 23 March 2021), 2015.
Street, R. A., Duckham, S. C., and Hewitt, C. N.: Laboratory and field studies of biogenic volatile organic compound emissions from Sitka spruce (Picea sitchensis Bong.) in the United Kingdom, J. Geophys. Res.-Atmos., 101, 22799–22806, https://doi.org/10.1029/96JD01171, 1996.
Tang, J., Schurgers, G., and Rinnan, R.: Process Understanding of Soil BVOC Fluxes in Natural Ecosystems: A Review, Rev. Geophys., 57, 966–986, https://doi.org/10.1029/2018RG000634, 2019.
Tobin, B., Black, K., Osborne, B., Bolger, T., Reidy, B., and Nieuwenhuis, M.: Biomass expansion factors for Sitka spruce (Picea sitchensis (Bong.) Carr.) in Ireland, Eur. J. For. Res., 126, 189–196, https://doi.org/10.1007/s10342-005-0105-3, 2007.
Tobin, B., Foreman, S., and Conor, O.: Short Rotation Forestry in Ireland – new research trials, For. Energy Rev., 6, 28–30, 2016.
Trowbridge, A. M., Stoy, P. C., and Phillips, R. P.: Soil Biogenic Volatile Organic Compound Flux in a Mixed Hardwood Forest: Net Uptake at Warmer Temperatures and the Importance of Mycorrhizal Associations, J. Geophys. Res.-Biogeosci., 125, 0–2, https://doi.org/10.1029/2019jg005479, 2020.
Tullus, A., Kupper, P., Sellin, A., Parts, L., Sõber, J., Tullus, T., Lõhmus, K., Sõber, A., and Tullus, H.: Climate change at northern latitudes: rising atmospheric humidity decreases transpiration, N-uptake and growth rate of hybrid aspen, PLOS ONE, 7, e42648–e42648, https://doi.org/10.1371/journal.pone.0042648, 2012.
UNEP/WMO: Integrated Assessment of Black Carbon and Tropospheric Ozone, United Nations Environment Programme and World Meteorological Organisation, online, available at: https://www.ccacoalition.org/en/resources/integrated-assessment-black-carbon-and-tropospheric-ozone, 2011.
Went, F. W.: Blue Hazes in the Atmosphere, Nature, 187, 641–643, https://doi.org/10.1038/187641a0, 1960.
Yu, Q.: Can physiological and anatomical characters be used for selecting high yielding hybrid aspen clones?, Silva Fenn., 35, 137–146, https://doi.org/10.14214/sf.591, 2001.
Zenone, T., Hendriks, C., Brilli, F., Fransen, E., Gioli, B., Portillo-Estrada, M., Schaap, M., and Ceulemans, R.: Interaction between isoprene and ozone fluxes in a poplar plantation and its impact on air quality at the European level, Sci. Rep., 6, 1–9, https://doi.org/10.1038/srep32676, 2016.