the Creative Commons Attribution 4.0 License.
the Creative Commons Attribution 4.0 License.
 | 26 Apr 2021
Effects of Earth system feedbacks on the potential mitigation of large-scale tropical forest restoration
Chris Brierley
Simon L. Lewis
To achieve the Paris Agreement requires aggressive mitigation strategies alongside negative emission technologies. Recent studies suggest that increasing tree cover can make a substantial contribution to negative emissions, with the tropics being the most suitable region from a biogeophysical perspective. Yet these studies typically do not account for subsequent carbon cycle and climate responses to large-scale land-use change. Here we quantify the maximum potential temperature and CO2 benefits from pantropical forest restoration, including the Earth system response, using a fully coupled, emission-driven Earth system model (HadGEM2-ES). We perform an idealised experiment where all land use in the tropics is stopped and vegetation is allowed to recover, on top of an aggressive mitigation scenario (RCP2.6). We find that tropical restoration of 1529 Mha increases carbon stored in live biomass by 130 Pg C by 2100 CE. Whilst avoiding deforestation and tropical restoration in the tropics removes 42 Pg C compared to RCP2.6, the subsequent reduction in extratropical and ocean carbon uptake means that carbon in the atmosphere only reduces by 18 Pg C by 2100. The resulting small CO2 (9 ppm) benefit does not translate to a detectable reduction in global surface air temperature compared to the control experiment. The greatest carbon benefit is achieved 30–50 years after restoration before the Earth system response adjusts to the new land-use regime and declining fossil fuel use. Comparing our results with previous modelling studies, we identify two model-independent key points: (i) in a world where emission reductions follow the Paris Agreement, restoration is best deployed immediately, and (ii) the global carbon cycle response to reduced emissions limits the efficacy of negative emissions technologies by more than half. We conclude that forest restoration can reduce peak CO2 mid-century, but it can only modestly contribute to negative emissions.
- Article
(6595 KB) - Full-text XML
- BibTeX
- EndNote


Only a limited quantity of additional carbon can be added to the atmosphere before temperatures exceed the threshold of 2 ∘C above the pre-industrial levels specified in the Paris Agreement on climate change (Allen et al., 2009; United Nations Treaty Collection, 2016). The most comprehensive assessment gives a remaining budget of 318 Pg C for a 67 % chance to remain within 2 ∘C, albeit excluding some Earth system feedbacks such as permafrost thawing (Rogelj et al., 2018). To stay within 2 ∘C, net-zero emissions need to be achieved or if overshot negative emissions will be needed thereafter. Increasing the land carbon sink via natural climate solutions, such as forest restoration, particularly in the tropics, is often seen as a low-cost alternative to carbon capture and storage technologies or at least as a bridge until these negative emissions technologies are widely available (Griscom et al., 2017; Busch et al., 2019). Forest restoration is broadly defined as actions that lead to the recovery of forests, their biomass, biodiversity, or other ecosystem services, for example by preventing further disturbance (Lamb et al., 2005). However, there is much uncertainty and controversy over the role of large-scale forest restoration in sequestering carbon, which is often because the carbon cycle and energy balance responses of the Earth system to widespread land-use change are not considered (Bastin et al., 2019; Friedlingstein et al., 2019a; Lewis et al., 2019b, a; Veldman et al., 2019).
The impact of an increased land carbon sink on atmospheric carbon is mediated by its response to temperature changes and the global carbon cycle feedback via ocean carbon uptake and CO2 fertilisation impacts (e.g. Joos et al., 1999). Hence, the efficiency of proposed natural climate solutions such as tropical forest restoration should be considered in an Earth system context. The tropics are generally considered most suitable for large-scale forest restoration due to their high aboveground biomass (AGB) potential and biogeophysical response to increased tree cover, via enhanced evaporative cooling and limited albedo changes (Claussen et al., 2001; Arora and Montenegro, 2011). The potential carbon and temperature benefit of increasing tropical tree cover has been explored using various approaches that do not include the feedbacks between climate and carbon cycle (Houghton et al., 2015; Houghton and Nassikas, 2018; Bastin et al., 2019; Busch et al., 2019). Approaches with Earth system models (ESMs) that include the feedbacks between climate and carbon cycle used either pre-industrial CO2 conditions (Bathiany et al., 2010) or high-CO2 conditions (Arora and Montenegro, 2011). However, no model experiment has been conducted that includes large-scale tropical forest restoration, interactive land-use emissions, and Earth system feedbacks in a scenario that would limit warming to 2 ∘C. This is an important omission from the literature because large-scale restoration is most likely to occur as part of a set of measures designed to meet commitments in the Paris Agreement.
Here we explore the potential climate benefits of pan-tropical natural restoration until the end of the century in an Earth system model (HadGEM2-ES) under an aggressive mitigation scenario (RCP2.6) that limits warming to below 2 ∘C. This scenario sees a rapid and sustained reduction of fossil fuel emissions, in part through replacement by an expansion of bioenergy crops. Based on an emission-driven RCP2.6 control simulation (esmrcp26) with dynamic vegetation (Jones et al., 2013), we performed a simulation where all current and future anthropogenic land use in the tropics (19.375∘ S–23.125∘ N) is stopped after 2 years following RCP2.6 land use and set to zero thereafter (2008–2100 CE). We call this experiment, where natural vegetation is then allowed to regrow, the restoration simulation (esmrcp26restor).
2.1 HadGEM2-ES
The Earth system model used here, HadGEM2-ES (Collins et al., 2011) contributed results to the last Intergovernmental Panel on Climate Change (IPCC) report (AR5; IPCC, 2013) and was part of phase 5 of the Coupled Model Intercomparison Project (CMIP5; Jones et al., 2011; Taylor et al., 2012). HadGEM2-ES includes a land and ocean carbon cycle, optionally with interactive land-use emissions, as well as a land surface scheme (MOSES II) with a dynamic global vegetation model that simulates the grid cell proportion that each plant functional type (PFT) occupies dynamically (TRIFFID, Top-down Representation of Interactive Foliage and Flora Including Dynamics). The atmosphere and land components have a resolution of 1.25∘ latitude and 1.875∘ longitude with a vertical atmosphere resolution of 38 layers up to 39 km in altitude. The ocean component has a horizontal grid of varying resolution, increasing from around 1∘ in the extratropics to at the Equator, and a vertical resolution of 40 unevenly spaced layers that increase towards the sea surface.
2.1.1 Met Office Surface Exchange Scheme version 2 (MOSES II)
The land surface scheme in HadGEM2-ES is the Met Office Surface Exchange Scheme (MOSES II; Essery et al., 2001), which simulates the fluxes of carbon as well as biogeophysical processes associated with the land surface. MOSES II employs a tiling approach that differentiates between nine different surface types: urban, water, ice, bare soil, and the five plant functional types (PFTs) C3 grasses, C4 grasses, shrubs, broadleaf trees, and needleleaf tree. There is no explicit crop surface type in the land surface scheme, meaning crops (and pastures) are represented as C3 and C4 grasses depending on environmental conditions. TRIFFID's ability to simulate the share of each PFT on a grid cell allows grassy and woody vegetation to expand onto abandoned grid cell space. After the cessation of agricultural activity, shrubs and trees therefore regrow depending on the climatological suitability of the region for each PFT and inter-PFT competition. The share of each PFT of a grid cell depends firstly on a grass–shrub–tree hierarchy, where shrub PFTs dominate grasses and tree PFTs dominate grasses and shrub, and secondly on a species competition approach (Lotka–Volterra) that determines the share between two PFTs of the same type (e.g. broadleaf and needleleaf) depending on height (Cox, 2001). Anthropogenic land use is represented by a disturbance mask, where shrubs and trees are removed and prevented from growing. The resulting bare soil is allocated to crops, i.e. C3 or C4 grasses (Collins et al., 2011). Harvesting cycles and consequences of intensive agriculture such as nutrient depletion and fertiliser input are not considered in the model. This means abandoned agricultural land is of the same “quality” as natural grassland, and succession is not impacted by previous land-use activities (e.g. soil nutrient depletion). Arrested succession (e.g. from plant diseases, fires, invasive species) is not considered in the model.
Land-use emissions are calculated interactively in the model following the land-use dynamics specified in RCP2.6. Both simulations have continued land use outside the tropics. Only emissions from the removal of woody PFTs (i.e. deforestation) are considered separate land-use flux. Thereby, deforested biomass is allocated to wood product pools with a fixed turnover of 1, 10, and 100 years (FWP being the sum of all biomass entering the WP pools), with the fraction allocated to each pool depending on the woody PFT type (Jones et al., 2011). Emissions from land use into the atmosphere (EDEFOR) are therefore the sum of the carbon fluxes from the wood product pools into the atmosphere at a given time. The carbon flux from the regrowth from abandoned areas, as well as the annual growth cycle of grasses/crops within agriculture regions, is included in the natural land carbon fluxes FLA (Jones et al., 2011; Liddicoat et al., 2013). This means EDEFOR is not directly comparable with land-use emissions from, for example, the Global Carbon Budget (Le Quéré et al., 2018). The land-to-atmosphere flux (FLA), as the difference between carbon uptake through net primary productivity (NPP) and the release of carbon into the atmosphere through Rh, excludes anthropogenic emissions but includes carbon uptake from regrowing vegetation following the cessation of anthropogenic disturbance (also known as “net ecosystem production”).
Aside the wood product pools, the land surface scheme in HadGEM2-ES consists of four soil carbon pools with different carbon residence times, modulated by soil temperature, soil moisture and soil carbon content (Collins et al., 2011). Carbon converted from living to dead biomass directly enters the soil carbon pools via litter flux (FSC), meaning there are no litter carbon pools in HadGEM2-ES.
2.2 RCP2.6
The IPCC AR5-scenario that comes closest to a 2 ∘C world is the Representative Concentration Pathway 2.6-3PD (Peak-Decline, for simplicity RCP 2.6; van Vuuren et al., 2011). In this scenario atmospheric CO2 concentrations achieve a peak radiative forcing of 3.0 W m−2 by 2050 CE and declines to 2.6 W m−2 by the end of the century. This corresponds to a warming of just under 2 ∘C in HadGEM2-ES (CMIP5 mean: 2 ∘C; Jones et al., 2013). To achieve this in RCP2.6, CO2 emissions need to decrease rapidly from 2020 CE onwards through a combination of measures, including bioenergy with carbon capture and storage (BECCS) (Smith et al., 2016; van Vuuren et al., 2011). Emissions from fossil fuels are projected to peak by 2020 and turn negative in this scenario by the end of the century (Liddicoat et al., 2013; van Vuuren et al., 2011). Peak net carbon emissions from land-use and land-cover change (LULCC) in RCP2.6 are small (<2 Pg C yr−1) compared to fossil fuel emissions (9.2 Pg C yr−1). With the widespread implementation of BECCS, tropical forest is replaced by bioenergy crops, leading to an increase in land-use area by 286 ×106 ha (Mha) by 2100 in RCP2.6 (van Vuuren et al., 2011). New bioenergy crops are primarily allocated near existing land use (Hurtt et al., 2011; van Vuuren et al., 2011).
The simulations presented here use carbon emissions from the use of fossil fuels and land use to interactively calculate atmospheric CO2 rather than prescribing CO2 concentrations (i.e. it is “emission driven”). HadGEM2-ES would simulate lower atmospheric CO2 concentrations than defined by RCP2.6 when driven by fossil fuel emissions directly derived from the integrated assessment model simulations (Jones et al., 2013). Therefore, fossil fuel emissions were computed by a RCP2.6 concentration-driven HadGEM2-ES simulation (Liddicoat et al., 2013). The interactive carbon budget in HadGEM2-ES and its terms are presented in Eq. (1).
In addition to the land-use carbon flux (EDEFOR), fossil fuel emissions (EFF) and the land flux into the atmosphere (FLA), the carbon cycle in HadGEM2-ES includes the flux from ocean to atmosphere (FOA), and the rate of change in atmospheric carbon concentration () or atmospheric growth rate of carbon (GATM) (Eq. 1). All forcing data, except the scenario related fossil fuel and land-use/disturbance mask, have been implemented in HadGEM2-ES as described in Jones et al. (2011). The urban (20 Mha), inland water (330 Mha) and the ice areas (163 Mha) remain constant throughout both simulations.
3.1 Restoration impacts on land cover (2006–2100 CE)
In the control simulation (esmrcp26), broadleaf forest declined globally by 107 Mha from 2006–2100 CE, driven by a decline of 213 Mha in the tropics that is somewhat offset by an 106 Mha increase in the extratropics. In the restoration simulation (esmrcp26restor), abandoning all present-day and future land-use areas led to an increase in broadleaf forest of 671 Mha globally and 572 Mha in the tropics (Fig. 1a). Unsurprisingly, the largest differences between esmrcp26 and esmrcp26restor in all five PFTs used in the model (Cox, 2001) are located in the tropics (Table A1). Anthropogenic land use increases in esmrcp26 over the 94 years, as do C3 grasses (and crops) and to a smaller extent shrubs, while tree PFTs and C4 grasses decline. By contrast, in esmrcp26restor current anthropogenic land use of 1529 Mha in the tropics abruptly ends, with shrub area increasing rapidly in the first decade after the cessation of land use at the expense of C3 grasses (and crops), followed by a long-term increase in broadleaf trees. The successional cycle after the cessation of anthropogenic land use is characterised by an increase in shrub PFTs within 7 years, before slowly declining again towards the end of the century, making way for tree PFTs.
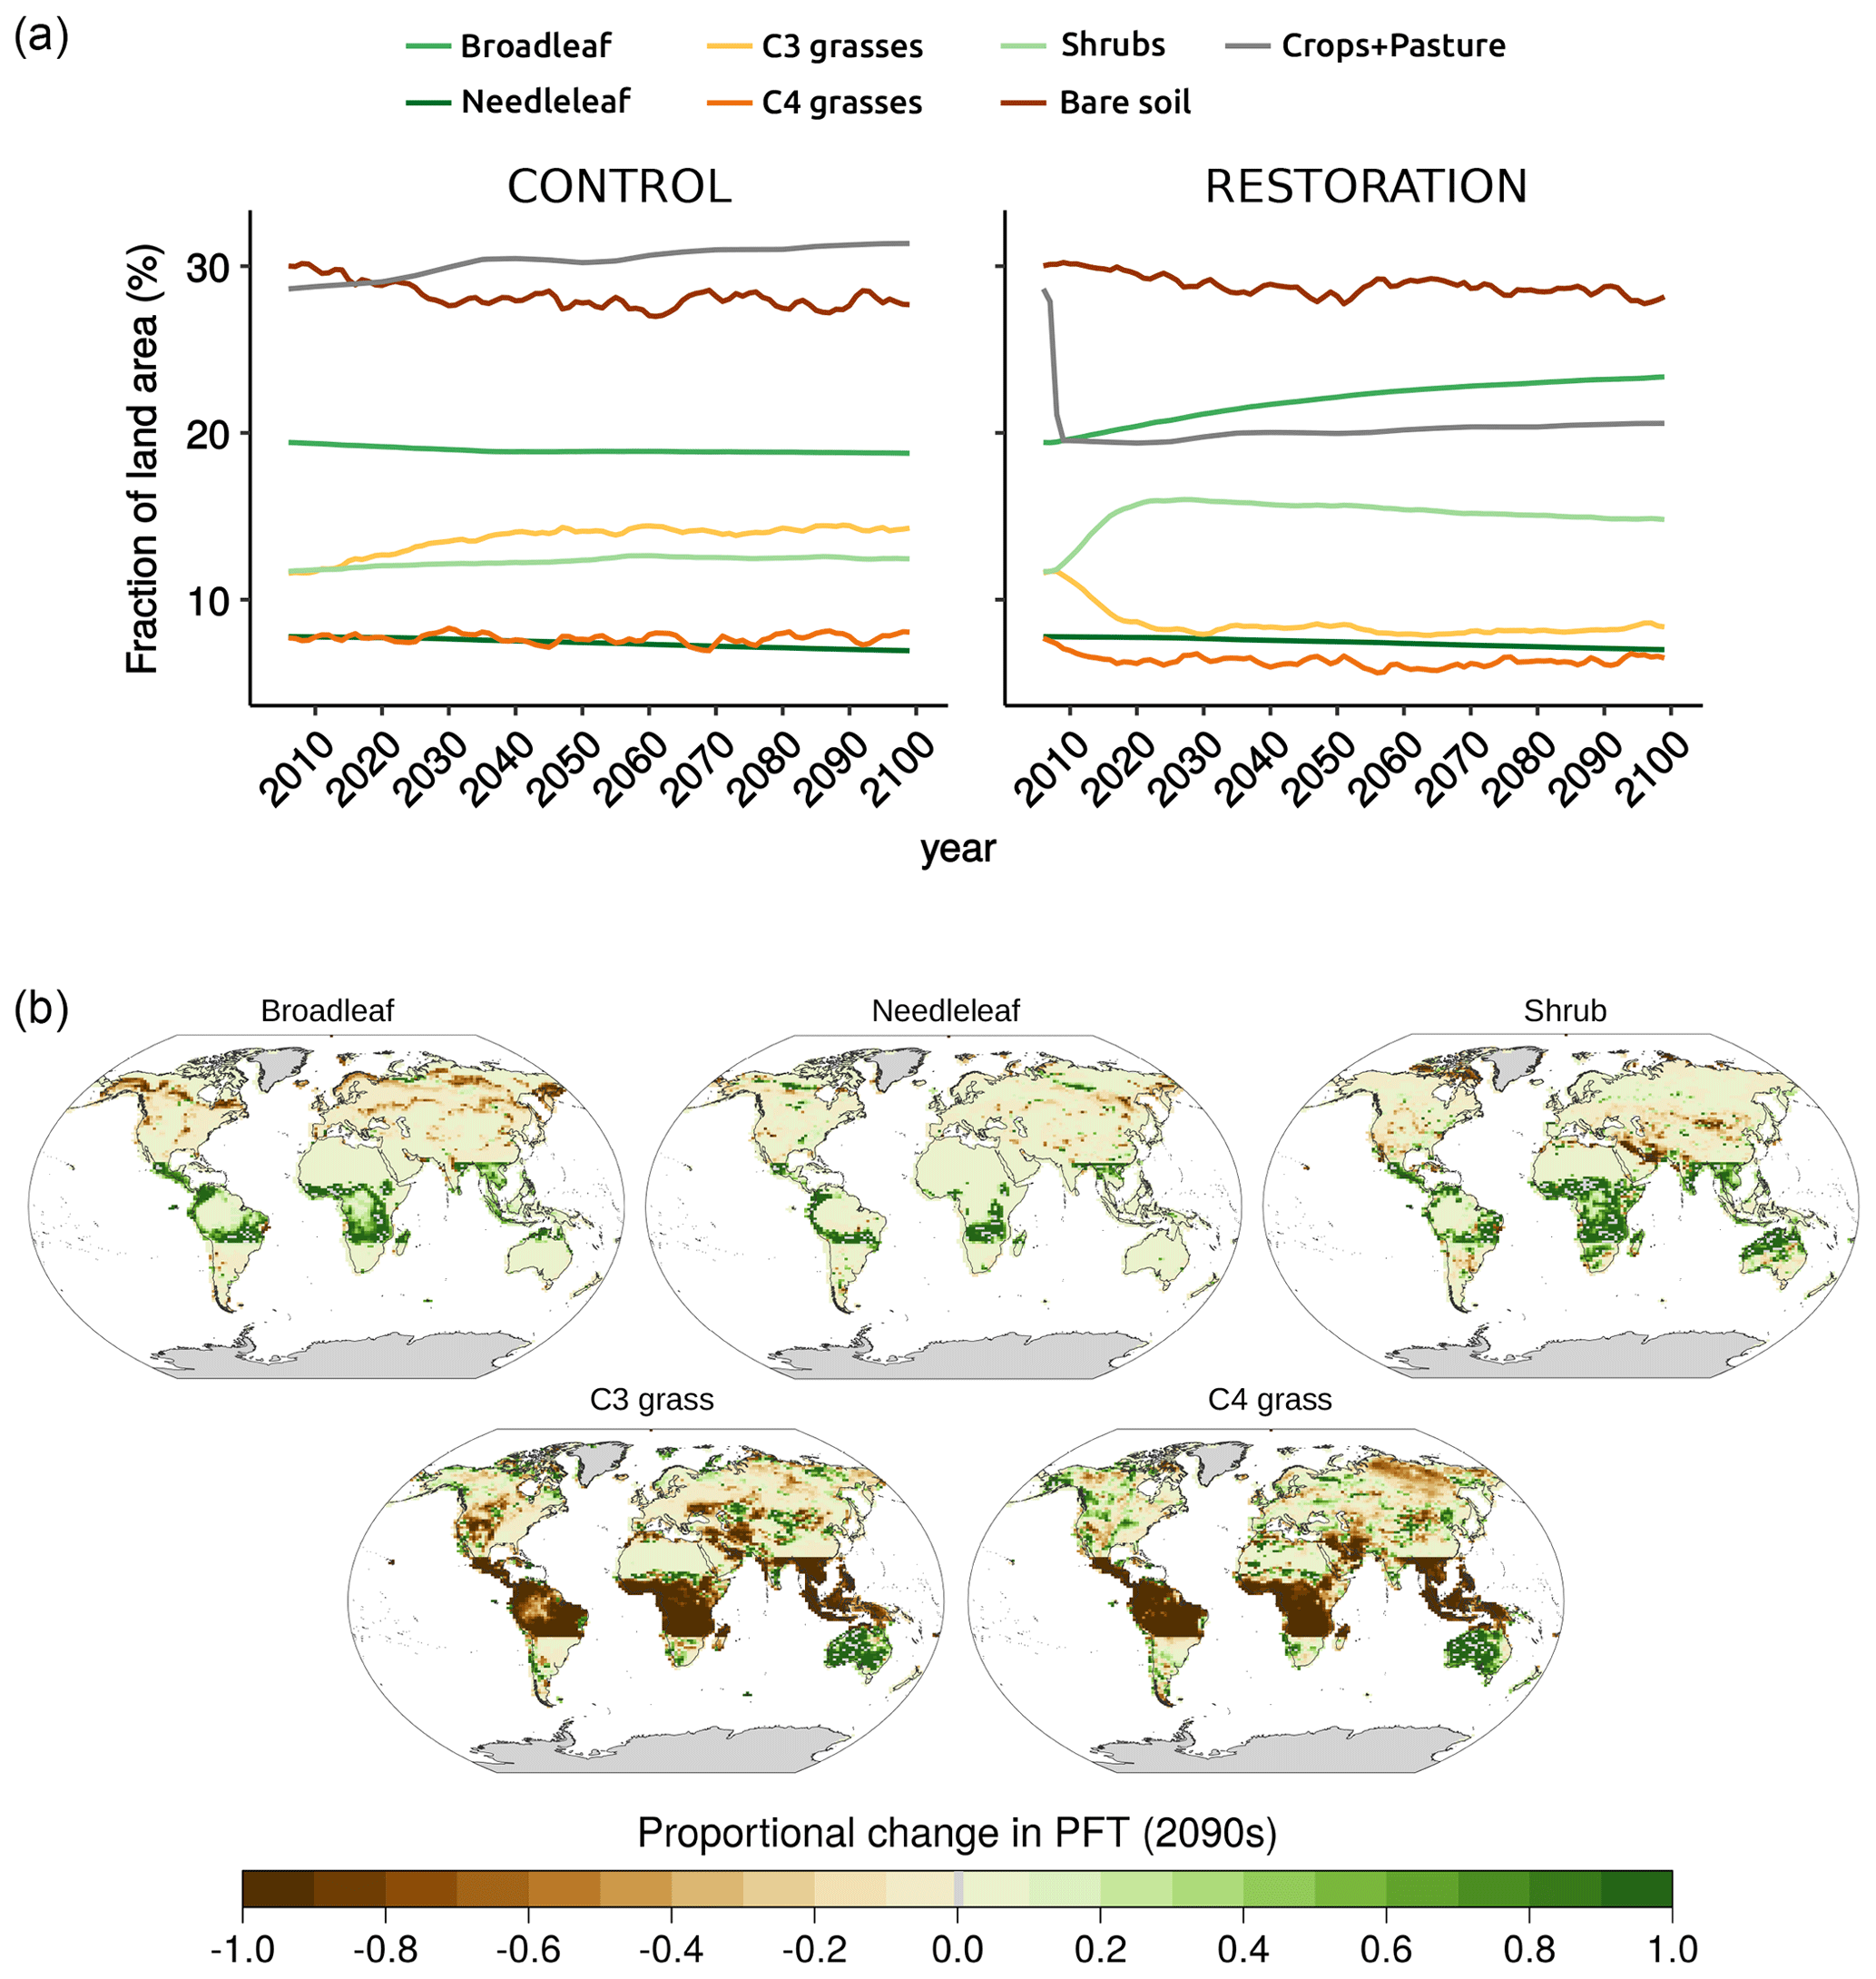
Figure 1(a) Change in land cover (2006–2100 CE) in control (left) and restoration (right) simulations. Urban (0.1 %), inland water (1.9 %), and ice fraction (9.7 %) are constant and not included. An anthropogenic land-use mask is added on top of other land-cover types, replacing woody PFTs with bare soil and preventing woody PFTs from replacing grassy PFTs, which include crops and pasture (see Sect. 2.1.1). (b) Spatial difference in land cover in the restoration simulation relative to the control simulation over the 2090s. A change of 1 represents a doubling of that land-cover type relative to the control simulation, a change of −1 means a reduction of 100 %.
The spatial pattern of land-cover change shows that the largest change in esmrcp26restor compared to esmrcp26 by 2100, 786 Mha, is the growth of new broadleaf trees, mostly located on the edges of the Amazon and Congo basins and the periphery of the SE Asian and Australasian tropics where broadleaf trees more than doubled by the 2090s (Fig. 1b). The only region in the tropics with substantially fewer broadleaf trees in esmrcp26restor compared to esmrcp26 is located at the Brazilian Atlantic coast, likely due to simulated warmer and dryer conditions (Fig. A2 in the Appendix). Most of the smaller 10 Mha increase in needleleaf trees in the tropics is located around the edges of the Amazon and Congo basins in esmrcp26restor. Shrubs also substantially increased in the tropics by 409 Mha in esmrcp26restor compared to esmrcp26 (Table A1). These increases in tree and shrub cover in esmrcp26restor compared to esmrcp26 in the tropics were at the expense of C3 and C4 grasses (including crops).
Abruptly stopping anthropogenic land use in the tropics led to vegetation changes outside the tropics. Broadleaf trees declined, by 8 Mha, mostly in the high latitudes of North America and East Asia, being replaced by needleleaf trees. Shrubs declined in total, particularly along the eastern edge of the Arabian Peninsula. C3 grasses declined overall, with a complex spatial pattern: increases in Australia, southern Africa, and central Asia but almost 100 % decreases in western Asia and the mid-western US. C4 vegetation increases in Australia and the mid-western US, leading to a net increase in C4 grasses in the extratropics. Overall, tropical land-use change altered patterns of vegetation cover globally by 2100 CE.
Finally, global deforestation emissions, EDEFOR, correspond to the episodes of land-use expansion in RCP2.6, with deforestation halted in the tropics only in esmrcp26restor. The pattern is reflecting waves of deforestation until 2035 CE, after which emissions decline rapidly and remain low for the rest of the century (Fig. 2). In esmrcp26, these deforestation emissions are largest in the tropics, particularly the Amazon, central Africa, and South East Asia (Fig. A1). In esmrcp26restor, tropical deforestation is halted, but extratropical deforestation occurs at a modest level until 2035 CE under RCP2.6. Overall, global cumulative EDEFOR emissions are 16.1 Pg C (esmrcp26) and 6.5 Pg C (esmrcp26restor), resulting in the prevention of 9.6 Pg C of emissions by halting deforestation alone.
Table 1Cumulative terrestrial carbon fluxes for NPP, litterfall (FSC), flux to the wood product pools (FWP), soil respiration (Rh), net change in living biomass , net change soil carbon (FSC−Rh), and the net land-to-atmosphere carbon flux (FLA) over the period 2006–2100 CE in the control and restoration simulations, as well as their difference. Global, tropical, and extratropical fluxes are presented. Negative FLA values indicate a net terrestrial sink. Values may not completely add up due to rounding.
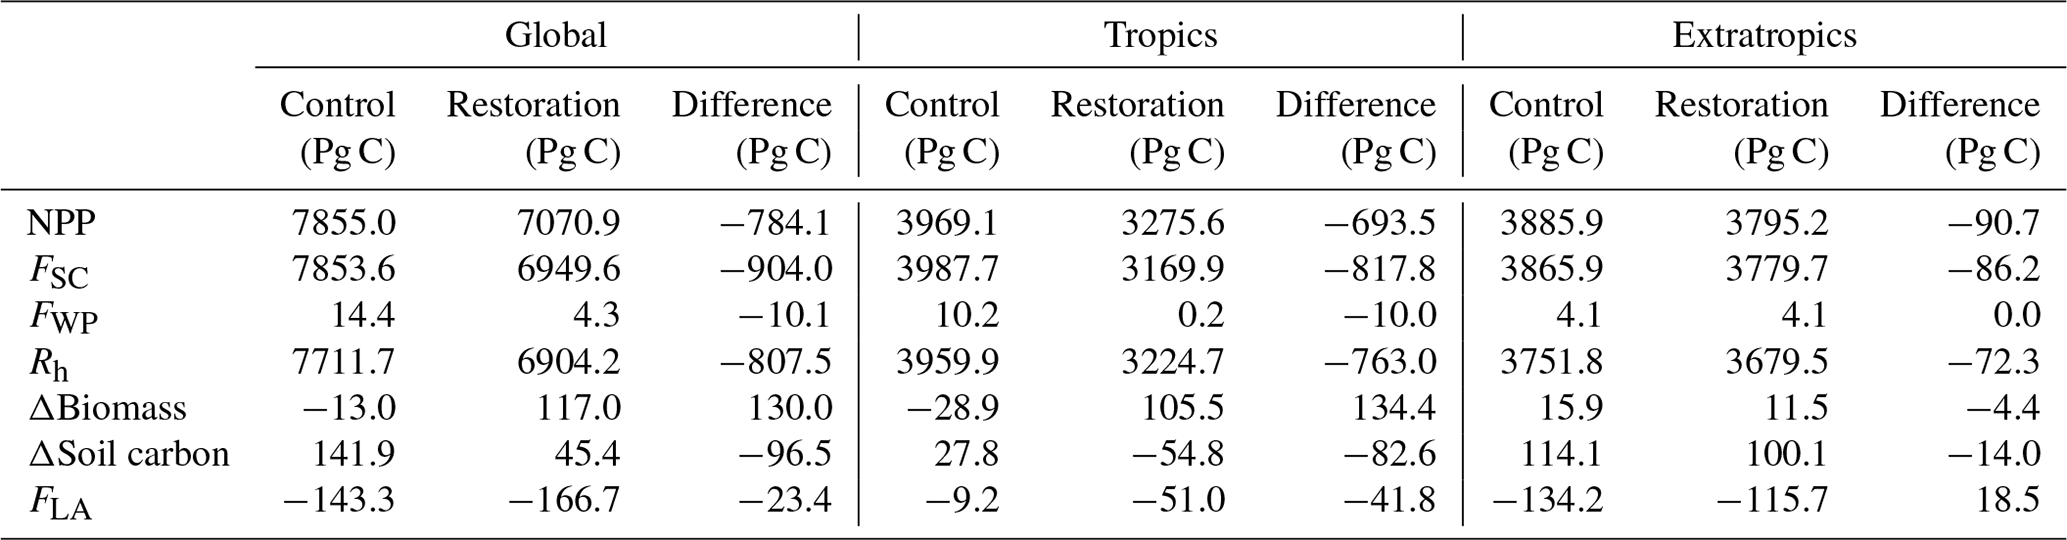
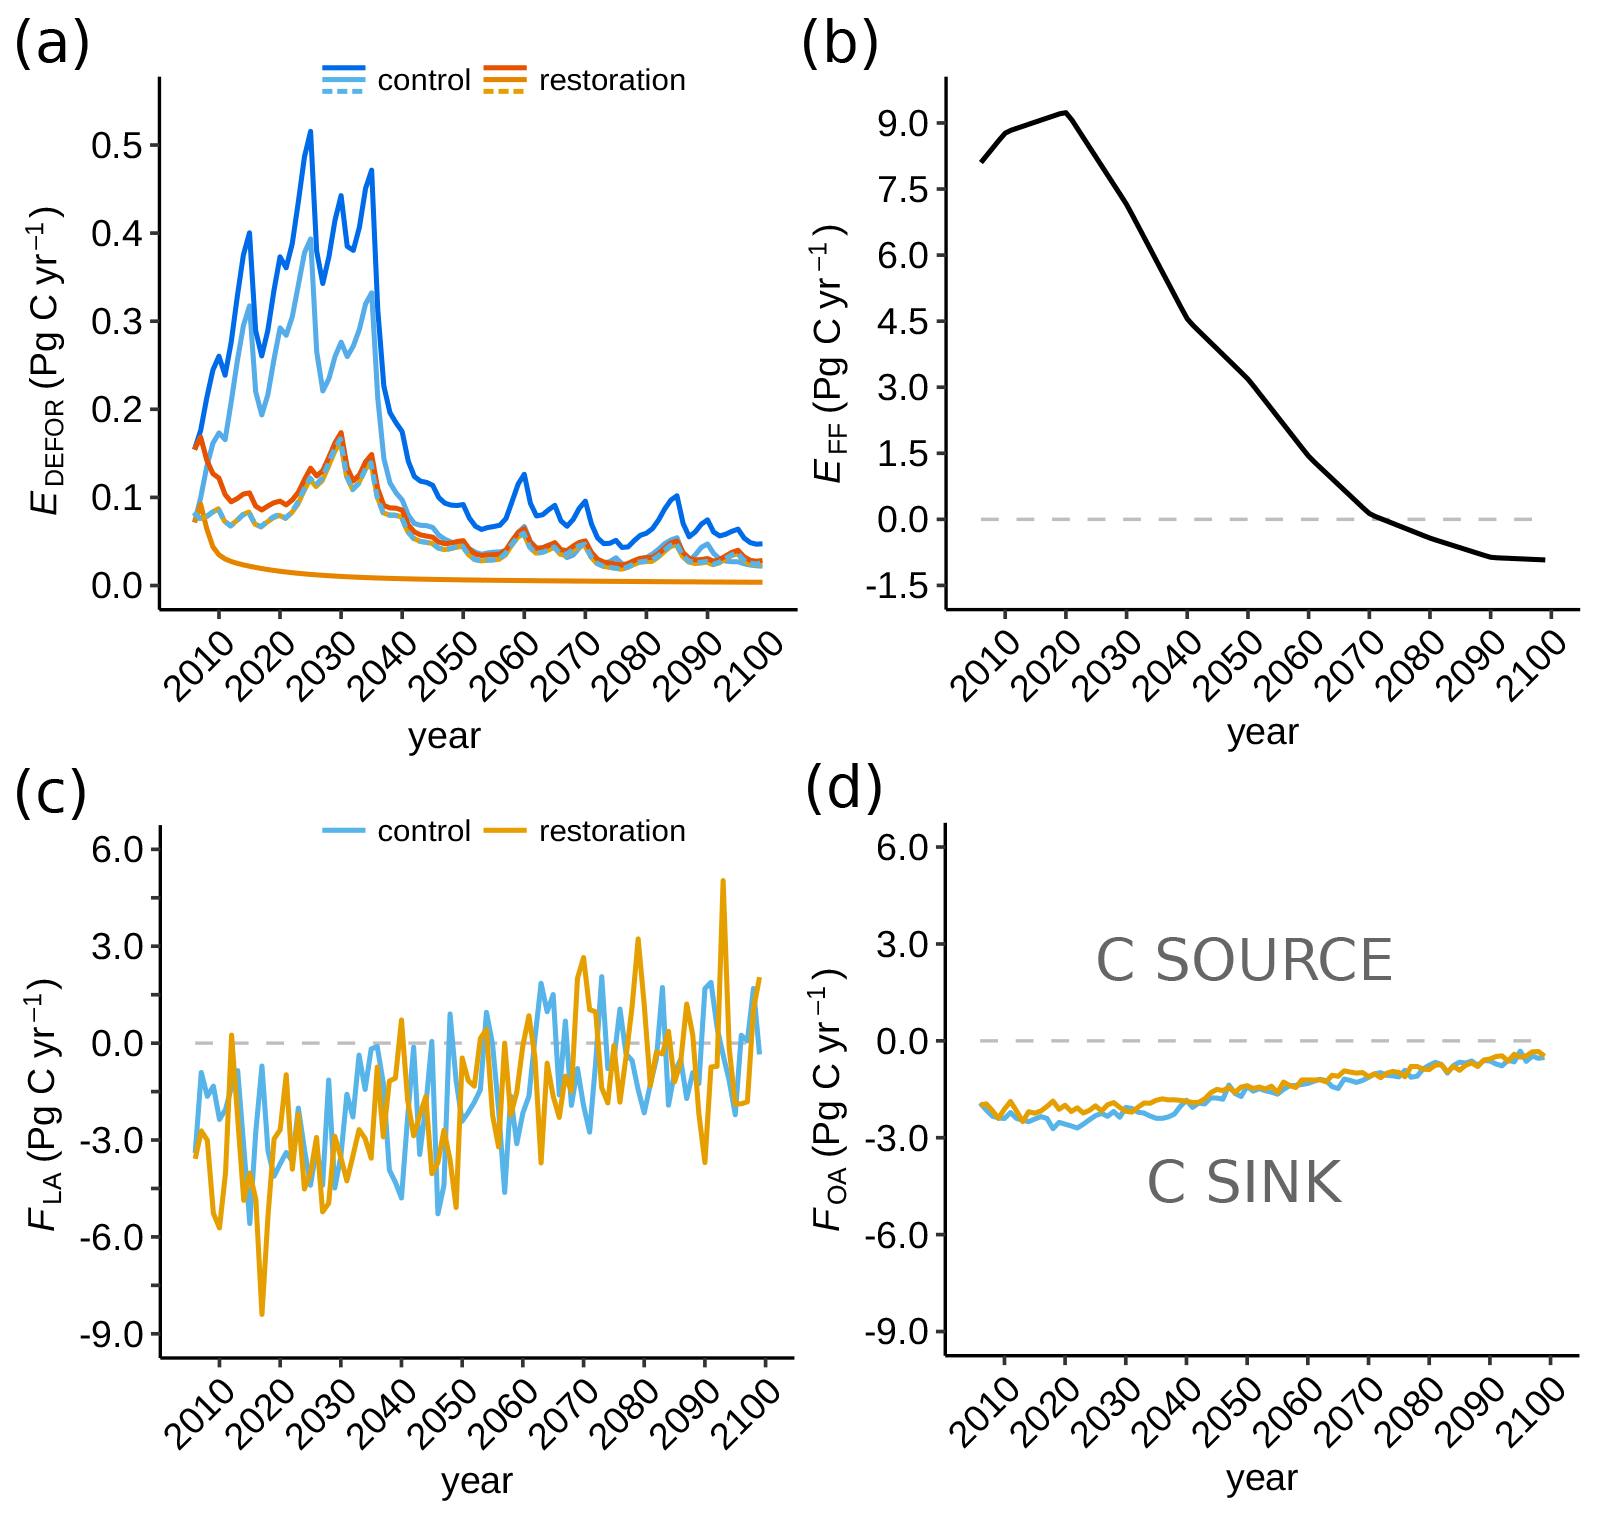
Figure 2Modelled carbon emissions and fluxes (2006–2100 CE) into the atmosphere for the control run (blues) and restoration simulation (oranges). (a) Deforestation emissions (EDEFOR); dark colours are global emissions, and light colours are the tropics and dashed lines are emissions outside the tropics. (b) Prescribed fossil fuel emissions (EFF) following RCP2.6 (Liddicoat et al., 2013). (c) Global land-to-atmosphere flux (FLA). (d) Global ocean-to-atmosphere flux (FOA). Negative values represent a carbon sink. Note the different vertical scales.
3.2 Land carbon response to tropical restoration
The terrestrial carbon cycle responds to the tropical land-cover change with an increase in net carbon uptake, driven by an increase in biomass in the tropics. Overall, there is a decline in net primary productivity (NPP), but there is also a stronger decline in litterfall (flux of dead plant matter) into the soil. The flux of carbon into the atmosphere from soil respiration is smaller than the uptake through NPP, thereby creating a net carbon sink (Table 1). NPP declines globally at first due to the change from grassy vegetation and crops to trees in esmrcp26restor and secondly due to the lower atmospheric CO2 concentrations in esmrcp26restor relative to esmrcp26 (Fig. A3a). The subsequent decline in dead plant matter leads to lower soil carbon stocks in esmrcp26restor compared to esmrcp26, which ultimately leads to lower soil respiration (Table 1).
The flux of carbon from the atmosphere into the living biomass carbon pool is modulated by the NPP of the different vegetation types. The global trend, variability, and the differences in both simulations are driven by tropical NPP, although extratropical NPP also declines after ∼40 years (Fig. A3a). Taken together this results in lower cumulative global NPP at the end of esmrcp26restor compared to esmrcp26 (Table 1). The main reasons for the greater NPP decline in esmrcp26restor are that grassy vegetation has a 2 to 3 times greater NPP per unit area than tree PFTs in HadGEM2-ES (Table A2) and a lower CO2 fertilisation from lower atmospheric CO2 levels in the second half of the century.
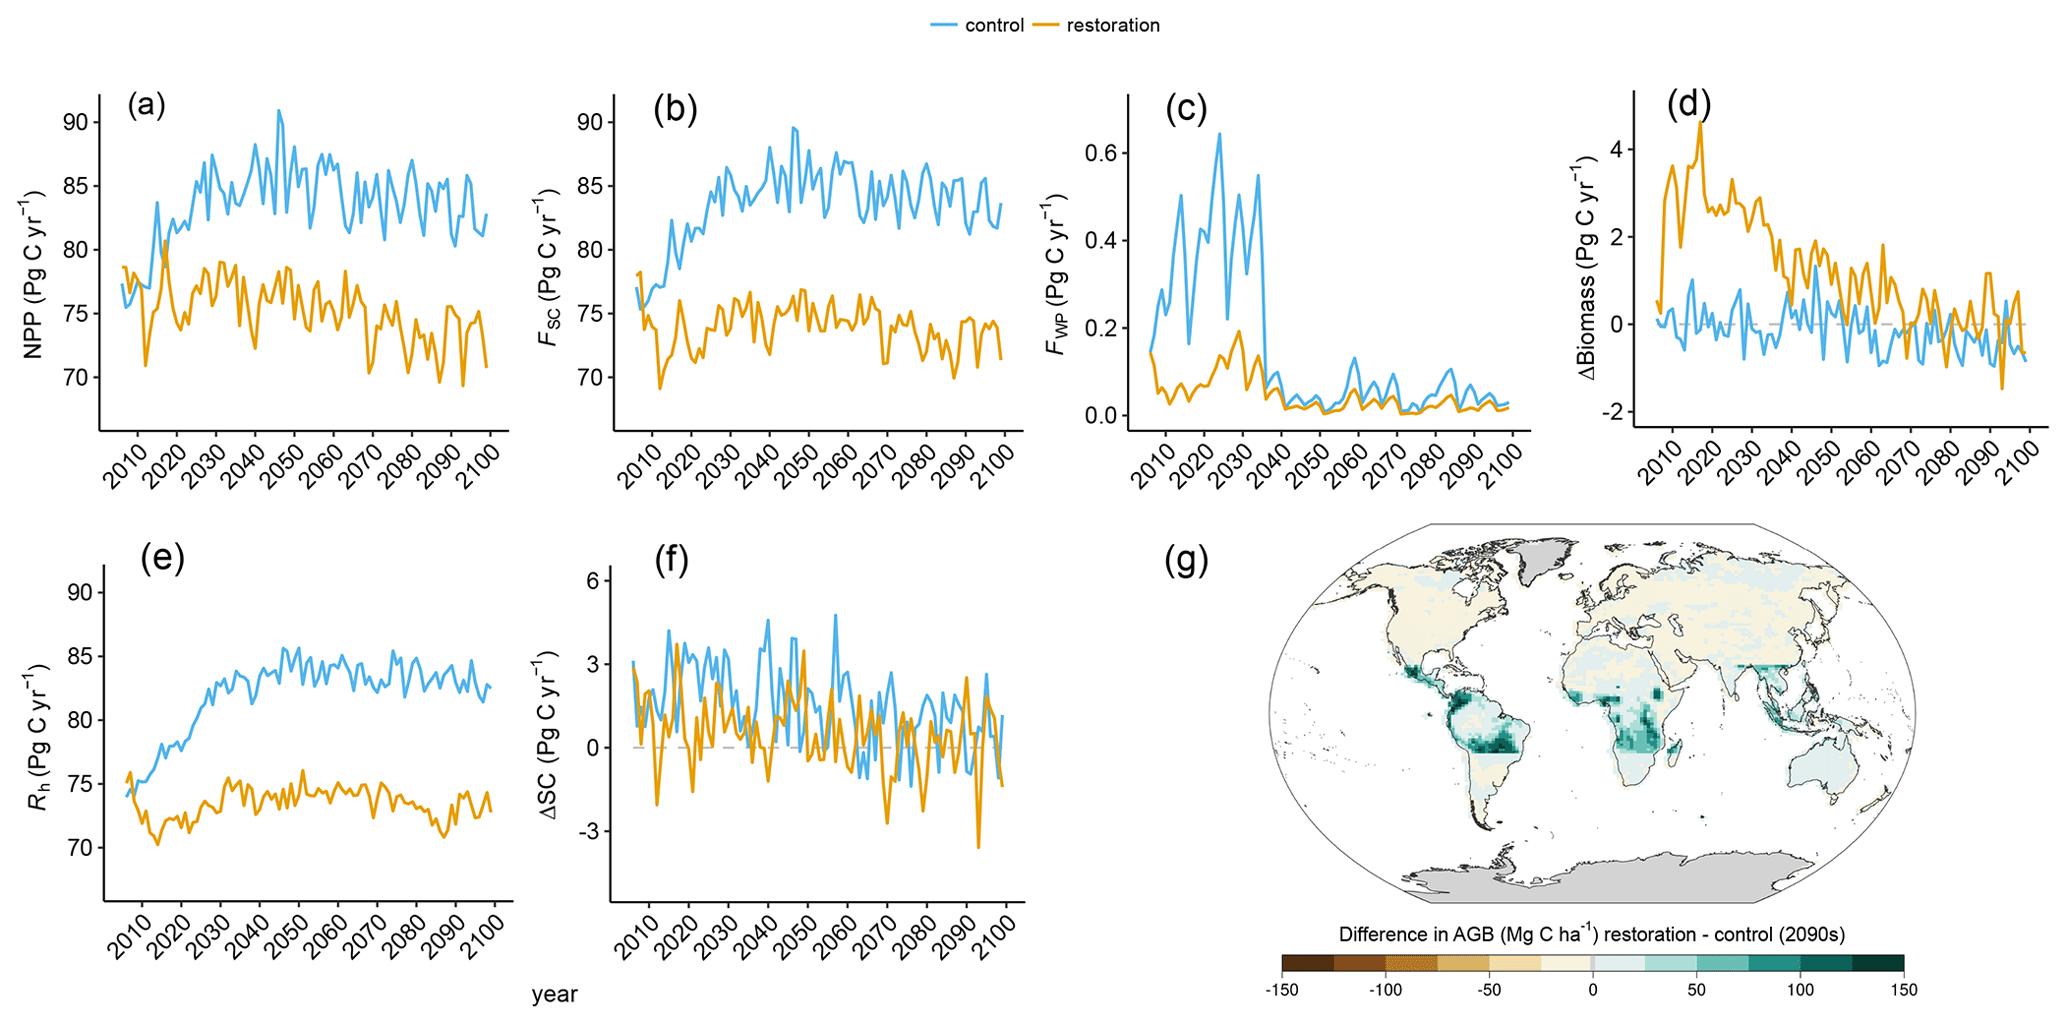
Figure 3Time series of (a) global net primary production (NPP), (b) global carbon flux into the soil (FSC), (c) global carbon flux into the wood product pools (FWP), (d) global annual change in aboveground biomass (ΔBiomass), (e) global soil respiration (Rh), and (f) global annual change in soil carbon (ΔSC) in the restoration (yellow) and control (blue) simulation. (g) Spatial difference in biomass between the restoration and control simulations over the 2090s (1 Mg C ha−1 = 10 kg C m−2).
The carbon flux of dead plant matter into the soil carbon pool (FSC) is determined by a temperature- and PFT-specific turnover rate, as well as the areal extent and biomass of each PFT. Trends in FSC have a similar spatial and temporal pattern to NPP (Fig. 3b; Table 1). In esmrcp26, global FSC increases before it slowly declines from 2040 CE onward. In esmrcp26restor, FSC initially drops before it increases until 2040 CE and then again declines over the second half of the simulation. In both simulations global FSC is primarily modulated by the tropics (Fig. A3b). Outside the tropics FSC gradually increases until 2030 CE, after which it remains constant in esmrcp26 but slowly declines in esmrcp26restor. The difference in cumulative global FSC by 2100 CE is driven by its large decrease in the tropics and further amplified by a more modest decline in the extratropics (Table 1). In particular the decrease in tropical FSC in esmrcp26restor is caused by the decline in grassy vegetation. At the same time lower overall production in extratropics leads to decreased FSC in esmrcp26restor.
Finally, some land area is deforested, 458 Mha, as specified by RCP2.6 land use in esmrcp26 but only 172 Mha specified by RCP2.6 land use in the extratropics in esmrcp26restor. This global carbon flux from deforestation is largely transferred into the wood product pool (FWP), and so it shows the same pattern as deforestation (Figs. 3c cf. 2a).
The net change in living biomass carbon is the difference between NPP and the combined fluxes into the soil carbon pool and the wood product pool (ΔBiomass = NPP − FSC−FWP). Globally, in esmrcp26, ΔBiomass slowly shifts from net-zero change to a small loss by the end of the century (Fig. 3d). This is because high deforestation before 2040 CE compensates for the initial rise in NPP and litterfall flux (FSC). In esmrcp26restor, ΔBiomass moves from a rapid gain in the first decade towards net-zero change by the end of the century, driven by NPP initially exceeding FSC and no tropical deforestation resulting in a small flux from wood products (FWP; Fig. 3d). Again, these differences are driven by changes in the tropics. Here ΔBiomass continuously declines in esmrcp26 but peaks and then declines in esmrcp26restor (Fig. A3f). In the extratropics, ΔBiomass turns from a net gain in the first half of the century into a net loss in the second half of both simulations although more so in esmrcp26restor. The cumulative global biomass difference between both simulations is driven by the increase in biomass in the tropics in esmrcp26restor, which is slightly offset by the late decline in extratropical biomass (Table 1). In total the increase in biomass resulting from tropical restoration alone is 134.4 Pg C by 2100 CE, with a total global difference from esmrcp26 of 130 Pg C (Table 1). Averaged over the last decade of the simulation, the grid cell by grid cell difference in mean biomass carbon density in the tropics is up to 150 Mg C ha−1 between the two simulations (Fig. 3g). Biomass growth mirrors the increase in woody PFTs and is highest around existing forest edges in Amazonia, northern Mexico, and the Congo Basin.
In terms of timescales, biomass carbon increases are highest in the first 20–40 years after land use ceases. On a per hectare basis, the median carbon accumulation rates over first 20 years after land-use cessation is 1.8 Mg C ha−1 yr−1 (range 0–5.5 Mg C ha−1 yr−1), using the grid cells where the share of broadleaf trees increased by at least 30 % of the grid-box area (n=224) in esmrcp26restor (dark green in Fig. 3g). Thereafter, uptake rates decrease to a median of 0.5 Mg C ha−1 yr−1 (−3.4 to 3.8 Mg C ha−1 yr−1) for the remaining 71 years. Median biomass increases by 35.4 Mg C ha−1 (0.6–86.3 Mg C ha−1) within 20 years of tropical land-use stopping and by 81.3 Mg C ha−1 (41.6–146.7 Mg C ha−1) over the whole simulation (Fig. A5). By 2100 CE median biomass for these new broadleaf forests is 165.2 Mg C ha−1 (62.9–209.7 Mg C ha−1). For comparison, in esmrcp26 the same 224 grid cells have a median biomass of 56.3 Mg C ha−1 (5.3–134.6 Mg C ha−1) by 2100 CE. The median biomass for all of the tropics is 46.9 Mg C ha−1 (0–207.1 Mg C ha−1) in esmrcp26 with land use and 105.0 Mg C ha−1 (0–210.5 Mg C ha−1) in esmrcp26restor.
The changes in soil carbon (ΔSC) are of the same magnitude as the changes in biomass carbon. In esmrcp26, ΔSC increased by 141.9 Pg C over 2006–2100 CE, mostly in the extratropics (114.1 Pg C), because of lower heterotrophic soil respiration relative to the litter influx (Table 1), likely due to cooler temperatures. In esmrcp26restor, global soil carbon uptake is much lower at 45.4 Pg C, with a similar strong uptake in the extratropics (100.1 Pg C) but a loss of soil carbon in the tropics (−54.8 Pg C). This is due to land-cover change from grass and crops to woody vegetation with lower NPP and litter input (Table 1). The net change of the soil carbon pool is determined by the difference between litter inputs (FSC) and heterotrophic soil respiration (Rh), i.e. the flux from the soil carbon pool into the atmosphere. Rh itself is a function of temperature, soil carbon, and FSC (Essery et al., 2003), so it increases as FSC and NPP increase. Therefore, overall Rh increases to a much higher level in esmrcp26 by about 2030 CE and stays high with a slight decline. By contrast, Rh declines rapidly in esmrcp26restor within a decade and only partially recovers, staying at a lower level until 2100 CE (Fig. 3e). As with NPP and FSC, the global differences in Rh between esmrcp26 and esmrcp26restor are driven by the decline in tropical Rh in esmrcp26restor and modulated by marginal differences in the extratropics (Fig. A3e), ultimately linked to lower atmospheric CO2 concentrations leading to less CO2 fertilisation, lower NPP, and less litterfall in esmrcp26restor compared to esmrcp26 (Table 1). Global ΔSC in both esmrcp26 and esmrcp26restor is net positive but saturates towards the end of the century, with, on average, lower values in esmrcp26restor (Fig. 3f). The difference comes from the tropics, where ΔSC in esmrcp26 varies around zero but is on average ∼1 Pg C yr−1 lower in esmrcp26 (Fig. A3g). Extratropical ΔSC slowly declines in both simulations but remains net positive. The reason for the cumulative difference in global soil carbon content is a net decline in Rh relative to FSC (Table 1).
Both simulations show that the land-to-atmosphere flux (FLA) is a strong carbon sink at the beginning of the simulation (average 3.4 Pg C yr−1 in the 2020s in both simulations) but that this sink is diminishing (Fig. 2c). This is driven by a greater decline in NPP relative to Rh. In the tropics, terrestrial carbon uptake reduces throughout both simulations and the land turns into a carbon source in the final 50 years of both simulations. In the extratropics, the land is a carbon sink for most of both simulations, only turning into an occasional net source towards the end of the century. Overall, cumulative carbon uptake in esmrcp26restor is 16 % higher than in esmrcp26 (Table 1). The overall increased carbon uptake in esmrcp26restor relative to esmrcp26 becomes apparent in the difference in cumulative FLA (Fig. 4c). The difference between the two simulations first grows until 2036 CE, but then declines again after 2066 CE. This pattern is due to a greater change in NPP relative to Rh in esmrcp26restor. First the tropical land-cover change increases NPP relative to Rh in esmrcp26restor, while in esmrcp26 this ratio remains unchanged until 2036 CE. In the last part of both simulations NPP then declines relative to Rh but more so in esmrcp26restor due to lower CO2 fertilisation from lower atmospheric CO2 compared to esmrcp26, causing the difference between both simulations to shrink. The global cumulative difference in land to atmosphere flux between esmrcp26restor and esmrcp26 is −23.4 Pg C (Table 1), with the largest difference at 2031 CE (−26.5 Pg C).
A large multi-year variability in FLA is associated with fluctuations between the components of the land–atmosphere carbon flux (Fig. 2c). Global NPP in the simulations exhibits large multi-year variability of 4 Pg C yr−1 throughout both simulations, driven by climate variability (Fig. 3a). This variability of ∼4 Pg C yr−1 is also seen in FSC and translates into a ∼3 Pg C yr−1 variability in ΔSC and Rh (Fig. 3b, e, and f).
3.3 Ocean and atmosphere feedbacks
The ocean net carbon sink (i.e. ocean to atmosphere carbon flux, FOA) declines in both esmrcp26 and esmrcp26restor over the whole simulation period (Fig. 2d). The cumulative net sink is smaller in esmrcp26restor compared to esmrcp26 by 15 Pg C, resulting from the lower atmospheric CO2 concentrations, leading to a reduced disequilibrium between ocean pCO2 and the atmospheric CO2 concentrations. This reduced uptake by the ocean limits the impact of restoration on atmospheric CO2. The cumulative difference in FOA increases between both runs between 2014–2036 CE before saturating in the second part of the century (Fig. 4c and Table 2).
The net carbon flux into the atmosphere (FA) peaks in the mid-2040s before turning negative (Fig. 4c). This is driven firstly by the specified RCP2.6 fossil fuel emission scenario which peaks at 2020 CE (Fig. 4b). The difference between esmrcp26 and esmrcp26restor is that peak emissions are lower because of the additional forest restoration and halting anthropogenic land-use emissions (Fig. 4b). Cumulatively, FA is lower by 18 Pg C in esmrcp26restor than esmrcp26 (Table 2).
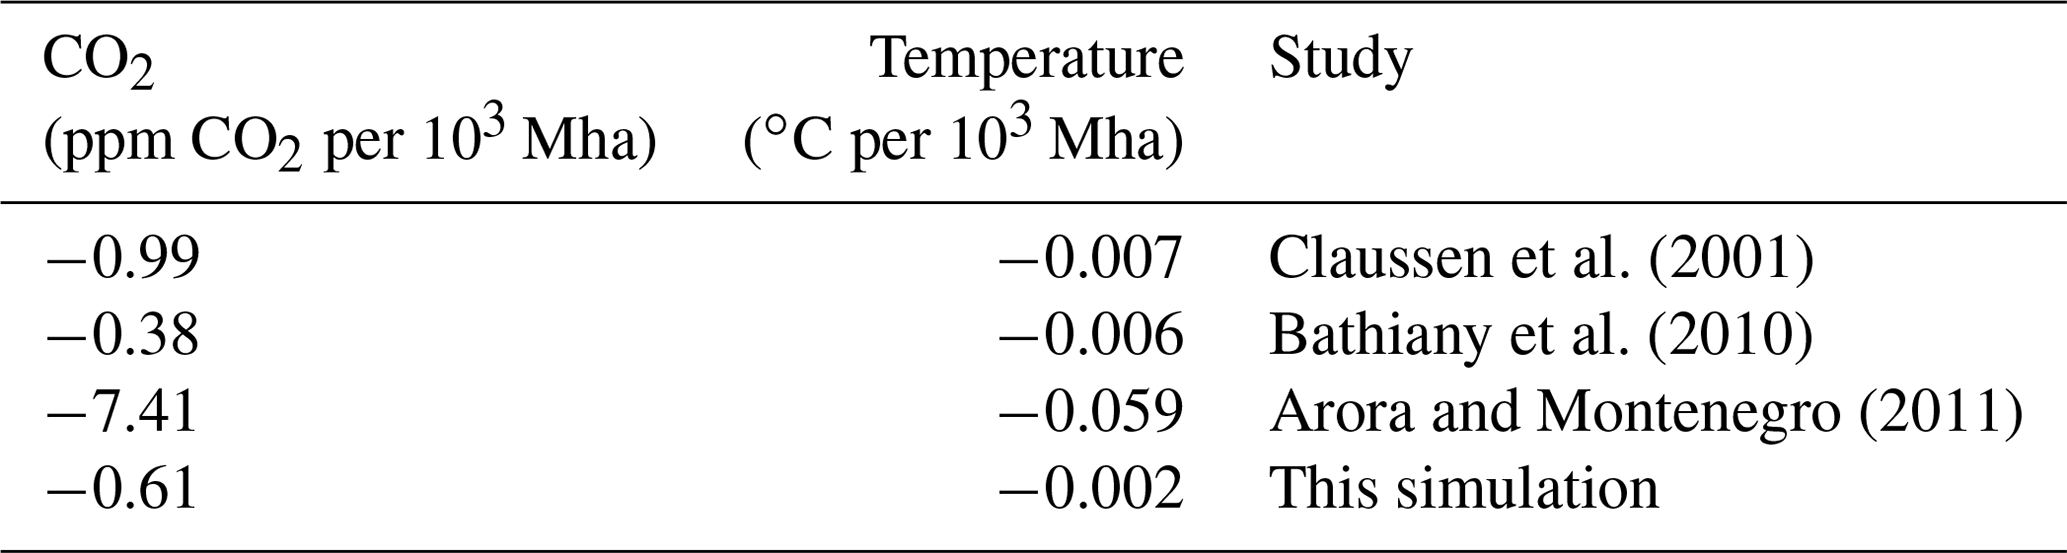
This 18 Pg C difference is equivalent to a benefit of 9.5 ppm atmospheric CO2 in esmrcp26restor. The maximum difference between both simulations is 17.1 ppm at 2037 CE (35.1 Pg C), with an extended period of relatively lower CO2 concentrations until 2070s (Fig. 5c), and seen more clearly as decadal means (Fig. 5d). After the 2070s the difference between esmrcp26 and esmrcp26restor diminishes, caused by a combined decline in ocean and land carbon uptake in esmrcp26restor relative to esmrcp26. Both can be explained through the carbon cycle response to lower atmospheric CO2: a decrease in the difference in partial pressure of CO2 between atmosphere and oceans and a decline in plant NPP due to lower CO2 fertilisation. This results in a CO2 sensitivity to forest restoration of −0.61 ppm CO2 per 103 Mha restored (Table A3).
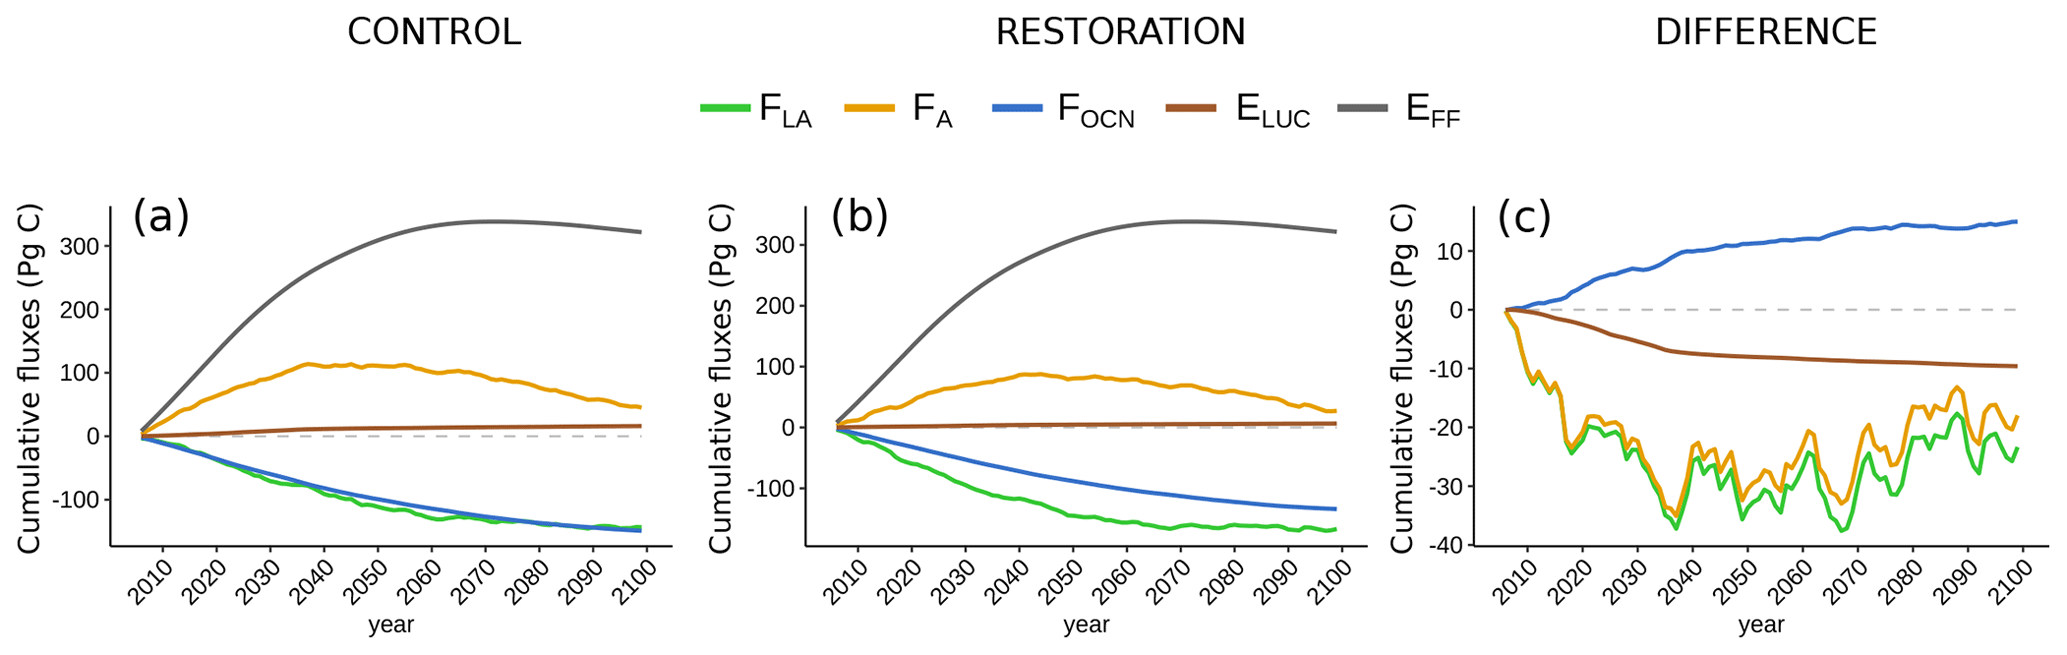
Figure 4Effect of tropical land-use stop and secondary succession on cumulative global carbon fluxes (2006–2100 CE) in (a) control, (b) restoration, and (c) cumulative difference between restoration and control simulation for land–atmosphere flux (FLA, green), ocean–atmosphere flux (FOA, blue), deforestation emissions (EDEFOR, brown), atmospheric carbon (FA, orange), and fossil fuel emissions (EFF, grey). The difference in fossil fuel emissions is zero and not plotted. Dashed line indicates zero; fluxes below zero indicate a carbon benefit in the restoration simulation with respect to the control simulation. Note the different vertical scales.
Table 2Cumulative global fluxes of all carbon cycle components: land–atmosphere flux (FLA), ocean–atmosphere flux (FOA), deforestation emissions (EDEFOR), fossil fuel emissions (EFF), and total net flux to atmosphere (FA) in the restoration simulation, the control simulation, and their differences. FLA is the difference between heterotrophic respiration (Rh) and NPP. “Interactive” represents calculated by the model, and “Prescribed” represents taken from input data. Negative values represent a carbon sink to the atmosphere.
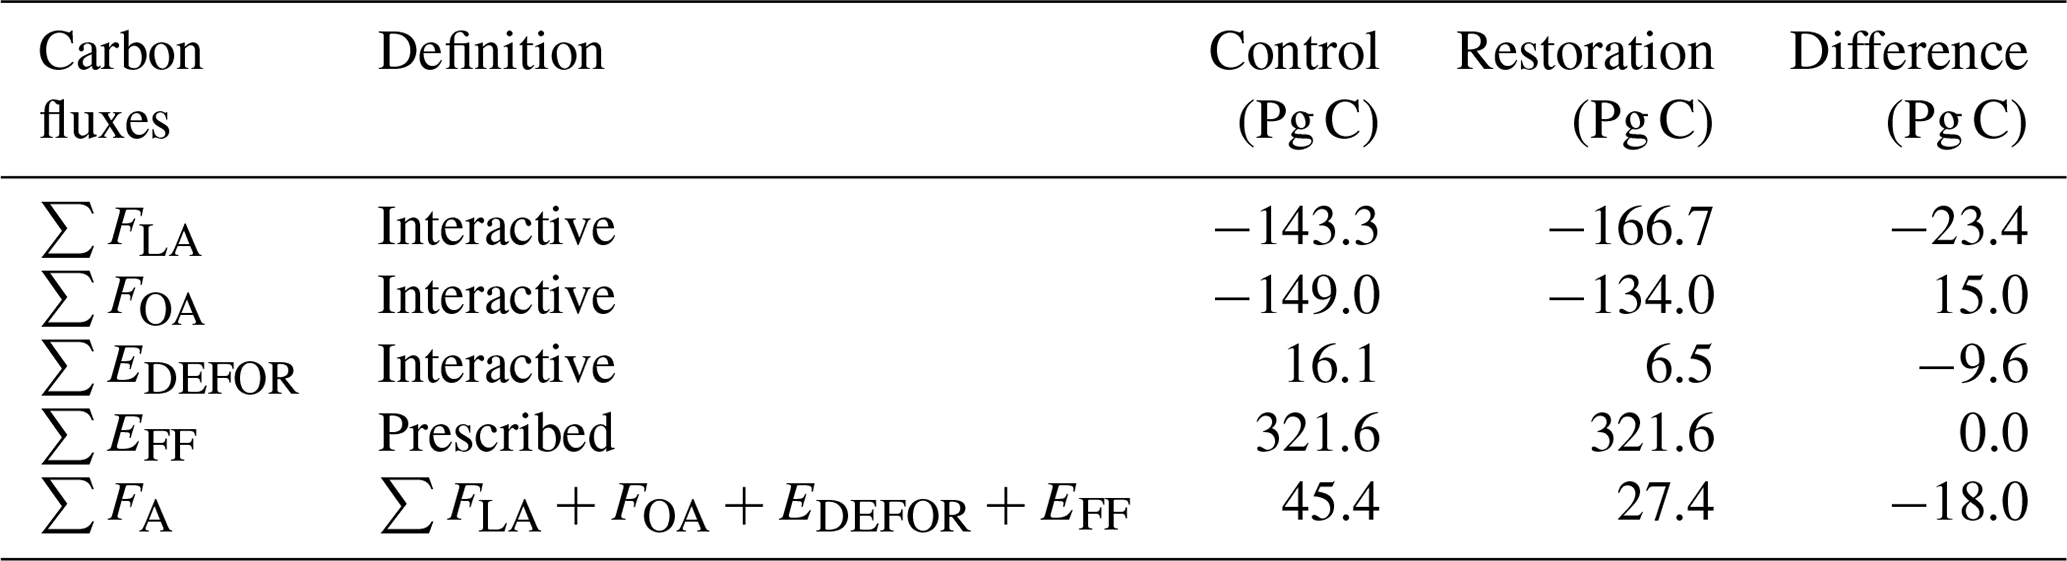
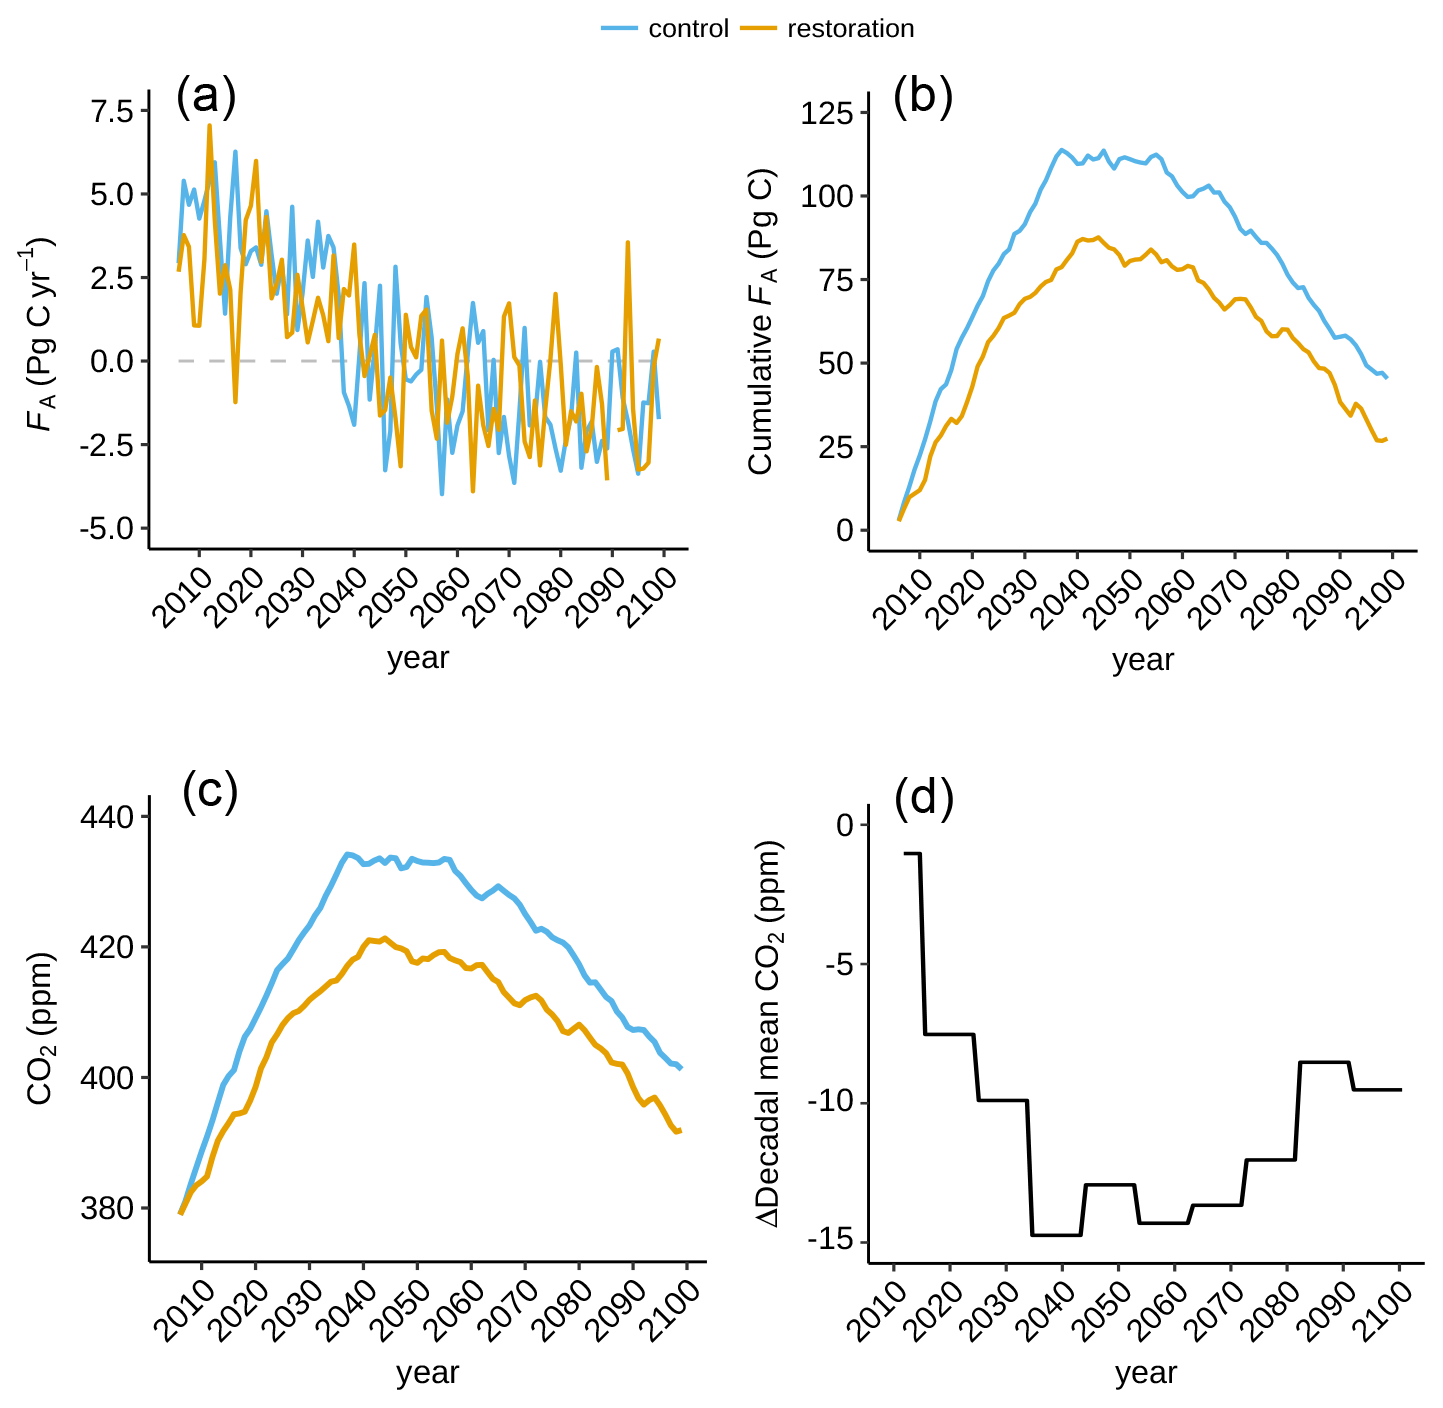
Figure 5Impact of tropical land-use stop on net carbon flux into the atmosphere and CO2, (a) Net carbon flux into the atmosphere (FA), (b) cumulative FA, (c) atmospheric CO2 for restoration (yellow) and control (blue) simulation, and (d) decadally averaged CO2 difference between the simulations. Note the different vertical scales.
3.4 Biogeophysical feedbacks
Beyond CO2, several other Earth system feedbacks may be important for large-scale tropical restoration impacts on global surface air temperatures: change in albedo, evapotranspiration, and precipitation. Surface albedo decreases in both simulations yet more so in esmrcp26restor. This “darkening” is due to trees with darker canopies replacing grasses and crops. Most of this occurs in the tropics, with surface albedo substantially lower in esmrcp26restor (5 %, 2.62 W m−2). This has a warming effect on Earth's surface temperature. Increased forest cover can also lead to increases in cloud cover and thus changes in top-of-atmosphere (TOA) albedo. Both global and tropical mean TOA albedo decreases in both simulations with similar magnitudes, suggesting no overall impact of large-scale forest regrowth on albedo from changes in cloud cover in HadGEM2-ES.
Evapotranspiration (ET) of water at, or near, the surface moderates surface temperature through the surface latent heat flux. Increased woody vegetation increases ET and surface latent heat flux, which lowers surface temperature and counteracts the warming effect of lower albedo in the tropics. The total latent heat flux over land in the tropics remains relatively constant in esmrcp26, but increases with the vegetation change in esmrcp26restor over the first two decades before levelling off for the remainder of the century. The decadally averaged tropical latent heat flux is 0.52 W m−2 higher in esmrcp26restor than in esmrcp26 in 2090s and therefore only moderately offsets the 2.62 W m−2 surface energy surplus from the lowered albedo. The spatial pattern of the combined annual average for the whole simulation period shows a strong latent heat flux in areas with increased abundance in broadleaf trees.
Finally, ET and other land surface properties may affect precipitation. While global precipitation increases in esmrcp26 and esmrcp26restor over the first 40 years, this broadly follows the increase in global temperature. Mean land-only precipitation in the tropics over the whole simulation is 2 % higher in esmrcp26restor than in esmrcp26, but as no robust spatial pattern is seen over the tropical restoration area, it is unclear if this is due to internal variability or a systematic change.
3.5 Surface temperature
Restoration reduces global surface temperatures by nearly 0.2 ∘C in the first 30 years of the simulation as a result from the net impact of radiative CO2 forcing, albedo, and ET changes. However, this difference weakens to become negligible by the 2090s (Fig. 6b and c). The early temperature differences overlap with the periods with the largest differences in atmospheric CO2 and before changes in surface energy, due to lowered albedo, counteract the reduced radiative CO2 forcing later in the century. This suggests that tropical forest restoration has near-term climate benefits and, in combination with fossil fuel mitigation can lower peak warming.
Under both simulations global average temperature stays below 2 ∘C but surpasses 1.5 ∘C relative to pre-industrial during nearly 50 years after 2035 CE (Fig. 6a). As the standard deviation of the decadal variability of HadGEM2-ES is 0.1 ∘C (Jones et al., 2011), only the short-term impacts of restoration result in a detectable temperature reduction.
No persistent spatial temperature patterns are observable over time in comparing esmrcp26 and esmrcp26restor. There is, however, a temperature gradient between sites with increased broadleaf trees and adjacent areas. Grid cells with increased tree cover are up to 0.6 ∘C warmer than adjacent cells that have no new tree growth, as seen on the tropical restoration boundaries, suggesting that albedo warming is stronger than ET cooling in these cells, causing localised surface warming, which in turn may lead to lower plant carbon uptake and increased soil respiration.

Figure 6Global temperature time series showing (a) annual averages and (b) decadal averages for the restoration (yellow) and control (blue) simulation; (c) decadal difference between both simulations.
Stopping anthropogenic land use in the tropics has two impacts on land cover. First as most deforestation in RCP2.6 is projected to occur in the tropics over the first half of the 21st century, 286 Mha deforestation is avoided by the end of the century (9.6 Pg C reduction in emissions). Second, trees replace grassy vegetation during secondary succession, renaturalising 1529 Mha of land. NPP, litterfall, soil carbon, and soil respiration respond to the land-cover change. Overall, as NPP declines less than litterfall under restoration, tropical total biomass increases by 105.5 Pg C in esmrcp26restor compared to a loss of 28.8 Pg C in esmrcp26, given a net biomass increase of 134.4 Pg C. However, while often neglected, lower CO2 fertilisation reduces biomass growth outside the tropics by 4.4 Pg C, and changes in soil carbon dynamics store 96.5 Pg C less in soils in esmrcp26restor over the simulation period, as reductions in Rh are lower than those in FSC following restoration. This leaves a net land carbon sink under both simulations but an additional land carbon benefit from restoration of only 23.4 Pg C. The ocean air–sea carbon exchange responds almost instantaneously to the enhanced land carbon sink through a cumulative reduction in carbon uptake of 15 Pg C over the century following restoration, relative to esmrcp26. The combined effect leads to a reduction in atmospheric carbon of 18 Pg C between both simulations, equivalent to a modest a 9.3 ppm CO2 by the end of the century, given that 1529 Mha were allowed to be restored and that 286 Mha additional deforestation was avoided. The largest difference is found in the 2040s (30 Pg C; 14.6 ppm CO2).
The net global temperature benefit from the combined effect of lower radiative forcing due to lower atmospheric CO2 concentrations and the biogeophysical responses to land-cover change is up to 0.2 ∘C in the decades after restoration but is minimal (<0.01 ∘C) by the end of the century. Overall, large-scale restoration increases carbon storage on land, and can reduce warming in the decades after restoration. Critically, when combined with aggressive mitigation actions, stopping deforestation and restoring forest in the tropics can limit peak warming later this century. Yet, the carbon sequestration and implied climate benefits are substantially smaller than recent, widely publicised claims of a potential tree restoration carbon uptake of 205 Pg C globally (104 Pg C of that in the tropics) (Bastin et al., 2019, but see Bastin et al., 2020). The difference originates likely from ignoring the full range of Earth system feedbacks.
4.1 Restoration timescales and carbon uptake
Generally succession is reproduced in HadGEM2-ES following a grass–shrub–tree cycle, which is likely too slow as observations show that carbon accumulation is driven almost immediately by tree growth in most tropical locations. Meanwhile the absence of fire disturbance in HadGEM2-ES means that succession is never interrupted. Given the slow tree growth in the model it is not surprising that the modelled pantropical median biomass increase of 1.8 Mg C ha−1 yr−1 (range 0.5–5.5 Mg C ha−1 yr−1; see Appendix) for the first 20 years is lower than the observed net carbon uptake rates over 20–30 years after the cessation of land use for the tropics 2.5–6. Mg C ha−1 yr−1 (Bonner et al., 2013; Koch et al., 2019) although values as low as 1.5 Mg C ha−1 yr−1 have been reported (Brown and Lugo, 1992). The median uptake rate of 0.5 Mg C ha−1 yr−1 simulated in later decades is in agreement with other studies from different parts of the tropics (Houghton and Nassikas, 2018; Lewis et al., 2009; Phillips et al., 2009; Poorter et al., 2016). Consequently, the modelled biomass increase after 20 years (41 Mg C ha−1, Fig. A5) is also smaller than the biomass observed in recovering forest in various regions of the neotropics (135–150 Mg C ha−1) (Orihuela-Belmonte et al., 2013; Poorter et al., 2016). The median biomass (165.2 Mg C ha−1) by the end of the simulation is in the range of reported values for the tropics (100–200 Mg C ha−1) (Saatchi et al., 2011). Initial grid-box biomass, however, was already higher in esmrcp26restor than biomass found in real-world post-disturbance monitoring plots, meaning less modelled biomass growth is sufficient to match observations.
The low biomass increase leads to an underestimate in carbon accumulation in the model by a factor of up to 2, and adjusting for this would equal a 15 ppm CO2 uptake by the end of the century in esmrcp26restor compared to esmrcp26. This is because a doubling in biomass would be caused by either an increase in NPP and no change in litter flux or no change in NPP and a decline in litter flux, causing no change in soil carbon and Rh, meaning the ratio between NPP and Rh increases, leading to an increase in tropical FLA also by a factor of 2 (83.6 Pg C). Scaling this by the ratio between FLA (tropics) and FLA (global) (Table 1) gives the global FLA from doubling tropical biomass (46.8 Pg C). Scaling by the ratio between FOA and FLA (Table 2) results in a cumulative net flux to the atmosphere of 30 Pg C, equal to 15 (14.2–16) ppm CO2 (based on 2.00 ± 0.12 Pg C = 1 ppm CO2 in HadGEM2-ES). This estimate assumes a linear carbon cycle response to increasing biomass and excludes any climate–carbon cycle feedbacks. This suggests that assisted restoration, i.e. reducing competition from grasses and shrubs, is preferable from a carbon uptake perspective over more natural restoration approaches.
4.2 Tropical restoration and carbon cycle feedbacks
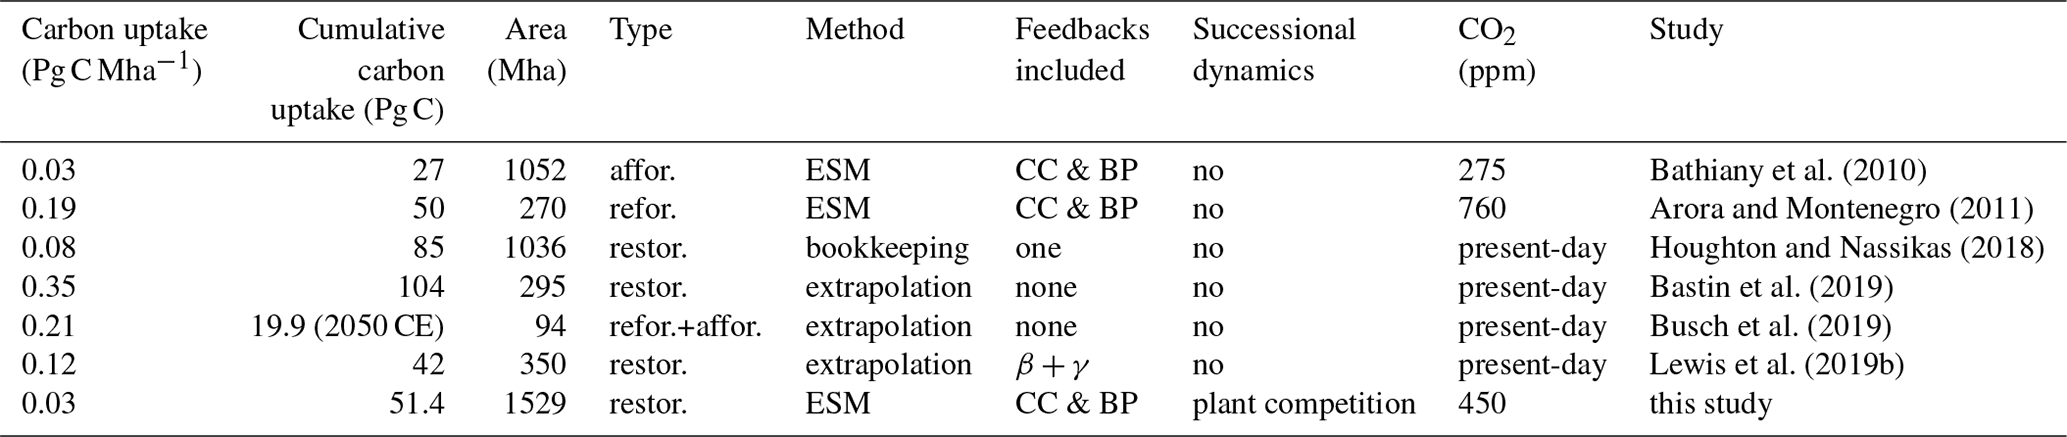
Stopping tropical deforestation has a greater carbon benefit on a per unit area basis (0.034 Pg C Mha−1; 9.6 Pg C 286 Mha) compared to forest restoration (0.027 Pg C Mha−1; 41.8 Pg C 1529 Mha). Taken together, preventing tropical deforestation of 286 Mha (9.6 Pg C) and the subsequent tropical forest restoration (41.8 Pg C) of 1529 Mha has a carbon benefit of 51.4 Pg C over esmrcp26 by 2100 CE, excluding any feedbacks. This is at the lower end of published uptake estimates when normalised over the renaturalised area (Table 3). The difference is primarily influenced by the choice of model (e.g. interactive calculation of biomass vs. fixed biomass scaling, processes included), CO2 scenario choice, reference point (time zero, before restoration vs. an evolving control simulation), and the type of renaturalisation. This shows that estimates that do not include carbon cycle and climate feedback processes overestimate the carbon uptake potential of natural climate solutions. Our simulations are closest to unguided forest restoration, while other studies calculate uptake rates from either simulated reforestation or assisted natural regeneration (without successional cycle). Assisted natural regeneration obtains higher carbon uptake rates faster but needs to be actively managed (i.e. more expensive) and, if implemented incorrectly, is prone to detrimental impacts on biodiversity and other ecosystem functions (Lewis and Maslin, 2018). The soil carbon response is also important but is often ignored (Bastin et al., 2019) or uncertain (Friedlingstein et al., 2014).
The carbon benefit from tropical forest restoration (51.4 Pg C) is partially offset by the Earth system response to lower atmospheric CO2. In particular by a lower extratropical uptake in esmrcp26restor compared to esmrcp26 (18.5 Pg C) and a lower ocean carbon uptake (15 Pg C). This leads to 65 % of the carbon benefit being diminished by reductions in carbon uptake by the ocean and extratropical forests. This is larger than the 20 %–50 % range found in previous studies employing coupled carbon cycle models (Arora and Montenegro, 2011; Bathiany et al., 2010; Jones et al., 2016; Pongratz et al., 2009; Stocker et al., 2011) and the 53 % of anthropogenic emissions taken up by land and ocean carbon sinks over 1990–2018 (Friedlingstein et al., 2019b). The difference is likely to be down to the use of dynamically regrowing vegetation vs. prescribed land cover, uncertainties in the CO2 fertilisation effect on plants, the sensitivity of the land carbon to temperature changes, the sensitivity of ocean carbon to changing temperatures and atmospheric CO2 concentrations, and different timescales (decades to multiple centuries). The actual carbon benefit when considering the Earth system response (18 Pg C) is smaller than the 51.4 Pg C from emission reduction and tropical vegetation uptake alone due to changes in soil carbon, CO2 fertilisation, and ocean carbon cycle feedbacks. This is important, as other approaches often do not take into account these CO2 feedbacks or the response of the carbon cycle to climate change. Indeed, the most high-profile restoration potential estimate by Bastin et al. (2019) includes none of these feedbacks, suggesting a CO2 benefit normalised by area far higher than all other estimates (Table 3).
All carbon fluxes and carbon cycle responses combined add up to a CO2 reduction of 9.3 ppm at the end of the century. A prior study utilising a fully coupled ESM and reforesting 270 Mha cropland in the tropics (compared to 1529 Mha renaturalised here) under the SRES A2 scenario (Special Report on Emissions Scenarios) finds a CO2 benefit of more than double: 20 ppm CO2 (Arora and Montenegro, 2011). Their CO2 sensitivity to tropical vegetation regrowth CO2 benefit normalised by the area returned to natural vegetation (Arora and Montenegro, 2011) was substantially higher than both other studies (Claussen et al., 2001; Bathiany et al., 2010) and the sensitivity found by this experiment (Table A3). The higher normalised CO2 benefit is due to prescribed vegetation, meaning cropland instantaneously becomes forest rather than converted through secondary succession, with the choice of a higher CO2 scenario resulting in a greater CO2 fertilisation of vegetation and a 30 % lower ocean carbon sensitivity to changes in atmospheric carbon in CanESM2 (Friedlingstein et al., 2014), resulting in a lower reduction in ocean carbon uptake following an increased land carbon sink. This demonstrates that ESM estimates of the benefit of forest restoration vary with model formulation and baseline scenario. The sensitivity found here is within the range of earlier studies (Table A3) and employs a more recent ESM and scenario choice.
Bathiany et al. (2010)Arora and Montenegro (2011)Houghton and Nassikas (2018)Bastin et al. (2019)Busch et al. (2019)Lewis et al. (2019b)Table 3Carbon uptake estimates for tropical afforestation (affor.), reforestation (refor.), and forest restoration (restor.), normalised by area, cumulative uptake by 2100 CE, renaturalised area, type of renaturalisation strategy, and method for calculation, whether carbon cycle feedbacks (CC), biogeophysical feedbacks (BP), CO2 fertilisation (β), or plant temperature responses (γ) were included; successional dynamics; and CO2 concentrations in control experiments. ESM represents Earth system model. All values are for tropics only (tropics as specified by each study), except Lewis et al. (2019b) includes some extratropical regions under the Bonn Challenge. Note that Arora and Montenegro (2011) uses the term afforestation for turning present-day cropland that would be forest back into forest; here we label this reforestation.
4.3 Temperature benefit to low emissions
The IPCC Special Report on 1.5 ∘C permissible carbon budget to stay within 2 ∘C (Rogelj et al., 2018) is 445 Pg C (±180 Pg C) between 2006 and 2100 CE, with 139 Pg C already used (Friedlingstein et al., 2019b). The diagnosed fossil fuel emissions in HadGEM2-ES (EFF: 320.4 Pg C) combined with the prognostic esmrcp26 land-use change emissions (EDEFOR: 16.1 Pg C), therefore, are close to the emissions budget for 2 ∘C. Together with the prescribed RCP2.6 non-CO2 radiative forcings and biogeophysical feedback processes in the model, warming only amounts to 1.5 ∘C relative to the pre-industrial levels by the 2090s in both HadGEM2-ES simulations. This is due to a relatively low transient climate response to cumulative emissions (TCRE) of 1.1 ∘C per 1000 Pg C in HadGEM2-ES (5 %–95 % range of observational TCRE constraints: (0.7–2.0 ∘C per 1000 Pg C; Gillett et al., 2013). Therefore, it is not surprising that the small CO2 benefit (18 Pg C) in esmrcp26restor relative to the standard RCP2.6 esmrcp26 does not result in a detectable cooling at the end of the century.
4.4 Assessing model dependence
Although our findings are based on a single Earth system model, two key conclusions are model independent: (i) in a world where emission reductions follow the Paris Agreement, restoration is best deployed immediately, and (ii) the ocean carbon feedbacks will reduce the efficacy of negative emissions technologies, whether natural or technological. Replicating this experiment with other ESMs would likely give a smaller or larger carbon benefit from large-scale tropical restoration, depending on how the various processes impacting the carbon cycle are represented. The simulation of the biomass increase after the cessation of anthropogenic land use depends on whether the dynamical expansion of vegetation is included, the variety of PFTs in the model and the implementation of their resource competition with a greater number of PFTs, however, not necessarily performing better (Koven et al., 2020) the inclusion of fire disturbance, and the balance between productivity and mortality, which are commonly a challenge for ESMs, (Negrón-Juárez et al., 2015). The representation of land use, whether only deforestation emissions or more complex processes are considered, is another factor influencing the carbon benefit in our experimental set-up. For example, including processes such as tillage leads to increase historical land-use change emissions by 70 % (Pugh et al., 2015). The response of vegetation to changes in atmospheric CO2 depends on the magnitude of CO2 fertilisation which is limited by nutrient (nitrate and phosphate) availability. Nutrient limitation is not included in HadGEM2-ES; models that include nutrient limitation generally show a weaker CO2 fertilisation impact on plant productivity 50 %–100 % (Huntzinger et al., 2017; Fleischer et al., 2019), but the magnitude of the effect in the real world is still uncertain (Haverd et al., 2020). The decline of the ocean carbon sink when lowering atmospheric CO2 is an expected response (Schwinger and Tjiputra, 2018); its sensitivity to changes in atmospheric CO2 (and temperature), however, is between 39 % lower and 30 % higher than the carbon sink in HadGEM2-ES over the historical period (Friedlingstein et al., 2014). Comparing these processes with HadGEM2-ES, the greater carbon benefit from cutting higher land-use emissions would be balanced by the smaller negative impact of lower atmospheric CO2 on extratropical carbon uptake, with an uncertain magnitude in ocean carbon uptake change. A coordinated effort exploring the intermodel spread of Earth system feedbacks to nature-based solutions e.g. in the Carbon Dioxide Removal Model Intercomparison Project – CDRMIP (Keller et al., 2018), would be beneficial given the importance of these feedbacks and the policy relevance of nature-based solutions.
We find small temperature benefits from large-scale tropical forest restoration over a few decades and no impact in the longer term. Tropical restoration reduces peak atmospheric CO2 concentrations, but the Earth system response to tropical restoration itself offsets nearly two-thirds of the initial carbon benefit from restoration. This work provides further insight into the Earth system response to negative emissions, particularly under a policy-relevant low-CO2 trajectory. Some of these findings may be model dependent, due to low modelled NPP of broadleaf trees, large modelled changes in albedo, and lower modelled changes in ET. Given the idealised extent of the forest restoration (1529 Mha) in this experiment, currently pledged restoration (e.g. 350 Mha in the Bonn Challenge, over 4 times less than the restored area here) would have little noticeable impact on global temperatures in the long-term even if HadGEM2-ES underestimates its impact somewhat. This result does not mean that natural solutions are not important for meeting climate targets. While ecosystem restoration only has a small carbon benefit in the long term and is no alternative to reducing fossil fuel emissions, it can, however, contribute to reducing peak CO2 concentrations and peak temperatures, which may be critical for societal and ecosystem adaptation. Furthermore negative emissions and lower atmospheric CO2 concentrations represent a system of diminishing returns. The magnitude of the land and ocean carbon sinks becomes smaller as atmospheric CO2 decreases and thereby erasing up to two-thirds of the additional carbon sink from LULCC. While well known in the modelling community (Jones et al., 2016; Schwinger and Tjiputra, 2018), it is also important to consider that the carbon benefits of avoided deforestation and the increase in forest cover are not fully realised, because the resulting reduction in atmospheric CO2 also reduces carbon uptake by the ocean and extratropical forests to avoid making misleading statements (e.g. Bastin et al., 2019) on the potential of carbon sinks from tropical restoration (Bastin et al., 2020; Friedlingstein et al., 2019a; Lewis et al., 2019a). In short, the more processes are considered in mitigation estimates for negative emission technologies – dynamic vegetation, climate, and carbon cycle response – the greater the reduction in their mitigation potential.
However, this idealised experiment shows that in the short to medium term (∼ 30 years) carbon uptake from tropical forest restoration, alongside radical reduction in fossil fuel use, can provide a valuable additional time until other negative emission technologies become more widely available to remove countries' remaining residual emissions to meet the societal goal of stabilising the climate by reaching net-zero greenhouse gas emissions.
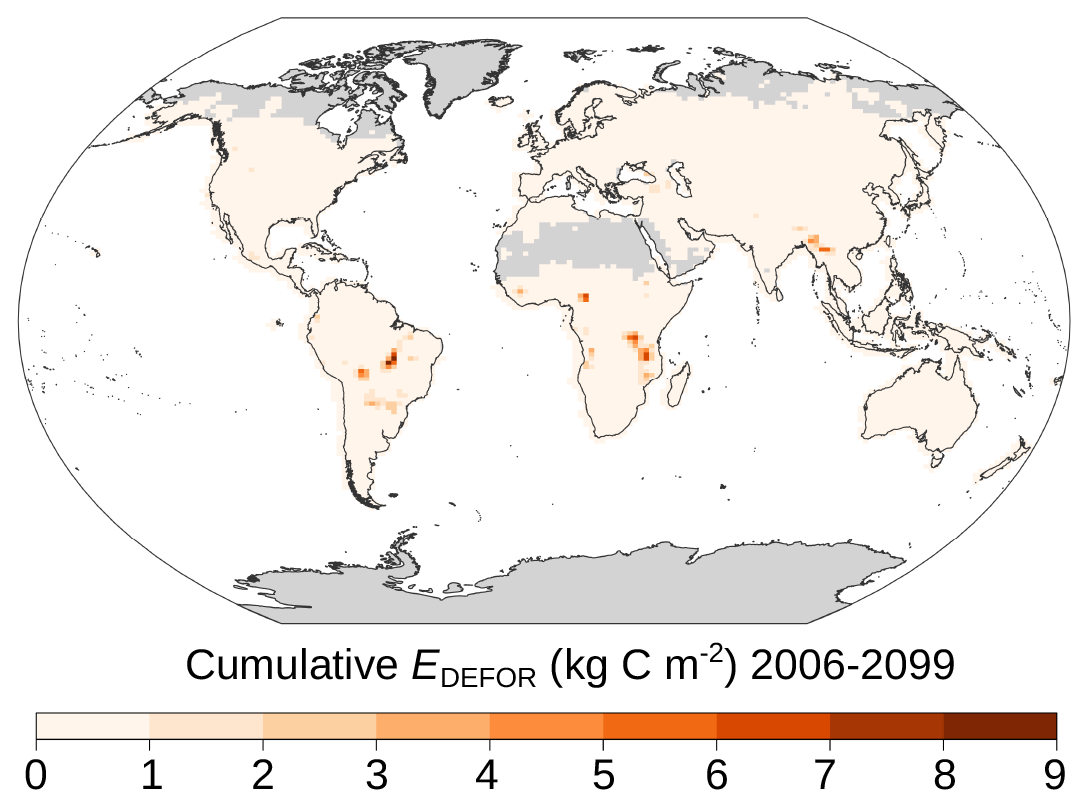
Figure A1Hotspots of deforestation emissions in RCP2.6. Cumulative deforestation emissions (2006–2099 CE) in the control simulation.
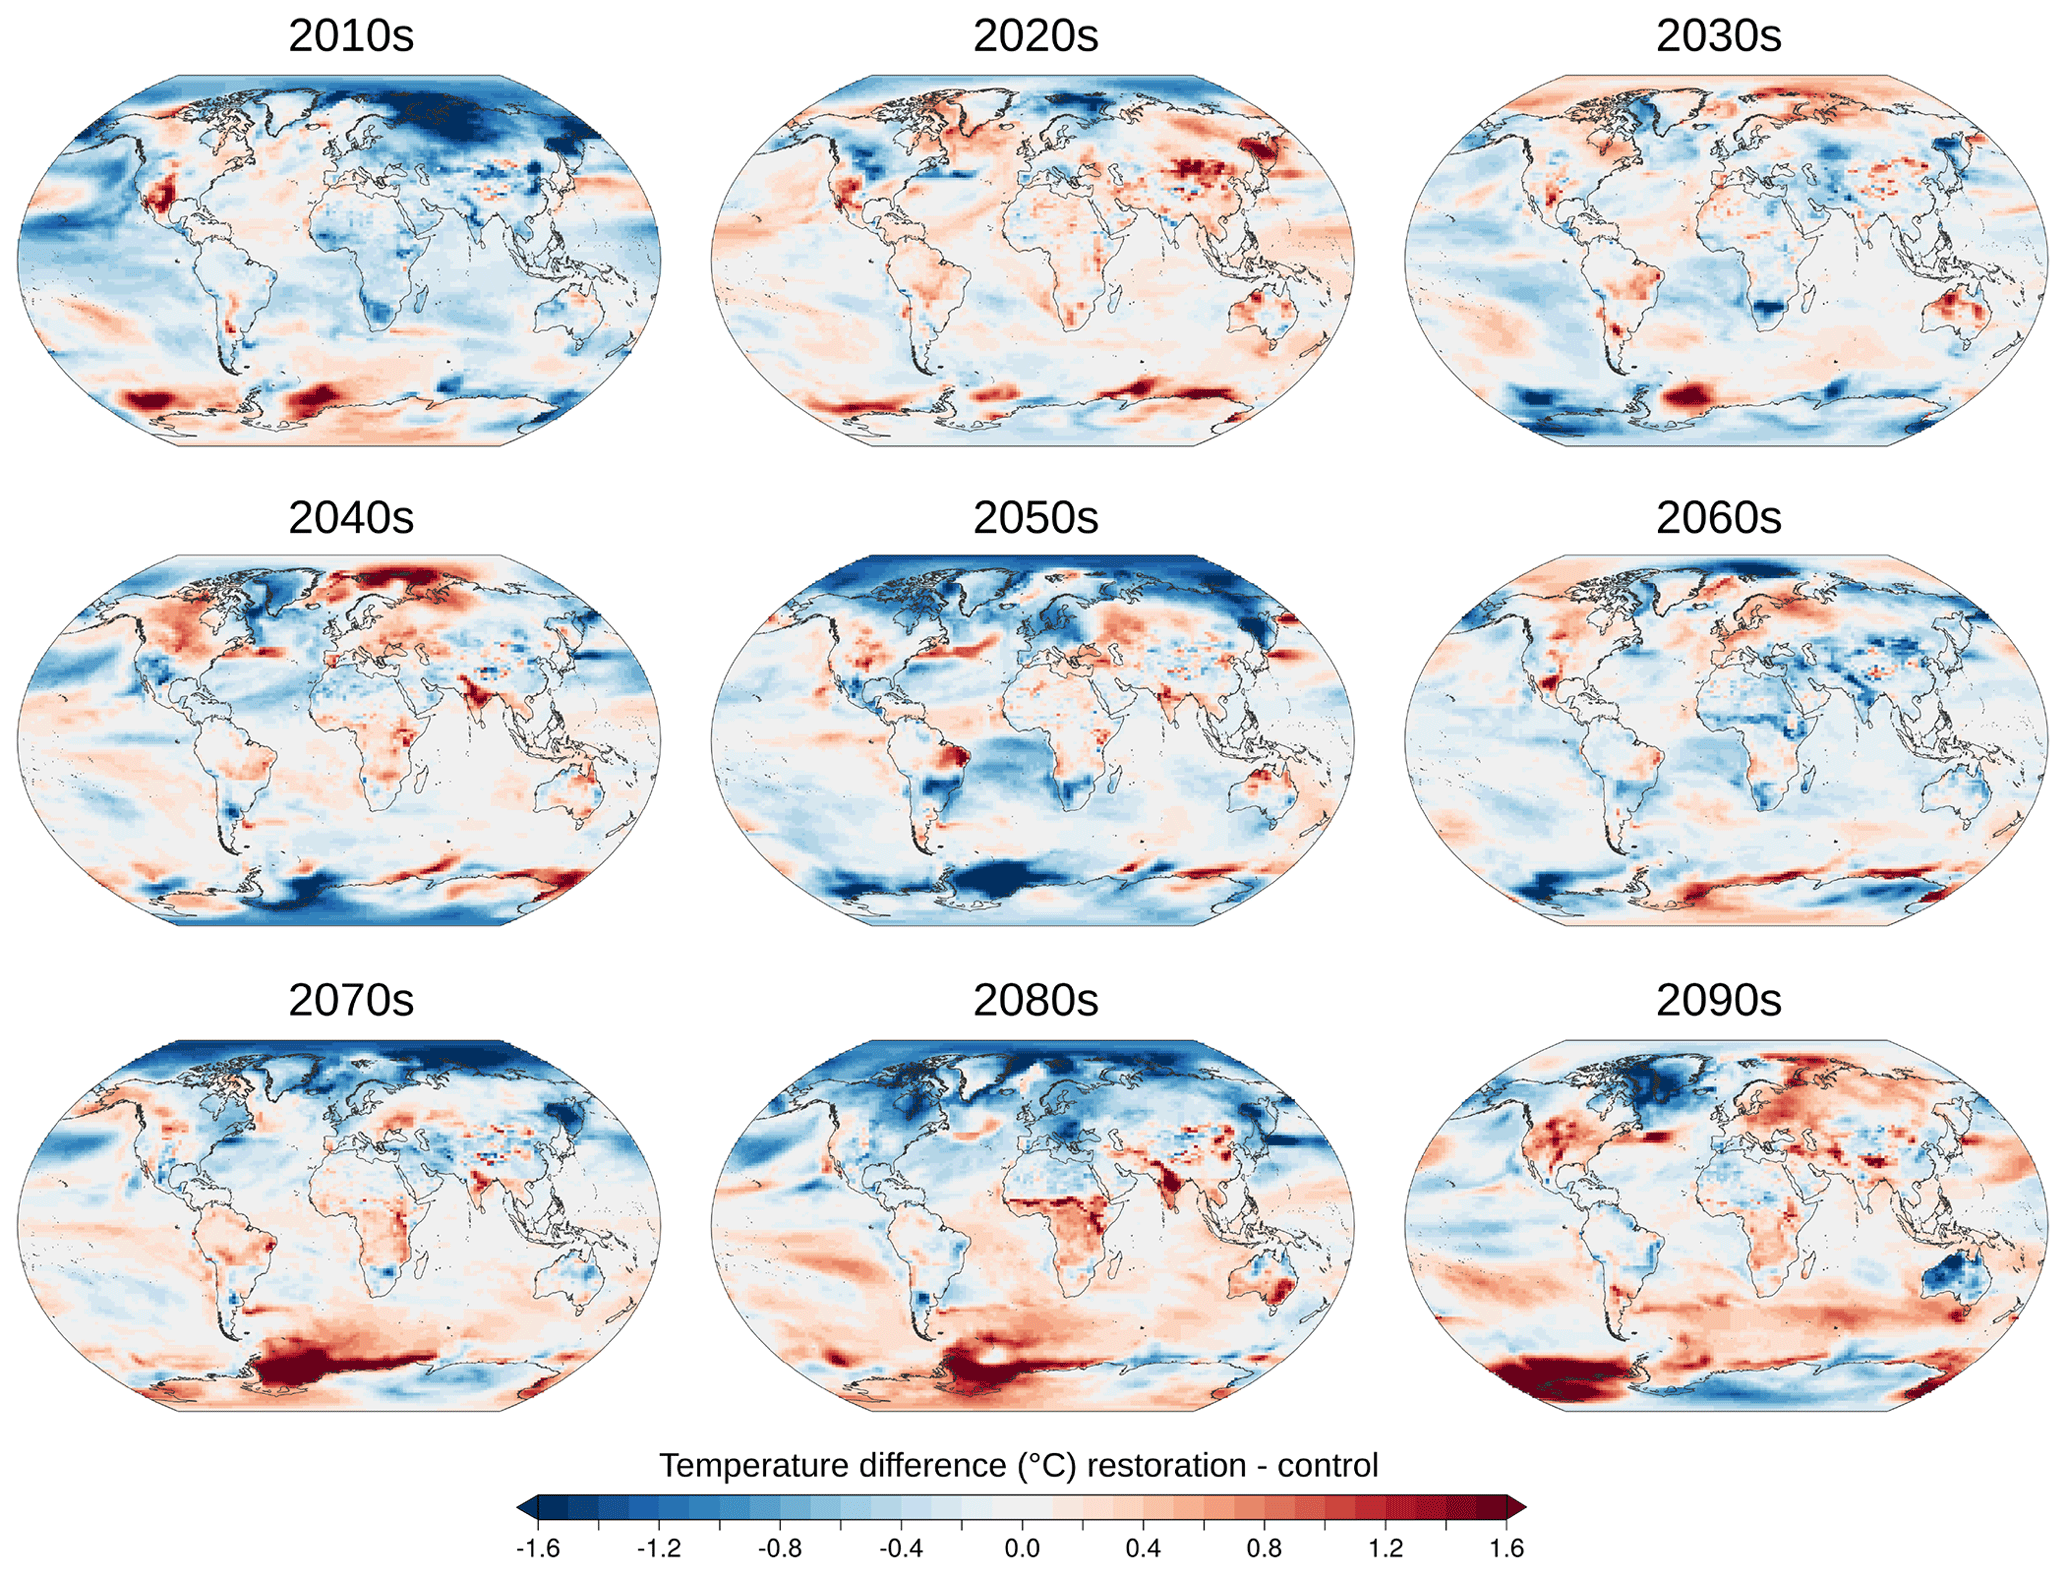
Figure A2Temperature difference of decadal means between esmrcp26restor and esmrcp26.
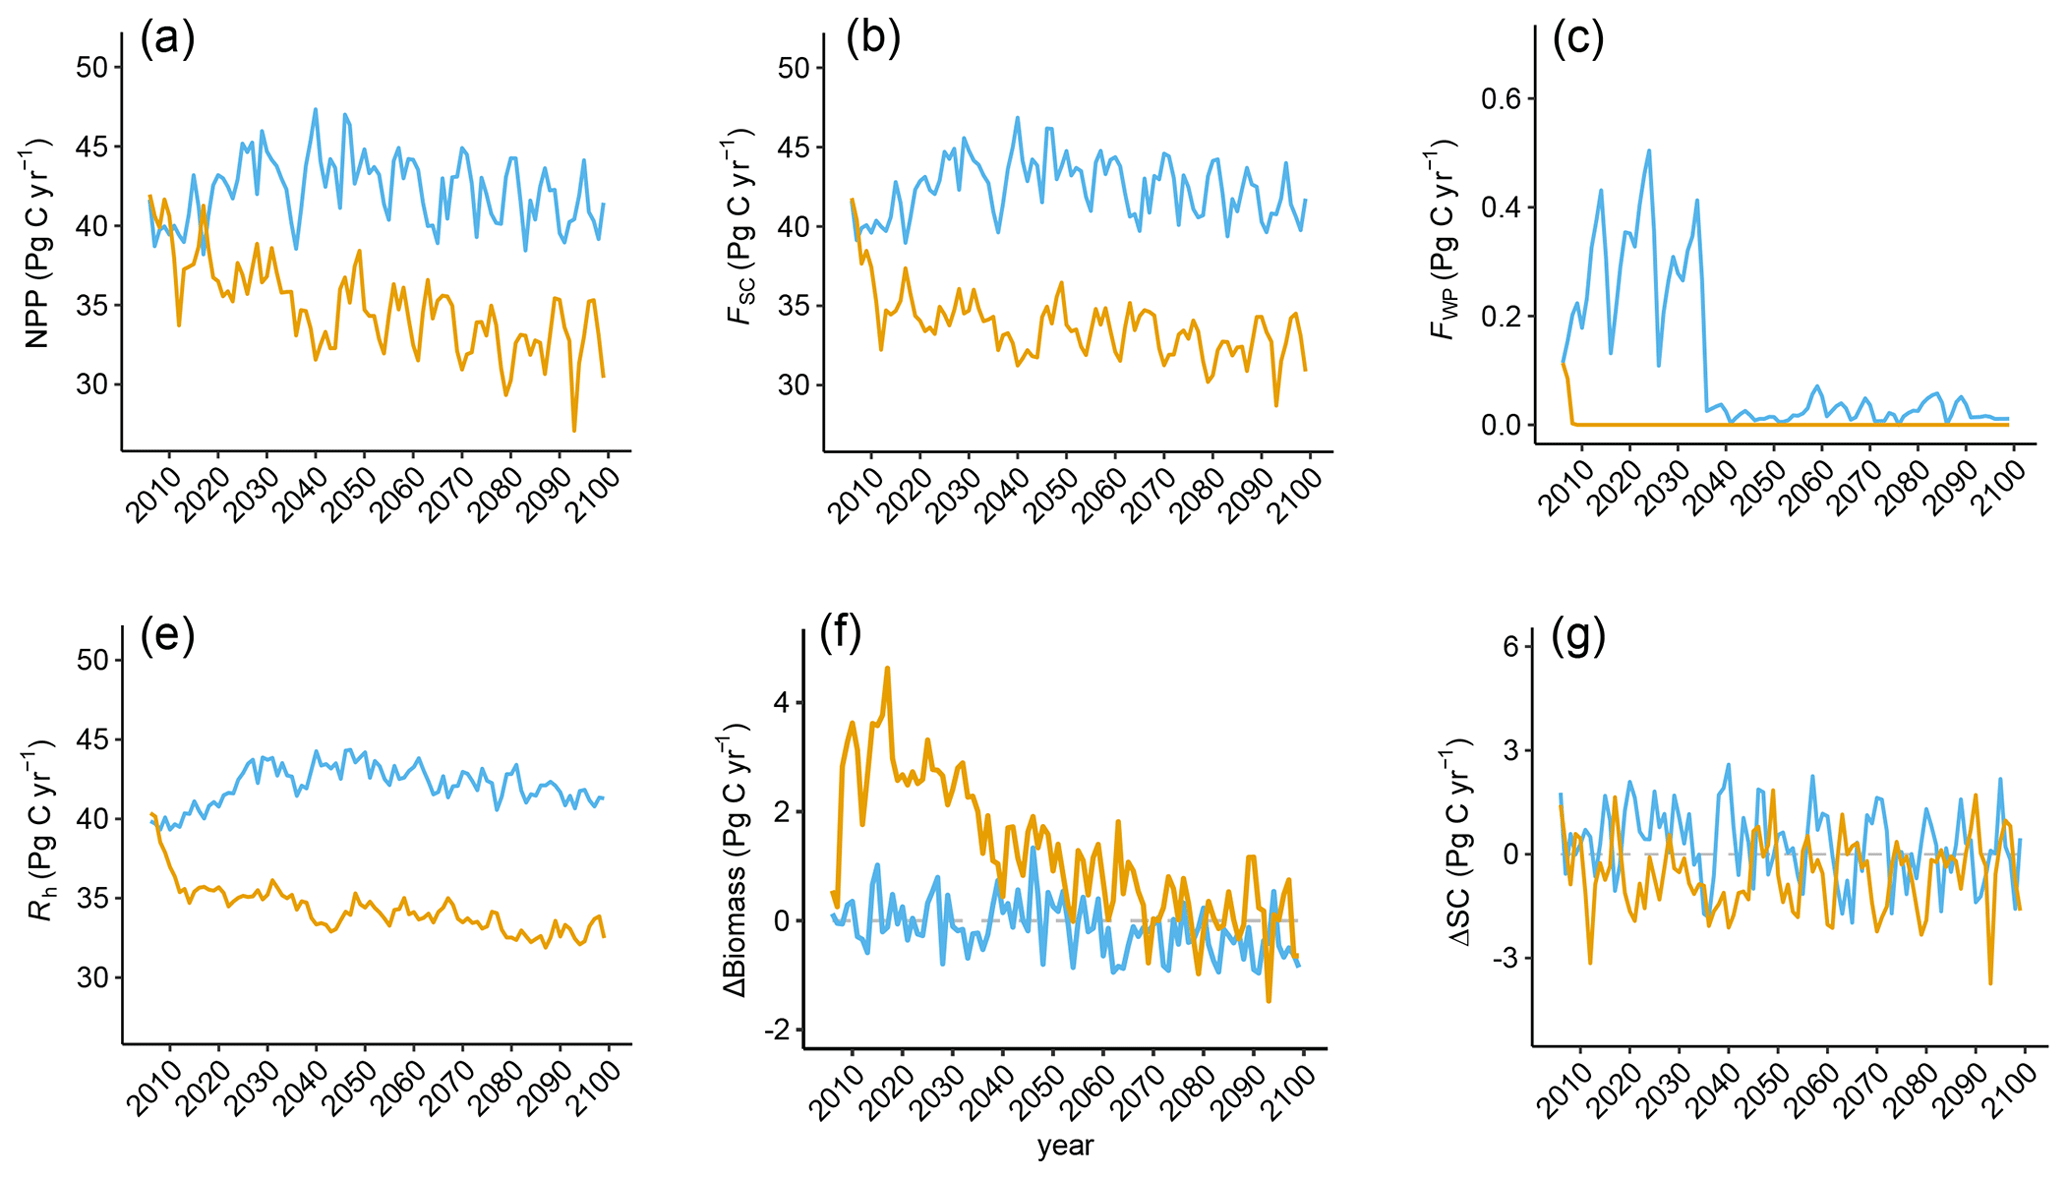
Figure A3Time series of (a) global net primary production (NPP), (b) global carbon flux into the soil (FSC), (c) global carbon flux into the wood product pools (FWP), (d) global annual change in aboveground biomass (ΔBiomass), (e) global soil respiration (Rh), and (f) global annual change in soil carbon (ΔSC) in the restoration (yellow) and control (blue) simulations.
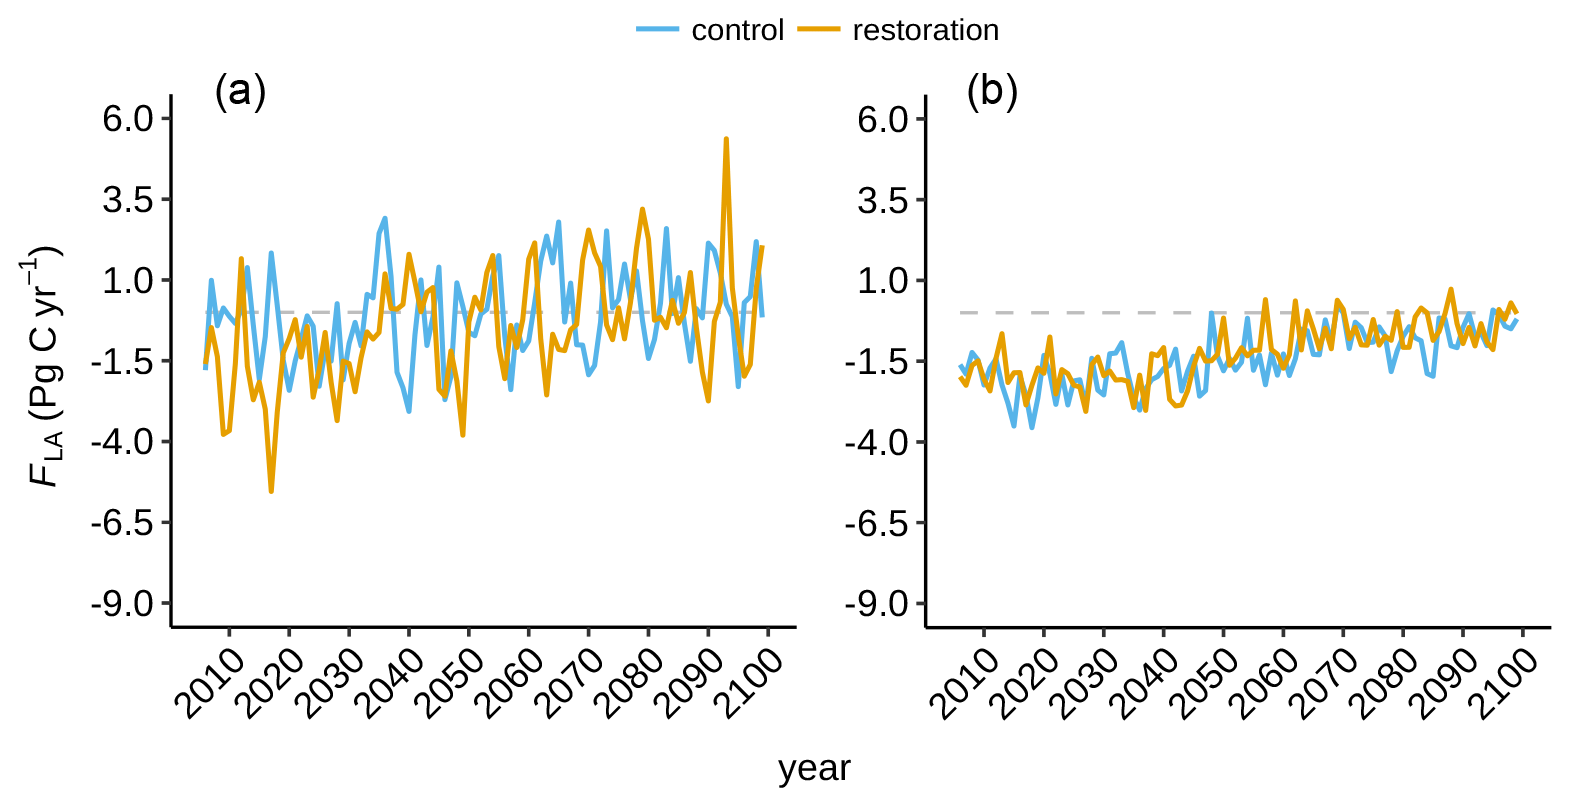
Figure A4Tropical (a) and extratropical (b) land–atmosphere flux (FLA) in the restoration (yellow) and control (blue) simulations.
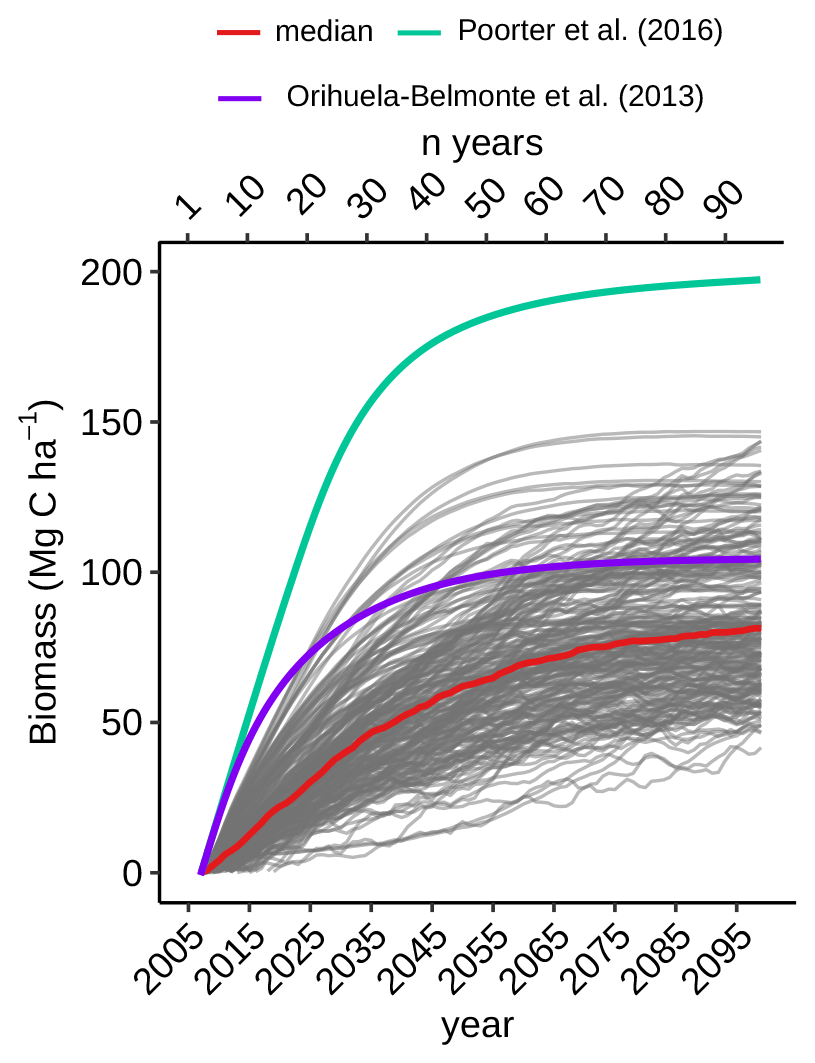
Figure A5Aboveground biomass change in regenerating broadleaf forest in the restoration simulation. Modelled median increase (red) compared to observations (Orihuela-Belmonte et al., 2013; Poorter et al., 2016). Regenerating broadleaf forests are defined as grid cells with an increase in broadleaf PFTs of >30 % of grid cell value.
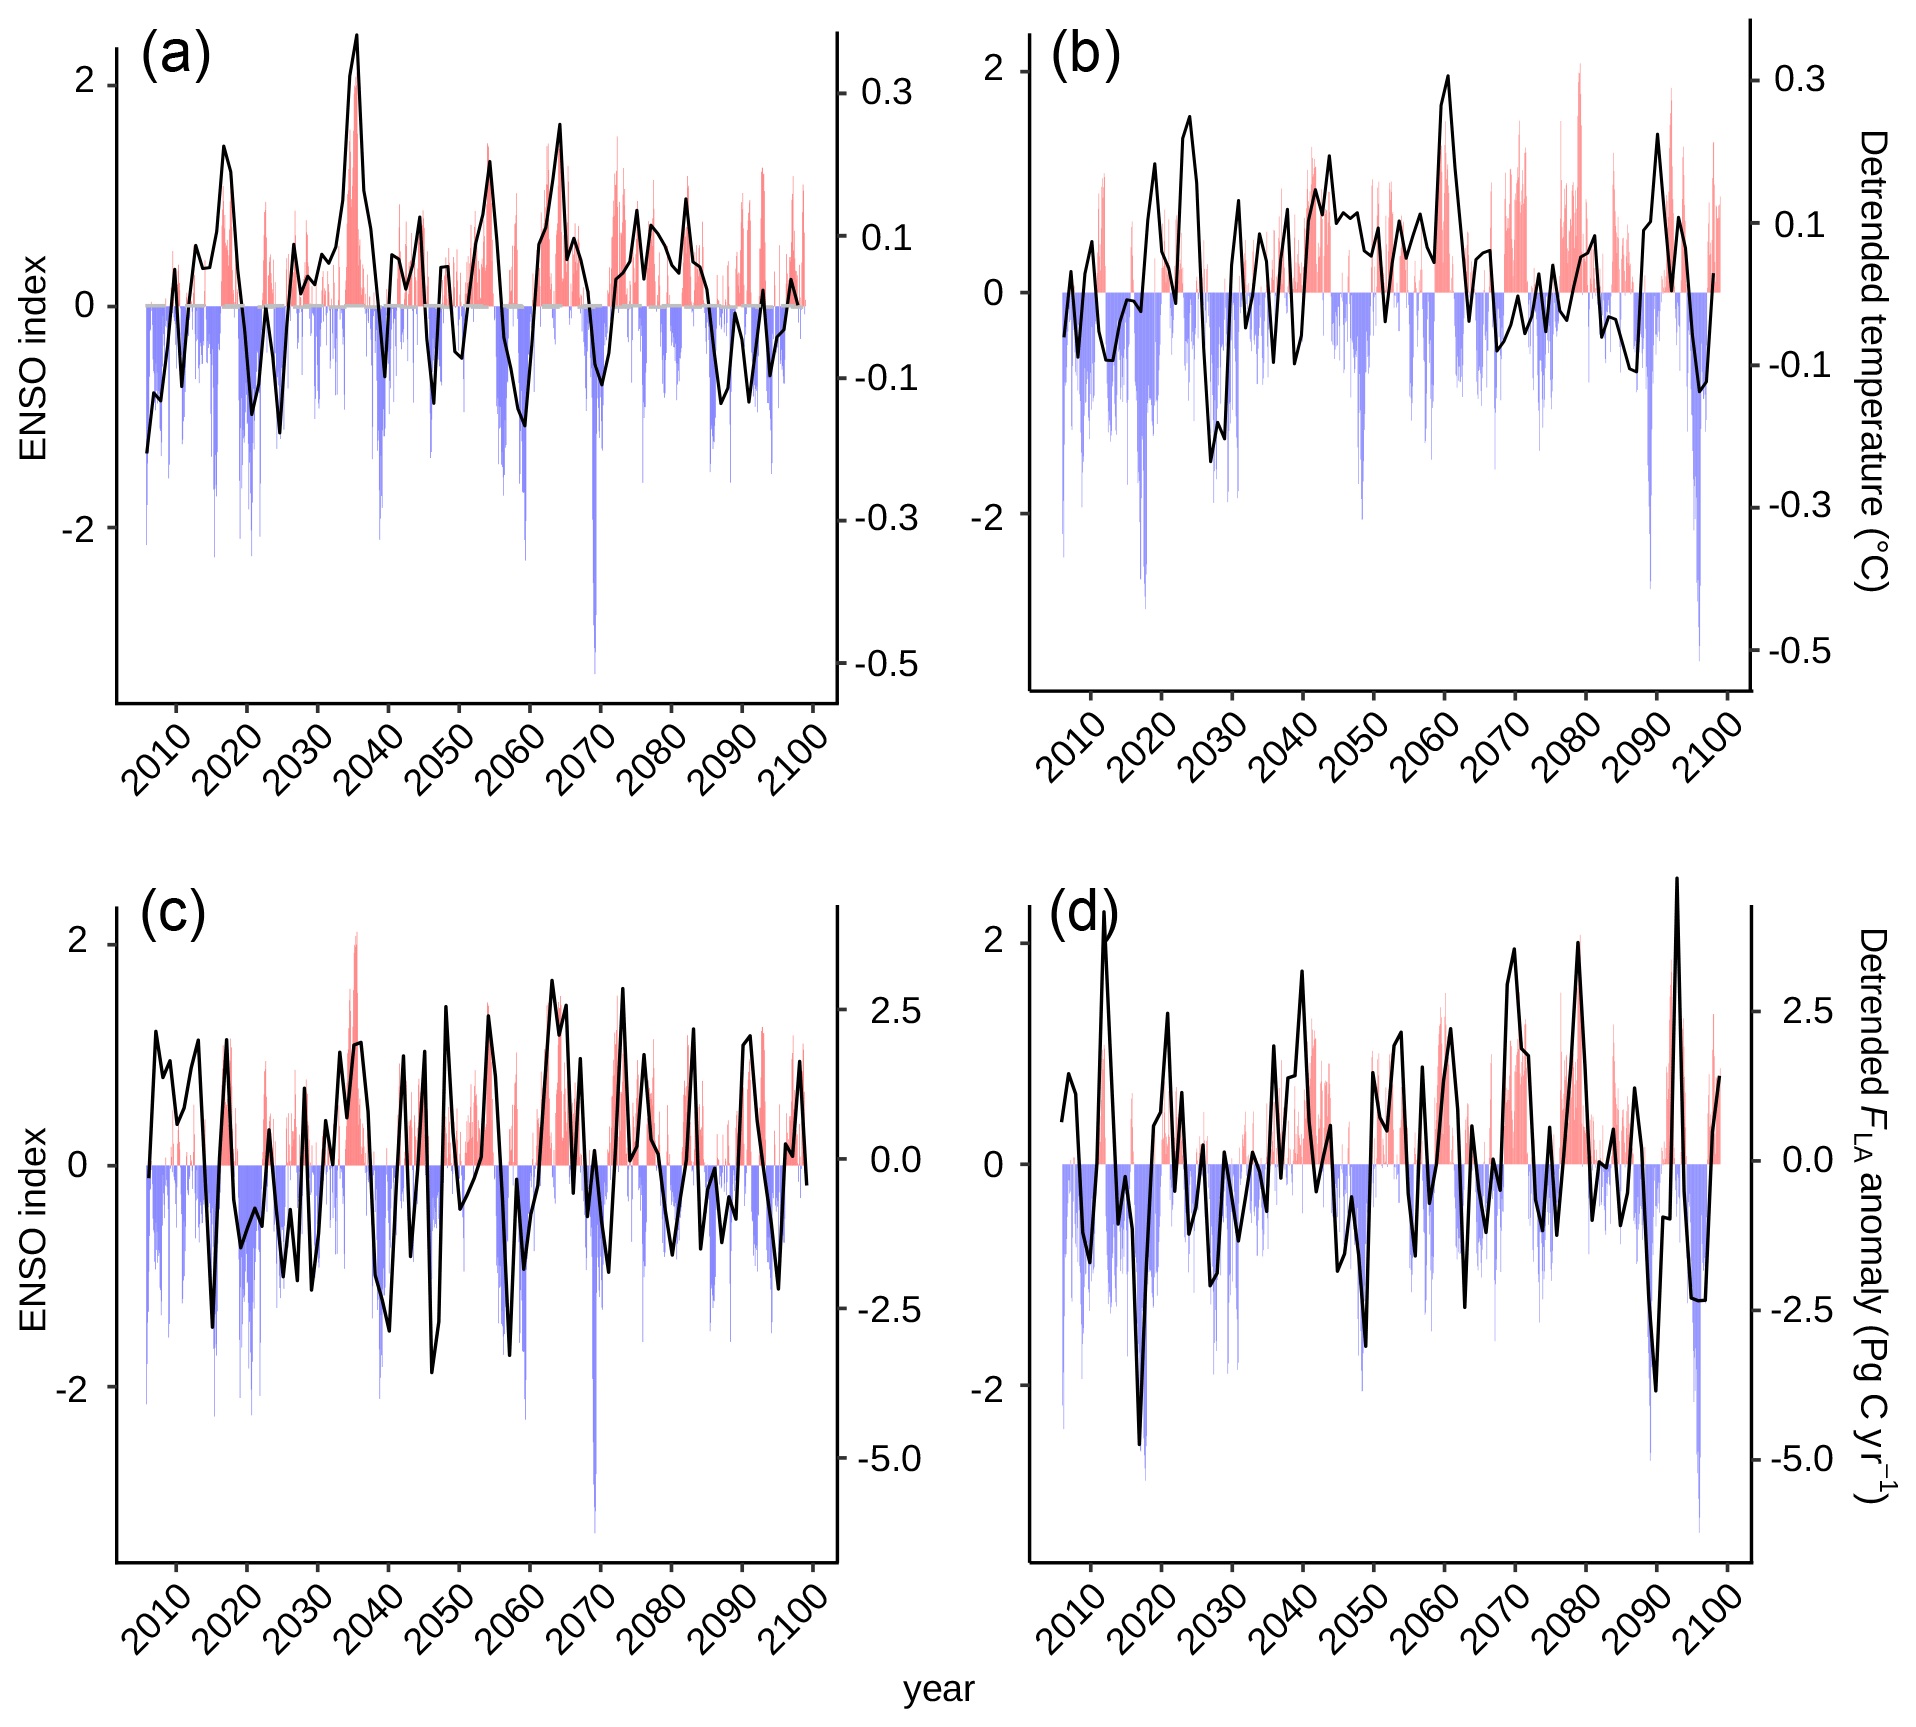
Figure A6The impact of El Niño–Southern Oscillation (ENSO) on global surface air temperature in the (a) control and (b) restoration simulations, as well as on the land carbon sink (FLA) in the (c) control and (d) restoration simulations. Positive ENSO values represent El Niño events (red), while negative values represent La Niña events (blue).
Table A1Change in land cover between control and restoration simulation by 2100 CE (in Mha; 1 Mha =10 000 km2). Negative values indicate a decrease in land-cover type in the restoration simulation. Anthropogenic land use is a mask that covers all land-cover-type areas (see Sect. 2.1.1). Note that values may not add up completely due to rounding.

Table A2Global and tropical average net primary production (NPP) per PFT.
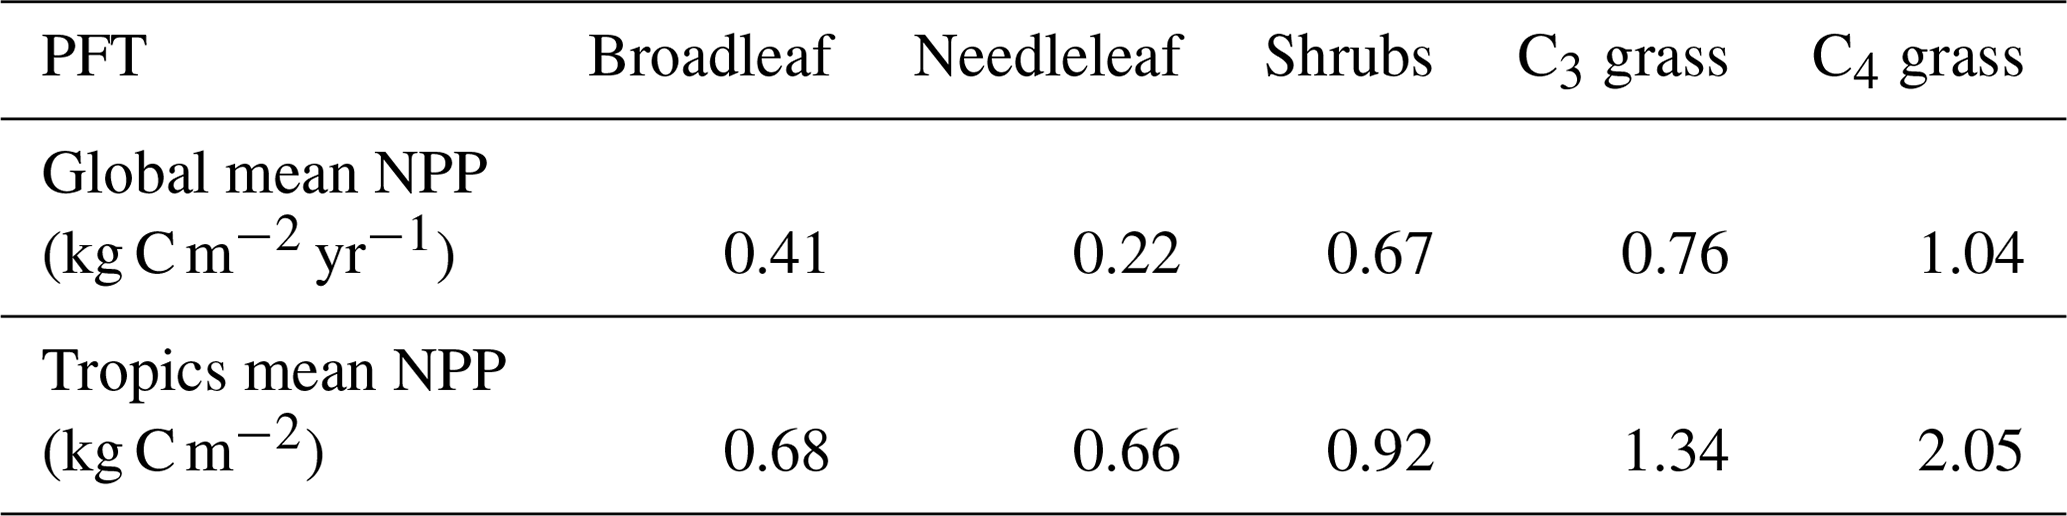
Table A3CO2 and temperature sensitivities to forest regrowth (including land-use change) in Earth system models. Area-weighted CO2 and temperature for the last 20 simulation years (this simulation and Arora and Montenegro, 2011), the last 30 simulation years (Bathiany et al., 2010), and an average of the last 150 simulation years (Claussen et al., 2001).
Code and data to recreate figures are available at http://dx.doi.org/10.17632/j39bw4rzsr.1 (last access: 18 August 2020, Koch, 2020).
AK, CB, and SLL conceived and developed the study; AK performed and analysed the experiment and wrote the article; all authors commented on the article.
The authors declare that they have no conflict of interest.
We thank Eddy Robertson for providing the HadGEM2-ES control simulation. We are grateful for computational support from the US National Centre for Atmospheric Science (NCAS), especially Grenville Lister and Rosalyn Hatcher, and the UK national high-performance computing service ARCHER. We thank two anonymous reviewers for their suggestions.
This research has been supported by the Natural Environment Research Council (grant no. NE/L002485/1).
This paper was edited by Kirsten Thonicke and reviewed by two anonymous referees.
Allen, M. R., Frame, D. J., Huntingford, C., Jones, C. D., Lowe, J. A., Meinshausen, M., and Meinshausen, N.: Warming caused by cumulative carbon emissions towards the trillionth tonne, Nature, 458, 1163–1166, https://doi.org/10.1038/nature08019, 2009. a
Arora, V. K. and Montenegro, A.: Small temperature benefits provided by realistic afforestation efforts, Nat. Geosci., 4, 514–518, https://doi.org/10.1038/ngeo1182, 2011. a, b, c, d, e, f, g, h, i
Bastin, J.-F., Finegold, Y., Garcia, C., Mollicone, D., Rezende, M., Routh, D., Zohner, C. M., and Crowther, T. W.: The global tree restoration potential, Science, 365, 76–79, https://doi.org/10.1126/science.aax0848, 2019. a, b, c, d, e, f, g
Bastin, J.-F., Finegold, Y., Garcia, C., Gellie, N., Lowe, A. J., Mollicone, D., Rezende, M., Routh, D., Sacande, M., Sparrow, B., Zohner, C. M., and Crowther, T. W.: Erratum for the Report: “The global tree restoration potential”, Science, 368, https://doi.org/10.1126/science.abc8905, 2020. a, b
Bathiany, S., Claussen, M., Brovkin, V., Raddatz, T., and Gayler, V.: Combined biogeophysical and biogeochemical effects of large-scale forest cover changes in the MPI earth system model, Biogeosciences, 7, 1383–1399, https://doi.org/10.5194/bg-7-1383-2010, 2010. a, b, c, d, e, f
Bonner, M. T. L., Schmidt, S., and Shoo, L. P.: A meta-analytical global comparison of aboveground biomass accumulation between tropical secondary forests and monoculture plantations, For. Ecol. Manage., 291, 73–86, https://doi.org/10.1016/j.foreco.2012.11.024, 2013. a
Brown, S. and Lugo, A.: Aboveground biomass estimates for tropical moist forests of the Brazilian Amazon, Interciencia, 17, 8–18, 1992. a
Busch, J., Engelmann, J., Cook-Patton, S. C., Griscom, B. W., Kroeger, T., Possingham, H., and Shyamsundar, P.: Potential for low-cost carbon dioxide removal through tropical reforestation, Nat. Clim. Change, 9, 463–466, https://doi.org/10.1038/s41558-019-0485-x, 2019. a, b, c
Claussen, M., Brovkin, V., and Ganopolski, A.: Biogeophysical versus biogeochemical feedbacks of largerscale land cover change, Geophys. Res. Lett., 28, 1011–1014, 2001. a, b, c, d
Collins, W. J., Bellouin, N., Doutriaux-Boucher, M., Gedney, N., Halloran, P., Hinton, T., Hughes, J., Jones, C. D., Joshi, M., Liddicoat, S., Martin, G., O'Connor, F., Rae, J., Senior, C., Sitch, S., Totterdell, I., Wiltshire, A., and Woodward, S.: Development and evaluation of an Earth-System model – HadGEM2, Geosci. Model Dev., 4, 1051–1075, https://doi.org/10.5194/gmd-4-1051-2011, 2011. a, b, c
Cox, P. M.: Description of the “TRIFFID” Dynamic Global Vegetation Model, Technical Report, Met Office London, UK, 17 pp., 2001. a, b
Essery, R., Best, M., and Cox, P.: MOSES 2.2 Technical Documentation, Technical Report, Met Office, London, UK, 31 pp., 2001. a
Essery, R. L. H., Best, M. J., Betts, R. A., Cox, P. M., and Taylor, C. M.: Explicit representation of subgrid heterogeneity in a GCM land surface scheme, J. Hydrometeorol., 4, 530–543, https://doi.org/10.1175/1525-7541(2003)004<0530:EROSHI>2.0.CO;2, 2003. a
Fleischer, K., Rammig, A., De Kauwe, M. G., Walker, A. P., Domingues, T. F., Fuchslueger, L., Garcia, S., Goll, D. S., Grandis, A., Jiang, M., Haverd, V., Hofhansl, F., Holm, J. A., Kruijt, B., Leung, F., Medlyn, B. E., Mercado, L. M., Norby, R. J., Pak, B., von Randow, C., Quesada, C. A., Schaap, K. J., Valverde-Barrantes, O. J., Wang, Y.-P., Yang, X., Zaehle, S., Zhu, Q., and Lapola, D. M.: Amazon forest response to CO2 fertilization dependent on plant phosphorus acquisition, Nat. Geosci., 12, 736–741, https://doi.org/10.1038/s41561-019-0404-9, 2019. a
Friedlingstein, P., Meinshausen, M., Arora, V. K., Jones, C. D., Anav, A., Liddicoat, S. K., and Knutti, R.: Uncertainties in CMIP5 climate projections due to carbon cycle feedbacks, J. Climate, 27, 511–526, https://doi.org/10.1175/JCLI-D-12-00579.1, 2014. a, b, c
Friedlingstein, P., Allen, M., Canadell, J. G., Peters, G. P., and Seneviratne, S. I.: Comment on “The global tree restoration potential”, Science, 366, eaay8060, https://doi.org/10.1126/science.aay8060, 2019a. a, b
Friedlingstein, P., Jones, M. W., O'Sullivan, M., Andrew, R. M., Hauck, J., Peters, G. P., Peters, W., Pongratz, J., Sitch, S., Le Quéré, C., Bakker, D. C. E., Canadell, J. G., Ciais, P., Jackson, R. B., Anthoni, P., Barbero, L., Bastos, A., Bastrikov, V., Becker, M., Bopp, L., Buitenhuis, E., Chandra, N., Chevallier, F., Chini, L. P., Currie, K. I., Feely, R. A., Gehlen, M., Gilfillan, D., Gkritzalis, T., Goll, D. S., Gruber, N., Gutekunst, S., Harris, I., Haverd, V., Houghton, R. A., Hurtt, G., Ilyina, T., Jain, A. K., Joetzjer, E., Kaplan, J. O., Kato, E., Klein Goldewijk, K., Korsbakken, J. I., Landschützer, P., Lauvset, S. K., Lefèvre, N., Lenton, A., Lienert, S., Lombardozzi, D., Marland, G., McGuire, P. C., Melton, J. R., Metzl, N., Munro, D. R., Nabel, J. E. M. S., Nakaoka, S.-I., Neill, C., Omar, A. M., Ono, T., Peregon, A., Pierrot, D., Poulter, B., Rehder, G., Resplandy, L., Robertson, E., Rödenbeck, C., Séférian, R., Schwinger, J., Smith, N., Tans, P. P., Tian, H., Tilbrook, B., Tubiello, F. N., van der Werf, G. R., Wiltshire, A. J., and Zaehle, S.: Global Carbon Budget 2019, Earth Syst. Sci. Data, 11, 1783–1838, https://doi.org/10.5194/essd-11-1783-2019, 2019b. a, b
Gillett, N. P., Arora, V. K., Matthews, D., and Allen, M. R.: Constraining the ratio of global warming to cumulative CO2 emissions using CMIP5 simulations, J. Climate, 26, 6844–6858, https://doi.org/10.1175/JCLI-D-12-00476.1, 2013. a
Griscom, B. W., Adams, J., Ellis, P. W., Houghton, R. A., Lomax, G., Miteva, D. A., Schlesinger, W. H., Shoch, D., Siikamäki, J. V., Smith, P., Woodbury, P., Zganjar, C., Blackman, A., Campari, J., Conant, R. T., Delgado, C., Elias, P., Gopalakrishna, T., Hamsik, M. R., Herrero, M., Kiesecker, J., Landis, E., Laestadius, L., Leavitt, S. M., Minnemeyer, S., Polasky, S., Potapov, P., Putz, F. E., Sandermanc, J., Silvius, M., Wollenberg, E., and Fargione, J.: Natural Climate Solutions Symposium, P. Natl. Acad. Sci. USA, 114, 1–6, https://doi.org/10.1073/pnas.1710465114, 2017. a
Haverd, V., Smith, B., Canadell, J. G., Cuntz, M., Mikaloff‐Fletcher, S., Farquhar, G., Woodgate, W., Briggs, P. R., and Trudinger, C. M.: Higher than expected CO2 fertilization inferred from leaf to global observations, Glob. Change Biol., 26, 2390–2402, https://doi.org/10.1111/gcb.14950, 2020. a
Houghton, R. A. and Nassikas, A. A.: Negative emissions from stopping deforestation and forest degradation, globally, Glob. Change Biol., 24, 350–359, https://doi.org/10.1111/gcb.13876, 2018. a, b, c
Houghton, R. A., Byers, B., and Nassikas, A. A.: A role for tropical forests in stabilizing atmospheric CO2, Nat. Clim. Change, 5, 1022–1023, https://doi.org/10.1038/nclimate2869, 2015. a
Huntzinger, D. N., Michalak, A. M., Schwalm, C., Ciais, P., King, A. W., Fang, Y., Schaefer, K., Wei, Y., Cook, R. B., Fisher, J. B., Hayes, D., Huang, M., Ito, A., Jain, A. K., Lei, H., Lu, C., Maignan, F., Mao, J., Parazoo, N., Peng, S., Poulter, B., Ricciuto, D., Shi, X., Tian, H., Wang, W., Zeng, N., and Zhao, F.: Uncertainty in the response of terrestrial carbon sink to environmental drivers undermines carbon-climate feedback predictions, Sci. Rep., 7, 1–8, https://doi.org/10.1038/s41598-017-03818-2, 2017. a
Hurtt, G. C., Chini, L. P., Frolking, S., Betts, R. A., Feddema, J., Fischer, G., Fisk, J. P., Hibbard, K., Houghton, R. A., Janetos, A., Jones, C. D., Kindermann, G., Kinoshita, T., Klein Goldewijk, K., Riahi, K., Shevliakova, E., Smith, S., Stehfest, E., Thomson, A., Thornton, P., van Vuuren, D. P., and Wang, Y. P.: Harmonization of land-use scenarios for the period 1500–2100: 600 years of global gridded annual land-use transitions, wood harvest, and resulting secondary lands, Clim. Change, 109, 117–161, https://doi.org/10.1007/s10584-011-0153-2, 2011. a
IPCC: The Physical Science Basis, Contribution of Working Group I to the Fifth Assessment Report of the Intergovernmental Panel on Climate Change, Cambridge University Press, Cambridge, UK and New York, USA, 1535 pp., 2013. a
Jones, C., Robertson, E., Arora, V., Friedlingstein, P., Shevliakova, E., Bopp, L., Brovkin, V., Hajima, T., Kato, E., Kawamiya, M., Liddicoat, S., Lindsay, K., Reick, C. H., Roelandt, C., Segschneider, J., and Tjiputra, J.: Twenty-First-Century Compatible CO2 Emissions and Airborne Fraction Simulated by CMIP5 Earth System Models under Four Representative Concentration Pathways, J. Climate, 26, 4398–4413, https://doi.org/10.1175/JCLI-D-12-00554.1, 2013. a, b, c
Jones, C., Ciais, P., Davis, S. J., Friedlingstein, P., Gasser, T., Peters, G. P., Rogelj, J., van Vuuren, D. P., Canadell, J. G., Cowie, A., Jackson, R. B., Jonas, M., Kriegler, E., Littleton, E., Lowe, J. A., Milne, J., Shrestha, G., Smith, P., Torvanger, A., and Wiltshire, A.: Simulating the Earth system response to negative emissions, Environ. Res. Lett., 11, 095012, https://doi.org/10.1088/1748-9326/11/9/095012, 2016. a, b
Jones, C. D., Hughes, J. K., Bellouin, N., Hardiman, S. C., Jones, G. S., Knight, J., Liddicoat, S., O'Connor, F. M., Andres, R. J., Bell, C., Boo, K.-O., Bozzo, A., Butchart, N., Cadule, P., Corbin, K. D., Doutriaux-Boucher, M., Friedlingstein, P., Gornall, J., Gray, L., Halloran, P. R., Hurtt, G., Ingram, W. J., Lamarque, J.-F., Law, R. M., Meinshausen, M., Osprey, S., Palin, E. J., Parsons Chini, L., Raddatz, T., Sanderson, M. G., Sellar, A. A., Schurer, A., Valdes, P., Wood, N., Woodward, S., Yoshioka, M., and Zerroukat, M.: The HadGEM2-ES implementation of CMIP5 centennial simulations, Geosci. Model Dev., 4, 543–570, https://doi.org/10.5194/gmd-4-543-2011, 2011 a, b, c, d, e
Joos, F., Meyer, R., Bruno, M., and Leuenberger, M.: The variability in the carbon sinks as reconstructed for the last 1000 years, Geophys. Res. Lett., 26, 1437, https://doi.org/10.1029/1999GL900250, 1999. a
Keller, D. P., Lenton, A., Scott, V., Vaughan, N. E., Bauer, N., Ji, D., Jones, C. D., Kravitz, B., Muri, H., and Zickfeld, K.: The Carbon Dioxide Removal Model Intercomparison Project (CDRMIP): rationale and experimental protocol for CMIP6, Geosci. Model Dev., 11, 1133–1160, https://doi.org/10.5194/gmd-11-1133-2018, 2018. a
Koch, A., Brierley, C., Maslin, M. M., and Lewis, S. L.: Earth system impacts of the European arrival and Great Dying in the Americas after 1492, Quaternary Sci. Rev., 207, 13–36, https://doi.org/10.1016/j.quascirev.2018.12.004, 2019. a
Koch, A.: Earth system feedbacks following large-scale tropical forest restoration (code & data), Mendeley Data, available at: https://data.mendeley.com/datasets/j39bw4rzsr/1, last access: 18 August 2020. a
Koven, C. D., Knox, R. G., Fisher, R. A., Chambers, J. Q., Christoffersen, B. O., Davies, S. J., Detto, M., Dietze, M. C., Faybishenko, B., Holm, J., Huang, M., Kovenock, M., Kueppers, L. M., Lemieux, G., Massoud, E., McDowell, N. G., Muller-Landau, H. C., Needham, J. F., Norby, R. J., Powell, T., Rogers, A., Serbin, S. P., Shuman, J. K., Swann, A. L. S., Varadharajan, C., Walker, A. P., Wright, S. J., and Xu, C.: Benchmarking and parameter sensitivity of physiological and vegetation dynamics using the Functionally Assembled Terrestrial Ecosystem Simulator (FATES) at Barro Colorado Island, Panama, Biogeosciences, 17, 3017–3044, https://doi.org/10.5194/bg-17-3017-2020, 2020. a
Lamb, D., Erskine, P. D., and Parrotta, J. A.: Restoration of Degraded Tropical Forest Landscapes, Science, 310, 1628–1632, 2005. a
Le Quéré, C., Andrew, R. M., Friedlingstein, P., Sitch, S., Pongratz, J., Manning, A. C., Korsbakken, J. I., Peters, G. P., Canadell, J. G., Jackson, R. B., Boden, T. A., Tans, P. P., Andrews, O. D., Arora, V. K., Bakker, D. C. E., Barbero, L., Becker, M., Betts, R. A., Bopp, L., Chevallier, F., Chini, L. P., Ciais, P., Cosca, C. E., Cross, J., Currie, K., Gasser, T., Harris, I., Hauck, J., Haverd, V., Houghton, R. A., Hunt, C. W., Hurtt, G., Ilyina, T., Jain, A. K., Kato, E., Kautz, M., Keeling, R. F., Klein Goldewijk, K., Körtzinger, A., Landschützer, P., Lefèvre, N., Lenton, A., Lienert, S., Lima, I., Lombardozzi, D., Metzl, N., Millero, F., Monteiro, P. M. S., Munro, D. R., Nabel, J. E. M. S., Nakaoka, S., Nojiri, Y., Padin, X. A., Peregon, A., Pfeil, B., Pierrot, D., Poulter, B., Rehder, G., Reimer, J., Rödenbeck, C., Schwinger, J., Séférian, R., Skjelvan, I., Stocker, B. D., Tian, H., Tilbrook, B., Tubiello, F. N., van der Laan-Luijkx, I. T., van der Werf, G. R., van Heuven, S., Viovy, N., Vuichard, N., Walker, A. P., Watson, A. J., Wiltshire, A. J., Zaehle, S., and Zhu, D.: Global Carbon Budget 2017, Earth Syst. Sci. Data, 10, 405–448, https://doi.org/10.5194/essd-10-405-2018, 2018. a
Lewis, S. L. and Maslin, M. A.: The Human Planet: How we created the Anthropocene, 1 edition, Pelican Books, London, UK, 2018. a
Lewis, S. L., Lopez-Gonzalez, G., Sonké, B., Affum-Baffoe, K., Baker, T. R., Ojo, L. O., Phillips, O. L., Reitsma, J. M., White, L., Comiskey, J. A., Djuikouo K, M. N., Ewango, C. E., Feldpausch, T. R., Hamilton, A. C., Gloor, M., Hart, T., Hladik, A., Lloyd, J., Lovett, J. C., Makana, J. R., Malhi, Y., Mbago, F. M., Ndangalasi, H. J., Peacock, J., Peh, K. S., Sheil, D., Sunderland, T., Swaine, M. D., Taplin, J., Taylor, D., Thomas, S. C., Votere, R., and Wöll, H.: Increasing carbon storage in intact African tropical forests, Nature, 457, 1003–1006, https://doi.org/10.1038/nature07771, 2009. a
Lewis, S. L., Mitchard, E. T. A., Prentice, C., Maslin, M., and Poulter, B.: Comment on “The global tree restoration potential”, Science, 366, eaaz0388, https://doi.org/10.1126/science.aaz0388, 2019a. a, b
Lewis, S. L., Wheeler, C. E., Mitchard, E. T. A., and Koch, A.: Restoring natural forests is the best way to remove atmospheric carbon, Nature, 568, 25–28, https://doi.org/10.1038/d41586-019-01026-8, 2019b. a, b, c
Liddicoat, S., Jones, C., and Robertson, E.: CO2 emissions determined by HadGEM2-ES to be compatible with the representative concentration pathway scenarios and their extensions, J. Climate, 26, 4381–4397, https://doi.org/10.1175/JCLI-D-12-00569.1, 2013. a, b, c, d
Negrón-Juárez, R. I., Koven, C. D., Riley, W. J., Knox, R. G., and Chambers, J. Q.: Observed allocations of productivity and biomass, and turnover times in tropical forests are not accurately represented in CMIP5 Earth system models, Environ. Res. Lett., 10, 064017, https://doi.org/10.1088/1748-9326/10/6/064017, 2015. a
Orihuela-Belmonte, D. E., De Jong, B. H. J., Mendoza-Vega, J., Van der Wal, J., Paz-Pellat, F., Soto-Pinto, L., and Flamenco-Sandoval, A.: Carbon stocks and accumulation rates in tropical secondary forests at the scale of community, landscape and forest type, Agric. Ecosyst. Environ., 171, 72–84, https://doi.org/10.1016/j.agee.2013.03.012, 2013. a, b
Phillips, O. L., Aragao, L. E. O. C., Lewis, S. L., Fisher, J. B., Lloyd, J., Lopez-Gonzalez, G., Malhi, Y., Monteagudo, A., Peacock, J., Quesada, C. A., van der Heijden, G., Almeida, S., Amaral, I., Arroyo, L., Aymard, G., Baker, T. R., Banki, O., Blanc, L., Bonal, D., Brando, P., Chave, J., de Oliveira, A. C. A., Cardozo, N. D., Czimczik, C. I., Feldpausch, T. R., Freitas, M. A., Gloor, E., Higuchi, N., Jimenez, E., Lloyd, G., Meir, P., Mendoza, C., Morel, A., Neill, D. A., Nepstad, D., Patino, S., Penuela, M. C., Prieto, A., Ramirez, F., Schwarz, M., Silva, J., Silveira, M., Thomas, A. S., Steege, H. T., Stropp, J., Vasquez, R., Zelazowski, P., Davila, E. A., Andelman, S., Andrade, A., Chao, K.-J., Erwin, T., Di Fiore, A., Keeling, H., Killeen, T. J., Laurance, W. F., Cruz, A. P., Pitman, N. C. A., Vargas, P. N., Ramirez-Angulo, H., Rudas, A., Salamao, R., Silva, N., Terborgh, J., and Torres-Lezama, A.: Drought Sensitivity of the Amazon Rainforest, Science, 323, 1344–1347, https://doi.org/10.1126/science.1164033, 2009. a
Pongratz, J., Reick, C. H., Raddatz, T., and Claussen, M.: Effects of anthropogenic land cover change on the carbon cycle of the last millennium, Global Biogeochem. Cy., 23, 1–13, https://doi.org/10.1029/2009GB003488, 2009. a
Poorter, L., Bongers, F., Aide, T. M., Almeyda Zambrano, A. M., Balvanera, P., Becknell, J. M., Boukili, V., Brancalion, P. H. S., Broadbent, E. N., Chazdon, R. L., Craven, D., de Almeida-Cortez, J. S., Cabral, G. A. L., de Jong, B. H. J., Denslow, J. S., Dent, D. H., DeWalt, S. J., Dupuy, J. M., Durán, S. M., Espírito-Santo, M. M., Fandino, M. C., César, R. G., Hall, J. S., Hernandez-Stefanoni, J. L., Jakovac, C. C., Junqueira, A. B., Kennard, D., Letcher, S. G., Licona, J.-C., Lohbeck, M., Marín-Spiotta, E., Martínez-Ramos, M., Massoca, P., Meave, J. A., Mesquita, R., Mora, F., Muñoz, R., Muscarella, R., Nunes, Y. R. F., Ochoa-Gaona, S., de Oliveira, A. A., Orihuela-Belmonte, E., Peña-Claros, M., Pérez-García, E. A., Piotto, D., Powers, J. S., Rodríguez-Velázquez, J., Romero-Pérez, I. E., Ruíz, J., Saldarriaga, J. G., Sanchez-Azofeifa, A., Schwartz, N. B., Steininger, M. K., Swenson, N. G., Toledo, M., Uriarte, M., van Breugel, M., van der Wal, H., Veloso, M. D. M., Vester, H. F. M., Vicentini, A., Vieira, I. C. G., Bentos, T. V., Williamson, G. B., and Rozendaal, D. M. A.: Biomass resilience of Neotropical secondary forests, Nature, 530, 211–214, https://doi.org/10.1038/nature16512, 2016. a, b, c
Pugh, T. A. M., Arneth, A., Olin, S., Ahlström, A., Bayer, A. D., Goldewijk, K. K., Lindeskog, M., and Schurgers, G.: Simulated carbon emissions from land-use change are substantially enhanced by accounting for agricultural management, Environ. Res. Lett., 10, 124008, https://doi.org/10.1088/1748-9326/10/12/124008, 2015. a
Rogelj, J., Shindell, D., Jiang, K., Fifita, S., Forster, P., Ginzburg, V., Handa, C., Kheshgi, H., Kobayashi, S., Kriegler, E., Mundaca, L., Séférian, R., and Vilariño, M.: Mitigation Pathways Compatible with 1.5∘C in the Context of Sustainable Development, in: Global Warming of 1.5∘C. An IPCC Special Report on the impacts of global warming of 1.5∘C above pre-industrial levels and related global greenhouse gas emission pathways, in the context of strengthening the global response to the threat of climate change, sustainable development, and efforts to eradicate pove, edited by: Masson-Delmotte, V., Zhai, P., Pörtner, H.-O., Roberts, D., Skea, J., Shukla, P., Pirani, A., Moufouma-Okia, W., Péan, C., Pidcock, R., Connors, S., Matthews, J., Chen, Y., Zhou, X., Gomis, M., Lonnoy, E., Maycock, T., Tignor, M., and Waterfield, T., IPCC, Geneva, Switzerland, 3–174, 2018. a, b
Saatchi, S. S., Harris, N. L., Brown, S., Lefsky, M., Mitchard, E. T. A., and Salas, W.: Benchmark map of forest carbon stocks in tropical regions across three continents, P. Natl. Acad. Sci. USA, 108, 9899–9904, https://doi.org/10.1073/pnas.1019576108, 2011. a
Schwinger, J. and Tjiputra, J.: Ocean carbon cycle feedbacks under negative emissions, Geophys. Res. Lett., 45, 5062–5070, https://doi.org/10.1029/2018GL077790, 2018. a, b
Smith, P., Davis, S. J., Creutzig, F., Fuss, S., Minx, J., Gabrielle, B., Kato, E., Jackson, R. B., Cowie, A., Kriegler, E., van Vuuren, D. P., Rogelj, J., Ciais, P., Milne, J., Canadell, J. G., McCollum, D., Peters, G., Andrew, R., Krey, V., Shrestha, G., Friedlingstein, P., Gasser, T., Grubler, A., Heidug, W. K., Jonas, M., Jones, C. D., Kraxner, F., Littleton, E., Lowe, J., Moreira, J. R., Nakicenovic, N., Obersteiner, M., Patwardhan, A., Rogner, M., Rubin, E., Sharifi, A., Torvanger, A., Yamagata, Y., Edmonds, J., and Yongsung, C.: Biophysical and economic limits to negative CO2 emissions, Nat. Clim. Change, 6, 42–50, 2016. a
Stocker, B. D., Strassmann, K., and Joos, F.: Sensitivity of Holocene atmospheric CO2 and the modern carbon budget to early human land use: analyses with a process-based model, Biogeosciences, 8, 69–88, https://doi.org/10.5194/bg-8-69-2011, 2011. a
Taylor, K. E., Stouffer, R. J., and Meehl, G. A.: A Summary of CMIP5 Experiment Design, B. Am. Meteorol. Soc., 93, 485–498, https://doi.org/10.1175/BAMS-D-11-00094.1, 2012. a
United Nations Treaty Collection: Paris Agreement to the United Nations Framework Convention on Climate Change, Paris, Dec. 12, 2015, T.I.A.S. No. 16-1104, 2016. a
van Vuuren, D. P., Stehfest, E., den Elzen, M. G. J., Kram, T., van Vliet, J., Deetman, S., Isaac, M., Goldewijk, K. K., Hof, A., Beltran, A. M., Oostenrijk, R., and van Ruijven, B.: RCP2.6: Exploring the possibility to keep global mean temperature increase below 2C, Clim. Change, 109, 95–116, https://doi.org/10.1007/s10584-011-0152-3, 2011. a, b, c, d, e
Veldman, J. W., Aleman, J. C., Alvarado, S. T., Anderson, T. M., Archibald, S., Bond, W. J., Boutton, T. W., Buchmann, N., Buisson, E., Canadell, J. G., Dechoum, M. D. S., Diaz-Toribio, M. H., Durigan, G., Ewel, J. J., Fernandes, G. W., Fidelis, A., Fleischman, F., Good, S. P., Griffith, D. M., Hermann, J.-M., Hoffmann, W. A., Le Stradic, S., Lehmann, C. E. R., Mahy, G., Nerlekar, A. N., Nippert, J. B., Noss, R. F., Osborne, C. P., Overbeck, G. E., Parr, C. L., Pausas, J. G., Pennington, R. T., Perring, M. P., Putz, F. E., Ratnam, J., Sankaran, M., Schmidt, I. B., Schmitt, C. B., Silveira, F. A. O., Staver, A. C., Stevens, N., Still, C. J., Strömberg, C. A. E., Temperton, V. M., Varner, J. M., and Zaloumis, N. P.: Comment on “The global tree restoration potential”, Science, 366, eaay7976, https://doi.org/10.1126/science.aay7976, 2019. a