the Creative Commons Attribution 4.0 License.
the Creative Commons Attribution 4.0 License.
 | 10 May 2021
Toward a global calibration for quantifying past oxygenation in oxygen minimum zones using benthic Foraminifera
Laetitia Licari
Ekaterina Ovsepyan
Kazuyo Tachikawa
Luc Beaufort
Oxygen minimum zones (OMZs) are oceanic areas largely depleted in dissolved oxygen, nowadays considered in expansion in the face of global warming. To investigate the relationship between OMZ expansion and global climate changes during the late Quaternary, quantitative oxygen reconstructions are needed but are still in their early development.
Here, past bottom water oxygenation (BWO) was quantitatively assessed through a new, fast, semi-automated, and taxon-independent morphometric analysis of benthic foraminiferal tests, developed and calibrated using WNP (western North Pacific, including its marginal seas), ENP (eastern North Pacific), and ESP (eastern South Pacific) OMZ samples. This new approach is based on an average size and shape index for each sample. This method, as well as two already published micropalaeontological techniques based on benthic foraminiferal assemblages' variability and porosity investigation of a single species, was calibrated here based on availability of new data from 45 core tops recovered along an oxygen gradient (from 0.03 to 2.88 mL L−1) from the WNP, ENP, EEP (eastern Equatorial Pacific), ESP, SWACM (southwest African continental margin), and AS (Arabian Sea) OMZs. Global calibrated transfer functions are herein proposed for these methods.
These micropalaeontological reconstruction approaches were then applied to a palaeorecord from the ENP OMZ to examine the consistency and limits of these methods, as well as the relative influence of bottom and pore waters on these micropalaeontological tools. Both the assemblage and morphometric approaches (which are also ultimately based on the ecological response of the complete assemblage and faunal succession according to BWO) gave similar and consistent past BWO reconstructions, while the porosity approach (based on a single species and its unique response to a mixed signal of bottom and pore waters) showed ambiguous estimations.
- Article
(6095 KB) - Full-text XML
-
Supplement
(113 KB) - BibTeX
- EndNote


Oxygen minimum zones (OMZs) are defined by a dissolved oxygen content of water lower than 0.5 mL L−1 (= 20 µmol kg−1; Gilly et al., 2013) mainly due to a combination of two factors: (1) a high oxygen consumption rate by biotic remineralization of the organic matter originating from primary producers during its slow sedimentation in nutrient-rich environments and (2) limited physical regeneration due to a slow oceanic circulation (Wyrtki, 1962; Paulmier and Ruiz-Pino, 2009; Gilly et al., 2013; Praetorius et al., 2015). These areas have expanded over the past 50 years (they now represent about 10 % of the global oceans' volume), and further deoxygenation is expected from now until the end of the century (Stramma et al., 2008, 2010; Gilly et al., 2013; Bopp et al., 2017; Breitburg et al., 2018) as a result of global warming (e.g. Moss et al., 2008). Due to OMZs' implications for structuring modern ecosystems, biodiversity, and fisheries and their relationship with climate change, the carbon pump, and the carbonate system, the investigation and quantification of past bottom water oxygenation (BWO) is key to understanding their behaviour in a context of global warming and to predicting their future evolution (Paulmier and Ruiz-Pino, 2009; Gilly et al., 2013; Gilbert, 2017; Breitburg et al., 2018; Levin, 2018).
Benthic foraminifera are considered to be sensitive tracers of temporal and spatial variations in OMZs' intensity (Bernhard and Reimers, 1991; Cannariato and Kennett, 1999) as oxygen is usually the main limiting factor in these areas (Jorissen et al., 1995). Whatever their investigation methods were, most of the previous studies concerned with this topic have usually produced qualitative past OMZ reconstructions and have not used the species-specific adaptation of benthic foraminifera with regards to oxygen concentration to produce quantitative reconstructions (e.g. den Dulk et al., 1998, 2000; Cannariato and Kennett, 1999; Cannariato et al., 1999; Ohkushi et al., 2013; Moffitt et al., 2014, 2015a, b). Regarding the benthic foraminiferal species adaptation to dissolved oxygen values usually found in OMZs, the scale historically used to define assemblages corresponds to oxic (> 1.5 mL L−1), suboxic or intermediate hypoxic (0.5 to 1.4 or 1.5 mL L−1), and dysoxic or severe hypoxic (< 0.5 mL L−1) (Kaiho, 1994; Cannariato and Kennett, 1999; Cannariato et al., 1999; Jorissen et al., 2007; Ohkushi et al., 2013; Palmer et al., 2020), and we decided to follow the terminology recently used by Palmer et al. (2020). Our previous investigation focused on two methods based on assemblage composition (Tetard et al., 2017a) and porosity measurements (Tetard et al., 2017b) to quantitatively reconstruct variations in past BWO in the largest worldwide OMZ, the eastern North Pacific (ENP) OMZ. However, both methods still required substantial taxonomical knowledge and are time-consuming. A modern calibration is also still needed.
Several studies have already reported morphological (size and shape of tests) responses of benthic foraminifera according to environmental gradients such as oxygenation (Corliss, 1991; Kaiho, 1994; Kaiho et al., 2006). Indeed, the principal idea behind the use of morphometry for palaeo-environmental reconstructions is that benthic foraminiferal shell morphology usually depends on the micro-habitat preferences of each species (Corliss, 1991). Palmer et al. (2020) remind us that in poorly oxygenated environments, benthic foraminiferal faunas are usually dominated by infaunal and elongate species with high porosity while porcelaneous and epifaunal taxa are more abundant in well-oxygenated conditions (Kaiho, 1994; Jorissen et al., 1995, 2007). Indeed, on the one hand, epibenthic species (surface dwellers living in oxic waters) are usually more circular (meaning trochospiral and planispiral tests here). Good examples are Cibicides and Planulina species that are rounded and usually lie flat on the sediment or are attached to a substrate in oxygenated conditions. On the other hand, endobenthic genera such as Bolivina and Buliminella thrive under oxygen-depleted conditions and tend to display more elongated (serial) tests (shallow to deep infaunal), allowing them to bury themselves several centimetres deep into the sediment. When oxic conditions prevail, the benthic fauna is dominated by epibenthic species. A decrease in bottom water oxygenation is usually associated with a replacement of the epibenthic fauna by deep and shallow endobenthic species moved up to the water–sediment interface following the redox front (Jorissen et al., 1995, 2007). Such changes were reported by the serial spiral forms ratio in Core MD02-2508 from the ENP OMZ (Tetard et al., 2017a). An increase in the average roundness of the assemblage is thus likely to indicate more oxic conditions, while bottom water conditions progressively depleted in oxygen will show a decrease in roundness (Tetard et al., 2017a). The roundness factor is thus prone to inter-specific but also to intra-specific (lengthening or widening of individual species in their respective oxygen range, due to an actual widening of chambers or due to a shortening of shells) influences. The overall morphometry of assemblages in OMZs will be further discussed in Sect. 4.1.
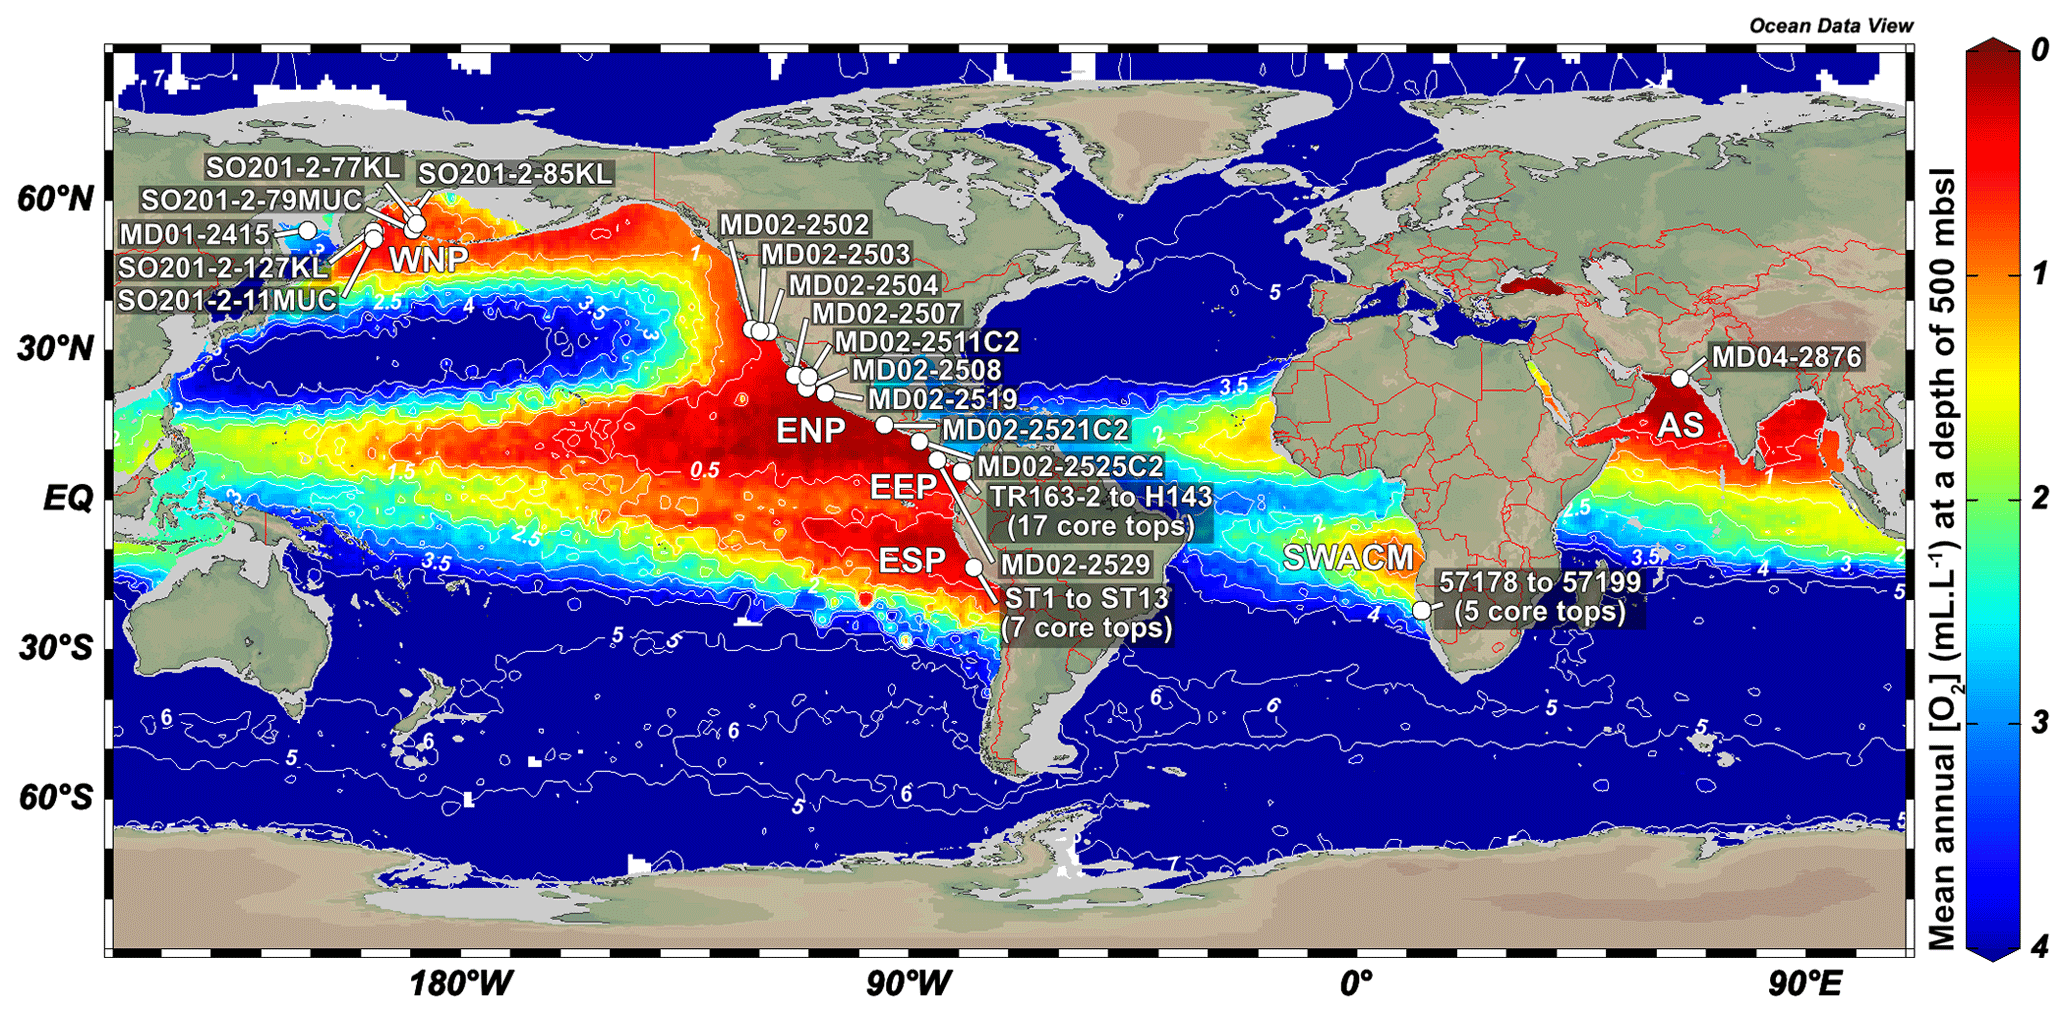
Figure 1Location (white dot) of the different cores used in this study. Labels show core names. Depths and mean annual dissolved oxygen concentrations near core sites are available in Table 1. This figure was generated by using the Ocean Data View software (Schlitzer, 2020) and the World Ocean Atlas 2013 dataset (Garcia et al., 2014).
These observations led to the development of a new morphometric method, accessible and easy-to-perform for non-specialists, requiring little equipment, fast, and relying on semi-automated size and shape measurements. However, relationships between benthic foraminifera (assemblages, measurements) and environmental parameters are usually region-based and are difficult to apply globally (Palmer et al., 2020). To this aim, 45 core tops recovered worldwide along oxygen gradients from several oxygen-deficient areas such as the WNP (western North Pacific, including its marginal seas), the ENP, the EEP (eastern Equatorial Pacific), the ESP (eastern South Pacific), the SWACM (southwest African continental margin), and the AS (Arabian Sea) OMZs, of which the modern values are known, were used for the global calibration of each of the three existing BWO estimation methods, based on assemblage composition, porosity, or morphometry.
2.1 Core materials
Core MD02-2508, the main core investigated in this study was retrieved ∼ 90 km off the Baja California coast (23∘27.91′ N, 111∘35.74′ W) during the R/V Marion Dufresne MD126 MONA (IMAGES VII) campaign in 2002 (Fig. 1a). This 40.42 m core was piston-cored (giant corer Calypso) at a depth of 606 m b.s.l. and covers the last 80 kyr (Blanchet et al., 2007). At this location and depth, the coring site lies in the margin of the ENP OMZ core, where the current mean annual [O2] is about 0.13 mL L−1 according to the World Ocean Atlas 2013 dataset (Garcia et al., 2014; http://www.nodc.noaa.gov/OC5/woa13/, last access: 4 May 2021).
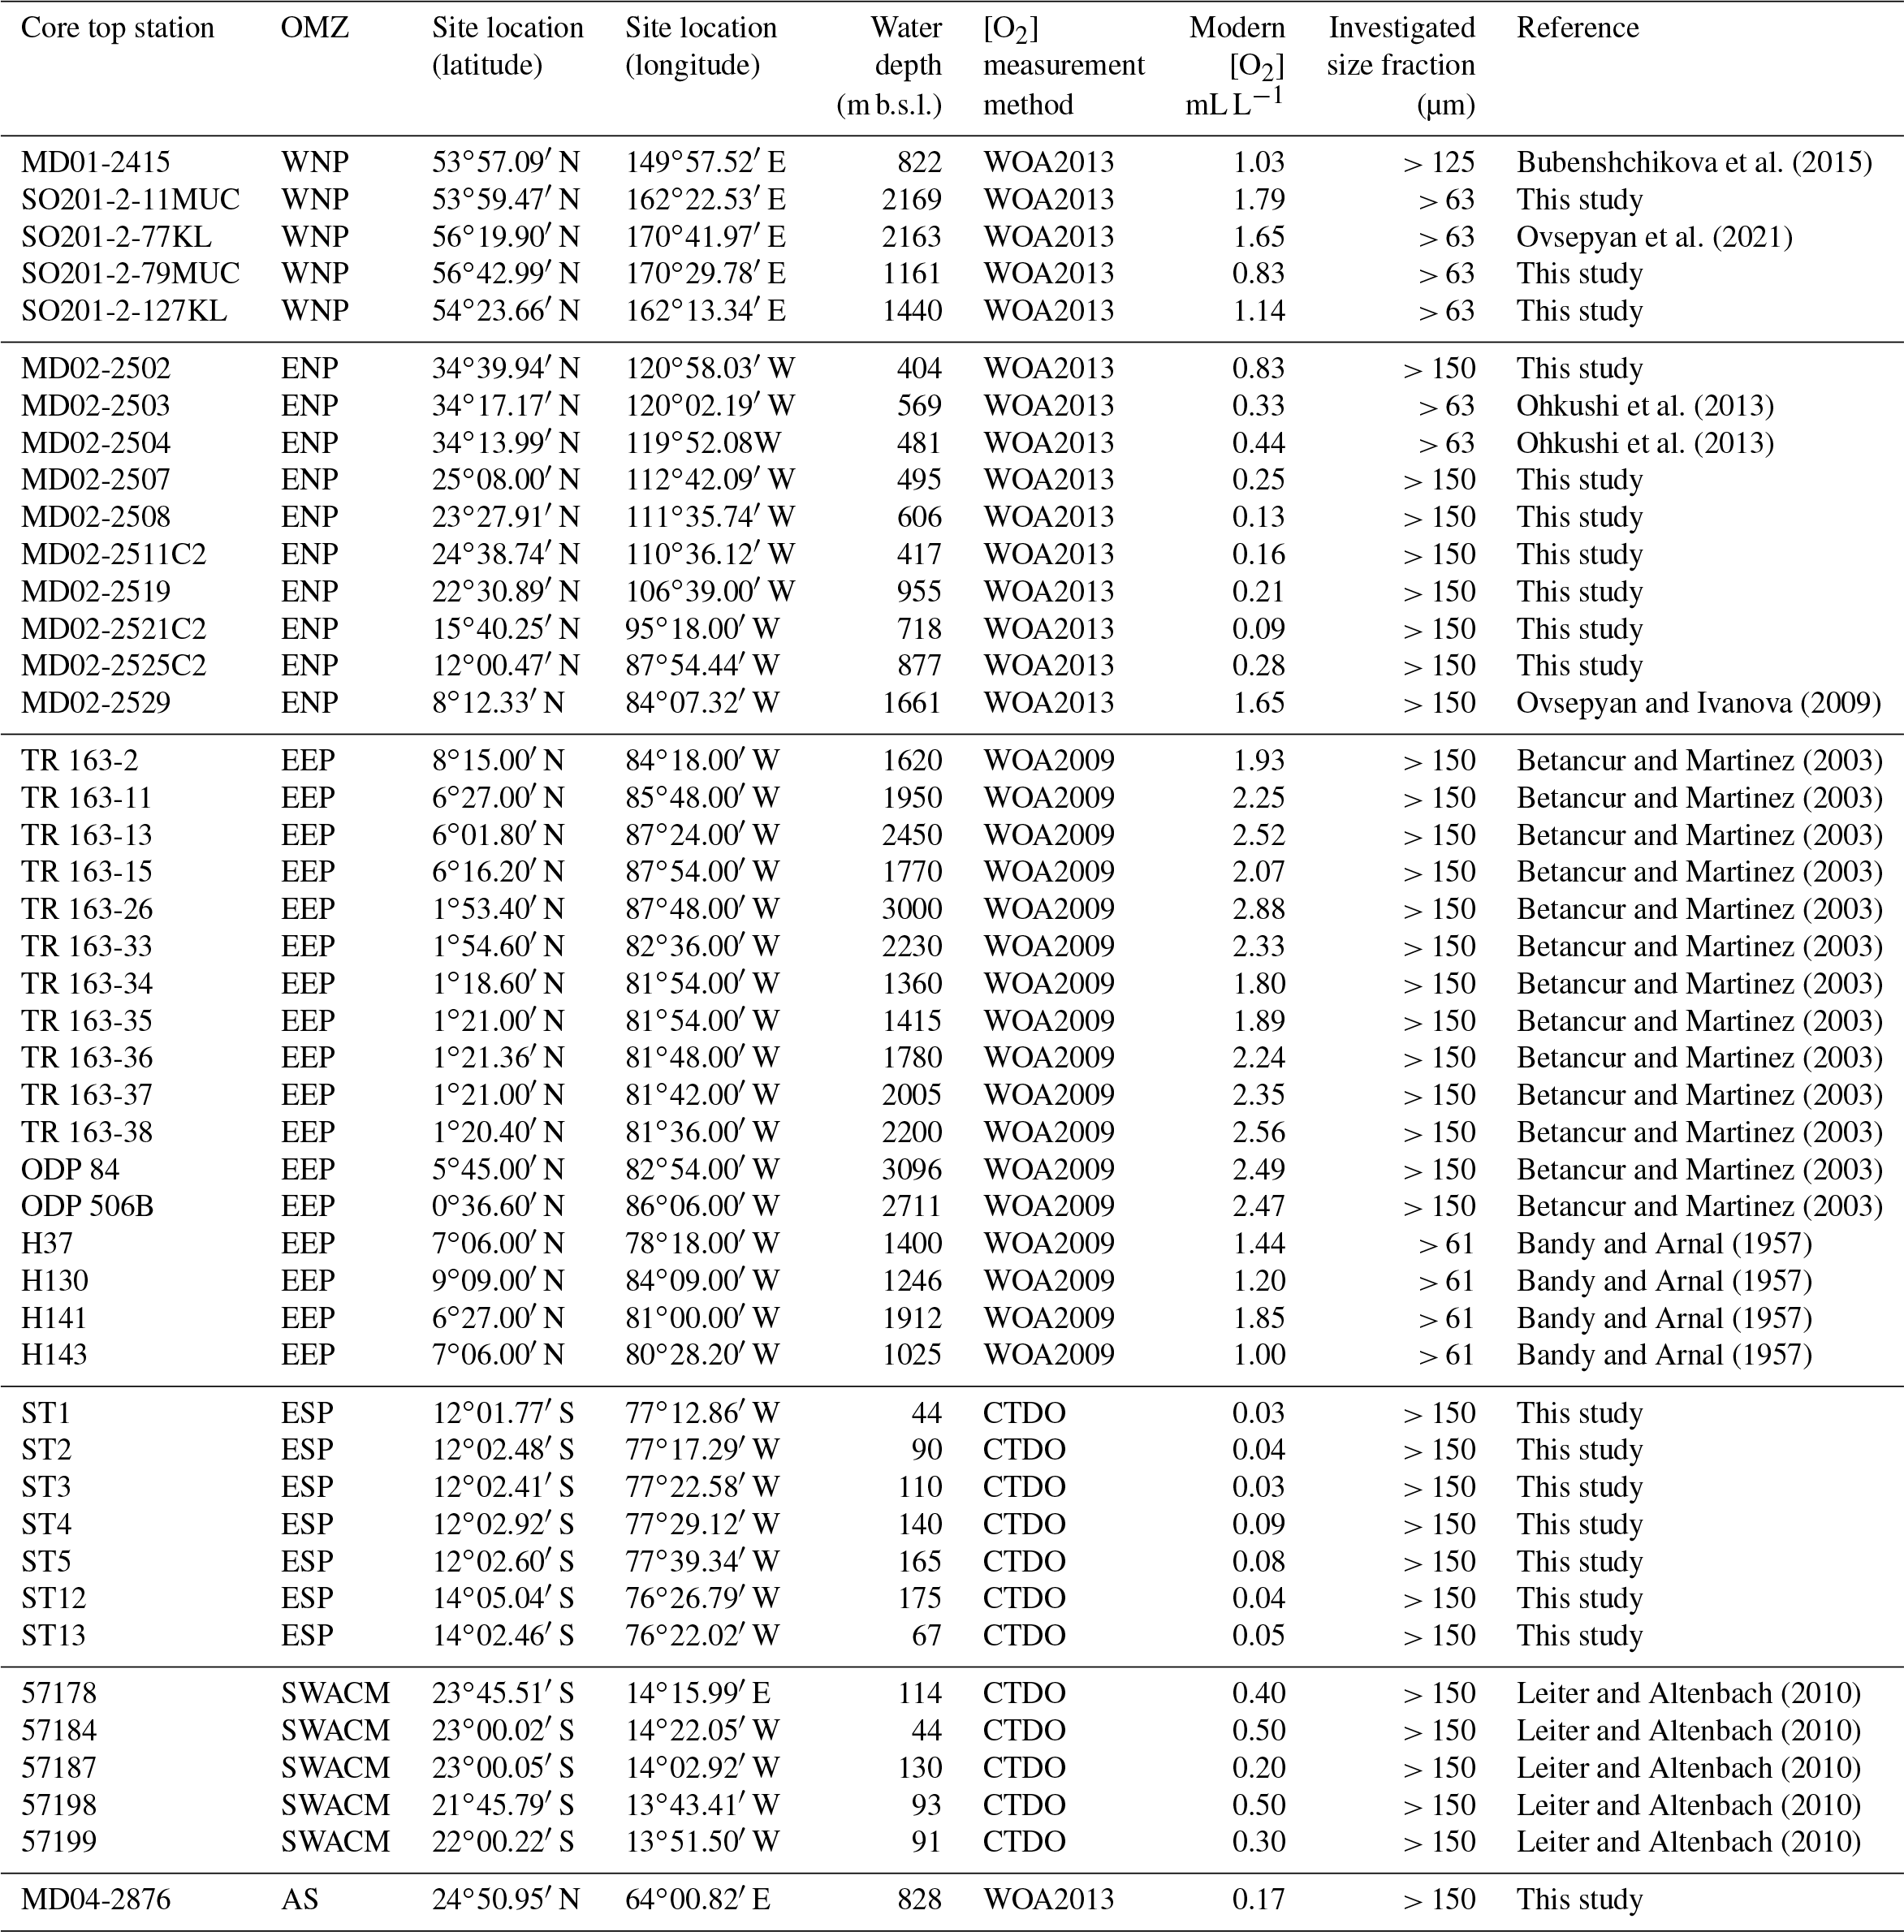
Several core tops, recovered along transects through the WNP, ENP, EEP, ESP, SWACM, and AS OMZs using a piston corer, multi-corer, and CASQ corer, were also investigated. This allowed the sampling throughout an oxygenation gradient of 0.03 to 2.88 mL L−1, where bottom water concentrations were estimated using the World Ocean Atlas 2013 (Garcia et al., 2014) regarding the ENP, AS, and WNP core sites and the World Ocean Atlas 2009 (Garcia et al., 2010) regarding the EEP core sites (originally investigated by Bandy and Arnal, 1957 and Betancur and Martinez, 2003, and recently by Patarroyo and Martinez, 2021), and CTDO measurements were made concerning the ESP and SWACM (investigated by Leiter and Altenbach, 2010) core sites. Core top location, water depth, and modern [O2] values are detailed in Table 1. Only 1 cm sections that usually record less than a few hundreds of years were investigated. These cores are thus suitable for faunal comparison and calibration purposes.
The ENP core tops (see Table 1) were carried out at CEREGE (preparation, census counting of benthic foraminifera, and morphometric measurements), except for cores MD02-2503 and MD02-2504 (Ohkushi et al., 2013) and Core MD02-2529 (Ovsepyan and Ivanova, 2009). The ESP Peruvian-margin OMZ core tops (ST1 to ST13) were recovered during the April 2015 CRIO campaign on the R/V Olaya where sediment sampling and CTDO measurements were carried out on five sites along the Callao transect (ST1 to ST5) and two sites along the Pisco transect (ST12 to ST13), and these were also prepared and processed at CEREGE. All the investigation on the core tops recovered from the WNP were carried out by Ekaterina Ovsepyan (regarding SO201-2-11MUC, SO201-2-77KL, SO201-2-79MUC, SO201-2-127KL) and Bubenshchikova et al. (2015, regarding MD01-2415, dataset of benthic foraminiferal counts is available in their supplementary material). These samples were collected during the R/V Sonne cruise Leg SO201-2 in 2009 and the 2001 WEPAMA cruise of the R/V Marion Dufresne, respectively. Regarding the EEP OMZ, census counting and oxygen information from 17 core tops (see list in Table 1), recovered from the Panama Basin, originally investigated by Bandy and Arnal (1957) and Betancur and Martinez (2003), was recovered from the supplementary material shared by Patarroyo and Martinez (2021). Regarding the SWACM samples, as no census data are provided in Leiter and Altenbach (2010), we used the relative abundance visible on their Figs. 3 and 5. As the authors divided their samples into 150–250 and > 250 µm size fractions and provided only benthic foraminiferal relative abundances for each fraction of each sample without giving the total number of tests per sample, we were not able to gather both fractions to investigate the > 150 µm fraction. Thus, only five samples were investigated, where the relative abundance for the 150–250 µm fraction (their Fig. 5) was available and where no foraminifera were present in the > 250 µm fraction (their Fig. 3). Finally, Core MD04-2876 recovered from the AS OMZ was investigated by Laetitia Licari.
Bubenshchikova et al. (2015)Ovsepyan et al. (2021)Ohkushi et al. (2013)Ohkushi et al. (2013)Ovsepyan and Ivanova (2009)Betancur and Martinez (2003)Betancur and Martinez (2003)Betancur and Martinez (2003)Betancur and Martinez (2003)Betancur and Martinez (2003)Betancur and Martinez (2003)Betancur and Martinez (2003)Betancur and Martinez (2003)Betancur and Martinez (2003)Betancur and Martinez (2003)Betancur and Martinez (2003)Betancur and Martinez (2003)Betancur and Martinez (2003)Bandy and Arnal (1957)Bandy and Arnal (1957)Bandy and Arnal (1957)Bandy and Arnal (1957)Leiter and Altenbach (2010)Leiter and Altenbach (2010)Leiter and Altenbach (2010)Leiter and Altenbach (2010)Leiter and Altenbach (2010)Table 1Core station location and depth and modern dissolved oxygen level for each investigated core top sample. WOA2013 and WOA2009 refer to the World Ocean Atlas 2013 and World Ocean Atlas 2009, respectively.
2.2 Benthic foraminiferal assemblage study
Regarding the preparation of the 14 core top samples available at CEREGE for calibration purposes (7 from the ENP (MD02-2502, MD02-2507, MD02-2508, MD02-2511C2, MD02-2519, MD02-2521C2, MD02-2525C2) and 7 from the ESP (ST1, ST2, ST3, ST4, ST5, ST12, ST13) transects), these samples usually contained benthic foraminifera often encrusted in organic-matter-rich clays. To extract benthic foraminiferal tests (as OMZ samples are mostly composed of calcareous tests and very few agglutinated or soft-shelled specimens which are usually not preserved in the fossil record; Gooday et al., 2000), the following procedure was adapted from Bairbakish et al. (1999):
-
A 1 cm thick slice was sampled and weighed.
-
The sample was oven-dried over 48 h and weighed again as a routine laboratory procedure to obtain estimates of wet and dry weights of bulk sediment.
-
The sample was gently re-wet to disaggregate sediment mass using a water spray over 63 and 150 µm sized meshes without damaging the foraminiferal tests.
-
If the sediments did not disaggregate, > 63 µm residues were placed into a 25 mL beaker where 6 mL of ∼ 3 % diluted NaClO (sodium hypochlorite solution) and 3 mL of ∼ 35 % diluted H2O2 (hydrogen peroxide solution) were added during 10 min to disaggregate organic clots. Residues were then rinsed with tap water and sieved over 63 and 150 µm sized meshes.
-
The contents of each sieve were rinsed with distilled water and filtered before being oven-dried and stored in vials.
-
Fine (63–150 µm) and coarse (> 150 µm) fractions were weighed.
The 31 other core tops used for the calibration of the assemblage method were previously counted for benthic foraminifera by Ekaterina Ovsepyan (MD02-2529, SO201-2-11MUC, SO201-2-77KL, SO201-2-79MUC, SO201-2-127KL), Bubenshchikova et al. (2015, MD01-2415), Ohkushi et al. (2013, MD02-2503 and MD02-2504), Betancur and Martinez (2003); Patarroyo and Martinez (2021, TR 163-2, TR 163-11, TR 163-13, TR 163-15, TR 163-26, TR 163-33, TR 163-34, TR 163-35, TR 163-36, TR 163-37, TR 163-38, ODP 84, ODP 506B), Bandy and Arnal (1957); Patarroyo and Martinez (2021, H37, H130, H141, H143), Leiter and Altenbach (2010, 57178, 57184, 57187, 57198, 57199), and Laetitia Licari (MD04-2876). The benthic foraminiferal specimens used in this study for Core MD02-2508 were picked for assemblage investigation in Tetard et al. (2017a). Depending on the abundance of benthic foraminifera, different aliquots were investigated to pick about 300 specimens per sample. We decided to mainly focus on coarse-fraction data (> 150 µm) as this is the size fraction commonly used in benthic foraminiferal studies and in order to propose a calibration adapted to most of the studies. However, we also decided to include fine-fraction data in our calibration by using the > 63 µm counting when available (for 10 out of the 45 core tops; see Table 2). According to this, only 17 out of the 63 shared core tops from census counting from Patarroyo and Martinez (2021) were used (the ones originally investigated by Bandy and Arnal, 1957, and Betancur and Martinez, 2003), as the other core tops were investigated for the fine fraction alone.
2.3 Pore density analysis
Regarding the Pacific Basin, Bolivina seminuda from the ENP was previously investigated for its porosity (Tetard et al., 2017b). This species was very abundant throughout Core MD02-2508 and is also present in two other ENP core tops (MD02-2519 and MD02-2525C2), and its ecological adaptation is well documented in the literature (e.g. Glock et al., 2013). As a consequence, it was selected in order to associate porosity values with oxygenation. The original procedure consists in picking 30 specimens which are then gently crushed between two microscope glass slides. The test fragments are then dropped along with ethanol into a compartmented decanter for a uniform and random settling of particles on a microscope glass slide. After drying, cover glasses are placed along with optical adhesive on each sample of the glass slide. Using customized image acquisition software, images of each fragment are automatically acquired under a transmitted light microscope and sent to image processing software that binarizes them and computes the area of each fragment and its pores. The average porosity for each sample can then be investigated (see detailed procedure in Tetard et al., 2017b).
2.4 Morphometric analysis procedure
As no tests were altered or broken (only some moderate in situ dissolution was observed in a few samples; absolute preservation score of 6 to 8 on the preservation scale of Nguyen et al., 2009), we were able to observe and measure several size and shape indices. Indeed, as the environmental conditions in OMZ usually correspond to oxygen-depleted clays with very limited bioturbation, shells are most of the time very well preserved. Moreover, we believe that good preservation might also be related to high sedimentation rates at the site locations studied, most likely due to their close position to the land where they could be affected by enhanced terrigenous material supply. Although the delicate shell of typical OMZ species such as Bolivina and Eubulimina species might appear fragile and delicate, these tests are quite tough, and we are confident that our cleaning procedure did not affect their preservation, assemblage composition overall, and morphology of the shells. The taxon-independent and semi-automated morphometric analysis was performed on 16 samples (3 from the WNP (SO201-2-11MUC, SO201-2-79MUC, SO201-2-127KL), 6 from the ENP (MD02-2502, MD02-2508, MD02-2511C2, MD02-2519, MD02-2521C2, MD02-2525C2), 6 from the ESP (ST1, ST2, ST3, ST4, ST5, ST12), and 1 from the AS (MD04-2876) transects). As the fine fraction (63–150 µm) might exhibit fragmented and broken tests (which do not reflect the true morphology of the organisms when they were living) or juvenile specimens (which do not always reflect the true morphology of the adult forms (e.g. for macrospheric forms of Bolivina species, the proloculus is usually very rounded, while the adult specimen can be very elongated)), this fraction was not investigated for the morphometric analysis which was focused on the > 150 µm fraction.
In order to measure several morphometric parameters for the complete assemblage of each sample, every specimen picked in the Tetard et al. (2017a) study (around 300 specimens per sample, corresponding to the number of specimens needed for representing a complete assemblage; Buzas, 1990; Fatela and Taborda, 2002) was dropped onto a 20 × 20 mm black square and a single picture per sample was acquired under a stereoscopic microscope. The light should be bright enough for the tests to be well visible on the black background but not too bright so that the background stays completely dark (see Fig. 2a as an example). These settings are the best compromise between resolution and spacing between every test for preventing contact.
The following procedure was used for the automated morphometric processing of every sample image on the ImageJ image analysis software (v.1.52e; Schneider et al., 2012; http://imagej.nih.gov/ij/ last access: 4 May 2021) and was automatically performed by using the MorFo_.ijm (Morphometrics on Foraminifera) Java macro developed for this study (available at https://github.com/microfossil/ImageJ-LabView-Scripts, last access: 4 May 2021, and in the Supplement). Once installed (simply put the MorFo_.ijm file into the plugin directory of your ImageJ software) and selected, the MorFo plugin will automatically perform the following:
-
It will ask the user for the input folder where original images are located and create three output subfolders for resized images, processed images, and results in the designated input folder. It also asks the user for a known distance in pixels and a known distance in micrometres in order to generate calculated measurements in micrometres.
-
It will open each image individually, reduce its size to 1000 × 1000 pixels, and convert it into an 8 bit image for binarization in order to obtain a black-and-white-only image (Fig. 2).
-
It will separate the specimens in contact with each other using “Watershed Irregular Features”, performed by using the BioVoxxel plugin (available online at http://fiji.sc/BioVoxxel_Toolbox, last access: 4 May 2021).
-
It will select “Area”, “Shape descriptors”, and “Fit ellipse” within the “Set measurements” panel in order to measure a size and a shape parameter for every specimen.
-
It will run an “Analyze particles” operation (“Size” and “Circularity” are adjusted, here 40–infinity and 0.30–1.00, respectively, so as to exclude small and elongated particles such as dust) to count and measure each specimen.
-
It will save the resized image, processed image, average results for each sample, and detailed results for each specimen.
-
It will display a success message and automatically close the ImageJ distribution.
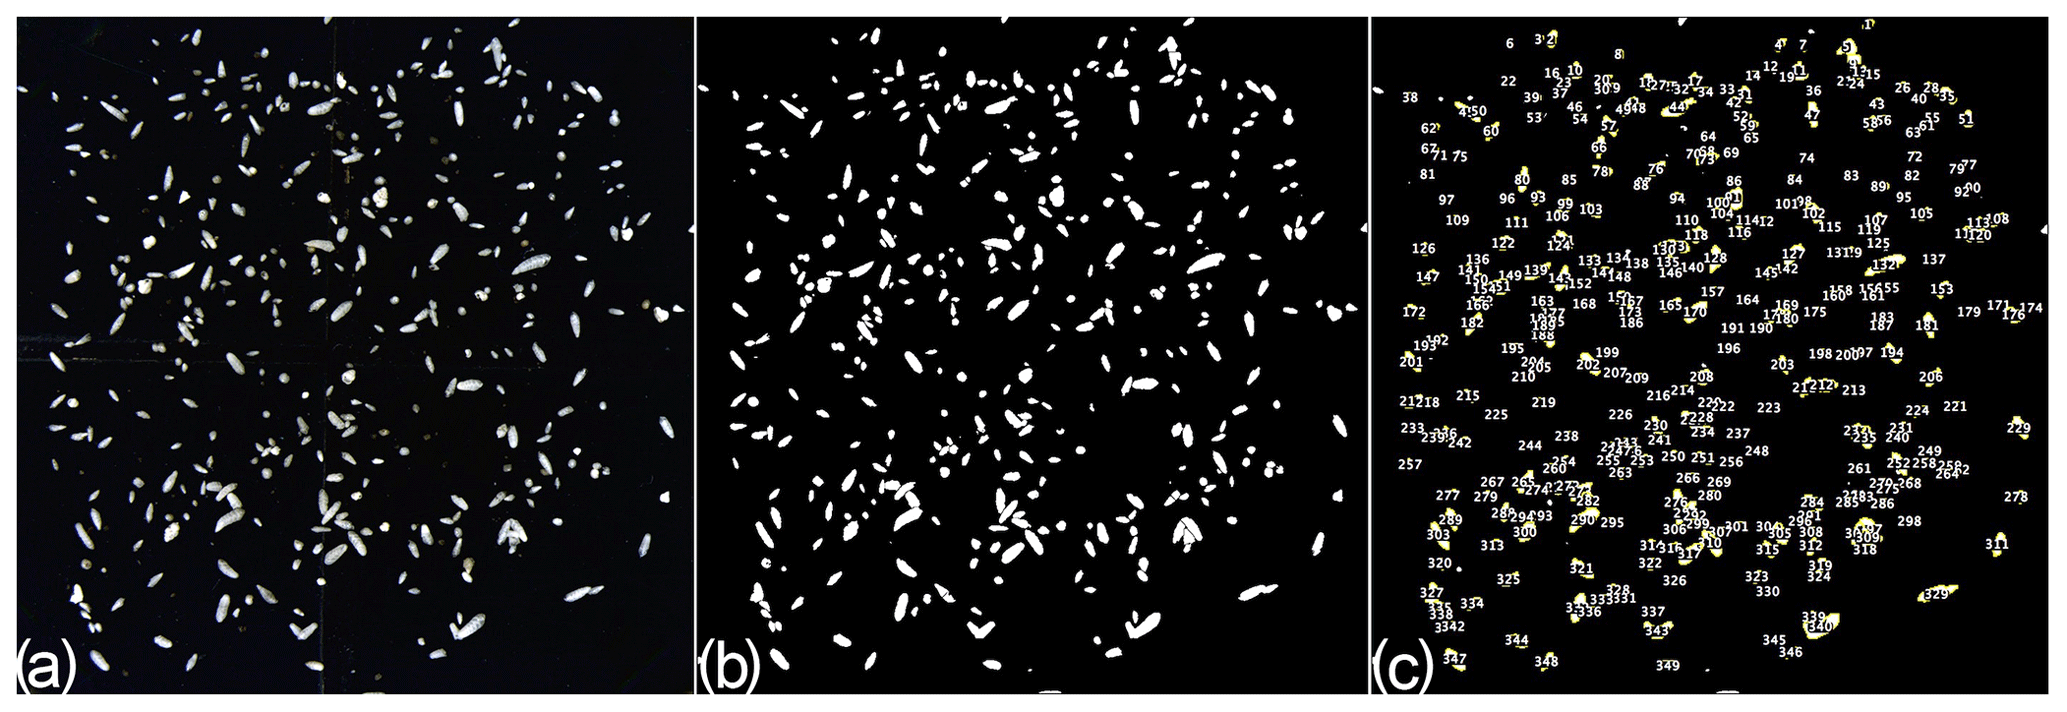
Figure 2Principal steps of the automated image analysis within the MorFo macro. (a) Original stereoscopic microscope image. (b) Binarized image and watershed. (c) Automated counting and measurements. The illustrated sample originates from Core MD02-2508, sample 240–241 cm.
The shape descriptor retained in this study is the roundness index, defined as
This roundness index should then be corrected for size due to the presence of round species occurring in dysoxic conditions (e.g. Takayanagia delicata in the WNP and ENP samples). As these species are relatively small by comparison with large and round epibenthic species characteristic of well-oxygenated environments (such as Cibicides-like species or Hoeglundina elegans), more or less oxygenated periods can be distinguished by taking the size of species into account. The retained size descriptor, here “Major”, corresponds to the primary axis of the best-fitting ellipse that has the same area as the investigated specimen. This is used to avoid error in measurement in case some pixels that do not correspond to the specimen (error in the watershed, image artefact) bias size measurement.
Other size descriptors (e.g. Feret's diameter or Area) and shape descriptors (e.g. Circularity or Length-to-width ratio) can also be used (see ImageJ User Guide – IJ 1.46r by Tiago Ferreira and Wayne Rasband, https://imagej.nih.gov/ij/docs/guide/user-guide.pdf, last access: 4 May 2021). In order to simultaneously take both the size and the shape descriptors into account in the Pacific OMZs, the morphometric index MARIN (Major Axis and Roundness INdex) is then calculated:
This morphometric approach is particularly worthy of consideration for non-specialists as only basic taxonomic knowledge is required. Benthic foraminifera only need to be picked and imaged under a stereoscopic microscope (a single picture per sample). Images are then automatically processed, and no identification is necessary. Approximately 10 min is needed for the processing (picking and imaging) of each sample, while at least 1 h is usually required for picking and identifying every specimen of each sample with a standard approach.
3.1 Re-calibration of the [O2] estimation by the assemblage method
A method to quantify past oxygenation within the ENP OMZ, based on the relative abundance and succession of three benthic foraminifera assemblages and the oxygenation adaptation of their affiliated species (indicatives of dysoxic, suboxic, and oxic conditions), was developed by Tetard et al. (2017a). This method was originally calibrated using the theoretical [O2] threshold between a 100 % dysoxic assemblage (0.1 mL L−1), 50 % dysoxic and 50 % suboxic assemblage (0.5 mL L−1), and 50 % suboxic and 50 % oxic assemblage (1.4 mL L−1). However, estimated [O2] values tested on seven Pacific core tops using the assemblage method from Tetard et al. (2017a) show that this original approach seems to be slightly over-estimating oxygenation by comparison with the average oxygen concentration near each site (Garcia et al., 2014).
Table 2Benthic foraminiferal assemblage composition, morphometry porosity, and respective [O2] estimation for each investigated core top sample. BFA denotes the benthic foraminiferal assemblage index, and PSA denotes pore surface area.

As a consequence, we decided to use all the available census data from the 45 core tops (5 from the WNP, 10 from the ENP, 17 from the EEP, 7 from the ESP, 5 from the SWACM, and 1 from the AS; see Table 2) of which the modern [O2] values are known (from Garcia et al., 2010, 2014, and CTDO measurements) to propose a global calibration for the assemblage [O2] estimation method based on actual [O2] and not on theoretical thresholds. The oxygen measurements available for calibration range from 0.03 to 2.88 mL L−1 (see Table 1) and are compared with a term defined by Eq. (3) and referred to as the benthic foraminiferal assemblage (BFA) index. This equation consists in assigning a number to each sample based on its dysoxic, suboxic, and oxic benthic foraminiferal composition (from 100 if the sample is 100 % composed of dysoxic specimens, to 0 if the sample is 100 % composed of suboxic specimens, to −100 if the sample is composed of 100 % of oxic specimens; see Fig. 3a).
The original extrapolation method was refined and now consists in Eq. (4) where the relative abundance of the dysoxic and oxic assemblages (through the use of the benthic foraminiferal assemblage index) can directly be used to determine past oxygenation:
This equation is based on the consistent relationship (R2=0.94; see Fig. 3a) between the benthic foraminiferal assemblage index and extrapolated and measured [O2] values (from Garcia et al., 2010, 2014, and CTDO measurements). Overall, poorly oxygenated samples are associated with high benthic foraminiferal assemblage index values (thus composed of dysoxic species) while well-oxygenated core tops are associated with negative benthic foraminiferal assemblage index values (thus showing oxic species). To make these oxygen reconstructions more user-friendly, an Excel spreadsheet is provided in the Supplement (Table S1) to automatically compute past oxygenation by filling at least two of the three columns corresponding to the relative abundance of the dysoxic, suboxic, and oxic assemblages. The list of dysoxic and suboxic benthic foraminiferal species used in this study as well as their respective references for assignation to the dysoxic or suboxic assemblage is provided in the Supplement (Table S2).
This approach produces accurate core top sample [O2] estimates that are very close to the modern mean annual [O2] values (Fig. 3d, regression line very close to the 1 : 1 line; R2=0.94) for the WNP, ENP, EEP, ESP, SWACM, and AS OMZs altogether. It is thus likely to be used as a global index in oxygen-deficient areas from different OMZs.

Figure 3(a–c) Relationship between the bottom water oxygenation and the benthic foraminiferal index, the new morphometric index (MARIN), and the porosity of B. seminuda. (d–f) Relationship between the bottom water oxygenation and the calibrated assemblage method estimation, taxon-independent morphometric method estimation, and porosity method estimation.
3.2 Calibration of the porosity indices
In order to calibrate the procedure described in Tetard et al. (2017b), a microscope slide containing B. seminuda fragments was prepared for the three Pacific core tops where this species was present in the first centimetre (MD02-2508, MD02-2519, MD02-2525C2). Considering the limited number of samples, the PSA (pore surface area) for these core tops shows a good correlation (R2=0.75; Fig. 3c) to the [O2] values near these stations (Garcia et al., 2014). Higher values of BWO are associated with a lower PSA of B. seminuda, while a higher porosity index is observed together with lower BWO values. The following Eq. (5) is then used to extrapolate [O2] for Core MD02-2508 based on its PSA values downcore (Fig. 3f):
3.3 Calibration of the morphometric indices
In order to associate morphometric measurements with BWO concentrations, three core tops available at the Shirshov Institute of Oceanology for the WNP OMZ and eight core tops available at CEREGE from the ENP and AS OMZs, for which the modern annual mean [O2] is known (Garcia et al., 2014), as well as six core tops from the ESP transects (when enough material was available and not coloured by rose bengal) of which the modern [O2] are known (CTDO measurements) were used for calibration purposes. These samples show lower MARIN values during dysoxic conditions and higher values during oxic conditions. The significant correlation (R2=0.88) between the estimated [O2] (Garcia et al., 2014) and the corresponding MARIN values (Fig. 3b) can then be used to extrapolate past BWO concentrations based on the MARIN values for each sample (Fig. 3e), according to Eq. (6):
3.4 Estimating the measurement uncertainties in the calibrated methods
In order to estimate the uncertainty linked with each of the calibrated approaches in this study, the standard deviation for every core top associated with each method was calculated. As the relationships between oxygenation and assemblage (BFA), morphometric (MARIN), or porosity (PSA) indices for the investigated core tops are exponential (Fig. 3a, b, and c), the standard deviations of the differences between the measured and the estimated [O2] values were not characteristic of their respective method's uncertainty. For example, regarding the assemblage method, the standard deviation of the differences between the measured and the estimated [O2] values for the 45 investigated core tops was 0.19 mL L−1. This error value is not representative of the method's uncertainty as low [O2] values exhibit relatively small error (e.g. 0.04 mL L−1 for [O2] values of about 0.20 mL L−1) while higher [O2] values (of about 2 mL L−1) are likely to show larger error (about 0.40 mL L−1).
To address this issue and assess an error that is more independent of each estimated [O2] value individually, we decide to focus instead on the standard deviation of the percentage corresponding to the differences between the measured and the estimated [O2] values comprised within each estimated [O2] value. For the assemblage and morphometry methods, the standard deviation based on the core tops used for their respective calibration (45 and 16 core tops, respectively) is about 23 % and 24 %, respectively. As the porosity calibration is only based on 3 core tops, no standard deviation was calculated as it would not be representative.
4.1 Understanding and advantages of the oxygen estimation methods
Some technical issues, specific to the morphometric analysis, are likely to induce biases during the data acquisition and processing that might result in inconsistencies in the [O2] reconstruction. Broken shells or shells that do not lie flat might appear distorted on images, leading to inaccurate size and shape measurements. The watershed step used to dissociate specimens in contact with each other during the image analysis in ImageJ might occasionally be incorrect, resulting in inaccurately cut specimens and measurements. Considering these potential biases that might affect morphometric measurements, we remain highly confident in this approach given that this only happens to very few specimens (4 to 5 on average) over usually more than 300 investigated per sample.
Concerning the faunistic aspect behind the methods discussed herein, the assemblage and morphometric methods are based on the whole preserved benthic foraminiferal fauna and its variability and species succession through time according to their ecological adaptation for dissolved oxygen. As both these approaches rely on numerous species and specimens, succeeding each other (Fig. 4) according to their [O2] preferences, they are likely to record and operate on a relatively large oxygen gradient, from its nearly complete depletion (as some species can survive temporarily in anoxic conditions) until it cannot be considered a limiting factor anymore (well-oxygenated conditions, usually more than about 2 to 3 mL L−1). However, the indices defined in the present study cannot exceed a certain threshold (e.g. the oxic assemblage cannot exceed 100 %).

Figure 4Conceptual graphic of the MARIN response of the top centimetres of benthic foraminiferal assemblage to [O2] variations (background image is courtesy of Erik Cordes, Temple University, BOEM Deep Search, USGS, NOAA HOV Alvin 2018, © Woods Hole Oceanographic Institution). The plot shows estimated [O2] using the assemblage method vs. estimated [O2] using the morphometric method (and corresponding MARIN values) for Core MD02-2508. Black boxes show species example of the top-centimetre sample gradually replaced with an increase in BWO.
Regarding the assemblage method, 10 core tops out of the 45 in total were originally investigated for their fine fraction (> 61 or > 63 µm; see list of cores and affiliated authors in Table 1). The results are very well integrated into the strong relationship between measured oxygen concentration and the BFA index. This indicates that both fractions could successfully be used to estimate palaeo-oxygenation in OMZs.
Regarding the morphometry-based approach, a link is visible between BWO and the benthic foraminiferal shape (average roundness) for each sample, from elongated species in dysoxic conditions (e.g. Bolivina, Buliminella species) to rounded species in oxic conditions (e.g. Planulina or Cibicides species). This relationship is however likely to reverse after a certain BWO threshold, where elongated oxic species will start to appear (e.g. Lagena, Dentalina species). As the later species are usually longer than the elongated dysoxic species, a size factor can thus be used to distinguish between an overall dysoxic and elongated assemblage (usually small in size) and an overall oxic and also elongated assemblage (usually big in size). This correction enables the MARIN to be gradually increased from low-oxygen (less than 0.1 mL L−1) to high-oxygen (about 2 mL L−1) conditions (Figs. 3 and 4). It has to be noted that some rounded taxa are also adapted to extremely low oxygen values, such as Rotaliatinopsis semiinvoluta in the Arabian Sea (e.g. Jannink et al., 1998; this study), Epistominella smithi in the SWACM (Schmiedl et al., 1997) and ENP and WNP (Tetard et al., 2017a; this study), or Takayanagia delicata in the ENP and WNP (Tetard et al., 2017a; this study). These species will tend to indicate a more rounded assemblage and thus higher oxygen levels. However, these typical rounded species from deoxygenated regions are also relatively small by comparison with rounded species from oxic conditions such as Planulina or Cibicides species and usually co-occur with more elongated species such as Bolivina and Buliminella species, which will overall be reflected by a relatively low MARIN and thus low oxygen concentrations. We also emphasize that the presence and abundance of some shallow infaunal taxa with elongated tests (e.g. some Uvigerina or Bolivina species in the Mediterranean Sea and Atlantic Ocean) might increase under high-oxygen conditions during times of enhanced organic matter fluxes (higher nutrient availability). This explains why this method should be used to investigate oxygen variability in known or supposed OMZ areas and not to assume occasional deoxygenation events.
Concerning the porosity approach, previous studies have already shown that some species react to bottom water oxygenation decrease (increase) by increasing (decreasing) the pore density (Kuhnt et al., 2013) and pore surface area of their shells (Fig. 5). A closer look at the correlation between [O2] and pore density of Bolivina pacifica from Kuhnt et al. (2013), for example, indicates that within the estimated [O2] range of Core MD02-2508 (from about 0.5 to about 1 mL L−1), pore density shows a limited variability. Thus, a complex response should occur over a relatively restricted oxygen gradient, where porosity probably responds to several factors at once and therefore represents a mixed environmental signal (Glock et al., 2011). However, when the gradient is larger, significant porosity changes might occur (Kuhnt et al., 2013) while faunal turnovers are expected to happen and the species of interest may not be found anymore. This method should thus be used for past oxygen estimation comprised within the oxygen range of predilection of the species of interest. The three methods discussed herein are then likely to be reliable in poorly oxygenated environments but cannot ensure a consistent estimation in oxygenated environments (more than about 2 to 3 mL L−1) or when dissolved oxygen is not the principal ecological parameter responsible for observed faunal changes.
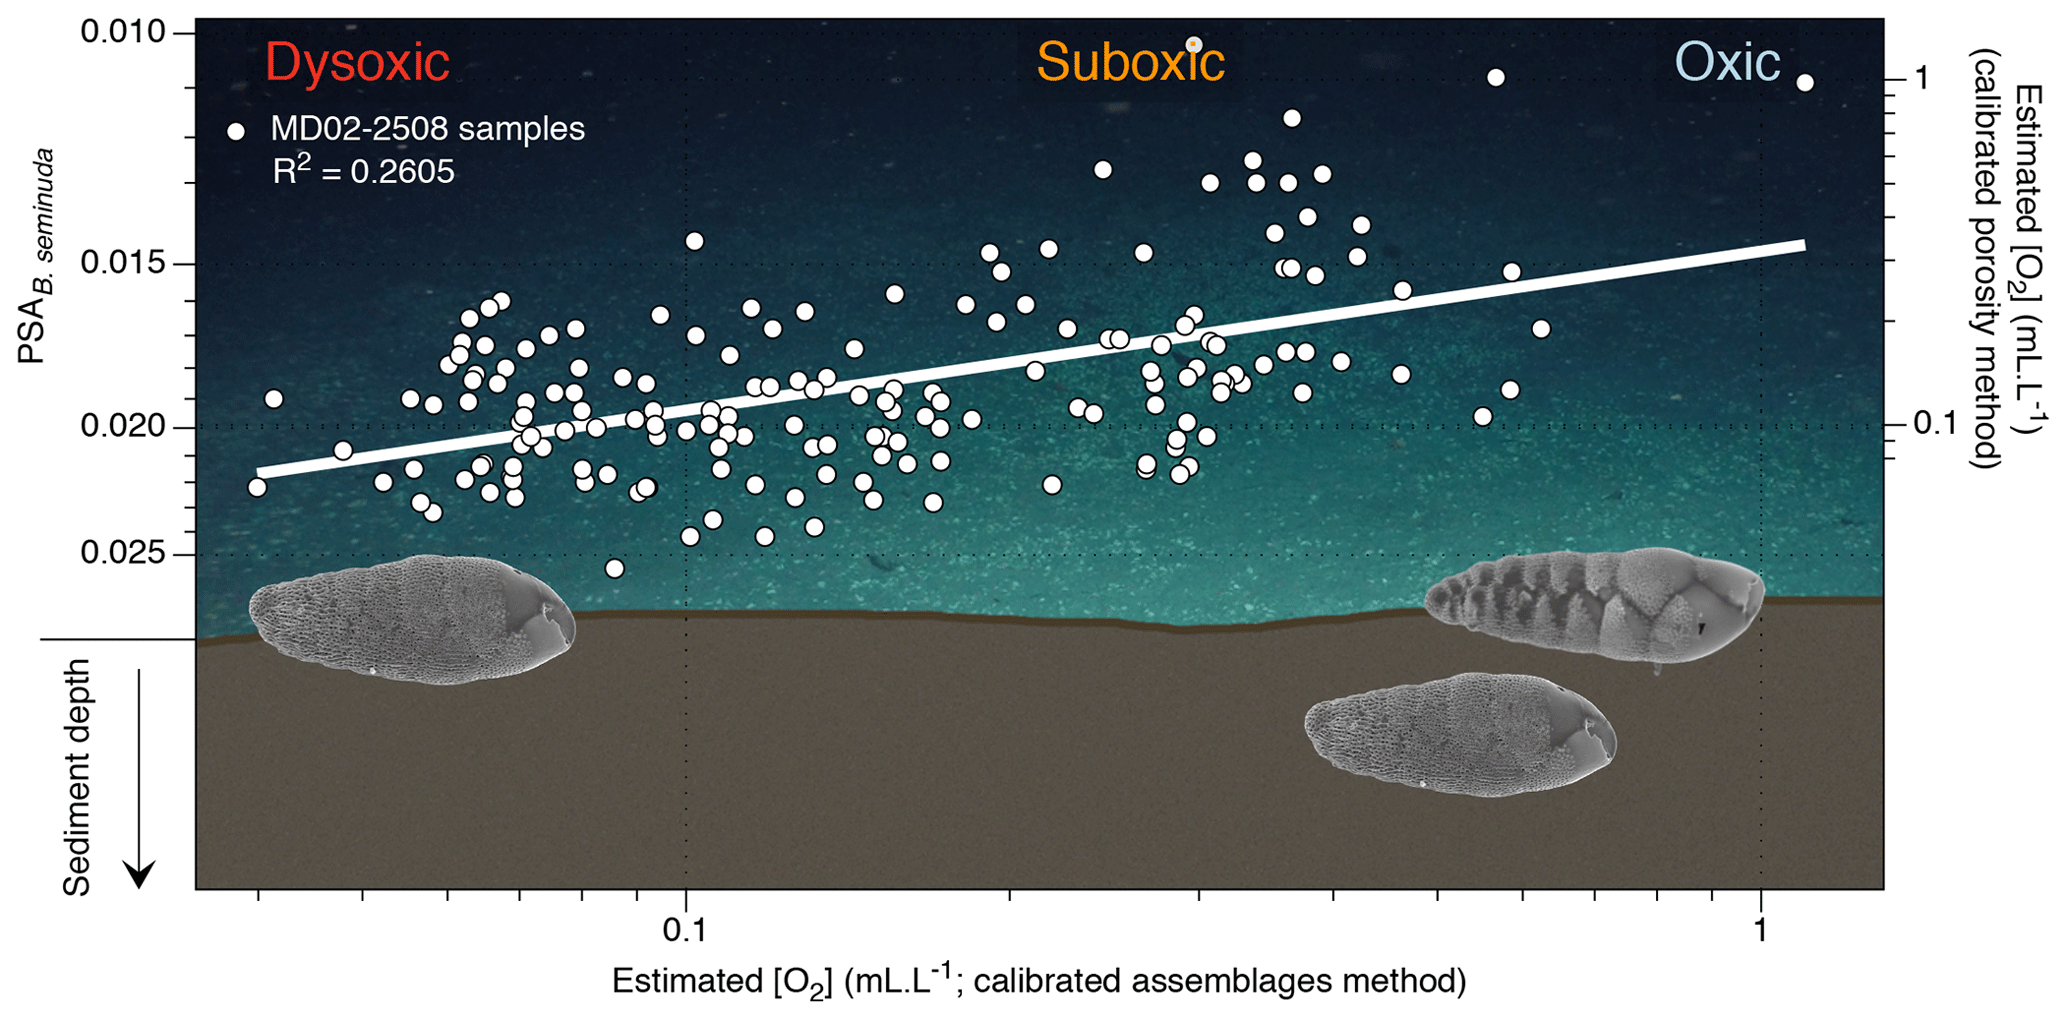
Figure 5Conceptual graphic of the porosity response of benthic foraminifera (B. seminuda for the ENP OMZ) to [O2] variations (background image is courtesy of Erik Cordes, Temple University, BOEM Deep Search, USGS, NOAA HOV Alvin 2018, © Woods Hole Oceanographic Institution). The plot shows estimated [O2] using the assemblage method vs. estimated [O2] using the porosity method (and corresponding PSA values) for Core MD02-2508. Images of B. seminuda show the gradual change in porosity associated with oxygen changes.
Regarding the recorded oxygen signal investigated with these three methods, one may question its water–sediment interface vs. pore water origin. When oxic conditions prevail, the presence of potentially epibenthic species (recorded by the relative abundance of the oxic assemblage and rounded shells through the assemblage and morphometry methods, respectively) at the sediment surface is considered to be representative of bottom water oxygenation. In times of oxygen depletion, these species are replaced by endobenthic (usually elongated) species migrating up to the water–sediment interface, which also become representative of bottom water conditions (Fig. 4). Conversely, in well-oxygenated conditions the endobenthic species are likely to move deeper into the sediment while the epibenthic species colonize the water–sediment interface again. In this way, the interface is always occupied by an assemblage or a morphometry characteristic of a specific oxygen level. The assemblage and morphometric methods are thus likely to be characteristic of bottom water and interface conditions (Fig. 4, black boxes). The endobenthic specimens (B. seminuda species) used for the porosity-based method, however, might migrate into their micro-habitat according to the redox front and thus record either bottom water or pore water conditions depending on the level of oxygen and the depth of penetration of the front into sediment (Fig. 5). In addition, pore water oxygenation largely depends on surrounding bottom water oxygenation. The porosity method is thus likely to represent a mixed signal between bottom water and pore water conditions.
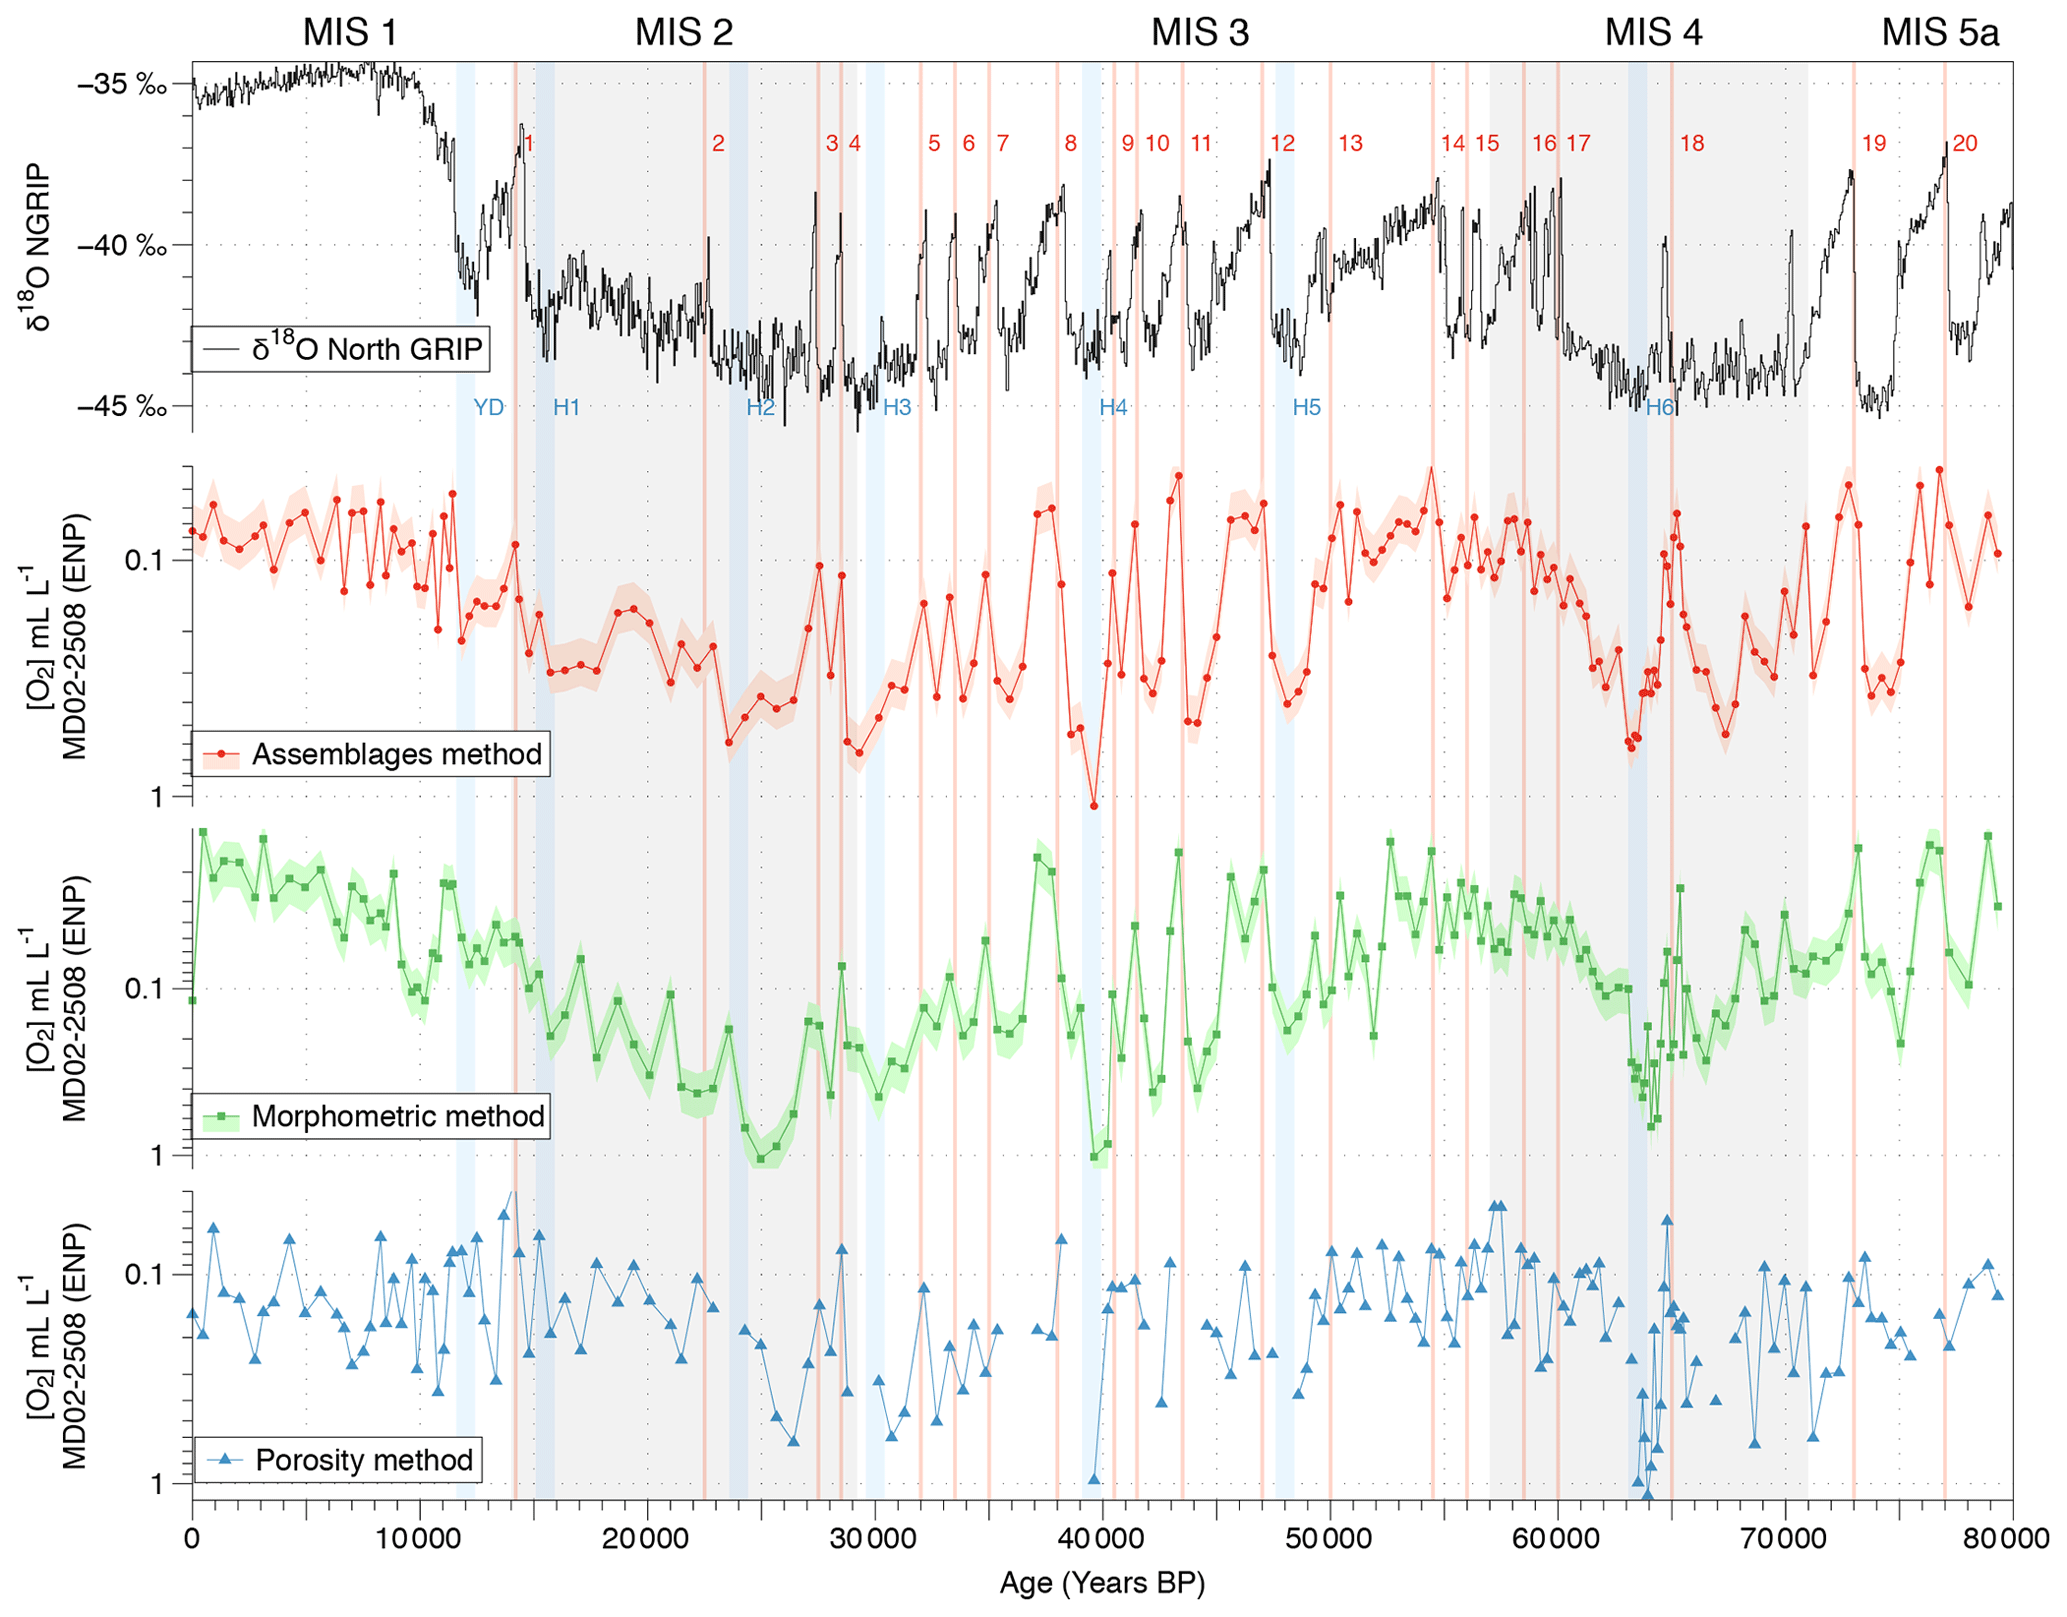
Figure 6Comparison between the isotopic composition (δ18O record) of the NGRIP ice core from Johnsen et al. (2001) and bottom water [O2] variations estimated using the calibrated assemblage (red circles), the morphometry (green squares), and the porosity (blue triangles) methods. The pink and light green shades represent the 23 % and 24 % uncertainty in the assemblage and morphometry approaches, respectively.
4.2 Comparison of oxygenation tracers
The reliability and consistency of the assemblage, morphometric, and porosity-based methods used for past oxygenation reconstructions in this study and based on benthic foraminifera were investigated on Core MD02-2508 (ENP OMZ) as this core was investigated using the three approaches at a high resolution (189 samples covering the last 80 kyr). The three methods provide similar [O2] estimations for the investigated modern core tops (Fig. 3d, e, and f). First, the modern [O2] estimations based on the assemblage, morphometric, and porosity approaches (about 0.08, 0.12, and 0.16 mL L−1, respectively, and 0.12 mL L−1 on average for the ENP OMZ) are very consistent with the modern mean annual dissolved [O2] value of 0.13 mL L−1 (Garcia et al., 2014) measured at 600 m b.s.l. near the core site.
Throughout Core MD02-2508, these three independent approaches also exhibit similar average values (0.20, 0.14, and 0.22 mL L−1, respectively, for the assemblage, morphometric, and porosity methods). These approaches also cover similar [O2] gradients of 1.06 mL L−1 (from 0.04 to 1.10 mL L−1), 1.04 mL L−1 (from 0.01 to 1.05 mL L−1), and 1.10 mL L−1 (from 0.04 to 1.14 mL L−1), respectively. The three past [O2] estimation methods thus exhibit very similar results and variations for Core MD02-2508 (Fig. 6) which are very consistent with the Northern Hemisphere climate variability record by the isotopic composition (δ18O) of the NGRIP ice core (Johnsen et al., 2001). As this relationship was already investigated in Tetard et al. (2017a), there will be no further discussion in this study.
As the assemblage method was calibrated based on numerous core top samples, we choose to use it as a reference for comparison with the other methods. Overall, the assemblage and morphometric approaches show similar and consistent estimated [O2] values downcore (R2=0.62; Fig. 4) which was expected as both methods rely on the complete assemblages (census data or morphometric measurements) of each sample. The assemblage and porosity approaches exhibit a less clear but still existing relationship (R2=0.26; Fig. 5), which can be explained by the fact that the assemblage method is based on the whole assemblage and is likely to reflect bottom water conditions, while the porosity approach is based on porosity measurements of a single species and probably reflects mixed conditions between bottom and pore waters.
We conclude that the present study demonstrates the reliability of a new, fast, and semi-automated morphometric analysis in OMZs, performed on benthic foraminifera for estimating past [O2], with an overall higher morphometric MARIN (higher circularity and larger specimens) in samples characteristic of oxic conditions, while poorly oxygenated samples are associated with a lower MARIN (lower circularity and smaller size). Since only basic taxonomical knowledge is required for this new method, its main advantages are its user-friendliness to non-specialists besides its ease and speed of image acquisition and automated processing.
A calibration based on numerous modern core tops (compilation of 45 cores from oxygen-deficient areas recovered from all the main OMZs in the world (AS, ENP, ESP, EEP, WNP, SWACM) and along several oxygen gradients for this new approach, as well as for the assemblage-based method from Tetard et al. (2017a) and the porosity-based method from Tetard et al. (2017b), shows similar and consistent estimations, again proving the reliability of these approaches as global past [O2] tracers. However, as these methods are prone to potential specific biases, we highly encourage their combination, whenever possible, for higher reliability.
The code use for the morphometric analysis of images is available at https://doi.org/10.5281/zenodo.4740079 (Tetard, 2021) and also in the Supplement of the present publication as a file named “MorFo_.ijm”.
All the data used for calibration of the methods presented in this study are available in Tables 1 and 2.
The supplement related to this article is available online at: https://doi.org/10.5194/bg-18-2827-2021-supplement.
MT designed the experiment; performed its technical aspects, including the image acquisition and processing and picking of the ENP core tops processed at CEREGE; and wrote the first draft of the paper. LB, LL, and KT were involved with the conception of the project. LL was in charge of the Arabian Sea sample, and EO was in charge of the WNP samples. All authors contributed to writing the paper.
The authors declare that they have no conflict of interest.
We thank the Agence Nationale de la Recherche for its financial support to Luc Beaufort and Martin Tetard under projects ANR-12-BS06-0007-CALHIS and JPI Belmont ANR-15-JCLI-0003-05-PACMEDY. We thank IODP France for its financial support to Martin Tetard. This work is a contribution to the EU FP7 project MedSeA (grant agreement no. 265103). Samples from the WNP were studied in the framework of the Shirshov Institute state assignment (theme no. 0128-2021-0006, Ekaterina Ovsepyan). Many thanks to the professional captains and crews of the research vessels Marion Dufresne, Sonne, Meteor, and Olaya. We would also like to thank Franck Bassinot, Frans Jorissen, and Helena Filipsson for their valuable contributions to this paper. Ekaterina Ovsepyan is thankful to Elena Ivanova for collecting core top samples from the WNP.
This research has been supported by the Agence Nationale de la Recherche (grant nos. ANR-12-BS06-0007-CALHIS and ANR-15-JCLI-0003-05-PACMEDY) and the European Commission, Seventh Framework Programme (MedSeA (grant no. 265103)).
This paper was edited by Hiroshi Kitazato and reviewed by two anonymous referees.
Bairbakhish, A. N., Bollmann, J., Sprengel, C., and Thierstein, H. R.: Disintegration of aggregates and coccospheres in sediment trap samples, Mar. Micropaleontol., 37, 219–223, 1999. a
Bandy, O. L. and Arnal, R. E.: Distribution of Recent foraminifera off west coast of Central America, Am. Assoc. Petr. Geol. B., 41, 2037–2053, 1957. a, b, c, d, e, f, g, h
Bernhard, J. M. and Reimers, C. E.: Benthic foraminifera population fluctuations related to anoxia: Santa Barbara Basin, Biogeochemistry, 15, 127–149, 1991. a
Betancur, M. A. and Martinez, J. I.: Foraminíferos bentónicos recientes en sedimentos de fondo de la cuenca de Panamá (Pacífico Colombiano), como indicadores de productividad y oxigenación, Bol. Invest. Mar. Costeras, 32, 3–18, 2003. a, b, c, d, e, f, g, h, i, j, k, l, m, n, o, p, q
Blanchet, C. L., Thouveny, N., Vidal, L., Leduc, Tachikawa, K., Bard, E., and Beaufort, L.: Terrigenous input response to glacial/interglacial climatic variations over southern Baja California: a rock magnetic approach, Quaternary Sci. Rev., 26, 3118–3133, 2007. a
Bopp, L., Resplandy, L., Untersee, A., Le Mezo, P., and Kageyama, M.: Ocean (de)oxygenation from the Last Glacial Maximum to the twenty-first century: insights from Earth System models, Philos. T. Roy. Soc. A, 375, 20160323, https://doi.org/10.1098/rsta.2016.0323, 2017. a
Breitburg, D., Levin, L. A., Oschlies, A., Grégoire, M., Chavez, F. P., Conley, D. J., Garçon, V., Gilbert, D., Gutiérrez, D., Isensee, K., Jacinto, G. S., Limburg, K. E., Montes, I., Naqvi, S. W. A., Pitcher, G. C., Rabalais, N. N., Roman, M. R., Rose, K. A., Seibel, B. A., Telszewski, M., Yasuhara, M., and Zhang, J.: Declining oxygen in the global ocean and coastal waters, Science, 359, eaam7240, https://doi.org/10.1126/science.aam7240, 2018. a, b
Bubenshchikova, N. V., Nurnberg, D., and Tiedemann, R.: Variations of Okhotsk Sea oxygen minimum zone: Comparison of foraminiferal and sedimentological records for latest MIS 12–11c and latest MIS 2–1, Mar. Micropaleontol., 121, 52–69, 2015. a, b, c
Buzas, M. A.: Another look at confidence limits for species proportions, J. Paleontol., 64, 842–843, 1990. a
Cannariato, K. G. and Kennett J. P.: Climatically related millennial-scale fluctuations in strength of California margin oxygen-minimum zone during the past 60 k.y, Geology, 27, 975–978, 1999. a, b, c
Cannariato, K. G., Kennett, J. P., and Behl, R. J.: Biotic response to late Quaternary rapid climate switches in Santa Barbara Basin: Ecological and evolutionary implications, Geology, 27, 63–66, 1999. a, b
Corliss, B. H.: Morphology and microhabitat preferences of benthic Foraminifera from the northwest Atlantic Ocean, Mar. Micropaleontol., 17, 195–236, 1991. a, b
den Dulk, M., Reichart, G. J., Memon, G. M., Roelofs, E. M. P., Zachariasse, W. J., and Van der Zwaan, G. J.: Benthic foraminiferal response to variations in surface water productivity and oxygenation in the northern Arabian Sea, Mar. Micropaleontol., 35, 43–66, 1998. a
den Dulk, M., Reichart, G. J., van Heyst, S., Zachariasse, W. J., and Van der Zwaan, G. J.: Benthic foraminifera as proxies of organic matter flux and bottom water oxygenation? A case history from the northern Arabian Sea. Palaeogeogr. Palaeocl., 161, 337–359, 2000. a
Fatela, F. and Taborda, R.: Confidence limits of species proportions in microfossil assemblages, Mar. Micropalaeontol., 45, 169–174, 2002. a
Garcia, H. E., Locarnini, R. A., Boyer, T. P., Antonov, J. I., Baranova, O. K., Zweng, M. M., and Johnson, D. R.: World Ocean Atlas 2009, in: Dissolved Oxygen, Apparent Oxygen Utilization, and Oxygen Saturation, NOAA Atlas NESDIS 70, Vol. 3, S. Levitus, Ed., NOAA Atlas NESDIS 70, U.S. Government Printing Office, Washington, D.C., 344 pp., 2010. a, b, c
Garcia, H. E., Locarnini, R. A., Boyer, T. P., Antonov, J. I., Baranova, O. K., Zweng, M. M., Reagan, J. R., and Johnson, D. R.: World Ocean Atlas 2013, in: Dissolved Oxygen, Apparent Oxygen Utilization, and Oxygen Saturation, NOAA Atlas NESDIS 75, Vol. 3, S. Levitus, Ed.; A. Mishonov, Technical Ed. NOAA Atlas NESDIS 75, 27 pp., 2014. a, b, c, d, e, f, g, h, i, j
Gilbert, D.: Oceans lose oxygen, Nature, 542, 303–304, 2017. a
Gilly, W. F., Beman, J. M., Litvin, S. Y., and Robison, B. H.: Oceanographic and Biological Effects of Shoaling of the Oxygen Minimum Zone, Annu. Rev. Mar. Sci., 5, 393–420, 2013. a, b, c, d
Glock, N., Eisenhauer, A., Milker, Y., Liebetrau, V., Schonfeld, J., Mallon, J., Sommer, S., and Hensen, C.: Environmental influences on the pore density of Bolivina spissa (Cushman), J. Foramin. Res., 41, 22–32, 2011. a
Glock, N., Schönfeld, J., Eisenhauer, A., Hensen, C., Mallon, J., and Sommer, S.: The role of benthic foraminifera in the benthic nitrogen cycle of the Peruvian oxygen minimum zone, Biogeosciences, 10, 4767–4783, https://doi.org/10.5194/bg-10-4767-2013, 2013. a
Gooday, A. J., Bernhard, J. M., Levin, L. A., and Suhr, S. B.: Foraminifera in the Arabian Sea oxygen minimum zone and other oxygen-deficient settings: taxonomic composition, diversity, and relation to metazoan faunas, Deep-Sea Res. Pt. II, 47, 25–54, 2000. a
Jannink, N. T., Zachariasse, W. J., and Van der Zwaan, G. J.: Living (Rose Bengal stained) benthic foraminifera from the Pakistan continental margin (northern Arabian Sea), Deep-Sea Res. Pt. I, 45, 1483–1513, 1998. a
Johnsen, S. J., Dahl-Jensen, D., Gundestrup, N., Steffensen, J. P., Clausen, H. B., Miller, H., Masson-Delmotte, V., Sveinbjornsdottir, A. V., and White, J.: Oxygen isotope and palaeotemperature records from six Greenland ice-core stations: Camp Century, Dye-3, GRIP, GISP2, Renland and NorthGRIP, J. Quaternary Sci., 16, 299–307, 2001. a, b
Jorissen, F. J., De Stigter, H. C., and Widmark, J. G. V.: A conceptual model explaining benthic foraminiferal microhabitats, Mar. Micropaleontol., 22, 3–15, 1995. a, b, c
Jorissen, F. J., Fontanier, C., and Thomas, E.: Paleoceanographical proxies based on deep-sea benthic foraminiferal assemblage characteristics, in: Proxies in Late Cenozoic Paleoceanography: Pt. 2: Biological tracers and biomarkers, edited by: Hillaire-Marcel, C. and de Vernal, A., 1, Elsevier, Amsterdam, the Netherlands, 264–325, 2007. a, b, c
Kaiho, K.: Benthic foraminiferal dissolved-oxygen index and dissolved-oxygen levels in the modern ocean, Geology, 22, 719–722, 1994. a, b, c
Kaiho, K., Takeda, K., Petrizzo, M. R., and Zachos, J. C.: Anomalous shifts in tropical Pacific planktonic and benthic foraminiferal test size during the Paleocene-Eocene thermal maximum, Palaeo3, 237, 456–464, 2006. a
Kuhnt, T., Friedrich, O., Schmiedl, G., Milker, Y., Mackensen, A., and Luckge, A.: Relationship between pore density in benthic foraminifera and bottom-water oxygen content, Deep-Sea Res. Pt. I, 76, 85–95, 2013. a, b, c
Leiter, C. and Altenbach, A.: Benthic Foraminifera from the Diatomaceous Mud Belt Off Namibia: Characteristic Species for Severe Anoxia, Palaeontol. Electron., 13, 11, 19 pp., 2010. a, b, c, d, e, f, g, h
Levin, L. A.: Manifestation, Drivers, and Emergence of Open Ocean Deoxygenation, Annu. Rev. Mar. Sci., 32, 1–17, 2018. a
Moffitt, S. E., Hill, T. M., Ohkushi, K., Kennett, J. P., and Behl, R. J.: Vertical oxygen minimum zone oscillations since 20 ka in Santa Barbara Basin: A benthic foraminiferal community perspective, Paleoceanography, 29, 44–57, 2014. a
Moffitt, S. E., Moffitt, R. A., Sauthoff, W., Davis, C. V., Hewett, K., and Hill, T. M.: Paleoceanographic insights on recent oxygen minimum zone expansion: Lessons for modern oceanography, PLoS ONE, 10, e0115246, https://doi.org/10.1371/journal.pone.0115246, 2015a. a
Moffitt, S. E., Hill, T. M., Roopnarine, P. D., and Kennett, J. P.: Response of seafloor ecosystems to abrupt global climate change, P. Natl. Acad. Sci. USA, 112, 4684–4689, 2015b. a
Moss, R., Babiker, M., Brinkman, S., Calvo, E., Carter, T., Edmonds, J., Elgizouli, I., Emori, S., Erda, L., Hibbard, K., Jones, R., Kainuma, M., Kelleher, J., Lamarque, J. F., Manning, M., Matthews, B., Meehl, J., Meyer, L., Mitchell, J., Nakicenovic, N., O'Neill, B., Pichs, R., Riahi, K., Rose, S., Runci, P., Stouffer, R., van Vuuren, D., Weyant, J., Wilbanks, T., van Ypersele J. P., and Zurek, M.: Towards new scenarios for analysis of emissions, climate change, impacts and response strategies. IPCC Expert Meeting Report, 19-21 September, 2007, Noordwijkerhout, Netherlands, Intergovernmental Panel on Climate Change (IPCC), Geneva, Switzerland, 132 pp., 2008. a
Nguyen, T. M. P., Petrizzo, M. R., and Speijer, R. P.: Experimental dissolution of a fossil foraminiferal assemblage (Paleocene-Eocene Thermal Maximum, Dababiya, Egypt): implications for paleoenvironmental reconstruction, Mar. Micropaleontol., 73, 241–258, 2009. a
Ohkushi, K., Kennett, J. P., Zeleski, C. M., Moffitt, S. E., Hill, T. M., Robert, C., Beaufort, L., and Behl, R. J.: Quantified intermediate water oxygenation history of the northeast Pacific: A new benthic foraminiferal record from Santa Barbara Basin, Paleoceanography, 29, 1–15, 2013. a, b, c, d, e, f
Ovsepyan, E. A. and Ivanova, E. V.: Benthic Foraminiferal Assemblages as Indicators of the Paleoceanographic Conditions in the Eastern Equatorial Pacific, Oceanology, 49, 121–129, 2009. a, b
Ovsepyan, E., Ivanova, E. V., Tetard, M., Max, L., and Tiedemann, R.: Evidence for different intermediate-and deep-water oxygenation history in the subarctic North Pacific throughout the last deglaciation, Front. Earth Sci., in review, 2021. a
Palmer, H. M., Hill, T. M., Roopnarine, P. D., Myhre, S. E., Reyes, K. R., and Donnenfield, J. T.: Southern California margin benthic foraminiferal assemblages record recent centennial-scale changes in oxygen minimum zone, Biogeosciences, 17, 2923–2937, https://doi.org/10.5194/bg-17-2923-2020, 2020. a, b, c, d
Patarroyo, G. D. and Martinez J. I.: Composition and diversity patterns of deep sea benthic foraminifera from the Panama basin, eastern equatorial Pacific, Deep-Sea Res. Pt. I, 169, 103470, https://doi.org/10.1016/j.dsr.2021.103470, 2021. a, b, c, d, e
Paulmier, A. and Ruiz-Pino, D.: Oxygen minimum zones (OMZs) in the modern ocean, Prog. Oceanogr., 80, 113–128, 2009. a, b
Praetorius, S. K., Mix, A. C., Walczak, M. H., Wilhowe, M. D., Addison, J. A., and Prahl, F. G.: North Pacific deglacial hypoxic events linked to abrupt ocean warming, Nature, 527, 362–366, 2015. a
Schlitzer, R.: Ocean data view, available at: https://odv.awi.de (last access: 4 May 2021), 2020. a
Schmiedl, G., Mackensen, A., and Müller, J.: Recent benthic foraminifera from the eastern South Atlantic Ocean: dependence on food supply and water masses, Mar. Micropaleontol., 32, 249–287, 1997. a
Schneider, C. A., Rasband, W. S., and Eliceiri, K. W.: NIH Image to ImageJ: 25 years of image analysis, Nat. Meth., 9, 671–675, 2012. a
Stramma, L., Johnson, G. C., Sprintall, J., and Mohrholz, V.: Expanding oxygen-minimum zones in the tropical oceans, Science, 320, 655–658, 2008. a
Stramma, L., Schmidtko, S., Levin, L. A., and Johnson, G. C.: Ocean oxygen minima expansions and their biological impacts, Deep-Sea Res. Pt. I, 57, 587–595, 2010. a
Tetard, M.: MorFo_.ijm plugin for ImageJ (Version 1), Zenodo, https://doi.org/10.5281/zenodo.4740079, 2021. a
Tetard, M., Licari, L., and Beaufort, L.: Oxygen history off Baja California over the last 80 kyr: a new foraminiferal-based record, Paleoceanography, 32, 249–264, 2017a. a, b, c, d, e, f, g, h, i, j, k
Tetard, M., Beaufort, L., and Licari, L.: A new optical method for automated pore analysis on benthic foraminifera, Mar. Micropaleontol., 136, 30–36, 2017b. a, b, c, d, e
Wyrtki, K.: The oxygen minima in relation to ocean circulation, Deep-Sea Res. Oceanic Abstr., 9, 11–23, 1962. a