the Creative Commons Attribution 4.0 License.
the Creative Commons Attribution 4.0 License.
 | 10 May 2021
Sun-induced fluorescence and near-infrared reflectance of vegetation track the seasonal dynamics of gross primary production over Africa
Anteneh Getachew Mengistu
Gizaw Mengistu Tsidu
Gerbrand Koren
Maurits L. Kooreman
K. Folkert Boersma
Torbern Tagesson
Jonas Ardö
Yann Nouvellon
Wouter Peters
The carbon cycle of tropical terrestrial vegetation plays a vital role in the storage and exchange of atmospheric CO2. But large uncertainties surround the impacts of land-use change emissions, climate warming, the frequency of droughts, and CO2 fertilization. This culminates in poorly quantified carbon stocks and carbon fluxes even for the major ecosystems of Africa (savannas and tropical evergreen forests). Contributors to this uncertainty are the sparsity of (micro-)meteorological observations across Africa's vast land area, a lack of sufficient ground-based observation networks and validation data for CO2, and incomplete representation of important processes in numerical models. In this study, we therefore turn to two remotely sensed vegetation products that have been shown to correlate highly with gross primary production (GPP): sun-induced fluorescence (SIF) and near-infrared reflectance of vegetation (NIRv). The former is available from an updated product that we recently published (Sun-Induced Fluorescence of Terrestrial Ecosystems Retrieval – SIFTER v2), which specifically improves retrievals in tropical environments. A comparison against flux tower observations of daytime-partitioned net ecosystem exchange from six major biomes in Africa shows that SIF and NIRv reproduce the seasonal patterns of GPP well, resulting in correlation coefficients of >0.9 (N=12 months, four sites) over savannas in the Northern and Southern hemispheres. These coefficients are slightly higher than for the widely used Max Planck Institute for Biogeochemistry (MPI-BGC) GPP products and enhanced vegetation index (EVI). Similarly to SIF signals in the neighboring Amazon, peak productivity occurs in the wet season coinciding with peak soil moisture and is followed by an initial decline during the early dry season, which reverses when light availability peaks. This suggests similar leaf dynamics are at play. Spatially, SIF and NIRv show a strong linear relation (R>0.9; N≥250 pixels) with multi-year MPI-BGC GPP even within single biomes. Both MPI-BGC GPP and the EVI show saturation relative to peak NIRv and SIF signals during high-productivity months, which suggests that GPP in the most productive regions of Africa might be larger than suggested.
- Article
(2976 KB) - Full-text XML
-
Supplement
(455 KB) - BibTeX
- EndNote


Gross primary production (GPP) is the carbon dioxide (CO2) flux between the terrestrial biosphere and the atmosphere by terrestrial plants via plant photosynthesis, and it is the largest CO2 flux on the planet (Beer et al., 2010). In determining African net ecosystem exchange (NEE), GPP was more important than total ecosystem respiration (TER) (Ciais et al., 2011; Ardö, 2015). It dominates the interannual variability in the terrestrial ecosystem carbon uptake, and as a consequence of fertilization, it is likely to continue its substantial increase and play an important role in carbon–climate coupling (Vermote et al., 1997; Friedlingstein et al., 2019). Therefore, quantification of the spatiotemporal variations in GPP is important to assess biogeochemical cycling in the terrestrial biosphere, ecosystem functioning, carbon budgets, and food production in the context of global climate change. Accurate quantification of GPP is still a challenge at scales beyond that of a single ecosystem level, due to the lack of a reliable GPP signal that can be observed worldwide. Especially in the highly productive tropical regions, the lack of both large-scale GPP signals and local measurements leads to a lack of understanding of how environmental changes drive carbon exchange. As a result, we can only crudely describe the carbon balance of these regions in the current and future climate.
For example, it is still unclear whether African biomes are a net sink or source of atmospheric CO2, and there is generally low confidence in the simulated climate change response of the region in Earth system models (Williams et al., 2007; Ciais et al., 2009). Africa has a significant and growing role in the global carbon budget, and it is likely that a sizable fraction of the observed interannual variability in the global carbon cycle (Cox et al., 2013; Ballantyne et al., 2018) can be attributed to the African continent (Williams et al., 2007). Despite its global and regional importance, Africa has few environmental observation networks (Fisher et al., 2013), leaving so-called global atmospheric CO2 inversions (Peters-Lidard et al., 2007; Peylin et al., 2013; Gaubert et al., 2019) poorly constrained. This leaves Africa as the most uncertain and error-prone continent for carbon flux estimates.
Recently, Palmer et al. (2019) suggested that tropical Africa is an unexpectedly large net source of CO2 to the atmosphere, reaching nearly 1.5 PgC yr−1 during the 2015–2016 El Niño event. According to two separate satellite products that retrieve column-integrated CO2 (XCO2) from observed radiances, the northern part of Africa contributes most to this carbon source (Mengistu and Mengistu Tsidu, 2020). Hotspots of emissions in the Congo basin and western Ethiopia, tentatively associated with land-use changes over lands with high soil carbon densities, are partly responsible for this source. An important next step is to verify these finding independently using ground-based measurements of CO2 fluxes (GPP, TER, and NEE) and CO2 mole fractions, as XCO2 retrievals are still in a development phase, and previous versions of these products have displayed various biases despite enormous efforts and great diligence from retrieval experts (O'Dell et al., 2018).
Arguably the most reliable measurements of NEE come from the eddy-covariance technique (Baldocchi et al., 2001). However, there are still uncertainties in the partitioning of the measured net ecosystem exchange flux into GPP and respiration (Reichstein et al., 2005; Lasslop et al., 2012). Furthermore, the eddy-covariance methods only provide measurements over a restricted area covered by their observation footprints with sizes and shapes that vary with tower height, canopy physical characteristics, and wind velocity and by the limited and biased spatial distribution of towers across the globe (Schimel et al., 2015). In Africa there are relatively few eddy-covariance measurement sites, and the data from these towers often suffer from gaps in their observational records. On the other hand, terrestrial and ecosystem models can simulate GPP over varied spatial and temporal scales all over the globe, but the reliability of such calculations heavily depends on both the input data and the model formulation, which often are not specific for African (or tropical) biomes. For example, Fisher et al. (2013) estimated average GPP of the African tropical forest to range from 1.4 to 4.0 kgC m−2 yr−1, indicating large variability among nine global dynamic vegetation models.
The seasonal dynamics of GPP over tropical ecosystems have been discussed widely due to contrasting observations from remote-sensing and eddy-covariance platforms over the South American Amazon basin (see Restrepo-Coupe et al., 2013, and references therein). In addition to photosynthetic active radiation (PAR) and vapor pressure deficit (VPD), there is a clear contribution of soil moisture stress in the changing photosynthetic capacity of leaves as a function of age in broadleaf vegetation (Xiao et al., 2006; Huete et al., 2006) to shaping the GPP seasonal cycle. In seasonally wet forests, GPP typically peaks in the wet season when VPD is low and soil moisture high and declines in the early dry season only to increase again well before the rainfall minimum, as freshly grown leaves take advantage of the maximum in PAR (Lopes et al., 2016). Areas with low vegetation (shrubs, grasses, sparse trees) instead show a decline in GPP throughout the dry season, as soil moisture and high VPD limit productivity of the vegetation. These patterns were confirmed in three separate studies using remote-sensing observations of sun-induced fluorescence from GOSAT (Lee et al., 2013), GOME-2A (Koren et al., 2018), and TROPOMI (Doughty et al., 2019) over the Amazon.
Similarly to SIF, the near-infrared of vegetation (NIRv), which is the product of the normalized vegetation index (NDVI) and total-scene near-infrared reflectance (NIRT), was found to provide a good proxy for GPP (Badgley et al., 2017; Badgley, 2019; Turner et al., 2020; Baldocchi et al., 2020). Therefore, we use the Sun-Induced Fluorescence of Terrestrial Ecosystems Retrieval (SIFTER; van Schaik et al., 2020) data from the GOME-2A instrument and NIRv from the Moderate Resolution Imaging Spectroradiometer (MODIS) to assess the usefulness of these signals to capture the seasonality and magnitudes of GPP derived from six eddy-covariance flux towers from Africa in the overlap years between the years 2007–2014. We also test the robustness of SIF and NIRv to track the seasonality of GPP for the major biomes in comparison to the widely used machine-learning approach of Max Planck Institute for Biogeochemistry (MPI-BGC) GPP, as well as to other vegetation remote-sensing indices like the NDVI (Kong et al., 2016) and enhanced vegetation index (EVI; Arvor et al., 2011). Further, we assess the relationship between the satellite observations and (model-generated) soil moisture (SM) and incoming shortwave radiation (SWR) in the region. Finally, we derived a plant-functional specific linear relation between eddy-covariance GPP and SIF/NIRv, to quantify integrated GPP from remotely sensed signals.
2.1 Study area
The relationships between NIRv, SIF, and GPP were studied for the major biomes over Africa. The dominant biomes of the region are broadleaf evergreen forest (BLEF), C3 grasses (C3), shrubs (Sh), and C4 grasses (C4) (Fig. 1e). Northern and southern parts of Africa operated in anti-phase in their summer insolation, precipitation, and other environmental stresses. Therefore, we subdivided the shrubs and C4 grasses into a Northern Hemisphere (NH) part and Southern Hemisphere (SH) part. However, we did not split up the BLEF, which is at the tropical rain belt and shows weak symmetry between the north and south of the Equator, or the C3, due to its smaller coverage over the northern part of Africa. The vegetation type distribution is based on the terrestrial biosphere model SiBCASA (Schaefer et al., 2008; van Schaik et al., 2018).
The seasonal movement of the Inter-Tropical Convergence Zone (ITCZ) drives the climate of Africa in response to changes in the location of maximum solar heating in the region. The ITCZ seasonally migrates north and south of the Equator as the latitude of maximum solar insolation varies, causing equatorial Africa to be characterized by double-rainfall-maximum rainy seasons (Singarayer et al., 2017). However, in East Africa, local topography leads to spatially variable temperatures and a complex distribution of rainfall (Gebrechorkos et al., 2019). The seasonal dynamics of vegetation are strongly controlled by these climatic conditions (Stephenson, 1990) through the key processes of photosynthesis, respiration, and transpiration. Primarily, the length of the dry season has often been emphasized as a major factor controlling the vegetation structure and patterns in the tropics (Ngomanda et al., 2009; Vincens et al., 2007). November–April are the wettest months, whereas June–September are the driest months for the regions with C3 and Sh-SH biomes (Fig. 1d). On the other hand, July–September are the wettest months, while December to March are the driest months Sh-NH and C4-NH regions. For BLEF regions the precipitation is higher than 100 mm per month throughout the year.
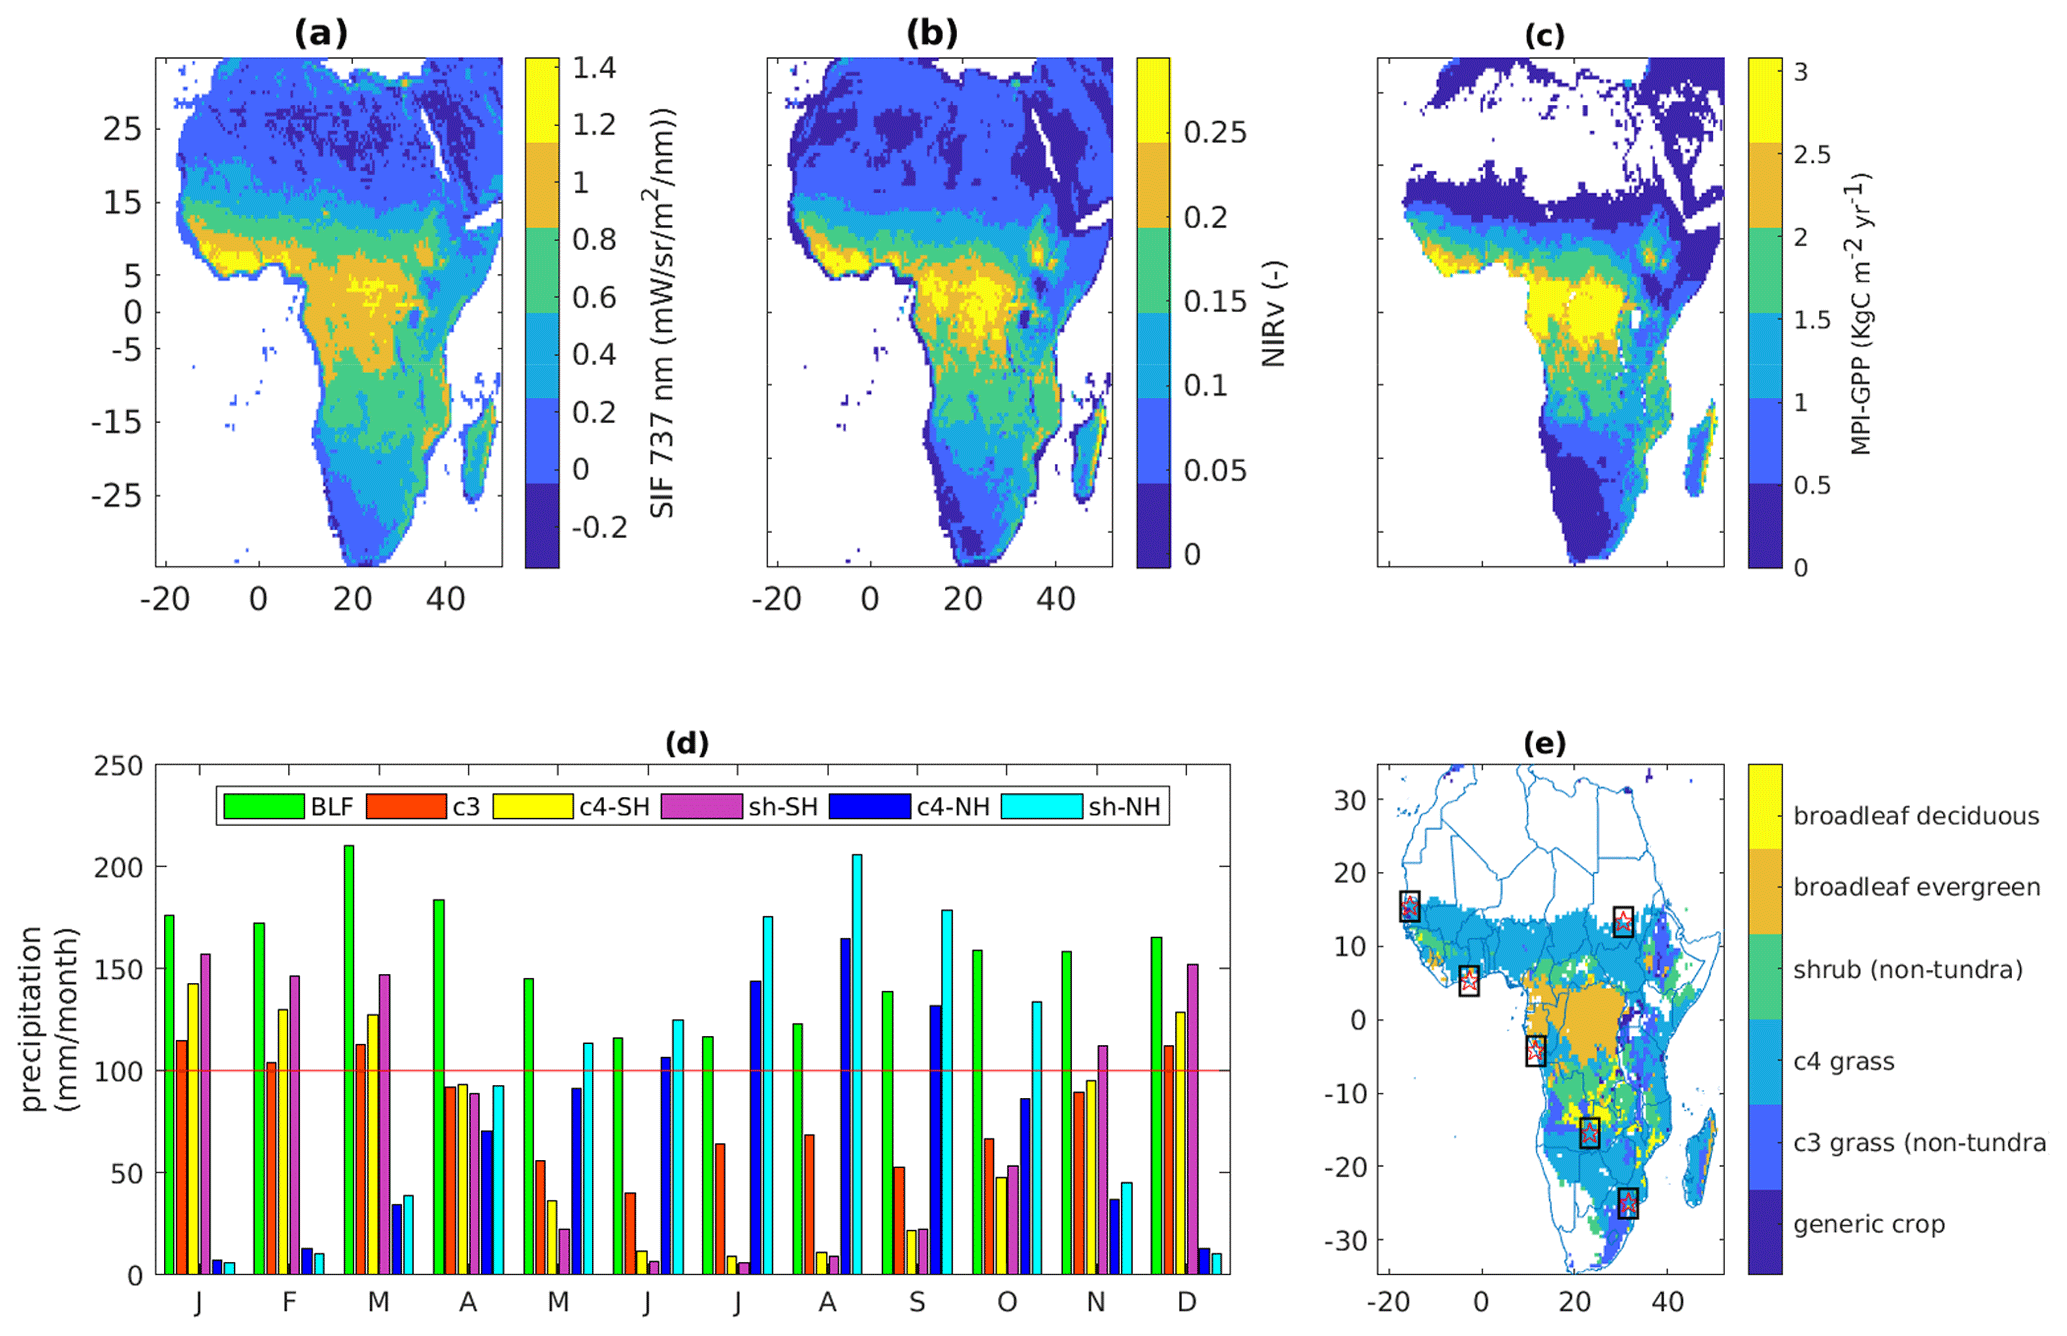
Figure 1Annual mean SIF (a) and NIRv (b) averaged over the years 2007–2016 at resolution. (c) Climatology of gross primary production (Beer et al., 2010) at resolution. (d) Monthly average precipitation computed from the GPCC product covering the period from 1951 to 2000 for the major biomes of Africa. The red line indicates a reference of 100 mm per month. (e) Vegetation types from the terrestrial biosphere model SiBCASA. The white color refers to non-vegetated regions. The rectangular window with a five-pointed star at the center shows the distribution of flux towers in Africa.
2.2 Gridded datasets
In this study we use Level-3 GOME-2 Sun-Induced Fluorescence of Terrestrial Ecosystems Retrieval SIF (v2.0) with 737 nm monthly data at a spatial resolution of covering the period from 2007 to 2016. For a fair comparability of the SIF with vegetation indices we normalized SIF by the cosine of the solar zenith angle. We used the Royal Netherlands Meteorological Institute (KNMI)–Wageningen University & Research (WUR) SIF retrieval, which is particularly suited for tropical conditions (van Schaik et al., 2020; Koren et al., 2018). The retrieval code uses a much larger dataset to construct the reference atmospheric spectra used to distinguish the small SIF signals from the complex structure of transmittance and reflectance from other atmospheric constituents such as water vapor (van Schaik et al., 2020).
The NIRv represents the fraction of reflected near-infrared reflectance (NIR) of light that originates from vegetation. NIRv was first described as a proxy for photosynthesis by Badgley et al. (2017). Recent studies have suggested using NIRv and computed NIRv-based SIF for a more robust GPP estimation under wide land cover with a varied canopy structure and soil brightness (Badgley et al., 2017; Badgley, 2019; Zeng et al., 2019). In this study we used NIRv at a spatial resolution of and a monthly temporal resolution for the years 2007–2016. We also used NIRv at a higher resolution (, daily) in comparison with flux tower GPP. NIRv data used here were calculated using surface reflectance data from MODIS collection MCD43C4 v006 (Schaaf and Wang, 2015) from 2007 to 2016 as
where ρnir and ρred are reflectances acquired in the near-infrared (841–876 nm) and red (620–670 nm) portions of the electromagnetic spectrum, respectively (Huete et al., 2002). A constant 0.08 is subtracted to reduce the effects of the bare soil (Baldocchi et al., 2001; Huang et al., 2019).
Monthly global ecosystem estimation of terrestrial GPP was made available by the Max Planck Institute's Biogeochemical Integration Group (Jung et al., 2011). This GPP estimation is constructed using a machine-learning method to upscale information from flux towers up to a grid, aided by gridded meteorological and remote-sensing co-variables, and hereafter we refer to this product as MPI-BGC GPP. This product is available at a monthly temporal resolution (downloaded from https://www.bgc-jena.mpg.de/geodb/projects/Data.php, last access: 5 January 2020) covering the period from 2007 to 2011.
The enhanced vegetation index (EVI) and the normalized difference vegetation index (NDVI) are the two most widely used vegetation indices for monitoring vegetation conditions and have significant relationships with GPP (Xiao et al., 2005). The monthly EVI and NDVI from the MODIS collection of MOD13C2 at a spatial resolution of 0.050.05∘ in the years 2007–2015 were used in the study. Compared with the NDVI, the EVI is less sensitive to soil background variations and remains sensitive over dense vegetation (Huete et al., 2002). For that reason we focus on comparison with the EVI rather than with the NDVI. Moreover, MODIS does not provide NIRv in the MOD13C2 dataset, so we calculated it using the BRDF-corrected surface reflectances from MCD43C4, following the steps outlined in Badgley et al. (2017).
Monthly precipitation data from the Global Precipitation Climatology Centre (GPCC) at a spatial resolution were employed to show the dry and wet months of the region for each major biome. The GPCC Full Data Monthly Product Version 2018 covers the period from 1891 to 2016; this new extended product version using the new GPCC climatology as analysis background was generated in May 2018 and can be accessed from https://www.dwd.de/ (last access: 15 January 2020). In addition we used monthly temperature data from European Centre for Medium-Range Weather Forecasts (ECMWF) atmospheric reanalysis ERA-Interim (with a grid). Furthermore, we used monthly soil moisture (SM) and incoming downward shortwave radiation (SWR) from the Global Land Data Assimilation System Version 2.1 (GLDAS2.1) of the National Aeronautics and Space Administration (NASA) Goddard Space Flight Center (GSFC) at a spatial resolution of covering the period from years 2007–2016 (Peters-Lidard et al., 2007).
2.3 Flux tower data
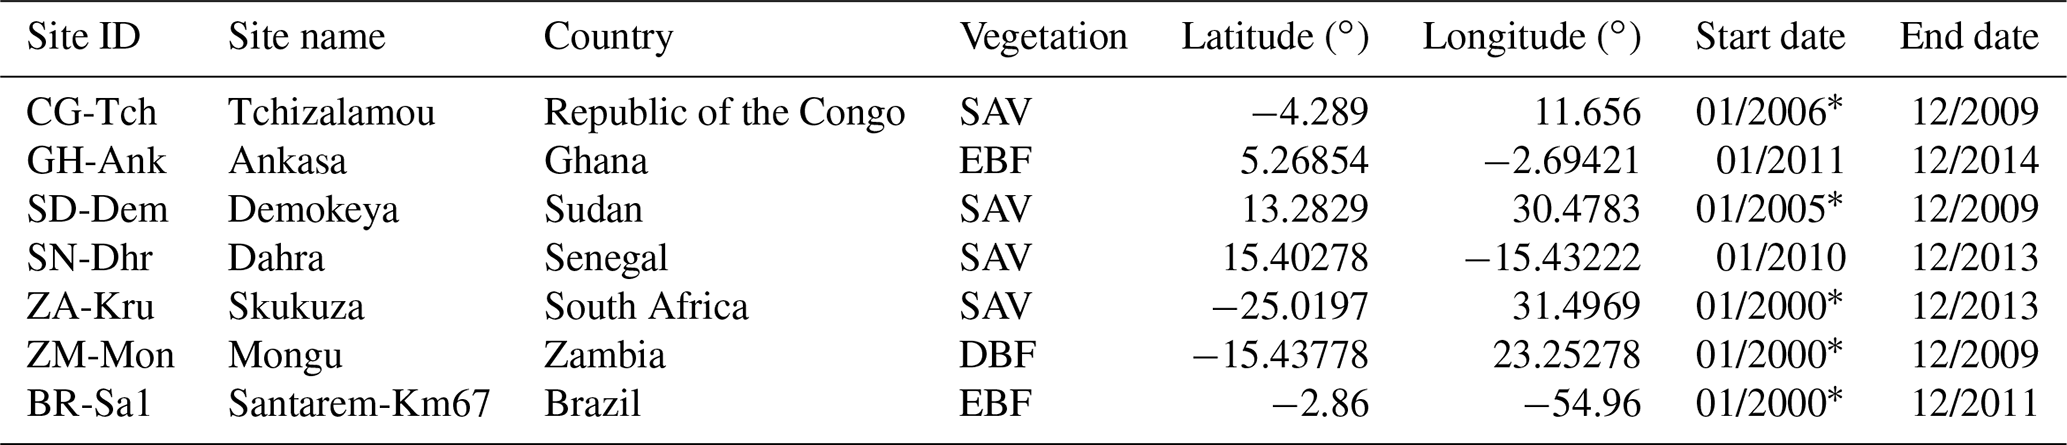
Standardized eddy-covariance flux data are available under the fair-use data policy of the FLUXNET2015 dataset. The data processing of the FLUXNET2015 dataset ensures inter-comparison and quality assurance and control across sites (Vuichard and Papale, 2015). A collection of eddy-covariance flux data from six regions in Africa were used in this study to assess the correlation between SIF, NIRv, and GPP at an ecosystem level, specifically, available monthly GPP products from the daytime partitioning of fluxes (GPP_DT_VUT_REF) from Tier-2 FLUXNET2015 synthesis https://fluxnet.org/ (last access: 15 January 2020). These variables were screened using quality flags so that only samples that are either measured (flag = 0) or good quality (flag = 1) were retained. An overview of the selected towers is given in Table 1. In addition to these six African flux towers we used data from the Brazilian BR-Sa1 flux tower for a better representation of GPP in broadleaf evergreen forests.
Table 1Information on flux tower sites in Africa and Brazil. The symbol “*” indicates that flux observations before 2007 were not used in this study. The major biomes are savanna (SAV), evergreen broadleaf forest (EBF), and deciduous broadleaf forest (DBF). The distribution of the towers over Africa is indicated in Fig. 1e. Note that we also included the details of one tower outside of Africa, BR-Sa1, that was used for our analysis of tropical evergreen broadleaf forests. Start and ends dates are given in the format month/year.
2.4 Analysis method
To compare the gridded datasets (SIF, NIRv, MPI-GPP) with the GPP measurements from flux towers, we extracted data from a window surrounding each flux tower. The flux towers have a footprint of about 1 km2, and it is hard to compare them to areas that are 200 km2, centering around the towers, which include many vegetation types. However, we use the vegetation mask to exclude grid cells with different vegetation from the tower's vegetation; this will account for the land heterogeneity of the regions. The variation in climate condition was addressed by splitting up the shrubs and C4 grasses over the Northern and Southern hemispheres. We used good quality data as recommended by each data source, and we further processed these datasets to match the spatiotemporal grids. For the reason that only a small fraction of emitted SIF signal can be sensed from space, which also depends on the direction of observation, the empirical relationship between SIF and GPP is complicated (Porcar-Castell et al., 2014; Zeng et al., 2019). Even if the mechanistic link between remotely sensed vegetation reflectance and GPP is complex (Porcar-Castell et al., 2014), Guanter et al. (2014) and Sun et al. (2017) showed that a simple linear relationship between SIF- and tower-based GPP is a reasonably convenient framework for presenting and evaluating arguments and counterarguments for the SIF–GPP relationship. Here, we predict GPP from this remotely sensed vegetation reflectance using a linear regression between GPP and these signals as
where y is the GPP obtained from SIF or NIRv signals, x is the SIF or NIRv signal, and a and b are the slope and y intercept of the fitting line, respectively. The conversion of SIF and NIRv to GPP is achieved by applying this fitting to all monthly SIF and NIRv values for each vegetation type separately.
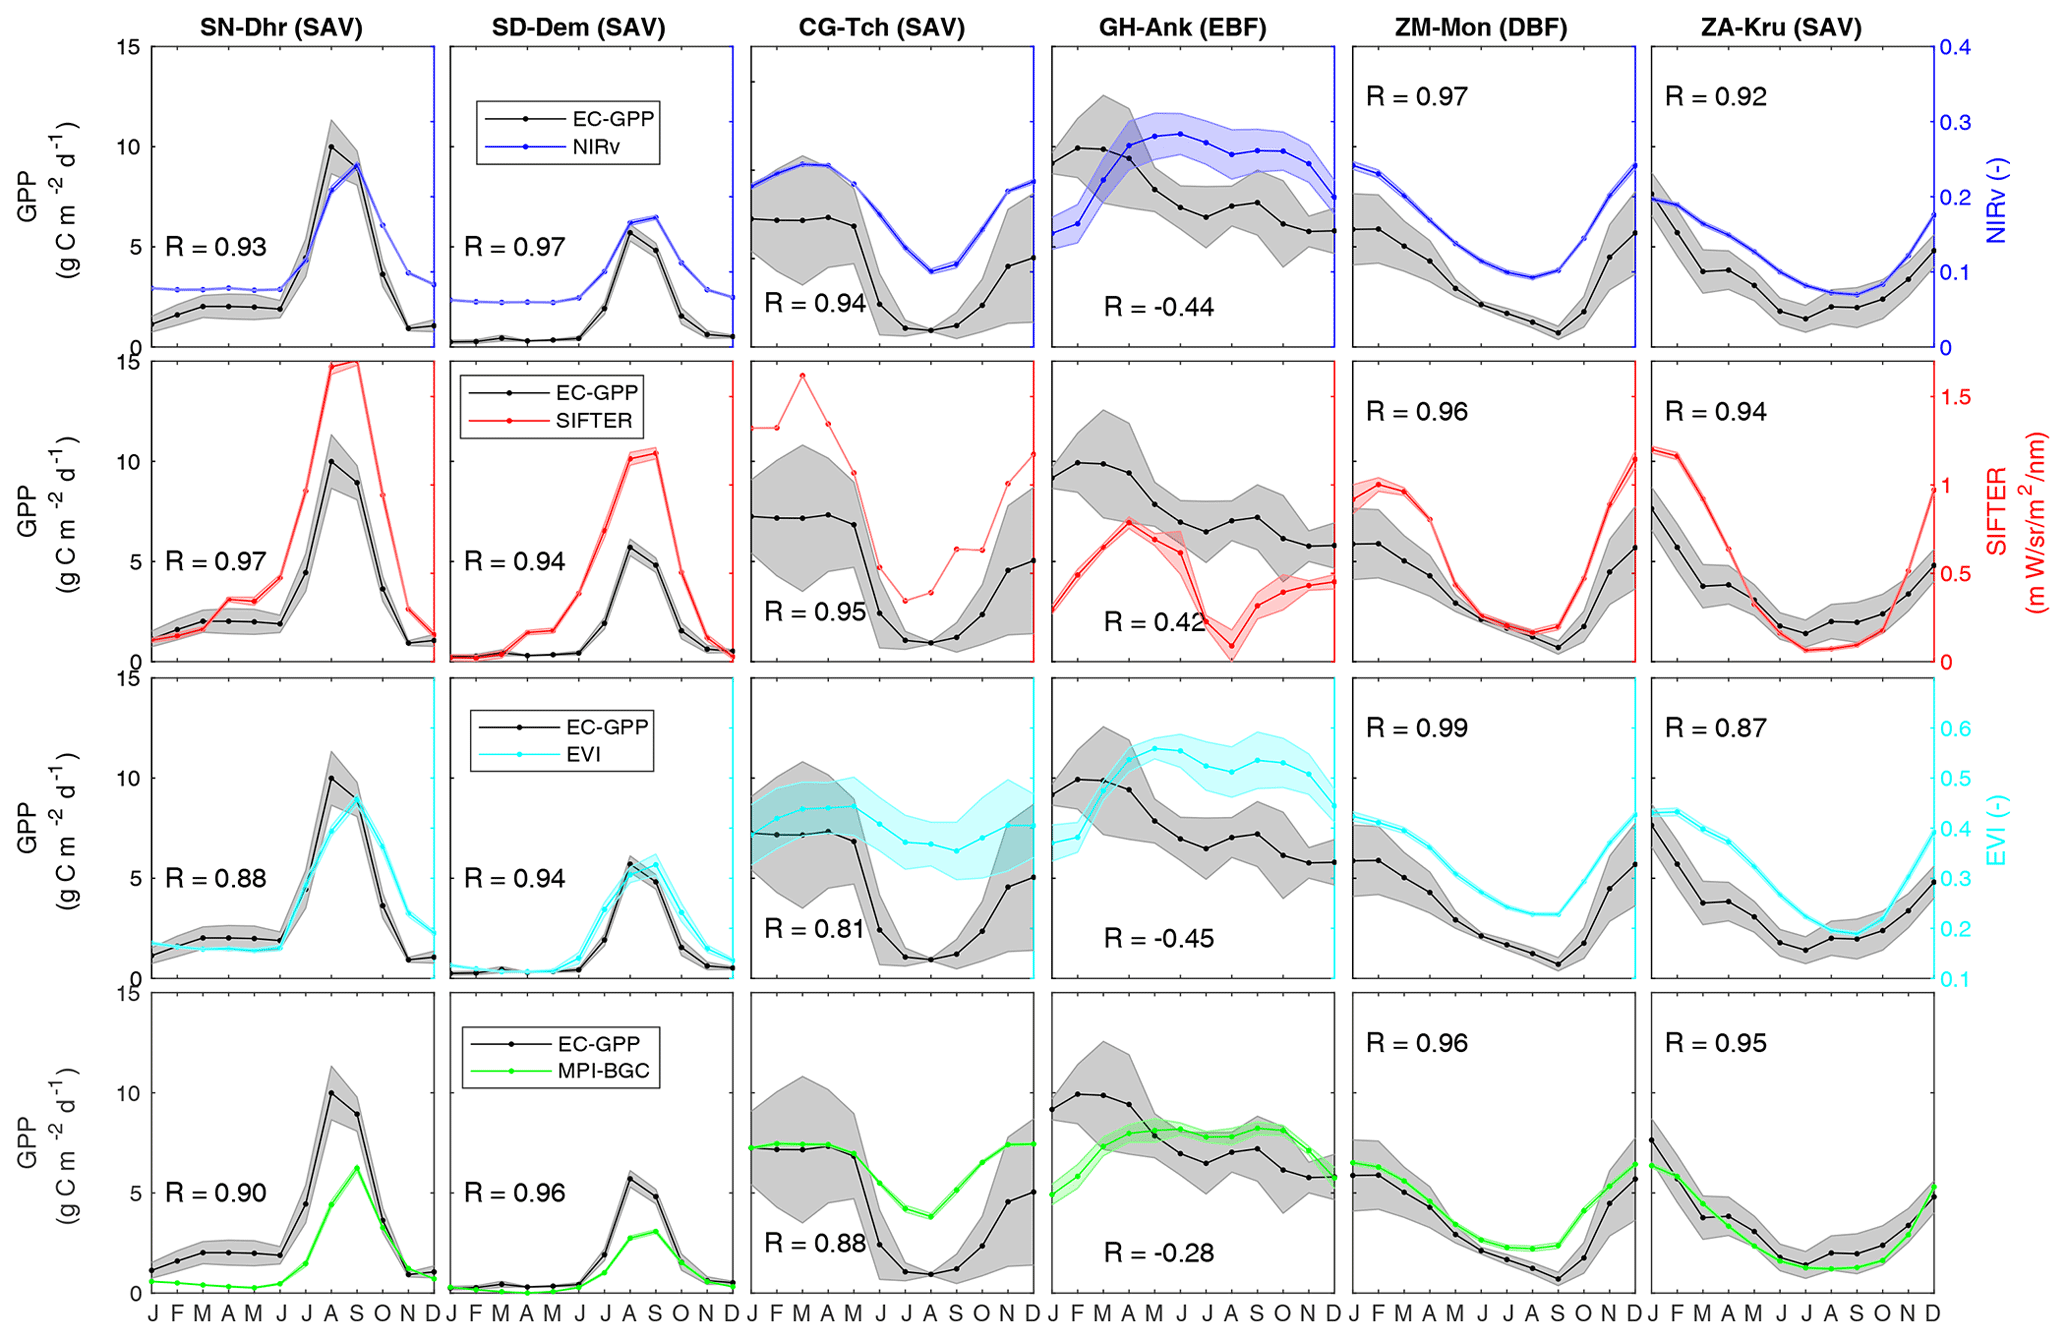
Figure 2The skill of NIRv, SIF, the EVI, and MPI GPP in capturing the seasonal cycle of GPP from flux towers. The shaded area indicates the standard deviation around the monthly means. Note that NIRv, SIF, and the EVI do not have the same unit as GPP and their values are provided on the secondary y axis.
The linear relationship between SIF and GPP in Eq. (2) may be rationalized with the formulation based on the concept of light use efficiency (LUE) (Monteith, 1972) in a simple parametric LUE-model GPP as follows:
where APAR is the absorbed photosynthetically active radiation expressed in radiance units and LUEp is the light use efficiency of photosynthesis, which represents the efficiency of energy conversion for gross CO2 assimilation. Similarly, SIF can be expressed as
where LUEf is the effective light use efficiency of SIF and fesc is the fraction of SIF photons escaping the canopy (Damm et al., 2015; Dechant et al., 2020). These equations can be combined making the dependence on light implicit:
SIF has negative values due to noise in its retrieval, and a zero value of SIF may not result in a zero value; therefore we do not force the regression to pass through the origin, and as result, there will be intercepts “b” as in Eq. (5). Further, the linear relationship between NIRv and SIF can be rationalized by the fact that both SIF and NIRv are jointly dependent on the flux of the fractional interception of vegetation, incoming solar radiation, and the fraction of photons that escape from the canopy; these last two are strongly related measurable fluxes (Zeng et al., 2019).
3.1 GPP proxies and eddy-covariance-derived GPP estimates
Spatial patterns in climatological NIRv, SIF, and MPI-BGC GPP are very similar across large scales, with maximum annual mean productivity in tropical broadleaf forests. Figure 1a–c show that productivity changes strongly at the borders of the plant-functional types (PFTs), which is interesting because only the MPI-BGC product was actually informed by a PFT map in its machine learning, while the satellite observations provide independent spatial views on productivity. Both products suggest additional variations within PFTs not represented in the MPI-BGC map, as would be expected based on the higher volume of observed data in the remote-sensing products.
NIRv, SIF, the EVI, and MPI-BGC GPP generally capture seasonal patterns of tower GPP well, except at the Ghana GH-Ank flux tower where from all products only SIF yields the expected positive correlation with eddy-covariance-derived GPP observations. Figure 2 shows the observation-derived and simulated seasonal cycles of GPP and the generally high (R>0.8) seasonal correlations. SIF shows more rapid changes in signal during the transitions from wet-to-dry periods than other proxies. The May–June–July period at the savanna site CG-Tch is an example and indicates that SIF responds more rapidly to the decline in photosynthesis in wilting grasses, which are still green and reflective enough to affect the NDVI, EVI, and NIRv. Moreover, time series analysis for the years covering 2007–2016 around the CG-Tch tower resulted in correlations of 0.77, 0.89, and 0.88 between SIF, NIRv, and the EVI and soil moisture (SM) and 0.72, 0.64, and 0.64 between SIF, NIRv, and the EVI and precipitation, respectively (Fig. S1). The low correlation between SIF and SM is due to SIF responding before the soil gets too dry, whereas the correlations of the EVI and NIRv with SM show the same pattern which suggests that they respond when the vegetation loses its green color. An immediate response of SIF to water stress of a similar type has also been observed by others (Chen et al., 2019; Tian et al., 2020).
SIF and NIRv have a higher monthly correlation with the eddy-covariance (EC) GPP at most of the towers than the EVI and MPI-BGC GPP (Fig. S2). Luus et al. (2017) also found this and suggest it is because chlorophyll content seen through the NDVI and EVI adapts slowly to stress and it can take weeks for leaves to lose their green color (Hew et al., 1969). The EVI and NDVI not only had generally much weaker correlations but also show saturation when GPP is high (Fig. S2). SIF and NIRv had the strongest correlations (R>0.90) with the EC GPP in C4 grass vegetation sites (SD-Dem and SN-Dhr), while weak or no relationship was found for broadleaf evergreen vegetation (GH-Ank). This lack of relation was also found previously by Li et al. (2018) over rainforest regions and is further discussed in Sect. 4. Even over evergreen forests where GPP is high throughout the season (see Fig. 1c), NIRv and SIF track seasonality of GPP well.
For a more detailed look, we also compare EC GPP to daily NIRv signals, derived from high-resolution () MODIS radiances instead of coarse averaged MODIS NIRv (). At this daily timescale, we again find a very strong correlation over northern Africa, while this correlation decreases for the equatorial sites (Fig. 3). And again, we see a weak correlation at GH-Ank, Ghana (Fig. 3 Gh-Ank). The high-resolution NIRv mostly improves the comparison for sites with more heterogeneous vegetation cover (GH-Ank and ZM-Mon, ZA-Kru), whereas there was no significant improvement for less heterogeneous sites (SN-Dhr and SD-Dem). In contrast to the low climatology correlation for tropical evergreen broadleaf forest (GH-Ank, ), the correlation in the interannual variation in NIRv and GPP is higher (R=0.21) (see Table S1). These results are illustrative of tropical ecosystems, where GPP variations are irregular and strongly coupled to photosynthetic capacity changes of vegetation (Restrepo-Coupe et al., 2013, 2017).
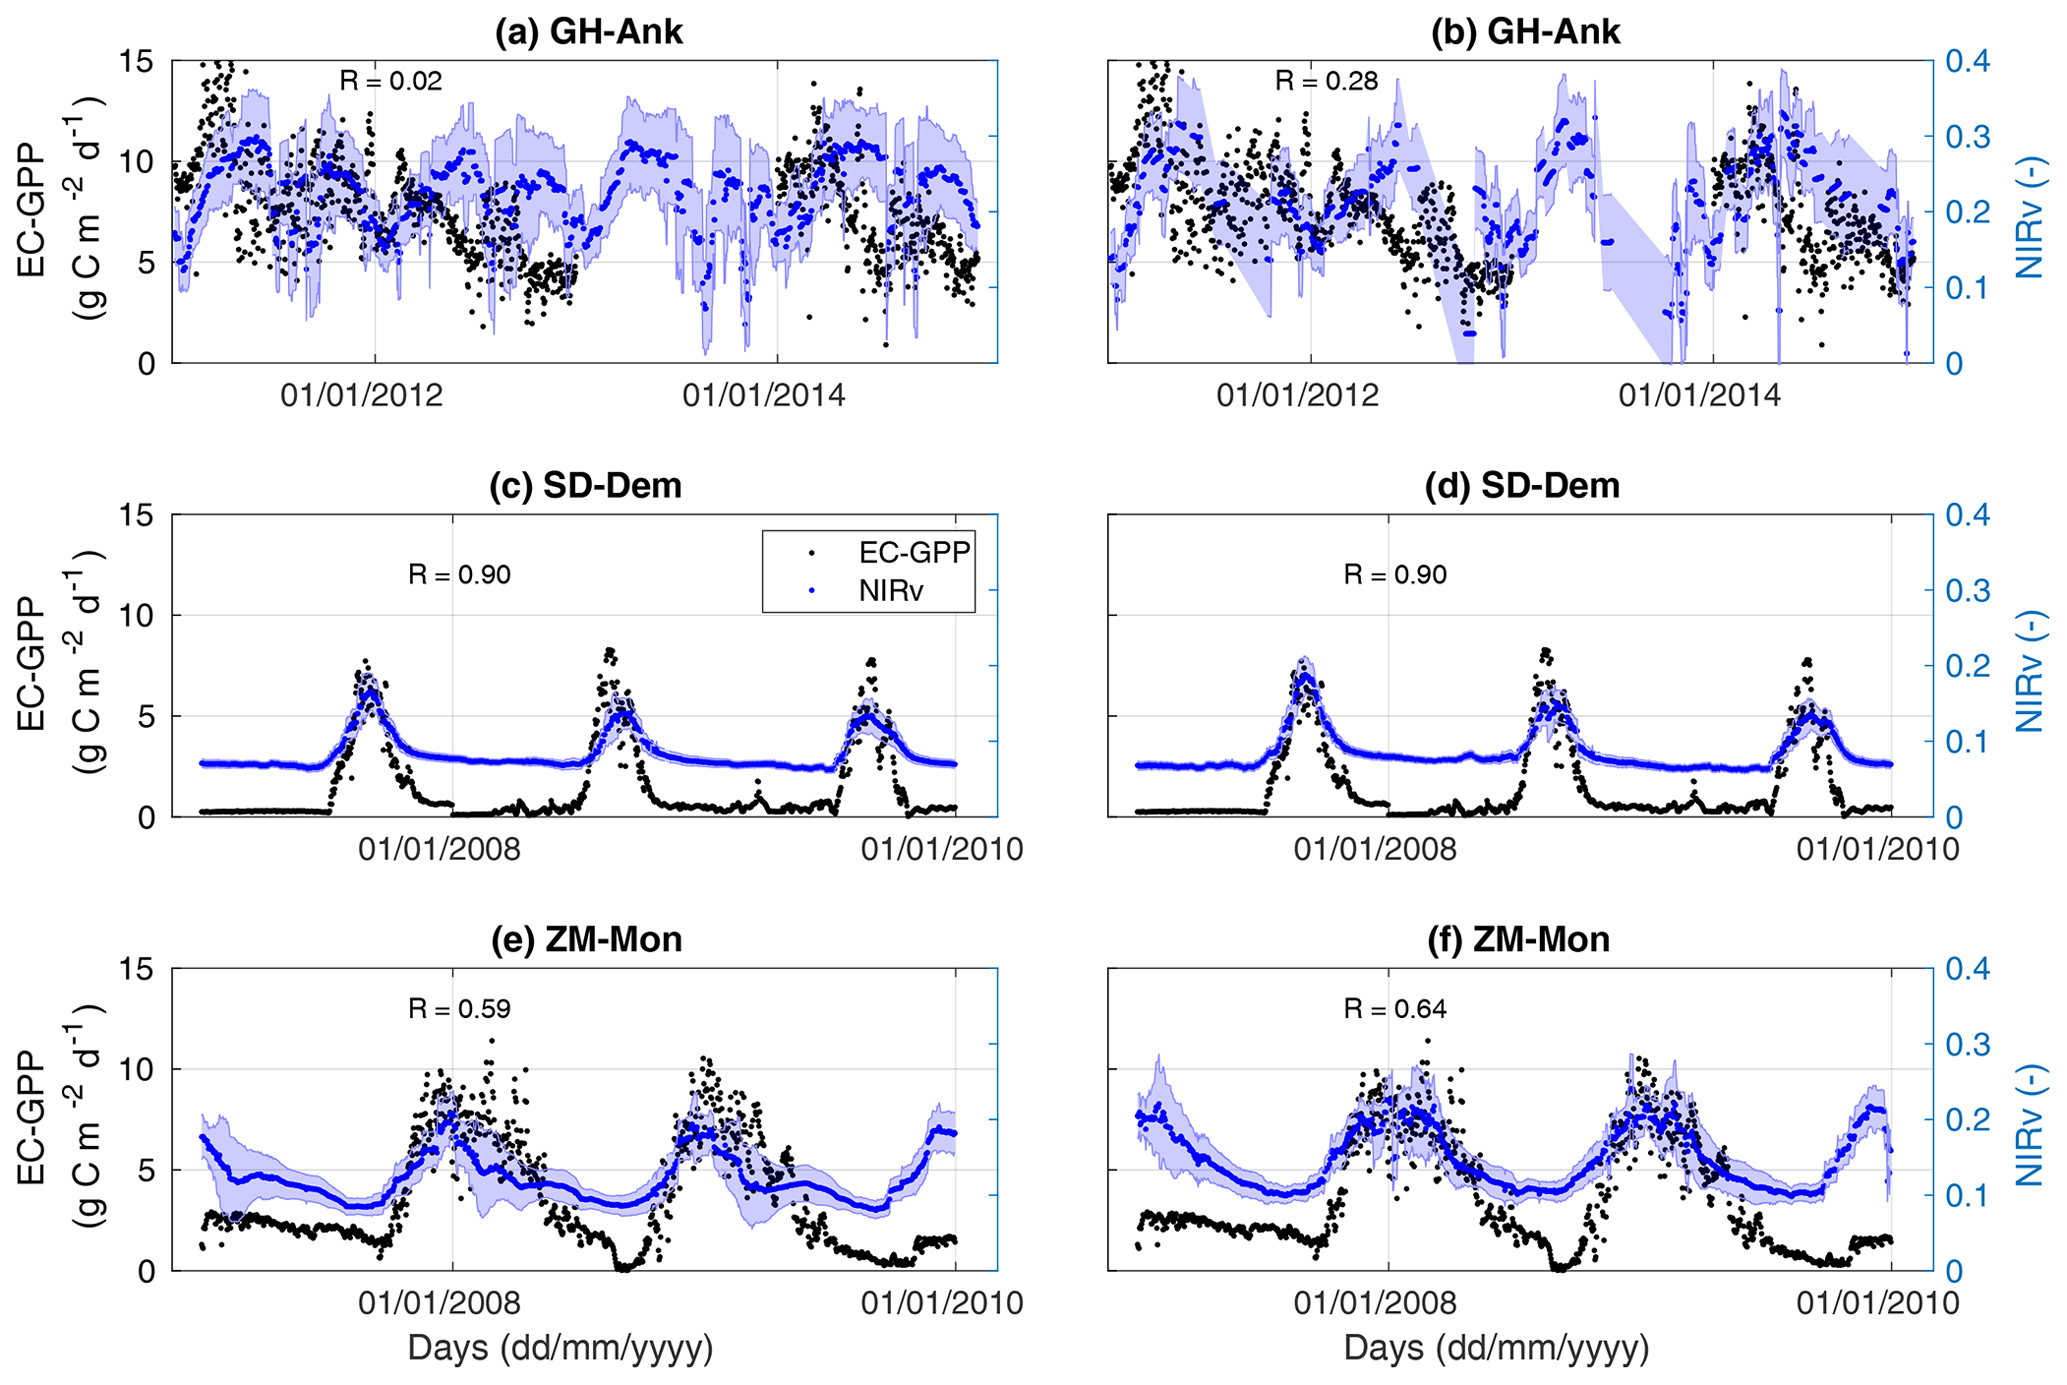
Figure 3Comparison of coarse NIRv at (left panels) and high-resolution NIRv at 0.05 (right panels) with flux-tower-measured GPP (EC GPP) for a selection of three African flux towers (GH-Ank, SD-Dem, and ZM-Mon). The temporal correlation between NIRv and EC GPP is given in each panel.
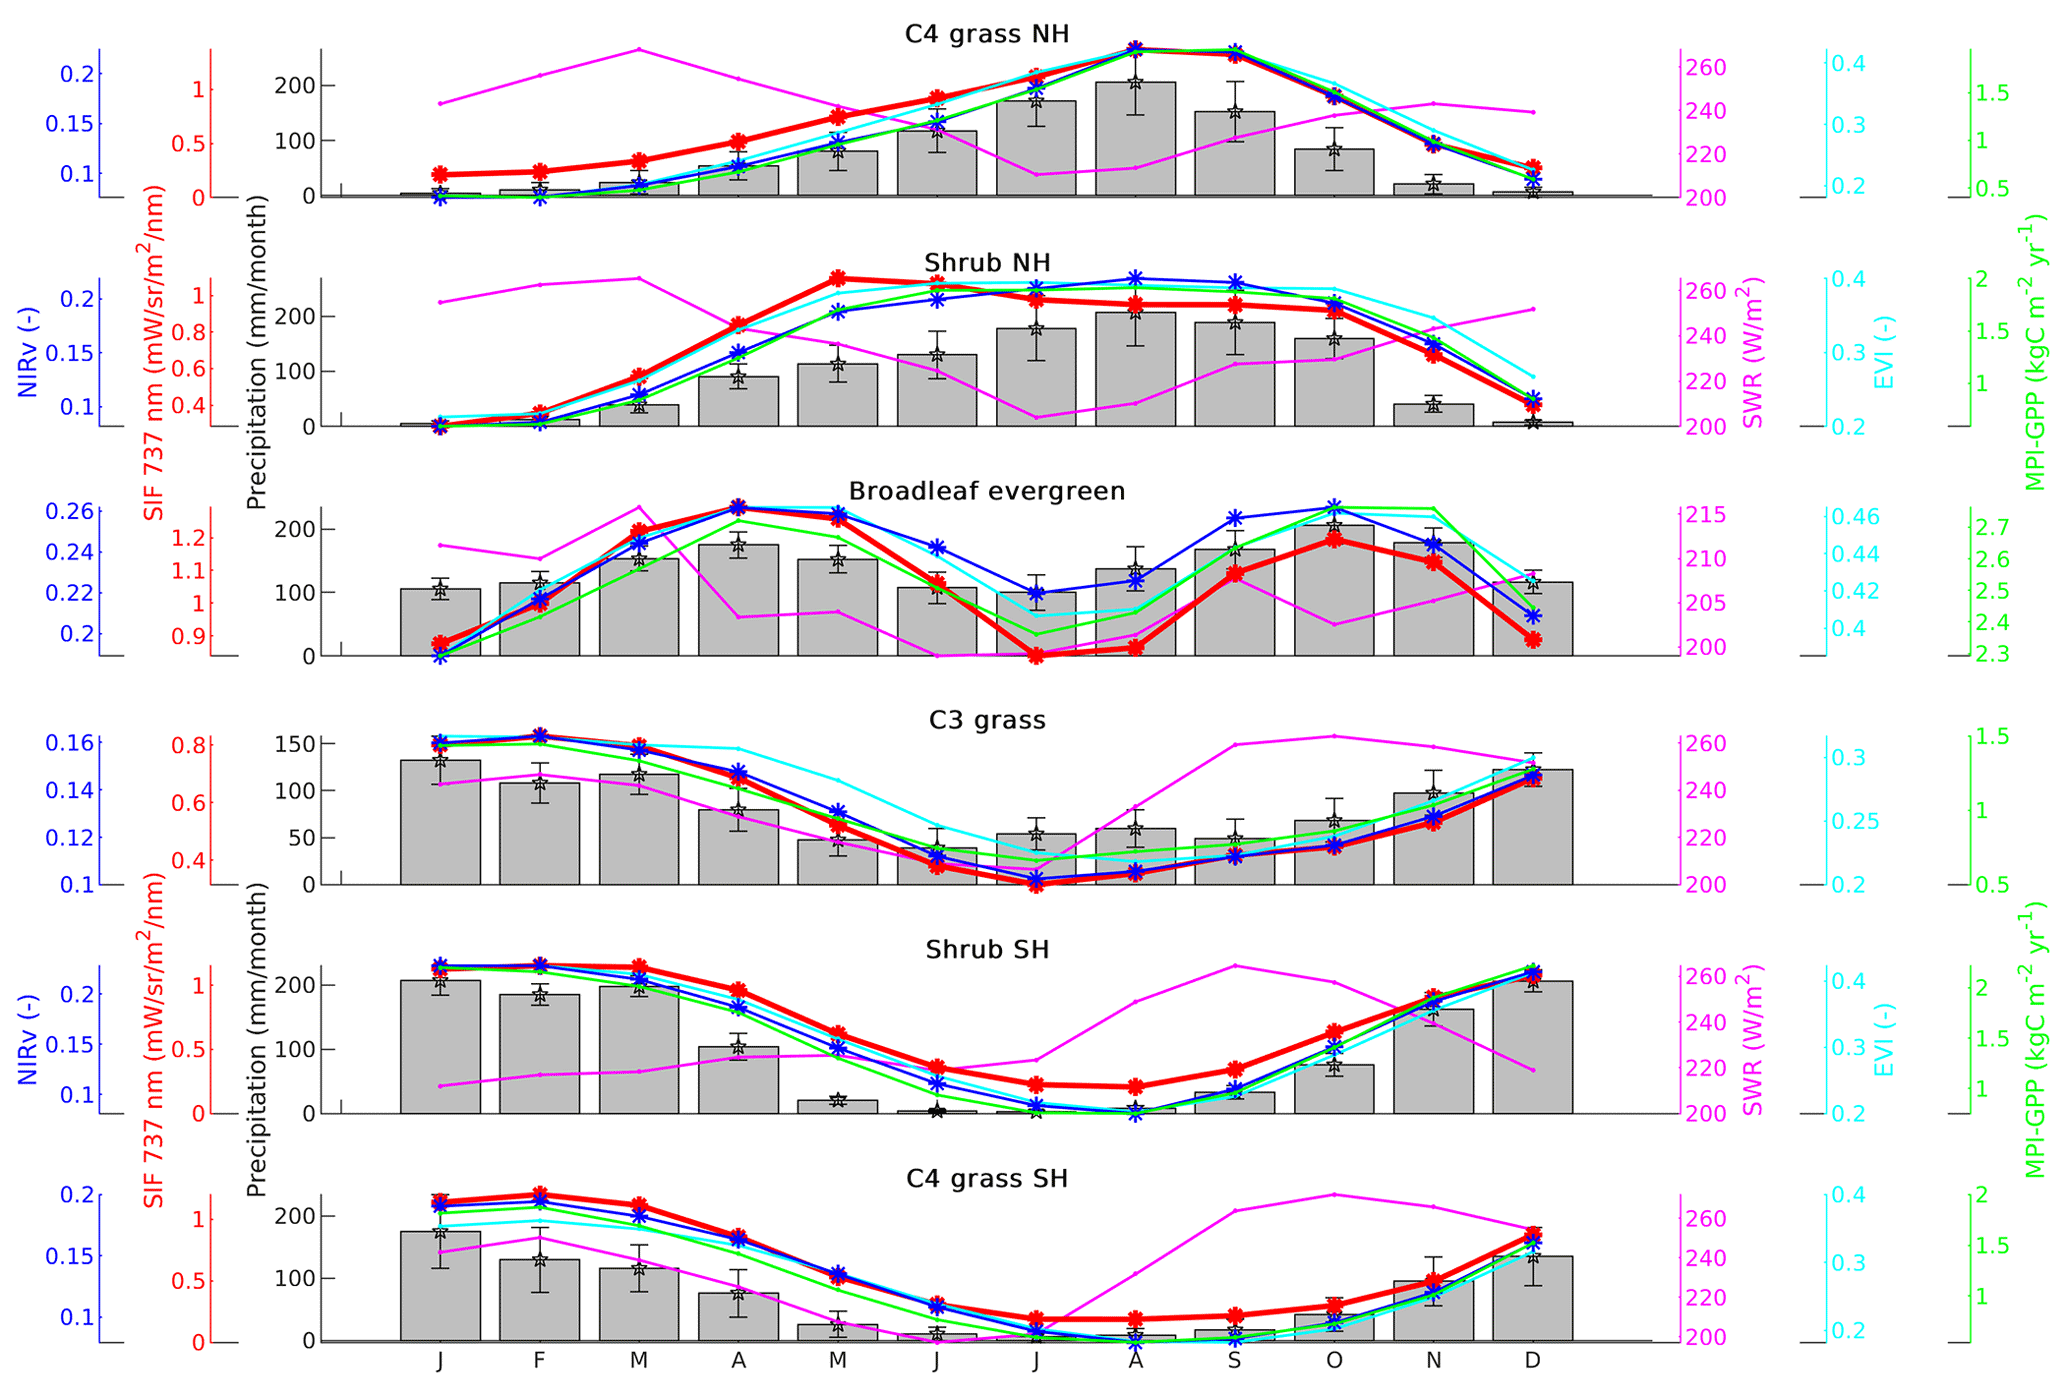
Figure 4Seasonal cycles of NIRv, SIF, precipitation, shortwave radiation (SWR), the EVI, and MPI GPP at a resolution over major biomes of Africa covering the period from 2007 to 2011. The error bars provided for precipitation denote the standard deviation around the mean.
3.2 GPP proxies across the major biomes of Africa
We next extend this view from the level of individual towers to the scale of six major biomes in Africa (Fig. 1e) by spatially averaging our productivity products. Also then, wet months show higher SIF and NIRv values than dry months for all biomes of the region. Both SIF and NIRv show a strong linear relation with those of the MPI-BGC GPP estimates. Signals from both SIF and NIRv were correlated well with MPI-BGC GPP over these biomes with a correlation of R2>0.85 for NIRv and R2>0.77 for SIF. However, the correlation was moderate for broadleaf evergreen forests with a correlation of 0.38 for NIRv and 0.16 for SIF (see Table S2). This seasonality shown in Fig. 4 agrees closely with that seen for similar biomes in the Amazon (Girardin et al., 2016; Koren et al., 2018) and confirms the known strong water control over GPP in tropical vegetation (Abdi et al., 2017; Bonal et al., 2016). Correlations with shortwave radiation are thus strongly negative, especially over short vegetation like shrubs and grasses. Over evergreen forests, SIF and NIRv show a double-peaked seasonality and a decrease in productivity during the dry seasons despite high SWR and a high leaf area index (see Fig. 4, Broadleaf evergreen), suggesting an influence of photosynthetic capacity on GPP that has been noted before to be not yet represented by most biosphere models and light use efficiency models (Bhattacharya, 2018). Clouds can strongly reduce direct solar radiation during the wet season which increases the ratio of diffuse versus direct solar radiation, possibly increasing productivity (Hollinger et al., 1999).
Mostly, the EVI and MPI GPP closely agree on the satellite-observed seasonality at these larger scales, but the EVI appears late in simulating the wet–dry season (September–December) decline in signal for C3 grasses and shrubs (see SIF-vs.-EVI hysteresis plots in Fig. S4). Similar differences in EVI- and SIF-derived seasonal cycles of photosynthesis were described in Luus et al. (2017), for short vegetation at high latitudes. Our response is opposite in the sense that we see photosynthesis decline already before the seasonal brown-down of the savanna. To further investigate this, we therefore turn to the main drivers, water and light, of the African seasonal cycle in GPP.
The biome-integrated productivity in Africa is seasonally strongly controlled by soil moisture, with a weak influence of light availability superimposed. In Fig. 5 this is recognized by the positive correlation between SIF/NIRv (which independently display the exact same patterns) and soil moisture in both hemispheres. Peak productivity coincides with peak soil moisture that occurs in September in the NH and in March in the SH. Interestingly, the lead-up to peak productivity occurs more slowly than its subsequent decline even at the same soil moisture levels, evident when comparing the pairs of months (1) August and October and (2) July and November for the NH, or pairs (1) January and April and (2) December and May for the SH. Translating these points to the SWR diagrams in panels (a) and (c), a notable difference between the hemispheres appears: in the SH peak productivity occurs while light availability continues to decline, creating the elliptical shape of the hysteresis diagram. In the NH however, peak productivity happens at minimum light availability becoming larger at the same soil moisture levels past the peak productivity.
3.3 SIF-GPP and NIRv-GPP estimation for the major biomes
A SIF- or NIRv-based GPP estimate across each biome compares independently quite well to MPI-BGC-estimated GPP. Figure 6 shows the GPP estimated by applying the SIF/NIRV-vs.-GPP relation derived at EC sites to biome-wide satellite observations.

Figure 5Relation between SIF/NIRv with downward shortwave radiation (a, c) and root zone soil moisture (b, d) for major African biomes. (a, b) Results over the vegetated regions of northern Africa (north of the Equator). (c, d) Results for southern Africa (south of the Equator). The numbers in the plot and the color of the markers refer to the month of the year.
We chose the relation between the remotely sensed reflectances and the EC GPP from Senegal SN-Dhr, Congo CG-Tch, and Sudan SD-Dem and ZA-Kru towers to estimate GPP of the northern shrub, the southern shrub, and C4 grass and C3 grass, respectively, to represent different biomes over northern and southern Africa (see Fig. S2 for the fitting equations applied). Due to the weak relationship between SIF/NIRv with Ghana GH-Ank GPP, a flux tower in tropical rainforest of Africa with broadleaf evergreen vegetation, we used a linear relation between SIF/NIRv and EC GPP data from the Brazilian BR-Sa1 flux tower which is also in a tropical rainforest region with a broadleaf evergreen vegetation and shows a better relation with these signals than the GH-Ank site (see Fig. S3). The good correspondence to MPI-BGC GPP partly results from the EC sites being part of the training algorithm for that product (Jiang and Ryu, 2016), but we note that the spatiotemporal drivers in our product (SIF/NIRv) are very different from those in MPI-BGC (PAR, T, PFT, precipitation, etc.). Mostly, the SIF- or NIRv-based GPP estimate shows that a reasonable first estimate of spatiotemporal GPP patterns can be based on SIF and NIRv without the need for the more complex and data-intensive machine-learning approach. At least, it captures the large differences between the major biomes of Africa, allowing further study of their seasonal dynamics, drought response, and contribution to tropical GPP.
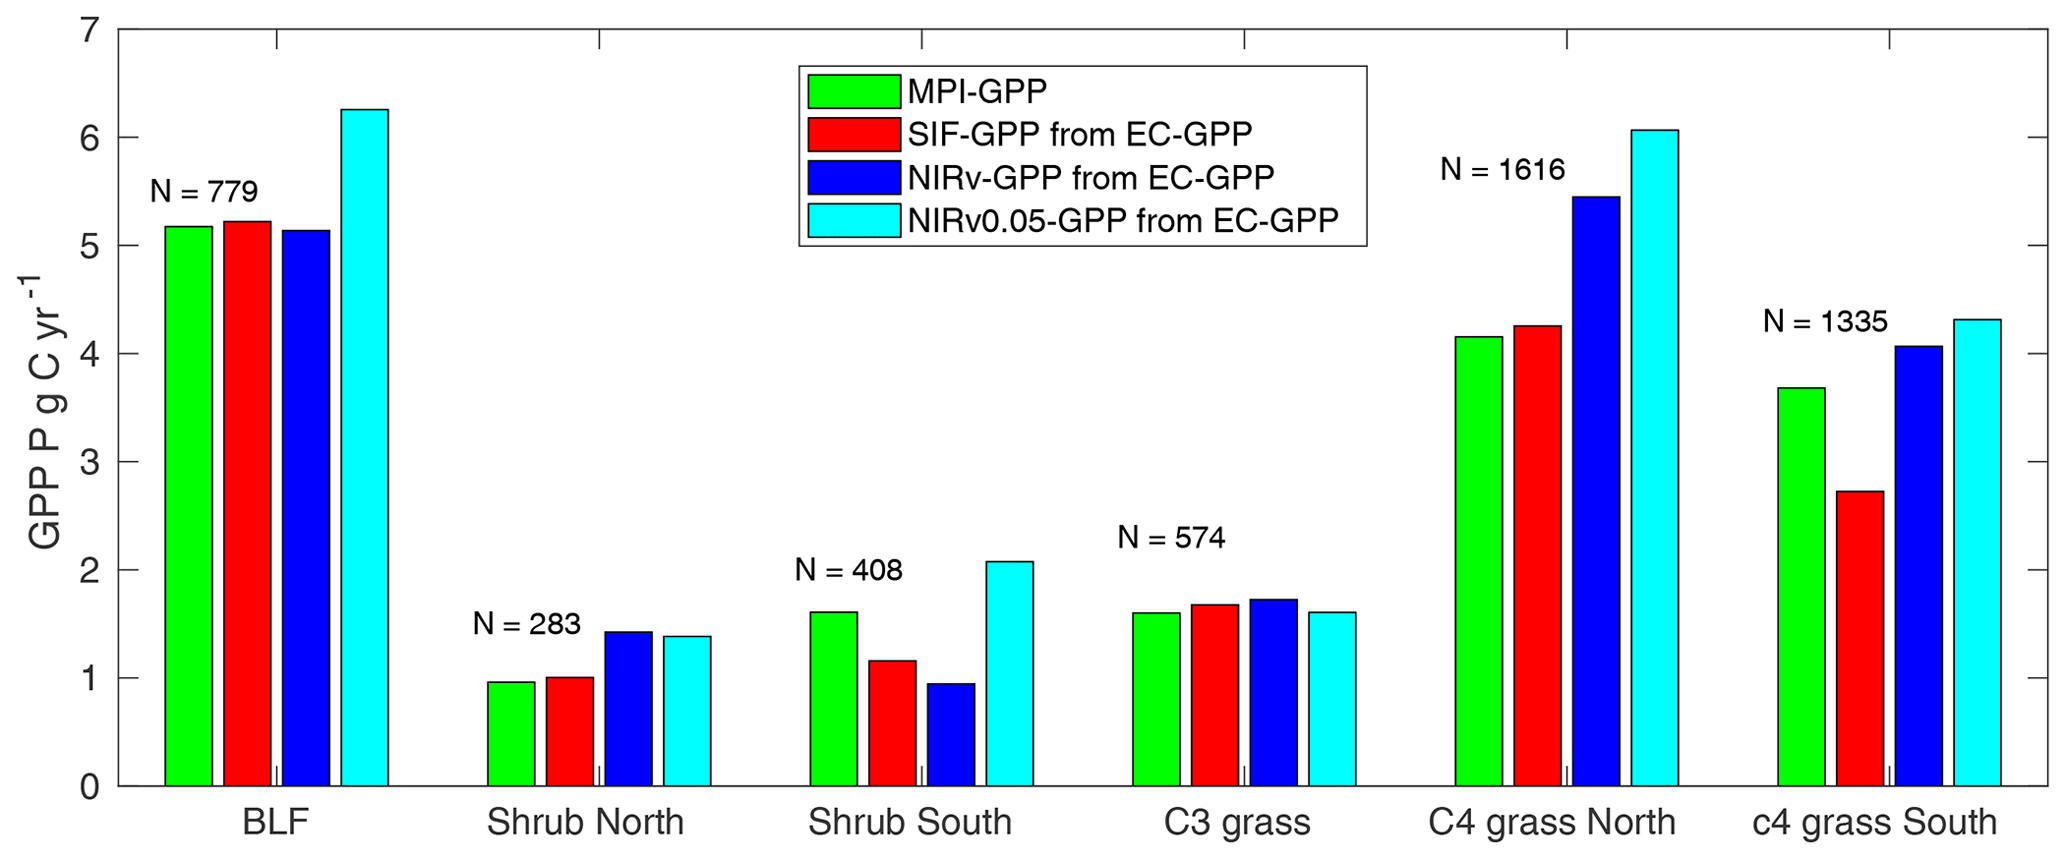
Figure 6Comparison of aggregated MPI-BGC GPP, SIF GPP, NIRv GPP, and GPP estimated from high-resolution NIRv (NIRv0.05 GPP) for major biomes in Africa. N is the number of grid boxes of size used in the aggregation.
We found the relationship between SIF/NIRv and GPP for croplands to be the strongest, with R>0.90 for C4 vegetation at both the Sudan (SD-Dem) and Senegal (SN-Dhr) sites (Fig. S2). Wang et al. (2020) have also shown that SIF can effectively track the seasonality of tower GPP better than the NDVI and vegetation optical depth (VOD). A much weaker relation was obtained for broadleaf evergreen vegetation such as in Ghana (GH-Ank). This agrees with Li et al. (2018), who also showed a weak relationship between SIF and GPP over rainforest sites. Previous authors have suggested this may result from the inefficiency of satellite measurements in detecting the canopy activities of tropical forest (Tang and Dubayah, 2017), due to limitations in their retrieval due to atmospheric cloud contamination (Frankenberg et al., 2014; Doughty et al., 2019) or to limitations in the EC measurement technique itself (Hayek et al., 2018).
Eddy correlation measurements over rainforests are more complicated than over flat vegetation due to the presence of tall uneven canopies (Mercado et al., 2006) as well as stable atmospheric conditions at night (Miller et al., 2004). This comes on top of the uncertainty incurred on the derived GPP, which requires a partitioning of the measured net ecosystem exchange during turbulent conditions (Reichstein et al., 2005). The methodology used assumes a temperature dependency of ecosystem respiration to remove its influence during the daytime, such that GPP can be determined from the residual of measured NEE and measurement-derived TER. For tropical sites this T dependency is often assumed negligible (Restrepo-Coupe et al., 2013). The partitioning approach is furthermore not well-tested for tropical ecosystems because of a lack of long data records, the larger uncertainty in determining nighttime TER (Kruijt et al., 2004), and the often-seen nighttime storage that results in peak NEE fluxes in the early morning (Araújo et al., 2002). Finally, tropical TER is likely to experience a larger control of temperature and moisture on TER (Chambers et al., 2004).
The tower GPP from the GH-Ank site shows limited seasonality (Fig. 3). GPP over evergreen tropical forest vegetation is poorly captured by all products. Where NIRv, the EVI, and MPI-BGC GPP all show a phase-lag of nearly 4 months, SIF manifests a double-peak structure and much too low annual mean SIF relative to the other datasets. In general, SIF and NIRv were better proxies for capturing the seasonal dynamics of GPP over most sites. The relationships can be improved by using higher-resolution products instead of these coarse resolutions. Here we used SIF from the GOME-2 instrument which has a larger footprint (40×80 km2) and global gridding with a spatial resolution of at a monthly timescale. TROPOMI SIF is a promising alternative for future studies of the African carbon cycle. TROPOMI SIF has a higher spatial resolution than GOME-2 SIF and more frequent coverage. Global TROPOMI SIF data were first shown by Köhler et al. (2018). Their study also included a detailed view of the North African Nile Delta. In addition, Doughty et al. (2019) used TROPOMI to study the seasonality of the Amazon, showing the capability of this instrument to capture seasonal dynamics of tropical ecosystems. Moreover, high-resolution () SIF can be modeled using explanatory variables which are available at both fine and coarse resolutions (Guanter et al., 2014; Zeng et al., 2019). These results are illustrative of tropical ecosystems, where GPP variations are irregular and strongly coupled to leaf phenology of vegetation (Restrepo-Coupe et al., 2013, 2017).
Remote-sensing-data-driven models are widely used for estimating plant photosynthesis, and they are linearly dependent on the amount of solar illumination and amount of water content in the soil and plant canopy (Ceccato et al., 2001). Most of these models assume information on the fraction of absorbed photosynthetically active radiation (fAPAR) and vapor pressure deficit (VPD) are sufficient to accurately estimate the responses of GPP to drought. However, deficits in soil moisture and their effects on GPP are not necessarily captured by fAPAR or VPD (Stocker et al., 2019) and result in large uncertainties in these GPP estimations. Our analysis showed seasonality of soil moisture strongly controls plant productivity with a weak intervention of available shortwave radiation. SIF and NIRv have a correlation coefficient of R≈0.97 with soil moisture over southern Africa which is stronger than over northern Africa (R≈0.76). Despite this strong linear relation, during some months, we observed a very small difference in SIF/NIRv while the difference in the soil moisture was large. This is partly related to the amount of solar radiation. During saturation, when the soil is very moist, the amount of shortwave radiation significantly impacts productivity, whereas during the growing season or end period of growing seasons, vegetation production has a strong proportion compared to soil moisture. A per-pixel temporal correlation of SIF, NIRv, and the EVI with soil moisture and precipitation over the vegetated regions of Africa covering the years 2007–2016 exhibits a weaker correlation over the tropical rainforest region, where the monthly average rainfall always exceeds 100 mm per month and a broadleaf evergreen forest is the major land cover (Fig. S5). This suggests that the seasonal patterns of GPP may have no correspondence with precipitation/soil moisture over this region, which generally has smaller seasonality in GPP and high soil moisture levels compared to non-broadleaf vegetation types.
GPP estimation from SIF needs a more complicated modeling approach (Norton et al., 2018; Anav et al., 2015) as it needs assimilation of SIF into a terrestrial biosphere model to estimate the gross uptake of carbon through photosynthesis. However, we applied a simple linear relation between SIF/NIRv and EC GPP and showed reasonably well estimates of GPP over different biomes (Fig. 6) (see also Table S3 for biome-specific estimation of GPP per unit area as a response of the major biomes of Africa). The GPP obtained in this simple upscaling method was integrated for each biome and was found to have good consistency with MPI-BGC GPP. SIF GPP was found to be more consistent with MPI-BGC GPP than the NIRv GPP. The upscaled NIRv GPP was 31 % higher compared to MPI-BGC GPP for C4 grass over northern Africa. In contrast, it was lower by 42 % for shrub over southern Africa. Guanter et al. (2014) found that the MPI-BGC GPP underestimated the global crop production by 50 %–70 % compared to SIF GPP obtained by a fitting to flux-tower-based GPP from US and European croplands and grasslands; however in African grassland we found SIF GPP to be relatively lower than MIP-BGC GPP. GPP estimation from high-resolution NIRv (at 0.05∘) showed an overestimated GPP compared to MPI-BGC over most biomes.
There is substantial uncertainty in GPP estimated by terrestrial biosphere models, especially for tropical regions, particularly in regions like Africa with very few and sparse observation networks. Thus, the use of satellite fluorescence is highly valuable to completing our understanding of the global and regional carbon cycle. The mean climatology of SIF and NIRv correlates well with GPP from EC towers, confirming their value as a robust GPP proxy. Comparing SIF and NIRv with flux tower measurements from six EC flux sites in Africa, we found that SIF and NIRv can capture the seasonality of measured GPP over most sites. The relationship between SIF/NIRv and GPP was stronger (R>0.90) in C4 vegetation examined at both Sudan (SD-Dem) and Senegal (SN-Dhr) sites. SIF and NIRv were found to capture the seasonal cycle well, while MPI-BGC GPP products and the vegetation index show a saturation when production is high. A weak relationship was found for broadleaf evergreen vegetation that was examined in Ghana (GH-Ank). The tower GPP in the GH-Ank site hardly shows the presence of seasonality in GPP. In contrast, both MPI-BGC GPP and satellite fluorescence showed there is a clear seasonality in tropical rainforest GPP that follows the rainfall pattern of the region. Large uncertainties in GPP measurement from the eddy-covariance technique in tropical forests may contribute to the weak relation. The correlation that we find for the seasonal cycle of GPP and NIRv for tropical evergreen broadleaf forest GH-Ank is , whereas the agreement in the interannual variation in NIRv and GPP is higher (R=0.28 for NIRv extracted from a grid). These results are illustrative of tropical ecosystems, where GPP variations are irregular and strongly coupled to leaf phenology of vegetation.
SIF and NIRv allow us to diagnose instantaneous productivity, whereas the signals carried by atmospheric tracers contain information on longer timescales. For example, the isotopic composition of CO2 is controlled by exchange with leaf water inside plants, and the magnitude of this exchange is related to GPP. In particular, Δ17O (also known as the 17O-excess, approximately equal to δ17O–0.5×δ18O) is a promising tracer because it is less dependent on the water cycle than the more traditional tracer δ18O and easier to interpret as a tracer for GPP. The signals contained in these tracers represent larger land areas such as the African biomes that we studied here. When sufficient observations become available, these tracers have the potential to provide an additional, independent constraint on productivity across Africa.
All data used for this research are publicly available under a fair-use policy. The SIF data are available at https://doi.org/10.21944/gome2a-sifter-v2-sun-induced-fluorescence (last access: 20 February 2021) (Kooreman et al., 2020). The surface reflectance data used to calculate NIRv are accessed from https://lpdaac.usgs.gov/products/mcd43c4v006/ (last access: 10 February 2020) (Schaaf and Wang, 2015). The FLUXNET2015 datasets used in this study can be accessed from the FLUXNET data portal at https://fluxnet.org/data/fluxnet2015-dataset/ (last access: 15 February 2020). The eddy-covariance data processing guidelines are available at https://doi.org/10.1038/s41597-020-0534-3 (last access: 15 February 2020) (Pastorello et al., 2020). The MPI-BGC GPP dataset can be downloaded from https://www.bgc-jena.mpg.de/geodb/projects/Data.php (last access: 15 January 2020).
The supplement related to this article is available online at: https://doi.org/10.5194/bg-18-2843-2021-supplement.
AGM, GMT, GK, and WP conceived the study. AGM, GMT, GK, and WP processed and analyzed the data. AGM, GMT, GK, and WP wrote and reviewed the manuscript. MLK and KFB provided SIF data and commented on the manuscript. TT, JA, and YN provided FLUXNET data and commented on the manuscript. All authors discussed, revised, and approved the final manuscript.
The authors declare that they have no conflict of interest.
The authors acknowledge the NOAA Earth System Research Laboratories, Met Office Hadley Centre, Global Precipitation Climatology Centre, Global Land Data Assimilation System, MODIS dataset, and ECMWF for the data products. We would also like to acknowledge the FLUXNET data principal investigators of the GH-Ank (Ghana), ZA-Kru (South Africa), ZM-Mon (Zambia), and BR-Sa1 (Brazil) sites. The first author also acknowledges Addis Ababa University, Addis Ababa Science and Technology University, the Coimbra Group Scholarship Programme, and the University of Groningen for their support through fellowship and access to research facilities. Data were processed on Cartesius (SURFsara) using a grant for computing time (SH-312-14) from the Dutch Research Council (NWO). Jonas Ardö was supported by Lund University. We would like to thank the associate editor David Bowling and the anonymous reviewers for their constructive and thoughtful comments and suggestions that significantly improved the paper.
This research has been supported by the European Research Council (ERC) under grant no. 649087 (ASICA), by H2020 grant no. CASSECS, and by grant no. 95/15 of the Swedish National Space Board (SNSB).
This paper was edited by David Bowling and reviewed by two anonymous referees.
Abdi, A. M., Boke-Olén, N., Tenenbaum, D. E., Tagesson, T., Cappelaere, B., and Ardö, J.: Evaluating water controls on vegetation growth in the semi-arid Sahel using field and Earth observation data, Remote Sens., 9, 294, https://doi.org/10.3390/rs9030294, 2017. a
Anav, A Friedlingstein, P., Beer, C., Ciais, P., Harper A., Jones, C., Murray-Tortarolo, G., Papale, D., Parazoo, N. C., Peylin, P., Piao S., Sitch, S., Viovy, N., Wiltshire, A., and Zhao, M.: Spatiotemporal patterns of terrestrial gross primary production: A review, Rev. Geophys., 53, 785–818, https://doi.org/10.1002/2015RG000483, 2015. a
Araújo, A., Nobre, A., Kruijt, B., Elbers, J., Dallarosa, R., Stefani, P., von Randow, C., Manzi, A., Culf, A., Gash, J., Valentini, R., and Kabat, P.: Comparative measurements of carbon dioxide fluxes from two nearby towers in a central Amazonian rainforest: The Manaus LBA site, J. Geophys. Res.-Atmos., 107, 8090, https://doi.org/10.1029/2001JD000676, 2002. a
Ardö, J.: Comparison between remote sensing and a dynamic vegetation model for estimating terrestrial primary production of Africa, Carbon Balance Manage., 10, 8, https://doi.org/10.1186/s13021-015-0018-5, 2015. a
Arvor, D., Jonathan, M., Meirelles, M. S. P., Dubreuil, V., and Durieux, L.: Classification of MODIS EVI time series for crop mapping in the state of Mato Grosso, Brazil, Int. J. Remote Sens., 32, 7847–7871, https://doi.org/10.1080/01431161.2010.531783, 2011. a
Badgley, G.: The Near-infrared Reflectance of Vegetation, Ph.D. thesis, Stanford University, available at: http://purl.stanford.edu/rf586bt4473 (last access: 20 February 2021), 2019. a, b
Badgley, G., Field, C. B., and Berry, J. A.: Canopy near-infrared reflectance and terrestrial photosynthesis, Sci. Adv., 3, e1602244, https://doi.org/10.1126/sciadv.1602244, 2017. a, b, c, d
Baldocchi, D., Falge, E., Gu, L., Olson, R., Hollinger, D., Running, S., Anthoni, P., Bernhofer, C., Davis, K., Evans, R., Fuentes, J., Goldstein, A., Katul, G., Law, B., Lee, X., Malhi, Y., Meyers, T., Munger, W., Oechel, W., Paw U, K. T., Pilegaard, K., Schmid, H. P., Valentini, R., Verma, S., Vesala, T., Wilson, K., and Wofsy, S.: FLUXNET: A new tool to study the temporal and spatial variability of ecosystem-scale carbon dioxide, water vapor, and energy flux densities, B. Am. Meteorol. Soc., 82, 2415–2434, https://doi.org/10.1175/1520-0477(2001)082<2415:FANTTS>2.3.CO;2, 2001. a, b
Baldocchi, D. D., Ryu, Y., Dechant, B., Eichelmann, E., Hemes, K., Ma, S., Rey Sanchez, C., Shortt, R., Szutu, D., Valach, A., Verfaillie, J., Badgley, G., Zeng, Y., and Berry, J. A.: Outgoing near infrared radiation from vegetation scales with canopy photosynthesis across a spectrum of function, structure, physiological capacity and weather, J. Geophys. Res.-Biogeo., 125, e2019JG005534, https://doi.org/10.1029/2019jg005534, 2020. a
Ballantyne, A., Ciais, P., and Miller, J.: Cautious optimism and incremental goals toward stabilizing atmospheric CO2, Earth's Future, 6, 1632–1637, https://doi.org/10.1029/2018EF001012, 2018. a
Beer, C., Reichstein, M., Tomelleri, E., Ciais, P., Jung, M., Carvalhais, N., Rödenbeck, C., Arain, M. A., Baldocchi, D., Bonan, G. B., Bondeau, A., Cescatti, A., Lasslop, G., Lindroth, A., Lomas, M., Luyssaert, S., Margolis, H., Oleson, K. W., Roupsard, O., Veenendaal, E., Viovy, N., Williams, C., Woodward, F. I., and Papale, D.: Terrestrial gross carbon dioxide uptake: global distribution and covariation with climate, Science, 329, 834–838, https://doi.org/10.1126/science.1184984, 2010. a, b
Bhattacharya, A.: Changing Climate and Resource Use Efficiency in Plants, Academic Press, https://doi.org/10.1016/C2017-0-04681-5, 2018. a
Bonal, D., Burban, B., Stahl, C., Wagner, F., and Hérault, B.: The response of tropical rainforests to drought-lessons from recent research and future prospects, Ann. Forest Sci., 73, 27–44, https://doi.org/10.1007/s13595-015-0522-5, 2016. a
Ceccato, P., Flasse, S., Tarantola, S., Jacquemoud, S., and Grégoire, J.-M.: Detecting vegetation leaf water content using reflectance in the optical domain, Remote Sens. Environ., 77, 22–33, https://doi.org/10.1016/S0034-4257(01)00191-2, 2001. a
Chambers, J. Q., Tribuzy, E. S., Toledo, L. C., Crispim, B. F., Higuchi, N., dos Santos, J., Araújo, A. C., Kruijt, B., Nobre, A. D., and Trumbore, S. E.: Respiration from a Tropical Forest Ecosystem: Partitioning of Sources and Low Carbon Use Efficiency, Ecol. Appl., 14, 72–88, https://doi.org/10.1890/01-6012, 2004. a
Chen, X., Mo, X., Zhang, Y., Sun, Z., Liu, Y., Hu, S., and Liu, S.: Drought detection and assessment with solar-induced chlorophyll fluorescence in summer maize growth period over North China Plain, Ecol. Ind., 104, 347–356, https://doi.org/10.1016/j.ecolind.2019.05.017, 2019. a
Ciais, P., Piao, S.-L., Cadule, P., Friedlingstein, P., and Chédin, A.: Variability and recent trends in the African terrestrial carbon balance, Biogeosciences, 6, 1935–1948, https://doi.org/10.5194/bg-6-1935-2009, 2009. a
Ciais, P., Bombelli, A., Williams, M., Piao, S., Chave, J., Ryan, C., Henry, M., Brender, P., and Valentini, R.: The carbon balance of Africa: synthesis of recent research studies, Philos. T. Roy. Soc. A., 369, 2038–2057, https://doi.org/10.1098/rsta.2010.0328, 2011. a
Cox, P., Pearson, D., Booth, B., Friedlingstein, P., Huntingford, C., Jones, C., and Luke, C.: Carbon dioxide variability constrains the sensitivity of tropical carbon to climate change, Nature, 494, 341–344, https://doi.org/10.1038/nature11882, 2013. a
Damm, A., Guanter, L., Paul-Limoges, E., Van der Tol, C., Hueni, A., Buchmann, N., Eugster, W., Ammann, C., and Schaepman, M. E.: Far-red sun-induced chlorophyll fluorescence shows ecosystem-specific relationships to gross primary production: An assessment based on observational and modeling approaches, Remote Sens. Environ., 166, 91–105, https://doi.org/10.1016/j.rse.2015.06.004, 2015. a
Dechant, B., Ryu, Y., Badgley, G., Zeng, Y., Berry, J. A., Zhang, Y., Goulas, Y., Li, Z., Zhang, Q., Kang, M., Li, J., and Moya, I.: Canopy structure explains the relationship between photosynthesis and sun-induced chlorophyll fluorescence in crops, Remote Sens. Environ., 241, 111733, https://doi.org/10.1016/j.rse.2020.111733, 2020. a
Doughty, R., Köhler, P., Frankenberg, C., Magney, T. S., Xiao, X., Qin, Y., Wu, X., and Moore, B.: TROPOMI reveals dry-season increase of solar-induced chlorophyll fluorescence in the Amazon forest, P. Natl. Acad. Sci. USA, 116, 22393–22398, https://doi.org/10.1073/pnas.1908157116, 2019. a, b, c
Fisher, J. B., Sikka, M., Sitch, S., Ciais, P., Poulter, B., Gal- braith, D., Lee, J.-E., Huntingford, C., Viovy, N., Zeng, N., Ahlström, A., Lomas, M. R., Levy, P. E., Frankenberg, C., Saatchi, S., and Malhi Y.: African tropical rainforest net carbon dioxide fluxes in the twentieth century, Philos. T. Roy. Soc. B, 368, 20120376, https://doi.org/10.1098/rstb.2012.0376, 2013. a, b
Frankenberg, C., O'Dell, C., Berry, J., Guanter, L., Joiner, J., Köhler, P., Pollock, R., and Taylor, T. E.: Prospects for chlorophyll fluorescence remote sensing from the Orbiting Carbon Observatory-2, Remote Sens. Environ., 147, 1–12, https://doi.org/10.1016/j.rse.2014.02.007, 2014. a
Friedlingstein, P., Jones, M. W., O'Sullivan, M., Andrew, R. M., Hauck, J., Peters, G. P., Peters, W., Pongratz, J., Sitch, S., Le Quéré, C., Bakker, D. C. E., Canadell, J. G., Ciais, P., Jackson, R. B., Anthoni, P., Barbero, L., Bastos, A., Bastrikov, V., Becker, M., Bopp, L., Buitenhuis, E., Chandra, N., Chevallier, F., Chini, L. P., Currie, K. I., Feely, R. A., Gehlen, M., Gilfillan, D., Gkritzalis, T., Goll, D. S., Gruber, N., Gutekunst, S., Harris, I., Haverd, V., Houghton, R. A., Hurtt, G., Ilyina, T., Jain, A. K., Joetzjer, E., Kaplan, J. O., Kato, E., Klein Goldewijk, K., Korsbakken, J. I., Landschützer, P., Lauvset, S. K., Lefèvre, N., Lenton, A., Lienert, S., Lombardozzi, D., Marland, G., McGuire, P. C., Melton, J. R., Metzl, N., Munro, D. R., Nabel, J. E. M. S., Nakaoka, S.-I., Neill, C., Omar, A. M., Ono, T., Peregon, A., Pierrot, D., Poulter, B., Rehder, G., Resplandy, L., Robertson, E., Rödenbeck, C., Séférian, R., Schwinger, J., Smith, N., Tans, P. P., Tian, H., Tilbrook, B., Tubiello, F. N., van der Werf, G. R., Wiltshire, A. J., and Zaehle, S.: Global Carbon Budget 2019, Earth Syst. Sci. Data, 11, 1783–1838, https://doi.org/10.5194/essd-11-1783-2019, 2019. a
Gaubert, B., Stephens, B. B., Basu, S., Chevallier, F., Deng, F., Kort, E. A., Patra, P. K., Peters, W., Rödenbeck, C., Saeki, T., Schimel, D., Van der Laan-Luijkx, I., Wofsy, S., and Yin, Y.: Global atmospheric CO2 inverse models converging on neutral tropical land exchange, but disagreeing on fossil fuel and atmospheric growth rate, Biogeosciences, 16, 117–134, https://doi.org/10.5194/bg-16-117-2019, 2019. a
Gebrechorkos, S. H., Hülsmann, S., and Bernhofer, C.: Long-term trends in rainfall and temperature using high-resolution climate datasets in East Africa, Sci. Rep., 9, 1–9, https://doi.org/10.1038/s41598-019-47933-8, 2019. a
Girardin, C. A., Malhi, Y., Doughty, C. E., Metcalfe, D. B., Meir, P., del Aguila-Pasquel, J., Araujo-Murakami, A., da Costa, A. C., Silva-Espejo, J. E., Farfan Amezquita, F., and Rowland, L.: Seasonal trends of Amazonian rainforest phenology, net primary productivity, and carbon allocation, Glob. Biogeochem. Cy., 30, 700–715, https://doi.org/10.1002/2015GB005270, 2016. a
Guanter, L., Zhang, Y., Jung, M., Joiner, J., Voigt, M., Berry, J. A., Frankenberg, C., Huete, A. R., Zarco-Tejada, P., Lee, J.-E., Moran, M. S., Ponce-Campos, G., Beer, C., Camps-Valls, G., Buchmann, N., Gianelle, D., Klumpp, K., Cescatti, A., Baker, J. M., and Griffis T. J.: Global and time-resolved monitoring of crop photosynthesis with chlorophyll fluorescence, P. Natl. Acad. Sci. USA, 111, 1327–1333, https://doi.org/10.1073/pnas.1320008111, 2014. a, b, c
Hayek, M. N., Wehr, R., Longo, M., Hutyra, L. R., Wiedemann, K., Munger, J. W., Bonal, D., Saleska, S. R., Fitzjarrald, D. R., and Wofsy, S. C.: A novel correction for biases in forest eddy covariance carbon balance, Agr. Forest Meteorol., 250, 90–101, https://doi.org/10.1016/j.agrformet.2017.12.186, 2018. a
Hew, C.-S., Krotkov, G., and Canvin, D. T.: Effects of temperature on photosynthesis and CO2 evolution in light and darkness by green leaves, Plant Physiol., 44, 671–677, https://doi.org/10.1104/pp.44.5.671, 1969. a
Hollinger, D., Goltz, S., Davidson, E., Lee, J., Tu, K., and Valentine, H.: Seasonal patterns and environmental control of carbon dioxide and water vapour exchange in an ecotonal boreal forest, Global Change Biol., 5, 891–902, https://doi.org/10.1046/j.1365-2486.1999.00281.x, 1999. a
Huang, X., Xiao, J., and Ma, M.: Evaluating the Performance of Satellite-Derived Vegetation Indices for Estimating Gross Primary Productivity Using FLUXNET Observations across the Globe, Remote Sens., 11, 1823, https://doi.org/10.3390/rs11151823, 2019. a
Huete, A., Didan, K., Miura, T., Rodriguez, E. P., Gao, X., and Ferreira, L. G.: Overview of the radiometric and biophysical performance of the MODIS vegetation indices, Remote Sens. Environ., 83, 195–213, https://doi.org/10.1016/S0034-4257(02)00096-2, 2002. a, b
Huete, A. R., Didan, K., Shimabukuro, Y. E., Ratana, P., Saleska, S. R., Hutyra, L. R., Yang, W., Nemani, R. R., and Myneni, R.: Amazon rainforests green-up with sunlight in dry season, Geophys. Res. Lett., 33, L06405, https://doi.org/10.1029/2005GL025583, 2006. a
Jiang, C. and Ryu, Y.: Multi-scale evaluation of global gross primary productivity and evapotranspiration products derived from Breathing Earth System Simulator (BESS), Remote Sens. Environ., 186, 528–547, https://doi.org/10.1016/j.rse.2016.08.030, 2016. a
Jung, M., Reichstein, M., Margolis, H. A., Cescatti, A., Richardson, A. D., Arain, M. A., Arneth, A., Bernhofer, C., Bonal, D., Chen, J., Gianelle, D., Gobron, N., Kiely, G., Kutsch, W., Lasslop, G., Law, B. E., Lindroth, A., Merbold, L., Montagnani, L., Moors, E. J., Papale, D., Sottocornola, M., Vaccari, F., and Williams, C.: Global patterns of land-atmosphere fluxes of carbon dioxide, latent heat, and sensible heat derived from eddy covariance, satellite, and meteorological observations, J. Geophys. Res.-Biogeo., 116, G00J07, https://doi.org/10.1029/2010JG001566, 2011. a
Köhler, P., Frankenberg, C., Magney, T. S., Guanter, L., Joiner, J., and Landgraf, J.: Global retrievals of solar-induced chlorophyll fluorescence with TROPOMI: First results and intersensor comparison to OCO-2, Geophys. Res. Lett., 45, 10–456, https://doi.org/10.1029/2018GL079031, 2018. a
Kong, F., Li, X., Wang, H., Xie, D., Li, X., and Bai, Y.: Land cover classification based on fused data from GF-1 and MODIS NDVI time series, Remote Sens., 8, 741, https://doi.org/10.3390/rs8090741, 2016. a
Kooreman, M., Boersma, K., van Schaik, E., van Versendaal, R., Cacciari, A., and Tuinder, O.: SIFTER sun-induced vegetation fluorescence data from GOME-2A (version 2.0) (Data set), Royal Netherlands Meteorological Institute (KNMI), available at: https://www.temis.nl/surface/sif.php, last access: 15 February 2020. a
Koren, G., van Schaik, E., Araújo, A. C., Boersma, K. F., Gärtner, A., Killaars, L., Kooreman, M. L., Kruijt, B., van der Laan-Luijkx, I. T., von Randow, C., Smith, N. E., and Peters, W.: Widespread reduction in sun-induced fluorescence from the Amazon during the 2015/2016 El Niño, Philos. T. Roy. Soc. B, 373, 20170408, https://doi.org/10.1098/rstb.2017.0408, 2018. a, b, c
Kruijt, B., Elbers, J., von Randow, C., Araújo, A., Oliveira, P., Culf, A., Manzi, A., Nobre, A., Kabat, P., and Moors, E.: The robustness of eddy correlation fluxes for Amazon rain forest conditions, Ecol. Appl., 14, 101–113, https://doi.org/10.1890/02-6004, 2004. a
Lasslop, G., Migliavacca, M., Bohrer, G., Reichstein, M., Bahn, M., Ibrom, A., Jacobs, C., Kolari, P., Papale, D., Vesala, T., Wohlfahrt, G., and Cescatti, A.: On the choice of the driving temperature for eddy-covariance carbon dioxide flux partitioning, Biogeosciences, 9, 5243–5259, https://doi.org/10.5194/bg-9-5243-2012, 2012. a
Lee, J.-E., Frankenberg, C., van der Tol, C., Berry, J. A., Guanter, L., Boyce, C. K., Fisher, J. B., Morrow, E., Worden, J. R., Asefi, S., Badgley, G., and Saatchi, S.: Forest productivity and water stress in Amazonia: Observations from GOSAT chlorophyll fluorescence, P. R. Soc. B., 280, 20130171, https://doi.org/10.1098/rspb.2013.0171, 2013. a
Li, X., Xiao, J., He, B., Altaf Arain, M., Beringer, J., Desai, A. R., Emmel, C., Hollinger, D. Y., Krasnova, A., Mammarella, I., Noe, S. M., Ortiz, P. S., Rey-Sanchez, A. C., Rocha, A. V., and Varlagin A.: Solar-induced chlorophyll fluorescence is strongly correlated with terrestrial photosynthesis for a wide variety of biomes: First global analysis based on OCO-2 and flux tower observations, Glob. Change Biol., 24, 3990–4008, https://doi.org/10.1111/gcb.14297, 2018. a, b
Lopes, A. P., Nelson, B. W., Wu, J., de Alencastro Graça, P. M. L., Tavares, J. V., Prohaska, N., Martins, G. A., and Saleska, S. R.: Leaf flush drives dry season green-up of the Central Amazon, Remote Sens. Environ., 182, 90–98, https://doi.org/10.1016/j.rse.2016.05.009, 2016. a
Luus, K., Commane, R., Parazoo, N., Benmergui, J., Euskirchen, E., Frankenberg, C., Joiner, J., Lindaas, J., Miller, C., Oechel, W., Zona, D., Wofsy, S., and Lin, J.: Tundra photosynthesis captured by satellite-observed solar-induced chlorophyll fluorescence, Geophys. Res. Lett., 44, 1564–1573, https://doi.org/10.1002/2016GL070842, 2017. a, b
Mengistu, A. G. and Mengistu Tsidu, G.: On the performance of satellite-based observations of XCO2 in capturing the NOAA Carbon Tracker model and ground-based flask observations over Africa's land mass, Atmos. Meas. Tech., 13, 4009–4033, https://doi.org/10.5194/amt-13-4009-2020, 2020. a
Mercado, L., Lloyd, J., Carswell, F., Malhi, Y., Meir, P., and Nobre, A. D.: Modelling Amazonian forest eddy covariance data: a comparison of big leaf versus sun/shade models for the C-14 tower at Manaus I. Canopy photosynthesis, Acta Amazon., 36, 69–82, https://doi.org/10.1590/S0044-59672006000100009, 2006. a
Miller, S. D., Goulden, M. L., Menton, M. C., da Rocha, H. R., de Freitas, H. C., Figueira, A. M. E. S., and Dias de Sousa, C. A.: Biometric and micrometeorological measurements of tropical forest carbon balance, Ecol. Appl., 14, 114–126, https://doi.org/10.1890/02-6005, 2004. a
Monteith, J.: Solar radiation and productivity in tropical ecosystems, J. Appl. Ecol., 9, 747–766, https://doi.org/10.2307/2401901, 1972. a
Ngomanda, A., Neumann, K., Schweizer, A., and Maley, J.: Seasonality change and the third millennium BP rainforest crisis in southern Cameroon (Central Africa), Quat. Res., 71, 307–318, https://doi.org/10.1016/j.yqres.2008.12.002, 2009. a
Norton, A. J., Rayner, P. J., Koffi, E. N., Scholze, M., Silver, J. D., and Wang, Y.-P.: Estimating global gross primary productivity using chlorophyll fluorescence and a data assimilation system with the BETHY-SCOPE model, Biogeosciences Discuss. [preprint], https://doi.org/10.5194/bg-2018-270, in review, 2018. a
O'Dell, C. W., Eldering, A., Wennberg, P. O., Crisp, D., Gunson, M. R., Fisher, B., Frankenberg, C., Kiel, M., Lindqvist, H., Mandrake, L., Merrelli, A., Natraj, V., Nelson, R. R., Osterman, G. B., Payne, V. H., Taylor, T. E., Wunch, D., Drouin, B. J., Oyafuso, F., Chang, A., McDuffie, J., Smyth, M., Baker, D. F., Basu, S., Chevallier, F., Crowell, S. M. R., Feng, L., Palmer, P. I., Dubey, M., García, O. E., Griffith, D. W. T., Hase, F., Iraci, L. T., Kivi, R., Morino, I., Notholt, J., Ohyama, H., Petri, C., Roehl, C. M., Sha, M. K., Strong, K., Sussmann, R., Te, Y., Uchino, O., and Velazco, V. A.: Improved retrievals of carbon dioxide from Orbiting Carbon Observatory-2 with the version 8 ACOS algorithm, Atmos. Meas. Tech., 11, 6539–6576, https://doi.org/10.5194/amt-11-6539-2018, 2018. a
Palmer, P. I., Feng, L., Baker, D., Chevallier, F., Bösch, H., and Somkuti, P.: Net carbon emissions from African biosphere dominate pan-tropical atmospheric CO2 signal, Nat. Commun., 10, 1–9, https://doi.org/10.1038/s41467-019-11097-w, 2019. a
Pastorello, G., Trotta, C., Canfora, E., Chu, H., Christianson, D., Cheah, Y.-W., Poindexter, C., Chen, J., Elbashandy, A., Humphrey, M., et al.: The FLUXNET2015 dataset and the ONEFlux processing pipeline for eddy covariance data, Sci. Data, 7, 1–27, https://doi.org/10.1038/s41597-020-0534-3, 2020. a
Peters-Lidard, C. D., Houser, P. R., Tian, Y., Kumar, S. V., Geiger, J., Olden, S., Lighty, L., Doty, B., Dirmeyer, P., Adams, J., Mitchell, K., Wood, F., and Sheffield, J.: High-performance Earth system modeling with NASA/GSFC's Land Information System, Innovations in Systems and Software Engineering, 3, 157–165, https://doi.org/10.1007/s11334-007-0028-x, 2007. a, b
Peylin, P., Law, R. M., Gurney, K. R., Chevallier, F., Jacobson, A. R., Maki, T., Niwa, Y., Patra, P. K., Peters, W., Rayner, P. J., Rödenbeck, C., van der Laan-Luijkx, I. T., and Zhang, X.: Global atmospheric carbon budget: results from an ensemble of atmospheric CO2 inversions, Biogeosciences, 10, 6699–6720, https://doi.org/10.5194/bg-10-6699-2013, 2013. a
Porcar-Castell, A., Tyystjärvi, E., Atherton, J., Van der Tol, C., Flexas, J., Pfündel, E. E., Moreno, J., Frankenberg, C., and Berry, J. A.: Linking chlorophyll a fluorescence to photosynthesis for remote sensing applications: mechanisms and challenges, J. Exp. Botany, 65, 4065–4095, https://doi.org/10.1093/jxb/eru191, 2014. a, b
Reichstein, M., Falge, E., Baldocchi, D., Papale, D., Aubinet, M., Berbigier, P., Bernhofer, C., Buchmann, N., Gilmanov, T., Granier, A., Grünwald, T., Havránková, K., Ilvesniemi, H., Janous, D., Knohl, A., Laurila, T., Lohila, A., Loustau, D., Matteucci G., Meyers, T., Miglietta, F., Ourcival, J-M., Pumpanen, J., Rambal, S., Rotenberg, E., Sanz, M., Tenhunen , J., Seufert, G., Vaccari, F., Vesala, T., Yakir, D., and Valentini, R.: On the separation of net ecosystem exchange into assimilation and ecosystem respiration: review and improved algorithm, Glob. Change Biol., 11, 1424–1439, https://doi.org/10.1111/j.1365-2486.2005.001002.x, 2005. a, b
Restrepo-Coupe, N., da Rocha, H. R., Hutyra, L. R., da Araujo, A. C., Borma, L. S., Christoffersen, B., Cabral, O. M., de Camargo, P. B., Cardoso, F. L., da Costa, A. C. L., Fitzjarrald, D. R., Goulden, M. l., Kruijt, B., Maiai, J. M.F., Malhim, Y. S., Manzi, A. O., Miller, S. D., Nobre, A. D., and Saleska, S. R.: What drives the seasonality of photosynthesis across the Amazon basin? A cross-site analysis of eddy flux tower measurements from the Brasil flux network, Agr. Forest Meteorol., 182, 128–144, https://doi.org/10.1016/j.agrformet.2013.04.031, 2013. a, b, c, d
Restrepo-Coupe, N., Levine, N. M., Christoffersen, B. O., Albert, L. P.,Wu, J., Costa, M. H., Galbraith, D., Imbuzeiro, H., Martins, G., da Araujo, A. C., Malhi, Y. S., Zeng, X., Moorcroft, P., and Saleska, S. R.: Do dynamic global vegetation models capture the seasonality of carbon fluxes in the Amazon basin?, A data-model intercomparison, Glob. Change Biol., 23, 191–208, https://doi.org/10.1111/gcb.13442, 2017. a, b
Schaaf, C. and Wang, Z.: MCD43C4 MODIS/Terra+Aqua BRDF/Albedo Nadir BRDF-Adjusted Ref Daily L3 Global 0.05Deg CMG V006 [Data set], NASA EOSDIS Land Processes DAAC, https://doi.org/10.5067/MODIS/MCD43C4.006, 2015. a, b
Schaefer, K., Collatz, G. J., Tans, P., Denning, A. S., Baker, I., Berry, J., Prihodko, L., Suits, N., and Philpott, A.: Combined simple biosphere/Carnegie-Ames-Stanford approach terrestrial carbon cycle model, J. Geophys. Res.-Biogeo., 113, G03034, https://doi.org/10.1029/2007JG000603, 2008. a
Schimel, D., Pavlick, R., Fisher, J. B., Asner, G. P., Saatchi, S., Townsend, P., Miller, C., Frankenberg, C., Hibbard, K., and Cox, P.: Observing terrestrial ecosystems and the carbon cycle from space, Global Change Biol., 21, 1762–1776, https://doi.org/10.1111/gcb.12822, 2015. a
Singarayer, J. S., Valdes, P. J., and Roberts, W. H.: Ocean dominated expansion and contraction of the late Quaternary tropical rainbelt, Sci. Rep., 7, 1–9, https://doi.org/10.1038/s41598-017-09816-8, 2017. a
Stephenson, N. L.: Climatic control of vegetation distribution: the role of the water balance, The American Naturalist, 135, 649–670, https://doi.org/10.1086/285067, 1990. a
Stocker, B. D., Zscheischler, J., Keenan, T. F., Prentice, I. C., Seneviratne, S. I., and Peñuelas, J.: Drought impacts on terrestrial primary production underestimated by satellite monitoring, Nat. Geosci., 12, 264–270, https://doi.org/10.1038/s41561-019-0318-6, 2019. a
Sun, Y., Frankenberg, C., Wood, J. D., Schimel, D. S., Jung, M., Guanter, L., Drewry, D., Verma, M., Porcar-Castell, A., Griffis, T. J., Gu, L., Magney, T. S., Köhler, P., Evans, B., and Yuen, K.: OCO-2 advances photosynthesis observation from space via solar-induced chlorophyll fluorescence, Science, 358, eaam5747, https://doi.org/10.1126/science.aam5747, 2017. a
Tang, H. and Dubayah, R.: Light-driven growth in Amazon evergreen forests explained by seasonal variations of vertical canopy structure, P. Natl. Acad. Sci. USA, 114, 2640–2644, https://doi.org/10.1073/pnas.1616943114, 2017. a
Tian, F., Wu, J., Liu, L., Leng, S., Yang, J., Zhao, W., and Shen, Q.: Exceptional Drought across Southeastern Australia Caused by Extreme Lack of Precipitation and Its Impacts on NDVI and SIF in 2018, Remote Sens., 12, 54, https://doi.org/10.3390/rs12010054, 2020. a
Turner, A. J., Köhler, P., Magney, T. S., Frankenberg, C., Fung, I., and Cohen, R. C.: A double peak in the seasonality of California's photosynthesis as observed from space, Biogeosciences, 17, 405–422, https://doi.org/10.5194/bg-17-405-2020, 2020. a
van Schaik, E., Killaars, L., Smith, N. E., Koren, G., van Beek, L., Peters, W., and van der Laan-Luijkx, I. T.: Changes in surface hydrology, soil moisture and gross primary production in the Amazon during the 2015/2016 El Niño, Philos. T. Roy. Soc. B, 373, 20180084, https://doi.org/10.1098/rstb.2018.0084, 2018. a
van Schaik, E., Kooreman, M. L., Stammes, P., Tilstra, L. G., Tuinder, O. N. E., Sanders, A. F. J., Verstraeten, W. W., Lang, R., Cacciari, A., Joiner, J., Peters, W., and Boersma, K. F.: Improved SIFTER v2 algorithm for long-term GOME-2A satellite retrievals of fluorescence with a correction for instrument degradation, Atmos. Meas. Tech., 13, 4295–4315, https://doi.org/10.5194/amt-13-4295-2020, 2020. a, b, c
Vermote, E., El Saleous, N., Justice, C., Kaufman, Y., Privette, J., Remer, L., Roger, J., and Tanre, D.: Atmospheric correction of visible to middle-infrared EOS-MODIS data over land surfaces: Background, operational algorithm and validation, J. Geophys. Res.-Atmos., 102, 17131–17141, https://doi.org/10.1029/97JD00201, 1997. a
Vincens, A., Garcin, Y., and Buchet, G.: Influence of rainfall seasonality on African lowland vegetation during the Late Quaternary: pollen evidence from Lake Masoko, Tanzania, J. Biogeogr., 34, 1274–1288, https://doi.org/10.1111/j.1365-2699.2007.01698.x, 2007. a
Vuichard, N. and Papale, D.: Filling the gaps in meteorological continuous data measured at FLUXNET sites with ERA-Interim reanalysis, Earth Syst. Sci. Data, 7, 157–171, https://doi.org/10.5194/essd-7-157-2015, 2015. a
Wang, X., Dannenberg, M. P., Yan, D., Jones, M. O., Kimball, J. S., Moore, D. J., van Leeuwen, W. J., Didan, K., and Smith, W. K.: Globally consistent patterns of asynchrony in vegetation phenology derived from optical, microwave, and fluorescence satellite data, J. Geophys. Res.-Biogeo., 125, e2020JG005732, https://doi.org/10.1029/2020JG005732, 2020. a
Williams, C., Hanan, N., Neff, J., Scholes, R., Berry, J., Denning, A., and Baker, D.: Africa and global carbon cycle, Carbon Balance Manage., 2, 1–13, https://doi.org/10.1186/1750-0680-2-3, 2007. a, b
Xiao, X., Zhang, Q., Hollinger, D., Aber, J., and Moore III, B.: Modeling gross primary production of an evergreen needleleaf forest using MODIS and climate data, Ecol. Appl., 15, 954–969, https://doi.org/10.1890/04-0470, 2005. a
Xiao, X., Hagen, S., Zhang, Q., Keller, M., and Moore III, B.: Detecting leaf phenology of seasonally moist tropical forests in South America with multi-temporal MODIS images, Remote Sens. Environ., 103, 465–473, https://doi.org/10.1016/j.rse.2006.04.013, 2006. a
Zeng, Y., Badgley, G., Dechant, B., Ryu, Y., Chen, M., and Berry, J. A.: A practical approach for estimating the escape ratio of near-infrared solar-induced chlorophyll fluorescence, Remote Sens. Environ., 232, 111209, https://doi.org/10.1016/j.rse.2019.05.028, 2019. a, b, c, d