the Creative Commons Attribution 4.0 License.
the Creative Commons Attribution 4.0 License.
 | 18 Jun 2021
The impact of the freeze–melt cycle of land-fast ice on the distribution of dissolved organic matter in the Laptev and East Siberian seas (Siberian Arctic)
Bennet Juhls
Dorothea Bauch
Markus Janout
Boris P. Koch
Birgit Heim
Permafrost degradation in the catchment of major Siberian rivers, combined with higher precipitation in a warming climate, could increase the flux of terrestrially derived dissolved organic matter (tDOM) into the Arctic Ocean (AO). Each year, ∼ 7.9 Tg of dissolved organic carbon (DOC) is discharged into the AO via the three largest rivers that flow into the Laptev Sea (LS) and East Siberian Sea (ESS). A significant proportion of this tDOM-rich river water undergoes at least one freeze–melt cycle in the land-fast ice that forms along the coast of the Laptev and East Siberian seas in winter. To better understand how growth and melting of land-fast ice affect dissolved organic matter (DOM) dynamics in the LS and ESS, we determined DOC concentrations and the optical properties of coloured dissolved organic matter (CDOM) in sea ice, river water and seawater. The data set, covering different seasons over a 9-year period (2010–2019), was complemented by oceanographic measurements (T, S) and determination of the oxygen isotope composition of the seawater.
Although removal of tDOM cannot be ruled out, our study suggests that conservative mixing of high-tDOM river water and sea-ice meltwater with low-tDOM seawater is the major factor controlling the surface distribution of tDOM in the LS and ESS. A case study based on data from winter 2012 and spring 2014 reveals that the mixing of about 273 km3 of low-tDOM land-fast-ice meltwater (containing ∼ 0.3 Tg DOC) with more than 200 km3 of high-tDOM Lena River water discharged during the spring freshet (∼ 2.8 Tg DOC yr−1) plays a dominant role in this respect. The mixing of the two low-salinity surface water masses is possible because the meltwater and the river water of the spring freshet flow into the southeastern LS at the same time every year (May–July). In addition, budget calculations indicate that in the course of the growth of land-fast ice in the southeastern LS, ∼ 1.2 Tg DOC yr−1 (± 0.54 Tg) can be expelled from the growing ice in winter, together with brines. These DOC-rich brines can then be transported across the shelves into the Arctic halocline and the Transpolar Drift Current flowing from the Siberian Shelf towards Greenland.
The study of dissolved organic matter dynamics in the AO is important not only to decipher the Arctic carbon cycle but also because CDOM regulates physical processes such as radiative forcing in the upper ocean, which has important effects on sea surface temperature, water column stratification, biological productivity and UV penetration.
- Article
(3959 KB) - Full-text XML
- BibTeX
- EndNote


The mean annual air temperature in the Arctic continues to rise (Overland et al., 2019), resulting in a rapid decrease in summer sea-ice extent and volume (Stroeve and Notz, 2018) and, consequently, a longer ice-free season. Furthermore, the terrestrial permafrost temperature is increasing (Biskaborn et al., 2019) with major implications for the Arctic carbon cycle. Due to the accelerated degradation of terrestrial permafrost, an estimated 1035 ± 150 Pg of organic carbon stored in the upper 3 m of circumpolar permafrost soils (Hugelius et al., 2014) can be either mineralised and mobilised as terrestrial dissolved organic matter (tDOM) into the hydrosphere or released as gaseous emissions into the atmosphere (Plaza et al., 2019). The release of soil carbon into the hydrosphere in combination with an increasing freshwater discharge from Arctic rivers (McClelland et al., 2004; Rawlins et al. 2010; Haine et al., 2015) might thus increase the flux of tDOM into the ocean (Frey and Smith, 2005; Guo et al., 2007; Prokushkin et al., 2011; Tank et al., 2016). Changes in the land–ocean fluxes of tDOM in the Arctic are of particular importance for the global carbon cycle since the rivers at high northern latitudes export significant quantities of tDOM to the Arctic Ocean (AO). Dissolved organic matter (DOM) is typically quantified via its carbon content (dissolved organic carbon; DOC), which contributes roughly half to the total mass of DOM. Currently, the annual riverine input of DOC into the AO is about 25–36 Tg C yr−1 (Raymond et al., 2007; Anderson and Amon, 2015), with the six largest Arctic rivers discharging about 18–20 Tg C yr−1 (Stedmon et al., 2011; Amon et al., 2012). The three major Siberian river systems (Ob, Yenisey and Lena) account for about 14 Tg C yr−1 (Holmes et al., 2012), with the Lena River alone discharging 6.8 Tg C yr−1 DOC into the Siberian Laptev Sea (LS) (Juhls et al., 2020). The total riverine DOC flux to the LS is about 8.3 Tg C yr−1 (Manizza et al., 2009), with the Lena drainage basin (2.61×10⁶ km2) accounting for about 70 % of the total area of the LS watershed. The LS additionally receives freshwater from the outflow of the Kara Sea (KS), which transports river water from Ob and Yenisey through the Vilkitsky Strait into the northwestern LS (Janout et al., 2015). The combined DOC flux of the two major rivers discharging to the East Siberian Sea (ESS; Kolyma and Indigirka) is ∼ 1.1 Tg DOC yr−1 (Opsahl et al., 1999), which is ∼ 50 % of the total annual riverine DOC flux to the ESS (Manizza et al., 2009). The combined area of the drainage basin of the rivers Kolyma and Indigirka (1.01×10⁶ km2) accounts for ∼ 75 % of the total ESS watershed.
The terrigenous input (particulate and dissolved) of carbon by coastal erosion to the entire AO is estimated to be 15.4 Tg yr−1 (9.2–24.2 Tg yr−1 with 1 standard deviation; Terhaar et al., 2021). However, DOC concentrations measured in Guba Buor-Khaya bay east of the Lena Delta, a region known for the most rapid and extensive coastal erosion of the Siberian Arctic coastline, suggest that direct DOC input from coastal erosion must be small compared to the riverine DOC flux (Alling et al., 2010).
If the input of tDOM into the AO increases as a consequence of climate change, it is crucial to achieve a better understanding of tDOM transport dynamics and biogeochemical cycles. Previous studies in the Arctic marginal seas have reported a strong negative linear relationship between salinity and DOC, which implies that tDOM-rich river water mixes with DOM-poor marine waters from the AO without significant losses and gains along the salinity gradient (i.e. conservative mixing) (Kattner et al., 1999; Köhler et al., 2003; Amon, 2004; Amon and Meon, 2004; Shin and Tanaka, 2004; Gueguen et al., 2005; Matsuoka et al., 2012; Pugach and Pipko, 2013; Pavlov et al., 2016; Tanaka et al., 2016; Pugach et al., 2018). In contrast, a number of studies indicate significant degradation of tDOM in the Arctic Ocean (Belanger et al., 2006; Alling et al., 2010; Stedmon et al., 2011; Letscher et al., 2011; Kaiser et al., 2017a), the Fram Strait (Granskog et al., 2012) and Hudson Bay (Granskog et al., 2009; Granskog, 2012). One reason for the partly contradictory observations could be the extreme seasonality in the discharge of Arctic rivers and the associated high variability in the tDOM concentrations and composition. In the course of the peak spring discharge (spring freshet), which has the highest annual tDOM concentrations, about half of the annual tDOM is exported to the AO (Cauwet and Sidorov, 1996; Stedmon et al., 2011; Holmes et al., 2012). In summer, autumn and winter, tDOM concentrations in Arctic rivers are significantly lower (Stedmon et al., 2011; Juhls et al., 2020). Several studies have shown that tDOM discharged during the spring freshet displays a different chemical composition and a higher biological and photochemical lability compared to the summer discharge (Osburn et al., 2009; Amon et al., 2012; Mann et al., 2012; Kaiser et al., 2017b). This could lead to tDOM degradation of 20 %–40 % within less than 1 month during the spring freshet (Holmes et al., 2008). Therefore, seasonal changes in tDOM composition and lability are another possible explanation for the observed variability in degradation rates.
Considering the high seasonal variability in input and chemical composition of tDOM and a predicted strong degradation of tDOM that is controlled by multiple processes, it appears puzzling that most studies in the LS have observed a conservative mixing of tDOM. This is especially true since the sea-ice growth–melt cycle in the Siberian shelf seas, which has a significant influence on the salinity–tDOM relationship (Anderson and Amon, 2015), should lead to much greater variability in tDOM concentrations along the salinity gradient. During sea-ice growth, DOM is expelled from ice crystals and concentrates in brines, which can then drain into the underlying seawater (Müller et al., 2013). The DOM remaining in the ice undergoes significant fractionation. The humic-like DOM fraction is most prone to rejection from the sea ice along with the brine during freezing, while the protein-like fraction is least prone to this process, which shifts the molecular composition of DOM in the ice towards a higher proportion of low molecular weight compounds (Müller et al., 2013; Granskog et al., 2015a; Retelletti-Brogi et al., 2018, Zabłocka et al., 2020). On the other hand, melting of CDOM-poor drifting pack ice (Kowalczuk et al., 2017) or immobile land ice (Wegner et al., 2017) is also important because it provides a low-salinity source that can dilute higher DOM concentrations in the surrounding seawater (Amon, 2004; Mathis et al., 2005; Granskog et al., 2015b; Logvinova et al., 2016; Tanaka et al., 2016).
At the end of winter, the LS shelf north of the land-fast ice (Fig. 1) is covered by large areas of open water (polynyas) and thin (< 50 cm) pack ice, which has almost completely retreated by the end of June (Itkin and Krumpen, 2017). The retreat of the pack ice is predominantly controlled by the prevailing atmospheric conditions in April and May (Janout et al., 2016a), whereas land-fast ice that forms in winter in the LS and ESS between 115 and 170∘ E retreats only during the month of July (Selyushenok et al., 2015). Bauch et al. (2013) and Janout et al. (2016b) showed that the decline in fast ice is also influenced by the input of warm river water during spring freshet. While the maximum extent of fast ice in the LS (∼ 130×103 km2) shows only small annual variations (observation period 1999–2013; Selyushenok et al., 2015), the maximum area of fast ice in the East Siberian Sea (140 to 170∘ E) varies annually from 130 to 200×103 km2 (2012–2021, data from https://www.meereisportal.de, last access: 15 May 2021; Spreen et al., 2008). At the end of winter, the fast ice also reaches its maximum thickness of ∼ 2 m (Kotchetov et al., 1994; Li et al., 2020). Thus, the maximum total volume of fast ice in the Laptev and East Siberian Sea is approximately between 520 and 660 km3 . Assuming an average salinity of the fast ice of 4, the land-fast ice meltwater corresponds to a maximum freshwater equivalent of up to ∼ 580 km3 (reference salinity 34.8).
The presence of tDOM-poor meltwater from the land-fast ice that contains a high proportion of river water and tDOM-rich river water in the Arctic shelf seas, together with the extreme seasonality of fluvial tDOM input, make it difficult to study tDOM removal processes based on the interpretation of the relationship between tDOM concentration and salinity (Granskog, 2012; Anderson and Amon, 2015). Although degradation processes are obviously important for DOM dynamics in the Arctic Ocean, our study focuses mainly on the physical drivers controlling the distribution of tDOM in the LS and ESS. In particular, we aim to understand whether sea-ice growth and melt have a discernible influence on the distribution of tDOM in the Siberian shelf seas. We attempt to show that degradation of tDOM is probably not the determining factor for the observed tDOM concentration distributions in the LS and ESS but that instead physical mixing of meltwater from land-fast ice with river and seawater plays a key role.
This research is based on one of the most comprehensive bio-optical, DOC and hydrographic data sets from the Siberian Arctic. We report on the first multi-year study of the coloured fraction of dissolved organic matter (CDOM), which includes observations in river runoff during spring freshet (2014), marine waters from the coastal area to the shelf edge of the LS (2010–2019) and ESS (2019), and ice and water samples from the land-fast ice of the southeastern LS (2012). Sampling was carried out in different seasons of the year over a period of 9 years (2010–2019). Although it was not sampled on each expedition (Table 1), we used the stable oxygen isotope data of the water samples to calculate the river water and sea-ice meltwater (sim) fractions.
2.1 Field sampling
Seven summer ship expeditions between 2010 and 2019 and one sea-ice-based winter expedition in 2012 were carried out to perform oceanographic and biogeochemical measurements in the LS (Table 1 and Fig. 1). During the ship-based expeditions, we operated a CTD profiler (conductivity–temperature–depth; Seabird 19+) to sample the basic hydrographic parameters. The CTD is operated on a carousel water sampler (SBE 32SC) allowing for automated water sampling at pre-selected depths. During the winter expedition (Ti12) a stand-alone CTD (Seabird 19+) was lowered through an ice hole along with Nansen water samplers. In this study we used the practical salinity scale to describe salinity (PSS-78). Ice cores (9 cm diameter) were collected in 2012 at stations on the land-fast ice between 19 March and 24 April. Six ice cores taken at three different locations (Fig. 1) in March/April 2012 were analysed (Ti12_ice, Table 1). Sub-samples were taken at 10 cm intervals to represent the different periods of ice formation, with the youngest ice in the lower section and the oldest ice from the first stages of ice formation in early winter in the uppermost sections of the ice core.
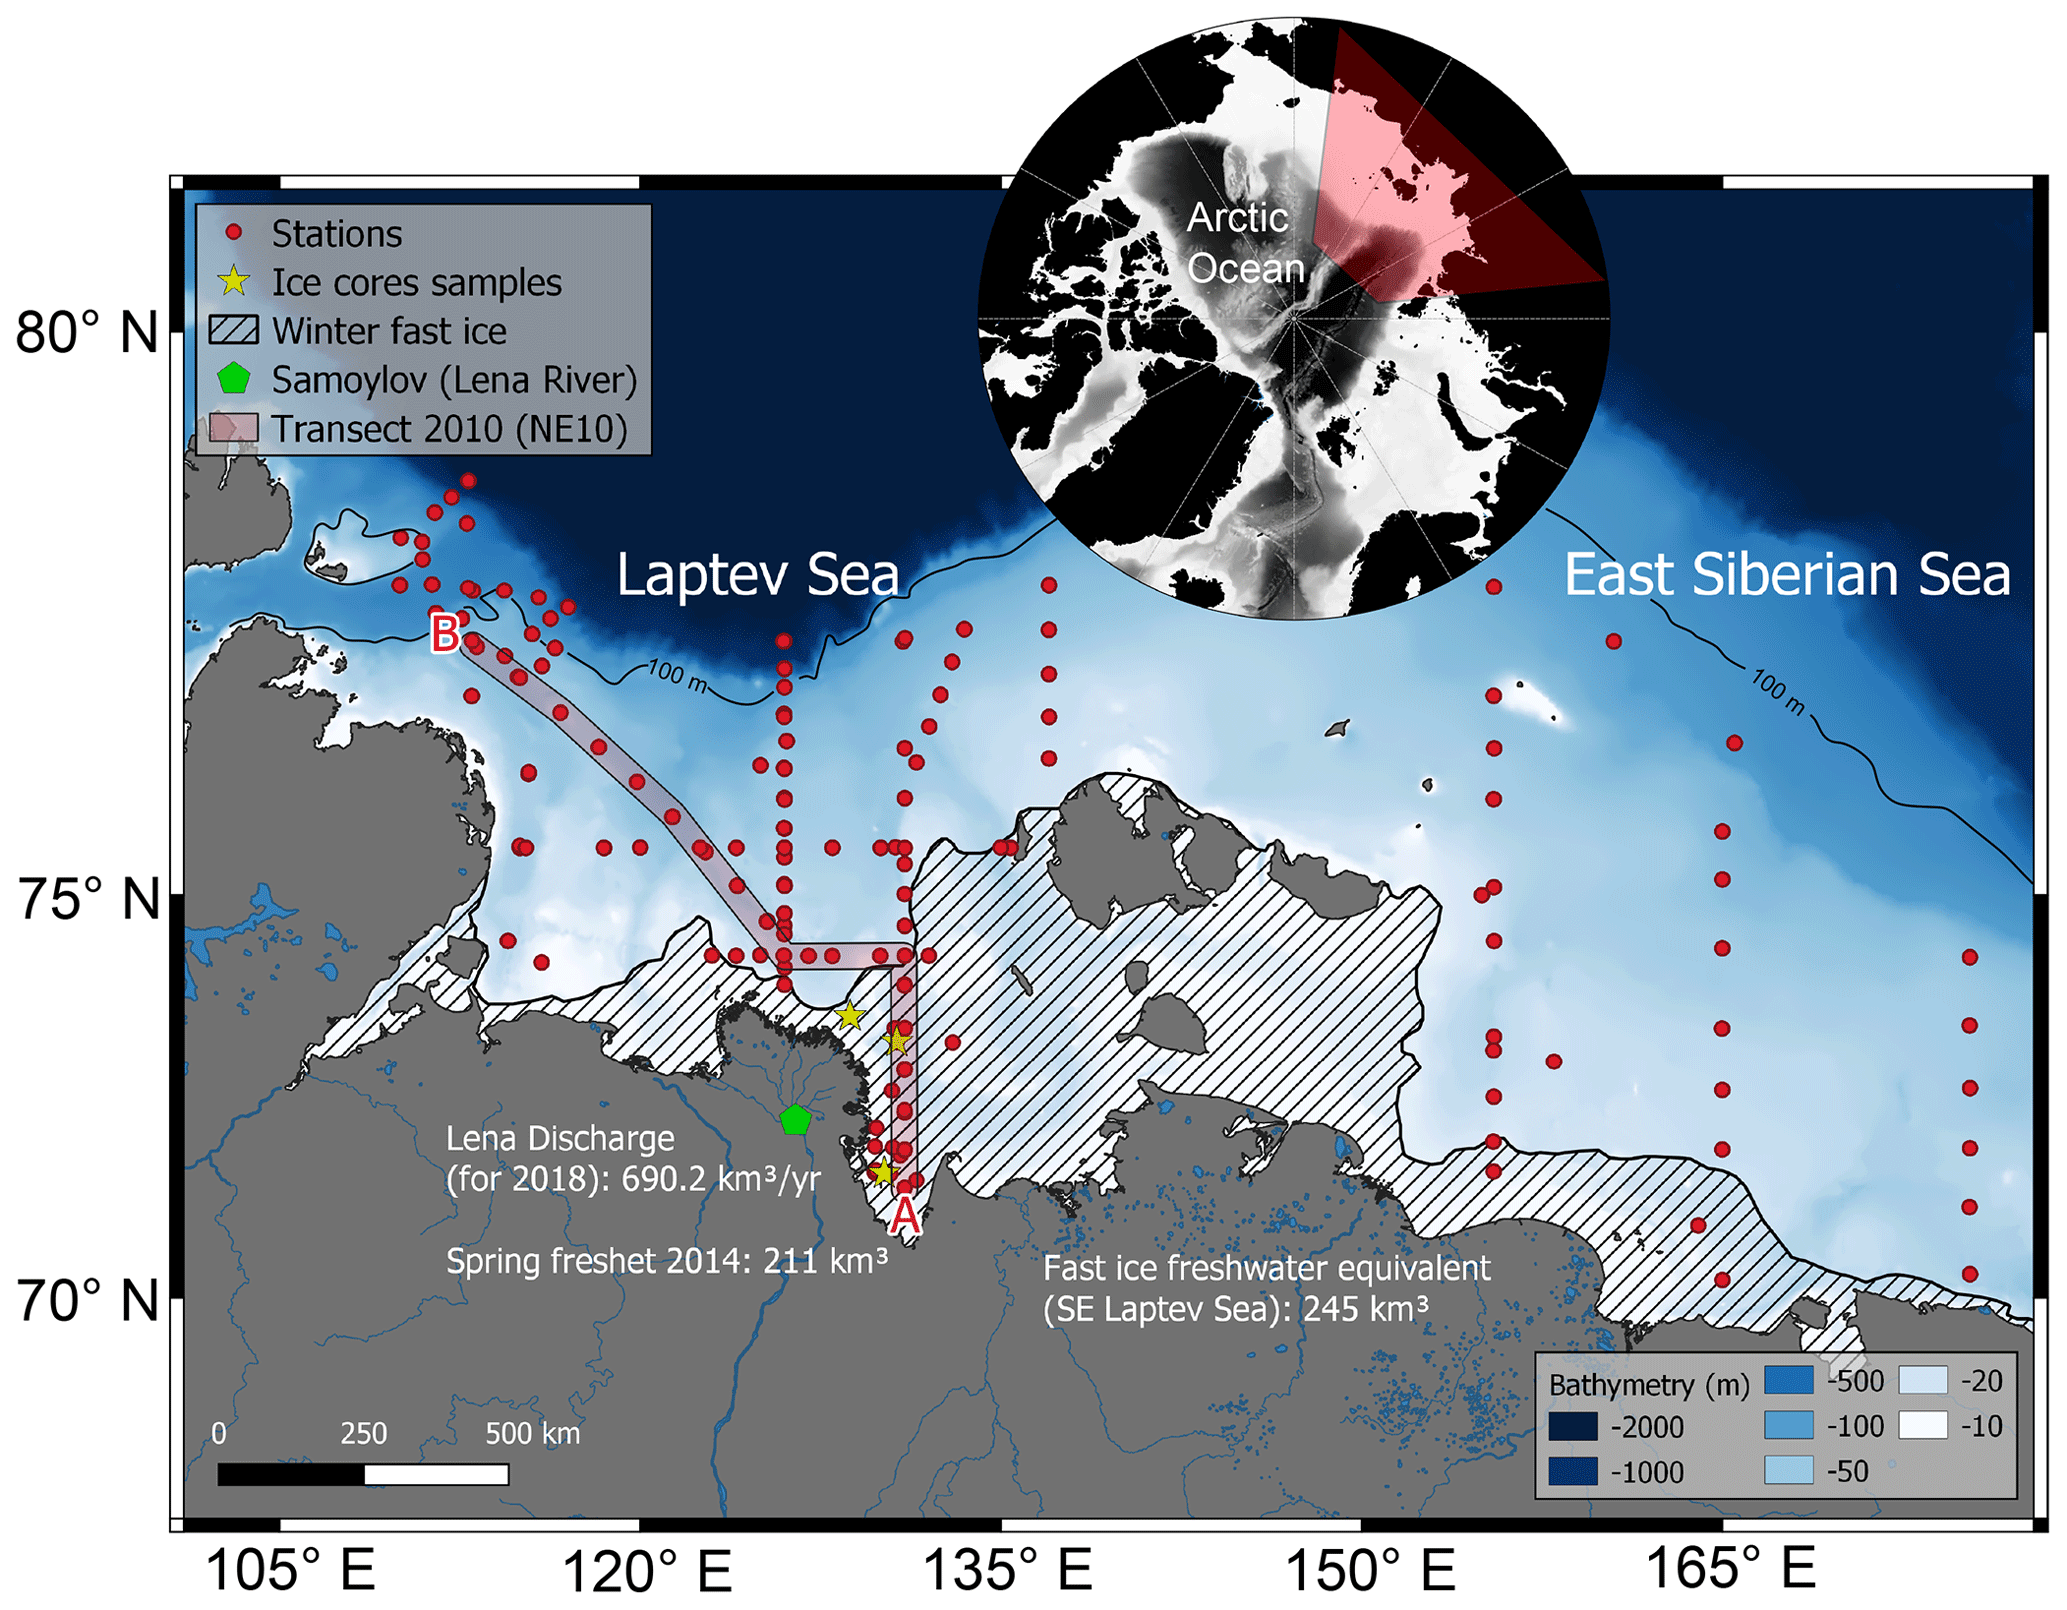
Figure 1Map of the Laptev (LS) and East Siberian (ESS) seas and station distribution during the ship-based expeditions in summer (red dots). The border between the LS and the ESS runs along 140∘ E. The LS was sampled in 2010, 2011, 2013, 2014, 2018 and 2019. Only a few stations could be repeatedly sampled in multiple years. The ESS was sampled in 2019. Maps of the stations of each expedition with a detailed description of the location and date are available under the respective data sets (Table 1; Hölemann et al., 2020a–g; Kattner et al., 2010). In addition, samples of land-fast ice (fast ice) and the water column were taken from March to April 2012 (yellow stars). The extent of fast ice describes the situation on 1 May 2011. The grey line between A and B represents the oceanographic transect shown in Fig. 6. Bathymetric data were provide by IBCAO V3 (Jakobsson et al., 2012).
Lena River data presented here were collected as part of the Lena 2014 expedition. Samples were taken close to the Samoylov Station (72∘22′ N, 126∘29′ E; green pentagon in Fig. 1) in the central part of the Lena Delta from 21 May to 16 June 2014. The sample treatment and methods used are the same as for sea water and ice samples (see below).
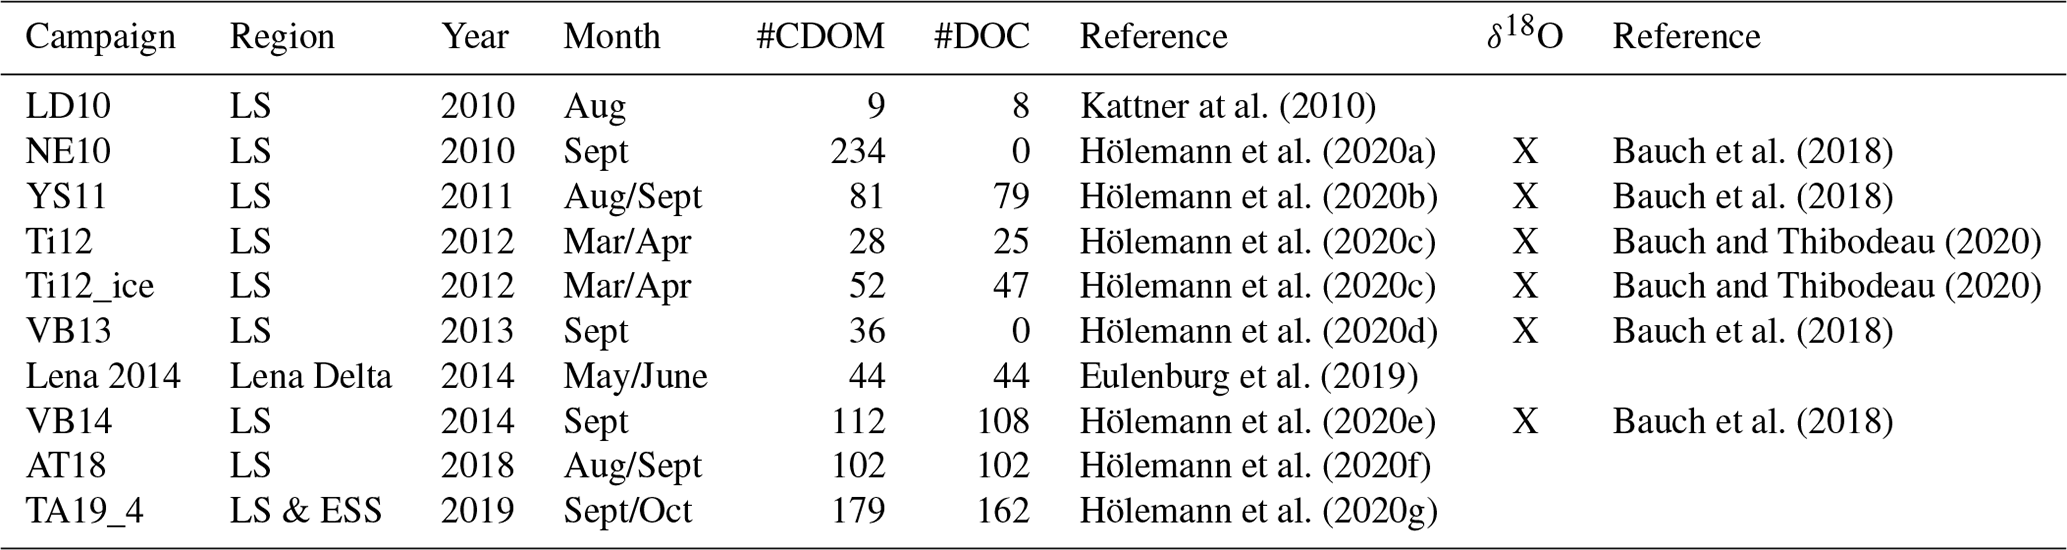
Table 1Expedition data and the number of samples (#) used in this study. The data are accessible on PANGAEA.
2.2 Sample preparation and analytical methods
Water samples were immediately filtered through pre-combusted Whatman GF/F glass microfiber filters (4.7 cm diameter) with a nominal pore size of approx. 0.7 µm. The filtrate was filled into acid cleaned and pre-rinsed high-density polyethylene bottles, stored dark and cold for CDOM analysis, and frozen at −20 ∘C for DOC analysis. Filtered DOC samples from the LENA 2014 expedition were filled into a pre-combusted 20 mL glass vial, acidified with 25µL HCl (Merck, Suprapur grade, 10 M) and stored in the dark at 4 ∘C. The ice cores were drilled using an electromechanical ice corer (Kovacs Enterprise, USA) and subsequently placed in polyethylene bags and transported frozen to the land-based laboratory. Within a few hours after coring, the core was placed in polyethylene containers in the dark at room temperature until they were completely melted. Immediately after melting, the salinity of the meltwater was determined with a conductivity metre (WTW 197i) with a standard conductivity cell (WTW TetraCon 325), and samples were subjected to vacuum filtration. Also samples for the determination of dissolved inorganic nutrient concentrations, chlorophyll a, particulate matter and stable oxygen isotopes were taken from the ice cores. Only Salinity, DOC and CDOM were used in this study. In addition, under-ice water samples were collected. Sample storage and analytical procedures were identical to those described for water samples.
DOC was determined by high-temperature catalytic oxidation (HTCO) with a Shimadzu TOC-VCPN analyser. In the autosampler, 6 mL of sample volume (pre-combusted or thoroughly rinsed vials) were acidified with 0.12 mL HCl (2 M) and sparged with oxygen (100 mL min−1) for 5 min to remove inorganic carbon. A 50 µL sample volume was injected directly on the catalyst (heated to 680 ∘C). Detection of the generated CO2 was performed with an infrared detector. Final DOC concentrations were average values of triplicate measurements. If the standard variation or the coefficient of variation exceeded 0.1 µmol L−1 C or 1 %, respectively, up to two additional analyses were performed and outliers were eliminated. Detection limit was 7 µmol L−1 C with an accuracy of ± 2 µmol L−1 C determined with low carbon water and seawater reference material (DOC-CRM, Hansell Research Lab, University of Miami, US). Quality control was assured by measuring one Milli-Q blank and two standards after every six samples.
The optical properties of CDOM provide information on both the amount of DOM present and its chemical properties (Coble, 2007). In order to retrieve the absorption by CDOM, optical density (OD) spectra were analysed on a dual beam spectrophotometer (Specord200, Jena Analytik) within 2 months after the expedition. Spectra were measured from 200 to 750 nm using quartz cuvettes with a path length of 5 cm or 10 cm, according to the expected absorption intensity of the sample. OD of each sample was measured three times against ultra-pure water. Napierian absorption per metre was calculated based on the averaged OD value using 2.303 × OD L, where L is the lengths of the cuvette. In this study, we present the absorption coefficient (m−1) at a wavelength of 350 nm: aCDOM(350). The wavelength was selected to make the results comparable with previous studies in Arctic waters (Granskog et al., 2012; Gonçalves-Araújo et al., 2015; Pavlov et al., 2016). The spectral slope of the absorption spectra in the wavelength range between 275 and 295 nm (S275−295) and between 300 and 600 nm (S300−600) was calculated by fitting with an exponential function aCDOM (λ) = aCDOM (λ0) × e−S(λ−λ0). The usefulness of S275−295 and other spectral slopes at shorter wavelengths for determining the origin and diagenesis of CDOM was demonstrated in the studies by Granskog (2012) and Fichot and Benner (2012). Based on the relationship between S275−295 and DOC-normalised lignin yield, Fichot and Benner (2012) showed that S275−295 is lower than 20 µm−1 when the proportion of terrestrial DOC is higher than 50 %. Steeper spectral slopes (i.e. higher S275−295) are typically associated with a higher proportion of marine CDOM. Steeper S275−295 slopes have also been associated with photochemically induced shifts in molecular weights (Helms et al., 2008). The spectral region between 275 and 295 nm lies at the short-wavelength edge of the natural solar spectrum. Solar ultraviolet radiation shows significant degradation for CDOM in natural aquatic ecosystems. In contrast to 295 nm, almost no photons are present at 275 nm in the lower atmosphere. It is therefore assumed that solar radiation absorbed by CDOM would always lead to a greater change in aCDOM(295) than in aCDOM(275) and consequently to an increase in S275−295 so that increased slope values are a good indicator of photodegradation, while microbial degradation should have the opposite effect (Helms et al., 2008). However, in marine systems such as the LS and ESS, which are characterised by a high riverine input of terrestrial CDOM, non-terrestrial sources and non-photochemical processes only become visible once the absorption of terrestrial CDOM has been removed to a high degree (Granskog, 2012).
Stable oxygen isotopes were analysed at the Stable Isotope Laboratory of COAS at Oregon State University (Corvallis, USA), applying the CO2–water isotope equilibration technique, and were analysed by dual inlet mass spectrometry (Thermo, DeltaPlus XL). The overall measurement precision for all δ18O analyses was ± 0.04 ‰. The 18O 16O ratios were calibrated with Vienna Standard Mean Ocean Water (VSMOW) and reported in the usual δ notation (Craig, 1961). For a quantitative interpretation of the oxygen isotope data, an exact match of salinity and δ18O values is essential. Therefore, in addition to CTD measurements, bottle salinity was determined directly within the water samples taken for δ18O analysis using an AutoSal 8400A salinometer (Guildline Instruments) with a precision of ± 0.003 and an accuracy greater than ± 0.005. The river water and sea-ice meltwater (sim) contributions can be quantified with a mass-balance calculation, which was previously applied in the Arctic Ocean basins (Bauch et al., 2011) and shelf regions (Bauch et al., 2005). The basis for the mass-balance calculation is the assumption that each sample is a mixture of marine water (fmar), river-runoff (frw) and sea-ice meltwater (fsim). The following equations determine the balance:
where fmar, frw and fSIM are the fractions of marine water, river-runoff and sea-ice meltwater in a water parcel, and Smar, Srw, Ssim, Omar, Orw and Osim are the corresponding salinities and δ18O values. Smeas and Omeas are the measured salinity and δ18O of the water samples. The analytical errors from δ18O and salinity measurements add up to approximately ± 0.3 % for each of the fractions. The additional systematic error depends on the exact choice of endmember values. When endmember values are varied within the estimated uncertainties (Bauch et al., 2013), both fractions are shifted by up to ∼ 1 % in absolute values, but relative results are qualitatively always conserved even when extreme variations in endmember values are tested (Bauch et al., 2011).
The endmembers are well known for the study area (Bauch et al., 2010, 2013). The only exception is the sea-ice endmember that is based on an assumption on the signature of the source water since sea ice and underlying water can move independently from each other. Within the direct vicinity of the Lena River, the summer surface layer is strongly influenced by summer discharge of the Lena River, so the low δ18O summer surface signature in this area is not a useful endmember for the sea ice formed during winter. Therefore, the average surface value from the winter polynya region of −7 ‰ in δ18O is applied as source water for sea-ice formation to all stations with a surface δ18O lower than −7 ‰. Differences in calculated sea-ice meltwater and river water fractions in the southern LS, when a constant polynya value is used instead of each station's surface signature, are generally small (for a detailed discussion see Bauch et al., 2010), and calculated fractions remain stable relative to each other.
3.1 CDOM-DOC relationship in the Laptev Sea and East Siberian Sea
Samples collected in the Lena River, LS, ESS, and the adjacent Nansen and Amundsen basins illustrate the range of variability in DOC concentrations and aCDOM(350). The highest DOC concentrations (> 1200 µmol L−1) we observed in river water were measured during the peak of the spring freshet of the Lena River between 29 May and 7 June 2014 (see Sect. 3.2). The lowest riverine DOC concentrations (384 µmol L−1) were recorded on 23 May 2014 before the onset of the spring freshet. The coastal waters near the Lena Delta are characterised by DOC concentrations of 185 to 853 µmol L−1 in the surface mixed layer (0–10 m depth), with the highest values (> 500 µmol L−1, salinity < 5) occurring near the river mouth and in the mixed layer underneath the land-fast ice east of the delta (300–520 µmol L−1, salinity 9–20). The marine water masses of the outer shelf and in the basins with salinity above 20 show lower DOC concentrations of 50–75 µmol L−1, with the lowest value recorded in the Atlantic Intermediate Water on the continental slope of the LS at a water depth of 300 m.
To characterise the relationship between the DOC concentration and the optical property – aCDOM(350) – of DOM in water and ice samples, we applied a non-linear regression analysis according to the method described in Juhls et al. (2019) and Matsuoka et al. (2017). Statistical analyses of the water samples from the LS and ESS show a strong relationship between aCDOM(350) and the DOC concentration (r2 = 0.99; RMSE = 0.8 m−1, n=527) (Fig. 2a). In contrast, ice samples from the land-fast ice of the southeastern LS (Fig. 2a, blue diamonds) show a significantly different relationship. The aCDOM(350) in the ice cores with DOC concentrations > 300 µmol L−1 is lower compared to water samples with comparable DOC concentrations. In particular, the DOC-rich (> 400 µmol L−1) ice samples show aCDOM(350) values that are up to 5 times lower than in seawater with the same DOC concentration. All ice samples with DOC concentrations > 200 µmol L−1 and aCDOM(350) < 2.5 were taken from the upper 70 cm of a 2 m long ice core from the coastal area near one of the mouths of the Lena River. We also used the model developed by Stedmon and Markager (2001) to differentiate between marine and terrestrial organic matter (Fig. 2b). The model that suggests a dominance of tDOM in the LS and ESS is based on the relationship between the spectral slope coefficient (300–600 nm) and CDOM absorption at 375 nm. In the LS and ESS most data points show high S300−600 values (> 17 µm−1) that stay relatively constant as aCDOM(375) decreases. The results of these investigations are discussed in more detail in Sect. 4.1.
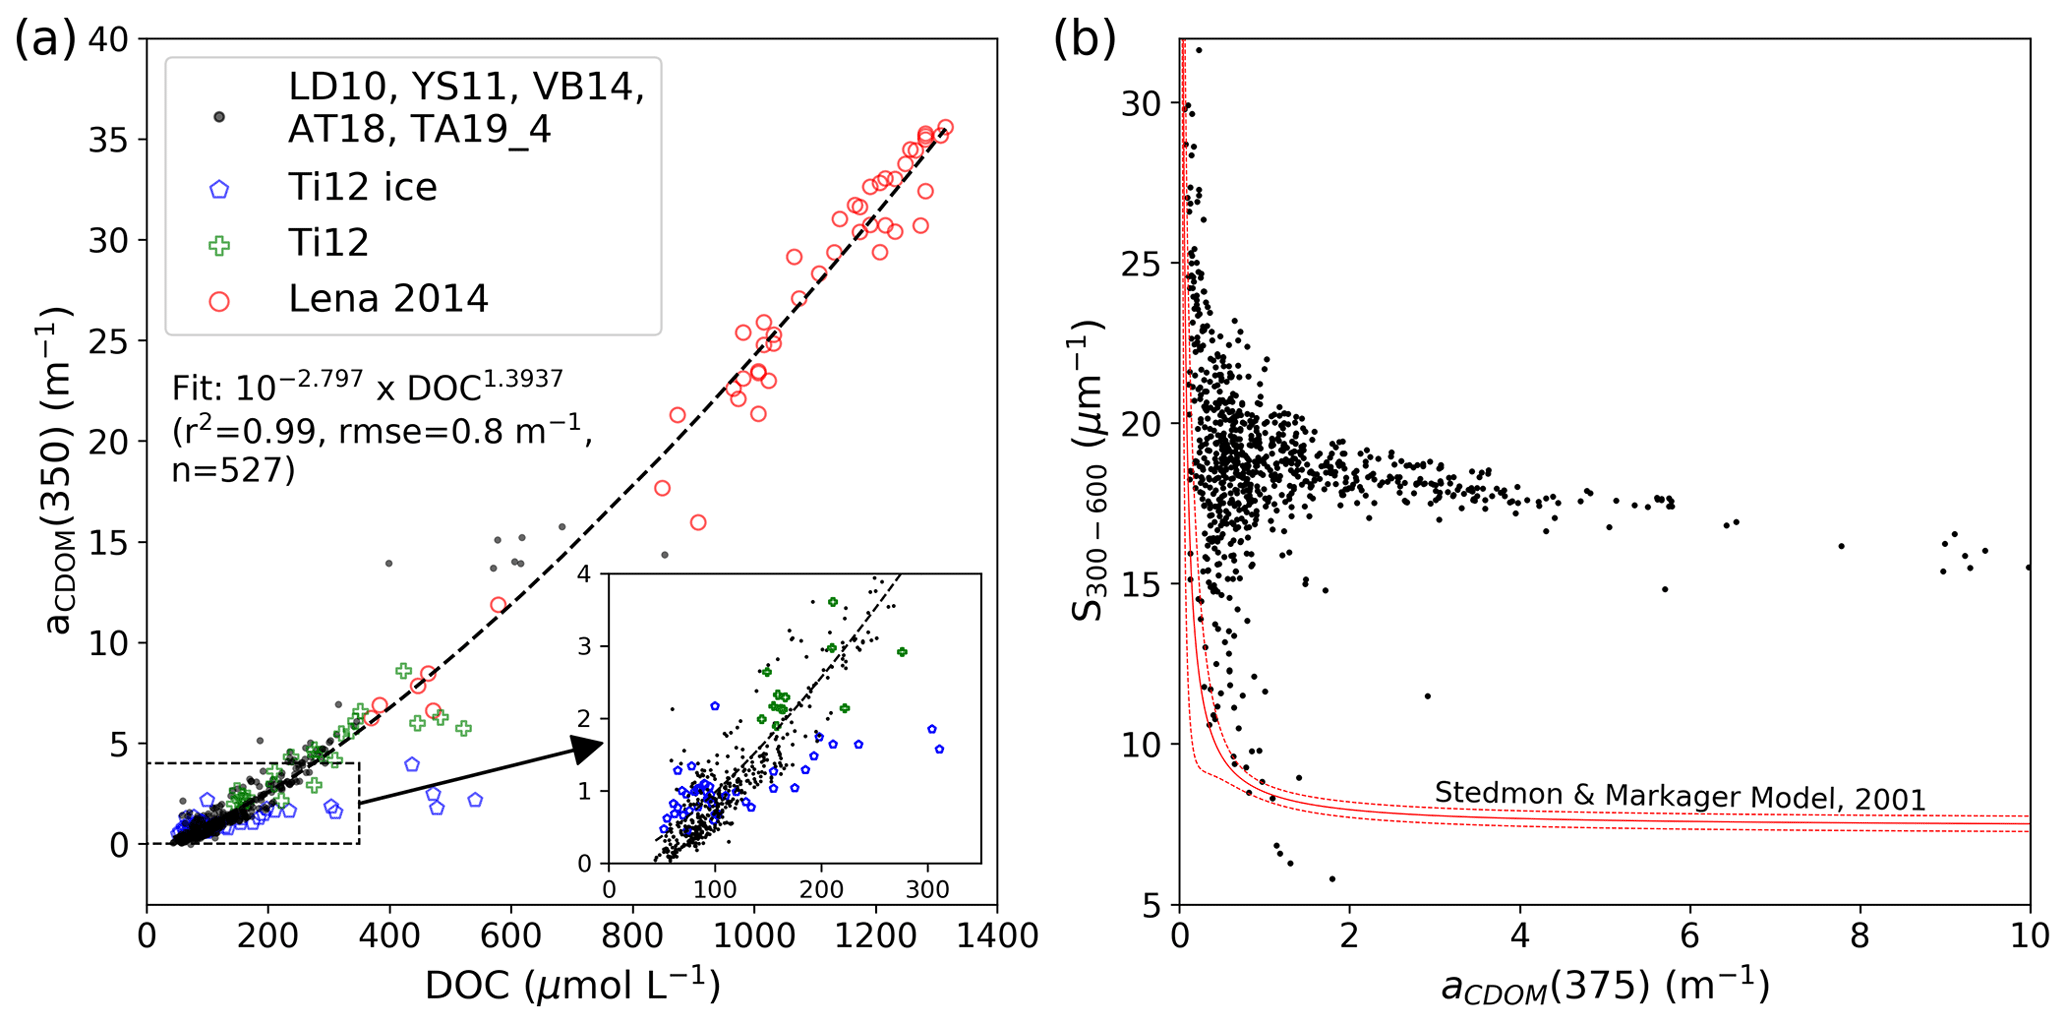
Figure 2(a) The relationship between DOC and aCDOM(350) for Lena River water, ice samples and seawater samples from the LS and ESS. The regression and r2 was calculated only on the basis of river and seawater samples. Panel (b) shows the model developed by Stedmon and Markager (2001) to differentiate between marine and terrestrial organic matter. Data points from the LS and ESS that lie within the model boundaries of the Stedmon and Markager (2001) model (dotted red lines) are defined as marine CDOM, while the rest are terrestrial in origin.
3.2 The tDOM characteristics in the Lena River during the spring freshet
The dominant feature of the hydrological cycle of the Lena is the spring freshet in May and June. We sampled this event in the central part of the Lena Delta from 21 May to 19 June 2014 (Lena 2014). The discharge data measured ∼ 200 km upstream at Kyusyur were provided by ArcticGRO (Shiklomanov et al., 2020). In their study based on ArcticGRO discharge data, Juhls et al. (2020) give a more detailed description of the annual variability in the tDOM input of the Lena River during the spring freshet and throughout the year. We corrected the discharge data for the distance between Kyusur and Samoylov Island as described in Juhls et al. (2020) assuming a mean flow propagation speed of 88 km d−1.

Figure 3(a) Corrected daily Lena River discharge data, (b) aCDOM(350) and S275−295, and (c) DOC concentration measured near Samoylov Island in the Lena Delta during the spring freshet in May/June 2014.
The highest aCDOM(350) (Fig. 3b) and DOC concentration (Fig. 3c) were measured during the peak river discharge on 31 May (Fig. 3a). During the observation period 211 km3 of freshwater with a flow-weighted average aCDOM(350) of 26.1 m−1 and a DOC load of 2.83 Tg entered the LS, which is one third of the annual DOC discharge of the Lena.
3.3 The tDOM in the Laptev and East Siberian seas (ESS) and in land-fast ice of the LS
Samples from the LS showed a significant negative linear relationship between salinity and aCDOM(350) (r2 = 0.90, n=659, p < 0.01) (Fig. 4a) and between the fraction of river (meteoric) water (frw) and aCDOM(350) (r2 = 0.94, n=465, p < 0.01) (Fig. 4b). The data points in the LS are well below the theoretical mixing line resulting from a conservative mixing between the Lena River water discharged after the spring freshet (post-freshet, “Summer” in Fig. 4), which has an average aCDOM(350) of 14.4 m−1 (standard deviation 3.4 m−1, n=26; Juhls at al., 2020), and the tDOM-poor seawater (salinity > 34) of the Nansen Basin. Looking at the theoretical conservative mixing line of the flow-weighted annual river input of CDOM (“Annual” in Fig. 4) that includes the spring freshet (April 2018 to April 2019, aCDOM(370) of 18.7 m−1, calculated from data published by Juhls et al., 2020) and the seawater, the discrepancy becomes even more apparent. The freshwater endmember calculated from the data in the LS on the basis of salinity has an aCDOM(350) of 11.7 m−1 (interception of linear fit in Fig. 4a). The aCDOM(350) of the river water endmember calculated from frw (interception of linear fit in Fig. 4b) is ∼ 10 m−1, which is about 50 % lower than the annual flow-weighted average aCDOM(350) of the river water. Whether this can be explained by the dilution of low-tDOM meltwater from the land-fast ice of the southeastern LS (Fig. 5b) that contains up to 90 % river water (Eicken et al., 2005) is discussed in Sect. 4.2. The group of data points with frw between 40 % and 60 % that fall below the regression line are mostly from the surface water of the southern LS and were sampled in September 2011 (Fig. 4, YS11-data points outlined in red). The possible reason for the deviation in this sample cluster is discussed in Sect. 4.3.
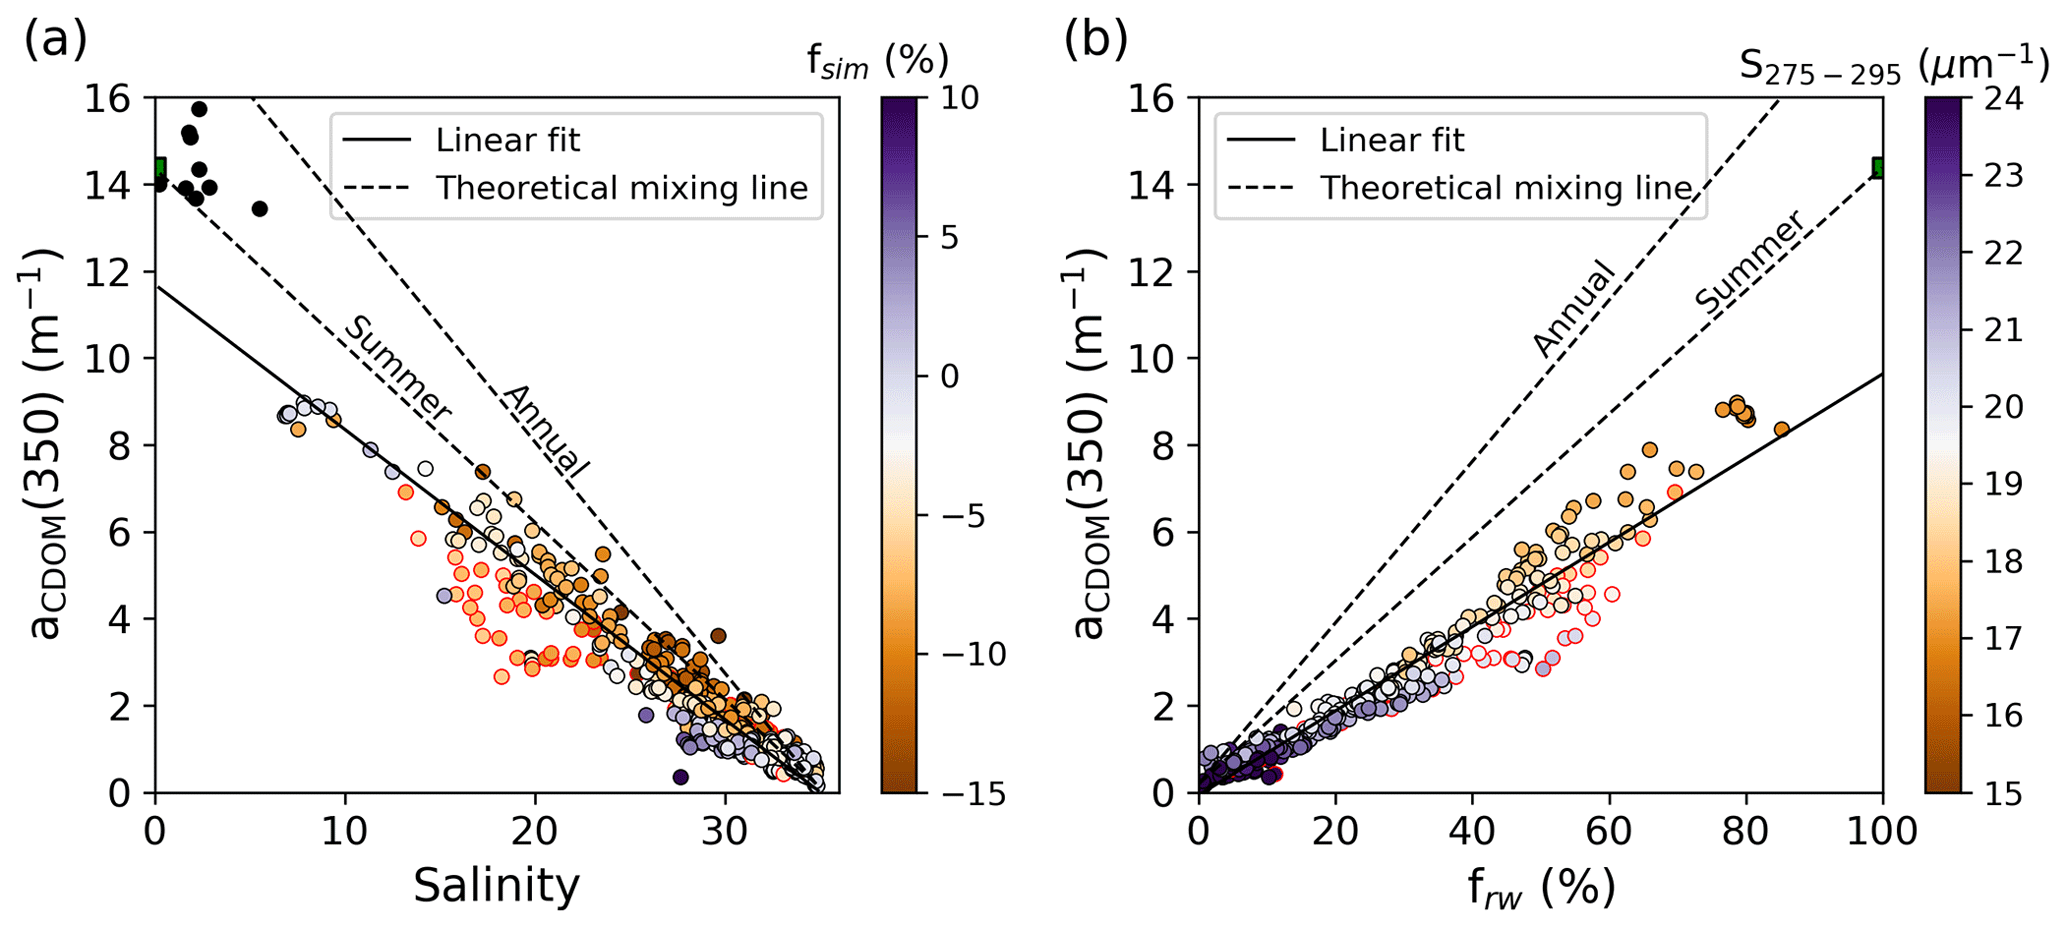
Figure 4(a) Salinity, aCDOM(350) and the percentage of sea-ice meltwater fraction (fsim %) measured in the LS in summer (NE10, LD10, YS11, VB13, VB14, AT18 and TA19_4) and (b) percentage of river water (frw %), aCDOM(350) and S275−295. The solid black line represents the linear regression fit to the data in the LS. The dashed black lines show the theoretical conservative mixing line between Lena River water after spring freshet (Summer, aCDOM(350) of 14.4 m−1 calculated from Juhls et al., 2020) and the marine endmember (Nansen Basin, NB, seawater), as well as the theoretical conservative mixing line of year-round flow-weighted average CDOM absorption of the Lena River (Annual, aCDOM(350) of 18.7 m−1 based on year-round measurements in the Lena Delta, April 2018–April 2019; Juhls et al., 2020) and the marine endmember. Red outlined dots are water samples from the surface layer (< 20 m) taken north and east of the Lena Delta in September 2011. Black dots in (a) represent samples on which stable oxygen isotope analysis was not performed (LD10).
To describe the influence of the formation and melting of sea ice on the distribution of tDOM in the LS, the stable oxygen isotope composition of the water was studied. At salinities > 25, most water samples, which are well below the regression line (Fig. 4a, linear fit) showed an increased fraction of sea-ice meltwater (positive fsim). In contrast, many samples above the regression line showed higher proportions of brine influence (negative fsim). The addition of brines, which are expelled from the sea ice during formation, was most apparent in a winter-water sample from the northern edge of the land-fast ice taken at 10 m water depth that showed a minimum fsim of −20 % at a salinity of 29.7 and a comparatively high aCDOM(350) of ≈ 4 m−1. Shelf waters during winter also showed higher DOC concentrations (mean 254 µmol L−1, salinity from 10 to 31) compared to summer shelf waters of the same salinity (mean 199 µmol L−1).
Sampling in the ESS was carried out in August and September 2019. Across the ESS, salinities were above 20 in 2019 (Fig. 5a). Even in coastal areas near the Indigirka and Kolyma rivers surface-water salinities were above 20. Moreover, aCDOM(350) in the ESS (Fig. 5a, coloured dots) was significantly lower compared to LS water (Fig. 5a, black dots) at similar salinities.
In the LS, S275−295 showed an inverse relationship with frw (Fig. 4b), indicating on the one hand a fluvial source of CDOM and on the other hand a more intense photobleaching of CDOM in the water masses on the outer shelf and continental margin. When interpreting the slope data, however, it must be kept in mind that in marine systems characterised by a high input of terrestrial CDOM, non-terrestrial sources and non-photochemical processes only become visible when the absorption of terrestrial CDOM has been removed to a high degree (Granskog, 2012).
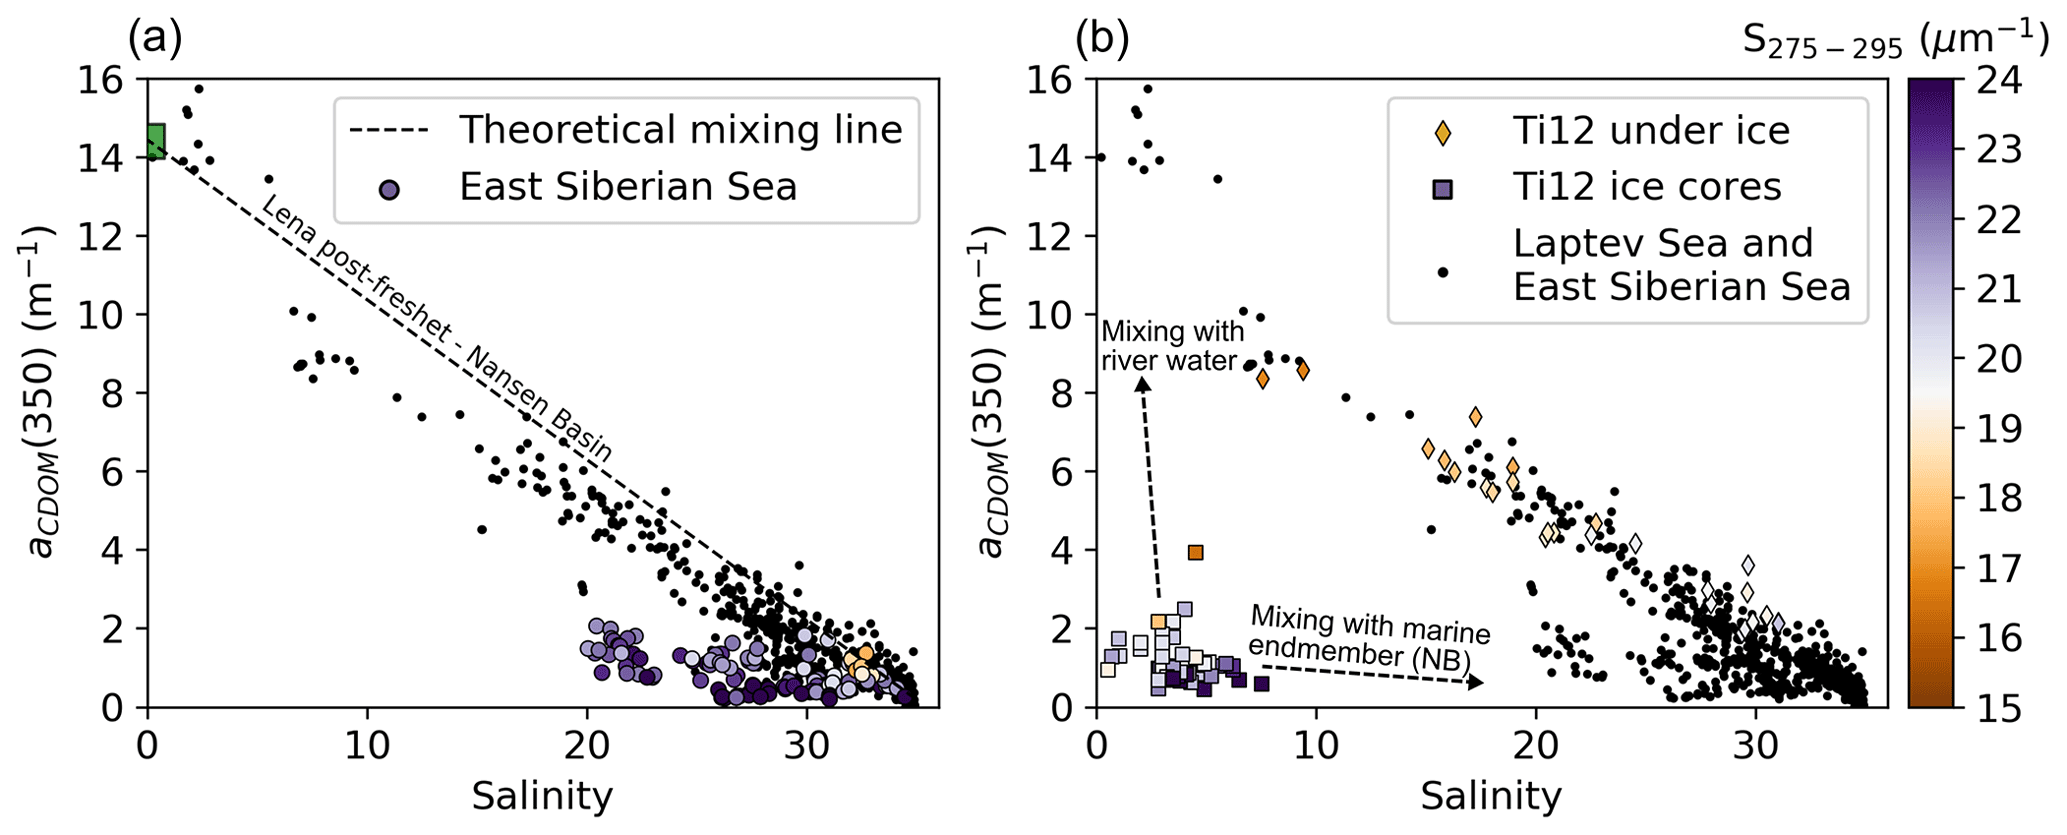
Figure 5(a) Salinity and aCDOM(350) in the ESS (August and September 2019, coloured dots) and LS (black dots). The broken line shows the theoretical conservative mixing line between the Lena River water that enters the LS after the spring freshet (post-freshet) and the marine endmember (Nansen Basin seawater, NB). The colour of the dots shows the slope of the absorption spectra in the range between 275 and 295 nm (S275−295). (b) Salinity, aCDOM(350) and S275−295 in land-fast ice (squares) and sub-ice water samples (diamonds) in the LS collected in (March/April 2012). The arrows indicate the direction of theoretical conservative mixing lines between the land-fast-ice meltwater and the Lena River water, as well as between the meltwater and the marine endmember. The black dots represent the samples from the LS and ESS (2010–2019).
The DOC concentration and optical properties of DOM in the land-fast ice of the southeastern LS were determined in March and April 2012. The ice core samples had a salinity of 3.6 and an aCDOM(350) of 0.99 m−1 (median of all cores and subsections; n=52), which was approximately 10 % of the aCDOM(350) observed in seawater with comparable salinity (Fig. 5b). Unfortunately, δ18O measurements of LS land-fast ice cannot be used directly as endmember for sea-ice meltwater as they represent a mixture of seawater and river water contained within the ice. The median of the DOC concentration in the ice was 96.2 µmol L−1. The highest aCDOM(350) values of up to 4 m−1 were observed in the lowermost 20 cm of an ice core sampled near the northern border of the land-fast ice. The high aCDOM(350) coincided with high chlorophyll a concentrations (Katya Abramova, personal communication, 2016). However, CDOM absorption spectra of algae-rich ice samples exhibited no ultraviolet absorption shoulders that indicate mycosporine-like amino acids from sympagic autotrophic organisms (Xie et al., 2014; Granskog et al., 2015b). Similar to the marine waters with an aCDOM(350) < 5 m−1 (Figs. 4a and 5b), the land-fast ice showed high S275−295 values with a median slope of 20.7 µm−1. An exception was the two chlorophyll-rich ice samples from the northern edge of the land-fast ice with slopes below 18 µm−1, which corresponds to the S275−295 slope of the tDOM in the winter runoff of the Lena River but which could also be caused by a higher proportion of marine DOM.
4.1 Dynamics of tDOM in the freshwater-influenced LS during spring and summer
Our results show that aCDOM(350) correlates strongly with the DOC concentration in riverine and marine LS and ESS waters (Fig. 2a). The high correlation is clear evidence for the terrestrial origin of the DOM, which is transported with the river water to the LS and ESS (Lara et al., 1998; Dittmar and Kattner, 2003; Amon et al, 2012; Mann et al, 2016; Kaiser et al, 2017b; Juhls et al., 2019). The results of the data analysis using the model developed by Stedmon and Markager (2001) also indicate a dominance of tDOM in the LS and ESS. These results are consistent with those of Gonçalves-Araujo et al. (2015), who investigated the composition and concentration of CDOM in the southeastern LS using excitation emission matrix spectroscopy and parallel factor analysis from a data set collected in September 2013. They found that CDOM in the region of freshwater influence (ROFI) of the LS was dominated by terrestrial humic-like material. Kattner et al. (1999) were also able to show on the basis of chemical analyses of DOM that the high input of tDOM not only shapes the ROFI of the Lena but that 60 % of the DOC of the entire LS and the adjacent Eurasian basin are also of terrestrial origin. One reason for the generally low DOM contribution from marine algae, which would significantly alter the dispersion in the CDOM vs. DOC dependence (Danhiez et al., 2017), could be the timing of sampling, which was mainly conducted between late August and mid-September when chlorophyll concentrations on the LS shelf are generally below 1 mg m−3 (Janout et al., 2016a).
To describe the tDOM dynamics in the Siberian shelf seas we analysed the optical properties of DOM along the salinity gradient in the LS, the ESS and the adjacent continental slope. In water samples from the LS, we found a statistically robust negative correlation between aCDOM(350) and salinity (r2 = 0.90, n=659, p < 0.01) (Fig. 4a) and between aCDOM(350) and the fraction of river (meteoric) water (frw) and (r2 = 0.94, n=465, p < 0.01) (Fig. 4b). The strong linear relationship suggests that tDOM mixes conservatively with seawater during the transit of river water across the shelf. The calculated aCDOM(350) concentration of the river water endmember of ≈ 10 m−1 (Fig. 5, linear fit of samples from the LS) is approximately 30 % below the mean aCDOM(350) absorption measured in the Lena River after the spring freshet (July–September, 14.4 m−1 with a standard deviation of 3.4 m−1; Juhls et al., 2020) and nearly 50 % below the flow-weighted annual average aCDOM(350) of the Lena River of 18.7 m−1 observed in 2018/2019 that also includes the spring freshet (data from Juhls et al., 2020). Because aCDOM(350) in river water may show intra-seasonal fluctuations between 10 and 22 m−1 in the post-freshet season (Juhls et al., 2020), the relatively high aCDOM(350) of 13.6–16 m−1 at salinities < 6 observed in the river plume near the Lena Delta in summer 2010 (Fig. 4a) were likely caused by short-term fluctuations of aCDOM(350) in the river.
The dominance of riverine input of terrestrial DOM and the resulting close relationship between salinity and aCDOM(350) is also evident from a hydrographic transect across the LS shelf observed in September 2010 (Fig. 6; the area of the transect is indicated in Fig. 1), The oceanographic transect runs from the mouth of the Lena River in the southeastern LS (A, Fig. 6) to the Taymyr Peninsula in the northwestern LS (B, Fig. 6). While the southeastern LS is dominated by the tDOM-rich river water plume of the Lena River, the northwestern LS is mainly affected by the inflow of tDOM-poor seawater from the Nansen Basin (Janout et al., 2013).
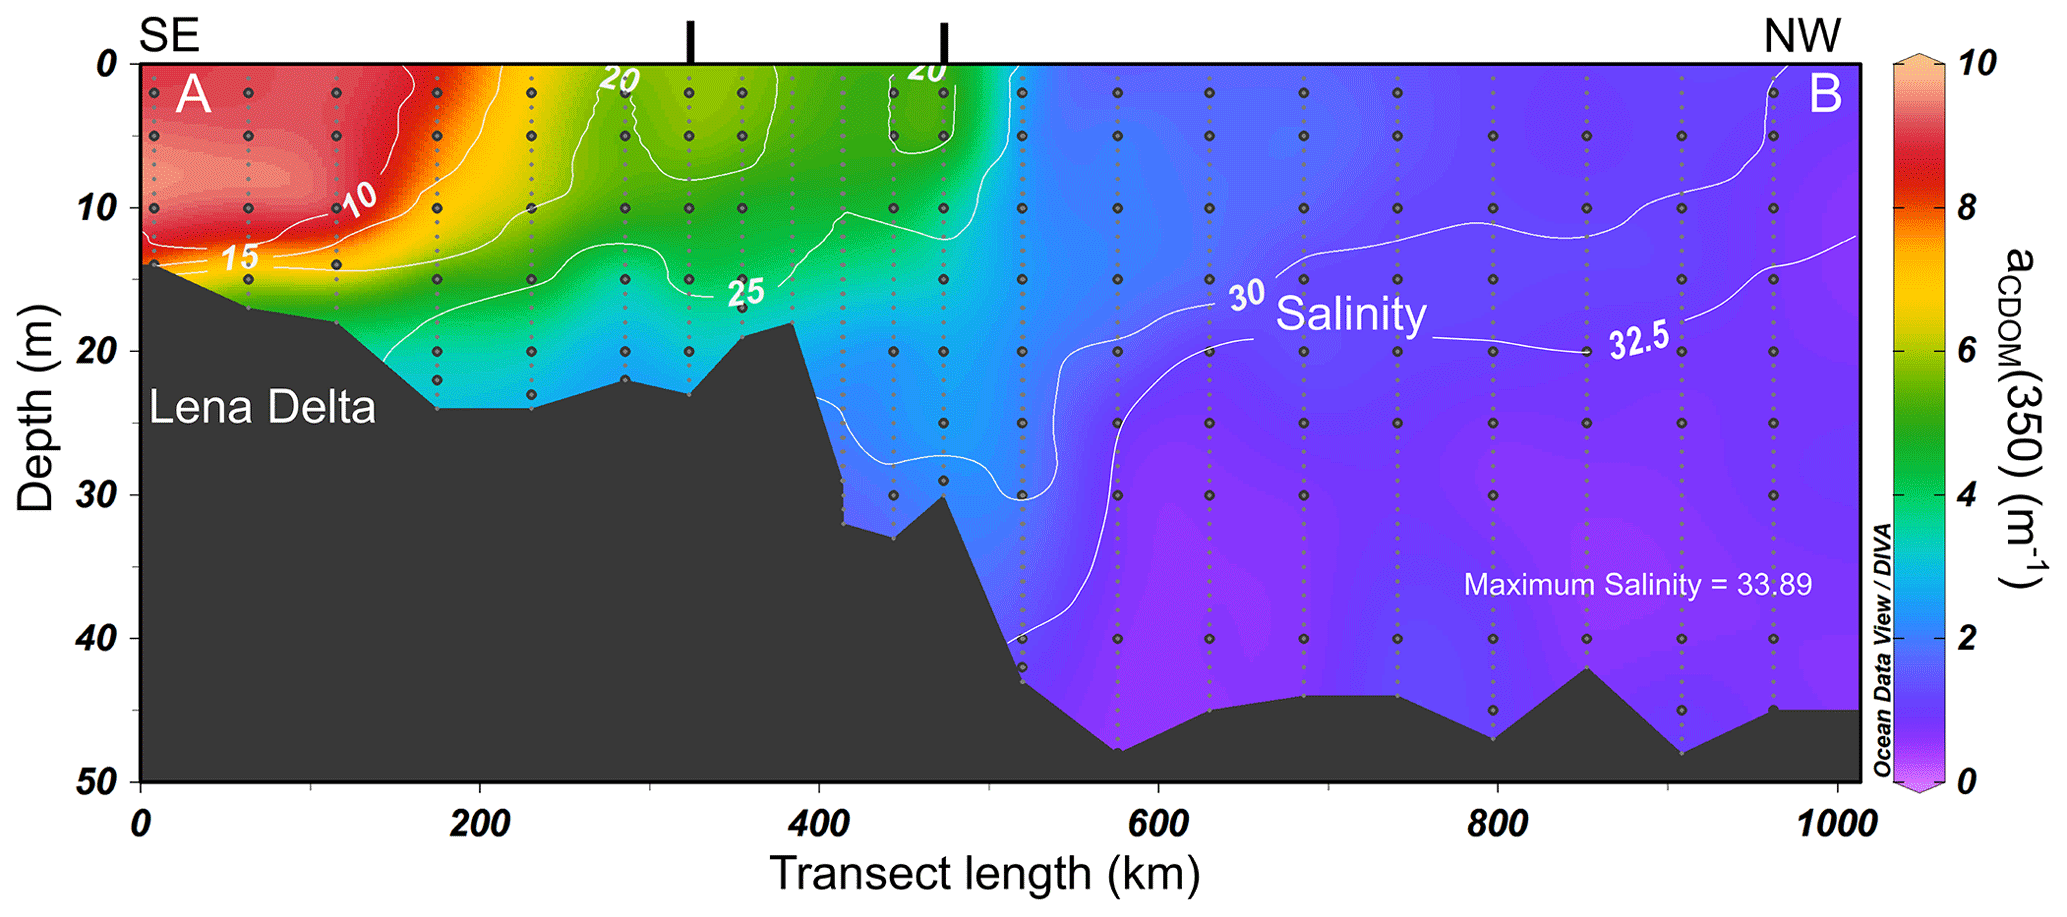
Figure 6Salinity (white isoline) and aCDOM(350) (colour) on a ∼ 1000 km long oceanographic transect from the Lena Delta (left) to the northwestern LS (September 2010; NE10). For the location of the profile see Fig. 1. Small gray dots represent salinity measurements (metre averaged), and black dots indicate water sampling for CDOM analysis. The figure was prepared with Ocean Data View (ODV) using DIVA gridding (Schlitzer, 2002). The black bars at the top of the panel indicate the changes in the direction of the transect (see Fig. 1).
Assuming conservative mixing, the input of more than 200 km3 of tDOM-rich freshwater with a flow-weighted average aCDOM(350) of 26.1 m−1 during the spring freshet in May and June should result in shelf aCDOM(350) values that are above the theoretical mixing line between the river water and the marine endmember (Fig. 4b). However, the aCDOM(350) vs. frw distribution of all summer (August/September) expeditions to the LS does not indicate the presence of freshet-related river water with high aCDOM(350) values on the shelf (Fig. 4b). Alling et al. (2010) suggested that the absence of tDOM-rich waters from the freshet on the LS shelf in 2008 was caused by a rapid wind-driven eastward transport into the adjacent ESS, but this is not consistent with the observation that when winds are predominantly easterly, as they were in the summer of 2008, the ROFI in the LS extends far north to the outer shelf of the LS (Janout et al, 2020). The same atmospheric forcing as in 2008 was also observed in 2011, when strong southeasterly summer winds coincided with mixed layer salinities below 16 ∼ 300 km north of the Lena Delta (Janout et al., 2020). The northern part of the ROFI should therefore contain a significant amount of tDOM-rich freshwater from the spring freshet, but this is not evident from the data (data from YS11, Table 1).
Another explanation for the absence of freshet-related high aCDOM(350) values within the ROFI could be the removal of tDOM, i.e. nonconservative mixing. This would imply that ∼ 50 % of the tDOM discharged into the southeastern LS in May and June had already been removed prior to the August and September sampling period. In this context, photochemical processes, flocculation of tDOM or rapid microbial degradation could play a major role. A previous study in the Mackenzie River, Canada, showed that photodegradation of tDOM was highest after spring freshet (Osburn et al., 2009). On the other hand, Belanger et al. (2006) noted that under a closed ice cover, photochemical reactions of tDOM carried by the Mackenzie River into the Beaufort Sea do not play a significant role in the degradation of tDOM. In the turbid nearshore waters of southeastern Hudson Bay, which have a high proportion of river water (frw > 25 %), self-shading could additionally slow photochemical reactions (photobleaching) of tDOM (Granskog, 2012). Since during the Lena spring freshet the turbid river plume mostly flows below the land-fast ice (Hölemann et al., 2005) that covers the inner shelves from October to mid-July (Barreis and Görgen, 2005; Selyuzhenok et al., 2015), photodegradation of tDOM should not play an important role in the LS either. Flocculation of DOM in the Lena River plume has been postulated as a theoretically possible removal mechanism for DOM in summer (Gonçalves-Araujo et al., 2015), which was, however, not directly observed. An investigation of the under-ice river plume during the spring freshet in 1996 (Hölemann et al., 2005) also gave no indication of flocculation processes. Furthermore, Gonçalves-Araujo et al. (2015) found that the degradation of tDOM by microbial processes plays only a minor role in the Lena Delta region. Nevertheless, if we would assume that 50 % of the tDOM were removed shortly after the spring freshet, the aCDOM(350) values observed in the LS should be much lower because the seawater is further diluted by CDOM-poor meltwater from the land-fast ice (Fig. 5b) that melts in the southeastern LS in June/July. This process, important to the LS and ESS, is discussed in more detail in the next two chapters.
4.2 The importance of land-fast ice meltwater for the distribution of tDOM in the LS
DOM is expelled from the ice matrix during sea-ice growth and is enriched in the brine (Giannelli et al., 2001; Müller et al., 2013). Only about 10 to 40 % of the original DOM and other impurities remain in the sea ice (Petrich and Eicken, 2010). Furthermore, Müller et al. (2013) were able to show that a relatively higher proportion of DOM is incorporated into the sea ice in relation to the dissolved inorganic substances. Most of the DOM then flows off into the underlying water column along with the saline brine (Amon, 2004; Anderson and Macdonald, 2015). This explains the observed low aCDOM(350) of 0.99 m−1 (median) and DOC concentration of 96.2 µmol L−1 (median) in the LS land-fast ice that forms from tDOM-rich surface waters sourced by the Lena River (Fig. 5b). Helms et al. (2008) showed that as a result of this process, the molecular weights of DOM in the ice and brine also decrease. Jørgensen et al. (2015) further suggest that the transformations of DOM during sea-ice formation also increase its bioavailability. We assume that the transformation processes of the DOM during ice growth, which shifts the molecular composition of DOM in the ice towards a higher proportion of low molecular weight compounds (Müller et al., 2013; Granskog et al., 2015a; Retelletti-Brogi et al., 2018; Zabłocka et al., 2020), are also responsible for the high S275−290 values (> 19 µm−1) of CDOM in the ice (Fig. 5b).
The formation of the land-fast ice, which stores 30 %–50 % of the annual freshwater discharge of the Lena River (Eicken et al., 2005), begins in mid-November with phases of rapid development in January and February (Selyuzhenok et al., 2015) during which the release of tDOM-rich brine is highest. In the following summer, when the land-fast ice melts, the tDOM-poor meltwater mixes with the ambient seawater and thus could dilute the tDOM concentration of the surface mixed layer (Mathis et al., 2005; Logvinova et al., 2016). North of the Lena Delta, sea-ice melt begins in June (Janout et al., 2020) and progresses eastwards, while the seaward edge of the land ice slowly moves southwards (Selyuzhenok et al., 2015). In general, the ice in the southeastern LS retreats completely by the end of July. The melting of sea-ice and land-fast ice in the southeastern LS thus occurs at the same time and in the same region where the spring freshet enters the LS, leading to a mixing of the two surface water masses (Bauch et al, 2013).
To assess the influence of mixing on the tDOM concentration, we calculated the first tDOM budget for the southeastern LS. During the course of the freshet in 2014 the Lena discharged about 211 km3 of freshwater with a flow-weighted average aCDOM(350) of 26.1 m−1 and a DOC load of 2.83 Tg. The maximum land-fast ice area in the southeastern LS is 134×103 km2 (Selyuzhenok et al., 2015) with an average ice thickness of 2.04 m (Kotchetov et al., 1994; Barreis and Görgen, 2005). With a salinity of 3.6 (median), the land-fast ice thus holds a freshwater equivalent of 245 km3 (reference salinity 34.8) with a median aCDOM(350) of 0.99 m−1 and a total DOC load of 0.28 Tg. Our budget calculations reveal that the mixing product (MIX) of land-fast-ice meltwater and the river water from the spring freshet has an aCDOM(350) of 12.6 m−1 (Fig. 7). This is close to the average aCDOM(350) of the post-freshet discharge of the Lena River of 14.4 m−1 (SD ± 3.4 m−1).

Figure 7Salinity and aCDOM350 measured in land-fast ice from the LS (squares), Lena River water during the spring freshet in May/June 2014 (stars), and marine waters from the LS (black dots) and ESS (red dots). The dashed lines represent the theoretical conservative mixing lines between the spring-freshet river water (flow-weighted CDOM absorption) and the Nansen Basin (NB) seawater, as well as between the mixing product of the spring-freshet river water with the land ice meltwater (MIX) and the seawater. The green squares indicate aCDOM350 endmember values of the spring-freshet river water and land-fast ice meltwater (freshwater equivalent), as well as the calculated endmember value for the mixing product of the two sources.
Since aCDOM(350) is in the same range in MIX and in post-freshet river water, the three main freshwater sources (spring-freshet river water, post-freshet river water and meltwater from the land-fast ice) appear as a single freshwater endmember in the aCDOM(350) vs. salinity (and frw) distribution. Because the sampling season in the southeastern LS ends when the land-fast ice begins to melt and does not start again until August, it has not yet been possible to take samples during the important phase of MIX water mass formation.
The proportions of meltwater and brine visible in the oxygen isotope data from the LS at salinities > 25 are not clearly pronounced at salinities < 25 (Fig. 4a). However, the observation that the oxygen isotope data from the shelf water with salinities < 25 show no dilution with meltwater but even indicate increased amounts of brine does not mean that no meltwater was added. This seemingly contradictory conclusion can be explained by the high export of sea ice in winter (Itkin and Krumpen, 2017). Part of the brine formed in winter is still present in the LS the following summer (Bauch et al., 2009a), while the newly formed sea ice from which the brine originates is continuously exported to the central AO. Because of the high sea-ice export, relatively young and thin drifting pack ice (< 50 cm) covers most of the LS north of the land-fast ice at the end of winter (Itkin and Krumpen, 2017). The melting of this thin pack-ice cover and the land-fast ice leads to a weakening of the isotopic brine signal (Bauch et al., 2013), but the isotopic composition nevertheless remains dominated by the brine-enriched winter water. Hence, the stable oxygen isotope signal of the sea-ice meltwater fraction is masked by the high brine signal from the winter. When interpreting the isotope data, it is important to note that the calculated sea-ice meltwater fractions do not include the meltwater resulting from the high and variable proportion of frozen river water that was part of the land-fast ice (Bauch et al., 2010). Thus δ18O measurements of land-fast ice from the LS cannot be used directly as an endmember for sea-ice meltwater.
Constructing the theoretical conservative mixing line (aCDOM(350) vs. salinity) between MIX and the Nansen Basin seawater (Fig. 7) reveals that the samples from the LS lie within the range of this mixing line. However, the linear fit between aCDOM(350) and frw (Fig. 4b) shows a freshwater endmember whose aCDOM(350) is about 30 % lower than in MIX or in the post-freshet river water of the Lena. This could be an indication for the photochemical or microbial removal of tDOM in the LS shelf system. However, in this context it must also be taken into account that the freezing of the river water in the fast ice – 30 %–50 % of the annual freshwater discharge of the Lena River (Eicken et al., 2005) – also leads to the extraction of tDOM from the river water. Although biogeochemical- and/or photochemical-induced removal of tDOM cannot be ruled out, our results suggest that the mixing of multiple water masses rather than removal is the main factor controlling tDOM distribution in the LS. Similar findings were discussed for the Chukchi Sea (Tanaka et al., 2016).
Previous studies indicate that approximately 30 % of the river-induced DOC is already remineralised on the shelf (Cooper et al., 2005), with the western ESS being a hotspot for organic matter degradation (Anderson et al., 2011; Anderson and Amon, 2015; Semiletov et al., 2016). Thus, increased removal of tDOM could also be the cause for the low-tDOM cluster of samples that we observed in the LS in September 2011 (red outlined dots in Fig. 4a and b). This cluster represents water samples from the upper water column (< 20 m) north of the Lena Delta that has a frw of 40 %–60 % (Fig. 4b). The aCDOM(350) in the low-aCDOM(350) cluster was up to 50 % lower than in samples with the same frw percentage lying on the mixing line of river water (summer discharge) and seawater. The general hydrography of the LS in September 2011 was characterised by low surface mixed layer salinities and sea surface temperatures (SSTs), which were ∼ 2 ∘C higher than the long-term average (ERA5; Copernicus Climate Change Service, 2017). High SSTs caused by solar warming support the assumption that photodegradation could be the major factor leading to tDOM loss and a S275−295 > 20 µm−1 (Fig. 4b). An alternative explanation to the removal of tDOM in 2011 could be a change in the relative proportion of one of the freshwater endmembers or a change in concentration in one of the tDOM sources. In 2011, large areas of the southeastern LS were covered by melting land-fast ice until the end of July. Exceptionally strong southeasterly winds in August 2011 (Janout et al., 2020) steered the land-fast ice meltwater plume to the northwest, resulting in additional mixing of CDOM-poor meltwater into the shelves north of the Lena Delta and further dilution of the shelf water, leading to low aCDOM(350).
The relationship between salinity and aCDOM(350) measured in the ESS in summer 2019 was significantly different from the relationship observed in the LS. The entire ESS shelf had salinities above 20, and aCDOM(350) was about 50 % lower than in LS samples having the same salinity (Fig. 5a coloured dots and Fig. 7 red dots). During sampling in the last week of September 2019, the ESS was ice-free. However, during the first week of July 2019, the ESS was almost completely covered with land-fast ice and drifting pack ice that did not completely melt until the last week of July (data from https://www.meereisportal.de, last access: 9 February 2021; Spreen et al., 2008).
Pugach et al. (2018) found that the distribution of tDOM concentration in the ESS is mainly controlled by wind forcing. During our sampling in the ESS in 2019, winds from the east (ERA5; Copernicus Climate Change Service, 2017) pushed the inflow from the Pacific Ocean westward far onto the ESS shelf. At the same time, southeasterly winds over the LS might have blocked the Lena ROFI from extending into the western ESS (Anderson et al., 2011; Janout et al., 2020). In addition, summer 2019 was characterised by anomalously low river discharge into the LS and ESS (ArcticGRO version 2020-01-23; Shiklomanov et al., 2020). The wind forcing and low river discharge led to a tDOM and salinity distribution in the ESS in 2019 that was comparable to the distribution in 2008 and 2011, during which wind forcing was similar (Alling et al., 2010; Pugach et al., 2018). In contrast, in summers when the Lena River ROFI extends further eastward, the western ESS is characterised by lower salinities and higher tDOM concentrations (Pugach et al., 2018), with a salinity–tDOM relationship that corresponds to the one we observed in the ROFI of the LS. Alling et al. (2010) assumed that due to the long residence time of the water of the Lena River on the ESS shelf, degradation of tDOM may be more advanced, leading to generally low tDOM concentrations in the western ESS, as observed in August and September 2008. This assumption is supported by the generally high S275−295 values (Fig. 5a), which indicate that the CDOM in the ESS has already been strongly transformed (e.g. by photochemical processes), but as in the LS, the addition of large amounts of DOM-poor meltwater from the land-fast ice and meltwater from the pack ice, which may show even lower CDOM absorptions (Kowalczuk et al., 2017), should result in a strong dilution of the riverine tDOM. The ESS west of 170∘ E is characterised by an extensive land-fast ice belt that varies in extent from 130 000 to 200 000 km2. The land-fast ice, which contains a freshwater equivalent of 230–360 km3, usually melts back in the first 2 weeks of July, and drifting fields of decaying ice might persist until August. We assume that the absence of the Lena ROFI in the western ESS, the generally low river runoff and the resulting higher fraction of low-tDOM sea-ice meltwater in the ESS led to the comparatively low tDOM concentrations in the western ESS observed in 2008 and 2019. This assumption contradicts Alling et al. (2010), who emphasise that the analysis of oxygen isotope data showed no evidence of meltwater input in the western ESS in September 2008. However, as the analysis of the ice distribution in 2008 (data from https://seaice.uni-bremen.de/data, last access: 9 February 2021; Spreen et al., 2008) shows, the land-fast ice still covered large areas of the southern ESS in mid-July. It is therefore more likely that the difficulty in interpreting oxygen isotope data from seasonally ice-covered shelves, which are characterised by high sea-ice export rates and thus high brine fractions in the water column (negative fsim values; see Sect. 4.2), has resulted in the masking of the sea-ice meltwater signal (positive fsim value).
5.1 Transport dynamics of tDOM-rich brines in the LS
We used fast ice and seawater data from the southeastern LS to estimate how much DOC might be expelled along with brine from growing land-fast ice in the LS. The observed average DOC concentration in surface waters (0–5 m) east of the Lena Delta (south of 73.4∘ N and east of 125.0∘ E) was 475 µmol L−1 (SD ± 165 µmol L−1). Thus, the observed median DOC concentration in the land-fast ice of 96.2 µmol L−1 indicates that 379 µmol L−1 has been removed during ice growth. This resulting value was multiplied by the total volume of fast ice (273 km3; Kotchetov et al., 1994; Barreis and Görgen, 2005; Selyuzhenok et al., 2005). Assuming that the DOC is removed from the ice along with the brines, about 1.2 Tg yr−1 (± 0.54 Tg) DOC would thus be expelled from the growing land-fast ice. The process of brine release is reflected in the water samples from the polynya at the northern land-fast ice edge in the southeastern LS, which show high brine fractions with simultaneously increased aCDOM(350) (Ti12, winter 2012). This budget calculation, however, does not take into account that the DOM in the brines has a higher bioavailability (Jørgensen et al., 2015). Thus, the rapid removal of DOC in the brine or the remineralisation of the remaining ice-bound DOC could also play an important role.
Due to the low salinity of the surface mixed layer in the southeast LS at the beginning of the freezing season and the continuous outflow of freshwater from the Lena River in winter (Juhls et al., 2020), the loss of buoyancy, which resulted from the addition of brine to the surface mixed layer, is not high enough to completely erode the pycnocline by convective mixing processes. This leads to permanently stratified waters under the land-fast ice of the southeastern LS (Bauch et al., 2009a), as well as in the polynya north of the Lena Delta, even during phases of high ice production (Krumpen et al., 2011). The strong stratification results in the trapping of tDOM-rich brines in the upper water column followed by advection, together with the winter river discharge (Macdonald et al., 1995). How fast the brines are advected across the shelf depends on the ocean currents in winter. Eicken et al. (2005) described under-ice spreading velocities of 1–2.7 cm s−1. Moored velocity records from below the land-fast ice (1998–1999, Hölemann unpub. data) showed a residual northeastward flow of ∼ 2 cm s−1. These velocities are on the same order of magnitude as those measured north of the Lena Delta in winter (Bauch et al., 2010; Janout et al., 2013). Further north the geostrophic velocity fields show eastward velocities above 5 cm s−1 with northward directions on the northeastern LS shelf in March/April (Kwok and Morrison, 2011). At the continental margin residual eastward velocities can reach more than 20 cm s−1 (Janout et al., 2015). The tDOM-rich brine formed in the southeast LS in December could thus be transported over several hundred kilometres in a northeasterly direction until the end of June, when the land-fast ice melts. This is in accordance with Bauch et al. (2009b) who showed that the residence time of the brines on the shelf could be as short as 1 year. A significant proportion of the surface waters (0–20 m) of the LS and western ESS leaves the Siberian shelf north of the New Siberian Islands (Morison and Kwok, 2012) and supplies the Transpolar Drift Stream with tDOM-rich water masses (Charette et al., 2020), while denser bottom waters flow north of the New Siberian Island further to the east and leave the shelf in the western ESS (Anderson et al., 2017). The transport of tDOM in the water masses at the upper halocline is confirmed by investigations in the East Greenland Current where a higher CDOM absorption occurring between 30 and 120 m water depth at salinities between 32 and 33 is explained by a high fraction of brine and river water from the Siberian shelves (Granskog et al., 2012).
During the northward transport of the brine-enriched water masses across the shelf, an increase in density occurs due to the further influx of brines from ice formation in leads and coastal polynyas of the western LS (Janout et al., 2017). Erosion of the density stratification at the end of winter and mixing with denser water masses from the western shelf of the LS could dilute the tDOM-rich brines from the southeastern LS but at the same time increase the density and bring them to greater water depths where they then flow into the Arctic halocline. The seasonal evolution of the density stratification in the LS is described in more detail in Janout et al. (2020). The water depth at which the brine is transported across the LS shelf and into the Arctic halocline depends mainly on the density structure of the water column in winter, which in turn depends on the position of the ROFI in the previous summer (Bauch et al., 2012). An eastward-directed transport south of the New Siberian Islands towards the ESS at a depth greater than ∼ 20 m is inhibited by the shallow water depths of the Dmitry Laptev (10 m) and Sannikov straits (18 m).
The eastern LS and western ESS together represent a region where much of the freshwater-influenced waters of the Siberian shelves discharge into the transpolar drift current and the Arctic halocline, which carries the shelf waters towards Greenland and the Nordic seas (Morison et al., 2012; Timmermans and Marshall, 2020). This region is thus a key region for a better understanding of the Arctic marine carbon cycle. Analysis of the extensive data set in this study, spanning several years and different seasons, illustrates that the distribution of tDOM in the LS and ESS is mainly determined by the physical mixing of river water, sea-ice meltwater and seawater. Our study highlights that the formation and melting of land-fast ice in the Laptev and East Siberian seas significantly shapes the concentration distribution of tDOM in the area of the Siberian shelf seas. In this context, the observed concentration distribution on the shelves indicates a conservative mixing behaviour of tDOM introduced by the river rather than a removal or an additional DOM supply from other sources. The reason for this could be the short residence time of the river water on the Siberian shelves, as well as a reduced photochemical degradation of the tDOM due to the ice cover of the southern shelves lasting until July. The extremely high CDOM absorption and suspended matter concentrations within the ROFI (Juhls et al., 2019; Heim et al., 2014), which lead to a self-shadowing effect, may also reduce photodegradation. The results of the study also illustrate that the growth of fast ice and the associated formation of CDOM-rich brines have an important role in the transport pathways of tDOM across the Siberian shelves and the AO.
The duration of the land-fast-ice season in the LS is reduced by 2.8 d per year (observational period 1999 to 2013; Seyushenok et al., 2015), while in the second decade of the 21st century the onset of the spring freshet of the Lena River happens about 6 d earlier than at the beginning of the observational period in 1940 (Shiklomanov et al., 2020). Further changes of the ice regime and the timing of spring freshet will certainly have an impact on the dynamics of tDOM in the AO. In addition, the decline of Arctic sea ice and the associated longer ice-free season will lead to changes in wind forcing in the shelf systems of the Arctic and to an increased input of solar radiation into the water column. This will significantly change freshwater transport pathways, the heat content of the water column, and stratification in the LS and ESS. The heat content in turn influences the formation of new ice and thus also the production of DOM-rich brines. Because density stratification also controls where and at which depth the DOM-rich brine leaves the shelf, changes in stratification also impact the future transport pathways of tDOM in the AO. Studying these processes is important not only to decipher the Arctic carbon cycle but also because it regulates physical processes such as radiative forcing in the upper ocean, which has important effects on, for example, sea surface temperature, water column stratification and UV penetration (Pegau, 2002; Hill, 2008; Granskog et al., 2015b; Gnanadeskian et al., 2019; Soppa et al., 2019).
The data sets used for this study (Table 1) can be downloaded from the Pangaea website (Bauch and Thibodeau, 2020; Bauch et al., 2018; Eulenburg et al., 2019; Hölemann et al., 2020a, b, c, d, e, f, g; Kattner et al., 2010).
JAH was responsible for sample collection, data analysis, and the organisation and writing of the manuscript. BJ, MJ and DB contributed with discussions and data collection at sea. BPK analysed the DOC samples and contributed with discussions. BH contributed with discussions and data records. All authors contributed to the article and approved the submitted version.
The authors declare that they have no conflict of interest.
This article reflects only the authors' views; the
funding agencies and their executive agencies are not responsible for any
use that may be made of the information that the article contains.
Publisher's note: Copernicus Publications remains neutral with regard to jurisdictional claims in published maps and institutional affiliations.
We thank the crews and colleagues on board the research vessels involved in sampling. Our thanks also go to the helicopter pilots, the staff of the airport in Tiksi and the colleagues who made the winter expedition possible. We also thank the colleagues of the Russian–German Otto Schmidt Laboratory in St. Petersburg for support and accessibility of laboratory instruments for sample analysis. We are grateful to Piotr Kowalczuk and an anonymous reviewer for the constructive comments on the manuscript. Our special thanks go to Heidemarie Kassens who headed all summer and winter expeditions and made sure that the scientific programme could be carried out as planned even under the most difficult conditions. We greatly acknowledge Leonid A. Timokhov, Heidemarie Kassens and Vladimir V. Ivanov for coordinating the German–Russian Laptev Sea System project.
This research has been supported by
the Bundesministerium für Bildung und Forschung (grant nos. 03G0833 and 03F0776). Bennet Juhls was supported by Geo. X, the Research Network for Geosciences in Berlin and Potsdam (grant no. SO_087_GeoX).
The article processing charges for this open-access publication were covered by the Alfred Wegener Institute, Helmholtz Centre for Polar and Marine Research (AWI).
This paper was edited by Anja Engel and reviewed by Piotr Kowalczuk and one anonymous referee.
Alling, V., Sanchez-Garcia, L., Porcelli, D., Pugach, S., Vonk, J. E., van Dongen, B., Morth, C. M., Anderson, L. G., Sokolov, A., Andersson, P., Humborg, C., Semiletov, I., and Gustafsson, O.: Nonconservative behavior of dissolved organic carbon across the Laptev and East Siberian seas, Global Biogeochem. Cy., 24, Gb4033, https://doi.org/10.1029/2010gb003834, 2010.
Amon, R. M. W.: The role of dissolved organic matter for the organic carbon cycle in the Arctic Ocean, in: The organic carbon cycle in the Arctic Ocean, edited by: Stein, R. and MacDonald, R. W., Springer Verlag, Berlin, 83–99, 2004.
Amon, R. M. W. and Meon, B.: The biogeochemistry of dissolved organic matter and nutrients in two large Arctic estuaries and potential implications for our understanding of the Arctic Ocean system, Mar. Chem., 92, 311–330, https://doi.org/10.1016/j.marchem.2004.06.034, 2004.
Amon, R. M. W., Rinehart, A. J., Duan, S., Louchouarn, P., Prokushkin, A., Guggenberger, G., Bauch, D., Stedmon, C., Raymond, P. A., Holmes, R. M., McClelland, J. W., Peterson, B. J., Walker, S. A., and Zhulidov, A. V.: Dissolved organic matter sources in large Arctic rivers, Geochim. Cosmochim. Ac., 94, 217–237, https://doi.org/10.1016/j.gca.2012.07.015, 2012.
Anderson, L. G. and Amon, R. M. W.: DOM in the Arctic Ocean, chap. 14, in: Biogeochemistry of Marine Dissolved Organic Matter (2nd Edn.), edited by: Hansell, D. A. and Carlson, C. A., Academic Press, Boston, 609–633, 2015.
Anderson, L. G. and Macdonald, R. W.: Observing the Arctic Ocean carbon cycle in a changing environment, Polar Res., 34, 26891, https://doi.org/10.3402/polar.v34.26891, 2015.
Anderson, L. G., Bjork, G., Jutterstrom, S., Pipko, I., Shakhova, N., Semiletov, I., and Wahlstrom, I.: East Siberian Sea, an Arctic region of very high biogeochemical activity, Biogeosciences, 8, 1745–1754, https://doi.org/10.5194/bg-8-1745-2011, 2011.
Anderson, L. G., Bjork, G., Holby, O., Jutterstrom, S., Morth, C. M., O'Regan, M., Pearce, C., Semiletov, I., Stranne, C., Stoven, T., Tanhua, T., Ulfsbo, A., and Jakobsson, M.: Shelf-Basin interaction along the East Siberian Sea, Ocean Sci., 13, 349–363, https://doi.org/10.5194/os-13-349-2017, 2017.
Bareiss, J. and Görgen, K.: Spatial and temporal variability of sea ice in the Laptev Sea: Analyses and review of satellite passive-microwave data and model results, 1979 to 2002, Global Planet. Change, 48, 28–54, https://doi.org/10.1016/j.gloplacha.2004.12.004, 2005.
Bauch, D. and Thibodeau, B.: Stable oxygen isotope analysis of water samples during helicopter/ice camp TRANSDRIFT-XX, Laptev Sea, PANGAEA [Dataset], https://doi.org/10.1594/PANGAEA.924538, 2020.
Bauch, D., Erlenkeuser, H., and Andersen, N.: Water mass processes on Arctic shelves as revealed from delta O-18 of H2O, Global Planet. Change, 48, 165–174, https://doi.org/10.1016/j.gloplacha.2004.12.011, 2005.
Bauch, D., Dmitrenko, I. A., Wegner, C., Hölemann, J., Kirillov, S. A., Timokhov, L. A., and Kassens, H.: Exchange of Laptev Sea and Arctic Ocean halocline waters in response to atmospheric forcing, J. Geophys. Res.-Ocean., 114, C05008, https://doi.org/10.1029/2008jc005062, 2009a.
Bauch, D., Dmitrenko, I., Kirillov, S., Wegner, C., Hölemann, J., Pivovarov, S., Timokhov, L., and Kassens, H.: Eurasian Arctic shelf hydrography: Exchange and residence time of southern Laptev Sea waters, Cont. Shelf Res., 29, 1815, https://doi.org/10.1016/j.csr.2009.06.009, 2009b.
Bauch, D., Hölemann, J., Willmes, S., Groger, M., Novikhin, A., Nikulina, A., Kassens, H., and Timokhov, L.: Changes in distribution of brine waters on the Laptev Sea shelf in 2007, J. Geophys. Res.-Ocean., 115, C11008, https://doi.org/10.1029/2010jc006249, 2010.
Bauch, D., van der Loeff, M. R., Andersen, N., Torres-Valdes, S., Bakker, K., and Abrahamsen, E. P.: Origin of freshwater and polynya water in the Arctic Ocean halocline in summer 2007, Prog. Oceanogr., 91, 482–495, https://doi.org/10.1016/j.pocean.2011.07.017, 2011.
Bauch, D., Hölemann, J. A., Dmitrenko, I. A., Janout, M. A., Nikulina, A., Kirillov, S. A., Krumpen, T., Kassens, H., and Timokhov, L.: Impact of Siberian coastal polynyas on shelf-derived Arctic Ocean halocline waters, J. Geophys. Res.-Ocean., 117, C00g12, https://doi.org/10.1029/2011jc007282, 2012.
Bauch, D., Hölemann, J. A., Nikulina, A., Wegner, C., Janout, M. A., Timokhov, L. A., and Kassens, H.: Correlation of river water and local sea-ice melting on the Laptev Sea shelf (Siberian Arctic), J. Geophys. Res.-Ocean., 118, 550–561, https://doi.org/10.1002/jgrc.20076, 2013.
Bauch, D., Cherniavskaia, E., Novikhin, A., and Kassens, H.: Physical oceanography, nutrients, and δ18O measured on water bottle samples in the Laptev Sea, PANGAEA [Dataset], https://doi.org/10.1594/PANGAEA.885448, 2018.
Bélanger, S., Xie, H. X., Krotkov, N., Larouche, P., Vincent, W. F., and Babin, M.: Photomineralization of terrigenous dissolved organic matter in Arctic coastal waters from 1979 to 2003: Interannual variability and implications of climate change, Global Biogeochem. Cy., 20, Gb4005, https://doi.org/10.1029/2006gb002708, 2006.
Biskaborn, B. K., Smith, S. L., Noetzli, J., Matthes, H., Vieira, G., Streletskiy, D. A., Schoeneich, P., Romanovsky, V. E., Lewkowicz, A. G., Abramov, A., Allard, M., Boike, J., Cable, W. L., Christiansen, H. H., Delaloye, R., Diekmann, B., Drozdov, D., Etzelmuller, B., Grosse, G., Guglielmin, M., Ingeman-Nielsen, T., Isaksen, K., Ishikawa, M., Johansson, M., Johannsson, H., Joo, A., Kaverin, D., Kholodov, A., Konstantinov, P., Kroger, T., Lambiel, C., Lanckman, J. P., Luo, D. L., Malkova, G., Meiklejohn, I., Moskalenko, N., Oliva, M., Phillips, M., Ramos, M., Sannel, A. B. K., Sergeev, D., Seybold, C., Skryabin, P., Vasiliev, A., Wu, Q. B., Yoshikawa, K., Zheleznyak, M., and Lantuit, H.: Permafrost is warming at a global scale, Nat. Commun., 10, 264, https://doi.org/:10.1038/s41467-018-08240-4, 2019.
Cauwet, G. and Sidorov, I.: The biogeochemistry of Lena River: Organic carbon and nutrients distribution, Mar. Chem., 53, 211–227, https://doi.org/10.1016/0304-4203(95)00090-9, 1996.
Charette, M. A., Kipp, L. E., Jensen, L. T., Dabrowski, J. S., Whitmore, L. M., Fitzsimmons, J. N., Williford, T., Ulfsbo, A., Jones, E., Bundy, R. M., Vivancos, S. M., Pahnke, K., John, S. G., Xiang, Y., Hatta, M., Petrova, M. V., Heimbürger-Boavida, L.-E., Bauch, D., Newton, R., Pasqualini, A., Agather, A. M., Amon, R. M. W., Anderson, R. F., Andersson, P. S., Benner, R., Bowman, K. L., Edwards, R. L., Gdaniec, S., Gerringa, L. J. A., González, A. G., Granskog, M., Haley, B., Hammerschmidt, C. R., Hansell, D. A., Henderson, P. B., Kadko, D. C., Kaiser, K., Laan, P., Lam, P. J., Lamborg, C. H., Levier, M., Li, X., Margolin, A. R., Measures, C., Middag, R., Millero, F. J., Moore, W. S., Paffrath, R., Planquette, H., Rabe, B., Reader, H., Rember, R., Rijkenberg, M. J. A., Roy-Barman, M., Rutgers van der Loeff, M., Saito, M., Schauer, U., Schlosser, P., Sherrell, R. M., Shiller, A. M., Slagter, H., Sonke, J. E., Stedmon, C., Woosley, R. J., Valk, O., van Ooijen, J., and Zhang, R.: The Transpolar Drift as a Source of Riverine and Shelf-Derived Trace Elements to the Central Arctic Ocean, J. Geophys. Res.-Ocean., 125, 1–34, https://doi.org/10.1029/2019jc015920, 2020.
Coble, P. G.: Marine optical biogeochemistry: The chemistry of ocean color, Chem. Rev., 107, 402–418, https://doi.org/10.1021/cr050350+, 2007.
Cooper, L. W., Benner, R., McClelland, J. W., Peterson, B. J., Holmes, R. M., Raymond, P. A., Hansell, D. A., Grebmeier, J. M., and Codispoti, L. A.: Linkages among runoff, dissolved organic carbon, and the stable oxygen isotope composition of seawater and other water mass indicators in the Arctic Ocean, J. Geophys. Res.-Biogeo., 110, G02013, https://doi.org/10.1029/2005jg000031, 2005.
Craig, H.: Standard for Reporting Concentrations of Deuterium and Oxygen-18 in Natural Waters, Science, 133, 1833–1834, https://doi.org/10.1126/science.133.3467.1833, 1961.
Danhiez, F. P., Vantrepotte, V., Cauvin, A., Lebourg, E., and Loisel, H.: Optical properties of chromophoric dissolved organic matter during a phytoplankton bloom. Implication for DOC estimates from CDOM absorption, Limnol. Oceanogr., 62, 1409–1425, https://doi.org/10.1002/lno.10507, 2017.
Dittmar, T. and Kattner, G.: The biogeochemistry of the river and shelf ecosystem of the Arctic Ocean: a review, Mar. Chem., 83, 103–120, https://doi.org/10.1016/S0304-4203(03)00105-1, 2003.
Eicken, H., Dmitrenko, I., Tyshko, K., Darovskikh, A., Dierking, W., Blahak, U., Groves, J., and Kassens, H.: Zonation of the Laptev Sea landfast ice cover and its importance in a frozen estuary, Global Planet. Change, 48, 55–83, https://doi.org/10.1016/j.gloplacha.2004.12.005, 2005.
Eulenburg, A., Juhls, B., and Hölemann, J. A.: Surface water dissolved organic matter (DOC, CDOM) in the Lena River, PANGAEA [Dataset], https://doi.org/10.1594/PANGAEA.898711, 2019.
Fichot, C. G. and Benner, R.: The spectral slope coefficient of chromophoric dissolved organic matter (S275–295) as a tracer of terrigenous dissolved organic carbon in river-influenced ocean margins, Limnol. Oceanogr., 57, 1453–1466, https://doi.org/10.4319/lo.2012.57.5.1453, 2012.
Frey, K. E. and Smith, L. C.: Amplified carbon release from vast West Siberian peatlands by 2100, Geophys. Res. Lett., 32, L09401, https://doi.org/10.1029/2004gl022025, 2005.
Giannelli, V., Thomas, D. N., Haas, C., Kattner, G., Kennedy, H., and Dieckmann, G. S.: Behaviour of dissolved organic matter and inorganic nutrients during experimental sea-ice formation, Ann. Glaciol., 33, 317–321, https://doi.org/10.3189/172756401781818572, 2001.
Gnanadesikan, A., Kim, G. E., and Pradal, M. A. S.: Impact of Colored Dissolved Materials on the Annual Cycle of Sea Surface Temperature: Potential Implications for Extreme Ocean Temperatures, Geophys. Res. Lett., 46, 861–869, https://doi.org/10.1029/2018gl080695, 2019.
Gonçalves-Araújo, R., Stedmon, C. A., Heim, B., Dubinenkov, I., Kraberg, A., Moiseev, D., and Bracher, A.: From Fresh to Marine Waters: Characterization and Fate of Dissolved Organic Matter in the Lena River Delta Region, Siberia, Front. Mar. Sci., 2, 108, https://doi.org/10.3389/fmars.2015.00108, 2015.
Granskog, M. A.: Changes in spectral slopes of colored dissolved organic matter absorption with mixing and removal in a terrestrially dominated marine system (Hudson Bay, Canada), Mar. Chem., 134/135, 10–17, https://doi.org/10.1016/j.marchem.2012.02.008, 2012.
Granskog, M. A., Macdonald, R. W., Kuzyk, Z. Z. A., Senneville, S., Mundy, C.-J., Barber, D. G., Stern, G. A., and Saucier, F.: Coastal conduit in southwestern Hudson Bay (Canada) in summer: Rapid transit of freshwater and significant loss of colored dissolved organic matter, J. Geophys. Res.-Ocean., 114, C08012, https://doi.org/10.1029/2009JC005270, 2009.
Granskog, M. A., Stedmon, C. A., Dodd, P. A., Amon, R. M. W., Pavlov, A. K., de Steur, L., and Hansen, E.: Characteristics of colored dissolved organic matter (CDOM) in the Arctic outflow in the Fram Strait: Assessing the changes and fate of terrigenous CDOM in the Arctic Ocean, J. Geophys. Res.-Ocean., 117, C12021, https://doi.org/10.1029/2012jc008075, 2012.
Granskog, M. A., Nomura, D., Muller, S., Krell, A., Toyota, T., and Hattori, H.: Evidence for significant protein-like dissolved organic matter accumulation in Sea of Okhotsk sea ice, Ann. Glaciol., 56, 1–8, 10.3189/2015AoG69A002, 2015a.
Granskog, M. A., Pavlov, A. K., Sagan, S., Kowalczuk, P., Raczkowska, A., and Stedmon, C. A.: Effect of sea-ice melt on inherent optical properties and vertical distribution of solar radiant heating in Arctic surface waters, J. Geophys. Res.-Ocean., 120, 7028–7039, https://doi.org/10.1002/2015jc011087, 2015b.
Gueguen, C., Guo, L. D., and Tanaka, N.: Distributions and characteristics of colored dissolved organic matter in the Western Arctic Ocean, Cont. Shelf Res., 25, 1195–1207, https://doi.org/10.1016/j.csr.2005.01.005, 2005.
Guo, L. D., Ping, C. L., and Macdonald, R. W.: Mobilization pathways of organic carbon from permafrost to arctic rivers in a changing climate, Geophys. Res. Lett., 34, L13603, https://doi.org/10.1029/2007gl030689, 2007.
Haine, T. W. N., Curry, B., Gerdes, R., Hansen, E., Karcher, M., Lee, C., Rudels, B., Spreen, G., de Steur, L., Stewart, K. D., and Woodgate, R.: Arctic freshwater export: Status, mechanisms, and prospects, Global Planet. Change, 125, 13–35, https://doi.org/10.1016/j.gloplacha.2014.11.013, 2015.
Heim, B., Abramova, E., Doerffer, R., Gunther, F., Hölemann, J., Kraberg, A., Lantuit, H., Loginova, A., Martynov, F., Overduin, P. P., and Wegner, C.: Ocean colour remote sensing in the southern Laptev Sea: evaluation and applications, Biogeosciences, 11, 4191–4210, https://doi.org/10.5194/bg-11-4191-2014, 2014.
Helms, J. R., Stubbins, A., Ritchie, J. D., Minor, E. C., Kieber, D. J., and Mopper, K.: Absorption spectral slopes and slope ratios as indicators of molecular weight, source, and photobleaching of chromophoric dissolved organic matter, Limnol. Oceanogr., 53, 955–969, https://doi.org/10.4319/lo.2008.53.3.0955, 2008.
Hill, V. J.: Impacts of chromophoric dissolved organic material on surface ocean heating in the Chukchi Sea, J. Geophys. Res.-Ocean., 113, C07024, https://doi.org/10.1029/2007jc004119, 2008.
Hölemann, J. A., Schirmacher, M., and Prange, A.: Seasonal variability of trace metals in the Lena River and the southeastern Laptev Sea: Impact of the spring freshet, Global Planet. Change, 48, 112–125, https://doi.org/10.1016/j.gloplacha.2004.12.008, 2005.
Hölemann, J. A., Juhls, B., and Timokhov, L. A.: Colored dissolved organic matter (CDOM) measured during cruise TRANSDRIFT-XVII, Laptev Sea, PANGAEA [Dataset], https://doi.org/10.1594/PANGAEA.924206, 2020a.
Hölemann, J., Koch, B. P., Juhls, B., and Timokhov, L. A.: Colored dissolved organic matter (CDOM) and dissolved organic carbon (DOC) measured during cruise TRANSDRIFT-XIX, Laptev Sea, PANGAEA [Dataset], https://doi.org/10.1594/PANGAEA.924209, 2020b.
Hölemann, J. A., Koch, B. P., Juhls, B., and Timokhov, L. A.: Colored dissolved organic matter (CDOM) and dissolved organic carbon (DOC) measured during helicopter/ice camp TRANSDRIFT-XX, Laptev Sea, PANGAEA [Dataset], https://doi.org/10.1594/PANGAEA.924228, 2020c.
Hölemann, J. A., Juhls, B., and Timokhov, L. A.: Colored dissolved organic matter (CDOM) measured during cruise TRANSDRIFT-XXI, Laptev Sea, PANGAEA [Dataset], https://doi.org/10.1594/PANGAEA.924203, 2020d.
Hölemann, J., Koch, B. P., Juhls, B., and Timokhov, L. A.: Colored dissolved organic matter (CDOM) and dissolved organic carbon (DOC) measured during cruise TRANSDRIFT-XXII, Laptev Sea, PANGAEA [Dataset], https://doi.org/10.1594/PANGAEA.924202, 2020e.
Hölemann, J. A., Koch, B. P., Juhls, B., and Ivanov, V.: Colored dissolved organic matter (CDOM) and dissolved organic carbon (DOC) measured during cruise TRANSDRIFT-XXIV, Laptev Sea, PANGAEA [Dataset], https://doi.org/10.1594/PANGAEA.924210, 2020f.
Hölemann, J. A., Chetverova, A., Juhls, B., and Kusse-Tiuz, N.: Colored dissolved organic matter (CDOM) and dissolved organic carbon (DOC) measured during cruise TRANSARKTIKA-2019 Leg4, Laptev Sea and East Siberian Sea, PANGAEA [Dataset], https://doi.org/10.1594/PANGAEA.924211, 2020g.
Holmes, R. M., McClelland, J. W., Peterson, B. J., Tank, S. E., Bulygina, E., Eglinton, T. I., Gordeev, V. V., Gurtovaya, T. Y., Raymond, P. A., Repeta, D. J., Staples, R., Striegl, R. G., Zhulidov, A. V., and Zimov, S. A.: Seasonal and Annual Fluxes of Nutrients and Organic Matter from Large Rivers to the Arctic Ocean and Surrounding Seas, Estuar. Coast., 35, 369–382, https://doi.org/10.1007/s12237-011-9386-6, 2012.
Hugelius, G., Strauss, J., Zubrzycki, S., Harden, J. W., Schuur, E. A. G., Ping, C. L., Schirrmeister, L., Grosse, G., Michaelson, G. J., Koven, C. D., O'Donnell, J. A., Elberling, B., Mishra, U., Camill, P., Yu, Z., Palmtag, J., and Kuhry, P.: Estimated stocks of circumpolar permafrost carbon with quantified uncertainty ranges and identified data gaps, Biogeosciences, 11, 6573–6593, https://doi.org/10.5194/bg-11-6573-2014, 2014.
Itkin, P. and Krumpen, T.: Winter sea ice export from the Laptev Sea preconditions the local summer sea ice cover and fast ice decay, The Cryosphere, 11, 2383–2391, https://doi.org/10.5194/tc-11-2383-2017, 2017.
Jakobsson, M., Mayer, L., Coakley, B., Dowdeswell, J. A., Forbes, S., Fridman, B., Hodnesdal, H., Noormets, R., Pedersen, R., Rebesco, M., Schenke, H. W., Zarayskaya, Y., Accettella, D., Armstrong, A., Anderson, R. M., Bienhoff, P., Camerlenghi, A., Church, I., Edwards, M., Gardner, J. V., Hall, J. K., Hell, B., Hestvik, O., Kristoffersen, Y., Marcussen, C., Mohammad, R., Mosher, D., Nghiem, S. V., Pedrosa, M. T., Travaglini, P. G., and Weatherall, P.: The International Bathymetric Chart of the Arctic Ocean (IBCAO) Version 3.0, Geophys. Res. Lett., 39, L12609, https://doi.org/10.1029/2012GL052219, 2012.
Janout, M. A., Hölemann, J., and Krumpen, T.: Cross-shelf transport of warm and saline water in response to sea ice drift on the Laptev Sea shelf, J. Geophys. Res.-Ocean., 118, 563–576, https://doi.org/10.1029/2011jc007731, 2013.
Janout, M. A., Aksenov, Y., Hölemann, J. A., Rabe, B., Schauer, U., Polyakov, I. V., Bacon, S., Coward, A. C., Karcher, M., Lenn, Y. D., Kassens, H., and Timokhov, L.: Kara Sea freshwater transport through Vilkitsky Strait: Variability, forcing, and further pathways toward the western Arctic Ocean from a model and observations, J. Geophys. Res.-Ocean., 120, 4925–4944, https://doi.org/10.1002/2014jc010635, 2015.
Janout, M. A., Hölemann, J., Waite, A. M., Krumpen, T., von Appen, W. J., and Martynov, F.: Sea-ice retreat controls timing of summer plankton blooms in the Eastern Arctic Ocean, Geophys. Res. Lett., 43, 12493–12501, https://doi.org/10.1002/2016gl071232, 2016a.
Janout, M. A., Holemann, J., Juhls, B., Krumpen, T., Rabe, B., Bauch, D., Wegner, C., Kassens, H., and Timokhov, L.: Episodic warming of near-bottom waters under the Arctic sea ice on the central Laptev Sea shelf, Geophys. Res. Lett., 43, 264–272, https://doi.org/10.1002/2015gl066565, 2016b.
Janout, M. A., Hölemann, J., Timokhov, L., Gutjahr, O., and Heinemann, G.: Circulation in the northwest Laptev Sea in the eastern Arctic Ocean: Crossroads between Siberian River water, Atlantic water and polynya-formed dense water, J. Geophys. Res.-Ocean., 122, 6630–6647, https://doi.org/10.1002/2017jc013159, 2017.
Janout, M.A., Hölemann, J., Smirnov, A., Krumpen, T., Bauch, D., Laukert, G., and Timokhov, L.: On the variability of stratification in the freshwater influenced Laptev Sea region, Front Mar. Sci., 7, 543489, https://doi.org/10.3389/fmars.2020.543489, 2020.
Jørgensen, L., Stedmon, C. A., Kaartokallio, H., Middelboe, M., and Thomas, D. N.: Changes in the composition and bioavailability of dissolved organic matter during sea ice formation, Limnol. Oceanogr., 60, 817–830, https://doi.org/10.1002/lno.10058, 2015.
Juhls, B., Overduin, P. P., Hölemann, J., Hieronymi, M., Matsuoka, A., Heim, B., and Fischer, J.: Dissolved organic matter at the fluvial-marine transition in the Laptev Sea using in situ data and ocean colour remote sensing, Biogeosciences, 16, 2693–2713, https://doi.org/10.5194/bg-16-2693-2019, 2019.
Juhls, B., Stedmon, C. A., Morgenstern, A., Meyer, H., Hölemann, J., Heim, B., Povazhnyi, V., and Overduin, P. P.: Identifying Drivers of Seasonality in Lena River Biogeochemistry and Dissolved Organic Matter Fluxes, Front. Environ. Sci., 8, 1–15, https://doi.org/10.3389/fenvs.2020.00053, 2020.
Kaiser, K., Benner, R., and Amon, R. M. W.: The fate of terrigenous dissolved organic carbon on the Eurasian shelves and export to the North Atlantic, J. Geophys. Res.-Ocean., 122, 4–22, https://doi.org/10.1002/2016jc012380, 2017a.
Kaiser, K., Canedo-Oropeza, M., McMahon, R., and Amon, R. M. W.: Origins and transformations of dissolved organic matter in large Arctic rivers, Sci. Rep.-UK, 7, 13064, https://doi.org/10.1038/s41598-017-12729-1, 2017b.
Kattner, G., Juhls, B., and Heim, B.: Surface water dissolved organic matter (DOC, CDOM) in the Lena River, PANGAEA [Dataset], https://doi.org/10.1594/PANGAEA.898705, 2010.
Kattner, G., Lobbes, J. M., Fitznar, H. P., Engbrodt, R., Nothig, E. M., and Lara, R. J.: Tracing dissolved organic substances and nutrients from the Lena River through Laptev Sea (Arctic), Mar. Chem., 65, 25–39, https://doi.org/10.1016/S0304-4203(99)00008-0, 1999.
Köhler, H., Meon, B., Gordeev, V. V., Spitzy, A., and Amon, R. M. W.: Dissolved organic matter (DOM) in the estuaries of Ob and Yenisei and the adjacent Kara Sea, Russia, in: Siberian river run-off in the Kara Sea, edited by: Stein, R., Fahl, K., Fütterer, D. K., Galimov, E. M., and Stepanets, O. V.: Proceedings in Marine Science, 6, Elsevier Science B. V., Amsterdam, 281–308, 2003.
Kotchetov, S. V., Kulakov, I. Y., Kurajov, V. K., Timokhov, L. A., and Vanda, Y. A.: Hydrometeorological regime of the Laptev Sea, Federal Service of Russia for Hydrometeorology and Monitoring of the Environment, Arct. Antarct. Res. Inst., St. Petersburg, Russia, 85, 1–34, 1994.
Kowalczuk, P., Meler, J., Kauko, H. M., Pavlov, A. K., Zablocka, M., Peeken, I., Dybwad, C., Castellani, G., and Granskog, M. A.: Bio-optical properties of Arctic drift ice and surface waters north of Svalbard from winter to spring, J. Geophys. Res.-Ocean., 122, 4634–4660, https://doi.org/10.1002/2016jc012589, 2017.
Krumpen, T., Hölemann, J. A., Willmes, S., Maqueda, M. A. M., Busche, T., Dmitrenko, I. A., Gerdes, R., Haas, C., Heinemann, G., Hendricks, S., Kassens, H., Rabenstein, L., and Schroder, D.: Sea ice production and water mass modification in the eastern Laptev Sea, J. Geophys. Res.-Ocean., 116, C05014, https://doi.org/10.1029/2010jc006545, 2011.
Kwok, R. and Morison, J.: Dynamic topography of the ice-covered Arctic Ocean from ICESat, Geophys. Res. Lett., 38, L02501, https://doi.org/10.1029/2010gl046063, 2011.
Lara, R. J., Rachold, V., Kattner, G., Hubberten, H. W., Guggenberger, G., Skoog, A., and Thomas, D. N.: Dissolved organic matter and nutrients in the Lena River, Siberian Arctic: Characteristics and distribution, Mar. Chem., 59, 301–309, https://doi.org/10.1016/S0304-4203(97)00076-5, 1998.
Letscher, R. T., Hansell, D. A., and Kadko, D.: Rapid removal of terrigenous dissolved organic carbon over the Eurasian shelves of the Arctic Ocean, Mar. Chem., 123, 78–87, https://doi.org/10.1016/j.marchem.2010.10.002, 2011.
Li, Z., Zhao, J., Su, J., Li, C., Cheng, B., Hui, F., Yang, Q., and Shi, L.: Spatial and Temporal Variations in the Extent and Thickness of Arctic Landfast Ice, Remote Sens-Basel, 12, 1–20, https://doi.org/10.3390/rs12010064, 2020.
Logvinova, C. L., Frey, K. E., and Cooper, L. W.: The potential role of sea ice melt in the distribution of chromophoric dissolved organic matter in the Chukchi and Beaufort Seas, Deep-Sea Res. Pt. II, 130, 28–42, https://doi.org/10.1016/j.dsr2.2016.04.017, 2016.
Macdonald, R. W., Paton, D. W., Carmack, E. C., and Omstedt, A.: The Fresh-Water Budget and under-Ice Spreading of Mackenzie River Water in the Canadian Beaufort Sea Based on Salinity and O-18 O-16 Measurements in Water and Ice, J. Geophys. Res.-Ocean., 100, 895–919, https://doi.org/10.1029/94jc02700, 1995.
Manizza, M., Follows, M. J., Dutkiewicz, S., McClelland, J. W., Menemenlis, D., Hill, C. N., Townsend-Small, A., and Peterson, B. J.: Modeling transport and fate of riverine dissolved organic carbon in the Arctic Ocean, Global Biogeochem. Cy., 23, Gb4006, https://doi.org/10.1029/2008gb003396, 2009.
Mann, P. J., Davydova, A., Zimov, N., Spencer, R. G. M., Davydov, S., Bulygina, E., Zimov, S., and Holmes, R. M.: Controls on the composition and lability of dissolved organic matter in Siberia's Kolyma River basin, J. Geophys. Res.-Biogeo., 117, G01028, https://doi.org/10.1029/2011jg001798, 2012.
Mann, P. J., Spencer, R. G. M., Hernes, P. J., Six, J., Aiken, G. R., Tank, S. E., McClelland, J. W., Butler, K. D., Dyda, R. Y., and Holmes, R. M.: Pan-Arctic Trends in Terrestrial Dissolved Organic Matter from Optical Measurements, Front Earth Sc-Switz, 4, 1–18, https://doi.org/10.3389/feart.2016.00025, 2016.
Mathis, J. T., Hansell, D. A., and Bates, N. R.: Strong hydrographic controls on spatial and seasonal variability of dissolved organic carbon in the Chukchi Sea, Deep-Sea Res. Pt. II, 52, 3245–3258, https://doi.org/10.1016/j.dsr2.2005.10.002, 2005.
Matsuoka, A., Bricaud, A., Benner, R., Para, J., Sempere, R., Prieur, L., Belanger, S., and Babin, M.: Tracing the transport of colored dissolved organic matter in water masses of the Southern Beaufort Sea: relationship with hydrographic characteristics, Biogeosciences, 9, 925–940, https://doi.org/10.5194/bg-9-925-2012, 2012.
Matsuoka, A., Boss, E., Babin, M., Karp-Boss, L., Hafez, M., Chekalyuk, A., Proctor, C. W., Werdell, P. J., and Bricaud, A.: Pan-Arctic optical characteristics of colored dissolved organic matter: Tracing dissolved organic carbon in changing Arctic waters using satellite ocean color data, Remote Sens. Environ., 200, 89–101, https://doi.org/10.1016/j.rse.2017.08.009, 2017.
McClelland, J. W., Holmes, R. M., Peterson, B. J., and Stieglitz, M.: Increasing river discharge in the Eurasian Arctic: Consideration of dams, permafrost thaw, and fires as potential agents of change, J. Geophys. Res.-Atmos., 109, D18102, https://doi.org/10.1029/2004jd004583, 2004.
Morison, J., Kwok, R., Peralta-Ferriz, C., Alkire, M., Rigor, I., Andersen, R., and Steele, M.: Changing Arctic Ocean freshwater pathways, Nature, 481, 66–70, https://doi.org/10.1038/nature10705, 2012.
Müller, S., Vahatalo, A. V., Stedmon, C. A., Granskog, M. A., Norman, L., Aslam, S. N., Underwood, G. J. C., Dieckmann, G. S., and Thomas, D. N.: Selective incorporation of dissolved organic matter (DOM) during sea ice formation, Mar. Chem., 155, 148–157, https://doi.org/10.1016/j.marchem.2013.06.008, 2013.
Opsahl, S., Benner, R., and Amon, R. M. W.: Major flux of terrigenous dissolved organic matter through the Arctic Ocean, Limnol. Oceanogr., 44, 2017–2023, https://doi.org/10.4319/lo.1999.44.8.2017, 1999.
Osburn, C. L., Retamal, L., and Vincent, W. F.: Photoreactivity of chromophoric dissolved organic matter transported by the Mackenzie River to the Beaufort Sea, Mar. Chem., 115, 10–20, https://doi.org/10.1016/j.marchem.2009.05.003, 2009.
Overland, J. E., Wang, M. Y., and Box, J. E.: An integrated index of recent pan-Arctic climate change, Environ. Res. Lett., 14, 035006, https://doi.org/10.1088/1748-9326/aaf665, 2019.
Pavlov, A. K., Stedmon, C. A., Semushin, A. V., Martma, T., Ivanov, B. V., Kowalczuk, P., and Granskog, M. A.: Linkages between the circulation and distribution of dissolved organic matter in the White Sea, Arctic Ocean, Cont. Shelf Res., 119, 1–13, https://doi.org/10.1016/j.csr.2016.03.004, 2016.
Pegau, W. S.: Inherent optical properties of the central Arctic surface waters, J. Geophys. Res.-Ocean., 107, 8035 https://doi.org/10.1029/2000jc000382, 2002.
Petrich, C. and Eicken, H.: Growth, Structure and Properties of Sea Ice, in: Sea Ice, 2nd Edn., edited by: Thomas, D. N. and Dieckmann, G. S., Wiley-Blackwell, Oxford, UK, 23–77, 2010.
Plaza, C., Pegoraro, E., Bracho, R., Celis, G., Crummer, K. G., Hutchings, J. A., Pries, C. E. H., Mauritz, M., Natali, S. M., Salmon, V. G., Schadel, C., Webb, E. E., and Schuur, E. A. G.: Direct observation of permafrost degradation and rapid soil carbon loss in tundra, Nat. Geosci., 12, 627–631, https://doi.org/10.1038/s41561-019-0387-6, 2019.
Prokushkin, A. S., Pokrovsky, O. S., Shirokova, L. S., Korets, M. A., Viers, J., Prokushkin, S. G., Amon, R. M. W., Guggenberger, G., and McDowell, W. H.: Sources and the flux pattern of dissolved carbon in rivers of the Yenisey basin draining the Central Siberian Plateau, Environ. Res. Lett., 6, 045212, https://doi.org/10.1088/1748-9326/6/4/045212, 2011.
Pugach, S. P. and Pipko, I. I.: Dynamics of colored dissolved matter on the East Siberian sea shelf, Dokl. Earth Sci., 448, 153–156, https://doi.org/10.1134/S1028334x12120173, 2013.
Pugach, S. P., Pipko, I. I., Shakhova, N. E., Shirshin, E. A., Perminova, I. V., Gustafsson, O., Bondur, V. G., Ruban, A. S., and Semiletov, I. P.: Dissolved organic matter and its optical characteristics in the Laptev and East Siberian seas: spatial distribution and interannual variability (2003–2011), Ocean Sci., 14, 87–103, https://doi.org/10.5194/os-14-87-2018, 2018.
Retelletti-Brogi, S., Ha, S.-Y., Kim, K., Derrien, M., Lee, Y. K., and Hur, J.: Optical and molecular characterization of dissolved organic matter (DOM) in the Arctic ice core and the underlying seawater (Cambridge Bay, Canada): Implication for increased autochthonous DOM during ice melting, Sci. Total Environ., 627, 802–811, https://doi.org/10.1016/j.scitotenv.2018.01.251, 2018.
Rawlins, M. A., Steele, M., Holland, M. M., Adam, J. C., Cherry, J. E., Francis, J. A., Groisman, P. Y., Hinzman, L. D., Huntington, T. G., Kane, D. L., Kimball, J. S., Kwok, R., Lammers, R. B., Lee, C. M., Lettenmaier, D. P., McDonald, K. C., Podest, E., Pundsack, J. W., Rudels, B., Serreze, M. C., Shiklomanov, A., Skagseth, O., Troy, T. J., Vorosmarty, C. J., Wensnahan, M., Wood, E. F., Woodgate, R., Yang, D. Q., Zhang, K., and Zhang, T. J.: Analysis of the Arctic System for Freshwater Cycle Intensification: Observations and Expectations, J. Clim., 23, 5715–5737, https://doi.org/10.1175/2010jcli3421.1, 2010.
Raymond, P. A., McClelland, J. W., Holmes, R. M., Zhulidov, A. V., Mull, K., Peterson, B. J., Striegl, R. G., Aiken, G. R., and Gurtovaya, T. Y.: Flux and age of dissolved organic carbon exported to the Arctic Ocean: A carbon isotopic study of the five largest arctic rivers, Global Biogeochem. Cy., 21, Gb4011, https://doi.org/10.1029/2007gb002934, 2007.
Schlitzer, R.: Interactive analysis and visualization of geoscience data with Ocean Data View, Comput. Geosci.-UK, 28, 1211–1218, https://doi.org/10.1016/S0098-3004(02)00040-7, 2002.
Selyuzhenok, V., Krumpen, T., Mahoney, A., Janout, M., and Gerdes, R.: Seasonal and interannual variability of fast ice extent in the southeastern Laptev Sea between 1999 and 2013, J. Geophys. Res.-Ocean., 120, 7791–7806, https://doi.org/10.1002/2015jc011135, 2015.
Semiletov, I., Pipko, I., Gustafsson, O., Anderson, L. G., Sergienko, V., Pugach, S., Dudarev, O., Charkin, A., Gukov, A., Broder, L., Andersson, A., Spivak, E., and Shakhova, N.: Acidification of East Siberian Arctic Shelf waters through addition of freshwater and terrestrial carbon, Nat. Geosci., 9, 361–365, https://doi.org/10.1038/ngeo2695, 2016.
Shin, K. H. and Tanaka, N.: Distribution of dissolved organic matter in the eastern Bering Sea, Chukchi Sea (Barrow Canyon) and Beaufort Sea, Geophys. Res. Lett., 31, L24304, https://doi.org/10.1029/2004gl021039, 2004.
Shiklomanov, A. I., Holmes, R. M., McClelland, J. W., Tank, S. E., and Spencer, R. G. M.: ArcticGRO Discharge Dataset, Version 2020-01-23, available at: https://www.arcticgreatrivers.org/data (last access: 25 February 2020), 2020.
Soppa, M. A., Pefanis, V., Hellmann, S., Losa, S. N., Hölemann, J., Martynov, F., Heim, B., Janout, M. A., Dinter, T., Rozanov, V., and Bracher, A.: Assessing the Influence of Water Constituents on the Radiative Heating of Laptev Sea Shelf Waters, Front Mar. Sci., 6, 221, https://doi.org/10.3389/fmars.2019.00221, 2019.
Spreen, G., Kaleschke, L., and Heygster, G.: Sea ice remote sensing using AMSR-E 89-GHz channels, J. Geophys. Res.-Ocean., 113, C02s03, https://doi.org/10.1029/2005jc003384, 2008.
Stedmon, C. A. and Markager, S.: The optics of chromophoric dissolved organic matter (CDOM) in the Greenland Sea: An algorithm for differentiation between marine and terrestrially derived organic matter, Limnol. Oceanogr., 46, 2087–2093, https://doi.org/10.4319/lo.2001.46.8.2087, 2001.
Stedmon, C. A., Amon, R. M. W., Rinehart, A. J., and Walker, S. A.: The supply and characteristics of colored dissolved organic matter (CDOM) in the Arctic Ocean: Pan Arctic trends and differences, Mar. Chem., 124, 108–118, https://doi.org/10.1016/j.marchem.2010.12.007, 2011.
Stroeve, J. and Notz, D.: Changing state of Arctic sea ice across all seasons, Environ. Res. Lett., 13, 103001, https://doi.org/10.1088/1748-9326/aade56, 2018.
Tanaka, K., Takesue, N., Nishioka, J., Kondo, Y., Ooki, A., Kuma, K., Hirawake, T., and Yamashita, Y.: The conservative behavior of dissolved organic carbon in surface waters of the southern Chukchi Sea, Arctic Ocean, during early summer, Sci. Rep.-UK, 6, 34123, https://doi.org/10.1038/srep34123, 2016.
Tank, S. E., Striegl, R. G., McClelland, J. W., and Kokelj, S. V.: Multi-decadal increases in dissolved organic carbon and alkalinity flux from the Mackenzie drainage basin to the Arctic Ocean, Environ. Res. Lett., 11, 054015, https://doi.org/10.1088/1748-9326/11/5/054015, 2016.
Terhaar, J., Lauerwald, R., Regnier, P., Gruber, N., and Bopp, L.: Around one third of current Arctic Ocean primary production sustained by rivers and coastal erosion, Nat. Commun., 12, 169, https://doi.org/10.1038/s41467-020-20470-z, 2021.
Timmermans, M.-L. and Marshall, J.: Understanding Arctic Ocean Circulation: A Review of Ocean Dynamics in a Changing Climate, J. Geophys. Res.-Ocean., 125, 1–35, https://doi.org/10.1029/2018jc014378, 2020.
Wegner, C., Wittbrodt, K., Hölemann, J. A., Janout, M. A., Krumpen, T., Selyuzhenok, V., Novikhin, A., Polyakova, Y., Krykova, I., Kassens, H., and Timokhov, L.: Sediment entrainment into sea ice and transport in the Transpolar Drift: A case study from the Laptev Sea in winter 2011/2012, Cont. Shelf Res., 141, 1–10, https://doi.org/10.1016/j.csr.2017.04.010, 2017.
Xie, H., Aubry, C., Zhang, Y., and Song, G.: Chromophoric dissolved organic matter (CDOM) in first-year sea ice in the western Canadian Arctic, Mar. Chem., 165, 25–35, https://doi.org/10.1016/j.marchem.2014.07.007, 2014.
Zabłocka, M., Kowalczuk, P., Meler, J., Peeken, I., Dragańska-Deja, K., and Winogradow, A.: Compositional differences of fluorescent dissolved organic matter in Arctic Ocean spring sea ice and surface waters north of Svalbard, Mar. Chem., 227, 103893, https://doi.org/10.1016/j.marchem.2020.103893, 2020.
- Abstract
- Introduction
- Materials and methods
- Results
- Discussion
- Sea-ice meltwater as possible cause for the aCDOM(350) anomaly in the LS in 2011 and the aCDOM(350) distribution in the ESS in 2019
- Conclusions
- Data availability
- Author contributions
- Competing interests
- Disclaimer
- Acknowledgements
- Financial support
- Review statement
- References