the Creative Commons Attribution 4.0 License.
the Creative Commons Attribution 4.0 License.
 | 05 Jan 2021
Vegetation modulates the impact of climate extremes on gross primary production
Milan Flach
Alexander Brenning
Fabian Gans
Markus Reichstein
Sebastian Sippel
Miguel D. Mahecha
Drought and heat events affect the uptake and sequestration of carbon in terrestrial ecosystems. Factors such as the duration, timing, and intensity of extreme events influence the magnitude of impacts on ecosystem processes such as gross primary production (GPP), i.e., the ecosystem uptake of CO2. Preceding soil moisture depletion may exacerbate these impacts. However, some vegetation types may be more resilient to climate extremes than others. This effect is insufficiently understood at the global scale and is the focus of this study. Using a global upscaled product of GPP that scales up in situ land CO2 flux observations with global satellite remote sensing, we study the impact of climate extremes at the global scale. We find that GPP in grasslands and agricultural areas is generally reduced during heat and drought events. However, we also find that forests, if considered globally, appear in general to not be particularly sensitive to droughts and heat events that occurred during the analyzed period or even show increased GPP values during these events. On the one hand, normal-to-increased GPP values are in many cases plausible, e.g., when conditions prior to the event have been particularly positive. On the other hand, however, normal-to-increased GPP values in forests may also reflect a lack of sensitivity in current remote-sensing-derived GPP products to the effects of droughts and heatwaves. The overall picture calls for a differentiated consideration of different land cover types in the assessments of risks of climate extremes for ecosystem functioning.
- Article
(3092 KB) - Full-text XML
-
Supplement
(2836 KB) - BibTeX
- EndNote


We expect that climate change will lead to increases in frequencies, durations, intensities, and spatial extents of droughts and heatwaves in the next decades (Meehl et al., 2000; Olesen and Bindi, 2002; Seneviratne et al., 2012; Coumou and Robinson, 2013; Cook et al., 2015; Zscheischler and Seneviratne, 2017). Ecosystems will respond to the events ahead in multiple ways. In particular the processes controlling the terrestrial carbon balance, i.e., photosynthesis and respiratory processes as well as fires and, for example, pest-induced mortality, are expected to be affected (Peuelas et al., 2004; Ciais et al., 2005; Vetter et al., 2008; Reichstein et al., 2013; Bastos et al., 2014; Yoshida et al., 2015; Wolf et al., 2016; Brando et al., 2019) (for a recent review see Sippel et al., 2018). Given that these responses represent feedbacks to the coupled climate–ecosystem dynamics, it is important to understand which factors generally influence the magnitudes of such impacts at the global scale (Frank et al., 2015). Previous studies have shown that event duration can be as important as intensity in controlling the reduction of gross primary production (GPP), which represents the total ecosystem carbon uptake (Granier et al., 2008; von Buttlar et al., 2018; Orth and Destouni, 2018). In particular, compound extreme events, e.g., the combination of drought and heat stress, can increase the impact on GPP as compared to singular stressors (Ciais et al., 2005; AghaKouchak et al., 2014; Zscheischler et al., 2018; von Buttlar et al., 2018). Several case studies point to the crucial role of timing of the extreme event in influencing the magnitude of impacts on ecosystem functioning. Warm and early springs may partly compensate for severe carbon impacts of summer droughts (Wolf et al., 2016). In contrast, soil moisture depletion in spring can even enhance carbon losses during summer (Buermann et al., 2013; Sippel et al., 2017a; Buermann et al., 2018).
One important aspect is the question of how strongly land cover types modulate drought and heat impacts on the fundamental processes controlling ecosystem carbon dynamics, such as gross primary production, ecosystem respiration, and net ecosystem exchange. Evidence from eddy covariance stations (von Buttlar et al., 2018) and case studies using spatiotemporal remote-sensing-derived data (Wolf et al., 2016; Flach et al., 2018) suggest that certain ecosystems are less vulnerable to heat and drought events than others. However, the question of to what degree land cover types shape the impacts of droughts and heatwaves globally remains unclear. Here we aim to specifically investigate the importance of land cover type in controlling the impacts of climate extremes relative to other factors such as duration and magnitude of the extreme event.
When discussing impacts of climate extremes, the crucial question is their definition. One option is to use values over some global thresholds to detect extremes, e.g., to detect temperatures above 25 or 30 ∘C and to investigate the associated anomaly in vegetation productivity. Another option is to define extreme events relative to some locally varying threshold, e.g., defined by the 95th percentile of the distribution of the data. Here, we rely on the latter definition, and we refine the definition by also taking a joint multivariate distribution of the data with regionally varying thresholds into account (Flach et al., 2017, 2018). Furthermore, we restrict our analysis to those events that can also be considered a relative drought and heat event. We estimate anomalies regionally, i.e., defining extreme events relative to the typical conditions of the regional growing season. We apply this method jointly to air temperature, surface moisture, and incoming shortwave radiation as fundamental variables to detect relative extreme events. Each event describes a spatiotemporal context that can be described by its spatial extent and duration (Zscheischler et al., 2013; Mahecha et al., 2017). The impacts are then assessed in these areas as anomalies in gross primary production (GPP). Our study addresses the impacts in the time range between 2003 and 2018 globally in different land cover classes and builds on nonlinear predictive models to understand the importance of the driving factors (for details see the Methods section, Sect. 2).
In the following, we will first start with the methods (Sect. 2), including subsections on the data, the preprocessing, the methods used for anomaly detection, the subsequent detection of spatiotemporally connected extreme events, and finally the statistical model to infer the main drivers of the GPP response during droughts and heatwaves. In the Results section (Sect. 3), we will first show more generally the associated productivity during droughts and heatwaves in forest ecosystems and agricultural systems. Then, we will explain the observed responses, first with a simple graphical approach, and we will then quantify the drivers of the observed responses with a statistical model. In the Discussion section (Sect. 4), we will first elaborate on other studies, which found contrasting responses to climate extremes, and will then show how our findings can be interpreted (with a specific focus on forest ecosystems). Finally, we discuss potential biases and limitations of our approach and of the data used, and we finish with some conclusions (Sect. 5).
For detecting hydrometeorological extreme events across ecosystems, we need (i) a set of variables describing hydrometeorological extreme events and their impacts on productivity (Sect. 2.1), (ii) a detection algorithm (Sect. 2.2), and (iii) an approach to evaluate the hydrometeorological extremes with regard to responses in different ecosystems (Sect. 2.4).
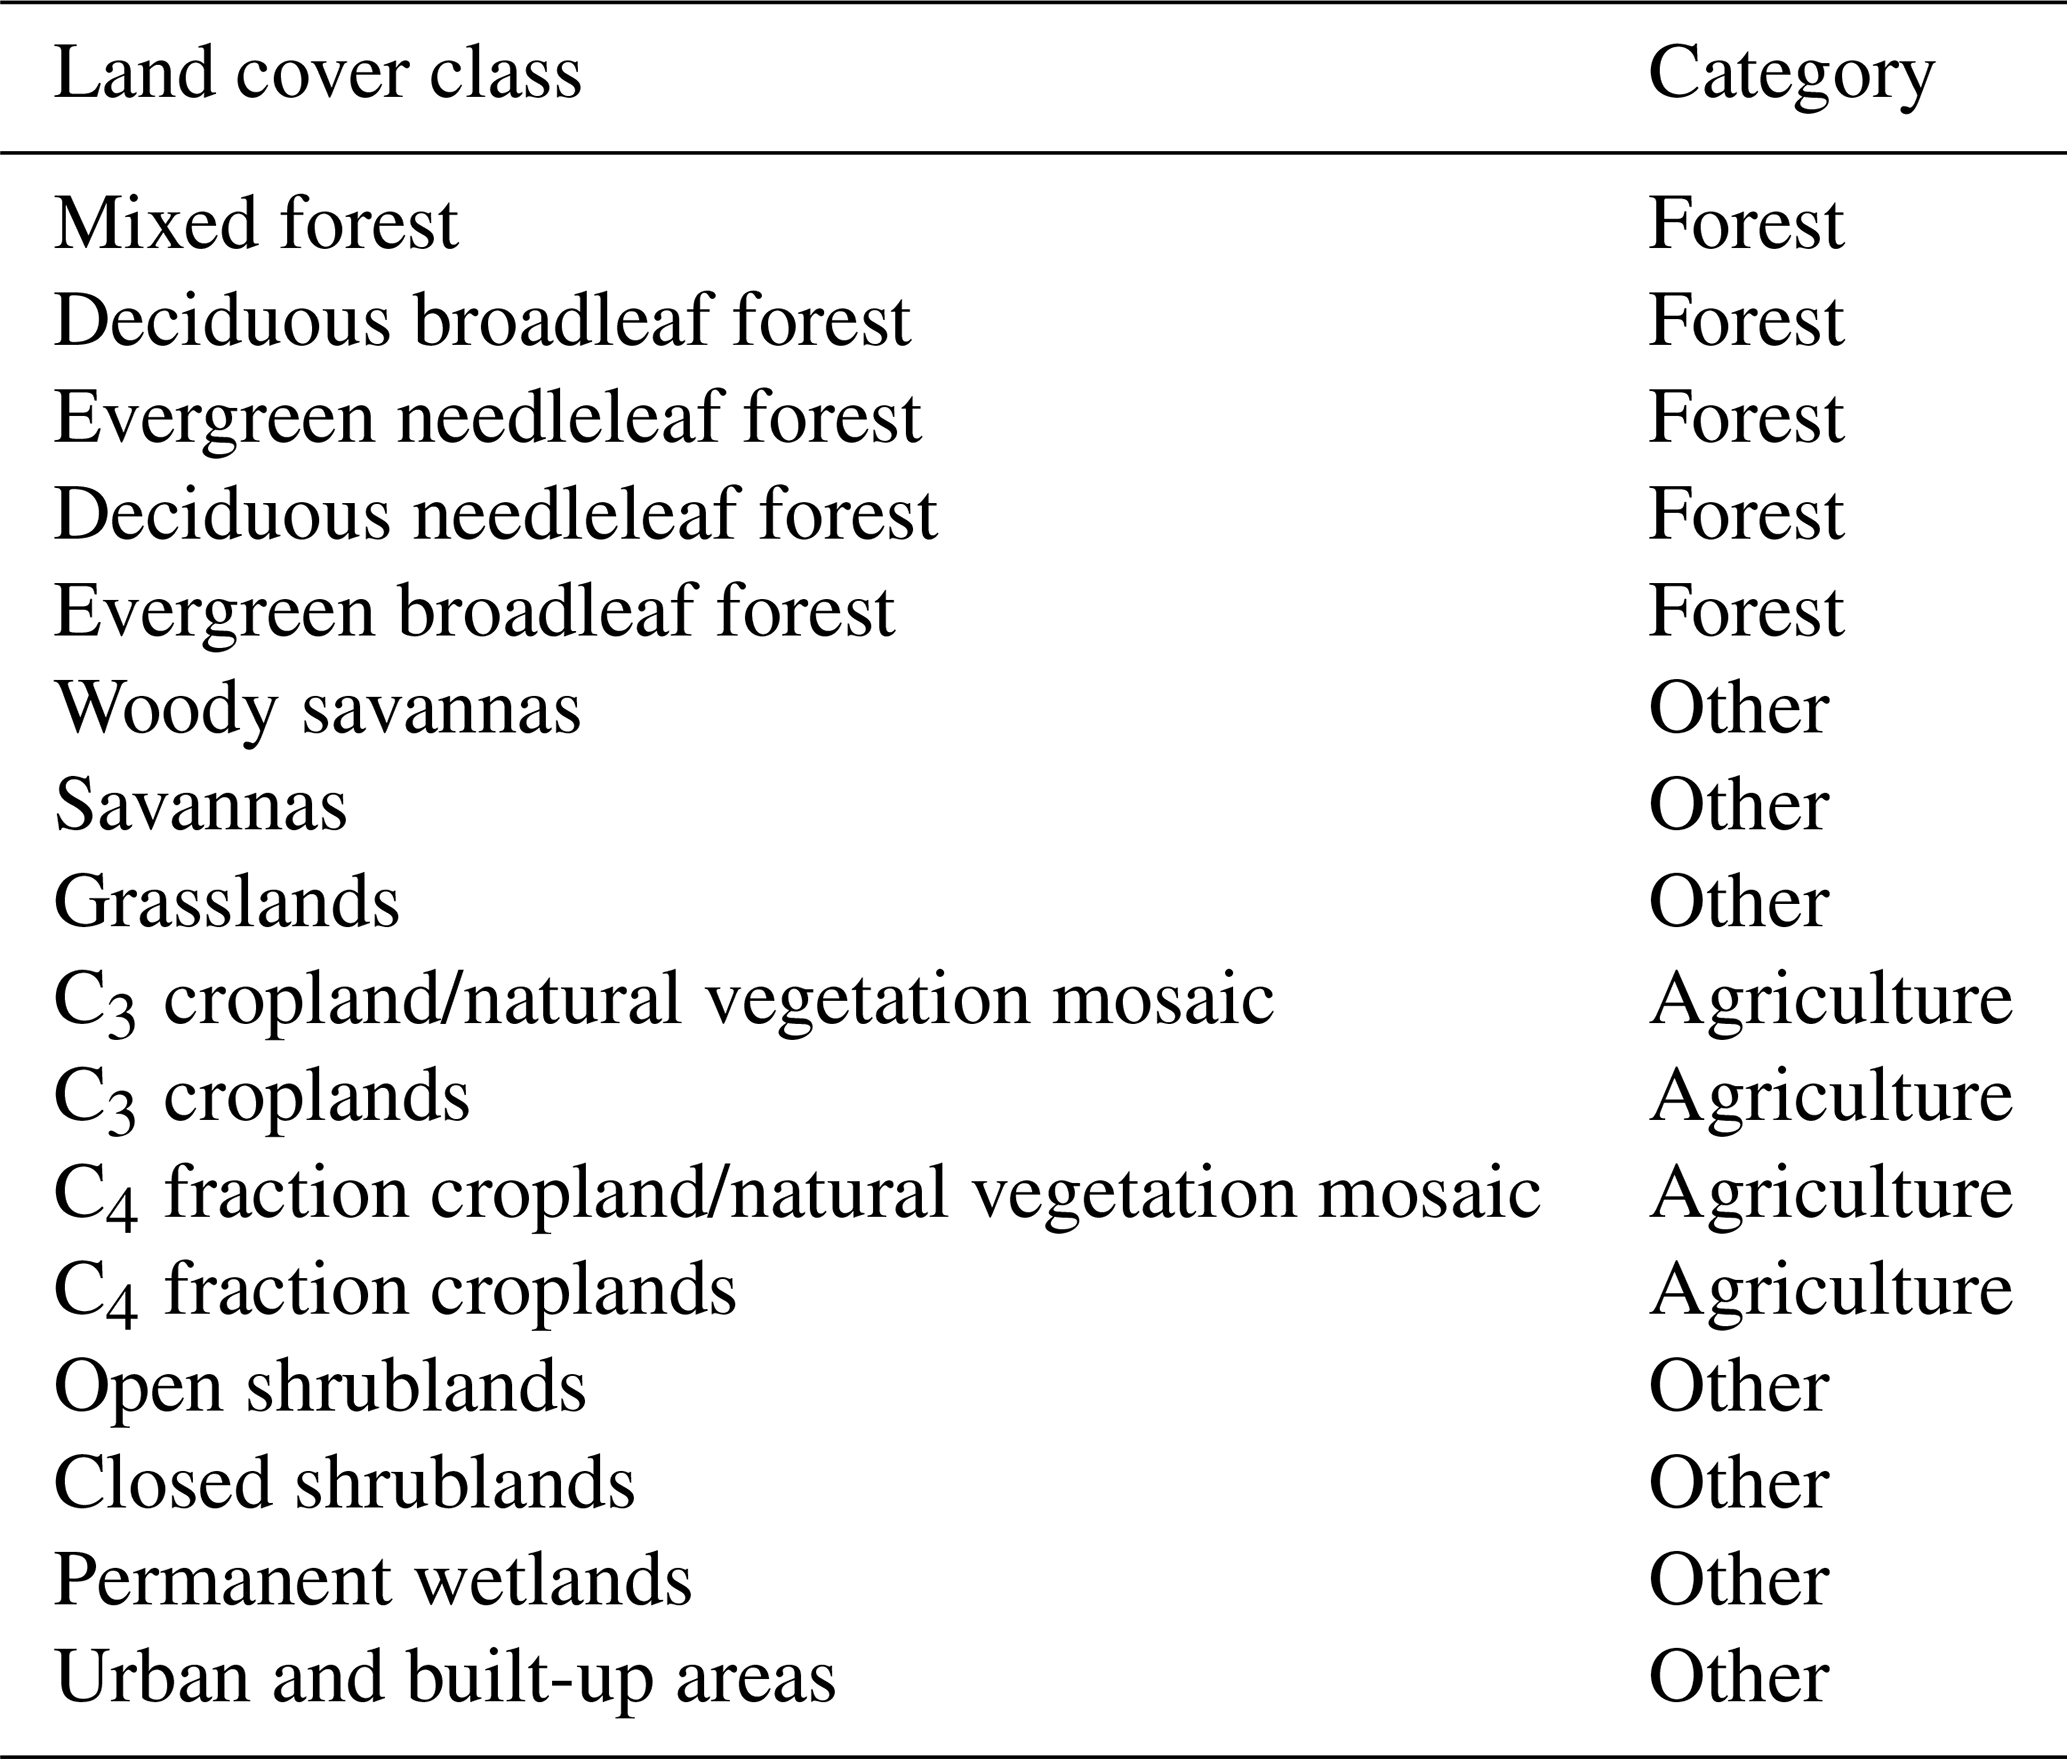
Table 1Grouping of the different ecosystems in the categories forest, agriculture, and other.
2.1 Data
To detect hydrometeorological extreme events, we use 2 m air temperature, incoming shortwave radiation (both are from ERA5, original resolution 0.25∘; Copernicus Climate Change Service, 2017), and surface moisture (v3.3b, original resolution 0.25∘ from the Global Land Evaporation Amsterdam Model (GLEAM) framework; Miralles et al., 2011; Martens et al., 2017). We consider surface moisture as a hydrometeorological variable due to its importance for drought detection although it is influenced by vegetation. The impacts of the identified extremes are quantified as anomalies in gross primary productivity (GPP, original resolution 1∕12∘ from the remote-sensing-driven FluxCom product (FLUXCOM-RS); Tramontana et al., 2016). Anomalies in GPP are computed as deviations from the mean seasonal cycle excluding the extreme year itself. The selected hydrometeorological variables have global coverage and a common spatial resolution of 0.25∘, and they are used at an 8 d temporal resolution covering the 2003–2018 period. The time period is chosen as it represents the common period of all data sets used (at the time of the analysis). Land cover classes at 1∕12∘ resolution (from the year 2010) were obtained from the Moderate Resolution Imaging Spectroradiometer (MODIS, collection 5; Friedl et al., 2010). We group the available land cover classes into forest ecosystems (land cover classes containing “forest”), agricultural ecosystems (containing “crop”), and all remaining land cover types (Table 1).
2.2 Preprocessing and anomaly detection
We compute deviations from a smoothed median seasonal cycle in the hydrometeorological variables, which we denote as anomalies. For detecting extreme events, we apply a multivariate anomaly detection procedure described in detail in Flach et al. (2018). It (i) accounts for seasonal changes in the variance of the anomalies using a moving window technique and (ii) uses climatic similarities to obtain more robust thresholds for extreme event detection via spatial replicates as proposed by Mahecha et al. (2017) (for more details see Sect. 2.3).
The extreme event detection algorithm itself is applied to the set of hydrometeorological anomaly time series and returns anomaly scores computed by kernel density estimation. Kernel density estimation showed good performance among other possible methods and accounts for nonlinearities in the data (Flach et al., 2017). The resulting anomaly scores can be interpreted as a univariate index of deviation from the general multivariate pattern. We consider the highest 5 % of the anomaly scores to be extreme events (95th percentile), which is within the typical range of percentiles defining extreme events (McPhillips et al., 2018). For a detailed step-by-step description to detect multivariate anomalies, see Appendix A.
Note that the extreme events so far are multivariate extreme events in any direction of the variables, i.e., depending on the input variables. They may contain heatwaves as well as cold spells and droughts as well as extremely wet periods, as well as their compounding combinations. A selection of droughts and heatwaves takes place at a later step (see Sect. 2.4).

Figure 1Map of the first three leading principal components (PCs) colored according to the color space hue (PC1), saturation (PC2), and lightness (PC3). Coloring according to hue (i.e., the color wheel specifies the tone of the color), saturation (intensity of the color ranging from grey to pure color), and lightness (brightness of the color, ranging from black to white) is one way to get an impression of three-dimensional data on a map.
2.3 Climatic similarities to obtain spatial replicates
We follow the procedure described and developed by Mahecha et al. (2017), which was extended to the multivariate case by Flach et al. (2018). In summary, the used approach defines climatically and phenologically similar regions by using the leading principal components (here three) of the seasonal cycles of the hydrometeorological variables (temperature, surface moisture, radiation) in addition to the vegetation proxy (gross primary productivity). Similar cycles appear in the same region of the obtained principal component space (Fig. 1). Thus, a simple classification can be obtained by dividing the principal component space into equally sized cubes. Here we use 25 breaks for each of the first three principal components, which leads to 814 classes globally of similar climate and phenology. For each pixel, we sample four random spatial replicates from each region to efficiently run the anomaly detection workflow globally (previously the procedure was used for Europe only). The number of random spatial replicates depends on the number of observations in each 3-month period and the length of the time series (here 16 years of data, each with 11 observations per 3-month period, leads to 176 observations for each spatial replicate and thus 880 observations for the pixel and its four spatial replicates), which is a reasonable compromise between stability of the results for extreme event detection and computational efficiency to run the anomaly detection procedure globally.
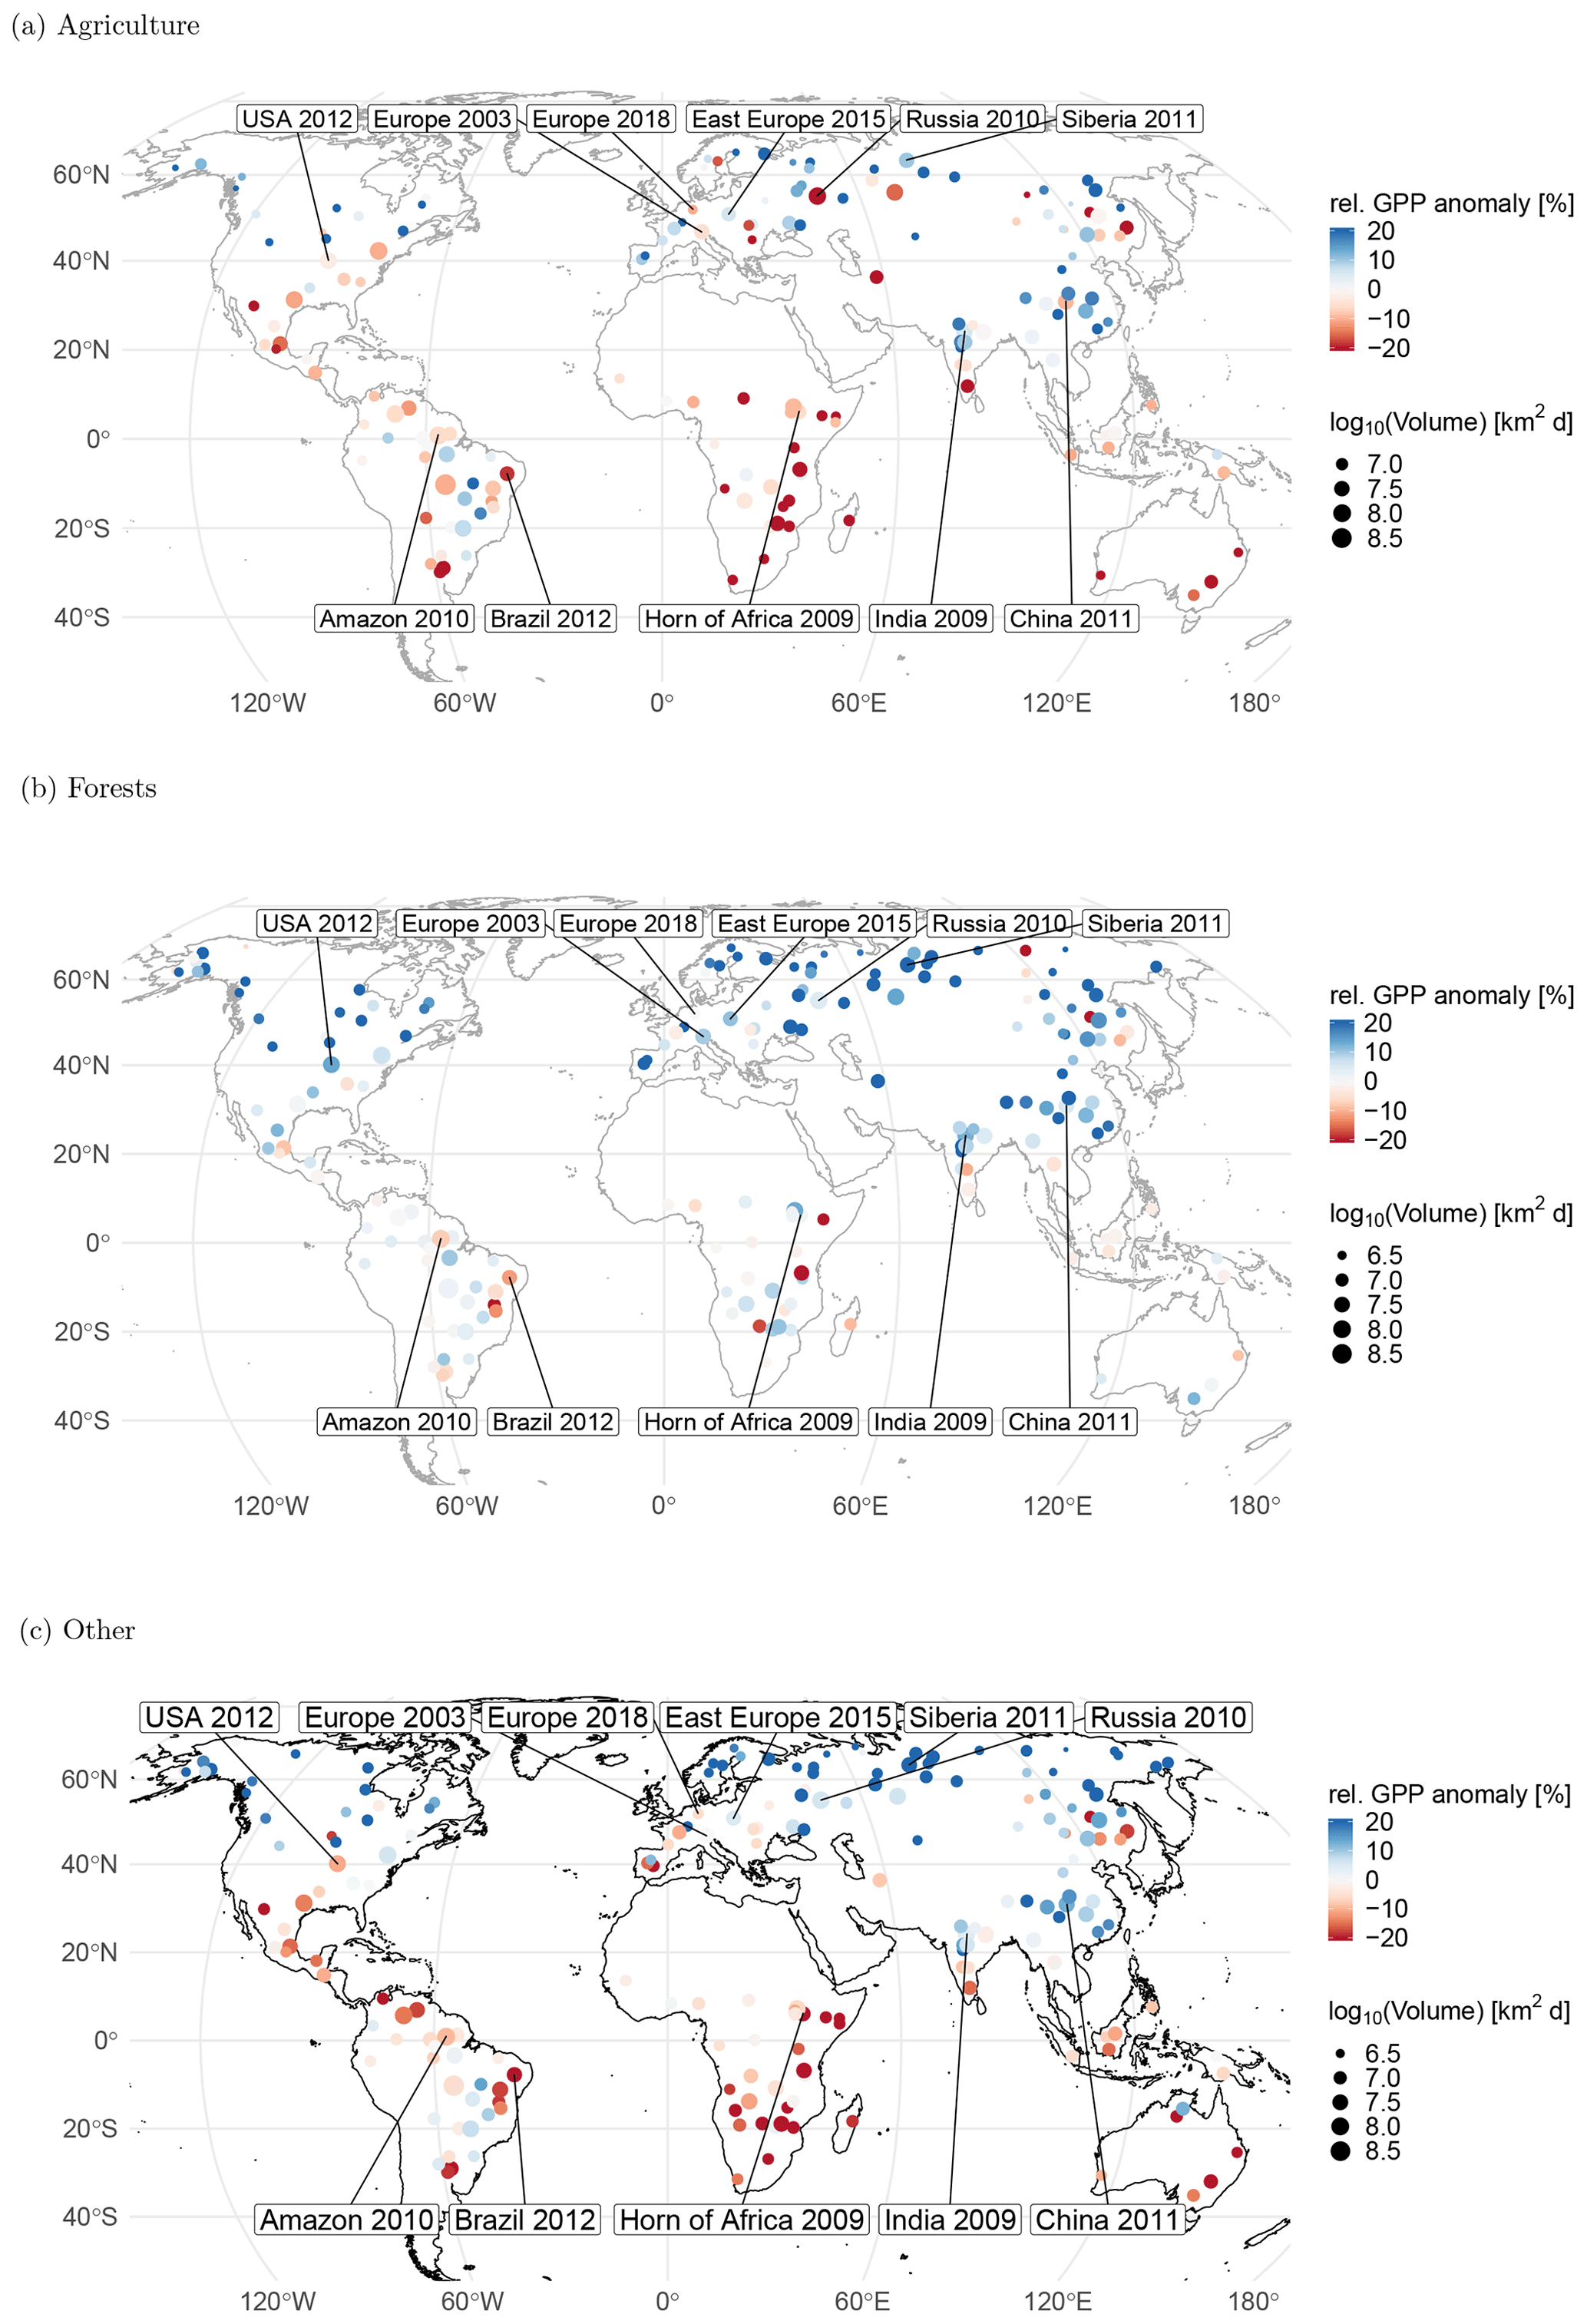
Figure 2Relative drought and heat events colored with the relative anomaly in gross primary production for (a) agricultural, (b) forest, and (c) other ecosystems. Point sizes are proportional to the affected volume of the space–time event. The largest and some well-known events are labeled. Note that one single extreme event can affect adjacent grid cells. Each of these adjacent grid cells may be dominated by a different ecosystem type. These extreme events will appear more than once, i.e., in (a), (b), and (c), each with the grid cells of part of the extreme event affecting the respective ecosystem. Labels are as follows: compounding drought and heatwave in the United States 2012, most commonly known as US drought 2012 (USA 2012); compounding European drought and heatwave 2003, commonly known as European heatwave 2003 (Europe 2003); compounding European drought and heatwave 2018 (Europe 2018); compounding eastern European drought and heatwave 2015 (Europe 2015); Siberian heatwave 2011 (Siberia 2011); compounding western Russian drought and heatwave 2010, commonly known as Russian heatwave 2010 (Russia 2010); compounding Amazon drought and heatwave 2010, mostly known as Amazon drought 2010 (Amazon 2010); drought in Brazil 2012 (Brazil 2012); compounding drought and heatwave at the Horn of Africa 2009 (Horn of Africa 2009); compounding Indian drought and heatwave 2009 (India 2009); and compounding drought and heatwave in China 2011 (China 2011).
2.4 Framework for extracting event-based statistics
We use the extracted binary information (extreme/non-extreme) to compute statistics based on the spatiotemporal structure of the extreme events similar to Lloyd-Hughes (2011), Zscheischler et al. (2013), Mahecha et al. (2017), and Chen et al. (2019). Extreme voxels are considered to belong to the same extreme event if they are connected within a 3 3 (long × lat × time) cube. Note that this definition includes connections over edges. We compute event-based statistics from the 1000 largest extreme events globally as introduced also for the Russian heatwave (Flach et al., 2018). Specifically, we calculate affected volume, centroids, mean, and integral of GPP separately for positive and negative anomalies, as well as the distance between the centroids of the positive and the negative anomalies of GPP during the event. We consider an event to be predominantly a relative drought (relative heatwave) if more than 50 % of the surface moisture (temperature) values during the extreme event are beneath (exceed) the 5th (95th) percentile of the variable. We select drought (n=98) and heat (n=44) events and combined drought–heat events (n=71), which are taking place during the growing season (total n=213). Growing season is defined here to be an extreme event taking place in the half year of the GPP maximum (± 3 months). Our statistics account for the spherical geometry of the Earth by weighting with the cosine of latitude.
Furthermore, we evaluate if the positive and negative anomalies in GPP during the event predominantly have a spatial or temporal component. Therefore, we split the event into parts with enhanced and parts with reduced productivity. Between those two parts, we compute the spatiotemporal distance between the centroids of each part. We consider positive and negative GPP anomalies to occur predominantly spatially if the temporal distance of the centroids is almost simultaneous, i.e., less than one time step in the data (8 d). GPP anomalies are considered to be predominantly temporally changing if the spatial distance of the centroids is less than 110 km (approximately 1∘ at the Equator). Both spatial and temporal components can be found for centroids which are more than 110 km and more than 8 d away.
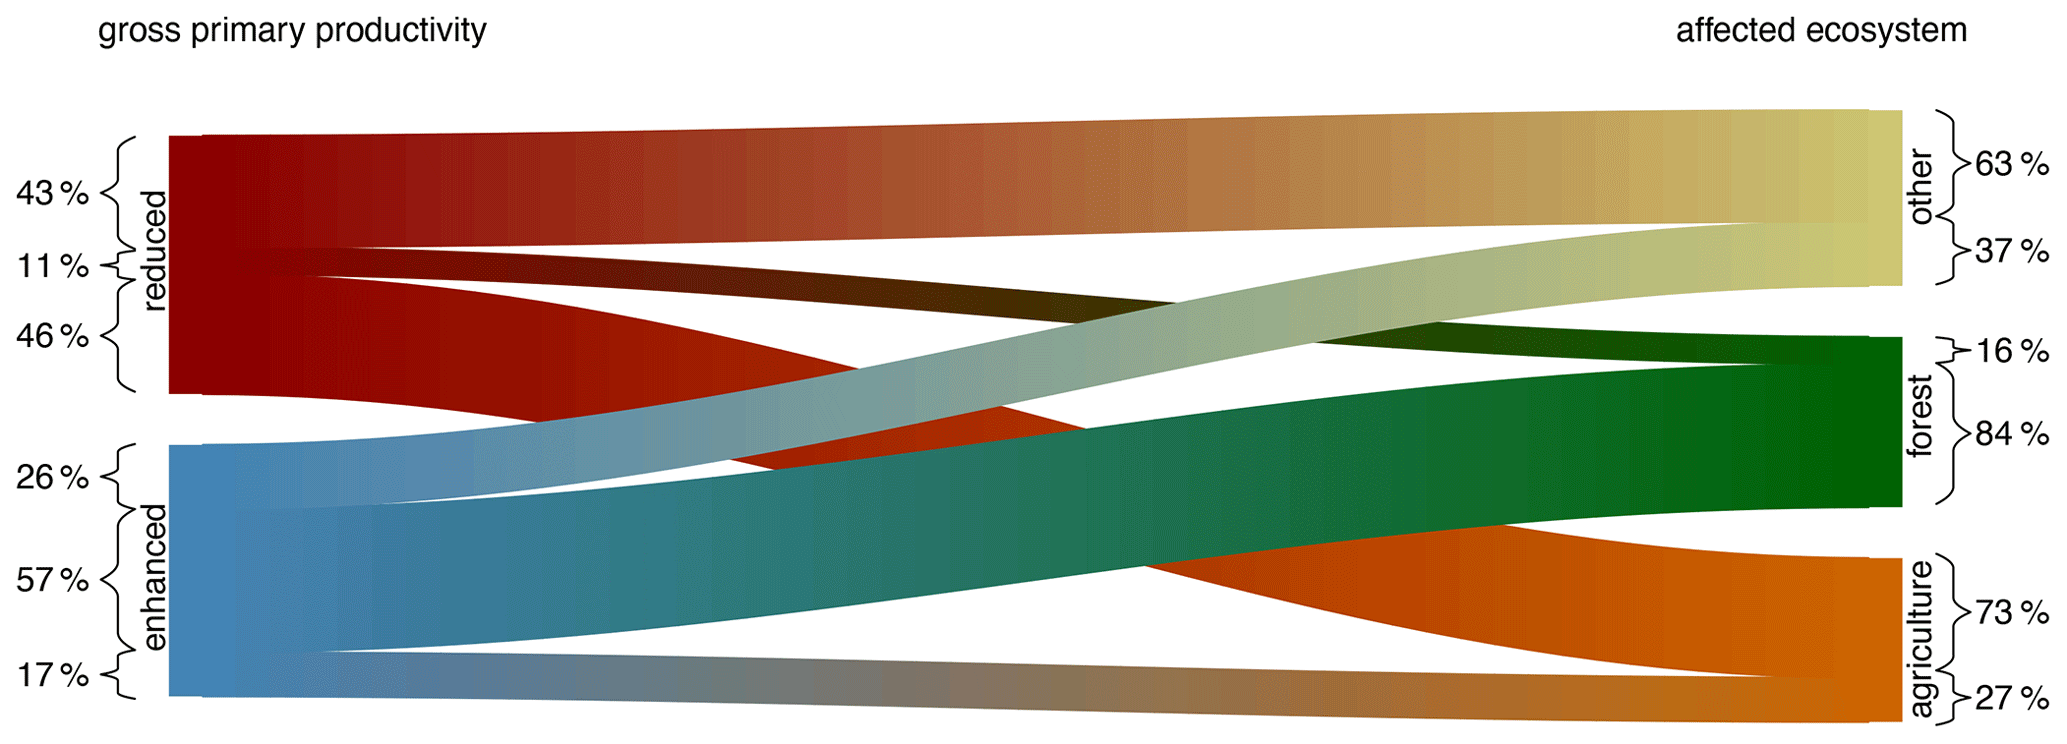
Figure 3Proportion of GPP anomalies with reduced or enhanced productivity and their distribution in the different ecosystems (growing season events between 2003–2018). Bar sizes are proportional to the affected volume of the identified events. Numbers denote percentages of the affected volume for each of the categories. Forests tend to be associated with enhanced productivity rates, while agricultural ecosystems tend to be associated with reduced productivity.
2.5 Statistical model of GPP during extreme events
As we detect heatwaves and droughts relative to the mean seasonal patterns, positive or negative GPP anomalies during the droughts and heatwaves may additionally be influenced by differences in the conditions in the hydrometeorological variables during the extreme event, differences in background climate in which the vegetation is growing, or duration and affected area of the event. We use gradient boosting machines (Friedman, 2001) to predict average GPP anomalies during the event as a function of mean surface moisture, mean temperature, mean radiation during the event, duration, affected area, land cover class, and mean climate during the growing season, i.e., mean temperature and surface moisture during all growing seasons between 2003 and 2018. We tune model parameters by following a workflow described in Elith et al. (2008) using a hyper grid search from 100 different random initializations of splitting the data into training (75 %) and testing data (remaining 25 %). We compute uncertainty of the variable importance measure described in Friedman (2001) from each of the 100 best models of the hyper grid search. Additionally we use an approach based on local interpretable model-agnostic explanations (LIME), which tries to predict each single observation in a black box model based on locally weighted regression (Ribeiro et al., 2016). Here, this approach helps to understand (1) the effect of specific land cover classes and (2) the direction of the effect.
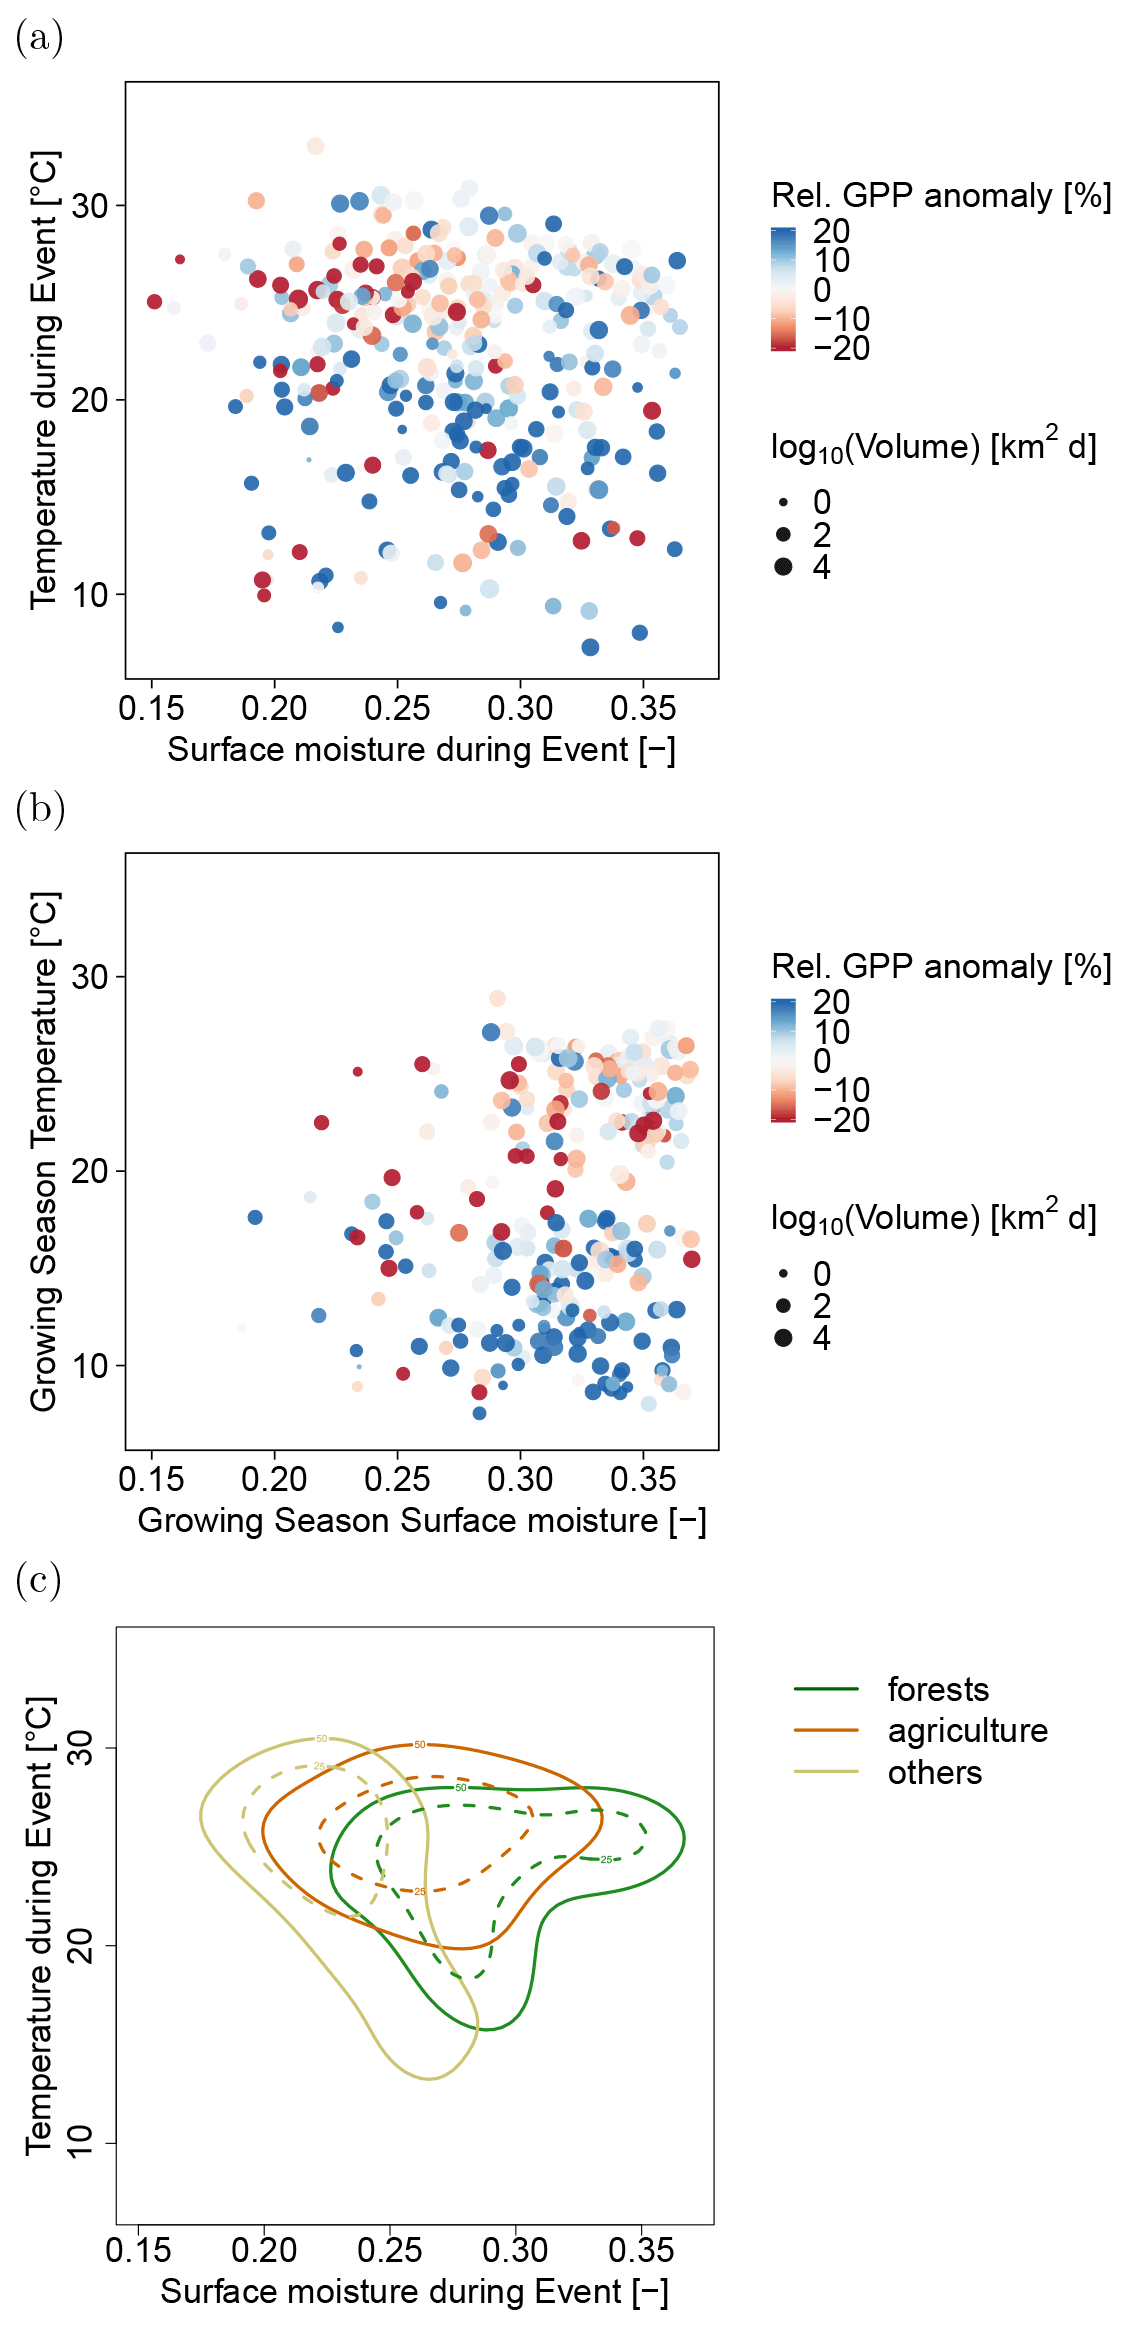
Figure 4(a) Mean temperature and surface moisture during the relative drought and heat events and (b) growing season temperature and growing season surface moisture for forests and agricultural ecosystems. Size and color of the points denote the affected space–time volume and the direction of the impact on productivity. (c) Average conditions in temperature and surface moisture during the events for all ecosystems. Colored lines enclose 25 % (dashed lines) and 50 % (solid lines) of the events within forest, agricultural, and other ecosystems.
The focus of this study is to better understand the impact of droughts and heatwaves on different vegetation types. Therefore, we detect multivariate extreme events relative to the regional typical conditions during the growing season. Furthermore, we use a global upscaled product of GPP to estimate the impact of the detected drought and heatwaves on different vegetation types. Our analysis based on a 5 % threshold in the multivariate anomaly scores leads to a detection of 213 events (98 relative droughts, 44 relative heatwaves, 71 compound drought–heatwaves) between 2003 and 2018.
If we only discriminate forest and agricultural ecosystems, we find substantial differences in the direction of the GPP anomalies during extreme droughts and heatwaves in the growing season. In agricultural (C3 and C4 croplands as well as C3 and C4 fractions croplands/natural vegetation mosaics) and other nonforest land cover types (savannas, grasslands, open and closed shrublands, woody savannas, permanent wetlands, and urban and built-up areas), GPP was reduced during the identified events (agricultural land cover types: 64 %; 56 %–72 %, 95 % confidence interval; reduction, Fig. 2a; other ecosystems 60 %; 53 %–67 %; Fig. 2c). In forested areas, instead, a majority of 71 % (63 %–78 %) of events show enhanced productivity (Fig. 2b). The dichotomy described in the instantaneous response patterns confirms the overall statistics. Events with their centroid in France 2003, Russia 2010, and Germany 2018 all show bidirectional GPP anomalies that coincide with land cover type transitions between predominantly forested land cover and others (a detailed illustration of the different events is provided in the Supplement). Figure 3 summarizes these findings across all events by relating the global integral areas of positive and negative anomalies in GPP during extreme events to the dominant land cover type. Note that the numbers in Fig. 3 are proportions of the affected space–time volume of the extreme events and thus slightly different from the proportions of the number of events reported earlier in this paragraph. Thus, Fig. 3 also indicates that it does not matter whether we obtain the statistics on an event basis or on the basis of a space–time volume. For both perspectives, the main message is the same: agricultural and other ecosystems are most strongly affected by droughts and heatwaves, whereas forests show neutral to enhanced productivity in the majority of the cases.
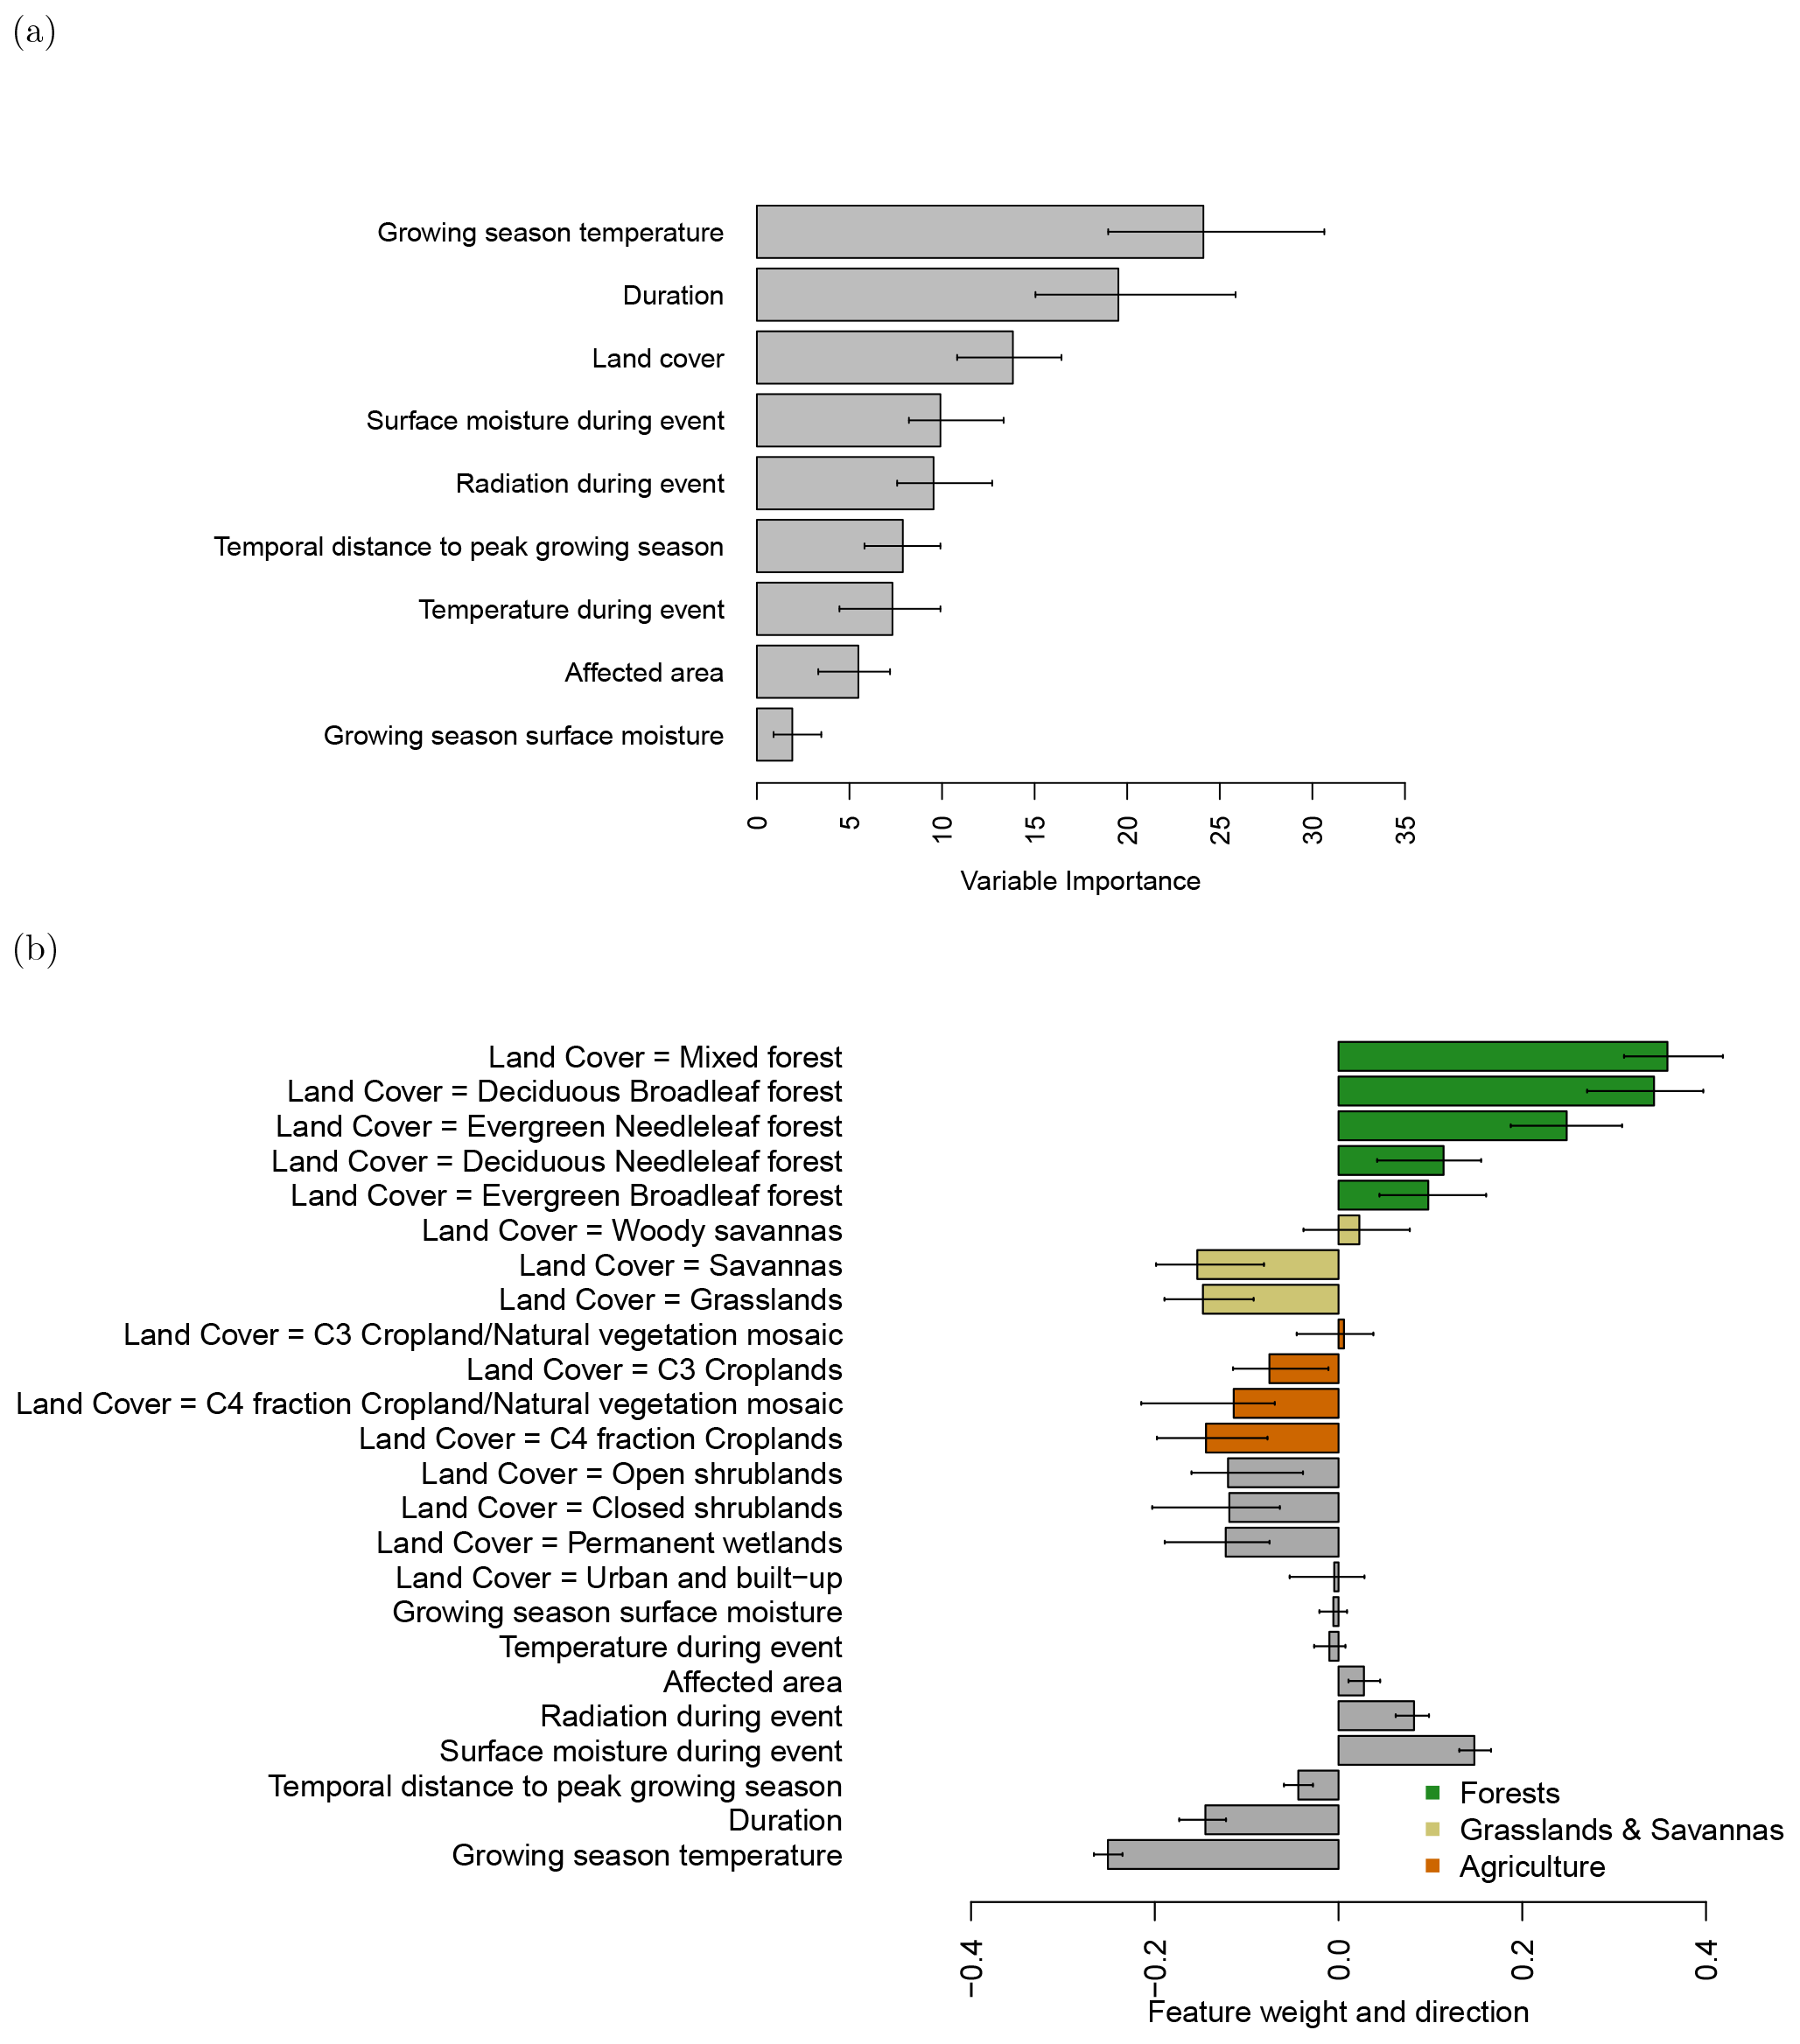
Figure 5(a) Variable importance of the 10 best gradient boosting machines predicting average GPP anomalies during the events; (b) direction and feature weight of the variables explaining GPP anomalies of the individual events based on linear regression via local interpretable model-agnostic explanations (LIME).
The events analyzed here are based on relative radiation, heat, and water availability anomalies (see Methods section). To better understand the role of absolute climate conditions, we show the reported GPP anomalies in terms of absolute temperatures and surface moisture levels in Fig. 4a. The figure shows that reduced rates of GPP tend to coincide with very low surface moisture and high temperature (8 d averages).
Furthermore, we show the events in climate space under which they occur, i.e., the average temperatures during growing season and average surface moisture during growing season (Fig. 4b). Here, we can see that the events under scrutiny are detected as extreme events relative to the normal growing season conditions. Thus, the relative drought and heat events are occurring in very hot and dry climates (upper left of Fig. 4c) as well as in very wet and cold climates (lower right of Fig. 4c). We can see a tendency towards stronger negative impacts of heat and drought events in hotter climates (Fig. 4c). A similar effect is not so clearly visible for very hot and dry climates. A reason may be a limited number of data points towards the upper left direction in Fig. 4c. Furthermore, heat and drought events in usually wet and cold climates are not associated with negative impacts or are even associated with an enhancement of productivity, e.g., when more radiation or temperature is available during the event in normally energy-limited systems.
Delineating different ecosystems within this space shows that they are arranged along decreasing surface moisture values. Most extreme events in forests tend to occur under slightly higher surface moisture conditions compared to agricultural and other ecosystems (Fig. 4c). Forests are hit less frequently with critical dry conditions for which we predominantly observe reduced productivity. In contrast, we observe reduced productivity during the events for agricultural ecosystems, which experience frequently critical hot and dry conditions (Fig. 4c).
Figure 4a shows that temperature and soil moisture have some effect on the direction of the impact, but it does not consider other potentially important variables. Thus, we refine our understanding of the observed patterns using a statistical model. To unravel the importance of land cover type and other factors, we predict average GPP anomalies using gradient boosting machines (R2=0.43; Friedman, 2001; Sect. 2.5) and explore their relative variable importance. Growing season temperature, event duration, land cover type, and surface moisture are, in decreasing order, the most important variables in the statistical model (Fig. 5a).
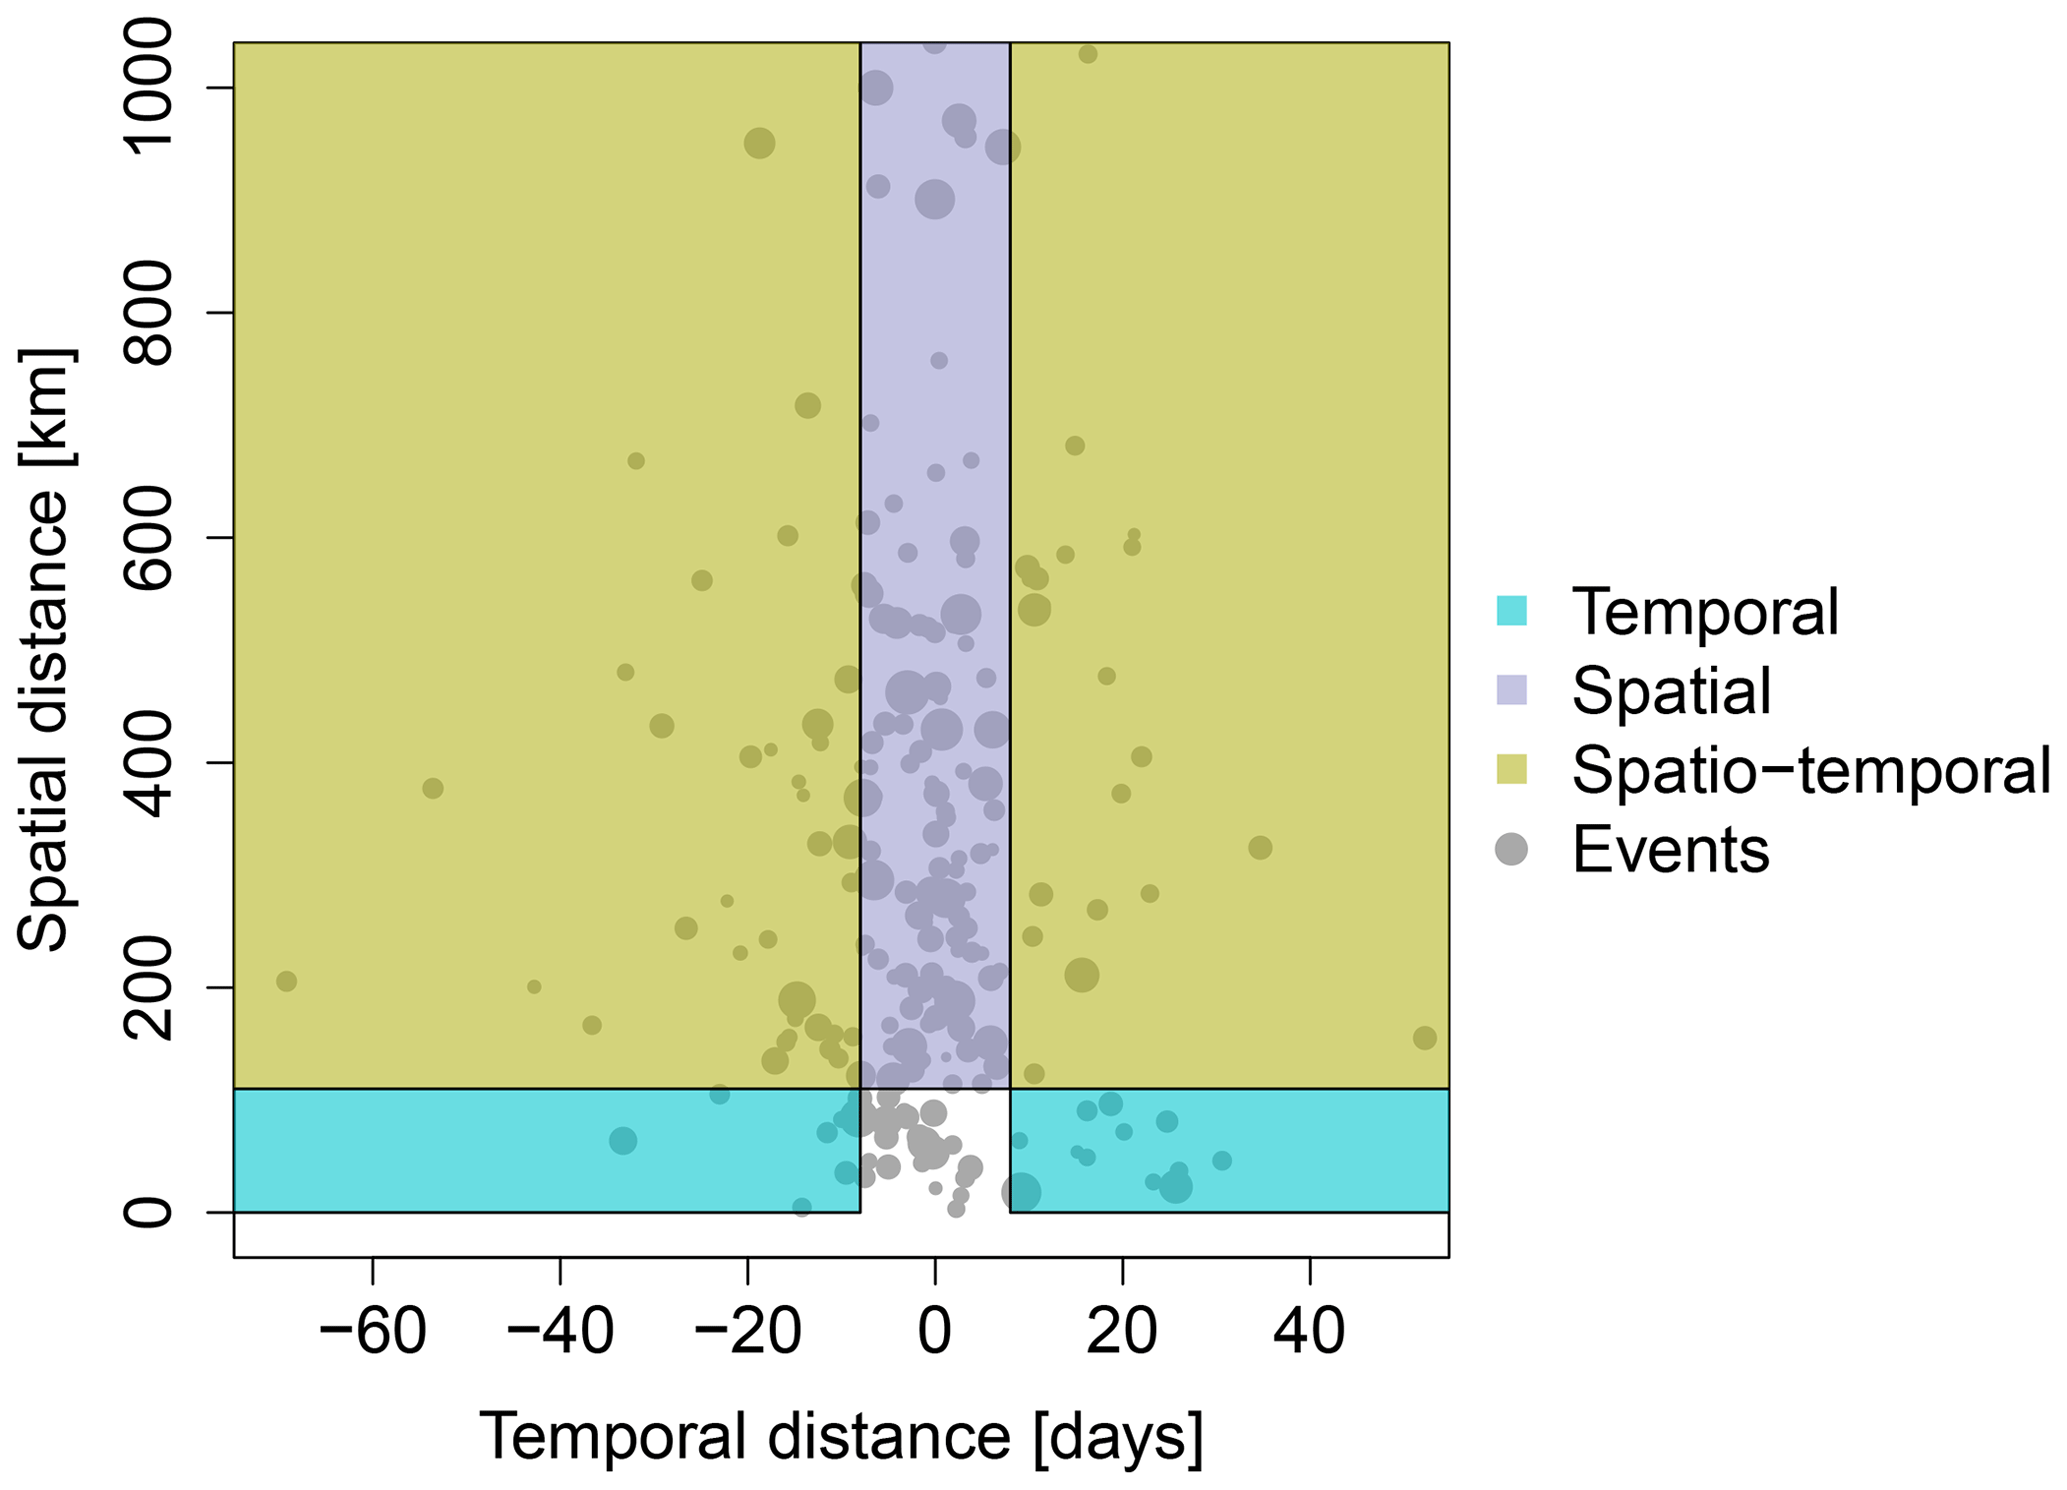
Figure 6Each extreme event is split into parts with enhanced and reduced GPP anomalies. The centroidal distance between both parts in space and time shows whether contrasting GPP anomalies are predominantly taking place temporally, spatially, or spatiotemporally. Point sizes are proportional to the event's affected volume.
Apart from identifying important variables that explain the GPP anomalies during drought and heat anomalies, we disentangle the direction of each factor's effect in the model and in particular for specific land cover classes. Negative model coefficients are a negative contribution of the respective variable to the GPP anomaly; that is, the variable contributes to a stronger impact. In contrast, a positive model coefficient is associated with a positive contribution of the respective variable to the GPP anomaly. Thus, positive model coefficients weaken the impact of the extreme event, which may even lead to an enhancement of GPP during the extreme event.
Whereas growing season temperature and duration show a negative model coefficient (i.e., a longer duration and a warmer climate are associated with a stronger impact), a greater availability of radiation and higher surface moisture during the event reduce the impact on vegetation.
Productivity in different land cover types is influenced in contrasting ways: forest ecosystems (land cover types including “forest” in their names) show increased average GPP during the extreme events. In contrast, agricultural ecosystems (land cover types including “cropland” in their names) reduce average GPP anomalies (Fig. 5b).
On land cover level, there is one exception of the agricultural ecosystems having a more neutral model coefficient: “C3 croplands/natural vegetation mosaics”. However, “C3 croplands” itself, “C4 fraction croplands”, and “C4 fraction croplands/natural vegetation mosaics” all show negative coefficients. These agricultural systems are highly managed, so their difference may be more related to management than to ecological differences. Mostly in the temperate and boreal zone mixed forests, deciduous broadleaf forests and evergreen needleleaf forests exhibit the most positive model coefficients. In the tropical zone evergreen broadleaf forests show the least positive model coefficient. In between forests and grasslands (savannas), woody savannas have still considerably many trees in each grid cell. They are positioned with a positive-to-neutral model coefficient on the transition between forests and savannas. Savannas and grasslands are both associated with a negative model coefficient comparable to agricultural systems. Open and closed shrublands as well as permanent wetlands exhibit a negative coefficient. Urban and built-up area is associated with a neutral coefficient.
We showed that the land cover type is one of the major factors influencing the direction of the GPP anomaly during an extreme event. A single hydrometeorological extreme event with a given magnitude and duration can affect two or more adjacent land cover types simultaneously with potentially contrasting impacts (spatial contrasting anomalies). Apart from an extreme event simultaneously affecting adjacent ecosystems with different or even contrasting impacts, it is also possible that one ecosystem shows contrasting impacts over time, i.e., with increasing duration. During startup of the extreme event, enhanced productivity may be observed which can turn into a contrasting reduced productivity at a later stage of the extreme event. This temporal difference in the response with a longer-lasting extreme event is considered to be a temporally contrasting anomaly. To explicitly quantify the role of spatial vs. temporal effects on the GPP anomalies during extreme events, we split each event into parts with enhanced and reduced GPP anomalies and computed the centroidal distance in space and time. In fact, positive and negative GPP anomalies mostly co-occur simultaneously in adjacent spatial regions (116 events of 213 events in total within ±8 d; Fig. 6). Especially for large-scale events (large volume), a considerable distance in the anomalies can be observed both in space and in time. Thus, these extreme events show spatially as well as temporally contrasting anomalies. Taking only the temporal distance into account, we have more events with enhanced productivity before reduced productivity (temporal distance < −8 d, n=44) than events with reduced productivity before enhanced productivity (> 8 d, n=33).
Contrasting responses of ecosystems to climate extremes, e.g., in the US in 2012 (Wolf et al., 2016) or in Russia in 2010 (Flach et al., 2018), are not singular cases but are shown to be frequent phenomena in response to hydrometeorological extreme events at the global scale. Within the same extreme event, reduced and enhanced productivity can be observed simultaneously in adjacent spatial regions. This finding complements previous studies on temporal (Wolf et al., 2016; Sippel et al., 2017a; Buermann et al., 2018) or spatial contrasting responses (Jolly et al., 2005; Zaitchik et al., 2006; Lewińska et al., 2016).
This study provides evidence that the impacts of extreme drought or heat anomalies on GPP during growing seasons are firstly a function of event duration and long-term climate and secondly also depend on the affected land cover type. In particular the tendency towards positive vs. negative responses seems to be controlled by tree cover (similar to the results of Ivits et al., 2014, and Walther et al., 2019); that is, forests seem to show higher resilience to drought and heat anomalies in the short term, which is reflected in a tendency towards positive GPP anomalies during the events. However, our results are based on events that are extreme relative to the regional normal conditions. In the Supplement, we illustrate a range of events in more detail. For instance, a relative drought or heatwave in a typically wet ecosystem can boost productivity as well as a heatwave in ecosystems that are typically cold (see cases reported, for example, for China 2011, India 2009, and the Siberian heatwave 2011). Both water stress and temperature affect ecophysiological processes in a nonlinear manner. Heat events below optimal temperatures enhance photosynthesis (Wang et al., 2017), or photosynthesis may be enhanced by the radiation surplus during dry periods (Walther et al., 2019), especially at higher latitudes (Bachmair et al., 2018) and as long as ecophysiological limits are not violated. Yet, the prevalence of certain land cover types is partly controlled by climatic gradients; therefore, land cover cannot really be considered independently of the mean climatological conditions that likewise play a role (Fig. 4a). Climate conditions also lead to adaptation of physiological processes. For instance, forests in dry ecosystems may be characterized by a more conservative water use strategy (Teuling et al., 2010; van Heerwaarden and Teuling, 2014; Ramos et al., 2015) and adapted to drought compared to analogous land cover types whose biogeographic history experienced colder and more moderate conditions (Doughty et al., 2015). Moreover, forests have access to deeper soil water compared to other ecosystems (Yang et al., 2016; Fan et al., 2017). The isohydric degree may further differentiate the response of forests, as it differs between tree species (Roman et al., 2015; Ruehr et al., 2015; Yi et al., 2017).
Our study only reports on GPP responses during the climatic anomaly without considering the legacy of the events. Responses may emerge with some time lag between weeks and months (Schwalm et al., 2012; Ruehr et al., 2015) or even at longer timescales (years) (Saatchi et al., 2013; Anderegg et al., 2015). Hence, finding enhanced productivity of forests during some heat event does not exclude increased mortality in the long term. Forest ecosystems are known to potentially have a much delayed response to environmental stress, which can trigger strong secondary impacts like insect outbreaks (Hicke et al., 2006; Rouault et al., 2006; Allen et al., 2010) or fires (Brando et al., 2014). In contrast, agricultural systems are known to be very directly vulnerable to droughts (De Keersmaecker et al., 2016; Bachmair et al., 2018). We choose the growing season as the time period of interest, which is notably different than summer for some regions, e.g., in the Mediterranean where more positive responses to warm anomalies in the cold season may be expected (Sippel et al., 2017b) and impacts of droughts may also be less than during the dry season (Huang et al., 2018).
Our results for gross primary productivity do not necessarily translate directly into net ecosystem exchange, because GPP and ecosystem respiration interact in a complex way (Richardson et al., 2007). However, studying the Russian heatwave 2010, Bastos et al. (2014) found an increase in autotrophic respiration rates in forests, whereas crops declined their respiration rates. Flach et al. (2018) observed similar differences between forests and agricultural systems for gross primary productivity as well as for net ecosystem productivity during the Russian heatwave. This similarity would suggest that the increase in autotrophic respiration for forest ecosystems during the heatwave does not offset potential carbon gains of available radiation and temperature in this particular energy-limited forest ecosystem. Although these findings remain case studies which are as such difficult to generalize, we would expect to see similar responses for net ecosystem productivity as for gross primary productivity.
Another aspect to discuss is data quality. We use ERA5 data for radiation and 2 m air temperature. In particular for the latter one, there are indications that 2 m air temperature might be slightly underestimated: land surface temperature is known to have a slight cold bias over the Iberian Peninsula due to the effect of prescribed vegetation and topography (Johannsen et al., 2019). This bias might further translate into turbulent energy fluxes and eventually also affect 2 m air temperature. However, as we use a relative detection scheme, a systematic seasonal cold bias in temperature would not change the occurrence of relative heat events in our study. In addition, it should be noted that ERA5 data have a considerably better data quality than its predecessor ERA-Interim (Johannsen et al., 2019), and it is thus preferred in this study.
Furthermore, we use GLEAM surface moisture. GLEAM is driven by ERA5 data; thus, errors in ERA5 might further propagate into GLEAM. Additionally, GLEAM is known to underestimate soil-moisture–temperature coupling due to soil and vegetation characteristics, in particular for temperate and continental climates (Gevaert et al., 2017). This may lead to an overestimation of the remaining soil moisture in energy-limited regimes and to an underestimation of soil moisture in water-limited regimes. It implies an underestimation (overestimation) of drought intensity for energy-limited (water-limited) regimes in our study. However, GLEAM is still best at capturing latent heat flux dynamics compared to other products (Gevaert et al., 2017), and it therefore seems to be reasonable to rely on GLEAM to detect droughts and heatwaves in our study.
Gross primary productivity from FLUXCOM-RS may inherit errors from the underlying remote sensing products; these have, in particular, been discussed for tropical forests (Asner et al., 2004; Asner and Alencar, 2010; Wu et al., 2018). Recently, Stocker et al. (2019) showed at the global scale that remote-sensing-retrieved GPP underestimates drought impacts due to soil moisture effects on light use efficiency. Comparing our estimates of GPP impacts to published data from eddy covariance stations for two case studies (US 2012; Wolf et al., 2016; and Europe 2003; Ciais et al., 2005; Reichstein et al., 2007) indicates that we do indeed underestimate GPP impacts. This lack of sensitivity of FLUXCOM-RS GPP to droughts and heatwaves seems to be a more general issue of GPP estimates as well as in remote sensing in general: we suspect that in addition to the GPP estimates used by Stocker et al. (2019), FLUXCOM-RS GPP also underestimates the impacts of climate extreme events specifically for forest ecosystems. FLUXCOM-RS additionally exhibits a good agreement for forests globally with GPP estimates based on solar-induced fluorescence (Walther et al., 2019). Thus, the lack of sensitivity to drought and heat impacts in forest ecosystems may be a more general issue in remote sensing data.
To understand the effect of different vegetation types and other factors on the response of drought and heatwaves, we analyzed 213 events between 2003 and 2018 globally. Generally, we find that extreme events of a given extent, magnitude, and duration often affect different adjacent vegetation types, each vegetation type differing in their specific response to the event. Quantifying these findings, we find that vegetation is one important variable which has to be considered for understanding the impact of climate extremes. Whereas agricultural systems, grasslands, savannas, and shrublands are most impacted in terms of gross primary productivity, forests are not particularly sensitive to the extreme event or even show enhanced gross primary productivity during the events.
Thus, we conclude that a more differentiated consideration of the role of land cover reveals firstly major differences between forests, agricultural, and other ecosystems. These differences may originate from a different (micro)climate or different water management strategies including the access to deeper soil water or point to more strongly lagged impacts in forest ecosystems.
Our findings imply for future climate that forest ecosystems may be crucial for mitigating immediate negative impacts on the carbon cycle of an increasing number of heatwaves. However, longer-lasting heatwaves, drying in continental climates, or a disproportionate increase in summer drought–heat events due to mutual dependencies may more frequently lead to critical moisture conditions for which we observe negative impacts for forests and to which forests are not well adapted. This is particularly critical as forest recovery times are multidecadal.
However, the lack of sensitivity of forest ecosystems to droughts and heatwaves is stronger than we would expect it to be, as forests are generally considered to be vulnerable to drought- and heat-related mortality risks. Thus, we think that our results also point towards deficiencies in FLUXCOM-RS-derived GPP data, which are potentially a more general issue in remote-sensing-derived indices of vegetation activity. These deficiencies call for the development of new global GPP products with a higher sensitivity to droughts and heatwaves, which can unravel the role of forest ecosystems in a more frequently hot and dry future climate.
The procedure which is used here to detect multivariate anomalies works as follows (see also Flach et al., 2018):
-
Select one pixel and some spatial replicates (here four spatial replicates as defined in Sect. 2.3) to obtain five considerably similar time series of temperature, radiation, and surface moisture.
-
Subtract a smoothed median seasonal cycle from each time series to obtain anomalies (deviations from the normal seasonality) and their covariance matrix Q.
-
Select a seasonal window of 3 months in each year (3 months would correspond to, for example, all summers in the years under scrutiny).
-
Standardize the anomalies to zero mean and unit variance.
-
Compute kernel density estimates using a standard multivariate normal kernel, K, with the covariance matrix Q. Using a multivariate normal kernel accounts for linear correlations among the set of input variables (here radiation, temperature, surface moisture) while allowing for nonlinear shapes in the data (Flach et al., 2017).
-
Transform the resulting univariate index of deviations from the general multivariate pattern into a score of normalized ranks between 0.0 (very normal) and 1.0 (extremely far away from the dense regions of the multivariate distribution).
-
Select the data points higher than a threshold of 0.95 to obtain 5 % of the data as multivariate extreme events.
-
Memorize the extreme events and the obtained score for the selected pixel and season.
-
Repeat the procedure (steps 3–8) in a (running) moving window of 3 months length.
-
Repeat the procedure with the next pixel.
We use data originating from the FluxCom initiative (https://doi.org/10.5194/bg-13-4291-2016, last access: 15 December 2020; Tramontana et al., 2016), the GLEAM model data integration framework (https://doi.org/10.5194/gmd-10-1903-2017, last access: 15 December 2020; Martens et al., 2017), and ERA5 (https://doi.org/10.1002/qj.3803, last access: 15 December 2020; Copernicus Climate Change Service, 2017). The harmonized data set is available within the project Earth System Data Lab (ESDL) and can be accessed upon registration at: https://www.earthsystemdatalab.net/index.php/interact/data-lab/ (last access: 15 December 2020; Earth System Data Lab, 2020).
The supplement related to this article is available online at: https://doi.org/10.5194/bg-18-39-2021-supplement.
MF and MDM designed the study in collaboration with AB, FG, SS, and MR. MF conducted the analysis and wrote the article with contributions from all co-authors.
The authors declare they have no conflict of interests.
This article is part of the special issue “Understanding compound weather and climate events and related impacts (BG/ESD/HESS/NHESS inter-journal SI)”. It is not associated with a conference.
This research was supported by the European Space Agency (project “Earth System Data Lab”) and the European Union's Horizon 2020 research and innovation program (project “BACI”, grant no. 64176). The authors are grateful to the FluxCom initiative (http://www.fluxcom.org, last access: 15 December 2020) for providing the data. Milan Flach acknowledges support by the International Max Planck Research School (IMPRS) for Global Biogeochemical Cycles. Two reviewers provided valuable feedback for improvement of the article.
This research has been supported by the European Commission, H2020 Industrial Leadership (grant no. BACI 640176), and the European Space Agency (project “Earth System Data Lab”).
The article processing charges for this open-access
publication were covered by the Max Planck Society.
This paper was edited by Bart van den Hurk and reviewed by two anonymous referees.
AghaKouchak, A., Cheng, L., Mazdiyasni, O., and Farahmand, A.: Global warming and changes in risk of concurrent climate extremes: Insights from the 2014 California drought, Geophys. Res. Lett., 41, 8847–8852, 2014. a
Allen, C. D., Macalady, A. K., Chenchouni, H., Bachelet, D., McDowell, N., Vennetier, M., Kitzberger, T., Rigling, A., Breshears, D. D., Hogg, E. H. T., Gonzalez, P., Fensham, R., Zhang, Z., Castro, J., Demidova, N., Lim, J.-H., Allard, G., Running, S. W., Semerci, A., and Cobb, N.: A global overview of drought and heat-induced tree mortality reveals emerging climate change risks for forests, Forest Ecol. Manag., 259, 660–684, 2010. a
Anderegg, W. R. L., Schwalm, C. R., Biondi, F., Camarero, J. J., Koch, G., Litvak, M., Ogle, K., Shaw, J. D., Shevliakova, E., Williams, A. P., Wolf, A., Ziaco, E., and Pacala, S.: Pervasive drought legacies in forest ecosystems and their implications for carbon cycle models, Science, 349, 524–528, 2015. a
Asner, G. P. and Alencar, A.: Drought impacts on the Amazon forest: the remote sensing perspective, New Phytol., 187, 569–578, 2010. a
Asner, G. P., Nepstad, D., Cardinot, G., and Ray, D.: Drought stress and carbon uptake in an Amazon forest measured with spaceborne imaging spectroscopy, P. Natl. Acad. Sci. USA, 101, 6039–6044, 2004. a
Bachmair, S., Tanguy, M., Hannaford, J., and Stahl, K.: How well do meteorological indicators represent agricultural and forest drought across Europe?, Environ. Res. Lett., 13, 034042, https://doi.org/10.1088/1748-9326/aaafda, 2018. a, b
Bastos, A., Gouveia, C. M., Trigo, R. M., and Running, S. W.: Analysing the spatio-temporal impacts of the 2003 and 2010 extreme heatwaves on plant productivity in Europe, Biogeosciences, 11, 3421–3435, https://doi.org/10.5194/bg-11-3421-2014, 2014. a, b
Brando, P. M., Balch, J. K., Nepstad, D. C., Morton, D. C., Putz, F. E., Coe, M. T., Silverio, D., Macedo, M. N., Davidson, E. A., Nobrega, C. C., Alencar, A., and Soares-Filho, B. S.: Abrupt increases in Amazonian tree mortality due to drought-fire interactions, P. Natl. Acad. Sci. USA, 111, 6347–6352, 2014. a
Brando, P. M., Paolucci, L., Ummenhofer, C. C., Ordway, E. M., Hartmann, H., Cattau, M. E., Rattis, L., Medjibe, V., Coe, M. T., and Balch, J.: Droughts, Wildfires, and Forest Carbon Cycling: A Pantropical Synthesis, Annu. Rev. Earth Pl. Sc., 47, 555–581, 2019. a
Buermann, W., Bikash, P. R., Jung, M., Burn, D. H., and Reichstein, M.: Earlier springs decrease peak summer productivity in North American boreal forests, Environ. Res. Lett., 8, 024027, https://doi.org/10.1088/1748-9326/8/2/024027, 2013. a
Buermann, W., Forkel, M., O'Sullivan, M., Sitch, S., Friedlingstein, P., Haverd, V., Jain, A. K., Kato, E., Kautz, M., Lienert, S., Lombardozzi, D., Nabel, J. E. M. S., Tian, H., Wiltshire, A. J., Zhu, D., Smith, W. K., and Richardson, A. D.: Widespread seasonal compensation effects of spring warming on northern plant productivity, Nature, 562, 110–111, 2018. a, b
Chen, W., Zhu, D., Huang, C., Ciais, P., Yao, Y., Friedlingstein, P., Sitch, S., Haverd, V., Jain, A. K., Kato, E., Kautz, M., Lienert, S., Lombardozzi, D., Poulter, B., Tian, H., Vuichard, N., Walker, A. P., and Zeng, N.: Negative extreme events in gross primary productivity and their drivers in China during the past three decades, Agr. Forest Meteorol., 275, 47–58, 2019. a
Ciais, P., Reichstein, M., Viovy, N., Granier, A., Ogée, J., Allard, V., Aubinet, M., Buchmann, N., Bernhofer, C., Carrara, A., Chevallier, F., De Noblet, N., Friend, A. D., Friedlingstein, P., Grünwald, T., Heinesch, B., Keronen, P., Knohl, A., Krinner, G., Loustau, D., Manca, G., Matteucci, G., Miglietta, F., Ourcival, J. M., Papale, D., Pilegaard, K., Rambal, S., Seufert, G., Soussana, J. F., Sanz, M. J., Schulze, E. D., Vesala, T., and Valentini, R.: Europe-wide reduction in primary productivity caused by the heat and drought in 2003, Nature, 437, 529–533, 2005. a, b, c
Cook, B. I., Ault, T. R., and Smerdon, J. E.: Unprecedented 21st century drought risk in the American Southwest and Central Plains, Science Advances, 1, e1400082, https://doi.org/10.1126/sciadv.1400082, 2015. a
Copernicus Climate Change Service (C3S): ERA5: Fifth generation of ECMWF atmospheric reanalyses of the global climate, Copernicus Climate Change Service Climate Data Store (CDS), available at: https://doi.org/10.1002/qj.3803 (last access: 15 December 2020), 2017. a, b
Coumou, D. and Robinson, A.: Historic and future increase in the global land area affected by monthly heat extremes, Environ. Res. Lett., 8, 034018, https://doi.org/10.1088/1748-9326/8/3/034018, 2013. a
De Keersmaecker, W., van Rooijen, N., Lhermitte, S., Tits, L., Schaminée, J., Coppin, P., Honnay, O., and Somers, B.: Species-rich semi-natural grasslands have a higher resistance but a lower resilience than intensively managed agricultural grasslands in response to climate anomalies, J. Appl. Ecol., 53, 430–439, 2016. a
Doughty, C. E., Metcalfe, D. B., Girardin, C. A. J., Amézquita, F. F., Cabrera, D. G., Huasco, W. H., Silva-Espejo, J. E., Araujo-Murakami, A., da Costa, M. C., Rocha, W., Feldpausch, T. R., Mendoza, A. L. M., da Costa, A. C. L., Meir, P., Phillips, O. L., and Malhi, Y.: Drought impact on forest carbon dynamics and fluxes in Amazonia, Nature, 519, 78–82, 2015. a
Elith, J., Leathwick, J. R., and Hastie, T.: A working guide to boosted regression trees, J. Anim. Ecol., 77, 802–813, 2008. a
ESDL: Earth System Data Lab, information are available upon registration at: https://www.earthsystemdatalab.net/index.php/interact/data-lab/ (last access: 15 December 2020). a
Fan, Y., Miguez-Macho, G., Jobbágy, E. G., Jackson, R. B., and Otero-Casal, C.: Hydrologic regulation of plant rooting depth, P. Natl. Acad. Sci. USA, 114, 10572–10577, https://doi.org/10.1073/pnas.1712381114, 2017. a
Flach, M., Gans, F., Brenning, A., Denzler, J., Reichstein, M., Rodner, E., Bathiany, S., Bodesheim, P., Guanche, Y., Sippel, S., and Mahecha, M. D.: Multivariate anomaly detection for Earth observations: a comparison of algorithms and feature extraction techniques, Earth Syst. Dynam., 8, 677–696, https://doi.org/10.5194/esd-8-677-2017, 2017. a, b, c
Flach, M., Sippel, S., Gans, F., Bastos, A., Brenning, A., Reichstein, M., and Mahecha, M. D.: Contrasting biosphere responses to hydrometeorological extremes: revisiting the 2010 western Russian heatwave, Biogeosciences, 15, 6067–6085, https://doi.org/10.5194/bg-15-6067-2018, 2018. a, b, c, d, e, f, g, h
Frank, D., Reichstein, M., Bahn, M., Thonicke, K., Frank, D., Mahecha, M. D., Smith, P., van der Velde, M., Vicca, S., Babst, F., Beer, C., Buchmann, N., Canadell, J. G., Ciais, P., Cramer, W., Ibrom, A., Miglietta, F., Poulter, B., Rammig, A., Seneviratne, S. I., Walz, A., Wattenbach, M., Zavala, M. A., and Zscheischler, J.: Effects of climate extremes on the terrestrial carbon cycle: concepts, processes and potential future impacts, Global Change Biol., 21, 2861–2880, 2015. a
Friedl, M. A., Sulla-Menashe, D., Tan, B., Schneider, A., Ramankutty, N., Sibley, A., and Huang, X.: MODIS Collection 5 global land cover: Algorithm refinements and characterization of new datasets, Remote Sens. Environ., 114, 168–182, 2010. a
Friedman, J. H.: Greedy Function Approximation: A Gradient Boosting Machine, Ann. Stat., 29, 1189–1232, 2001. a, b, c
Gevaert, A. I., Miralles, D. G., de Jeu, R. A. M., Schellekens, J., and Dolman, A. J.: Soil Moisture‐Temperature Coupling in a Set of Land Surface Models, J. Geophys. Res.-Atmos., 123, 1481–1498, https://doi.org/10.1002/2017JD027346, 2017. a, b
Granier, A., Bréda, N., Longdoz, B., Gross, P., and Ngao, J.: Ten years of fluxes and stand growth in a young beech forest at Hesse, North-eastern France, Ann. For. Sci., 65, 704, https://doi.org/10.1051/forest:2008052, 2008. a
Hicke, J. A., Logan, J. A., Powell, J., and Ojima, D. S.: Changing temperatures influence suitability for modeled mountain pine beetle (Dendroctonus ponderosae) outbreaks in the western United States, J. Geophys. Res.-Biogeo., 111, G02019, https://doi.org/10.1029/2005JG000101, 2006. a
Huang, M., Wang, X., Keenan, T. F., and Piao, S.: Drought timing influences the legacy of tree growth recovery, Global Change Biol., 24, 3546–3559, 2018. a
Ivits, E., Horion, S., Fensholt, R., and Cherlet, M.: Drought footprint on European ecosystems between 1999 and 2010 assessed by remotely sensed vegetation phenology and productivity, Global Change Biol., 20, 581–593, 2014. a
Johannsen, F., Ermida, S., Martins, J. P. A., Trigo, I. F., Nogueira, M., and Dutra, E.: Cold Bias of ERA5 Summertime Daily Maximum Land Surface Temperature over Iberian Peninsula, Remote Sens.-Basel, 11, 2570, https://doi.org/10.3390/rs11212570, 2019. a, b
Jolly, W. M., Dobbertin, M., Zimmermann, N. E., and Reichstein, M.: Divergent vegetation growth responses to the 2003 heat wave in the Swiss Alps, Geophys. Res. Lett., 32, L18409, https://doi.org/10.1029/2005GL023252, 2005. a
Lewińska, K., Ivits, E., Schardt, M., and Zebisch, M.: Alpine Forest Drought Monitoring in South Tyrol: PCA Based Synergy between scPDSI Data and MODIS Derived NDVI and NDII7 Time Series, Remote Sens.-Basel, 8, 639, https://doi.org/10.3390/rs8080639, 2016. a
Lloyd-Hughes, B.: A spatio-temporal structure-based approach to drought characterisation, Int. J. Climatol., 32, 406–418, 2011. a
Mahecha, M. D., Gans, F., Sippel, S., Donges, J. F., Kaminski, T., Metzger, S., Migliavacca, M., Papale, D., Rammig, A., and Zscheischler, J.: Detecting impacts of extreme events with ecological in situ monitoring networks, Biogeosciences, 14, 4255–4277, https://doi.org/10.5194/bg-14-4255-2017, 2017. a, b, c, d
Martens, B., Miralles, D. G., Lievens, H., van der Schalie, R., de Jeu, R. A. M., Fernández-Prieto, D., Beck, H. E., Dorigo, W. A., and Verhoest, N. E. C.: GLEAM v3: satellite-based land evaporation and root-zone soil moisture, Geosci. Model Dev., 10, 1903–1925, https://doi.org/10.5194/gmd-10-1903-2017 (last access: 15 December 2020), 2017. a, b
McPhillips, L. E., Chang, H., Chester, M. V., Depietri, Y., Friedman, E., Grimm, N. B., Kominoski, J. S., McPhearson, T., Méndez-Lázaro, P., Rosi, E. J., and Shafiei Shiva, J.: Defining Extreme Events: A Cross-Disciplinary Review, Earth's Future, 6, 441–455, 2018. a
Meehl, G. A., Zwiers, F. W., Evans, J. L., Knutson, T., Mearns, L. O., and Whetton, P.: Trends in Extreme Weather and Climate Events: Issues Related to Modeling Extremes in Projections of Future Climate Change, B. Am. Meteorol. Soc., 81, 427–436, 2000. a
Miralles, D. G., Holmes, T. R. H., De Jeu, R. A. M., Gash, J. H., Meesters, A. G. C. A., and Dolman, A. J.: Global land-surface evaporation estimated from satellite-based observations, Hydrol. Earth Syst. Sci., 15, 453–469, https://doi.org/10.5194/hess-15-453-2011, 2011. a
Olesen, J. E. and Bindi, M.: Consequences of climate change for European agricultural productivity, land use and policy, Eur. J. Agron., 16, 239–262, 2002. a
Orth, R. and Destouni, G.: Drought reduces blue-water fluxes more strongly than green-water fluxes in Europe, Nat. Commun., 9, 3602, https://doi.org/10.1038/s41467-018-06013-7, 2018. a
Peuelas, J., Gordon, C., Llorens, L., Nielsen, T., Tietema, A., Beier, C., Bruna, P., Emmett, B., Estiarte, M., and Gorissen, A.: Nonintrusive Field Experiments Show Different Plant Responses to Warming and Drought Among Sites, Seasons, and Species in a North/South European Gradient, Ecosystems, 7, 598–612, 2004. a
Ramos, A., Pereira, M. J., Soares, A., do Rosário, L., Matos, P., Nunes, A., Branquinho, C., and Pinho, P.: Seasonal patterns of Mediterranean evergreen woodlands (Montado) are explained by long-term precipitation, Agr. Forest Meteorol., 202, 44–50, https://doi.org/10.1016/j.agrformet.2014.11.021, 2015. a
Reichstein, M., Ciais, P., Papale, D., Valentini, R., Running, S., Viovy, N., Cramer, W., Granier, A., Ogée, J., Allard, V., Aubinet, M., Bernhofer, C., Buchmann, N., Carrara, A., Grünwald, T., Heimann, M., Heinesch, B., Knohl, A., Kutsch, W., Loustau, D., Manca, G., Matteucci, G., Miglietta, F., Ourcival, J.-M., Pilegaard, K., Pumpanen, J., Rambal, S., Schaphoff, S., Seufert, G., Soussana, J. F., Sanz, M. J., Vesala, T., and Zhao, M.: Reduction of ecosystem productivity and respiration during the European summer 2003 climate anomaly: a joint flux tower, remote sensing and modelling analysis, Global Change Biol., 13, 634–651, 2007. a
Reichstein, M., Bahn, M., Ciais, P., Frank, D., Mahecha, M. D., Seneviratne, S. I., Zscheischler, J., Beer, C., Buchmann, N., Frank, D. C., Papale, D., Rammig, A., Smith, P., Thonicke, K., van der Velde, M., Vicca, S., Walz, A., and Wattenbach, M.: Climate extremes and the carbon cycle, Nature, 500, 287–295, 2013. a
Ribeiro, M. T., Singh, S., and Guestrin, C.: “Why Should I Trust You?”, KDD'16, Proceedings of the 22nd ACM SIGKDD International Conference on Knowledge Discovery and Data Mining (13–17 August 2016), ACM Press, San Francisco, CA, USA, 1135–1144, 2016. a
Richardson, A. D., Hollinger, D. Y., Aber, J. D., Ollinger, S. V., and Braswell, B. H.: Environmental variation is directly responsible for short- but not long-term variation in forest-atmosphere carbon exchange, Global Change Biol., 13, 788–803, 2007. a
Roman, D. T., Novick, K. A., Brzostek, E. R., Dragoni, D., Rahman, F., and Phillips, R. P.: The role of isohydric and anisohydric species in determining ecosystem‐scale response to severe drought, Oecologia, 179, 641–654, 2015. a
Rouault, G., Candau, J.-N., Lieutier, F., Nageleisen, L.-M., Martin, J.-C., and Warzée, N.: Effects of drought and heat on forest insect populations in relation to the 2003 drought in Western Europe, Ann. For. Sci., 63, 613–624, 2006. a
Ruehr, N. K., Gast, A., Weber, C., Daub, B., and Arneth, A.: Water availability as dominant control of heat stress responses in two contrasting tree species, Tree Physiol., 36, 164–178, 2015. a, b
Saatchi, S., Asefi-Najafabady, S., Malhi, Y., Aragao, L. E. O. C., Anderson, L. O., Myneni, R. B., and Nemani, R.: Persistent effects of a severe drought on Amazonian forest canopy, P. Natl. Acad. Sci. USA, 110, 565–570, 2013. a
Schwalm, C. R., Williams, C. A., Schaefer, K., Baldocchi, D., Black, T. A., Goldstein, A. H., Law, B. E., Oechel, W. C., Paw, U. K. T., and Scott, R. L.: Reduction in carbon uptake during turn of the century drought in western North America, Nat. Geosci., 5, 551–556, 2012. a
Seneviratne, S. I., Nicholls, N., Easterling, D., Goodess, C., Kanae, S., Kossin, J., Luo, Y., Marengo, J., McInnes, K., Rahimi, M., Reichstein, M., Sorteberg, A., Vera, C., and Zhang, X.: Changes in climate extremes and their impacts on the natural physical environment, in: Managing the Risks of Extreme Events and Disasters to Advance Climate Change Adaptation (IPCC SREX Report), edited by: Field, C., Barros, V., Stocker, T., Qin, D., Dokken, D., Ebi, K., Mastrandrea, M., Mach, K., Plattner, G.-K., Allen, S., Tignor, M., and Midgley, P. M., Cambridge University Press, Cambridge, UK, 109–230, 2012. a
Sippel, S., Forkel, M., Rammig, A., Thonicke, K., Flach, M., Heimann, M., Otto, F. E. L., Reichstein, M., and Mahecha, M. D.: Contrasting and interacting changes in simulated spring and summer carbon cycle extremes in European ecosystems, Environ. Res. Lett., 12, 075006, https://doi.org/10.1088/1748-9326/aa7398, 2017a. a, b
Sippel, S., El-Madany, T. S., Mahecha, M. D., Migliavacca, M., Carrara, A., Flach, M., Kaminski, T., Otto, F. E. L., Thonicke, K., Vossbeck, M., and Reichstein, M.: Warm winter, wet spring, and and extreme response in ecosystem functioning on the Iberian Peninsula, B. Am. Meteorol. Soc., 98, 80–85, 2017b. a
Sippel, S., Reichstein, M., Ma, X., Mahecha, M. D., Lange, H., Flach, M., and Frank, D.: Drought, Heat, and the Carbon Cycle: a review, Current Climate Change Reports, 4, 266–286, https://doi.org/10.1007/s40641-018-0103-4, 2018. a
Stocker, B. D., Zscheischler, J., Keenan, T. F., Prentice, I. C., Seneviratne, S. I., and Peñuelas, J.: Drought impacts on terrestrial primary production underestimated by satellite monitoring, Nat. Geosci., 12, 264–270, 2019. a, b
Teuling, A. J., Seneviratne, S. I., Stöckli, R., Reichstein, M., Moors, E. J., Ciais, P., Luyssaert, S., van den Hurk, B., Ammann, C., Bernhofer, C., Dellwik, E., Gianelle, D., Gielen, B., Grünwald, T., Klumpp, K., Montagnani, L., Moureaux, C., Sottocornola, M., and Wohlfahrt, G.: Contrasting response of European forest and grassland energy exchange to heatwaves, Nat. Geosci., 3, 722–727, 2010. a
Tramontana, G., Jung, M., Schwalm, C. R., Ichii, K., Camps-Valls, G., Ráduly, B., Reichstein, M., Arain, M. A., Cescatti, A., Kiely, G., Merbold, L., Serrano-Ortiz, P., Sickert, S., Wolf, S., and Papale, D.: Predicting carbon dioxide and energy fluxes across global FLUXNET sites with regression algorithms, Biogeosciences, 13, 4291–4313, https://doi.org/10.5194/bg-13-4291-2016 (last access: 15 December 2020), 2016. a, b
van Heerwaarden, C. C. and Teuling, A. J.: Disentangling the response of forest and grassland energy exchange to heatwaves under idealized land–atmosphere coupling, Biogeosciences, 11, 6159–6171, https://doi.org/10.5194/bg-11-6159-2014, 2014. a
Vetter, M., Churkina, G., Jung, M., Reichstein, M., Zaehle, S., Bondeau, A., Chen, Y., Ciais, P., Feser, F., Freibauer, A., Geyer, R., Jones, C., Papale, D., Tenhunen, J., Tomelleri, E., Trusilova, K., Viovy, N., and Heimann, M.: Analyzing the causes and spatial pattern of the European 2003 carbon flux anomaly using seven models, Biogeosciences, 5, 561–583, https://doi.org/10.5194/bg-5-561-2008, 2008. a
von Buttlar, J., Zscheischler, J., Rammig, A., Sippel, S., Reichstein, M., Knohl, A., Jung, M., Menzer, O., Arain, M. A., Buchmann, N., Cescatti, A., Gianelle, D., Kiely, G., Law, B. E., Magliulo, V., Margolis, H., McCaughey, H., Merbold, L., Migliavacca, M., Montagnani, L., Oechel, W., Pavelka, M., Peichl, M., Rambal, S., Raschi, A., Scott, R. L., Vaccari, F. P., van Gorsel, E., Varlagin, A., Wohlfahrt, G., and Mahecha, M. D.: Impacts of droughts and extreme-temperature events on gross primary production and ecosystem respiration: a systematic assessment across ecosystems and climate zones, Biogeosciences, 15, 1293–1318, https://doi.org/10.5194/bg-15-1293-2018, 2018. a, b, c
Walther, S., Duveiller, G., Jung, M., Guanter, L., Cescatti, A., and Camps-Valls, G.: Satellite Observations of the Contrasting Response of Trees and Grasses to Variations in Water Availability, Geophys. Res. Lett., 46, 1429–1440, 2019. a, b, c
Wang, E., Martre, P., Zhao, Z., Ewert, F., Maiorano, A., Rötter, R. P., Kimball, B. A., Ottman, M. J., Wall, G. W., White, J. W., Reynolds, M. P., Alderman, P. D., Aggarwal, P. K., Anothai, J., Basso, B., Biernath, C., Cammarano, D., Challinor, A. J., De Sanctis, G., Doltra, J., Dumont, B., Fereres, E., Garcia-Vila, M., Gayler, S., Hoogenboom, G., Hunt, L. A., Izaurralde, R. C., Jabloun, M., Jones, C. D., Kersebaum, K. C., Koehler, A.-K., Liu, L., Müller, C., Kumar, S. N., Nendel, C., O'Leary, G., Olesen, J. E., Palosuo, T., Priesack, E., Rezaei, E. E., Ripoche, D., Ruane, A. C., Semenov, M. A., Shcherbak, I., Stöckle, C., Stratonovitch, P., Streck, T., Supit, I., Tao, F., Thorburn, P., Waha, K., Wallach, D., Wang, Z., Wolf, J., Zhu, Y., and Asseng, S.: The uncertainty of crop yield projections isreduced by improved temperature response functions, Nat. Plants, 3, 17102, https://doi.org/10.1038/nplants.2017.102, 2017. a
Wolf, S., Keenan, T. F., Fisher, J. B., Baldocchi, D. D., Desai, A. R., Richardson, A. D., Scott, R. L., Law, B. E., Litvak, M. E., Brunsell, N. A., Peters, W., and van der Laan-Luijkx, I. T.: Warm spring reduced carbon cycle impact of the 2012 US summer drought, P. Natl. Acad. Sci. USA, 113, 5880–5885, 2016. a, b, c, d, e, f
Wu, J., Kobayashi, H., Stark, S. C., Meng, R., Guan, K., Tran, N. N., Gao, S., Yang, W., Restrepo-Coupe, N., Miura, T., Oliviera, R. C., Rogers, A., Dye, D. G., Nelson, B. W., Serbin, S. P., Huete, A. R., and Saleska, S. R.: Biological processes dominate seasonality of remotely sensed canopy greenness in an Amazon evergreen forest, New Phytol., 217, 1507–1520, 2018. a
Yang, Y., Donohue, R. J., and McVicar, T. R.: Global estimation of effective plant rooting depth: Implications for hydrological modeling, Water Resour. Res., 52, 8260–8276, 2016. a
Yi, K., Dragoni, D., Phillips, R. P., Roman, D. T., and Novick, K. A.: Dynamics of stem water uptake among isohydric and anisohydric species experiencing a severe drought, Tree Physiol., 37, 1379–1392, https://doi.org/10.1093/treephys/tpw126, 2017. a
Yoshida, Y., Joiner, J., Tucker, C., Berry, J., Lee, J. E., Walker, G., Reichle, R., Koster, R., Lyapustin, A., and Wang, Y.: The 2010 Russian drought impact on satellite measurements of solar-induced chlorophyll fluorescence: Insights from modeling and comparisons with parameters derived from satellite reflectances, Remote Sens. Environ., 166, 163–177, 2015. a
Zaitchik, B. F., Macalady, A. K., Bonneau, L. R., and Smith, R. B.: Europe's 2003 heat wave: a satellite view of impacts and land-atmosphere feedbacks, Int. J. Climatol., 26, 743–769, 2006. a
Zscheischler, J. and Seneviratne, S. I.: Dependence of drivers affects risks associated with compound events, Science Advances, 3, e1700263, https://doi.org/10.1126/sciadv.1700263, 2017. a
Zscheischler, J., Mahecha, M. D., Harmeling, S., and Reichstein, M.: Detection and attribution of large spatiotemporal extreme events in Earth observation data, Ecol. Inform., 15, 66–73, 2013. a, b
Zscheischler, J., Westra, S., Hurk, B. J. J. M., Seneviratne, S. I., Ward, P. J., Pitman, A., AghaKouchak, A., Bresch, D. N., Leonard, M., Wahl, T., and Zhang, X.: Future climate risk from compound events, Nat. Clim. Change, 8, 469–477, 2018. a