the Creative Commons Attribution 4.0 License.
the Creative Commons Attribution 4.0 License.
 | 01 Jul 2021
Development of global temperature and pH calibrations based on bacterial 3-hydroxy fatty acids in soils
Pierre Véquaud
Sylvie Derenne
Alexandre Thibault
Christelle Anquetil
Giuliano Bonanomi
Sylvie Collin
Sergio Contreras
Andrew T. Nottingham
Pierre Sabatier
Norma Salinas
Wesley P. Scott
Josef P. Werne
Arnaud Huguet
Gram-negative bacteria produce specific membrane lipids, i.e. 3-hydroxy fatty acids with 10 to 18 C atoms. They have been recently proposed as temperature and pH proxies in terrestrial settings. Nevertheless, the existing correlations between pH or temperature and indices derived from 3-OH FA distribution are based on a small soil dataset (ca. 70 samples) and only applicable regionally. The aim of this study was to investigate the applicability of 3-OH FAs as mean annual air temperature (MAAT) and pH proxies at the global level. This was achieved using an extended soil dataset of 168 topsoils distributed worldwide, covering a wide range of temperatures (5 to 30 ∘C) and pH (3 to 8). The response of 3-OH FAs to temperature and pH was compared to that of established branched glycerol dialkyl glycerol tetraether (GDGT)-based proxies (MBT'5Me/CBT). Strong linear relationships between 3-OH-FA-derived indices (RAN15, RAN17 and RIAN) and MAAT or pH could only be obtained locally for some of the individual transects. This suggests that these indices cannot be used as palaeoproxies at the global scale using simple linear regression models, in contrast with the MBT'5Me and CBT. However, strong global correlations between 3-OH FA relative abundances and MAAT or pH were shown by using other algorithms (multiple linear regression, k-NN and random forest models). The applicability of the three aforementioned models for palaeotemperature reconstruction was tested and compared with the MAAT record from a Chinese speleothem. The calibration based on the random forest model appeared to be the most robust. It generally showed similar trends with previously available records and highlighted known climatic events poorly visible when using local 3-OH FA calibrations. Altogether, these results demonstrate the potential of 3-OH FAs as palaeoproxies in terrestrial settings.
- Article
(1592 KB) - Full-text XML
-
Supplement
(931 KB) - BibTeX
- EndNote


Investigating past climate variations is essential to understand and predict future environmental changes, especially in the context of global anthropogenic change. Direct records of environmental parameters are available for the last decades, the so-called “instrumental” period. Beyond this period, proxies can be used to obtain indirect information on environmental parameters. A major challenge is to develop reliable proxies which can be applied to continental environments in addition to marine ones. Indeed, available proxies have been mainly developed and used in marine settings as the composition and mechanism of formation of marine sedimentary cores are less complex than in continental settings, which are highly heterogeneous. Several environmental proxies based on organic (e.g. the alkenone unsaturation index (U; Brassell et al., 1986) and inorganic ( ratio and ratio of foraminifera; Emiliani, 1955; Erez and Luz, 1983) fossil remains were notably developed for the reconstruction of sea surface temperatures.
Some of the existing proxies are based on membrane lipids synthesized by certain microorganisms (Eglinton and Eglinton, 2008; Schouten et al., 2013). These microorganisms are able to adjust the composition of their membrane lipids in response to the prevailing environmental conditions in order to maintain an appropriate fluidity and to ensure the optimal state of the cellular membrane (Singer and Nicolson, 1972; Sinensky, 1974; Hazel and Williams, 1990; Denich et al., 2003). The structure of glycerol dialkyl glycerol tetraethers (GDGTs), which are membrane lipids biosynthesized by archaea and some bacteria, is especially known to be related to environmental conditions. Archaeal GDGTs are constituted of isoprenoid alkyl chains ether-linked to glycerol, whereas bacterial GDGTs are characterized by branched alkyl chains instead of isoprenoid ones. The latter compounds are ubiquitous in terrestrial (Weijers et al., 2007; Peterse et al., 2012; De Jonge et al., 2014; Naafs et al., 2017) and aquatic environments (Peterse et al., 2009; Tierney and Russell, 2009; Sinninghe Damsté et al., 2009; Loomis et al., 2012; Peterse et al., 2015; Weber et al., 2015). These branched GDGTs (brGDGTs) are produced by still unidentified bacteria, although some of them may belong to the phylum Acidobacteria (Sinninghe Damsté et al., 2011, 2014, 2018). The analysis of brGDGTs in a large number of soils distributed worldwide showed that the relative distribution of these compounds is mainly related to mean annual air temperature (MAAT) and soil pH (Weijers et al., 2007; Peterse et al., 2012; De Jonge et al., 2014). Even though brGDGT proxies were largely investigated over the last 10 years (De Jonge et al., 2014; Dearing Crampton-Flood et al., 2020) and were applied to various palaeorecords (e.g, Coffinet et al., 2018; Wang et al., 2020), new molecular proxies, independent of and complementary to brGDGTs, are needed to improve the reliability of temperature reconstructions in terrestrial settings.
Recent studies have unveiled the potential of another family of bacterial lipids – 3-hydroxy fatty acids (3-OH FAs) – for temperature and pH reconstructions in terrestrial (Wang et al., 2016, 2018; Huguet et al., 2019) and marine (Yang et al., 2020) settings; 3-OH FAs with 10 to 18 carbon atoms are specifically produced by Gram-negative bacteria and are bound to the lipopolysaccharide (LPS) by ester or amide bonds (Wollenweber et al., 1982; Wollenweber and Rietschel, 1990). Three types of 3-OH FAs can be distinguished with either normal chains or branched chains, iso or anteiso.
The analysis of 3-OH FAs in soils showed that the ratio of C15 or C17 anteiso 3-OH FA to normal C15 or C17 3-OH FA (RAN15 and RAN17 indices, respectively) were negatively correlated with MAAT along the three mountains investigated so far: Mt. Shennongjia (China; Wang et al., 2016), Mt. Rungwe and Mt. Majella (Tanzania and Italy, respectively; Huguet et al., 2019). This suggests that Gram-negative bacteria producing these fatty acids respond to colder temperatures with an increase in anteiso- vs. n- 3-OH FAs in order to maintain a proper fluidity and optimal state of the bacterial membrane, the so-called homeoviscous adaptation mechanism (Sinensky, 1974; Hazel and Eugene Williams, 1990). Nevertheless, the relationships between RAN15 and MAAT along the three mountain transects showed the same slopes but different intercepts (Wang et al., 2016; Huguet et al., 2019), suggesting that regional or local RAN15 relations may be more appropriate to apply for temperature reconstructions in terrestrial settings. In contrast, a significant calibration between RAN17 and MAAT could be established using combined data from the three mountain regions (Wang et al., 2016; Huguet et al., 2019).
Another index, defined as the cologarithm of the sum of anteiso and iso 3-OH FAs divided by the sum of normal homologues (RIAN index), was shown to be strongly negatively correlated with soil pH along the three aforementioned mountains (Wang et al., 2016; Huguet et al., 2020), reflecting a general relative increase in normal homologues compared to branched (iso and anteiso) ones with increasing pH. This mechanism was suggested to reduce the permeability and fluidity of the membrane for the cell to cope with lower pH (Russell et al., 1995; Denich et al., 2003; Beales, 2004).
For the first time, 3-OH FA indices were recently applied to the reconstruction of the temperature and hydrological changes over the last 10 000 years in a speleothem from China (Wang et al., 2018), showing the potential of 3-OH FAs as independent tools for environmental reconstruction in terrestrial settings. A very recent study based on marine sediments from the North Pacific Ocean suggested that the distribution of 3-OH FAs could also be used to reconstruct sea surface temperature (Yang et al., 2020).
Even though these results are promising, the linear regressions between pH or MAAT and 3-OH FA indices in terrestrial environments are still based on a rather small dataset (ca. 70 soil samples; Wang et al., 2016; Huguet et al., 2019). The aim of this study was to investigate the applicability of 3-OH FAs as MAAT and pH proxies at the global level using an extended soil dataset and refined statistical tools. The 3-OH FA distribution from 54 soils was determined in four globally distributed altitudinal transects (Tibet, Italy, the Peruvian Andes and Chile) and was combined with data previously published by Wang et al. (2016; Mt. Shennongjia, China), Huguet et al. (2019; Mt. Rungwe, Tanzania, and Mt. Majella, Italy) and Véquaud et al. (2021; Mt. Bauges and Mt. Lautaret-Galibier, France), leading to a total of 168 samples. In addition to linear regressions, non-parametric machine learning models were used to improve the global relationships between 3-OH FA distribution and MAAT or pH. These models present the advantage of taking into account non-linear environmental influences, in line with the intrinsic complexity of the environmental settings. Finally, these new models were tested and compared by applying them to a speleothem archive (Wang et al., 2018) representing to date the only available MAAT record derived from 3-OH FA proxies in a continental setting. As brGDGTs are the only microbial organic proxies which can be used for temperature and pH reconstructions in terrestrial settings so far, they can serve as a reference proxy to understand the temperature and pH dependency of 3-OH FAs analysed in the same dataset. The 3-OH FAs and brGDGTs have thus been concomitantly analysed to assess their reliability and complementarity as independent temperature and pH proxies.
2.1 Soil dataset
2.1.1 Study sites
The dataset of the present study is comprised of the globally distributed surface soils previously analysed for brGDGTs and 3-OH FAs and collected along four altitudinal transects: Mt. Shennongjia (China; Yang et al., 2015; Wang et al., 2016), Mt. Rungwe (Tanzania; Coffinet et al., 2017; Huguet et al., 2019), Mt. Majella (Italy; Huguet et al., 2019) and Mt. Bauges and Mt. Lautaret-Balibier (France; Véquaud et al., 2021). This set was extended with surficial soils (0–10 cm) from four additional altitudinal transects described below, located in Italy, Tibet, Peru and Chile (Table 1).
Table 1List of the soil samples collected along Mt. Shegyla, Mt. Pollino, the Peruvian Andes and the Chilean Andes, with corresponding altitude (m), MAAT (∘C), pH, and 3-OH-FA- and brGDGT-derived indices.
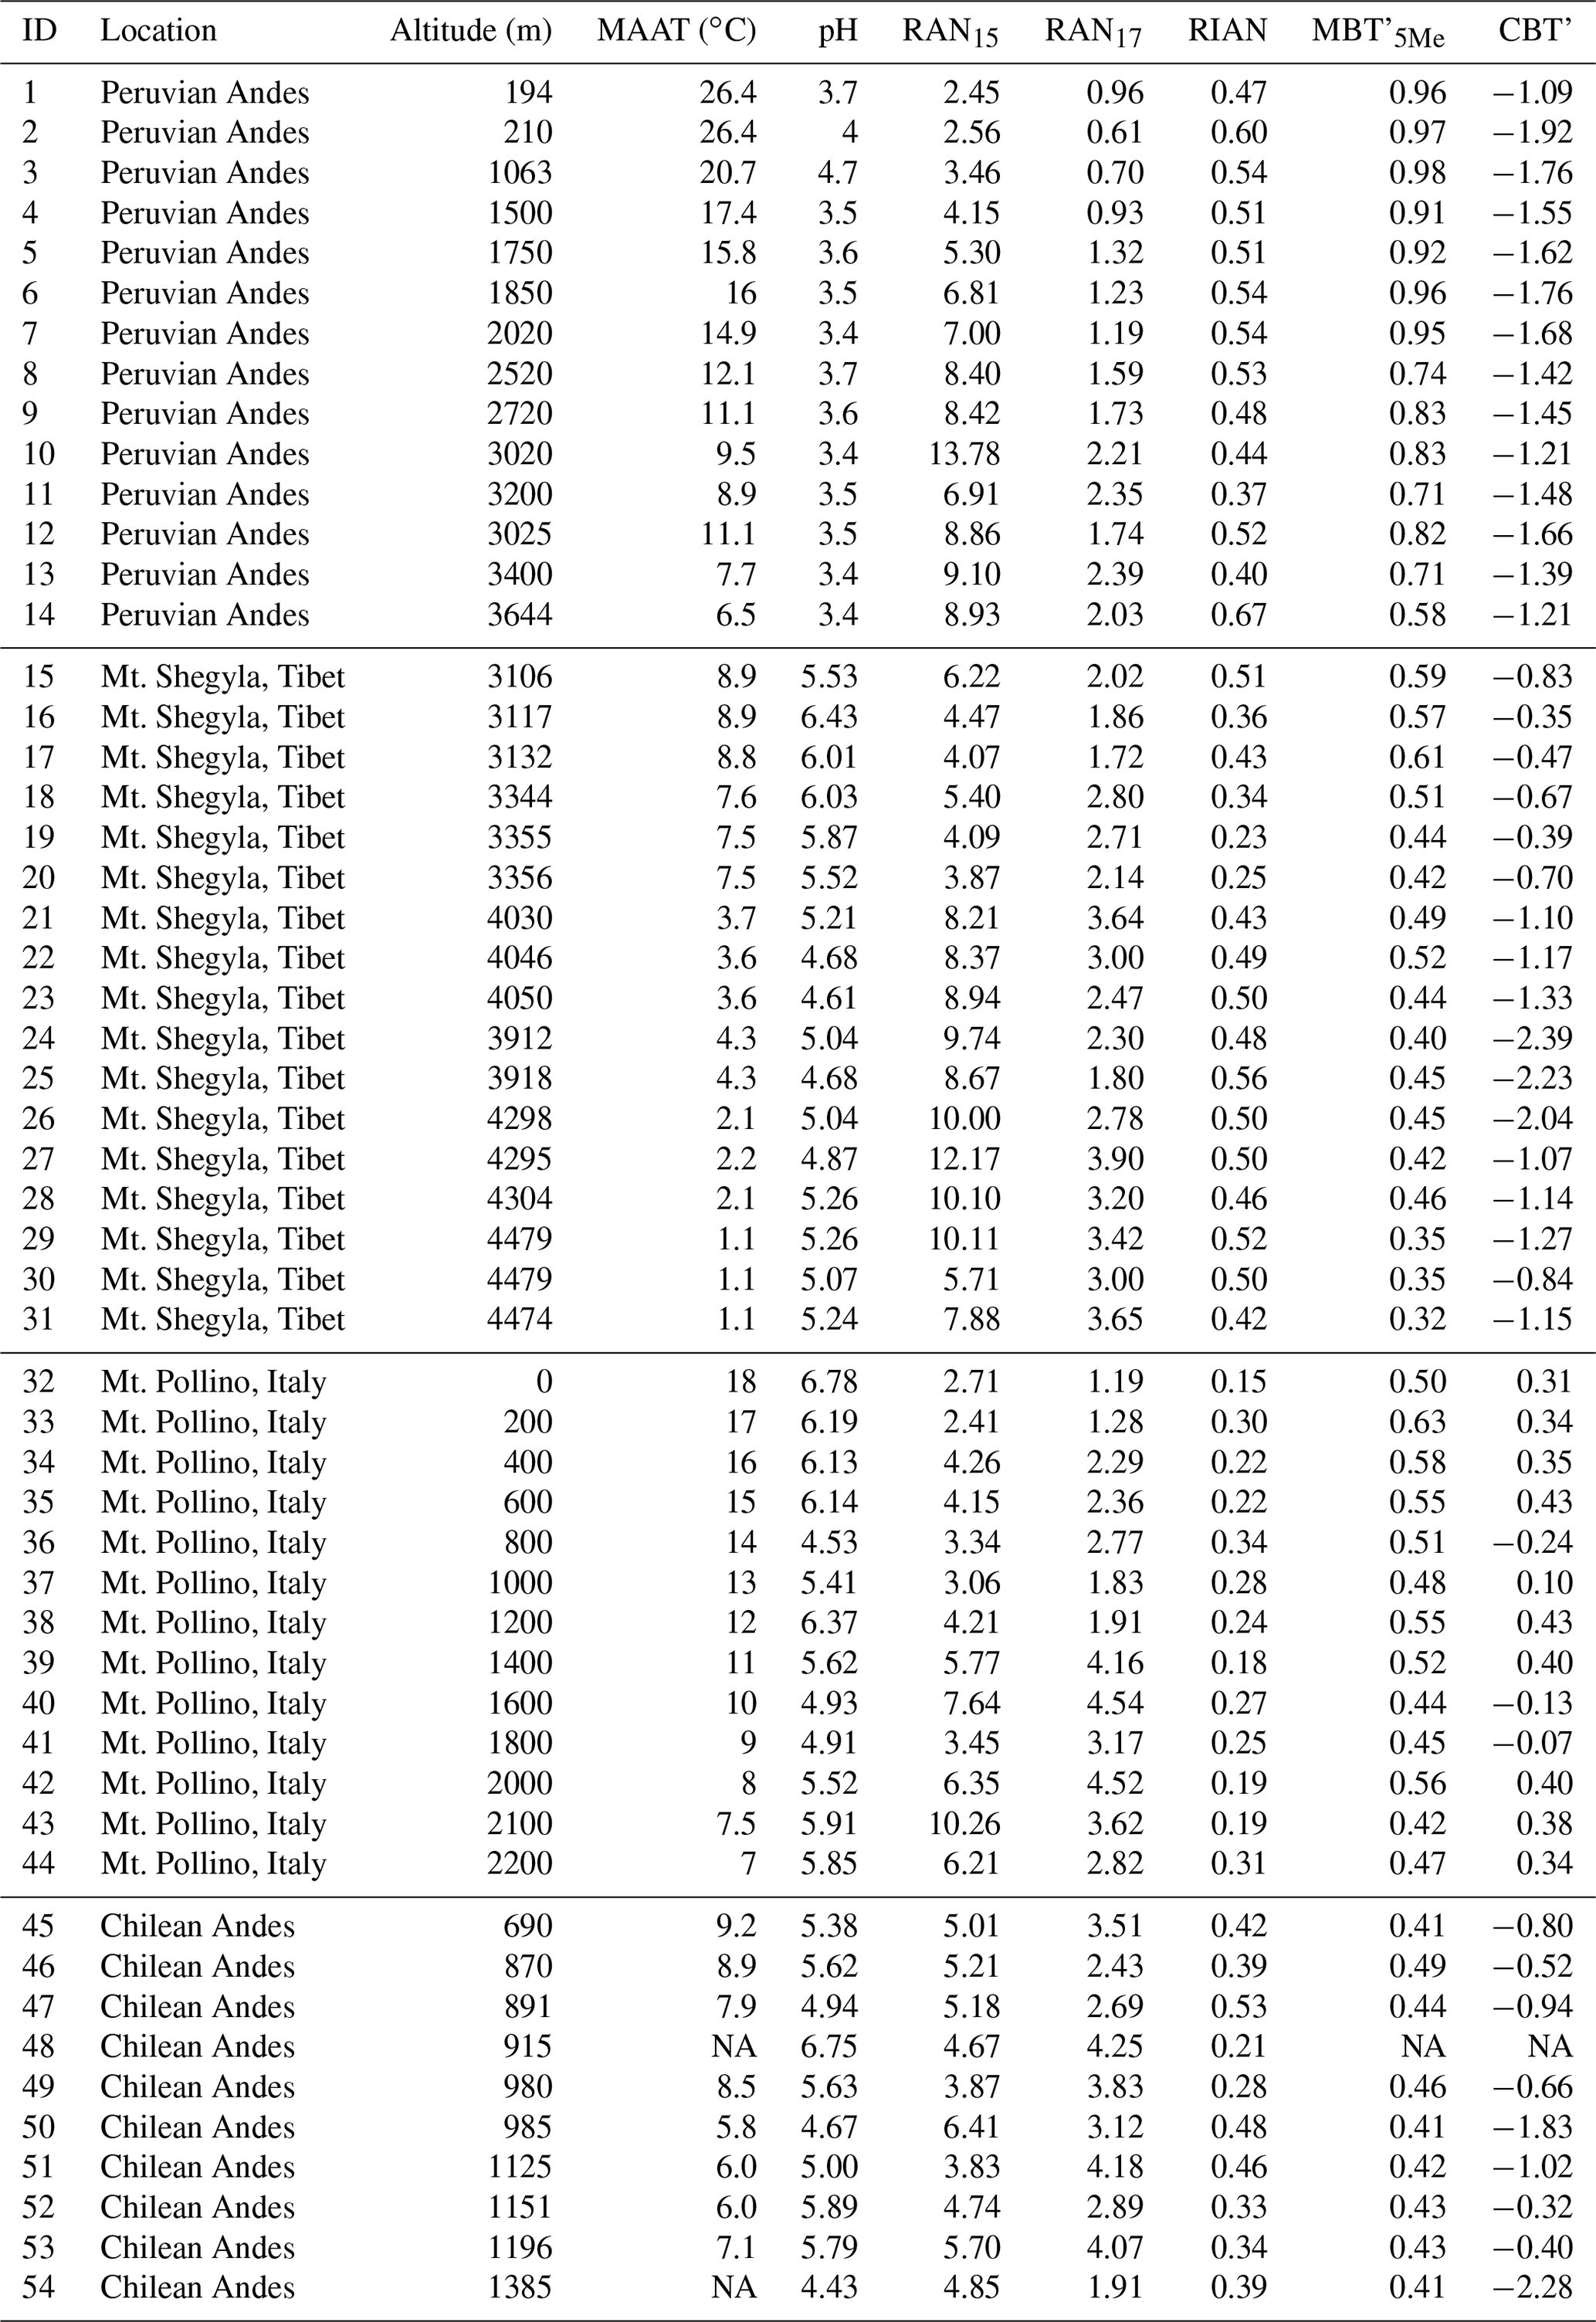
Soil samples were collected from 13 sites along Mount Pollino in the Calabria region (Italy) between 0 and 2200 m a.s.l. (above sea level) (Table 1). Mt. Pollino is located in the calcareous Apennine range and is 2248 m a.s.l. It is framed to the north-west by the Sierra de Prete (2181 m high) and to the south by the Pollino Abyss. The alpine to subalpine area (above 2100 m a.s.l.) is characterized by the presence of Mediterranean grasslands (Festuca bosniaca, Carex kitaibeliana) and the presence of sinkholes (Todaro et al., 2007; Scalercio et al., 2014). The mountainous vegetation (over 1200 m a.s.l.) is dominated by Fagus sylvatica forests and, at the treeline, by scattered Pinus leucodermis (Bonanomi et al., 2020). The soil is poorly developed and dominated by calcareous soils. Between 0 and 1200 m a.s.l. (Scalercio et al., 2014, and reference therein), Mt. Pollino is characterized by the presence of Quercus ilex forests or shrubs. Climate along this mountain is humid Mediterranean, with high summer temperatures and an irregular distribution of rainfall throughout the year with pronounced summer drought (39.5 % in winter, 23.7 % in spring, 29.2 % in autumn, 7.6 % in summer; average annual precipitation: 1570 mm; see Todaro et al., 2007). MAAT is comprised between 7 ∘C (2200 m a.s.l.) and 18 ∘C (0 m a.s.l.; Scalercio et al., 2014). MAAT along Mt. Pollino was estimated using a linear regression between two MAATs (16 ∘C at 400 m a.s.l. and 10 ∘C at 1600 m a.s.l.) from the meteorological data (Castrovillari station) recorded by Scalercio et al. (2014). The pH of the soils analysed in the present study ranges between 4.5 and 6.8 (Table 1).
Soil samples were collected from 17 sites along Mount Shegyla between 3106 and 4474 m a.s.l. (south-eastern Tibet, China), as previously described by Wang et al. (2015). Different climatic zonations are observed along this high-altitude site (2700 to 4500 m a.s.l.): (i) a mountainous temperate zone between 2700 and 3400 m, (ii) a subalpine cold temperate zone between 3400 and 4300 m, and (iii) a cold alpine zone above 4300 m. Plant species such as brown oak (Q. semecarpifolia) or common fir (Abies alba) are abundant within the mountainous and subalpine levels. In the cold subalpine zone, the forrest's fir (Abies georgei var. smithii) is endemic to western China. In the cold alpine zone, coniferous species (Sabina saltuaria) as well as species typical of mountainous regions such as Rhododendron are observed. MAAT was estimated using a linear regression between seven measured MAATs from the data recorded by Wang et al. (2015). The average MAAT along the transect is 4.6 ∘C, with a minimum of 1.1 ∘C at ca. 4500 m a.s.l. and a maximum of 8.9 ∘C at ca. 3100 m a.s.l. (Table 1). Soil pH ranges between 4.6 and 6.4 (Table 1).
Soils were sampled from 14 sites in the Peruvian Andes along the Kosñipata transect, located in south-eastern Peru, in the upper part of the Madre de Dios and Madeira watershed, east of the Andes Cordillera (Nottingham et al., 2015). This transect (190 m to 3700 m a.s.l.) is well documented and is the object of numerous ecological studies (Malhi et al., 2010; Nottingham et al., 2015). There is a shift in vegetation zonation with increasing elevation, from tropical lowland forest to montane cloud forest and high-elevation “Puna” grassland. The treeline lies between 3200 and 3600 m a.s.l. For the 14 sites sampled in this study, the lower 13 sites are forest, and the highest site is grassland. The 14 sites are part of a network of 1 ha forest plots (Nottingham et al., 2015); for each 1 ha plot, 0–10 cm surface soil was sampled from five systematically distributed locations within each 1 ha plot. Mean annual precipitation does not vary significantly with altitude (mean = 2448 mm yr−1, SD = 503 mm yr−1; Rapp and Silman, 2012; Nottingham et al., 2015). MAAT is comprised between 26.4 ∘C at 194 m altitude and 6.5 ∘C at 3644 m altitude (Table 1). The pH is characteristic of acidic soils (3.4–4.7; Table 1). Further information on these sites and soils is available in Nottingham et al. (2015).
Soil samples were collected from 10 sites between 690 m and 1385 m a.s.l. from the lake shore (20 to 50 m offshore) of 10 Andean lakes located in Chile (38–39∘ S) within the temperate forest (Table 1). High-frequency measurements of MAAT over a period of 1 year are available for the different sampling sites. MAAT is comprised between 5.75 and 9.2 ∘C. Soil pH ranges between 4.4 and 6.8 (Table 1).
2.1.2 pH measurement
Following sampling, soils were immediately transported to the laboratory and stored at −20 ∘C. Soil samples from the Peruvian Andes, Mt. Pollino and Mt. Shegyla were then freeze-dried, ground and sieved at 2 mm. The pH of the freeze-dried samples was measured in ultrapure water with a 1:2.5 soil–water ratio. Typically, 10 mL of ultrapure water were added to 4 g of dry soil. The soil solution was stirred for 30 min before decantation for one hand pH measurement (Carter et al., 2007).
2.2 Lipid analyses
The brGDGTs and 3-OH FAs were analysed in all samples from the Peruvian Andes, Chilean Andes, Mt. Pollino and Mt. Shegyla.
2.2.1 3-OH FA analysis
Sample preparation for 3-OH FA analysis was identical to that reported by Huguet et al. (2019) and Véquaud et al. (2021). Soil samples were subjected to acid hydrolysis (3 M HCl) and extracted with organic solvents. This organic fraction was then rotary-evaporated, methylated in a 1 M HCl–MeOH solution at 80 ∘C for 1 h and separated into three fractions over an activated silica column: (i) 30 mL of heptane : EtOAc (98:2), (ii) 30 mL of EtOAc and (iii) 30 mL of MeOH. The 3-OH FAs contained in the second fraction were derivatized at 70 ∘C for 30 min with a solution of N,O- bis(trimethylsilyl)trifluoroacetamide (BSTFA) – trimethylchlorosilane (TMCS) 99:1 (Grace Davison Discovery Science, USA) before gas chromatography–mass spectrometry (GC–MS) analysis.
We analysed 3-OH FAs with an Agilent 6890N GC-5973N using a Restek RXI-5 Sil MS silica column (60 m × 0.25 mm, 0.25 µm inner diameter film thickness), as previously described (Huguet et al., 2019). The 3-OH FAs were quantified by integrating the appropriate peak on the ion chromatogram and comparing the area with an internal standard (3-hydroxytetradecanoic acid, 2,2,3,4,4-d5; Sigma-Aldrich, France). The internal standard (0.5 mg/mL) was added just before injection as a proportion of 3 µL of standard to 100 µL of sample, as detailed by Huguet et al. (2019). The different 3-OH FAs were identified based on their retention time after extraction of the characteristic 175 fragment ( 178 for the deuterated internal standard; cf. Huguet et al., 2019).
The RIAN index was calculated as follows (Wang et al., 2016; Eq. 1) in the range C10–C18:
where I, A and N represent the sum of all iso, anteiso and normal 3-OH FAs, respectively.
RAN15 and RAN17 indices are defined as follows (Wang et al., 2016; Eqs. 2 and 3):
Analytical errors associated with the calculation of RIAN, RAN15 and RAN17 indices are respectively 0.006, 0.3 and 0.2 based on the analysis of one sample injected nine times during the analysis and five samples injected in triplicate.
2.2.2 brGDGT analysis
Sample preparation for brGDGT analysis was similar to that reported by Coffinet et al. (2014). Briefly, ca. 5–10 g of soil was extracted using an accelerated solvent extractor (ASE 100, Thermo Scientific Dionex, USA) with a dichloromethane (DCM)–methanol (MeOH) mixture (9:1) for 3×5 min at 100 ∘C at a pressure of 100 bars in 34 mL cells. The total lipid extract was rotary-evaporated and separated into two fractions of increasing polarity on a column of activated alumina: (i) 30 mL of heptane : DCM (9:1, v:v); (ii) 30 mL of DCM : MeOH (1:1, v:v). GDGTs are contained in the second fraction, which was rotary evaporated. An aliquot (300 µL) was re-dissolved in heptane and centrifuged using an Eppendorf MiniSpin centrifuge (Eppendorf AG, Hamburg, Germany) at 7000 rpm for 1 min.
GDGTs were then analysed by high-pressure liquid chromatography coupled with mass spectrometry with an atmospheric pressure chemical ionization source (HPLC–APCI-MS) using a Shimadzu LCMS 2020. GDGT analysis was performed using two Hypersil GOLD silica columns in tandem (150 mm × 2.1 mm, 1.9 µm; Thermo Finnigan, USA), thermally controlled at 40 ∘C, as described by Huguet et al. (2019). This methodology enables the separation of 5- and 6-methyl brGDGTs. Semi-quantification of brGDGTs was performed by comparing the integrated signal of the respective compound with the signal of a C46 synthesized internal standard (Huguet et al., 2006) assuming their response factors to be identical.
The MBT'5Me index, reflecting the average number of methyl groups in 5-methyl isomers of GDGTs and considered to be related to MAAT, was calculated according to De Jonge et al. (2014; Eq. 4):
The CBT' index, reflecting the average number of cyclopentyl rings in GDGTs and considered to be related to pH, was calculated as follows (De Jonge et al., 2014; Eq. 5):
The Roman numerals correspond to the different GDGT structures presented in De Jonge et al. (2014). The 6-methyl brGDGTs are denoted by an apostrophe after the Roman numerals for their corresponding 5-methyl isomers. Analytical errors associated with the calculation of MBT'5Me and CBT' indices are 0.015 and 0.02, respectively, based on the analysis of three samples in triplicate among the 44 soil samples.
2.3 Statistical analysis
In order to investigate the correlations between environmental variables (pH, MAAT) and the relative abundances of bacterial lipids (brGDGTs and 3-OH FAs) or the indices based on these compounds, pairwise correlation matrices were performed in addition to single or multiple linear regressions. As the dataset is not normally distributed, Spearman correlation was used with a confidence level of 5 %.
Principal component analyses (PCAs) were performed on the different soil samples to statistically compare the 3-OH FA and brGDGT distributions along the different altitudinal transects. The fractional abundances of the bacterial lipids (3-OH FAs and brGDGTs) were used for these PCAs, with MAAT, pH and location of the sampling site representing supplementary variables (i.e. not influencing the principal components of the analysis).
Independent models should be used for the development of environmental calibrations as each of them has its own advantages and limits. Linear regression methods are simple to use, but many of them suffer from the phenomenon of regression dilution, as previously noted (Naafs et al., 2017; Dearing Crampton-Flood et al., 2020). That is why other models than ordinary least squares or single or multiple regression were also proposed in this study (cf. Sect. 4.2. for discussion of the models): the k-nearest neighbour (k-NN) and random forest models. These models are based on machine learning algorithms, which are built on a proportion of the total dataset (randomly defined, i.e. training dataset) and then tested on the rest of the dataset, considered to be independent (test dataset).
The k-NN model is based on the estimation of the mean distances between the different samples. This is a supervised learning method (e.g. Gangopadhyay et al., 2009). A training database composed of N “input–output” pairs is initially constituted to estimate the output associated with a new input x. The method of the k-nearest neighbours takes into account the k training samples whose input is the closest to the new input x, according to a distance to be defined. This method is non-parametric and is used for classification and regression. In k-NN regression, the result is the value for this object, which is the average of the values of the k-nearest neighbours. Its constraints lie in the fact that, by definition, if a range of values is more frequent than the others, then it will be statistically predominant among the k closest neighbours. To overcome this limitation of the k-NN method, data selection was performed randomly on the dataset with a stratification modality according to the MAAT or the pH. This approach allows the limitation of the impact of extreme values as detailed below.
The random forest algorithm is also a supervised learning method used, among other things, for regressions (e.g. Ho, 1995; Breiman, 2001; Denisko and Hoffman, 2018). This model works by constructing a multitude of decision trees at training time and producing the mean prediction of the individual trees. Decision tree learning is one of the predictive modelling approaches used to move from observations to conclusions about the target value of an item. Decision trees where variables are continuous values are called regression trees.
The training phase required for the random forests, k-NN and multiple linear regression was performed on 75 % of the sample set with an iteration of 10 cross-validations per model. Data selection was performed randomly on the dataset (with no pre-processing of the individual 3-OH FAs) but with a stratification modality according to the MAAT or the pH to limit the impact of extreme values on the different models used. Then, the robustness and precision of the different models were tested on the remaining 25 % of samples, considered to be an independent dataset. Simple and multiple linear regressions, PCA, k-NN and random forest models were performed with R software, version 3.6.1 (R Core Team, 2014), using the packages tidymodels (version 0.1.0), kknn (version 1.3.1) and ranger (version 0.11.2). A web application is available online (https://athibault.shinyapps.io/paleotools, last access: 12 April 2021) for the reconstruction of 3-OH FA-derived MAAT using the machine learning models proposed in the present study.
3.1 Distribution of bacterial lipids
3.1.1 3-OH FAs
Representing 8 elevation transects and 168 samples, 3-OH FAs were identified in the whole dataset (Supplement Table S1; Yang et al., 2015; Wang et al., 2016; Coffinet et al., 2017; Huguet et al., 2019; Véquaud et al., 2021). Their chain lengths range between 8 and 26 C atoms, indicating that these compounds have various origins (bacteria, plants and fungi; (Zelles, 1999; Wang et al., 2016, and reference therein). The homologues of 3-OH FAs with 10 to 18 C atoms are considered to be produced exclusively by Gram-negative bacteria (Wollenweber and Rietschel, 1990; Szponar et al., 2003) and will be the only ones considered in the following. Compounds with an even carbon number and normal chains were the most abundant 3-OH FAs in all samples (mean = 67.9 % of the total 3-OH FAs, standard deviation (SD) = 6.8 %), with a predominance of the n-C14 homologue (21.9 %, SD = 3.23 %; Fig. 1). Iso (mean = 22.9 %, SD = 5.01 %) and anteiso (mean = 6.33 %, SD = 1.79 %) isomers were also present. It must be noted that anteiso isomers were only detected for odd carbon-numbered 3-OH FAs (Yang et al., 2015; Wang et al., 2016; Coffinet et al., 2017; Huguet et al., 2019).

Figure 1Average distribution of 3-OH FAs along the eight altitudinal transects investigated in this study. Data from Mt. Majella and Mt. Rungwe were taken from Huguet et al. (2019). Data from Mt. Shennongjia were taken from Wang et al. (2016). Data from Mt. Bauges and Mt. Lautaret-Galibier were taken from Véquaud et al. (2021).
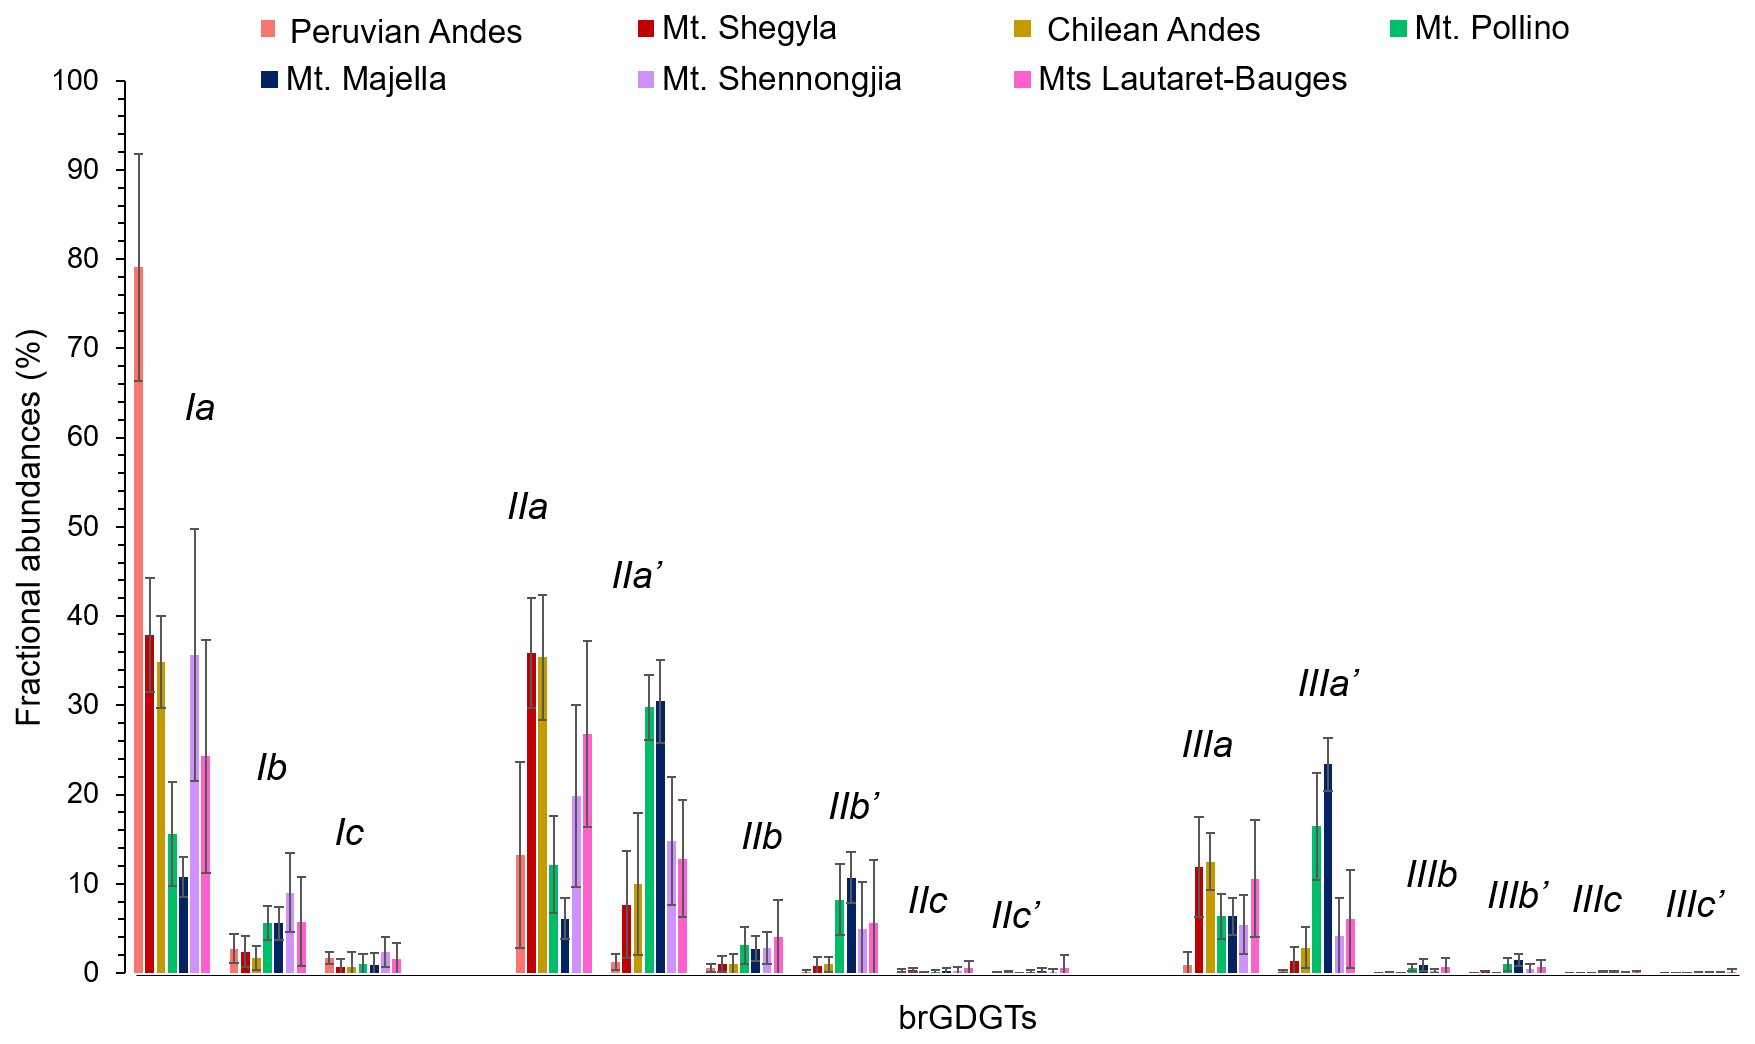
Figure 2Average distribution of 5- and 6-methyl brGDGTs, along Mt. Shegyla, Mt. Pollino Majella, Lautaret-Bauges, the Peruvian Andes and the Chilean Andes. Data from Mt. Majella were taken from Huguet et al. (2019). Data from Mt. Shennongjia were taken from Yang et al. (2015). Data from Mt. Bauges and Mt. Lautaret-Galibier were taken from Véquaud et al. (2021).
The distribution of 3-OH FAs in the soils of the different altitudinal transects did not show a large variability (Fig. 1). Thus, there was no major difference in the relative abundances of most of the 3-OH FAs (i-C11, a-C11, n-C11, i-C12, a-C13, n-C13, i-C14, n-C15, i-C16, a-C17 and n-C17) between the eight study sites, even though slight differences could be observed for some compounds as detailed below. For example, the Peruvian samples were characterized by higher average proportions of n-C18 3-OH FA and lower contribution of the n-C10 and n-C12 homologues than those from the other transects. Soils from Mt. Shegyla were characterized by lower average proportions of n-C14 3-OH FAs and higher abundances of i-C17 compounds compared to the other transects (Fig. 1).
3.1.2 brGDGTs
The relative abundances of brGDGTs were compared between the same transects as for 3-OH FAs, representing a total of 168 samples. The 5- and 6-methyl isomers were separated in most of the samples (Fig. 2, Table S2), except in older dataset, i.e. soils from Mt. Rungwe (Coffinet et al., 2014, 2017). The brGDGT data from Mt. Rungwe will not be further considered in this study.
The brGDGT distribution was dominated by acyclic compounds (Ia, IIa, IIa', IIIa, IIIa') which represent on average ca. 83.4 % of total brGDGTs (SD = 14.5 %; Fig. 2). The tetramethylated (Ia-c; mean = 39.3 %, SD of 20.5 %) and the pentamethylated (IIa–c; 44.8 %, SD = 12.8 %) brGDGTs were predominant over the hexamethylated ones (IIIa–c; Fig. 2). The 5-methyl isomers were on average present in a higher proportion (mean = 71.9 %, SD = 23.4 %) than the 6-methyl compounds (Fig. 2).
High variability in the brGDGT distribution was observed among the different transects. The relative abundance of brGDGT Ia was much higher in the Peruvian soils (mean = 83 %, SD = 12.6 %) than in the other transects (mean between 17.3 % and 61.7 %; Fig. 2). The 5-methyl isomers were more abundant than the 6-methyl isomers for all sites except for Mt. Pollino (mean 5-methyl = 44 %, SD = 11.7 %) and Mt. Majella (mean 5-methyl = 33.7 %, SD = 5.5 %; Fig. 2).
3.2 3-OH-FA- and brGDGT-derived indices
3.2.1 3-OH FAs
The RIAN index varied between 0.1 and 0.8 among the eight elevation transects (Table 1). The RIAN index ranged from 0.37 to 0.67 for the Peruvian Andes, 0.23 to 0.56 for Mt. Shegyla, 0.15 to 0.34 for Mt. Pollino, 0.21 to 0.53 for the Chilean Andes, 0.26 to 0.80 for Mt. Rungwe (Huguet et al., 2019), 0.16 to 0.46 for Mt. Majella (Huguet et al., 2019), 0.20 to 0.69 for Mt. Shennongjia (Wang et al., 2016) and 0.13 to 0.56 for the French Alps (Véquaud et al., 2021).
The RAN15 varied greatly among the different sites (Table 1). It was in the same range along Mt. Rungwe (1.04-5.73) and Mt. Majella (0.68–6.43; Huguet et al., 2019). In contrast, its upper limit was higher for Mt. Shennongjia (0.68–10.18; Wang et al., 2016), Mt. Shegyla (4.07–12.17), Mt. Pollino (2.41–10.26), the Peruvian Andes (2.45–13.77) and the French Alps (1.44–12.26). The range of variation in RAN15 was narrower for the Chilean Andes (3.82–6.40).
The RAN17 values were similar among the different altitudinal transects (Table 1), ranging from 1.72 to 3.90 along Mt. Shegyla, 0.73 to 4.75 along Mt. Majella (Huguet et al., 2019), 1.19 to 4.54 along Mt. Pollino, 1.91 to 4.25 for the Chilean Andes and 1.12 to 3.57 along Mt. Shennongjia (Wang et al., 2016). The range of RAN17 values was narrower for Mt. Rungwe (0.33–1.62; Huguet et al., 2019) and the Peruvian Andes (0.61–2.39) and wider for the French Alps (0.89–6.42; Véquaud et al., 2021) compared to the other sites.
3.2.2 brGDGTs
The range of variation in the MBT'5Me index was homogeneous along most transects (0.32–0.63; Table 1), except the Peruvian Andes, with higher values (0.58–0.98; Table 1). Regarding the CBT' index, it showed similar ranges along the Chilean Andes (−2.28 to −0.32) and Mt. Shegyla (−2.39 to −0.35; Table 1). This index showed different ranges of variations along the other altitudinal transects, Mt. Shennongjia (−1.18 to 0.50; Yang et al., 2015), Mt. Pollino (−0.24 to 0.43) and the Peruvian Andes (−1.91 to −1.09). Finally, the CBT' values varied within a narrow range along Mt. Majella (0.23–0.59; Huguet et al., 2019) and within a wide range along the French Alps (−2.29 to 0.52; Véquaud et al., 2021).
3.3 Principal component analysis and clustering of 3-OH FA and brGDGT distribution
Principal component analyses were performed to refine the comparison of bacterial lipid distribution (3-OH FAs and brGDGTs) among the different altitudinal transects.
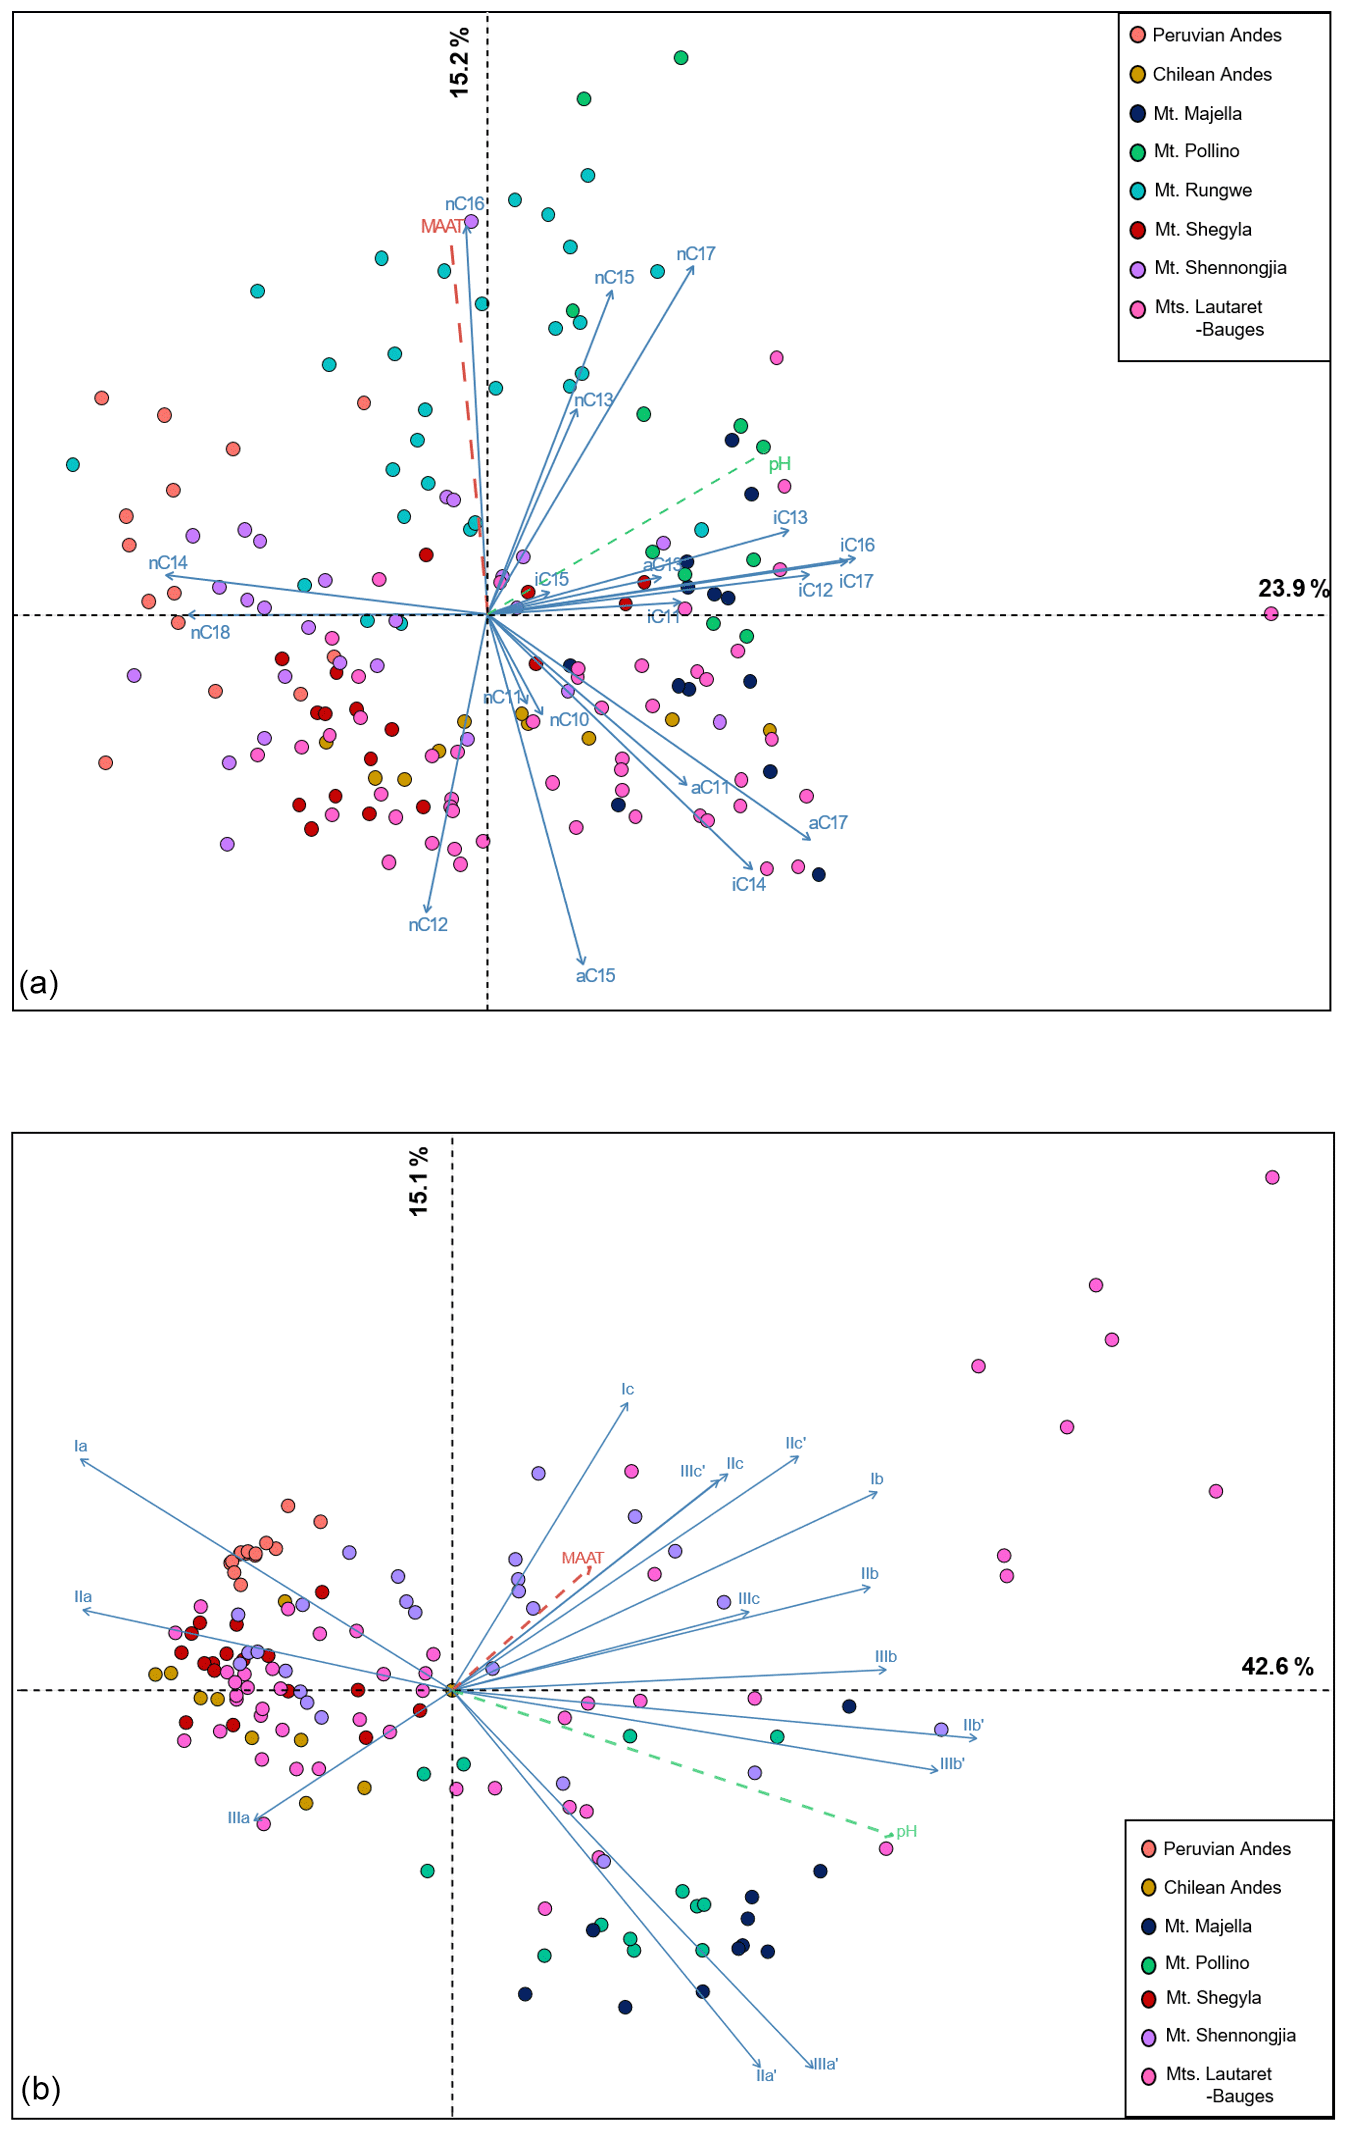
Figure 3PCA biplot of (a) 3-OH FA fractional abundances in soil samples from the eight altitudinal transects and (b) brGDGT fractional abundances in soil samples from seven of the eight altitudinal transects. The brGDGT data from Mt. Rungwe, for which 5- and 6-methyl isomers were not separated, were not included in the PCA.
3.3.1 3-OH FAs
The first two axes of the 3-OH FA PCA explained 39.1 % of the total variance in the dataset (Fig. 3a). Dimension 1 (23.9 %) opposed samples from Mt. Pollino in the right quadrant to Peruvian soils and samples from Mt. Shennongjia. Dimension 2 (15.2 %) especially separated individuals from Chile and Mt. Rungwe. The Wilks' test showed that the location of the sampling sites was the best variable discriminating the distribution of the individuals in the PCA.
Principal component analysis performed on the temperature (RAN15, RAN17) and pH (RIAN) indices derived from 3-OH FAs showed that most of the variance was carried by the first two axes of the PCA (Axis 1 = 56.09 %, Axis 2 = 35.29 %; Fig. S2). The first axis was highly correlated with the RAN15 (r=0.87) and RAN17 (r=0.93) as well as with MAAT (), while Axis 2 showed strong correlations with the RIAN (r=0.96) and pH (). The PCA allowed the visualization of relationships at the scale of the whole dataset between MAAT and RAN15 and RAN17 (; , respectively) and between pH and RIAN ().
3.3.2 brGDGTs
The first two axes of the brGDGT PCA explained 57.7 % of the total variance in the dataset (Fig. 3b). Dimension 1 (42.6 %) strongly discriminated soils from Mt. Majella and, to a lesser extent, Mt. Pollino in the right quadrant from those from Mt. Shegyla, the Peruvian Andes and the Chilean Andes in the left quadrant. Mt. Majella and Mt. Pollino were also discriminated negatively along dimension 2 (15.1 %). Samples from Mt. Shennongjia and Lautaret-Galibier were distributed over the entire PCA. As for the 3-OH FAs, Wilks' test showed that the location of the sampling sites was the best variable discriminating the distribution of the brGDGTs in the PCA.
4.1 3-OH-FA- and brGDGT-derived proxies
Previous studies conducted on soils from individual altitudinal transects revealed (1) local linear relationships between MAAT or pH and 3-OH FA indices and (2) the potential for combined calibrations using simple linear regressions (Wang et al., 2016; Huguet et al., 2019; Véquaud et al., 2021). In the present study, the existence of linear relationships between 3-OH-FA-derived indices and environmental variables was further investigated using an extended soil dataset, and the corresponding results were compared with those derived from the brGDGTs, used as an established reference proxy.
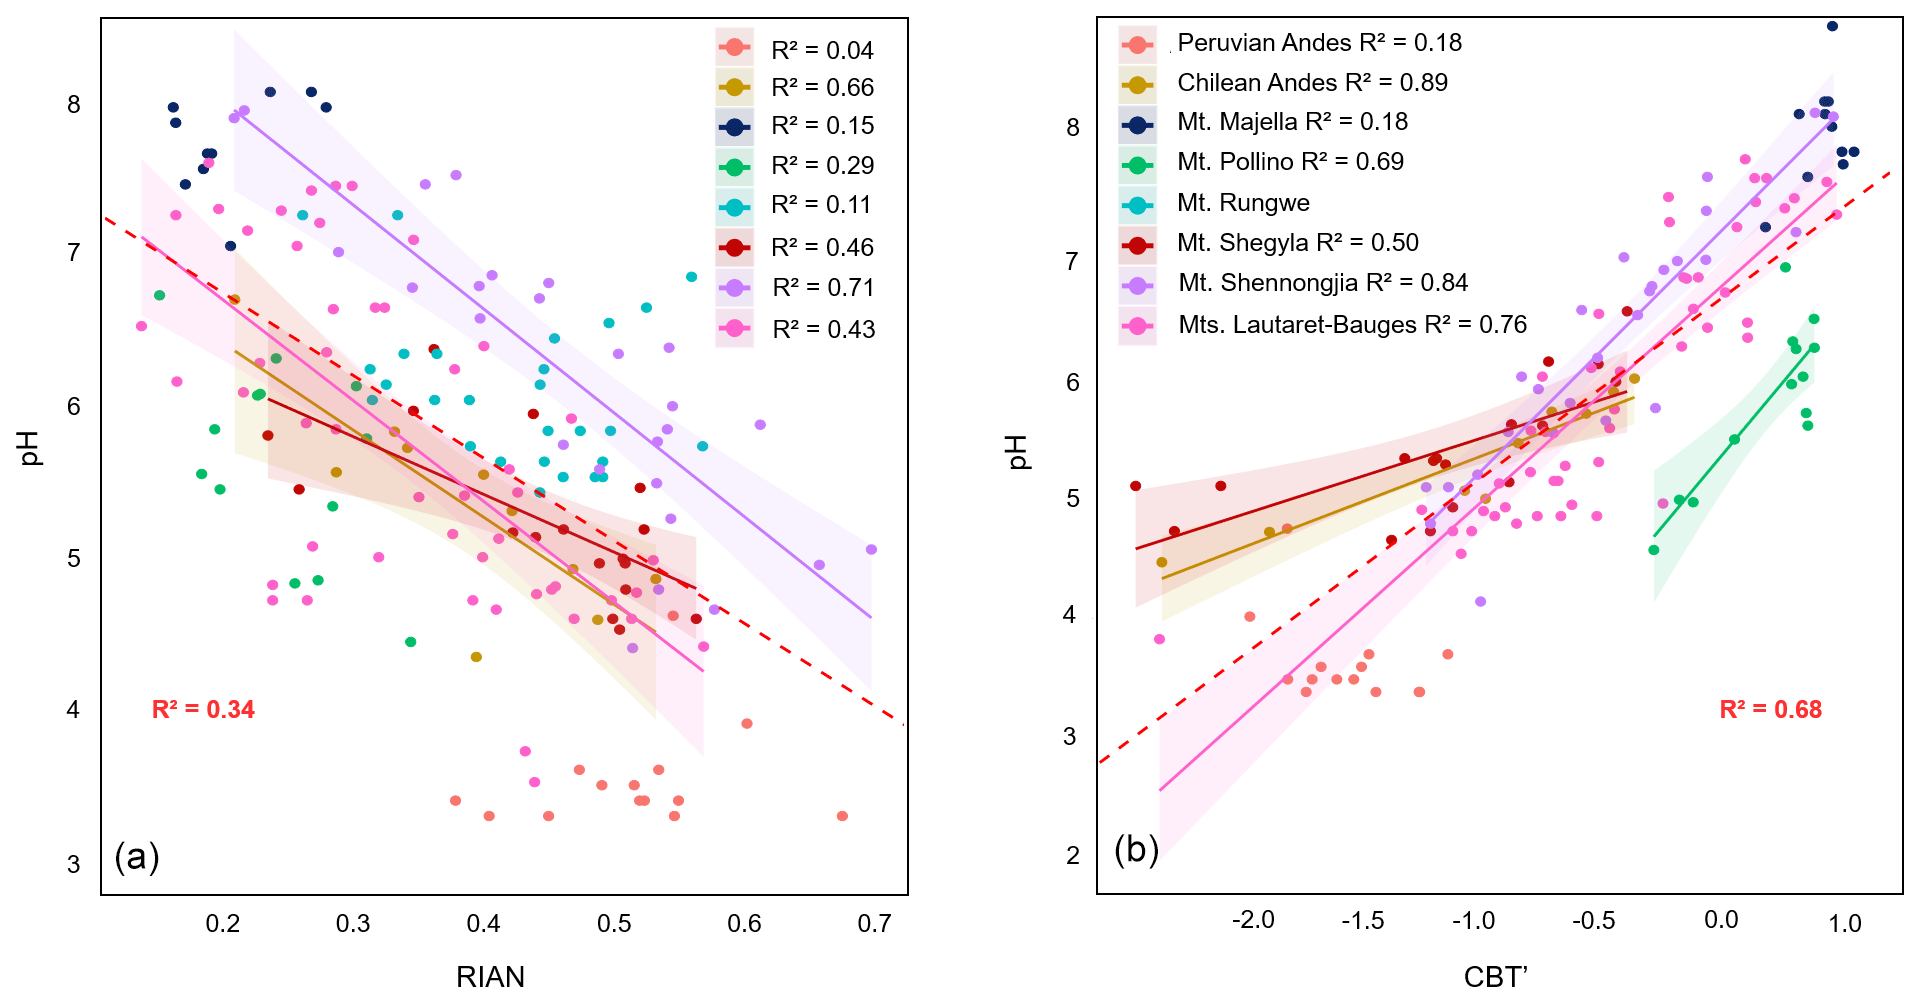
Figure 4Linear regressions between (a) pH and RIAN and (b) pH and CBT' along the eight altitudinal transects investigated. Dotted lines represent the 95 % confidence interval for each regression, and coloured areas represent the 95 % confidence interval for each regression. Data for Mt. Majella and Mt. Rungwe were taken from Huguet et al. (2019). Data from Mt. Shennongjia were taken from Yang et al. (2015) and Wang et al. (2016). Data from Mt. Bauges and Mt. Lautaret-Galibier were taken from Véquaud et al. (2021). Only significant regressions (p<0.05) are shown.
4.1.1 Relationships between pH and bacterial lipid-derived proxies
The relationship between RIAN and pH was investigated along each of the altitudinal transects (Fig. 4a, Table S3). No significant linear relationship was obtained for the Peruvian Andes, Mt. Rungwe, Mt. Pollino and Mt. Majella (Huguet et al., 2019), and weak to moderate correlations were observed along Mt. Shegyla and Lautaret-Bauges (R2=0.29–0.46; Table S3). In contrast, strong regressions between RIAN and pH were observed along Mt. Shennongjia (R2=0.71) and in the Chilean Andes (R2=0.66). A weak linear relationship between RIAN and pH (R2=0.34, RMSE = 0.99, ) was also obtained when considering the 168 samples for the eight elevation transects altogether. Therefore, our results confirm the general influence of pH on the relative abundance of 3-OH FAs (Huguet et al., 2019) but suggest that strong linear correlations between RIAN and pH can only be obtained (i) at a local level and (ii) only for some of the sites.
As previously suggested (Huguet et al., 2019), the absence or weakness of linear correlations between RIAN and pH may be at least partly due to the small range of variation in pH (<2 units) along some mountains, such as Mt. Rungwe, Mt. Majella and the Peruvian Andes (Fig. 4a, Table 1; Huguet et al., 2019). Transects for the Peruvian Andes and Mt. Majella were also characterized by the absence of relationships between pH and the brGDGT-derived CBT' index, supporting the hypothesis that narrow pH ranges limit the potential of obtaining linear relationships between indices based on bacterial lipids and pH. Nevertheless, the existence of a narrow pH range was not the only limiting factor in obtaining a strong linear regression between RIAN and pH. Indeed, MAAT rather than soil pH was the dominant driver of soil bacterial diversity and community composition for the Peruvian transect (determined using 16S rRNA sequencing (Nottingham et al., 2018) and phospholipid fatty acids (Whitaker et al., 2014)), consistent with the weak correlation between soil pH and bacterial lipids. The weakness of the RIAN–pH relationship may also be partly due to the heterogeneity of soils encountered along a given altitudinal transect, representing specific microenvironments, and to the large diversity of bacterial communities in soils from different elevations (Siles and Margesin, 2016). The distribution of 3-OH FAs varies greatly among Gram-negative bacterial species (Bhat and Carlson, 1992), which may account for the significant variability in RIAN values observed in soils from a given transect. Altogether, these results suggest that linear models are not the most suitable for establishing a global calibration between RIAN and pH in soils.
Concerning GDGTs, moderate to strong relationships between brGDGT-derived CBT' index and pH were observed along five of the seven altitudinal transects investigated (Fig. 4b, Table S3). All the individual linear relationships between CBT' and pH, where present, had similar slopes and ordinates and share (for most of the samples) the same 95 % confidence intervals (p value < 0.5). This resulted in a strong linear relationship between CBT' index and pH values for the dataset (R2=0.68, RMSE = 0.71, n=140), which is weaker than the global calibration (R2=0.85, RMSE = 0.52, n=221) proposed by De Jonge et al. (2014).
The discrepancy in relationships between temperature and brGDGTs and 3-OH FAs might partly be due to differences in the relative abundance of these lipids among bacterial communities. The brGDGTs are produced by a more restricted and less diverse number of bacterial species than 3-OH FAs, which are arguably biosynthesized by a large diversity of Gram-negative bacteria species (e.g. Wakeham et al., 2003, Zelles et al., 1995; Zelles, 1999). So far, only bacteria from the Acidobacteria phylum were identified as putative brGDGT producers in soils (Sinninghe Damsté et al., 2018). The hypothetical lower diversity of brGDGT producers, in contrast with 3-OH FAs, might explain the more homogenous response and lower scatter of the relationships between pH and CBT' index. Moreover, the CBT' index is a ratio based on a restricted number of compounds, representing the direct dependence of the degree of cyclization of bacterial GDGTs on pH. Conversely, the RIAN index is calculated from the relative abundances of all the individual 3-OH FAs between C10 and C18 (Wang et al., 2016). It cannot be ruled out that some of the compounds used to calculate the RIAN index are preferentially synthesized, as part of the homeoviscous mechanism, in response to environmental variables other than pH. This calls for a better understanding of the ecology of 3-OH-FA-producing bacteria and their adaptation mechanisms.
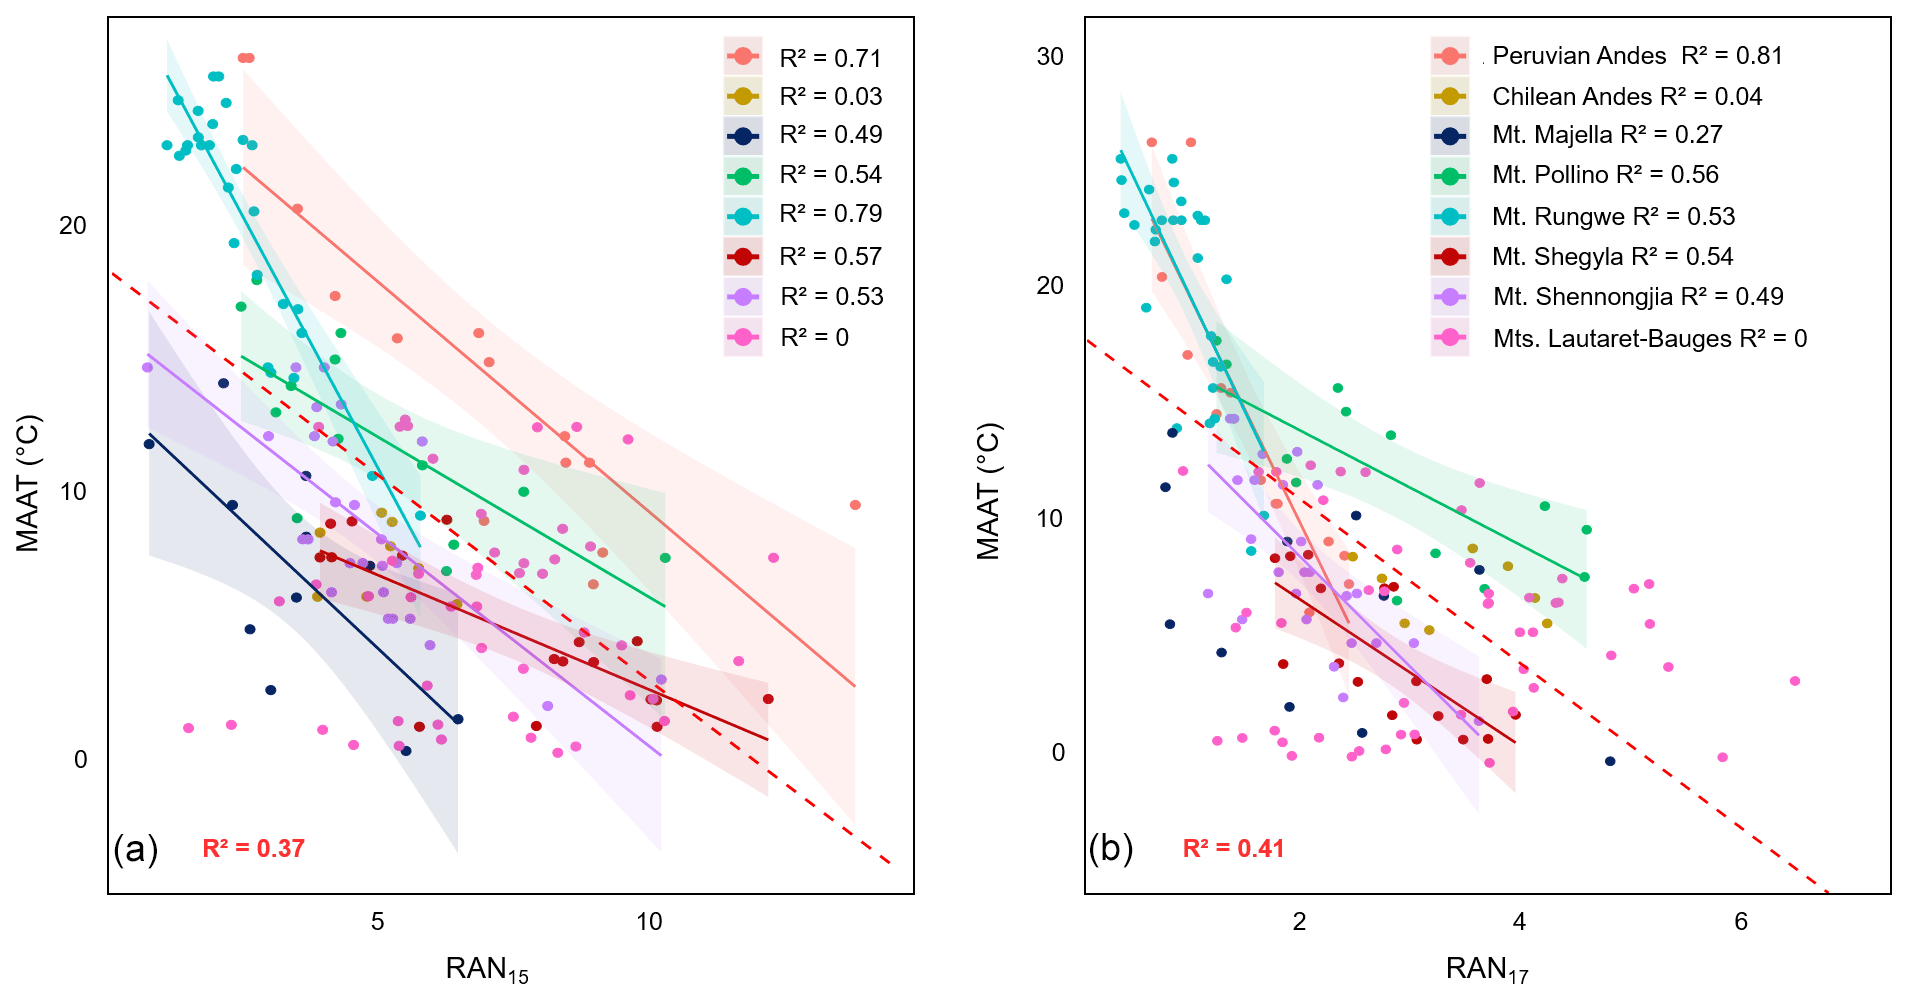
Figure 5Linear regressions between (a) MAAT and RAN15 and (b) MAAT and RAN17 along the eight altitudinal transects investigated. Dotted lines represent the 95 % confidence interval for each regression, and coloured areas represent the 95 % confidence interval for each regression. Data from Mt. Majella and Mt. Rungwe were taken from Huguet et al. (2019). Data from Mt. Shennongjia were taken from Wang et al. (2016). Data from Mt. Bauges and Mt. Lautaret-Galibier were taken from Véquaud et al. (2021). Only significant regressions (p<0.05) are shown.
4.1.2 Relationships between MAAT and bacterial lipid-derived proxies
RAN15 was previously shown to be correlated with MAAT along Mt. Rungwe, Mt. Majella and Mt. Shennongjia (Wang et al., 2016; Huguet et al., 2019). Moderate to strong linear correlations (R2=0.49–0.79) between RAN15 and MAAT were also observed along most of the individual transects investigated (Fig. 5a, Table S3), except along the Chilean and Lautaret-Bauges transects. The individual correlations do not share the same 95 % confidence intervals, and even when some of them present similar slopes, the regression lines display significantly different intercepts (p value > 0.05) (Fig. 5a). This supports the hypothesis of a site-dependent effect of the linear RAN15–MAAT relationship previously made by Huguet et al. (2019).
Similarly to RAN15, RAN17 was moderately to strongly correlated (R2=0.53–0.81) with MAAT along five out of eight individual transects (Fig. 5b, Table S3). The small range of variation in MAAT along the Chilean transect (6.0–9.2 ∘C) (Table 1), associated with that of the RAN15/RAN17, could explain the lack of a linear relationship between the MAAT and these indices. As for the French Alps (Mt. Bauges and Mt. Lautaret-Galibier), the influence of local environmental parameters (pH and to a lesser extent soil moisture and grain size, related to vegetation and soil types, or thermal regimes associated with the snow cover) on 3-OH FA distribution was shown to be predominant over that of MAAT (Véquaud et al., 2021). In contrast with RAN15, the linear regressions between RAN17 and MAAT along Mt. Shegyla, Mt. Shennongjia, Mt. Rungwe and the Peruvian Andes transects share confidence intervals at 95 % and have similar slope and intercept values (p value < 0.05; Fig. 5b, Table S3), suggesting that RAN17 could be a more effective global proxy for MAAT reconstructions than RAN15.
In order to test the hypothesis that RAN17 rather than RAN15 is a more effective global proxy for MAAT, the global calibrations between RAN15/RAN17 and MAAT based on the entire soil dataset (n=168) were compared. The two linear regressions had similar moderate determination coefficients (R2=0.37 and 0.41 for RAN15 and RAN17, respectively) and similar high RMSE (RMSE = 5.46 ∘C and 5.28 ∘C for RAN15 and RAN17, respectively; Table S3). For all transects (except for the Mt. Majella RAN17–MAAT relationship), the individual local regressions between RAN15/RAN17 and MAAT outperformed the proposed global linear calibrations in terms of determination coefficients (0.49–0.81) and RMSE (1.98–3.57 ∘C; Table S3), suggesting that local rather than global linear transfer functions based on RAN15 or RAN17 may be more appropriate for palaeotemperature reconstructions in soils.
The difficulties in establishing global linear RAN15/RAN17–MAAT calibrations may partly be due to the fact that microbial diversity, especially for 3-OH-FA-producing Gram-negative bacteria (Margesin et al., 2009; Siles and Margesin, 2016), can vary greatly from one soil to another, resulting in variation in the RAN15/RAN17 indices, as also assumed for the RIAN. The strong regional dependence of the 3-OH FA distribution may thus explain the weak correlation between 3-OH-FA-derived indices (RAN15, RAN17 and RIAN) and environmental variables (MAAT or pH) at a global level. This regional dependency was further supported by the PCA of the relative abundance of 3-OH FAs across the global dataset, which showed that the individuals were grouped based on the sampling location (Fig. 3a).
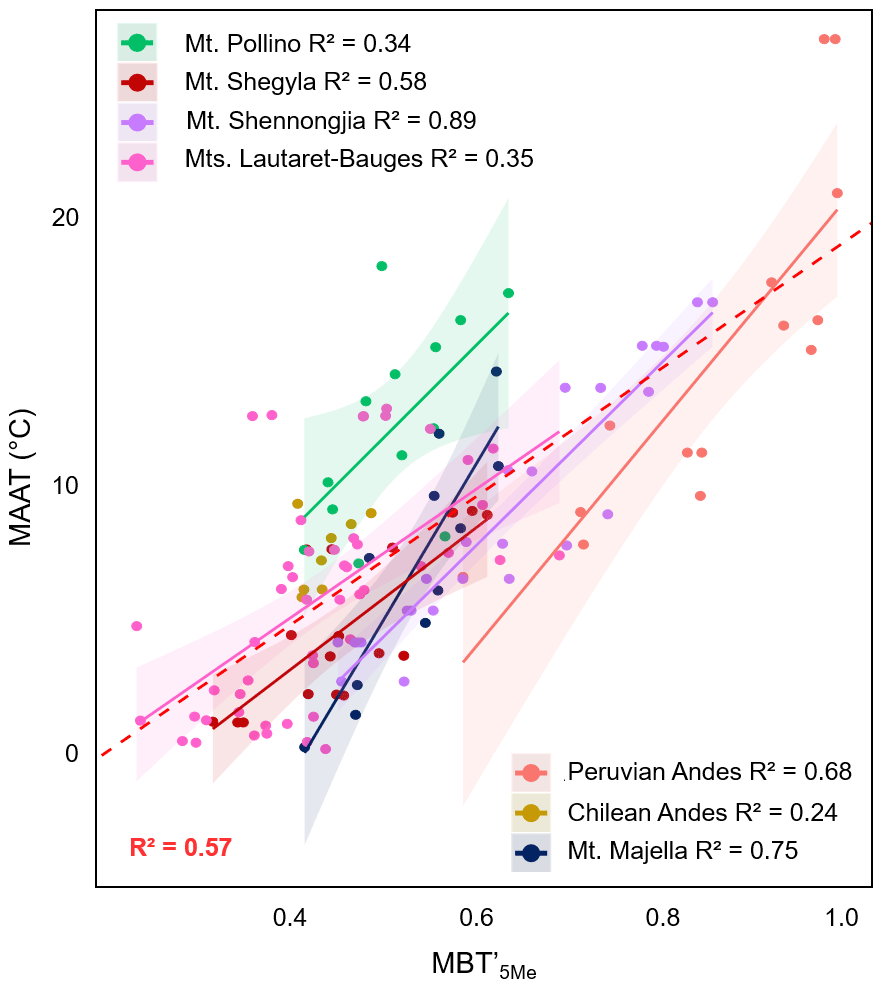
Figure 6Linear regressions between (a) MAAT and MBT'5Me along seven of the eight altitudinal transects investigated. Data from Mt. Rungwe (Coffinet et al., 2014), for which 5- and 6-methyl brGDGTs were not separated, were not included in this graph. Dotted lines represent the 95 % confidence interval for each regression, and coloured areas represent the 95 % confidence interval for each regression. Data from Mt. Majella were taken from Huguet et al. (2019). Data from Mt. Bauges and Mt. Lautaret-Galibier were taken from Véquaud et al. (2021). Data from Mt. Shennongjia were taken from Yang et al. (2015). The global soil calibration by De Jonge et al. (2014) was applied to all these transects. Only significant regressions (p<0.05) are shown.
In addition to 3-OH FAs, the relationships between brGDGT distribution and MAAT were investigated along the seven transects for which the 5- and 6-methyl brGDGT isomers were separated (Mt. Shegyla, Mt. Pollino Majella, Lautaret-Bauges, Mt. Shennongjia, the Peruvian Andes and the Chilean Andes). These individual transects showed moderate to strong relationships between MAAT and MBT'5Me (R2 0.35–0.89; Fig. 6 and Table S3), with similar slopes and ordinates (except for the Peruvian Andes), and shared 95 % confidence intervals for most of the samples. A distinct relationship between MBT'5Me and MAAT was observed along the Peruvian Andes and Mt. Majella transects (Fig. 6a), as also observed for the RIAN and RAN15 indices (Figs. 4a and 5a). The singularity of the Peruvian soils is also visible in the PCA performed on the brGDGT distribution (Fig. 3b), where the samples from this region are pooled separately from the rest of the dataset. This specific trend is difficult to explain, even though the Peruvian Andes are subjected to warmer climatic conditions (Table 1) than the other temperate transects, which may in turn affect the nature of the microbial communities encountered in the soils and the bacteria lipid distribution (Siles and Margesin, 2016; Hofmann et al., 2016; De Jonge et al., 2019).
A moderate linear relationship between MAAT and MBT'5Me (MAAT = 24.3 × MBT'5Me−5.03, R2 = 0.57, RMSE = 3.39 ∘C, n=140; Table S3) was observed after combining the data for the seven aforementioned altitudinal transects. This global relationship follows a similar trend as the calibration proposed by De Jonge et al. (2014) (MAAT = 31.45 × MBT'5Me−8.57) and is more robust and accurate than those obtained between the RAN15/RAN17 and MAAT (Table S3). This confirms that the MBT'5Me index can be applied at a global scale using a simple linear regression model as previously shown (De Jonge et al., 2014; Naafs et al., 2017), in contrast with the RAN15 and RAN17 proxies, for which only strong local calibrations with MAAT were found.
As a similar conclusion was obtained for the RIAN–pH proxy, it appears necessary to use more complex models to develop global calibrations between 3-OH-FA-derived proxies and MAAT or pH. This novel method allows the complexity and specificity of each environmental site to be taken into account.
4.2 Development of new models for the reconstruction of MAAT and pH from 3-OH FAs
Several complementary methods were recently used to derive calibrations with environmental parameters from organic proxies. Most calibrations between lipid distribution and environmental variables were based on simple linear regression models, most often the ordinary least square regression (e.g. for brGDGTs: De Jonge et al., 2014; Wang et al., 2016) as it is simple and easy to implement and understand. Other linear models, such as Deming regression (Naafs et al., 2017) or Bayesian regression (Tierney and Tingley, 2014; Dearing Crampton-Flood et al., 2020), were also used. Nevertheless, these single linear regression methods rely on a given index (e.g. MBT'5Me or CBT' for brGDGTs) which is correlated with environmental parameters. This represents a limitation as the relative distribution of bacterial lipids can be concomitantly influenced by several environmental parameters (e.g. Véquaud et al., 2021) and can also depend on the diversity of the bacteria producing these compounds (Parker et al., 1982; Bhat and Carlson, 1992; Zelles, 1999). In contrast, using bacterial lipid relative abundances rather than a single index in the relationships with environmental variables appears less restrictive and more representative of the environmental complexity. Other models can be used in this way, such as those based on multiple regressions (e.g. Peterse et al., 2012; De Jonge et al., 2014; Russell et al., 2018), describing the relationships between one or several explained variables (e.g. bacterial lipid abundances) and one or several explanatory variables (e.g. MAAT, pH). Multiple regressions can reveal the presence of linear relationships among several known variables but cannot take into account non-linear influences, which may occur in complex environmental settings. This limitation, common to all linear models, can be overcome using non-parametric methods such as some of the machine learning algorithms (e.g. nearest neighbours or random forest; Dunkley Jones et al., 2020). The reliability of the latter models lies in the fact that they are non-linear, which helps capture the intrinsic complexity of the environmental setting, and that they avoid the regression dilution phenomenon observed in most linear models. Moreover, their robustness is improved by the fact that they are built on a randomly defined proportion of the total dataset and then tested on the rest of the dataset, considered to be independent. Last, these machine learning algorithms are flexible and are continuously evolving when adding new samples.
As shown in Sect. 4.1., robust global calibrations between 3-OH-FA-derived indices (RIAN, RAN15 and RAN17) and MAAT or pH could not be established using a simple linear regression model, contrary to what was observed with brGDGT-derived indices. Therefore, three different independent and complementary models were tested to potentially establish stronger statistical relationships between 3-OH FA distributions and pH or MAAT at the global level: (i) a parametric model – multiple linear regression, (ii) two non-parametric models – random forest (e.g. Ho, 1995; (Denisko and Hoffman, 2018) and k-NN algorithms (e.g. Gangopadhyay et al., 2009). As discussed above, the multiple linear regression model allows the determination of linear relationships between MAAT or pH and the individual relative abundances of 3-OH FAs instead of indices derived from the latter. As for the two non-parametric models, they present among other things the advantage of taking into account non-linear environmental influences.
The three models, based on a supervised machine learning approach, were applied to the total soil dataset (n=168). All the 3-OH FA homologues of Gram-negative bacterial origin (i.e. with chain lengths between C10 and C18; Wilkinson et al., 1988) were included in the models, whatever their abundance, to keep the maximum variability and take into account the specificity and complexity of each altitudinal transect. Indeed, the nature of the individual 3-OH FAs whose fractional abundance is mainly influenced by MAAT or pH may be site-dependent, as previously observed (Véquaud et al., 2021). The performances of these three models were compared with those of the linear calibrations between 3-OH-FA-derived indices (RAN15, RAN17, RIAN) and MAAT or pH (Table 2).
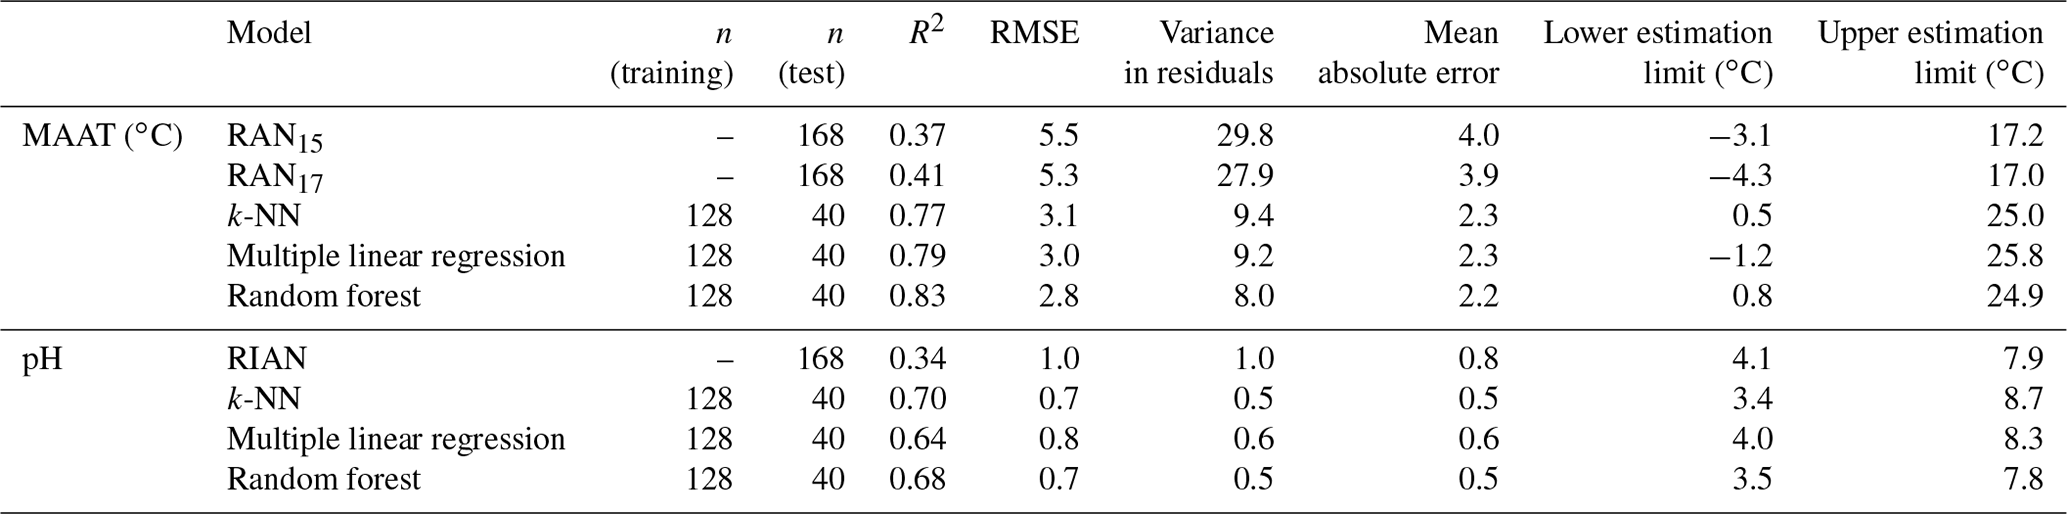
Table 2Characteristics of the different models proposed in this study to estimate MAAT and pH: R2, RMSE, variance in the residuals, mean absolute error (MAE), and the upper and lower limits of estimation. The “training” samples were used to develop the different machine learning models, which were then tested on a “test” sample set.
4.2.1 Temperature calibrations
The multiple linear regression model yielded a strong relationship between 3-OH FA relative abundances and MAAT (Fig. 7a, Eq. 6):
This model, which takes into account the Gram-negative bacterial 3-OH FAs (C10-C18; Wilkinson et al., 1988), presents a higher strength than the global linear relationships between 3-OH-FA-derived indices and MAAT (R2=0.37 and 0.41, RMSE = 5.5 ∘C and 5.3 ∘C for RAN15 and RAN17, respectively; Table 2). The multiple linear regression also improves the accuracy and robustness of MAAT prediction in comparison with single linear relationships, with lower RMSE (3.0 ∘C), variance in the residuals (9.2 ∘C; Fig. 7d) and mean absolute error (MAE; 2.3 ∘C) than with the RAN15 and RAN17 calibrations (RMSE of 5.5 and 5.3 ∘C, variance of 29.8 and 27.9 ∘C, MAE of 4.0 and 3.9 ∘C for RAN15 and RAN17, respectively; Table 2).
Similarly to the multiple linear regression model (Fig. 7a), the random forest (Fig. 7b) and k-NN (Fig. 7c) calibrations are characterized by strong determination coefficients (R2 0.83 and 0.77, respectively). The variance in residuals, MAE and RMSE of the random forest calibration are slightly lower than those of the multiple linear regression and k-NN models (Table 2). An advantage of the random forest algorithm lies in the fact that the weight of the different variables used to define the model can be quantified using the permutation importance method (Breiman, 2001). The a-C15, i-C14, a-C17, n-C12 and n-C15 as well as to a lesser extent n-C17, n-C16 and i-C13 3-OH FAs were observed to be the homologues predominantly used by the model to estimate MAAT values (Fig. 9a). They include all the 3-OH FAs involved in the calculation of the RAN15 and RAN17 indices, especially the a-C15 homologue. This may explain why linear relationships between the RAN15/RAN17 and MAAT could be established along some, but not all, of the altitudinal transects investigated until now (Wang et al., 2016; Huguet al., 2019; Véquaud et al., 2021; this study). Nevertheless, other individual 3-OH FAs than those appearing in the calculation of the RAN15 and RAN17 also have a major weight in the random forest model and seem to be influenced by temperature changes, explaining the moderate determination coefficients of the global RAN15/RAN17–MAAT linear relationships observed in this study.
On the whole, the strength and accuracy of the multiple linear regression, k-NN and random forest models are much higher than those based on the RAN15 and RAN17 indices (Table 2). This is likely related to the fact that the three aforementioned models integrate the whole suite of 3-OH FA homologues (C10 to C18) and thus better capture the complexity of the response of soil Gram-negative bacteria and their lipid distribution to temperature changes than the RAN15 and RAN17 indices. They also present the advantage of increasing the range of temperature, which may be predicted by more than 4 ∘C in comparison with the RAN15 and RAN17 calibrations (Table 2). Indeed, even though the lower limit of MAAT estimates for the three models tested in the present study is slightly higher than those based on the RAN15 and RAN17 indices, the upper limit of the MAAT, which can be estimated using the multiple linear regression, random forest and k-NN models, is substantially higher (ca. 25 ∘C) than that based on the RAN15 or RAN17 indices (ca. 17 ∘C; Table 2).
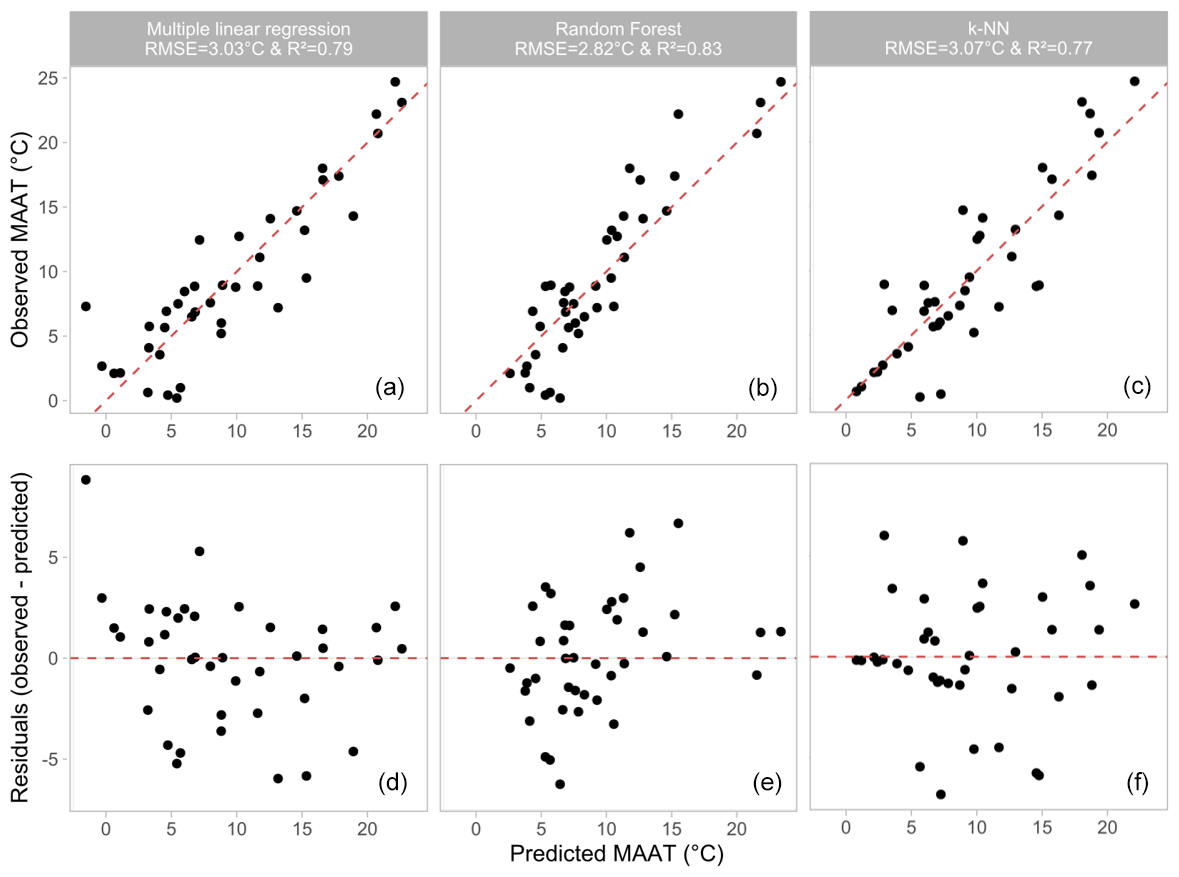
Figure 7Results of the three different models tested to reconstruct the MAAT from 3-OH FA distribution: observed MAAT (∘C) vs. predicted MAAT (∘C) for (a) the multiple linear regression model, (b) the random forest model and (c) the k-NN method. MAAT residuals plotted against the predicted MAAT for (d) the multiple linear regression model, (e) the random forest model and (f) the k-NN method.
The three proposed models show the potential of 3-OH FAs as MAAT proxies at the global level, which was not visible using RAN15 and RAN17 indices. The non-parametric models (random forest and k-NN) may benefit from the fact that they take into account the complex, non-linear relationships between environmental parameters and bacterial lipid abundance. This is highlighted when comparing the independent variations in the individual 3-OH FA relative abundances with estimated MAAT for the three proposed models, with non-linear trends for the k-NN and random forest models, in contrast with the multiple linear regression (Fig. S2).
4.2.2 pH calibrations
A robust linear relationship between the RIAN and pH could not be obtained from the whole soil dataset (Fig. 4a, Table 2). In contrast, the multiple regression model provided a strong correlation between the 3-OH FA fractional abundances and pH (Fig. 8a, Eq. 7):
The random forest (Fig. 8b) and k-NN pH models (Fig. 8c) appeared to be slightly more robust and accurate than the multiple linear regression (Fig. 8a) as the former two models presented slightly higher determination coefficients (R2=0.68 and 0.70 for k-NN and random forest, respectively) and slightly lower RMSE (0.7), variance in residuals (0.5) and MAE (0.5) than the multiple linear regression (Table 2).
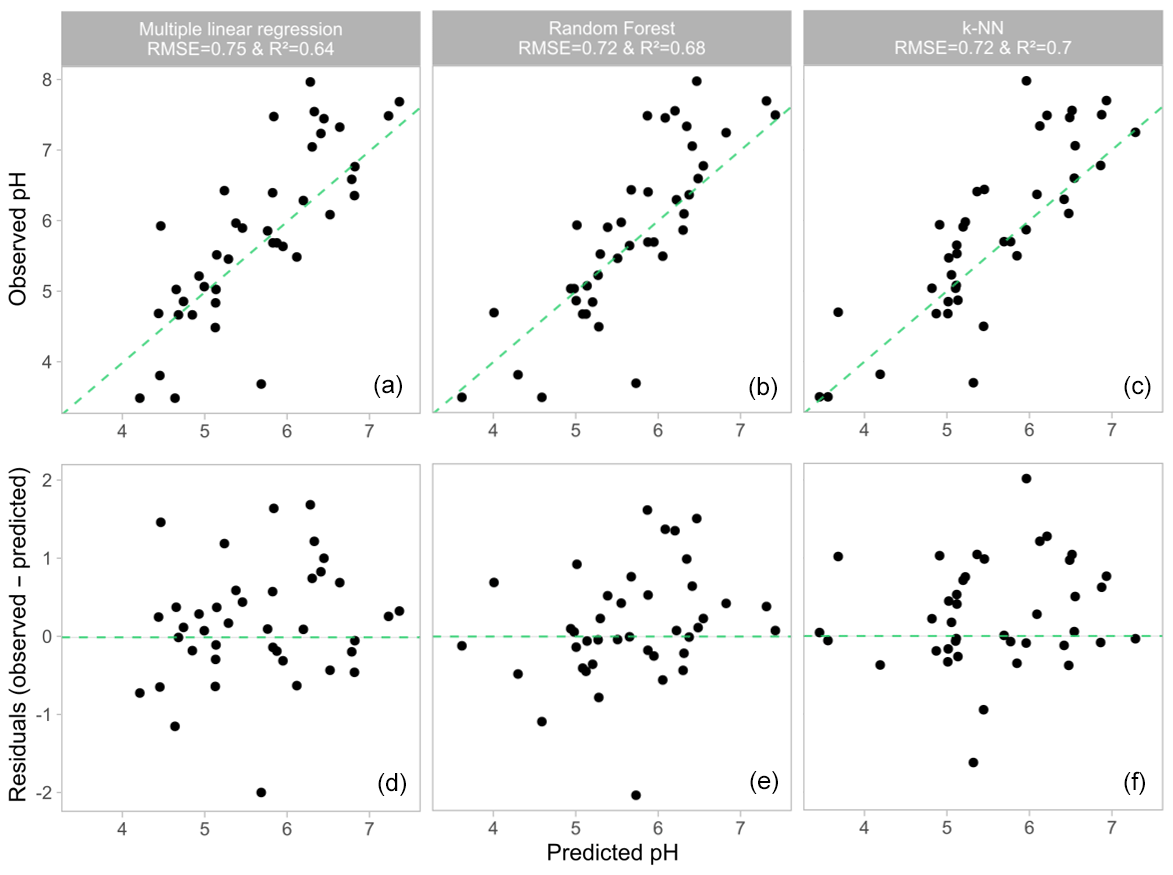
Figure 8Results of the three different models tested to reconstruct the pH from 3-OH FA distribution: observed pH vs. predicted pH for (a) the multiple linear regression model, (b) the random forest model and (c) the k-NN method. The pH residuals plotted against the predicted pH for (d) the multiple linear regression model, (e) the random forest model and (f) the k-NN method.
As for the MAAT random forest model, the weight of the individual 3-OH FAs in the pH random forest calibration was determined (Fig. 9b). Three homologues – i-C13, n-C15, i-C16 – had a larger weight in the global pH model than the others (Fig. 9b). This is consistent with a detailed study of 3-OH FA distribution in soils from the French Alps (Véquaud et al., 2021), where the i-C13 and i-C16 3-OH FAs were observed to be predominantly influenced by pH. Nevertheless, in addition to the three aforementioned homologues, most of the C10 to C18 3-OH FAs have a non-negligible influence in the random forest pH model, except the a-C15 and i-C14 compounds (Fig. 9b). This is in line with the definition of the 3-OH FA-based pH index (RIAN) defined by Wang et al. (2016), which includes the whole suite of 3-OH FAs. These results suggest that soil Gram-negative bacteria may respond to pH variations by modifying the whole distribution of associated 3-OH FAs (C10-C18). This would need to be further confirmed by, for example, investigating the influence of pH variations on pure strains of Gram-negative bacteria isolated from soils.
In any case, in contrast with the RIAN index, the multiple linear regression, k-NN and random forest models provided strong global calibrations with pH (Fig. 8) as robust as the global CBT'–pH relationship (Fig. 4b). The three proposed models also increase the range of pH which can be estimated (∼ 4 pH units) in comparison with the RIAN global calibration (∼ 3 pH units), further strengthening the potential of these models for soil pH reconstruction. As MAAT models, the independent variations in the individual 3-OH FA relative abundances with estimated pH highlight non-linear trends for the k-NN and random forest models, in contrast with the multiple linear regression (Fig. S3), which might favour the use of the two non-parametric models in order to take into account such non-linear influences. The machine learning MAAT and pH models proposed in this paper are flexible and could be further improved by increasing the number of soil samples analysed and the representativeness of the different MAAT and pH values within the dataset.
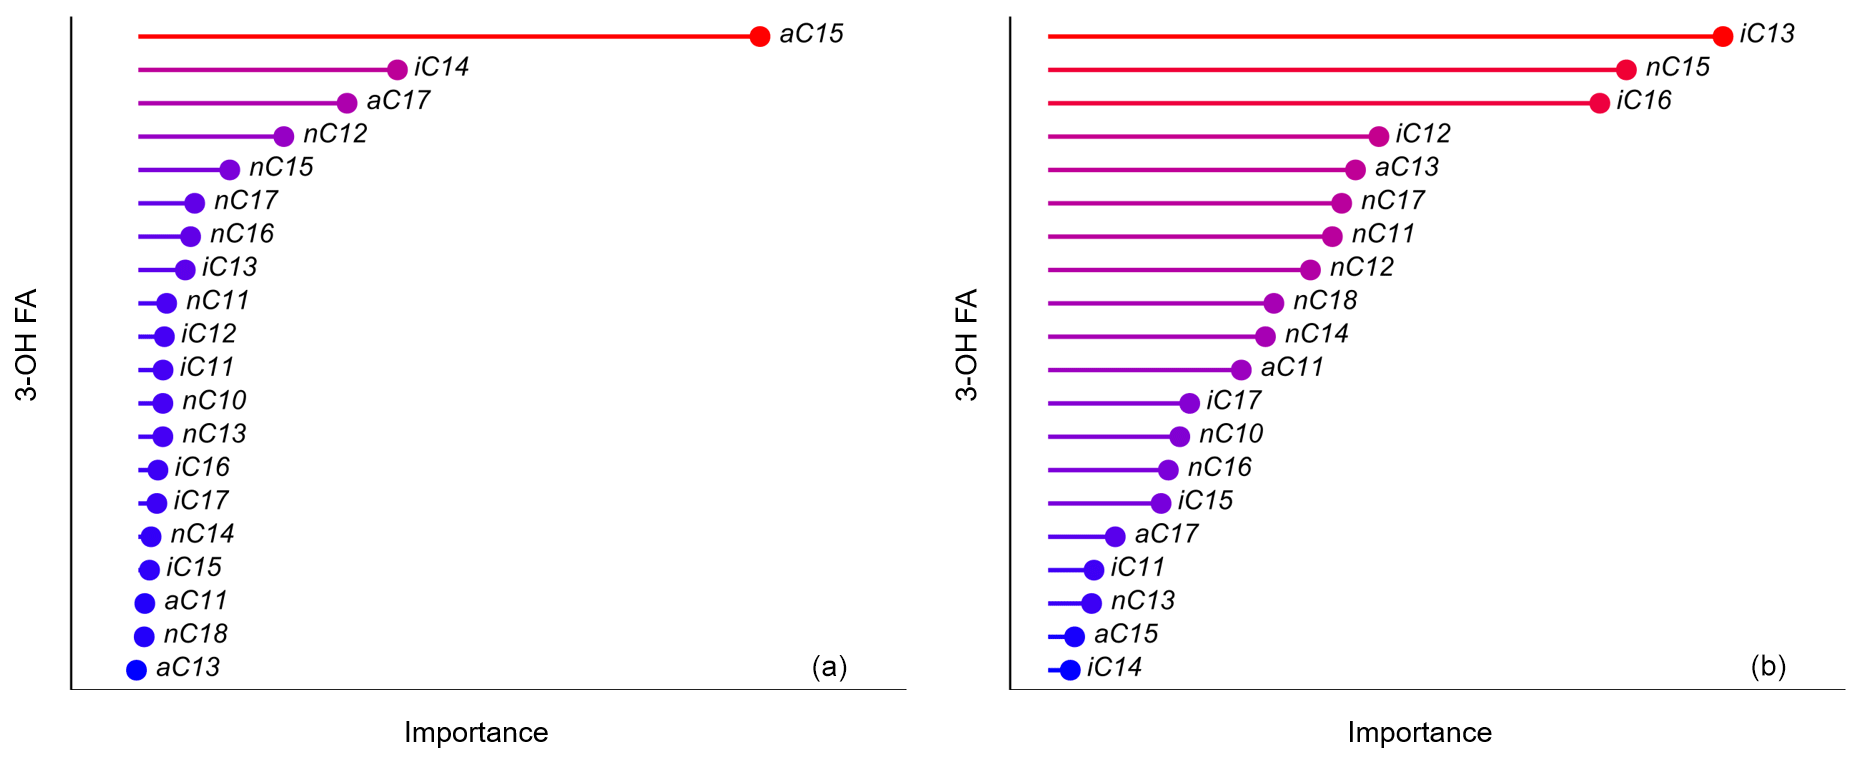
Figure 9Importance (arbitrary unit) of the 3-OH FAs used to estimate (a) MAAT and (b) pH in the random forest models proposed in this study according to the permutation importance method (Breiman, 2001).
4.3 Palaeoclimate application of the new 3-OH FA and MAAT models
The multiple regression, random forest and k-NN models developed for MAAT reconstruction using 3-OH FAs were similar in terms of robustness and precision (Fig. 7a–c, Table 2). The performance and validity of these global terrestrial calibrations for palaeotemperature reconstructions were thus tested and compared with the MAAT record from a Chinese speleothem (HS4 stalagmite) covering the last 9000 years BP (Wang et al., 2018). This terrestrial archive was the object of previous palaeostudies, thus providing a context for the interpretation of the MAAT data, and, to the best of our knowledge, represents the only published application of 3-OH FAs as a palaeotemperature proxy in terrestrial settings (Wang et al., 2018). The local comparison of 3-OH FA distributions in the overlying soils and stalagmites and the analyses of bacterial diversity and transport pathways suggested that the 3-OH FAs in the HS4 speleothem were mainly soil-derived (Wang et al., 2018), supporting the application of soil calibrations for MAAT reconstruction from this archive, although not being a palaeosoil itself. The first palaeoapplication of 3-OH FAs (Wang et al., 2018) on this speleothem relied on a local calibration between the RAN15 index and MAAT proposed by Wang et al. (2016) using soils from Mt. Shennongjia. The MAAT estimates derived from our global soil calibrations were compared with those obtained from this local soil calibration (Wang et al., 2016).
4.3.1 Comparison of the multiple linear regression, k-NN and random forest global MAAT calibrations
The multiple regression model (Eq. 6, Fig. 7a) yielded MAAT estimates ranging between −35 and 22.8 ∘C over the last 9000 years (Fig. S4). The temperature minimum (−35 ∘C) observed at 560 years BP can be considered to be an outlier, with a significantly lower MAAT estimate than those provided by the other samples. After having ignored this apparent outlier, the MAAT range over the last 9000 years was comprised between 3.2 and 22.8 ∘C, with temperature shifts of up to 15 ∘C within very short periods of time. The observed range of MAAT and large variations in temperature over such short periods appear far too excessive as the expected amplitude of MAAT during the Holocene is expected to be up to ca. 2–3 ∘C (Liu et al., 2014). This highly questions the reliability of the multiple linear regression model for MAAT reconstruction from this archive.
MAAT estimates derived from the k-NN calibration ranged between 6.5 and 19.7 ∘C over the last 9000 years (Fig. S4). Abrupt shifts in MAAT of more than 10 ∘C were observed between 2000 and 4000 years BP. Such variations, higher than the RMSE of the calibration, appear excessive for the Holocene period, as previously discussed for the multiple regression model. The bias in MAAT estimates may be due to the intrinsic definition of the k-NN model, which is better suited for uniformly distributed datasets. This is not the case here as the individual transects heterogeneously cover a wide range of temperatures. The application of a global calibration at the local scale – that of the HS4 stalagmite – using the k-NN method and based on the similarities among samples thus does not appear appropriate. Such a calibration might be improved by extending the dataset with samples more equally distributed across a wider range of global climatic gradients.
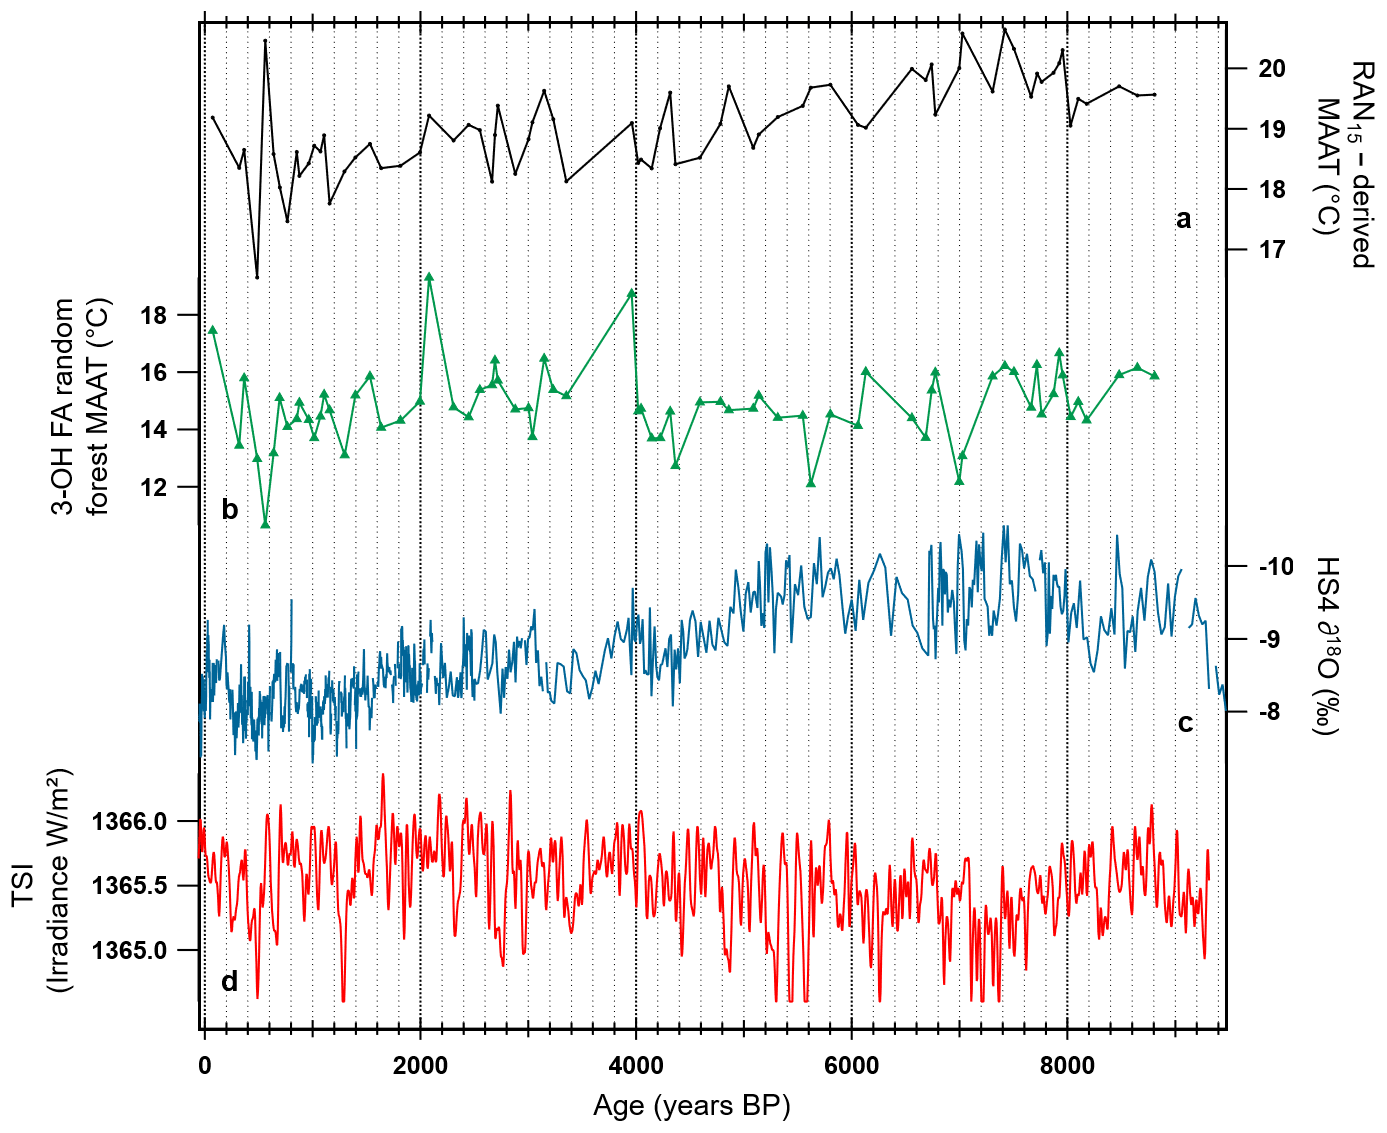
Figure 10Comparison of the 3-OH FA model–MAAT record with other time series and proxy records for the HS4 speleothem (Wang et al., 2018). (a) RAN15–MAAT record reconstructed using a local Chinese calibration (Wang et al., 2016, 2018). (b) 3-OH FA random forest model–MAAT. (c) The CaCO3 oxygen isotope record (Hu et al., 2008b). (d) Total solar irradiance (TSI; W/m2) during the Holocene (past 9300 years) based on a composite described in Steinhilber et al. (2009).
Finally, the random forest model yielded MAAT estimates between 10.6 and 19.3 ∘C, i.e. a smaller estimation range than the k-NN algorithm and multiple regression model (Fig. S4). The amplitude of the shifts observed between 2000 and 4000 years BP was ca. 4 ∘C, which is climatically more consistent than the variations obtained with the k-NN method and multiple regression model, even though these large variations in MAAT over such short periods of time still appear too excessive. Furthermore, the application of the global random forest calibration roughly provided similar temperature trends as those derived from the local RAN15 calibration by Wang et al. (2018; Fig. 10), despite some of the largest oscillations for the global model. These results suggest that the random forest calibration is more reliable than the multiple regression and k-NN ones. This can be explained by the intrinsic definition of the random forest algorithm, which averages the results of several independent models (so-called decision trees), thus reducing the variance and thus the forecast error in the final model. This is also in line with the slightly higher accuracy of the random forest calibration compared with the other two models (Table 2), as previously discussed. In contrast, the multiple regression calibration was the less performant of the three models in the investigated archive. This may be related to its parametric nature and the fact that it does not take into account the natural non-linear variations in 3-OH FA fractional abundances highlighted by the random forest and k-NN models (Figs. 2 and 3).
In conclusion, the three models proposed in this study, especially the random forest, have potential for MAAT reconstruction, even though the application to a well-known palaeoclimate archive showed their limitations. This highlights the importance of testing new calibrations on well-characterized archives to investigate their reliability.
4.3.2 Comparison of the global random forest and local RAN15 calibrations for MAAT reconstruction
The random forest model was observed to be the most reliable of the three proposed global MAAT calibrations (Fig. 7). To go further, we compared the temperature record derived from our global random forest calibration with that derived from the local MAAT–RAN15 transfer function proposed by Wang et al. (2016; Fig. 10). The application of the local RAN15 calibration to the HS4 stalagmite yielded an average MAAT of ca. 18.4 ∘C over the most recent part of the record (last 800 years; Fig. 10), consistent with the MAAT of 18 ∘C recorded in situ by a temperature logger (Hu et al., 2008; Wang et al., 2018). In contrast, absolute MAAT estimates derived from the random forest model were on average 14.2 ∘C over the last 800 years and were generally lower than those obtained from the local RAN15 calibration over the whole record. Altogether, these results suggest that the random forest model tends to underestimate absolute MAAT, in contrast with the RAN15 calibration proposed by Wang et al. (2016). This discrepancy may be due to the fact that the calibration proposed in the present study is based on a global dataset, with samples subject to a large variety of environmental and climatic conditions, whereas the RAN15–MAAT transfer function by Wang et al. (2016) was constructed using soil samples from a regional altitudinal transect, located at only 120 km distance from the stalagmite site (Wang et al., 2018).
Even though the local calibration by Wang et al. (2016) provides more accurate absolute MAAT values than the present global random forest model, as could be expected, both calibrations roughly generate similar qualitative MAAT trends over time. A regular slight decrease in temperature of ca. 1 ∘C was observed between 9000 and ca. 1000 years BP based on the local RAN15 calibration (Fig. 10a; Wang et al., 2018). This general decreasing trend was also visible when using the random forest model but with larger oscillations and mainly between 9000 and 4000 years BP, in agreement with the general trend recorded by the ∂18O record (mixture of temperature and hydrological signals; Wang et al., 2018) of the HS4 stalagmite (Fig. 10b, c; Hu et al., 2008). In addition, both the global random forest, local RAN15 calibrations and the ∂18O record allowed the identification of several climatic events in the Northern Hemisphere, in agreement with the reconstructed total solar irradiance (TSI; Steinhilber et al., 2009; Fig. 10d). Thus, both models highlighted, with slightly different amplitudes, the Medieval Warm Period (MWP; 800–1000 years BP) and Little Ice Age (LIA; 200–500 years BP) (Mann et al., 2008; Ljungqvist, 2010; Wang et al., 2018). The LIA event is particularly well represented by the global random forest calibration, in line with the decrease in the TSI (Fig. 10b, d) associated with a relative increase in the ∂18O of HS4 carbonates (dry–cool event; Wang et al., 2018). Before the MWP, the global random forest calibration shows slight oscillations, which can be assumed to be representative of TSI variations between 500 and 1300 years BP. Similarly, an important cooling event, well correlated with a significant decrease in the TSI (Fig. 10a, b, d), was recorded by the two calibrations at 1300 years BP.
The global random forest calibration also highlighted two cooling events, poorly represented by the local RAN15 calibration: one at ca. 4200 years BP and, to a lesser extent, another one between 2800 and 3000 years BP (Bond et al., 2001; Mayewski et al., 2004). The event at 4200 years BP is consistent with the ∂18O and solar irradiance records and is referenced in the literature as the “4.2-kiloyear event” (deMenocal, 2001). This intense drought event was suggested to have had a major impact on different civilizations (collapses, migrations; Gibbons, 1993; Staubwasser et al., 2003; Li et al., 2018; Bini et al., 2019). Thus, in some parts of China, the production of rice fields sharply decreased during this period, leading to a decrease in population (Gao et al., 2007).
Both calibrations additionally show a cooling period between 4000 years and 3200 years BP, more pronounced based on the global random forest model, followed by another cooling between 3200 and 3000 years BP. This cooling period is consistent with the trends derived from ∂18O and solar irradiance records. It culminates with a cold episode at 3000 years BP, also known as Late Bronze Age Collapse (Kaniewski et al., 2013). Indeed, this cold episode, combined with droughts, may have led to a decrease in agricultural production in China, contributing to the degradation of trade routes and ultimately to the collapse of Bronze Age civilizations (Weiss, 1982; Knapp and Manning, 2016). Last, the global random forest calibration also highlights two additional cold events, between 5600 and 5900 years BP as well as around 7100 years BP, corresponding to solar irradiance minima (Bond et al., 2001; Mayewski et al., 2004) and which are not as clearly visible with the local RAN15 calibration by Wang et al. (2016).
The first application of the random forest calibration to a natural archive shows the potential of 3-OH FAs as palaeotemperature proxies at a global scale as known and documented climatic events were recorded, with a similar RMSE (2.8 ∘C; Table 2) as that of the local calibration by Wang et al. (2.6 ∘C; 2016). In summary, we demonstrate that 3-OH FAs are promising and effective temperature proxies for terrestrial settings, complementary to, and independent of, the brGDGTs (De Jonge et al., 2014; Naafs et al., 2017; Dearing Crampton-Flood et al., 2020), and also highlight the usefulness of non-parametric models using machine learning, especially the random forest algorithm, to establish global MAAT calibrations. We expect that analyses of 3-OH FAs in a larger number of globally distributed soils will further improve the accuracy and robustness of the global random forest calibration for palaeotemperature reconstruction. Additional palaeoapplications are also required to further test and validate the applicability of the global MAAT and pH calibrations based on 3-OH FAs presented in this study.
The 3-OH FAs have been recently proposed as environmental proxies in terrestrial settings, based on local studies. This study investigated for the first time the applicability of these compounds as MAAT and pH proxies at the global scale using an extended soil dataset across a series of globally distributed elevation transects (n=168). Strong linear relationships between 3-OH FA-derived indices (RAN15, RAN17 and RIAN) and MAAT or pH could only be obtained locally for some individual transects, suggesting that these indices cannot be used as palaeoproxies at the global scale through this kind of model. Other algorithms (multiple linear regression, k-NN and random forest models) were tested and, in contrast with simple linear regressions, provided strong global correlations between MAAT or pH and 3-OH FA relative abundances. The applicability of these three models for palaeotemperature reconstruction was tested and compared with the MAAT record from the unique available record: a Chinese speleothem. The calibration based on the random forest model appeared to be the most robust and showed similar trends to previous reconstructions and known Holocene climate variations. Furthermore, the global random forest model highlighted documented climatic events poorly represented by the local RAN15 calibration. This new global model is promising for palaeotemperature reconstructions in terrestrial settings and could be further improved by analysing 3-OH FAs in a larger number of globally distributed soils. This study demonstrates the major potential of 3-OH FAs as MAAT or pH proxies in terrestrial environments through the different models presented and their application for palaeoreconstruction.
All data are available in the Supplement tables.
The supplement related to this article is available online at: https://doi.org/10.5194/bg-18-3937-2021-supplement.
PV performed the lipid and statistical analyses and wrote a first draft of the paper. AH and SD supervised the work of PV and corrected the first draft; PV and AT developed the different models; GB, AN, WPS, NS, JPW and SeC provided samples and/or associated data; and all the co-authors reviewed and commented on the paper.
The authors declare that they have no conflict of interest.
We thank Sorbonne Université for a PhD scholarship to Pierre Véquaud and the Labex MATISSE (Sorbonne Université) for financial support. The EC2CO programme (CNRS/INSU – BIOHEFECT/MICROBIEN) is thanked for funding of the SHAPE project. Arnaud Huguet and Sergio Contreras are grateful for funding of the ECOS SUD/ECOS ANID #C19U01/190011 project. We are grateful to Jérôme Poulenard for discussions on soil characteristics and for comments on the manuscript. We thank Juntao Wang and Jinzheng He for having provided soils from Mt. Shegyla. We thank the Peruvian programme led by Norma Salinas, including CONCYTEC/FONDECYT through contract 116-2016. We thank the associate editor Marcel van der Meer and the reviewers for their comments, which helped in improving the manuscript.
This research has been supported by the Centre National de la Recherche Scientifique, Institut national des sciences de l'Univers (grant no. EC2CO SHAPE), and the Université Pierre et Marie Curie (grant no. Labex MATISSE).
This paper was edited by Marcel van der Meer and reviewed by two anonymous referees.
Beales, N.: Adaptation of Microorganisms to Cold Temperatures, Weak Acid Preservatives, Low pH, and Osmotic Stress: A Review, Comprehensive Reviews in Food Science and Food Safety, 3, 1–20, https://doi.org/10.1111/j.1541-4337.2004.tb00057.x, 2004.
Bhat, U. R. and Carlson, R. W.: A new method for the analysis of amide-linked hydroxy fatty acids in lipid-As from gram-negative bacteria, Glycobiology, 2, 535–539, https://doi.org/10.1093/glycob/2.6.535, 1992.
Bini, M., Zanchetta, G., Perşoiu, A., Cartier, R., Català, A., Cacho, I., Dean, J. R., Di Rita, F., Drysdale, R. N., Finnè, M., Isola, I., Jalali, B., Lirer, F., Magri, D., Masi, A., Marks, L., Mercuri, A. M., Peyron, O., Sadori, L., Sicre, M.-A., Welc, F., Zielhofer, C., and Brisset, E.: The 4.2 ka BP Event in the Mediterranean region: an overview, Clim. Past, 15, 555–577, https://doi.org/10.5194/cp-15-555-2019, 2019.
Bonanomi, G., Zotti, M., Mogavero, V., Cesarano, G., Saulino, L., Rita, A., Tesei, G., Allegrezza, M., Saracino, A., and Allevato, E.: Climatic and anthropogenic factors explain the variability of Fagus sylvatica treeline elevation in fifteen mountain groups across the Apennines, Forest Ecosyst., 7, 5, https://doi.org/10.1186/s40663-020-0217-8, 2020.
Bond, G., Kromer, B., Beer, J., Muscheler, R., Evans, M. N., Showers, W., Hoffmann, S., Lotti-Bond, R., Hajdas, I., and Bonani, G.: Persistent Solar Influence on North Atlantic Climate During the Holocene, Science, 294, 2130–2136, https://doi.org/10.1126/science.1065680, 2001.
Brassell, S. C., Eglinton, G., Marlowe, I. T., Pflaumann, U., and Sarnthein, M.: Molecular stratigraphy: a new tool for climatic assessment, Nature, 320, 129–133, https://doi.org/10.1038/320129a0, 1986.
Breiman, L.: Random Forests, Machine Learning, 45, 5–32, https://doi.org/10.1023/A:1010933404324, 2001.
Carter, M. R., Gregorich, E. G., and Gregorich, E. G.: Soil Sampling and Methods of Analysis, CRC Press, https://doi.org/10.1201/9781420005271, 2007.
Coffinet, S., Huguet, A., Williamson, D., Fosse, C., and Derenne, S.: Potential of GDGTs as a temperature proxy along an altitudinal transect at Mount Rungwe (Tanzania), Organic Geochem., 68, 82–89, https://doi.org/10.1016/j.orggeochem.2014.01.004, 2014.
Coffinet, S., Huguet, A., Pedentchouk, N., Bergonzini, L., Omuombo, C., Williamson, D., Anquetil, C., Jones, M., Majule, A., Wagner, T., and Derenne, S.: Evaluation of branched GDGTs and leaf wax n-alkane δ2H as (paleo) environmental proxies in East Africa, Geochim.t Cosmochim. Ac., 198, 182–193, https://doi.org/10.1016/j.gca.2016.11.020, 2017.
Coffinet, S., Huguet, A., Bergonzini, L., Pedentchouk, N., Williamson, D., Anquetil, C., Gałka, M., Kołaczek, P., Karpińska-Kołaczek, M., Majule, A., Laggoun-Défarge, F., Wagner, T., and Derenne, S.: Impact of climate change on the ecology of the Kyambangunguru crater marsh in southwestern Tanzania during the Late Holocene, Quat. Sci. Rev., 196, 100–117, https://doi.org/10.1016/j.quascirev.2018.07.038, 2018.
De Jonge, C., Hopmans, E. C., Zell, C. I., Kim, J.-H., Schouten, S., and Sinninghe Damsté, J. S.: Occurrence and abundance of 6-methyl branched glycerol dialkyl glycerol tetraethers in soils: Implications for palaeoclimate reconstruction, Geochim. Cosmochim. Ac., 141, 97–112, https://doi.org/10.1016/j.gca.2014.06.013, 2014.
De Jonge, C., Radujković, D., Sigurdsson, B. D., Weedon, J. T., Janssens, I., and Peterse, F.: Lipid biomarker temperature proxy responds to abrupt shift in the bacterial community composition in geothermally heated soils, Organic Geochem., 137, 103897, https://doi.org/10.1016/j.orggeochem.2019.07.006, 2019.
Dearing Crampton-Flood, E., Tierney, J. E., Peterse, F., Kirkels, F. M. S. A., and Sinninghe Damsté, J. S.: BayMBT: A Bayesian calibration model for branched glycerol dialkyl glycerol tetraethers in soils and peats, Geochim. Cosmochim. Ac., 268, 142–159, https://doi.org/10.1016/j.gca.2019.09.043, 2020.
deMenocal, P. B.: Cultural Responses to Climate Change During the Late Holocene, 292, 667–673, https://doi.org/10.1126/science.1059287, 2001.
Denich, T. J., Beaudette, L. A., Lee, H., and Trevors, J. T.: Effect of selected environmental and physico-chemical factors on bacterial cytoplasmic membranes, J. Microbiol. Meth., 52, 149–182, https://doi.org/10.1016/S0167-7012(02)00155-0, 2003.
Denisko, D. and Hoffman, M. M.: Classification and interaction in random forests, P. Natl. Acad. Sci. USA, 115, 1690–1692, https://doi.org/10.1073/pnas.1800256115, 2018.
Dunkley Jones, T., Eley, Y. L., Thomson, W., Greene, S. E., Mandel, I., Edgar, K., and Bendle, J. A.: OPTiMAL: a new machine learning approach for GDGT-based palaeothermometry, Clim. Past, 16, 2599–2617, https://doi.org/10.5194/cp-16-2599-2020, 2020.
Eglinton, T. I. and Eglinton, G.: Molecular proxies for paleoclimatology, Earth Planet. Sc. Lett., 275, 1–16, https://doi.org/10.1016/j.epsl.2008.07.012, 2008.
Emiliani, C.: Pleistocene Temperatures, J. Geol., 63, 538–578, https://doi.org/10.1086/626295, 1955.
Erez, J. and Luz, B.: Experimental paleotemperature equation for planktonic foraminifera, Geochim. Cosmochim. Ac., 47, 1025–1031, https://doi.org/10.1016/0016-7037(83)90232-6, 1983.
Gangopadhyay, S., Harding, B. L., Rajagopalan, B., Lukas, J. J., and Fulp, T. J.: A nonparametric approach for paleohydrologic reconstruction of annual streamflow ensembles, Water Resour. Res., 45, https://doi.org/10.1029/2008WR007201, 2009.
Gao, H., Zhu, C., and Xu, W.: Environmental change and cultural response around 4200 cal. yr BP in the Yishu River Basin, Shandong, J. Geogr. Sci., 17, 285–292, https://doi.org/10.1007/s11442-007-0285-5, 2007.
Gibbons, A.: How the Akkadian Empire Was Hung Out to Dry, Science, 261, 985, https://doi.org/10.1126/science.261.5124.985, 1993.
Hazel, J. R. and Eugene Williams, E.: The role of alterations in membrane lipid composition in enabling physiological adaptation of organisms to their physical environment, Prog. Lipid Res., 29, 167–227, https://doi.org/10.1016/0163-7827(90)90002-3, 1990.
Hofmann, K., Lamprecht, A., Pauli, H., and Illmer, P.: Distribution of Prokaryotic Abundance and Microbial Nutrient Cycling Across a High-Alpine Altitudinal Gradient in the Austrian Central Alps is Affected by Vegetation, Temperature, and Soil Nutrients, Microb. Ecol., 72, 704–716, https://doi.org/10.1007/s00248-016-0803-z, 2016.
Hu, C., Henderson, G. M., Huang, J., Xie, S., Sun, Y., and Johnson, K. R.: Quantification of Holocene Asian monsoon rainfall from spatially separated cave records, Earth Planet. Sc. Lett., 266, 221–232, https://doi.org/10.1016/j.epsl.2007.10.015, 2008.
Huguet, A., Coffinet, S., Roussel, A., Gayraud, F., Anquetil, C., Bergonzini, L., Bonanomi, G., Williamson, D., Majule, A., and Derenne, S.: Evaluation of 3-hydroxy fatty acids as a pH and temperature proxy in soils from temperate and tropical altitudinal gradients, Org. Geochem., 129, 1–13, https://doi.org/10.1016/j.orggeochem.2019.01.002, 2019.
Huguet, C., Hopmans, E. C., Febo-Ayala, W., Thompson, D. H., Sinninghe Damsté, J. S., and Schouten, S.: An improved method to determine the absolute abundance of glycerol dibiphytanyl glycerol tetraether lipids, Org. Geochem., 37, 1036–1041, https://doi.org/10.1016/j.orggeochem.2006.05.008, 2006.
Kaniewski, D., Campo, E. V., Guiot, J., Burel, S. L., Otto, T., and Baeteman, C.: Environmental Roots of the Late Bronze Age Crisis, PLOS ONE, 8, e71004, https://doi.org/10.1371/journal.pone.0071004, 2013.
Knapp, A. B. and Manning, S. W.: Crisis in Context: The End of the Late Bronze Age in the Eastern Mediterranean, American Journal of Archaeology, 120, 99–149, https://doi.org/10.3764/aja.120.1.0099, 2016.
Li, C.-H., Li, Y.-X., Zheng, Y.-F., Yu, S.-Y., Tang, L.-Y., Li, B.-B., and Cui, Q.-Y.: A high-resolution pollen record from East China reveals large climate variability near the Northgrippian-Meghalayan boundary (around 4200 years ago) exerted societal influence, Palaeogeogr. Palaeocl. Palaeoecol., 512, 156–165, https://doi.org/10.1016/j.palaeo.2018.07.031, 2018.
Liu, Z., Zhu, J., Rosenthal, Y., Zhang, X., Otto-Bliesner, B. L., Timmermann, A., Smith, R. S., Lohmann, G., Zheng, W., and Elison Timm, O.: The Holocene temperature conundrum, P. Natl. Acad. Sci. USA, 111, 3501–3505, https://doi.org/10.1073/pnas.1407229111, 2014.
Ljungqvist, F. C.: A new reconstruction of temperature variability in the extra-tropical northern hemisphere during the last two millennia, Geografiska Annaler: Series A , 92, 339–351, https://doi.org/10.1111/j.1468-0459.2010.00399.x, 2010.
Loomis, S. E., Russell, J. M., Ladd, B., Street-Perrott, F. A., and Sinninghe Damsté, J. S.: Calibration and application of the branched GDGT temperature proxy on East African lake sediments, Earth Planet. Sc. Lett., 357, 277–288, https://doi.org/10.1016/j.epsl.2012.09.031, 2012.
Malhi, Y., Silman, M., Salinas, N., Bush, M., Meir, P., and Saatchi, S.: Introduction: Elevation gradients in the tropics: laboratories for ecosystem ecology and global change research, Glob. Change Biol., 16, 3171–3175, https://doi.org/10.1111/j.1365-2486.2010.02323.x, 2010.
Mann, M. E., Zhang, Z., Hughes, M. K., Bradley, R. S., Miller, S. K., Rutherford, S., and Ni, F.: Proxy-based reconstructions of hemispheric and global surface temperature variations over the past two millennia, P. Natl. Acad. Sci. USA, 105, 13252–13257, https://doi.org/10.1073/pnas.0805721105, 2008.
Margesin, R., Jud, M., Tscherko, D., and Schinner, F.: Microbial communities and activities in alpine and subalpine soils: Communities and activities in alpine and subalpine soils, FEMS Microb. Ecol., 67, 208–218, https://doi.org/10.1111/j.1574-6941.2008.00620.x, 2009.
Mayewski, P. A., Rohling, E. E., Curt Stager, J., Karlén, W., Maasch, K. A., David Meeker, L., Meyerson, E. A., Gasse, F., van Kreveld, S., Holmgren, K., Lee-Thorp, J., Rosqvist, G., Rack, F., Staubwasser, M., Schneider, R. R., and Steig, E. J.: Holocene climate variability, Quat. Res., 62, 243–255, https://doi.org/10.1016/j.yqres.2004.07.001, 2004.
Naafs, B. D. A., Gallego-Sala, A. V., Inglis, G. N., and Pancost, R. D.: Refining the global branched glycerol dialkyl glycerol tetraether (brGDGT) soil temperature calibration, Org. Geochem., 106, 48–56, https://doi.org/10.1016/j.orggeochem.2017.01.009, 2017.
Nottingham, A. T., Whitaker, J., Turner, B. L., Salinas, N., Zimmermann, M., Malhi, Y., and Meir, P.: Climate Warming and Soil Carbon in Tropical Forests: Insights from an Elevation Gradient in the Peruvian Andes, 65, 906–921, https://doi.org/10.1093/biosci/biv109, 2015.
Nottingham, A. T., Fierer, N., Turner, B. L., Whitaker, J., Ostle, N. J., McNamara, N. P., Bardgett, R. D., Leff, J. W., Salinas, N., Silman, M. R., Kruuk, L. E. B., and Meir, P.: Microbes follow Humboldt: temperature drives plant and soil microbial diversity patterns from the Amazon to the Andes, Ecology, 99, 2455–2466, https://doi.org/10.1002/ecy.2482, 2018.
Peterse, F., Kim, J.-H., Schouten, S., Kristensen, D. K., Koç, N., and Sinninghe Damsté, J. S.: Constraints on the application of the MBT/CBT palaeothermometer at high latitude environments (Svalbard, Norway), Org. Geochem., 40, 692–699, https://doi.org/10.1016/j.orggeochem.2009.03.004, 2009.
Peterse, F., van der Meer, J., Schouten, S., Weijers, J. W. H., Fierer, N., Jackson, R. B., Kim, J.-H., and Sinninghe Damsté, J. S.: Revised calibration of the MBT–CBT paleotemperature proxy based on branched tetraether membrane lipids in surface soils, Geochim. Cosmochim. Ac., 96, 215–229, https://doi.org/10.1016/j.gca.2012.08.011, 2012.
Peterse, F., Moy, C. M., and Eglinton, T. I.: A laboratory experiment on the behaviour of soil-derived core and intact polar GDGTs in aquatic environments, Biogeosciences, 12, 933–943, https://doi.org/10.5194/bg-12-933-2015, 2015.
R Core Team, R: A language and environment for statistical computing, R Foundation for Statistical Computing, Vienna, Austria, 2674, 2014.
Russell, N. J., Evans, R. I., ter Steeg, P. F., Hellemons, J., Verheul, A., and Abee, T.: Membranes as a target for stress adaptation, Int. J. Food Microbiol., 28, 255–261, https://doi.org/10.1016/0168-1605(95)00061-5, 1995.
Russell, J. M., Hopmans, E. C., Loomis, S. E., Liang, J., and Sinninghe Damsté, J. S.: Distributions of 5- and 6-methyl branched glycerol dialkyl glycerol tetraethers (brGDGTs) in East African lake sediment: Effects of temperature, pH, and new lacustrine paleotemperature calibrations, Org. Geochem., 117, 56–69, https://doi.org/10.1016/j.orggeochem.2017.12.003, 2018.
Scalercio, S., Bonacci, T., Mazzei, A., Pizzolotto, R., and Brandmayr, P.: Better up, worse down: bidirectional consequences of three decades of climate change on a relict population of Erebia cassioides, J. Insect. Conserv., 18, 643–650, https://doi.org/10.1007/s10841-014-9669-x, 2014.
Schouten, S., Hopmans, E. C., and Sinninghe Damsté, J. S.: The organic geochemistry of glycerol dialkyl glycerol tetraether lipids: A review, Org. Geochem., 54, 19–61, https://doi.org/10.1016/j.orggeochem.2012.09.006, 2013.
Siles, J. A. and Margesin, R.: Abundance and Diversity of Bacterial, Archaeal, and Fungal Communities Along an Altitudinal Gradient in Alpine Forest Soils: What Are the Driving Factors?, Microb. Ecol., 72, 207–220, https://doi.org/10.1007/s00248-016-0748-2, 2016.
Sinensky, M.: Homeoviscous Adaptation – A Homeostatic Process that Regulates the Viscosity of Membrane Lipids in Escherichia coli, P. Natl. Acad. Sci. USA, 71, 522–525, https://doi.org/10.1073/pnas.71.2.522, 1974.
Singer, S. J. and Nicolson, G. L.: The Fluid Mosaic Model of the Structure of Cell Membranes, Science, 175, 720–731, https://doi.org/10.1126/science.175.4023.720, 1972.
Sinninghe Damsté, J. S., Rijpstra, W. I. C., Hopmans, E. C., Weijers, J. W. H., Foesel, B. U., Overmann, J. and Dedysh, S. N.: 13,16-Dimethyl Octacosanedioic Acid (iso-Diabolic Acid), a Common Membrane-Spanning Lipid of Acidobacteria Subdivisions 1 and 3, Appl. Environ. Microbiol., 77, 4147–4154, https://doi.org/10.1128/AEM.00466-11, 2011.
Sinninghe Damsté, J. S., Rijpstra, W. I. C., Hopmans, E. C., Foesel, B. U., Wüst, P. K., Overmann, J., Tank, M., Bryant, D. A., Dunfield, P. F., Houghton, K., and Stott, M. B.: Ether- and Ester-Bound iso-Diabolic Acid and Other Lipids in Members of Acidobacteria Subdivision 4, Appl. Environ. Microbiol., 80, 5207–5218, https://doi.org/10.1128/AEM.01066-14, 2014.
Sinninghe Damste, J. S., Rijpstra, W. I. C., Foesel, B. U., Huber, K. J., Overmann, J., Nakagawa, S., Kim, J. J., Dunfield, P. F., Dedysh, S. N. and Villanueva, L.: An overview of the occurrence of ether- and ester-linked iso-diabolic acid membrane lipids in microbial cultures of the Acidobacteria: Implications for brGDGT paleoproxies for temperature and pH, Org. Geochem., 124, 63–76, https://doi.org/10.1016/j.orggeochem.2018.07.006, 2018.
Staubwasser, M., Sirocko, F., Grootes, P. M., and Segl, M.: Climate change at the 4.2 ka BP termination of the Indus valley civilization and Holocene south Asian monsoon variability, Geophys. Res. Lett., 30, 1425, https://doi.org/10.1029/2002GL016822, 2003.
Steinhilber, F., Beer, J., and Fröhlich, C.: Total solar irradiance during the Holocene, Geophys. Res. Lett., 36, L19704, https://doi.org/10.1029/2009GL040142, 2009.
Szponar, B., Kraśnik, L., Hryniewiecki, T., Gamian, A., and Larsson, L.: Distribution of 3-Hydroxy Fatty Acids in Tissues after Intraperitoneal Injection of Endotoxin, Clin. Chem., 49, 1149–1153, https://doi.org/10.1373/49.7.1149, 2003.
Tierney, J. E. and Russell, J. M.: Distributions of branched GDGTs in a tropical lake system: Implications for lacustrine application of the MBT/CBT paleoproxy, Org. Geochem., 40, 1032–1036, https://doi.org/10.1016/j.orggeochem.2009.04.014, 2009.
Tierney, J. E. and Tingley, M. P.: A Bayesian, spatially-varying calibration model for the TEX86 proxy, Geochim. Cosmochim. Ac., 127, 83–106, https://doi.org/10.1016/j.gca.2013.11.026, 2014.
Todaro, L., Andreu-Hayles, L., D'Alessandro, C., Gutiérrez, E., Cherubini, P., and Saracino, A.: Response of Pinus leucodermis to climate and anthropogenic activity in the National Park of Pollino (Basilicata, Southern Italy), Biol. Conserv., 137, 507–519, https://doi.org/10.1016/j.biocon.2007.03.010, 2007.
Véquaud, P., Derenne, S., Anquetil, C., Collin, S., Poulenard, J., Sabatier, P., and Huguet, A.: Influence of environmental parameters on the distribution of bacterial lipids in soils from the French Alps: Implications for paleo-reconstructions, Org. Geochem., 153, 104194, https://doi.org/10.1016/j.orggeochem.2021.104194, 2021.
Wakeham, S. G., Pease, T. K., and Benner, R.: Hydroxy fatty acids in marine dissolved organic matter as indicators of bacterial membrane material, Org. Geochem., 34, 857–868, https://doi.org/10.1016/S0146-6380(02)00189-4, 2003.
Wang, C., Bendle, J., Yang, Y., Yang, H., Sun, H., Huang, J., and Xie, S.: Impacts of pH and temperature on soil bacterial 3-hydroxy fatty acids: Development of novel terrestrial proxies, Org. Geochem., 94, 21–31, https://doi.org/10.1016/j.orggeochem.2016.01.010, 2016.
Wang, C., Bendle, J. A., Zhang, H., Yang, Y., Liu, D., Huang, J., Cui, J., and Xie, S.: Holocene temperature and hydrological changes reconstructed by bacterial 3-hydroxy fatty acids in a stalagmite from central China, Quat. Sci. Rev., 192, 97–105, https://doi.org/10.1016/j.quascirev.2018.05.030, 2018.
Wang, H., An, Z., Lu, H., Zhao, Z., and Liu, W.: Calibrating bacterial tetraether distributions towards in situ soil temperature and application to a loess-paleosol sequence, Quat. Sci. Rev., 231, 106172, https://doi.org/10.1016/j.quascirev.2020.106172, 2020.
Wang, J.-T., Cao, P., Hu, H.-W., Li, J., Han, L.-L., Zhang, L.-M., Zheng, Y.-M., and He, J.-Z.: Altitudinal Distribution Patterns of Soil Bacterial and Archaeal Communities Along Mt. Shegyla on the Tibetan Plateau, Microb. Ecol., 69, 135–145, https://doi.org/10.1007/s00248-014-0465-7, 2015.
Weber, Y., De Jonge, C., Rijpstra, W. I. C., Hopmans, E. C., Stadnitskaia, A., Schubert, C. J., Lehmann, M. F., Sinninghe Damsté, J. S., and Niemann, H.: Identification and carbon isotope composition of a novel branched GDGT isomer in lake sediments: Evidence for lacustrine branched GDGT production, Geochim. Cosmochim. Ac., 154, 118–129, https://doi.org/10.1016/j.gca.2015.01.032, 2015.
Weijers, J. W. H., Schouten, S., van den Donker, J. C., Hopmans, E. C., and Sinninghe Damsté, J. S.: Environmental controls on bacterial tetraether membrane lipid distribution in soils, Geochim. Cosmochim. Ac., 71, 703–713, https://doi.org/10.1016/j.gca.2006.10.003, 2007.
Weiss, B.: The decline of Late Bronze Age civilization as a possible response to climatic change, Clim. Change, 4, 173–198, https://doi.org/10.1007/BF00140587, 1982.
Whitaker, J., Ostle, N., Nottingham, A. T., Ccahuana, A., Salinas, N., Bardgett, R. D., Meir, P., and McNamara, N. P.: Microbial community composition explains soil respiration responses to changing carbon inputs along an Andes-to-Amazon elevation gradient, J. Ecol., 102, 1058–1071, https://doi.org/10.1111/1365-2745.12247, 2014.
Wilkinson, S. G.: Gram-negative bacteria, edited by: Ratledge, C., and Wilkinson, S. G., Microbial Lipids, Vol. 1. Academic Press, New York, 199–488, 1988.
Wollenweber, H. W. and Rietschel, E. T.: Analysis of lipopolysaccharide (lipid A) fatty acids, J. Microb. Meth., 11, 195–211, 1990.
Wollenweber, H.-W., Broady, K. W., Luderitz, O., and Rietschel, E. T.: The Chemical Structure of Lipid A, Europ. J. Biochem., 124, 191–198, https://doi.org/10.1111/j.1432-1033.1982.tb05924.x, 1982.
Yang, H., Lü, X., Ding, W., Lei, Y., Dang, X., and Xie, S.: The 6-methyl branched tetraethers significantly affect the performance of the methylation index (MBT') in soils from an altitudinal transect at Mount Shennongjia, Org. Geochem., 82, 42–53, https://doi.org/10.1016/j.orggeochem.2015.02.003, 2015.
Zelles, L.: Fatty acid patterns of phospholipids and lipopolysaccharides in the characterisation of microbial communities in soil: a review, Biol. Fertil Soils., 29, 111–129, https://doi.org/10.1007/s003740050533, 1999.