the Creative Commons Attribution 4.0 License.
the Creative Commons Attribution 4.0 License.
 | 06 Jul 2021
Organic phosphorus cycling may control grassland responses to nitrogen deposition: a long-term field manipulation and modelling study
Christopher R. Taylor
Victoria Janes-Bassett
Gareth K. Phoenix
Ben Keane
Iain P. Hartley
Jessica A. C. Davies
Ecosystems limited in phosphorous (P) are widespread, yet there is limited understanding of how these ecosystems may respond to anthropogenic deposition of nitrogen (N) and the interconnected effects on the biogeochemical cycling of carbon (C), N, and P. Here, we investigate the consequences of enhanced N addition for the C–N–P pools of two P-limited grasslands, one acidic and one limestone, occurring on contrasting soils, and we explore their responses to a long-term nutrient-manipulation experiment. We do this by combining data with an integrated C–N–P cycling model (N14CP). We explore the role of P-access mechanisms by allowing these to vary in the modelling framework and comparing model plant–soil C–N–P outputs to empirical data. Combinations of organic P access and inorganic P availability most closely representing empirical data were used to simulate the grasslands and quantify their temporal response to nutrient manipulation. The model suggested that access to organic P is a key determinant of grassland nutrient limitation and responses to experimental N and P manipulation. A high rate of organic P access allowed the acidic grassland to overcome N-induced P limitation, increasing biomass C input to soil and promoting soil organic carbon (SOC) sequestration in response to N addition. Conversely, poor accessibility of organic P for the limestone grassland meant N provision exacerbated P limitation and reduced biomass input to the soil, reducing soil carbon storage. Plant acquisition of organic P may therefore play an important role in reducing P limitation and determining responses to anthropogenic changes in nutrient availability. We conclude that grasslands differing in their access to organic P may respond to N deposition in contrasting ways, and where access is limited, soil organic carbon stocks could decline.
-
Please read the editorial note first before accessing the article.
-
Article
(1108 KB)
-
Supplement
(1007 KB)
-
Please read the editorial note first before accessing the article.
- Article
(1108 KB) - Full-text XML
-
Supplement
(1007 KB) - BibTeX
- EndNote


Grasslands represent up to a fifth of terrestrial net primary productivity (NPP) (Chapin et al., 2011) and potentially hold over 10 % of the total organic carbon stored within the biosphere (Jones and Donnelly, 2004). The ecosystem services provided by grasslands, such as carbon storage, are highly sensitive to perturbations in their nutrient cycling, including the perturbation of nitrogen (N) inputs from atmospheric deposition (Phoenix et al., 2012).
Since the onset of the industrial revolution, human activity has doubled the global cycling of N, with anthropogenic sources contributing 210 Tg of fixed N yr−1 to the global N cycle, surpassing naturally fixed N by 7 Tg N yr−1 (Fowler et al., 2013). Much of this additional N is deposited on terrestrial ecosystems from atmospheric sources. This magnitude of N deposition results in a range of negative impacts on ecosystems (including grasslands) such as reductions in biodiversity (Bobbink et al., 2010; Southon et al., 2013), acidification of soil, and the mobilisation of potentially toxic metals (Carroll et al., 2003; Horswill et al., 2008; Phoenix et al., 2012).
Despite large anthropogenic fluxes of N, most terrestrial ecosystems on temperate post-glacial soils are thought to be N-limited (biomass production is most restricted by N availability) (Vitousek and Howarth, 1991; Du et al., 2020), as weatherable sources of phosphorus (P) remain sufficiently large to meet plant P demand (Vitousek and Farrington, 1997; Menge et al., 2012). Both empirical and modelling studies have shown that pollutant N, when deposited on N-limited ecosystems, can increase productivity (Tipping et al., 2019) and soil organic carbon (SOC) storage (Tipping et al., 2017), largely as a result of stimulated plant growth. This suggests that while there are negative consequences of N deposition, there may also be benefits from enhanced plant productivity and increases in carbon sequestration.
Whilst most research focuses on N-limited ecosystems (LeBauer and Treseder, 2008), a number of studies have highlighted that P limitation and N–P co-limitation are just as prevalent, if not more widespread, than N limitation (Fay et al., 2015; Du et al., 2020; Hou et al., 2020). In a meta-analysis of grassland nutrient addition experiments spanning five continents, Fay et al. (2015) found that aboveground annual net primary productivity was limited by nutrients in 31 out of 42 sites, most commonly through co-limitation of N and P (Fay et al., 2015). Similarly, P additions in 652 field experiments increased aboveground plant productivity by an average of 34.9 % (Hou et al., 2020), and it is estimated that P limitation, alone or through co-limitation with N, could constrain up to 82 % of the natural terrestrial surface's productivity (Du et al., 2020).
Furthermore, P limitation may be exacerbated by N deposition (Johnson et al., 1999; Phoenix et al., 2004) or become increasingly prevalent as previously N-limited ecosystems transition to N-sufficient states (Goll et al., 2012). For example, in parts of the Peak District National Park, UK, N deposition has exceeded 3 g m−2 yr−1, with further experimental additions of 3.5 g m−2 yr−1 leading to decreases rather than increases in productivity of limestone grasslands (Carroll et al., 2003). This makes P limitation critical to understand in the context of global carbon and nutrient cycles. By definition, N deposition should impact P-limited ecosystems differently to N-limited ones, yet there is little understanding of how N deposition impacts these systems.
While N deposition may worsen P limitation in some instances, plant strategies for P acquisition may require substantial investments of N, suggesting that increased N supply may facilitate enhanced P uptake (Vance et al., 2003; Long et al., 2016; Chen et al., 2020). Indeed, previous work from long-term experimental grasslands has shown strong effects of N deposition on plant enzyme production (Johnson et al., 1999; Phoenix et al., 2004), whereby the production of additional extracellular phosphatase enzymes was stimulated. While it is not clear whether this response is driven by exacerbated P limitation resulting from N deposition or extra N availability making elevated enzyme production possible, such changes in plant physiology may promote cleaving of P from organic soil pools. Over time, the accumulation of plant-available P from organic sources may provide a mechanism by which plants exposed to high levels of N deposition may overcome P limitation (Chen et al., 2020).
By using the integrated C–N–P cycle model N14CP, Janes-Bassett et al. (2020) suggest that the role of organic P cycling in models may be poorly represented, as the model failed to simulate empirical yield data in agricultural soils with low P fertiliser input. Organic P access is therefore likely an important means of nutrient acquisition for plants in high-N and low-P soils (Chen et al., 2020), yet our understanding of organic P cycling in semi-natural ecosystems is fairly limited (Janes-Bassett et al., 2020). Such interdependencies of the C, N, and P cycles make understanding an ecosystem's response to perturbations in any one nutrient cycle challenging, particularly when ecosystems are not solely limited in N. This highlights the need for integrated understanding of plant–soil nutrient cycling across the C, N, and P cycles and in ecosystems that are not solely N-limited.
Process-based models have a role to play in addressing this, as they allow us to test our mechanistic understanding and decouple the effects of multiple drivers. There has been increasing interest in linking C with N and P cycles in terrestrial ecosystem models (Wang et al., 2010; Achat et al., 2016; Jiang et al., 2019) as the magnitude of the effects that anthropogenic nutrient change can have on biogeochemical cycling are realised (Yuan et al., 2018). Yet, few modelling studies have explicitly examined the effects of P limitation or the role of organic P access in determining nutrient limitation, likely mirroring the relatively fewer empirical studies of these systems.
By combining process-based models with empirical data from long-term nutrient-manipulation experiments, we may simultaneously improve our understanding of empirical nutrient limitation, the role(s) of organic P acquisition, and their interactions with anthropogenic nutrient pollution. In particular, this approach offers a valuable opportunity for understanding ecosystem responses to environmental changes that may only manifest after extended periods of time, such as with changes in soil organic C, N, and P pools, which typically occur on decadal timescales (Davies et al., 2016a; Janes-Bassett et al., 2020). Here, we combine new data from a long-term nutrient manipulation experiment on two P-limited upland grasslands (acidic and limestone) occurring on contrasting soils, with the mechanistic C–N–P plant–soil biogeochemical model N14CP (Davies et al., 2016b).
We use these experimental data to explore the role of organic P access in determining ecosystem nutrient limitation and grassland responses to long-term nutrient manipulations. Specifically, we aim to explore how variation in P acquisition parameters, which control access to organic and inorganic sources of P in the model, may help account for differing responses of empirical grassland C, N, and P pools to N and P additions. Second, we explore the effects of long-term anthropogenic N deposition and experimental N and P additions on plant and soil variables of the simulated acidic and limestone grasslands. This will help improve our understanding of organic P process attribution within the model and may suggest how similarly nutrient-limited grasslands could respond to similar conditions.
We hypothesise that (1) access to organic P will be an important determinant of ecosystem nutrient limitation, (2) increased organic P availability may alleviate P limitation resulting from N deposition, and (3) grasslands capable of accessing sufficient P from organic forms may overcome P limitation resulting from N deposition and nutrient treatments, whereas grasslands lacking such accessibility will not.
2.1 Field experiment description
The empirical data are from Wardlow Hay Cop (henceforth referred to as Wardlow), a long-term experimental grassland site in the Peak District National Park (UK) (Morecroft et al., 1994). Details of empirical data collection are available in Supplement Sect. S1. There are two distinct grassland communities occurring in close proximity: acidic (National vegetation classification U4e) and limestone (NVC CG2d) semi-natural grasslands (Table S2). Both grasslands share a carboniferous limestone hill, but the limestone grassland sits atop a thin humic ranker (Horswill et al., 2008) and occurs predominantly on the hill brow. In contrast, the acidic grassland occurs in the trough of the hill, allowing the accumulation of windblown loess and the formation of a deeper soil profile of a palaeo-argillic brown earth (Horswill et al., 2008).
Despite contrasting soil types, both the acidic and limestone grasslands are largely P-limited (Morecroft et al., 1994; Carroll et al., 2003), though occasional N and P co-limitation can occur (Phoenix et al., 2003), and more recently, positive growth responses in solely N-treated plots have been observed, in line with the latest understanding that long-term N loading may increase P supply by increasing phosphatase enzyme activity (Johnson et al. 1999; Phoenix et al.2004; Chen et al. 2020).
Nutrients (N and P) have been experimentally added to investigate the effects of elevated N deposition and the influence of P limitation (Morecroft et al., 1994). Nitrogen treatments simulate additional N deposition to the background level, and the P treatment acts to alleviate P limitation. Nutrients are added as solutions of distilled water and applied as fine spray by backpack sprayer and have been applied monthly since 1995, and since 2017 bi-monthly. Nutrient additions are in the form of NH4NO3 for nitrogen and NaH2PO4 for phosphorus. Nitrogen is applied at rates of 0 (distilled water control – 0N), 3.5 (low nitrogen – LN), and 14 g N m−2 yr−1 (high nitrogen – HN). The P treatment is applied at a rate of 3.5 g P m−2 yr−1 (phosphorus – P).
Data collected from the Wardlow grasslands for the purpose of this work are aboveground biomass C, SOC, and total N, which is assumed to be equivalent to modelled SON. These new data are combined with total P data that were collected by Horswill et al. (2008) at the site (Horswill et al., 2008). Summaries of these data are available within the Supplement (Table S1), and details of their collection and conversion to model-compatible units are in Supplement Sect. S1.
2.2 Summary of model processes
2.2.1 N14CP model summary
The N14CP ecosystem model is an integrated C–N–P biogeochemical cycle model that simulates net primary productivity (NPP); C, N, and P flows and stocks between and within plant biomass and soils, and their associated fluxes to the atmosphere and leachates (Davies et al., 2016b). N14CP was originally developed and tested on 88 northern Europe plot-scale studies, including grasslands, where C, N, and P data were available. All but one of the tested ecosystems exhibited N limitation (Davies et al., 2016b). It has also been extensively and successfully blind-tested against SOC (Tipping et al., 2017) and NPP data from unimproved grassland sites across the UK (Tipping et al., 2019).
However, N14CP has not been extensively tested against sites known to exhibit P limitation, especially where these are explicitly manipulated by long-term experimental treatments. While the importance of modelled weatherable P (PWeath0) and historic N deposition on N-limited C, N, and P has been investigated (Davies et al., 2016b), the potential influence of organic P on ecosystem nutrient limitation and responses to nutrient perturbations have yet to be explored.
Here, we modify N14CP to add experimental N and P additions to simulate a long-term nutrient manipulation experiment similar to that at the limestone and acidic grasslands at Wardlow, and we use empirical data from Wardlow to explore the role of organic P cleaving in determining ecosystem state. A full model description can be found in Davies et al. (2016b); however, a summary of the most relevant features is given here for convenience.
2.2.2 Net primary productivity and nutrient limitations
Plant biomass is simulated in the model as two sets of pools of coarse and fine tissues representing both above and belowground plant C, N, and P, with belowground biomass for each plant functional type represented by a root fraction. NPP adds to these on a quarterly basis with growth occurring in quarters 2 and 3 (spring and summer). In N14CP, NPP depends on a single limiting factor, in accordance with Liebig's law of the minimum. The factors that can limit growth in the model include available N and P, temperature, or precipitation, the latter two being provided as input driver data (see Sect. 2.3.2).
First, the potential maximum NPP limited by climate is calculated using regression techniques, as in Tipping et al. (2014). The corresponding plant demand for N and P to achieve this potential NPP is then calculated (Davies et al., 2016b; Tipping et al., 2017). This demand is defined by plant functional type stoichiometry, which changes through time in accordance with ecosystem succession (see Sect. 2.3.2). Stoichiometry of coarse tissue is constant, but the fine tissue of each plant functional type has two stoichiometric end members. This allows the model to represent transitions from N-poor to N-rich plant communities or an enrichment of the fine tissues within plants (or a combination of both) (Davies et al., 2016b), dependent on available N. This allows a degree of flexibility in plant C : N ratios in response to environmental changes such as N deposition. If the available nutrients cannot meet the calculated plant nutrient demand, the minimum calculated NPP based on either N or P availability is used, giving an estimation of the most limiting nutrient to plant growth.
Nutrient co-limiting behaviour can occur in the model through increased access to organic P sources in the presence of sufficient N (see Sect. 2.2.3) and by having the rate of N fixation dependent on plant- and microbial-available P (Davies et al., 2016b). The initial rate of N fixation is based on literature values for a given plant functional type and is downregulated by anthropogenic N deposition but not soil N content more generally, as it is assumed that atmospherically deposited N is readily available to N fixers. Nitrogen fixation in the model is also related to P availability. The degree to which P availability limits this maximum rate of fixation is determined by a constant, KNfix (Davies et al., 2016b). This means that while modelled NPP is limited by availability of a single nutrient, co-limitation may occur through P limitation of N fixation (Danger et al., 2008).
2.2.3 Plant and soil N and P cycling
A simplified summary of key pools and processes regarding plant–soil nutrient cycling is detailed in Fig. 1. Details such as initial base cation pools, their effects on soil pH, and most parameter names have been omitted for clarity but are available from the original model development study (Davies et al., 2016b). Key changes for the purpose of this work are highlighted in red.
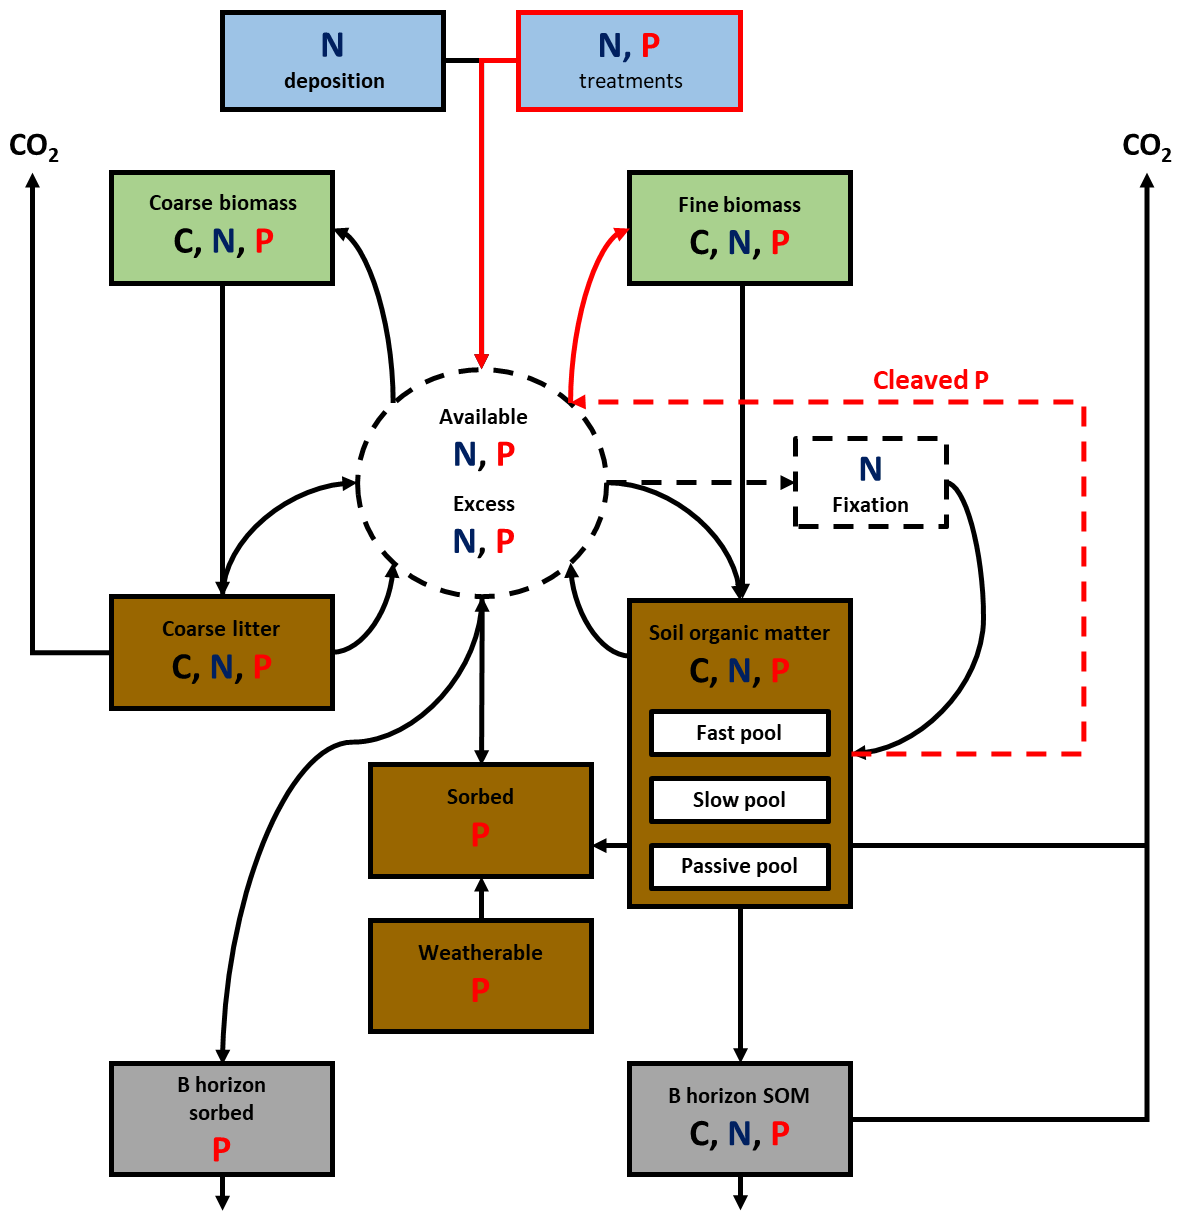
Figure 1A simplified schematic of the key flows and pools of C, N, and P within N14CP, adapted from the full schematic available in Davies et al. (2016b). Red lines highlight modifications to N14CP for the purpose of this work, including adding experimental nutrients and allowing uptake of cleaved P to be more flexible. Solid lines indicate input to another pool, and a dashed line indicates either a feedback or interaction with another pool. In the model, N can enter the available pool via atmospheric deposition, nutrient treatments, biological fixation, and decomposition of coarse litter and SOM. For P, the two main sources are the inorganic sorbed pool and the turnover of SOM. The former is derived initially from the weatherable supply of P, defined by its initial condition (PWeath0). P can also be added to this pool experimentally as with N. The dashed line going from available N and P to N fixation represents the downregulation of N fixation by N deposition and the dependency of N fixation on P availability. The cleaving of organic P from SOM and its incorporation into the plant-available nutrient pool are represented by the dashed red line and its uptake by plants, determined by PCleaveMax, shown with a solid red line.
Plant-available N is derived from biological fixation, the decomposition of coarse litter and soil organic matter (SOM), atmospheric deposition, and direct N application. Fine plant litter enters the SOM pool directly due to its rapid rate of turnover whereas coarse litter contributes N and P through decomposition and does not join the SOM pool. Plant-available P also comes from SOM and coarse litter decomposition, direct treatment, desorption of inorganic P from soil surfaces, and sometimes cleaving of organic P (Davies et al., 2016b). The sorbed inorganic P pool builds over time with inputs of weathered P and sorption of any excess plant-available inorganic P, and desorption occurs as a first-order process.
Phosphorus enters the plant-soil system by weathering of parent material, the initial value of which (PWeath0 within the model) can be set to a default value or made site-specific by calibrating this initial condition to soil observational data (as in Sect. 2.3.3). From this initial pool, annual releases of weathered P are determined by first-order rate constants that are temperature dependent, with the assumption that no weathering occurs below 0 ∘C. This weathered P can then contribute toward plant-available P in soil water or be sorbed to soil surfaces. In principle, P can be added in small quantities by atmospheric deposition (Ridame and Guieu, 2002), but for the purpose of this work, P deposition is set to zero in the model. While the contribution of P through atmospheric deposition is increasingly realised (Aciego et al., 2017), we cannot account for the losses of P that may also occur through landscape redistribution (Tipping et al., 2014).
The size of the available P pool is determined by summing: P retained within plant biomass prior to litterfall, inorganic P from decomposition, dissolved organic P, and P cleaved from SOP by plants. Accessibility of each P form is determined by a hierarchal relationship in the order mentioned above, whereby plants and microbes access the most readily available P sources first and only move on to the next once it has been exhausted.
When N is in sufficient supply and more bioavailable P forms have been exhausted from the total available pool, simulated plants can access P from SOM via an implicit representation of extracellular P-cleaving enzymes with a parameter termed PCleave. While empirical data quantifying this parameter are scarce, N14CP constrains PCleave by utilising a maximum SOM C : P ratio, (C : P)fixlim, that ensures SOM stoichiometry is not unrealistically disrupted by excessive removal of organic P (Eq. 1).
The functioning of the PCleave parameter, including its stoichiometric constraint, remains the same in this work, but we have introduced a modifier to adjust the rate at which plants can access this P source. This parameter, PCleaveMax, represents the maximum amount (g m−2 per season) of cleaved P that plants can acquire from the available P pool to satiate P demand.
A fraction of plant biomass is converted to litter in each quarterly time step and contributes a proportion of its C, N, and P content to SOM, which is sectioned intro three pools (fast, slow, and passive) depending on turnover rate (Davies et al., 2016b). Soil organic P (SOP) is simulated alongside SOC and SON using C : N : P stoichiometries of coarse and fine plant biomass. Decomposition of SOP, and its contribution to the available P pool, is subject to the same turnover rate constants as for SOC and SON.
Carbon is lost as CO2 following temperature-dependent decomposition and as dissolved organic carbon. Likewise, N and P are lost via dissolved organic N and P in a proportion consistent with the stoichiometry of each SOM pool. Inorganic N is lost via denitrification, and inorganic P can be sorbed by soil surfaces. Both inorganic N and P can be leached in dissolved forms if they are in excess of plant demand.
2.3 Simulating the field manipulation experiment with the model
We use data from the Wardlow limestone and acidic grasslands to explore the potential role organic P access may have in determining grassland nutrient limitation when exposed to long-term N deposition and more recently experimental nutrient manipulation. We use environmental input data collated from Wardlow to drive model processes. Empirical data regarding contemporary soil C, N, and P for the contrasting grasslands are used to calibrate the initial size of the weatherable P pool within the model and to allow access to organic cleaved P to vary to account for patterns in the data. We do not aim to perfectly replicate the Wardlow grasslands but rather use the unique opportunity that Wardlow provides to test our understanding of such P-limited ecosystems and how our conceptualisation of P-access mechanisms within the model may affect them. In addition, we can use the model-simulated grasslands to investigate the potential effects of long-term N deposition and nutrient manipulation on ecosystems which may differ in their relative availability of different P forms.
2.3.1 Nutrient applications
Nutrient treatments are treated in N14CP as individual plots in the simulations with differing amounts of inorganic N and P applied in line with the field experimental treatments (Sect. 2.1). The N and P treatments are added to the bioavailable N and P pools of the model on a quarterly basis in line with the model's time step. While Wardlow nutrient treatments are applied monthly and N14CP quarterly, the annual sum of applied N or P is equivalent, and nutrients are applied during all quarters.
2.3.2 Input drivers
N14CP simulations run on a quarterly time step and are spun up from the onset of the Holocene (10 000 BP in the model). This is to capture the length of time required for soil formation following deglaciation in northwest Europe and is not an attempt to truly model this long-term period. Instead, it allows us to form initial conditions for modern-day simulations that take in what we know about the site's history and forcings.
To use this spin-up phase and simulate contemporary soil C, N, and P stocks, we use a variety of input driver data. Inputs closer to the present are more accurately defined based on site-scale measurements, and assumptions are made regarding past conditions. This approach of spinning up to present-day observations avoids the assumption that ecosystems are in a state of equilibrium, which is likely inaccurate for ecosystems exposed to long-term anthropogenic changes in C, N, and P availability. Input driver data include plant functional type history, climatic data, and N deposition data. A summary of the data used for model input is provided in Supplement Table S3. To simulate the sites' plant functional type history, we used data on Holocene pollen stratigraphy of the White Peak region of Derbyshire (Taylor et al., 1994), which captures important information regarding Wardlow's land-use history for the entire duration of the model spin-up phase.
Input drivers are provided as annual time series to drive the model, and as the acidic and limestone sites are co-located, these input time series are shared for both grasslands. It is assumed in the model that anthropogenic N deposition was negligible prior to 1800 and the onset of the industrial revolution. After 1800, N deposition is assumed to have increased similarly across Europe (Schöpp et al., 2003). In N14CP, this trend is linearly extrapolated from the first year of data (1880) back to 1800 (Tipping et al., 2012). Data regarding N deposition that are specific to Wardlow were incorporated between the years 2004 and 2014, and the Schöpp et al. (2003) anomaly was scaled to represent the high N deposition of the site.
To provide climate forcing data, daily minimum, mean, and maximum temperature and mean precipitation records beginning in 1960 were extracted from the UKPC09 Met office CEDA database (Table S3). The data closest to Wardlow were calculated by triangulating latitude and longitude data and using Pythagoras' theorem to determine the shortest distance. These data were converted into mean quarterly temperature and precipitation. Prior to this, temperature was assumed to follow trends described in Davies et al. (2016b), and mean quarterly precipitation was derived from Met Office rainfall data between 1960 and 2016 and held constant.
2.3.3 Model parameters for the acidic and limestone grasslands
The N14CP model has been previously calibrated and tested against a wide range of site data to provide a general parameter set that is applicable to temperate semi-natural ecosystems, without extensive site-specific calibration (Davies et al., 2016b). The majority of those parameters are used here for both grasslands. However, two parameters relating to P sources and processes were allowed to vary between the sites: the initial condition for the weatherable P pool, PWeath0, and the rate of plant access to organic P sources, PCleaveMax (Fig. 1). We allowed PWeath0 to vary for each grassland as variation in a number of factors including lithology and topography means that we should expect the flux of weathered P entering the plant–soil system to vary on a site-by-site basis (Davies et al., 2016b). Indeed, we should expect that PWeath0 differs between the acid and limestone grasslands, as despite their proximity, they have differing lithology. Davies et al. (2016b), show that variation in this initial condition considerably helps explain variance in contemporary SOC, SON, and SOP stocks between sites. However, it is difficult to set this parameter directly using empirical data, as information on lithology and P release is limited at the site scale.
As this is the first time that N14CP has been knowingly applied to ecosystems of a largely P-limited nature, we also allowed the maximum rate at which plants could access cleaved P (PCleaveMax) to vary, to investigate how plant P acquisition might change when more readily accessible P forms become scarcer. Empirical quantification of organic P access is poor (Janes-Bassett et al., 2020); hence we use a similar data-driven calibration for PCleaveMax as we do for PWeath0.
We ran a series of simulations systematically varying PWeath0 and PCleaveMax and comparing the results to observations. We simulated the two grasslands and their treatment blocks with a set of 200 parameter combinations. This captured all combinations of 20 values of PWeath0 between 50 and 1000 g m−2 and 10 values of PCleaveMax between 0 and 1 g m−2 per growing season using a log10 spacing to focus on the lower range of PCleaveMax values. The PWeath0 range was set to capture the lower end of PWeath0 estimates described in Davies et al. (2016b), which were more likely to be appropriate for these P-poor sites. We explored a range of values for PCleaveMax, from zero where no access to organic sources is allowed to 1 g m−2 per growing season – a rate on the order of magnitude of a fertiliser application.
The model outputs were compared to measured, SOC, SON, and total P (Table S4) for each grassland. We tested how these parameter sets performed by calculating the error between the observations and model outputs of the same variables for each combination of PCleaveMax and PWeath0. The sum of the absolute errors between modelled and observed soil C, N, and P data was scaled (to account for differing numbers of observations) and summed to provide an F value (Eq. 2) as an overall measure of error across multiple observation variables.
Plant biomass C data were excluded from the cost function to allow for blind testing of the model's performance against empirical observations. As the variable most responsive to nutrient additions, in terms of both rapidity and magnitude of the response, we deemed these the most rigorous data to use for separate testing. We included soil C, N, and P data from all nutrient treatments rather than just the control to ensure that the selected parameter combination could better account for patterns in empirical data. For instance, we know that empirical N treatments can increase plant and soil enzyme activity in both Wardlow grasslands (Johnson et al., 1999; Phoenix et al., 2004; Keane et al., 2020), which a calibration to control-only data may not have captured.
While the cost function is a useful tool in allowing the model to simulate the magnitude of contemporary C, N, and P pools, it does not allow us to capture all necessary information to accurately simulate grassland responses to long-term nutrient manipulation. The pattern of grassland response, i.e. how a variable responds to nutrient treatment, is an important consideration and is determined in the model by the most limiting nutrient. Consequently, the parameter combination with the lowest F value that still maintained a grassland's empirical response to nutrient additions, was used within the analysis.
Below, we first present data regarding the results of the calibration of PWeath0 and PCleaveMax for each grassland and how simulated grassland C, N, and P using these parameter combinations compares to the empirical data (Sect. 3.1, Fig. 2). Raw empirical data are available in Table S1 in Sect. 2 of the Supplement. Second, we explore how the limiting nutrient of the modelled grasslands has changed through time in response to N deposition and experimental treatment (Sect. 3.2, Fig. 3). Third, we explore how C, N, and P pools in the simulated grasslands have responded to N deposition and nutrient treatment within the model and include empirical data to contextualise changes (Sect. 3.3, Fig. 4). Finally, we present the C, N, and P budgets for both modelled grasslands to examine changes in C, N, and P pools more closely, in order to better our mechanistic understanding of changes in nutrient flows within the model (Sect. 3.3, Fig. 5).
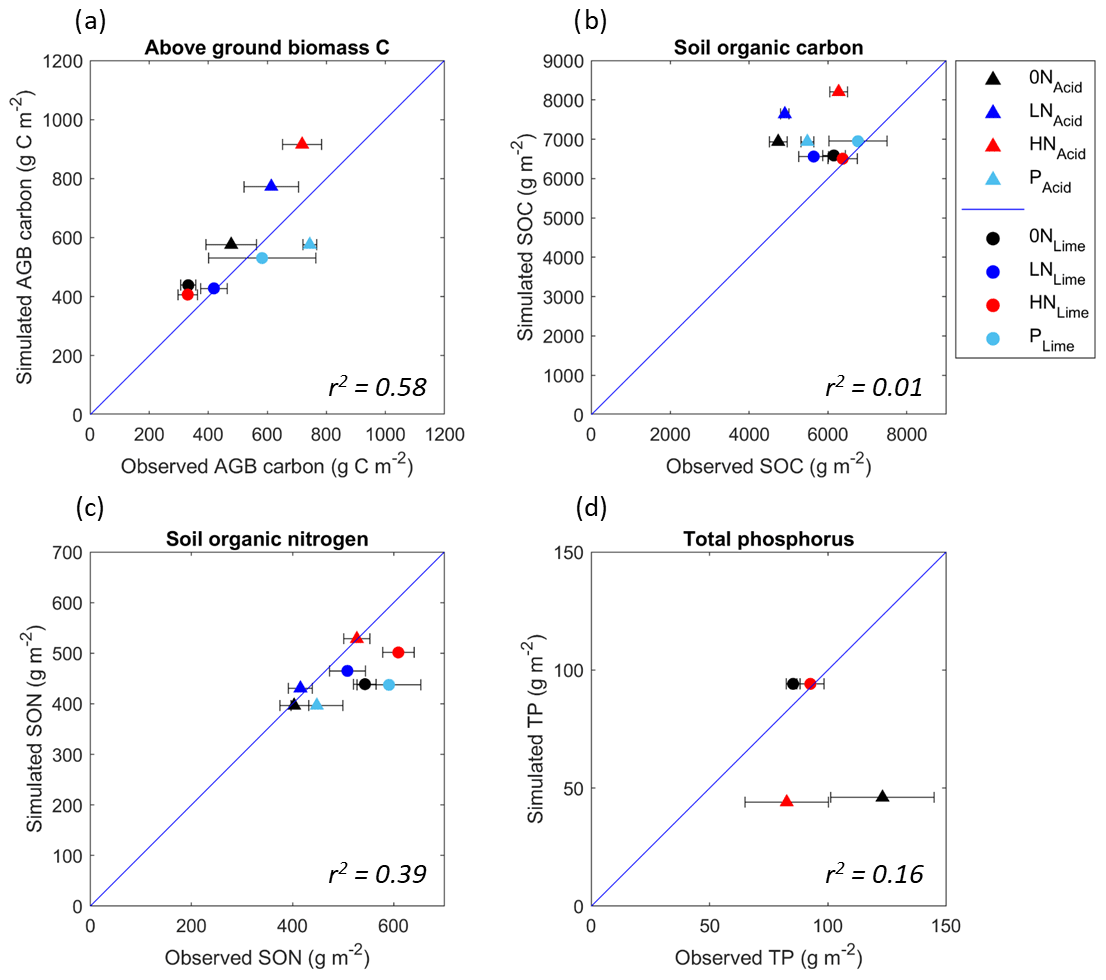
Figure 2A comparison of the observed values of (a) aboveground biomass carbon, (b) soil organic carbon, (c) soil organic nitrogen, and (d) total soil phosphorus from both grasslands, with simulated values from the model. The blue line represents a 1-to-1 relationship, and the closer the data points are to the line, the smaller the discrepancy between observed and modelled data. All data are in grams per metre squared, and all treatments for which data were collected are presented. The horizontal error bars represent the standard error of the empirical data means. The r2 value of regression models fitted to the data gives an overall indication of the direction of response of each variable to nutrient addition; hence a low value is not necessarily indicative of poor model fit.
3.1 Varying phosphorus source parameters
The model calibration selected parameter values for PWeath0 and PCleaveMax that indicate contrasting use of P sources by the two simulated grasslands, with the acidic grassland capable of acquiring more P from organic sources having a PCleaveMax value of 0.32 g m−2 per season compared to the limestone, with a value 10 times smaller at 0.03 g m−2 per season. Conversely, inorganic P availability was greater in the limestone grassland due to the larger weatherable pool of P, PWeath0, at 300 g m−2 compared to 150 g m−2 in the acidic grassland.
The selected parameter combinations resulted in the model simulating the acidic grassland as N-limited and the limestone as P-limited, with reasonable congruence between observed and modelled data. The outputs for the calibrated model are shown in Fig. 2 against the observations for above-ground biomass C, soil organic C, N, and total phosphorous (TP) for both the acidic and limestone grasslands (Fig. 2). Raw data used for Fig. 2 are provided in Supplement Tables S4 and S5.
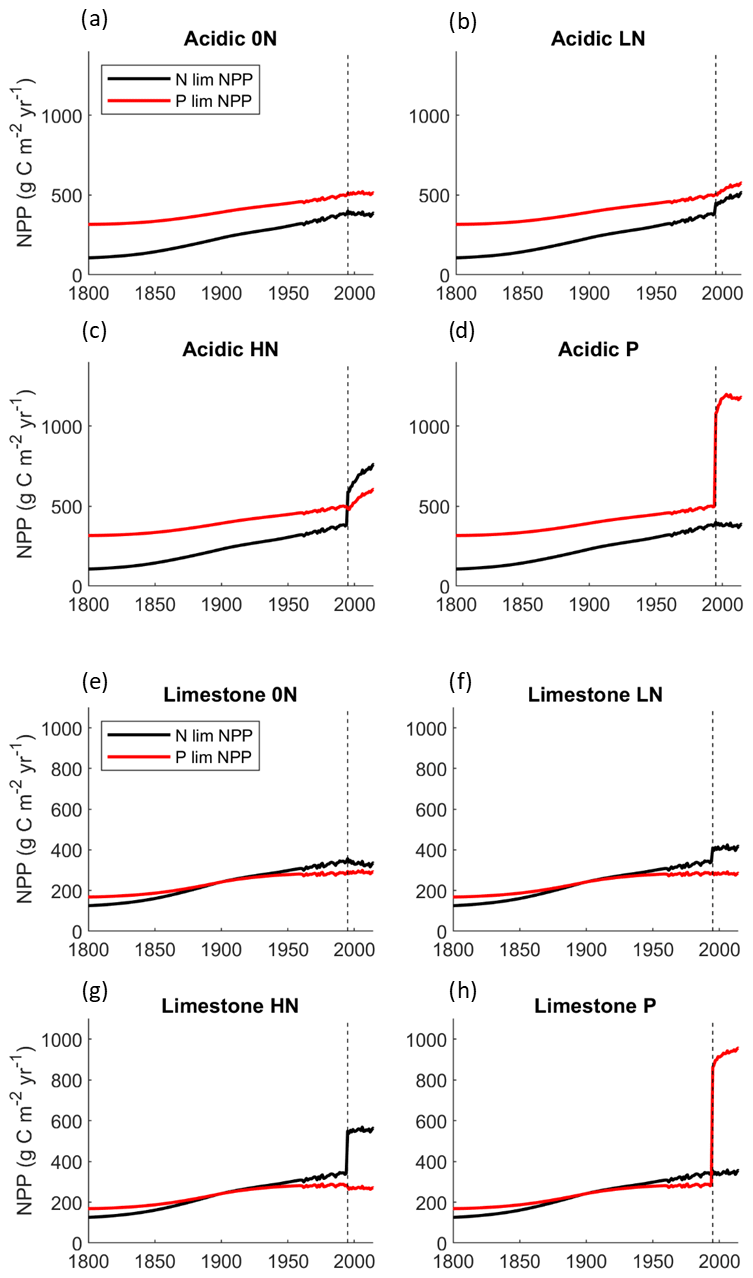
Figure 3Plots showing the nutrient most limiting productivity for all nutrient treatments in both simulated grasslands. The vertical dashed line is the year of the first nutrient addition within the model (1995). The value of the lines represents the maximum amount of productivity attainable given the availability of N and P separately. Due to Liebig's law of the minimum approach to plant growth, it is the lowest of the two lines that dictates the limiting nutrient of the grassland and represents actual modelled productivity. Where lines share a value, it can be considered in a state of N–P co-limitation.
Overall, N14CP more accurately simulated the magnitude of limestone grassland C, N, and P pools than the acidic grassland, and it generally captured the pattern of responses to nutrient treatment, albeit this is not always supported by high r2 values. The model estimates of above-ground biomass C are broadly aligned with the observations: capturing variation between the grasslands and treatments (r2=0.58) and on average overestimating the magnitude by 12.9 % (SE ± 11.9) and 12.1 % (SE ± 9.4) for the acidic and limestone grasslands respectively (Fig. 2a).
Soil organic C on average was slightly overestimated (7.1 % with SE ± 3.3) for the limestone grassland (Fig. 2b), with a larger average overestimate for the acidic grassland (39.9 % with SE ± 6.8). However, in this latter case the variation between treatments was better captured. Despite a low r2 value for SOC (0.01), the model broadly captured the patterns we observe in the empirical data, with N addition increasing SOC in the acidic grassland and P addition increasing SOC in the limestone grassland. However, the intermediate increase in SOC with P in the acidic grassland is not captured by the model, nor is the magnitude of the negative effect of LN treatment on limestone SOC.
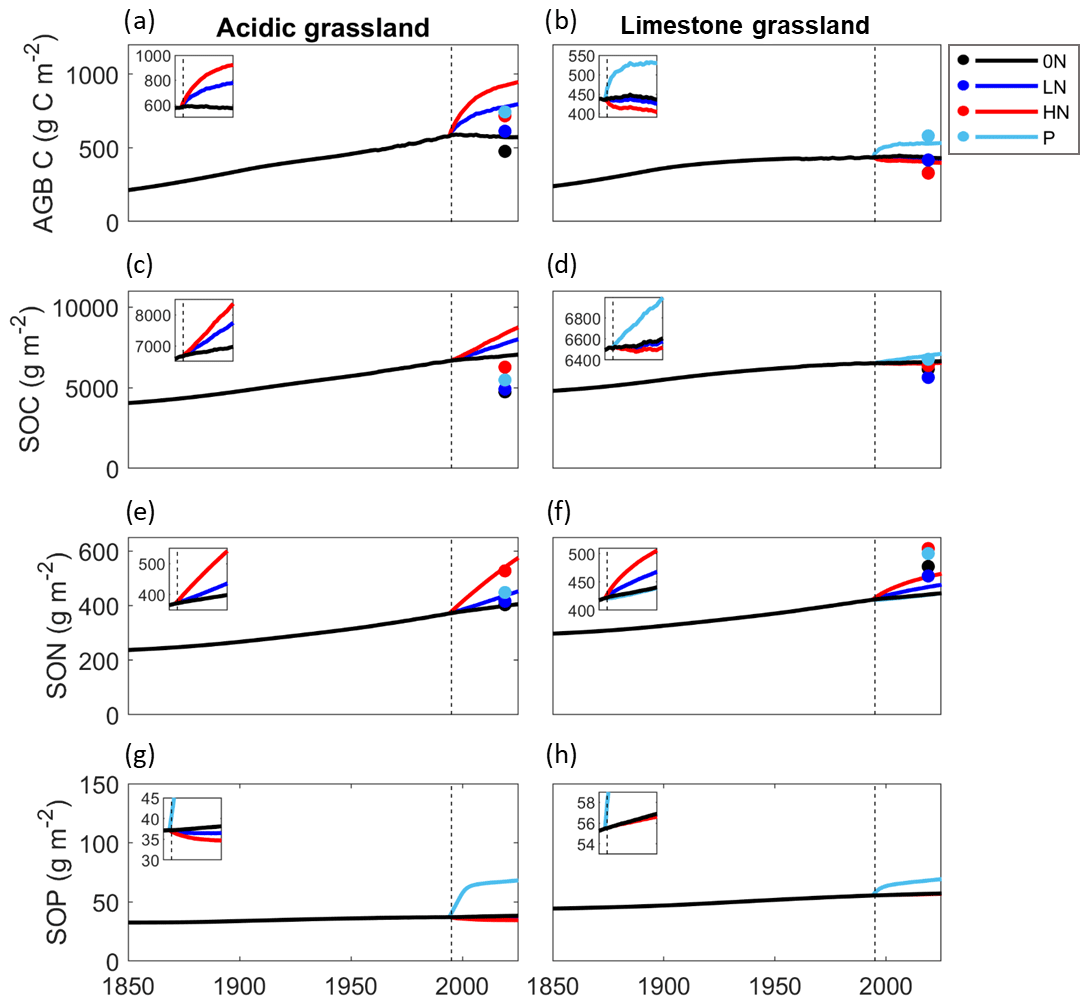
Figure 4Time series plots of aboveground biomass C and soil organic C, N, and P for the acidic (panels a, c, e, and g respectively) and limestone modelled grasslands (panels b, d, f, and h respectively). The vertical dashed line represents the first year of nutrient addition (1995) and marks the beginning of the experimental period. The inset subplots focus on this experimental period (1995–2020) and highlight changes occurring as a result of nutrient additions rather than background N deposition. All nutrient treatments at Wardlow are represented in all panels, though not all lines are visible if they do not differ from 0N. Both grasslands share a y axis. Empirical data from Fig. 2 are plotted on the respective panels, with the exception of panels g and h, where empirical data are incompatible with modelled data (total P versus organic P).
Simulated magnitudes of SON are well-aligned with observations for the acidic grassland, with an average error of 2.3 % (SE ± 3.2), whilst SON for the limestone grassland was on average underestimated by 17.8 % (SE ± 3.6) (Fig. 2c). The variation between treatments was better captured for acidic than limestone SON but was overall reasonable (r2 = 0.39).
Finally, the model overestimated TP (defined in the model as organic P plus sorbed P) by an average of 6.0 % (SE ± 4.3) for the limestone but underestimated by 54.7 % (SE ± 8.0) in the acidic grassland, which was the least accurately predicted variable out of those investigated (Fig. 2d). With only two empirical data points for TP across only two nutrient treatments, it is difficult to discern the relationship between treatments and TP, so an r2 value is of little relevance here.
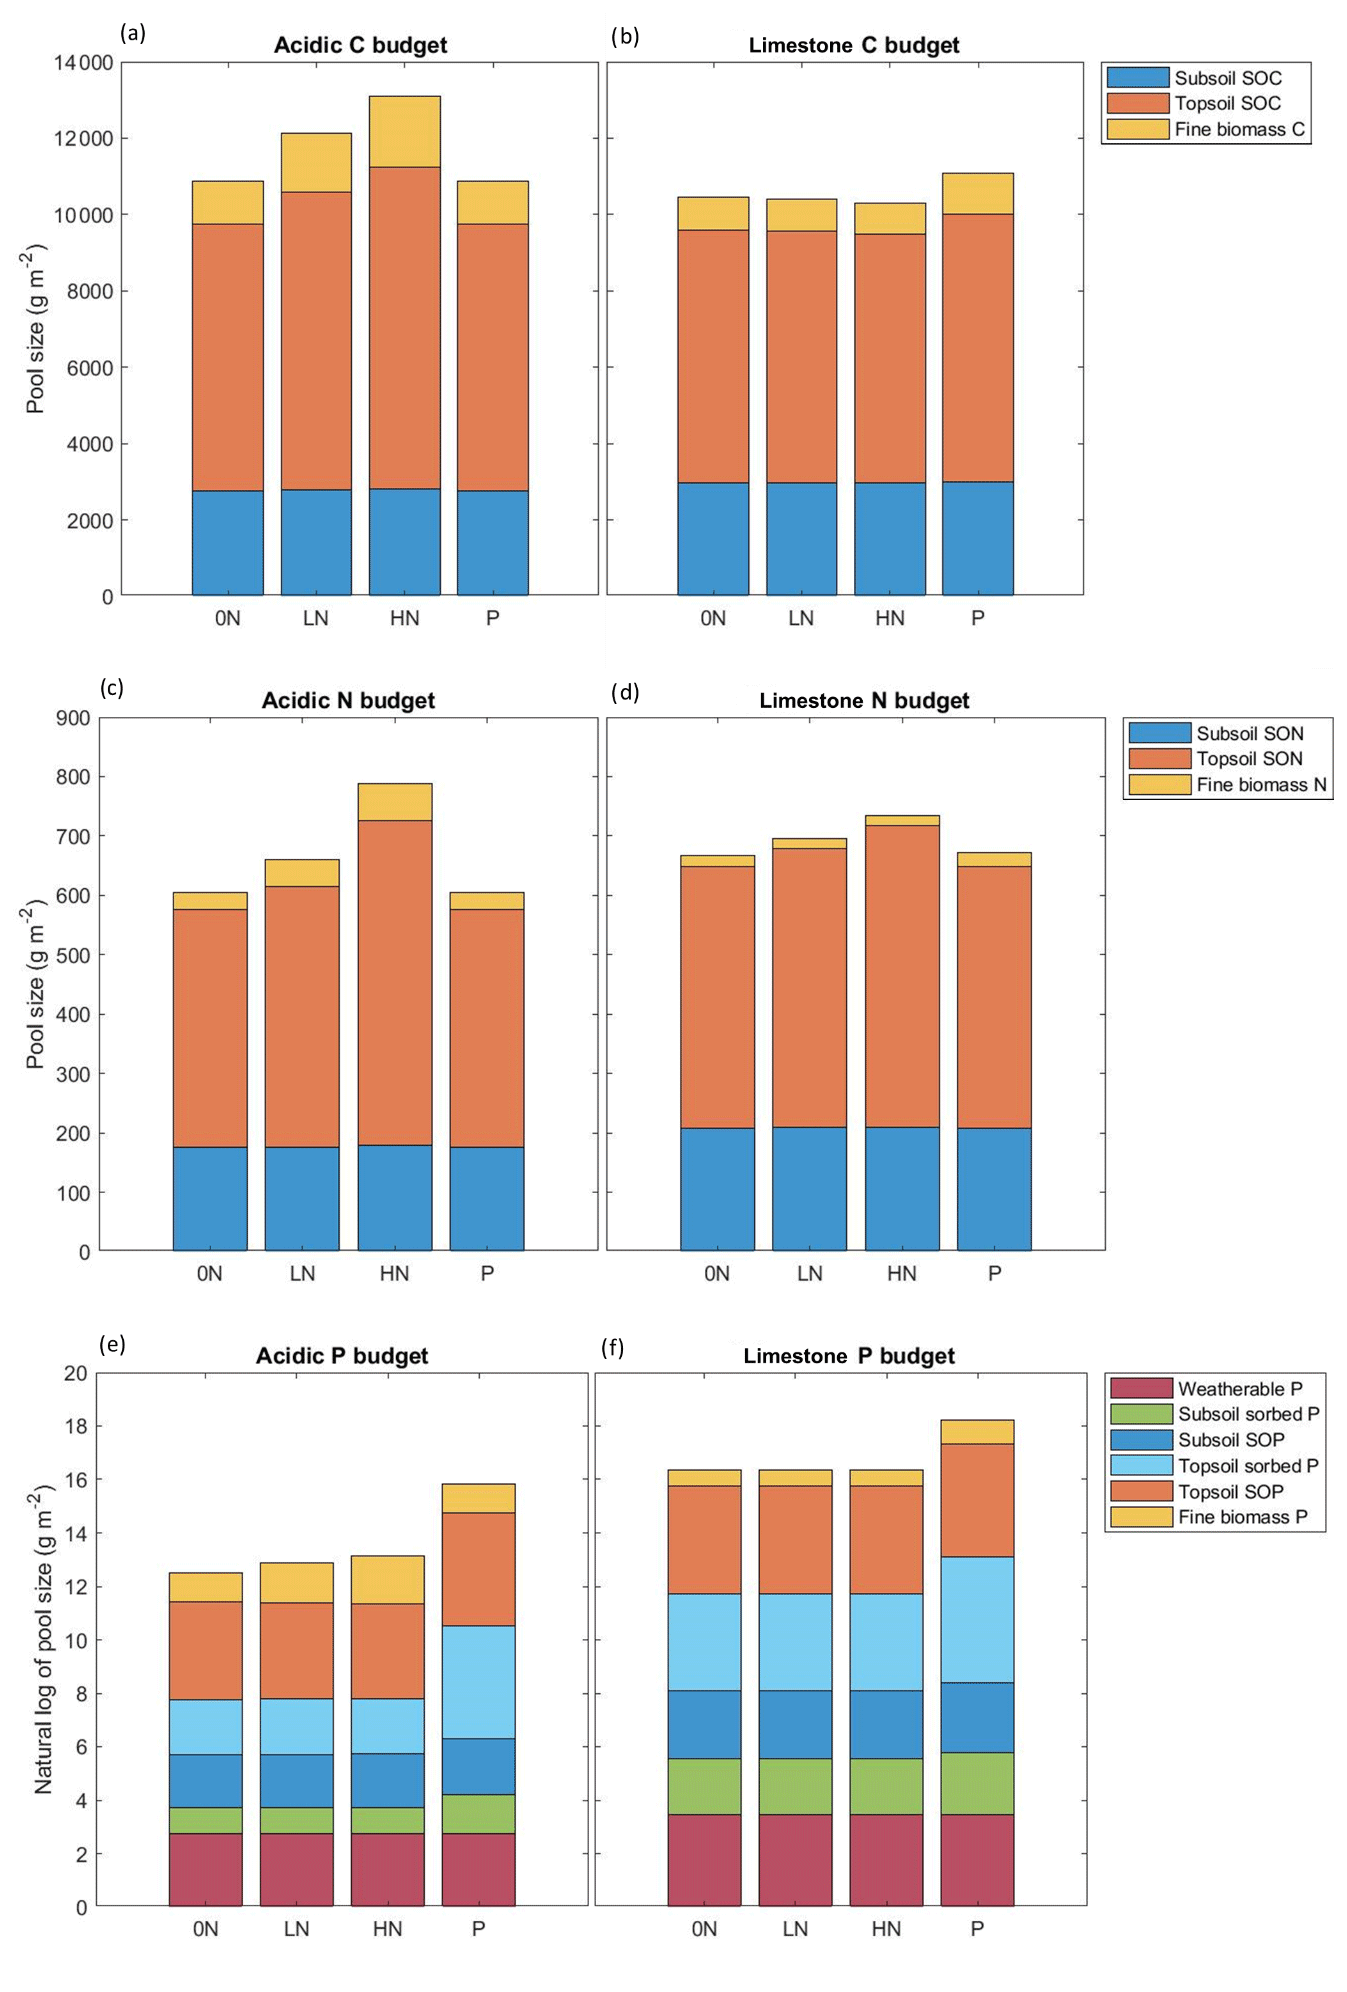
Figure 5Modelled C, N, and P budgets for the acidic (panels a, c, and e) and limestone (panels b, d, f) grasslands for the year 2020. Modelled sizes of C and N pools are in grams per metre squared, and P pools are presented as the natural log of grams per metre squared. Temporary pools such as available N and P and fixed N are not presented here to avoid “double counting” in other pools, and wood litter C, N, and P are not presented due to their negligible sizes.
3.2 The limiting nutrient through time
Modelled acid grassland NPP remained N-limited from 1800 through to 2020 under most nutrient treatments (Fig. 3). Nitrogen deposition increased the potential NPP through time, and the grassland moved toward co-limitation in the LN treatment (i.e. the N and P lines were closer) but remained N-limited (Fig. 3b). In the HN treatment, the acidic grassland shifted to P limitation as N-limited NPP surpasses P-limited NPP (Fig. 3c).
The simulated limestone grassland was also initially N-limited but was driven through a prolonged (ca. 100 years) state of apparent co-limitation until clearly reaching P limitation in 1950, solely as a result of N deposition (Fig. 3). In the 0N treatment, the grassland remained P-limited, but the potential NPP values for N and P are similar, suggesting the grassland is close to co-limitation (Fig. 3e). The LN and HN treatment amplified pre-existing P limitation, lowering the potential NPP of the grasslands (Fig. 3f, g). With the addition of P in 1995, P limitation is alleviated, and the ecosystem transitions to a more productive N-limited grassland (Fig. 3h).
Another way to interpret the extent of nutrient limitation within N14CP with specific reference to P demand is to assess the rate of P cleaving through time. These data corroborate the N and P-limited NPP data, showing that in the limestone grassland, the maximum amount of cleavable P is accessed by plants in the 0N, LN, and HN treatments from approximately 1900 through to the end of the experimental period in 2020 (Fig. S1, Table S13), highlighting its consistent state of P limitation.
Conversely, while cleaved P is used in the 0N treatment in the acidic grassland, it occurs at approximately one-third of the total rate; hence the grassland is not entirely P-limited (Fig. S1, Table S9). The LN treatment increases the rate of access to cleaved P, and HN causes it to reach its maximum value, confirming the shift to P limitation suggested by the NPP data (Fig. S1, Table S9). Soil organic P cleaving does not occur in the P-treated plots of either grassland.
3.3 Modelled trends and responses to nutrient additions
The model allows the temporal trends and responses to nutrient additions to be further explored. Figure 4 provides the temporal responses for the treatments and Fig. 5 a full nutrient budget for the year 2020. Full data for changes in soil C, N, and P and plant biomass C pools since the onset of large-scale N deposition (1800 within the model) for both grasslands are included in Supplement Table S14. All data used for determining responses of biomass C and soil organic C, N, and P pools to experimental nutrient additions are in Supplement Tables S15 (acidic) and S16 (limestone).
3.3.1 Acidic grassland
The modelled time series suggest that in the 0N (control) treatment for the acidic grassland, background levels of atmospheric N deposition between the period 1800–2020 resulted in an almost 4-fold increase in biomass C, a near-2-fold increase in SOC and SON, and an increase in the size of the SOP pool by almost a fifth (Fig. 4).
Since initiated in 1995, all C and N pools responded positively to N but not P treatments (Fig. 5a, c, Tables S7, S8). The LN and HN treatments further increased aboveground biomass C by 36.2 % and 61.7 % (Fig. 4a) and increased the size of the total SOC pool by 11.5 % and 20.6 % respectively (Fig. 4c). Similarly, the total SON pool in the acidic grassland increased by 9.7 % in the LN treatment and 36.6 % in the HN (Fig. 4e).
Responses of the SOP pool are in contrast to those of the SOC and SON pools, with LN and HN decreasing SOP by 4.4 % and 9.1 % respectively, while P addition substantially increased the size of the SOP pool by 76.7 % (Fig. 4g). Nitrogen treatments facilitated access to SOP from both subsoil and topsoil, increasing plant-available P and facilitating its uptake into biomass material (Fig. 5e, Table S8).
3.3.2 Limestone grassland
Model simulations for the limestone grassland also suggest N deposition between 1800 and 2020 considerably increased aboveground biomass C, SOC, and SON pools (Fig. 4) but to a lesser extent than in the acidic grassland. Soil organic C and SON increased by almost half, and biomass C more than doubled. Soil organic P accumulated at a faster rate than in the acidic grassland, increasing by about a third (Fig. 4, Table S14).
Responses of the aboveground biomass C and SOC pools in the limestone grassland differ greatly to those of the acidic grassland, declining with N addition and increasing with P addition (Fig. 4). This response was ubiquitous to all C pools, with declines in subsoil, topsoil, and biomass C (Fig. 5b, Table S10). Biomass C declined by 2.4 % and 7.3 % with LN and HN addition (Fig. 4b), and SOC declined by 0.5 % and 1.4 % with the same treatments (Fig. 4d). Phosphorus addition increased biomass C and SOC by 22.0 % and 6.1 % respectively (Fig. 4b, d).
Nitrogen treatments increased the size of subsoil, topsoil, and available N pools but led to small declines in biomass N (Fig. 5d, Table S11) The P treatment slightly reduced subsoil and topsoil SON compared to the control yet increased available N and biomass N, to the extent that biomass N is greater in the P than HN treatment (Fig. 5d, Table S11). Total SON increased by 6.4 % and 15.0 % with LN and HN respectively and declined by 0.2 % with P treatment (Fig. 4f).
The response of the limestone P pools mirrors that of carbon, with declines in subsoil SOP, topsoil SOP, available P, and biomass P with LN and HN addition (Fig. 5f, Table S12). The limestone grassland SOP pool declined by 0.2 % with LN and 0.5 % with HN addition, with an increase of 20.0 % upon addition of P (Fig. 4h). The P treatment substantially increased total ecosystem P in the limestone grassland, particularly in the topsoil sorbed pool (Fig. 5f, Table S12).
4.1 Simulating contrasting grasslands by varying plant access to P sources
This is the first instance in which N14CP, and to the best of our knowledge any other integrated C–N–P cycle model, has explicitly modelled P-limited ecosystems and investigated their responses to N deposition and additional nutrient treatments. By using empirical data from long-term experimental grasslands to drive and calibrate N14CP, we could test the model's ability to simulate two contrasting P-limited grasslands and how organic P access may affect this ability. While the purpose of this work was not to explicitly reproduce the Wardlow grasslands within N14CP, by comparing data from Wardlow to the simulated grasslands, we can simultaneously develop our understanding of the model's representation of under-studied P cycling processes and contextualise what this may mean for empirical systems such as Wardlow.
The model suggests that the acidic grassland was characterised by high access to organic P, with comparatively low inorganic P availability, whereas the limestone grassland was the opposite, with low organic and high inorganic P availability. These simulated differences could reflect the relative availability of different P sources at Wardlow. As the acidic grassland formed in a hillside depression, loess has accumulated, thickening the soil profile and distancing the plant community from the limestone bedrock. The plant rooting zone of the acidic grassland is therefore not in contact with the bedrock, and roots almost exclusively occur in the presence of organic P sources which can be cleaved and utilised by plants (Caldwell, 2005; Margalef et al., 2017). Conversely, the limestone grassland soil rarely exceeds 10 cm depth, and the rooting zone extends to the limestone beneath, providing plants with greater access to weatherable calcium phosphate (Smits et al., 2012).
Such parameter combinations allowed for reasonable congruence between empirical and simulated data, with an average discrepancy of only 6.6 % (SE ± 9.1) and 1.2 % (SE ± 4.4) for the acidic and limestone grasslands respectively across all variables (Table S5). However, model performance differed greatly between the two grasslands. For instance, the model accurately captured the magnitude of limestone C, N, and P data and their expected P-limited responses to nutrient treatment but was less effective at simulating the acidic grassland. N14CP did not simulate an increase in biomass C or SOC with P addition in the acidic grassland, instead simulating a solely N-limited grassland. While this may be expected of a model that employs a law-of-the-minimum approach, N14CP has a number of mechanisms to account for N and P interdependence, meaning that in principle, it is capable of simulating positive responses to LN, HN, and P treatment, as observed in the empirical data from 2019 (Sect. 2.2.2).
The overestimation of acidic C pools and underestimation of total P suggest that the model is simulating that too much organic P is being accessed by plants in response to N addition and transferred into plant biomass pools (Fig. 2d). Few parameter sets were simultaneously able to simulate the magnitude of the empirical TP pool and the positive response of biomass to N addition in the acidic grassland. This may also be due to limitations in the empirical P data, as P data used for calibrating P cycling were available for only two nutrient treatments and represented total soil P, not organic P. While we acknowledge the technical and theoretical issues associated with distinguishing between organic and inorganic P pools (Lajtha et al., 1999; Barrow et al., 2020), such distinctions would help in understanding this discrepancy and likely improve the model's ability to simulate P-limited systems, particularly when organic P availability may be important.
Additionally, N14CP's representation of organic P cleaving likely underestimates the ability of soil to rapidly occlude and protect organic P that enters solution. For example, inositol phosphate, a major constituent of organic P, has been found to be used extensively by plants grown in sand but is hardly accessed by plants grown in soil (Adams and Pate, 1992). Such organic phosphates become strongly bound to oxides in the soil, protecting them from attack by phosphatase enzymes (Barrow, 2020). This may be particularly prevalent in the acidic grassland at Wardlow where N deposition has resulted in acidification and base cation depletion (Horswill et al., 2008), potentially enhancing the formation of iron and aluminium complexes and immobilising P (Kooijman et al., 1998).
In addition to physico-chemical processes reducing P availability, in P-limited grassland soils, microbial processes may be dominant drivers of ecosystem P fluxes (Bünemann et al., 2012). For instance, while mineralisation of organic P may increase inorganic P in solution (Schneider et al., 2017), this can be rapidly and almost completely immobilised by microbes, particularly when soil P availability is low (Bünemann et al., 2012). As the model lacks a mechanism for increasing access to secondary mineral P forms comparable to organic P cleaving, and microbial P immobilisation is incompletely represented for P-limited conditions, it is possible that the uptake of organic P by the acidic grassland in the model is exaggerated.
The model's inability to simulate a positive response to both N and P addition in the acidic grassland may be an unintended consequence of the downregulation of N fixation by N deposition included within N14CP (Davies et al., 2016b). While this representation is appropriate (Gundale et al., 2013), when N deposition exceeds fixation (as at Wardlow), fixation is essentially nullified (as in Tables S7, S11), meaning deposition becomes the sole source of N to the grassland. This in effect removes the dependence of N acquisition on P availability and could make modelling behaviour akin to N–P co-limitation (Harpole et al., 2011) under high levels of N deposition challenging. This suggests that current C–N–P cycle models that employ Liebig's law of the minimum can provide a broad representation of multiple variables by calibrating access to both organic and inorganic P sources (Davies et al., 2016b), provided the ecosystem in question's limiting nutrient leans towards N or P limitation. Furthermore, where access to organic P forms is likely to be lower, as in the limestone grassland, model performance may improve. This could be further explored by allowing N fixation limits in the model to adapt to P nutrient conditions or by attenuating the suppression of N deposition on N fixation, to represent acclimatisation of N fixers to greater N availability (Zheng et al., 2018).
Ultimately, differences in modelled accessibility to organic forms of P enabled N14CP to distinguish between the two empirical grasslands and simulate the magnitude and pattern of data with reasonable accuracy, albeit with the previously mentioned caveats.
4.2 Consequences of differential P access on ecosystem C, N, and P
While the model's estimation of PCleaveMax for the acidic grassland is likely overestimated, the model experiment has highlighted that differences in organic versus inorganic P availability are a key determinant of an ecosystem's nutrient limitation and consequently how they respond to changes in anthropogenic N and P availability. For instance, while being exposed to the same background level of N deposition and the same magnitude of experimental treatment, the modelled acidic grassland was able to stimulate growth in response to LN and HN treatment, whereas the modelled limestone grassland was negatively affected by it.
Nitrogen addition increases plant demand for P and can shift ecosystems toward a state of P limitation or increase the severity of limitation where it already exists (Menge and Field, 2007; An et al., 2011; Goll et al., 2012). Consistent with this, both simulated grasslands saw SOP decline with LN and HN treatment, worsening P limitation in the limestone grassland and depleting the SOP pool in the acidic grassland. As P cleaved from organic pools is the least bioavailable within the model hierarchy (Sect. 2.2.3), this is indicative of increasing P stress in both grasslands. While SOP declined in both grasslands, the responses of available and biomass P to nutrient treatments differed markedly between the grasslands. Due to the higher rate of PCleaveMax in the acidic grassland, more P was in plant-available forms, and hence P does not become the limiting factor under N treatments (Table S8). Conversely, available and biomass P decline under LN and HN addition in the limestone grassland (Table S12), highlighting how the grassland's PCleaveMax capability is insufficient to meet increased P demand.
Such high access to organic P sources in the modelled acidic grassland likely led it to respond to nutrient enrichment in an N-limited manner, increasing productivity in response to N deposition and LN and HN treatments as the model's limiting nutrient stimulated plant growth. Detrital C inputs from plant biomass are the primary source of SOC accumulation within N14CP (Davies et al., 2016b), and as such, changes in SOC integrate long-term trends in net primary productivity in systems where external nutrients are supplied. The provision of additional N in the modelled LN and HN treatments therefore led to large increases in biomass accumulation and consequently almost linearly increased SOC (Fig. 4c).
Similar increases in N-limited grassland SOC under N addition have been shown, resulting from significant increases in below-ground carbon input from litter, roots (He et al., 2013), and detrital inputs (Fornara et al., 2013), mechanisms similar to those reported by the model. Similarly, Tipping et al. (2017) used N14CP to show that N deposition onto N-limited UK ecosystems ubiquitously increased SOC storage by an average of 1.2 kg C m−2 (ca. 10 %) between 1750 and 2010 (Tipping et al., 2017).
Despite its P-limited condition under the HN treatment (Fig. 3c), the acidic grassland continued to accumulate biomass with N addition as the grassland's greater access to topsoil SOP (Table S8) allowed it to acquire sufficient P to stimulate additional growth but not necessarily to alleviate P limitation. This is consistent with the acidic grassland at Wardlow, where N treatment stimulated root surface phosphatases, likely supplying more SOP to plants (Johnson et al., 1999). Our simulated acidic grassland therefore supports the hypothesis that prolonged N deposition may increase SOP access to such an extent that P limitation is alleviated and growth can be stimulated (Chen et al., 2020). Organic P release from SOM and its potential immobilisation are poorly represented in models, and we encourage further study aimed at quantifying these processes (Chen et al., 2020; Janes-Bassett et al., 2020; Phoenix et al., 2020). However, such high rates of SOP access only occurred under experimental LN and HN treatments, and in reality, such rapid degradation of SOP may eventually degrade the pool to such an extent that P limitation soon returns.
Conversely, biomass C and SOC in the modelled limestone grassland responded positively to P addition, via similar mechanisms to the N response in the modelled acidic grassland. However, in contrast to the acidic grassland, N addition caused declines in limestone biomass and SOC, the former of which has been observed at the limestone grassland at Wardlow (Carroll et al., 2003). Reductions in limestone biomass C (and consequently SOC) in the model are a combined result of reductions in bioavailable P (Table S12), occurring via N-driven increases in stoichiometric P demand, in addition to an inability to access sufficient P from the SOP pool (Table S14). Plants therefore cannot meet P demand, and new biomass is insufficient to replace senesced plant material, decreasing net biomass C input to the SOC pool. This suggests that in P-limited limestone grasslands such as at Wardlow, where access to organic P forms may be comparatively limited, N deposition may worsen pre-existing P limitation and reduce ecosystem C stocks (Goll et al., 2012; Li et al., 2018).
4.3 Model limitations
While N14CP is a fairly simple ecosystem model by design, it is one of few models to integrate the C, N, and P cycles for semi-natural ecosystems and has been extensively tested against empirical NPP and soil C, N, and P data (Davies et al., 2016a, b; Tipping et al., 2017, 2019; Janes-Bassett et al., 2020). Previous work with N14CP has identified the need to enhance its ability to simulate organic P cycling (Janes-Bassett et al., 2020), which we aimed to do in this study by using long-term experimental data from contrasting P-limited grasslands.
N14CP's simplified representation of plant nutrient pools and plant control over nutrient uptake is largely controlled by stoichiometric demand (Davies et al., 2016a) and does not incorporate many plant strategies for P acquisition (Vance et al., 2003). Indeed, by allowing PCleaveMax to vary to account for empirical data, we attempt to somewhat increase plant control over organic P uptake. We acknowledged earlier that such an approach likely underestimates the ability of soil surfaces and microbes to protect newly cleaved P from plant uptake. As such, where we may expect access to organic P to be high, such as the acidic grassland at Wardlow, such a modelled representation of plant-mediated P access may lead to unrealistic depletions in soil P and increases in biomass and soil C, and we would encourage further work aimed at improving model representation of plant controls on organic P cycling (Fleischer et al., 2019).
While we feel incorporating a suite of plant strategies for acquiring P would represent over-parameterisation, we acknowledge that a modelled equivalent to PCleaveMax for accessing inorganic P forms is lacking, such as carbon-based acid exudation to increase mineral P weathering (Achat et al., 2016; Phoenix et al., 2020), which likely contributes toward the poor representation of the acidic total P pool. Biota-enhanced P weathering and nutrient redistribution by mycorrhizal hyphae are important for nutrient cycling (Quirk et al., 2012), and fungal community structure and function are strongly influenced by perturbations in the C and N cycles (Moore et al., 2020). Such processes are not included within N14CP as the extent to which weathering can be controlled by such mechanisms and the manner in which these can be represented in C–N–P cycle models are debated (Davies et al., 2016b).
Currently, N14CP assumes C to be in unlimited supply, with its uptake by plants and consequent input into soil pools controlled by C : N : P stoichiometry; hence C availability has little effect on N and P dynamics within the model. Increasing atmospheric CO2 may increase nutrient availability, as plants may reallocate additional carbon resources toward nutrient acquisition (Keane et al., 2020), or elevated CO2 (eCO2) may increase limitation of other nutrients such as N (Luo et al., 2004). The inclusion of eCO2 into N14CP poses a particularly enticing research opportunity, and we aim to use this study as a foundation for future work to include this process.
We have shown that by varying two P-acquisition parameters within N14CP, we can account for contrasting responses of two P-limited grasslands and with reasonable accuracy. However, such coarse representation of organic P cycling in the model likely overestimates the ability of plants to use newly cleaved P and limits our ability to simulate grasslands where N and P interact to control plant productivity, including the potential for N inputs to alleviate P limitation.
Differences in organic P access was a key factor distinguishing the contrasting responses of the modelled grasslands to nutrient manipulation, with high plant access allowing the acidic grassland to acquire sufficient P to match available N from chronic deposition and prevent “anthropogenic P limitation”. In the acidic grassland, N treatment stimulated plant access of organic P, promoting growth and C sequestration. However, the model suggests that this is an unsustainable strategy, as the SOP pool rapidly degrades, and if N additions are sustained, P limitation may return. Conversely, in the limestone grassland, which was less able to access organic P, additional N provision exacerbated pre-existing P limitation by simultaneously increasing plant P demand and reducing P bioavailability. This reduced productivity, and consequently C input to soil pools declined, resulting in SOC degradation exceeding its replacement.
We further show that anthropogenic N deposition since the onset of the industrial revolution has had a substantial impact on the C, N, and P pools of both the modelled acidic and limestone grasslands, to the extent that almost half of contemporary soil C and N in the model could be from, or caused by, N deposition.
Our work therefore suggests that with sufficient access to organic P, long-term N addition may alleviate P limitation. Where organic P access is limited, N deposition could shift more ecosystems toward a state of P limitation or strengthen it where it already occurs (Goll et al., 2012), reducing productivity to the point where declines in grassland SOC stocks – one of our largest and most labile carbon pools – may occur.
Data presented in the manuscript have been deposited with NERC's Environmental Information Data Centre (EIDC) at the following DOI: https://doi.org/10.5285/98b473c7-3ca9-498d-a851-31152b1f1da7 (Taylor et al., 2021). All data to be archived are present in the Supplement for review purposes.
The supplement related to this article is available online at: https://doi.org/10.5194/bg-18-4021-2021-supplement.
CRT contributed to conceptualisation of the study, data curation, formal analysis, investigation, methodology, project administration, validation, visualisation, and writing. VJB contributed to conceptualisation, formal analysis, investigation, methodology, supervision, and writing. GKP contributed to conceptualisation, methodology, funding acquisition, project administration, resources, supervision, and writing. BK contributed to the investigation, methodology, supervision, and writing. IPH contributed to funding acquisition, methodology, resources, supervision, and writing. JACD contributed to conceptualisation, formal analysis, investigation, resources, methodology, supervision, project administration, and writing.
The authors declare that they have no conflict of interest.
Publisher's note: Copernicus Publications remains neutral with regard to jurisdictional claims in published maps and institutional affiliations.
We thank Jonathan Leake for his insightful interpretation of our findings and for constructive feedback on early versions of the work. In addition, we are grateful for technical assistance from Irene Johnson, Heather Walker, and Gemma Newsome, without whom there would be no carbon and nitrogen data for model input. We are grateful to the Met Office UK and the Centre for Ecology and Hydrology for use of their meteorological and deposition data respectively. We also wish to extend our thanks to James Fisher for his earlier work on Wardlow carbon data, which prompted additional investigation into the grassland's carbon stocks. Finally, we thank the anonymous reviewers for their valuable contributions to improving the paper. Site access was provided by Shaun Taylor at Natural England.
This work was funded by the Natural Environment Research Council award NE/N010132/1 to GKP and NERC award NE/N010086/1 to IPH of the “Phosphorus Limitation and Carbon dioxide Enrichment” (PLACE) project. This work was also funded through “Adapting to the Challenges of a Changing Environment” (ACCE), a NERC-funded doctoral training partnership to CRT: ACCE DTP NE/L002450/1.
This paper was edited by Michael Weintraub and reviewed by four anonymous referees.
Achat, D. L., Augusto, L., Gallet-Budynek, A., and Loustau, D.: Future challenges in coupled C-N-P cycle models for terrestrial ecosystems under global change: a review, Biogeochemistry, 131, 173–202, https://doi.org/10.1007/s10533-016-0274-9, 2016.
Aciego, S. M., Riebe, C. S., Hart, S. C., Blakowski, M. A., Carey, C. J., Aarons, S. M., Dove, N. C., Botthoff, J. K., Sims, K. W. W., and Aronson, E. L.: Dust outpaces bedrock in nutrient supply to montane forest ecosystems, Nat. Commun., 8, 14800, https://doi.org/10.1038/ncomms14800, 2017.
Adams, M. A. and Pate, J. S.: Availability of organic and inorganic forms of phosphorus to Lupins (Lupinus spp.), Plant Soil, 145, 107–113, https://doi.org/10.1007/bf00009546, 1992.
An, Z., Niu, D.-C., Wen, H.-Y., Yang, Y., Zhang, H.-R., and Fu, H.: Effects of N addition on nutrient resorption efficiency and C:N:P stoichiometric characteristics in Stipa bungeana of steppe grasslands in the Loess Plateau, China, Chinese J. Plant Ecol., 35, 801–807, https://doi.org/10.3724/SP.J.1258.2011.00801, 2011.
Barrow, N. J.: Comparing two theories about the nature of soil phosphate, Eur. J. Soil Sci., 72, 679–685, https://doi.org/10.1111/ejss.13027, 2021.
Bobbink, R., Hicks, K., Galloway, J., Spranger, T., Alkemade, R., Ashmore, M., Bustamante, M., Cinderby, S., Davidson, E., Dentener, F., Emmett, B., Erisman, J. W., Fenn, M., Gilliam, F., Nordin, A., Pardo, L., and De Vries, W.: Global assessment of nitrogen deposition effects on terrestrial plant diversity: a synthesis, Ecol. Appl., 20, 30–59, https://doi.org/10.1890/08-1140.1, 2010.
Bünemann, E. K., Oberson, A., Liebisch, F., Keller, F., Annaheim, K. E., Huguenin-Elie, O., and Frossard, E.: Rapid microbial phosphorus immobilization dominates gross phosphorus fluxes in a grassland soil with low inorganic phosphorus availability, Soil Biol. Biochem., 51, 84–95, https://doi.org/10.1016/j.soilbio.2012.04.012, 2012.
Caldwell, B. A.: Enzyme activities as a component of soil biodiversity: A review, Pedobiologia, 49, 637–644, https://doi.org/10.1016/j.pedobi.2005.06.003, 2005.
Carroll, J. A., Caporn, S. J. M., Johnson, D., Morecroft, M. D., and Lee, J. A.: The interactions between plant growth, vegetation structure and soil processes in semi-natural acidic and calcareous grasslands receiving long-term inputs of simulated pollutant nitrogen deposition, Environ. Pollut., 121, 363–376, https://doi.org/10.1016/s0269-7491(02)00241-5, 2003.
Chapin, F. S., Matson, P. A., and Vitousek, P. M. (Eds.): Nutrient cycling, in: Principles of Terrestrial Ecosystem Ecology, Springer, New York, 259–296, 2011.
Chen, J., van Groenigen, K. J., Hungate, B. A., Terrer, C., van Groenigen, J. W., Maestre, F. T., Ying, S. C., Luo, Y. Q., Jorgensen, U., Sinsabaugh, R. L., Olesen, J. E., and Elsgaard, L.: Long-term nitrogen loading alleviates phosphorus limitation in terrestrial ecosystems, Glob. Change Biol., 26, 5077–5086, https://doi.org/10.1111/gcb.15218, 2020.
Danger, M., Daufresne, T., Lucas, F., Pissard, S., and Lacroix, G.: Does Liebig's law of the minimum scale up from species to communities?, Oikos, 117, 1741–1751, https://doi.org/10.1111/j.1600-0706.2008.16793.x, 2008.
Davies, J. A. C., Tipping, E., and Whitmore, A. P.: 150 years of macronutrient change in unfertilized UK ecosystems: Observations vs simulations, Sci. Total Environ., 572, 1485–1495, https://doi.org/10.1016/j.scitotenv.2016.03.055, 2016a.
Davies, J. A. C., Tipping, E., Rowe, E. C., Boyle, J. F., Pannatier, E. G., and Martinsen, V.: Long-term P weathering and recent N deposition control contemporary plant-soil C, N, and P, Global Biogeochem. Cy., 30, 231–249, https://doi.org/10.1002/2015gb005167, 2016b.
Du, E. Z., Terrer, C., Pellegrini, A. F. A., Ahlstrom, A., van Lissa, C. J., Zhao, X., Xia, N., Wu, X. H., and Jackson, R. B.: Global patterns of terrestrial nitrogen and phosphorus limitation, Nat. Geosci., 13, 221–226, https://doi.org/10.1038/s41561-019-0530-4, 2020.
Fay, P. A., Prober, S. M., Harpole, W. S., Knops, J. M. H., Bakker, J. D., Borer, E. T., Lind, E. M., MacDougall, A. S., Seabloom, E. W., Wragg, P. D., Adler, P. B., Blumenthal, D. M., Buckley, Y., Chu, C. J., Cleland, E. E., Collins, S. L., Davies, K. F., Du, G. Z., Feng, X. H., Firn, J., Gruner, D. S., Hagenah, N., Hautier, Y., Heckman, R. W., Jin, V. L., Kirkman, K. P., Klein, J., Ladwig, L. M., Li, Q., McCulley, R. L., Melbourne, B. A., Mitchell, C. E., Moore, J. L., Morgan, J. W., Risch, A. C., Schutz, M., Stevens, C. J., Wedin, D. A., and Yang, L. H.: Grassland productivity limited by multiple nutrients, Nat. Plants, 1, 15080, https://doi.org/10.1038/nplants.2015.80, 2015.
Fleischer, K., Rammig, A., De Kauwe, M. G., Walker, A. P., Domingues, T. F., Fuchslueger, L., Garcia, S., Goll, D. S., Grandis, A., Jiang, M. K., Haverd, V., Hofhansl, F., Holm, J. A., Kruijt, B., Leung, F., Medlyn, B. E., Mercado, L. M., Norby, R. J., Pak, B., von Randow, C., Quesada, C. A., Schaap, K. J., Valverde-Barrantes, O. J., Wang, Y. P., Yang, X. J., Zaehle, S., Zhu, Q., and Lapola, D. M.: Amazon forest response to CO2 fertilization dependent on plant phosphorus acquisition, Nat. Geosci., 12, 736–741, https://doi.org/10.1038/s41561-019-0404-9, 2019.
Fornara, D. A., Banin, L., and Crawley, M. J.: Multi-nutrient vs. nitrogen-only effects on carbon sequestration in grassland soils, Glob. Change Biol., 19, 3848–3857, https://doi.org/10.1111/gcb.12323, 2013.
Fowler, D., Coyle, M., Skiba, U., Sutton, M. A., Cape, J. N., Reis, S., Sheppard, L. J., Jenkins, A., Grizzetti, B., Galloway, J. N., Vitousek, P., Leach, A., Bouwman, A. F., Butterbach-Bahl, K., Dentener, F., Stevenson, D., Amann, M., and Voss, M.: The global nitrogen cycle in the twenty-first century, Philos. T. R. Soc. B, 368, 1–13, https://doi.org/10.1098/rstb.2013.0164, 2013.
Goll, D. S., Brovkin, V., Parida, B. R., Reick, C. H., Kattge, J., Reich, P. B., van Bodegom, P. M., and Niinemets, U.: Nutrient limitation reduces land carbon uptake in simulations with a model of combined carbon, nitrogen and phosphorus cycling, Biogeosciences, 9, 3547–3569, https://doi.org/10.5194/bg-9-3547-2012, 2012.
Gundale, M. J., Bach, L. H., and Nordin, A.: The impact of simulated chronic nitrogen deposition on the biomass and N-2-fixation activity of two boreal feather moss-cyanobacteria associations, Biol. Lett., 9, 1–4, https://doi.org/10.1098/rsbl.2013.0797, 2013.
Harpole, W. S., Ngai, J. T., Cleland, E. E., Seabloom, E. W., Borer, E. T., Bracken, M. E. S., Elser, J. J., Gruner, D. S., Hillebrand, H., Shurin, J. B., and Smith, J. E.: Nutrient co-limitation of primary producer communities, Ecol. Lett., 14, 852–862, https://doi.org/10.1111/j.1461-0248.2011.01651.x, 2011.
He, N. P., Yu, Q., Wang, R. M., Zhang, Y. H., Gao, Y., and Yu, G. R.: Enhancement of Carbon Sequestration in Soil in the Temperature Grasslands of Northern China by Addition of Nitrogen and Phosphorus, Plos One, 8, 10, https://doi.org/10.1371/journal.pone.0077241, 2013.
Horswill, P., O'Sullivan, O., Phoenix, G. K., Lee, J. A., and Leake, J. R.: Base cation depletion, eutrophication and acidification of species-rich grasslands in response to long-term simulated nitrogen deposition, Environ. Pollut., 155, 336–349, https://doi.org/10.1016/j.envpol.2007.11.006, 2008.
Hou, E. Q., Luo, Y. Q., Kuang, Y. W., Chen, C. R., Lu, X. K., Jiang, L. F., Luo, X. Z., and Wen, D. Z.: Global meta-analysis shows pervasive phosphorus limitation of aboveground plant production in natural terrestrial ecosystems, Nat. Commun., 11, 637, https://doi.org/10.1038/s41467-020-14492-w, 2020.
Janes-Bassett, V., Davies, J., Rowe, E. C., and Tipping, E.: Simulating long-term carbon nitrogen and phosphorus biogeochemical cycling in agricultural environments, Sci. Total Environ., 714, 136599, https://doi.org/10.1016/j.scitotenv.2020.136599, 2020.
Jiang, M. K., Caldararu, S., Zaehle, S., Ellsworth, D. S., and Medlyn, B. E.: Towards a more physiological representation of vegetation phosphorus processes in land surface models, New Phytol., 222, 1223–1229, https://doi.org/10.1111/nph.15688, 2019.
Johnson, D., Leake, J. R., and Lee, J. A.: The effects of quantity and duration of simulated pollutant nitrogen deposition on root-surface phosphatase activities in calcareous and acid grasslands: a bioassay approach, New Phytol., 141, 433–442, https://doi.org/10.1046/j.1469-8137.1999.00360.x, 1999.
Jones, M. B. and Donnelly, A.: Carbon sequestration in temperate grassland ecosystems and the influence of management, climate and elevated CO(2), New Phytol., 164, 423–439, https://doi.org/10.1111/j.1469-8137.2004.01201.x, 2004.
Keane, J. B., Hoosbeek, M. R., Taylor, C. R., Miglietta, F., Phoenix, G. K., and Hartley, I. P.: Soil C, N and P cycling enzyme responses to nutrient limitation under elevated CO2, Biogeochemistry, 151, 221–235, https://doi.org/10.1007/s10533-020-00723-1, 2020.
Kooijman, A. M., Dopheide, J. C. R., Sevink, J., Takken, I., and Verstraten, J. M.: Nutrient limitations and their implications on the effects of atmospheric deposition in coastal dunes; lime-poor and lime-rich sites in the Netherlands, J. Ecol., 86, 511–526, https://doi.org/10.1046/j.1365-2745.1998.00273.x, 1998.
Lajtha, K., Driscoll, C. T., Jarrell, W. M., and Elliott, E. T.: Soil phosphorus: characterization and total element analysis, in: Standard soil methods for long-term ecological research, edited by: Robertson, G. P., Coleman, D. C., Bledsoe, C. S., and Sollins, P., New York, NY, Oxford University Press, 115–142, 1999.
LeBauer, D. S. and Treseder, K. K.: Nitrogen limitation of net primary productivity in terrestrial ecosystems is globally distributed, Ecology, 89, 371–379, https://doi.org/10.1890/06-2057.1, 2008.
Li, J. H., Hou, Y. L., Zhang, S. X., Li, W. J., Xu, D. H., Knops, J. M. H., and Shi, X. M.: Fertilization with nitrogen and/or phosphorus lowers soil organic carbon sequestration in alpine meadows, Land Degrad. Dev., 29, 1634–1641, https://doi.org/10.1002/ldr.2961, 2018.
Long, M., Wu, H. H., Smith, M. D., La Pierre, K. J., Lu, X. T., Zhang, H. Y., Han, X. G., and Yu, Q.: Nitrogen deposition promotes phosphorus uptake of plants in a semi-arid temperate grassland, Plant Soil, 408, 475–484, https://doi.org/10.1007/s11104-016-3022-y, 2016.
Luo, Y., Su, B., Currie, W. S., Dukes, J. S., Finzi, A. C., Hartwig, U., Hungate, B., McMurtrie, R. E., Oren, R., Parton, W. J., Pataki, D. E., Shaw, M. R., Zak, D. R., and Field, C. B.: Progressive nitrogen limitation of ecosystem responses to rising atmospheric carbon dioxide, Bioscience, 54, 731–739, https://doi.org/10.1641/0006-3568(2004)054[0731:pnloer]2.0.co;2, 2004.
Margalef, O., Sardans, J., Fernandez-Martinez, M., Molowny-Horas, R., Janssens, I. A., Ciais, P., Goll, D., Richter, A., Obersteiner, M., Asensio, D., and Penuelas, J.: Global patterns of phosphatase activity in natural soils, Sci. Rep., 7, 1337, https://doi.org/10.1038/s41598-017-01418-8, 2017.
Menge, D. N. L. and Field, C. B.: Simulated global changes alter phosphorus demand in annual grassland, Glob. Change Biol., 13, 2582–2591, https://doi.org/10.1111/j.1365-2486.2007.01456.x, 2007.
Menge, D. N. L., Hedin, L. O., and Pacala, S. W.: Nitrogen and Phosphorus Limitation over Long-Term Ecosystem Development in Terrestrial Ecosystems, Plos One, 7, e42045, https://doi.org/10.1371/journal.pone.0042045, 2012.
Moore, J. A. M., Anthony, M. A., Pec, G. J., Trocha, L. K., Trzebny, A., Geyer, K. M., van Diepen, L. T. A., and Frey, S. D.: Fungal community structure and function shifts with atmospheric nitrogen deposition, Glob. Change Biol., 27, 1349–1364, https://doi.org/10.1111/gcb.15444, 2020.
Morecroft, M. D., Sellers, E. K., and Lee, J. A.: An Experimental Investigation Into The Effects Of Atmospheric Nitrogen Deposition On 2 Seminatural Grasslands, J. Ecol., 82, 475–483, https://doi.org/10.2307/2261256, 1994.
Phoenix, G. K., Booth, R. E., Leake, J. R., Read, D. J., Grime, J. P., and Lee, J. A.: Effects of enhanced nitrogen deposition and phosphorus limitation on nitrogen budgets of semi-natural grasslands, Glob. Change Biol., 9, 1309–1321, https://doi.org/10.1046/j.1365-2486.2003.00660.x, 2003.
Phoenix, G. K., Booth, R. E., Leake, J. R., Read, D. J., Grime, J. P., and Lee, J. A.: Simulated pollutant nitrogen deposition increases P demand and enhances root-surface phosphatase activities of three plant functional types in a calcareous grassland, New Phytol., 161, 279–289, https://doi.org/10.1046/j.1469-8137.2003.00910.x, 2004.
Phoenix, G. K., Emmett, B. A., Britton, A. J., Caporn, S. J. M., Dise, N. B., Helliwell, R., Jones, L., Leake, J. R., Leith, I. D., Sheppard, L. J., Sowerby, A., Pilkington, M. G., Rowe, E. C., Ashmorek, M. R., and Power, S. A.: Impacts of atmospheric nitrogen deposition: responses of multiple plant and soil parameters across contrasting ecosystems in long-term field experiments, Glob. Change Biol., 18, 1197–1215, https://doi.org/10.1111/j.1365-2486.2011.02590.x, 2012.
Phoenix, G. K., Johnson, D. A., Muddimer, S. P., Leake, J. R., and Cameron, D. D.: Niche differentiation and plasticity in soil phosphorus acquisition among co-occurring plants, Nat. Plants, 6, 349–354, https://doi.org/10.1038/s41477-020-0624-4, 2020.
Quirk, J., Beerling, D. J., Banwart, S. A., Kakonyi, G., Romero-Gonzalez, M. E., and Leake, J. R.: Evolution of trees and mycorrhizal fungi intensifies silicate mineral weathering, Biol. Lett., 8, 1006–1011, https://doi.org/10.1098/rsbl.2012.0503, 2012.
Ridame, C. and Guieu, C.: Saharan input of phosphate to the oligotrophic water of the open western Mediterranean Sea, Limnol. Oceanogr., 47, 856–869, https://doi.org/10.4319/lo.2002.47.3.0856, 2002.
Schneider, K. D., Voroney, R. P., Lynch, D. H., Oberson, A., Frossard, E., and Bunemann, E. K.: Microbially-mediated P fluxes in calcareous soils as a function of water-extractable phosphate, Soil Biol. Biochem., 106, 51–60, https://doi.org/10.1016/j.soilbio.2016.12.016, 2017.
Schöpp, W., Posch, M., Mylona, S., and Johansson, M.: Long-term development of acid deposition (1880–2030) in sensitive freshwater regions in Europe, Hydrol. Earth Syst. Sci., 7, 436–446, https://doi.org/10.5194/hess-7-436-2003, 2003.
Smits, M. M., Bonneville, S., Benning, L. G., Banwart, S. A., and Leake, J. R.: Plant-driven weathering of apatite – the role of an ectomycorrhizal fungus, Geobiology, 10, 445–456, https://doi.org/10.1111/j.1472-4669.2012.00331.x, 2012.
Southon, G. E., Field, C., Caporn, S. J. M., Britton, A. J., and Power, S. A.: Nitrogen Deposition Reduces Plant Diversity and Alters Ecosystem Functioning: Field-Scale Evidence from a Nationwide Survey of UK Heathlands, Plos One, 8, e59031, https://doi.org/10.1371/journal.pone.0059031, 2013.
Taylor, C. R., Janes-Bassett, V., Phoenix, G. K., Keane, B., Hartley, I. P., and Davies, J. A. C.: Empirical and modelled carbon, nitrogen and phosphorus content of plants and soils from Wardlow Hay Cop, UK, NERC Environmental Information Data Centre [Dataset], https://doi.org/10.5285/98b473c7-3ca9-498d-a851-31152b1f1da7 (last access: 29 June 2021), 2021.
Taylor, D. M., Griffiths, H. I., Pedley, M. H., and Prince, I.: Radiocarbon-dated Holocene pollen and ostracod sequences from barrage tufa-dammed fluvial systems in the White Peak, Derbyshire, UK, The Holocene, 4, 356–364, https://doi.org/10.1177/095968369400400403, 1994.
Tipping, E., Rowe, E. C., Evans, C. D., Mills, R. T. E., Emmett, B. A., Chaplow, J. S., and Hall, J. R.: N14C: A plant-soil nitrogen and carbon cycling model to simulate terrestrial ecosystem responses to atmospheric nitrogen deposition, Ecol. Model., 247, 11–26, https://doi.org/10.1016/j.ecolmodel.2012.08.002, 2012.
Tipping, E., Benham, S., Boyle, J. F., Crow, P., Davies, J., Fischer, U., Guyatt, H., Helliwell, R., Jackson-Blake, L., Lawlor, A. J., Monteith, D. T., Rowe, E. C., and Toberman, H.: Atmospheric deposition of phosphorus to land and freshwater, Environ. Sci.-Proc. Im., 16, 1608–1617, https://doi.org/10.1039/c3em00641g, 2014.
Tipping, E., Davies, J. A. C., Henrys, P. A., Jarvis, S. G., Rowe, E. C., Smart, S. M., Le Duc, M. G., Marrs, R. H., and Pakeman, R. J.: Measured estimates of semi-natural terrestrial NPP in Great Britain: comparison with modelled values, and dependence on atmospheric nitrogen deposition, Biogeochemistry, 144, 215–227, https://doi.org/10.1007/s10533-019-00582-5, 2019.
Tipping, E., Davies, J. A. C., Henrys, P. A., Kirk, G. J. D., Lilly, A., Dragosits, U., Carnell, E. J., Dore, A. J., Sutton, M. A., and Tomlinson, S. J.: Long-term increases in soil carbon due to ecosystem fertilization by atmospheric nitrogen deposition demonstrated by regional-scale modelling and observations, Sci. Rep., 7, 1890, https://doi.org/10.1038/s41598-017-02002-w, 2017.
Vance, C. P., Uhde-Stone, C., and Allan, D. L.: Phosphorus acquisition and use: critical adaptations by plants for securing a nonrenewable resource, New Phytol., 157, 423–447, https://doi.org/10.1046/j.1469-8137.2003.00695.x, 2003.
Vitousek, P. M. and Farrington, H.: Nutrient limitation and soil development: Experimental test of a biogeochemical theory, Biogeochemistry, 37, 63–75, https://doi.org/10.1023/a:1005757218475, 1997.
Vitousek, P. M. and Howarth, R. W.: Nitrogen limitation on land and in the sea – how can it occur, Biogeochemistry, 13, 87–115, 1991.
Wang, Y. P., Law, R. M., and Pak, B.: A global model of carbon, nitrogen and phosphorus cycles for the terrestrial biosphere, Biogeosciences, 7, 2261–2282, https://doi.org/10.5194/bg-7-2261-2010, 2010.
Yuan, Z. W., Jiang, S. Y., Sheng, H., Liu, X., Hua, H., Liu, X. W., and Zhang, Y.: Human Perturbation of the Global Phosphorus Cycle: Changes and Consequences, Environ. Sci. Technol., 52, 2438–2450, https://doi.org/10.1021/acs.est.7b03910, 2018.
Zheng, M. H., Zhang, W., Luo, Y. Q., Li, D. J., Wang, S. H., Huang, J., Lu, X. K., and Mo, J. M.: Stoichiometry controls asymbiotic nitrogen fixation and its response to nitrogen inputs in a nitrogen-saturated forest, Ecology, 99, 2037–2046, https://doi.org/10.1002/ecy.2416, 2018.
Please read the editorial note first before accessing the article.
- Article
(1108 KB) - Full-text XML
-
Supplement
(1007 KB) - BibTeX
- EndNote