the Creative Commons Attribution 4.0 License.
the Creative Commons Attribution 4.0 License.
 | 19 Jan 2021
Mg∕Ca, Sr∕Ca and stable isotopes from the planktonic foraminifera T. sacculifer: testing a multi-proxy approach for inferring paleotemperature and paleosalinity
Gert Jan Reichart
Christophe Menkes
Morgan Mangeas
Stephan Frickenhaus
Jelle Bijma
Over the last decades, sea surface temperature (SST) reconstructions based on the Mg∕Ca of foraminiferal calcite have frequently been used in combination with the δ18O signal from the same material to provide estimates of the δ18O of water (δ18Ow), a proxy for global ice volume and sea surface salinity (SSS). However, because of error propagation from one step to the next, better calibrations are required to increase the accuracy and robustness of existing isotope and element to temperature proxy relationships. Towards that goal, we determined Mg∕Ca, Sr∕Ca and the oxygen isotopic composition of Trilobatus sacculifer (previously referenced as Globigerinoides sacculifer) collected from surface waters (0–10 m) along a north–south transect in the eastern basin of the tropical and subtropical Atlantic Ocean. We established a new paleotemperature calibration based on Mg∕Ca and on the combination of Mg∕Ca and Sr∕Ca. Subsequently, a sensitivity analysis was performed in which one, two or three different equations were considered. Results indicate that foraminiferal Mg∕Ca allows for an accurate reconstruction of surface water temperature. Combining equations, δ18Ow can be reconstructed with a precision of about ± 0.5 ‰. However, the best possible salinity reconstruction based on locally calibrated equations only allowed for a reconstruction with an uncertainty of ± 2.49. This was confirmed by a Monte Carlo simulation, applied to test successive reconstructions in an “ideal case” in which explanatory variables are known. This simulation shows that from a purely statistical point of view, successive reconstructions involving Mg∕Ca and δ18Oc preclude salinity reconstructions with a precision better than ± 1.69 and hardly better than ± 2.65 due to error propagation. Nevertheless, a direct linear fit to reconstruct salinity based on the same measured variables (Mg∕Ca and δ18Oc) was established. This direct reconstruction of salinity led to a much better estimation of salinity (± 0.26) than the successive reconstructions.
- Article
(3534 KB) - Full-text XML
- BibTeX
- EndNote


Since Emiliani's pioneering work (1954), oxygen isotope compositions recorded in fossil foraminiferal shells became a major tool to reconstruct past sea surface temperatures (SSTs). After Shackleton's seminal studies (1967, 1968 and 1974), it became clear that part of the signal reflected glacial–interglacial changes in continental ice volume and hence sea level variations. The oxygen isotope composition of foraminiferal calcite (δ18Oc) is thus controlled by the temperature of calcification (Urey, 1947; Epstein et al., 1953) but also by the oxygen isotope composition of seawater (δ18Ow). The relative contribution of these two factors cannot be deconvolved without an independent measure of the temperature at the time of calcification, such as e.g., Mg∕Ca (e.g., Nürnberg et al., 1996; Rosenthal et al., 1997; Rathburn and DeDeckker, 1997; Hastings et al., 1998; Lea et al., 1999; Lear et al., 2002; Toyofuku et al., 2000; Anand et al., 2003; Kisakurek et al., 2008; Dueñas-Bohórquez et al., 2009, 2011; Honisch et al., 2013; Kontakiotis et al., 2016; Jentzen et al., 2018). The sea surface temperature reconstructed from the Mg∕Ca of foraminiferal calcite has, therefore, increasingly been used in combination with the δ18O signal measured from the same material to estimate δ18Ow and global ice volume and to infer past sea surface salinity (SSS) (e.g., Rohling 2000; Elderfield and Ganssen, 2000; Schmidt et al., 2004; Weldeab et al., 2005; 2007). These studies also showed that, because of error propagation, inaccuracies in the different proxies combined for the reconstruction of past sea water δ18O and salinity obstruct meaningful interpretations. Hence, while there is an understandable desire to apply empirical proxy relationships downcore, additional calibrations appear necessary to make reconstructions more robust. Calibrations using foraminifera sampled from surface seawater (0–10 m deep) provide the best possibility to avoid most of the artifacts usually seen when using specimens from core tops or culture experiments for calibration purposes. Here, we report a calibration based on Globigerinoides sacculifer, which should now and will be referenced in this paper as Trilobatus sacculifer (Spezzaferri et al., 2015), from the Atlantic Ocean. Mg and Sr concentrations were measured on the last chamber of individual specimens with laser ablation inductively coupled plasma mass spectrometry (LA-ICP-MS), while the oxygen isotope composition of the same tests as used for the elemental analyses was subsequently measured by isotope ratio mass spectrometry (IRMS). Environmental parameters (temperature, T, salinity, S, dissolved inorganic carbon, DIC, and alkalinity, ALK) but also the isotopic composition (O18w) of the seawater that the foraminifera were growing in were measured. The primary objectives of this study are (1) to test and improve the calibration of both the Mg∕Ca and oxygen isotope paleothermometer for the paleoceanographic relevant species T. sacculifer; (2) to test whether the incorporation of Sr into the Mg–T reconstruction equation improves temperature reconstruction by accounting for the impact of salinity; (3) to evaluate the agreement between observed and predicted δ18Ow, and (4) to test the potential for SSS reconstructions of the Atlantic Ocean. Our results indicate that the best possible salinity reconstruction based on locally calibrated equations from the present study only allowed reconstructions with an uncertainty of ± 2.49. Such an uncertainty does not allow for viable (paleo)salinity data. This is subsequently confirmed by a Monte Carlo simulation applied to test successive reconstructions in an “ideal case”, for which explanatory variables are known. This simulation shows that from a purely statistical point of view, successive reconstructions involving Mg∕Ca and δ18Oc preclude salinity reconstructions with a precision better than ± 1.69 and hardly better than ± 2.65 due to error propagation. Nevertheless, a direct linear fit based on the same measured variables (Mg∕Ca and δ18Oc), and leading to a much better estimation of salinity (± 0.26), could be established.
Table 1Measured temperature, salinity, DIC, ALK and δ18Ow of the stations selected for this study (October/November 2005).
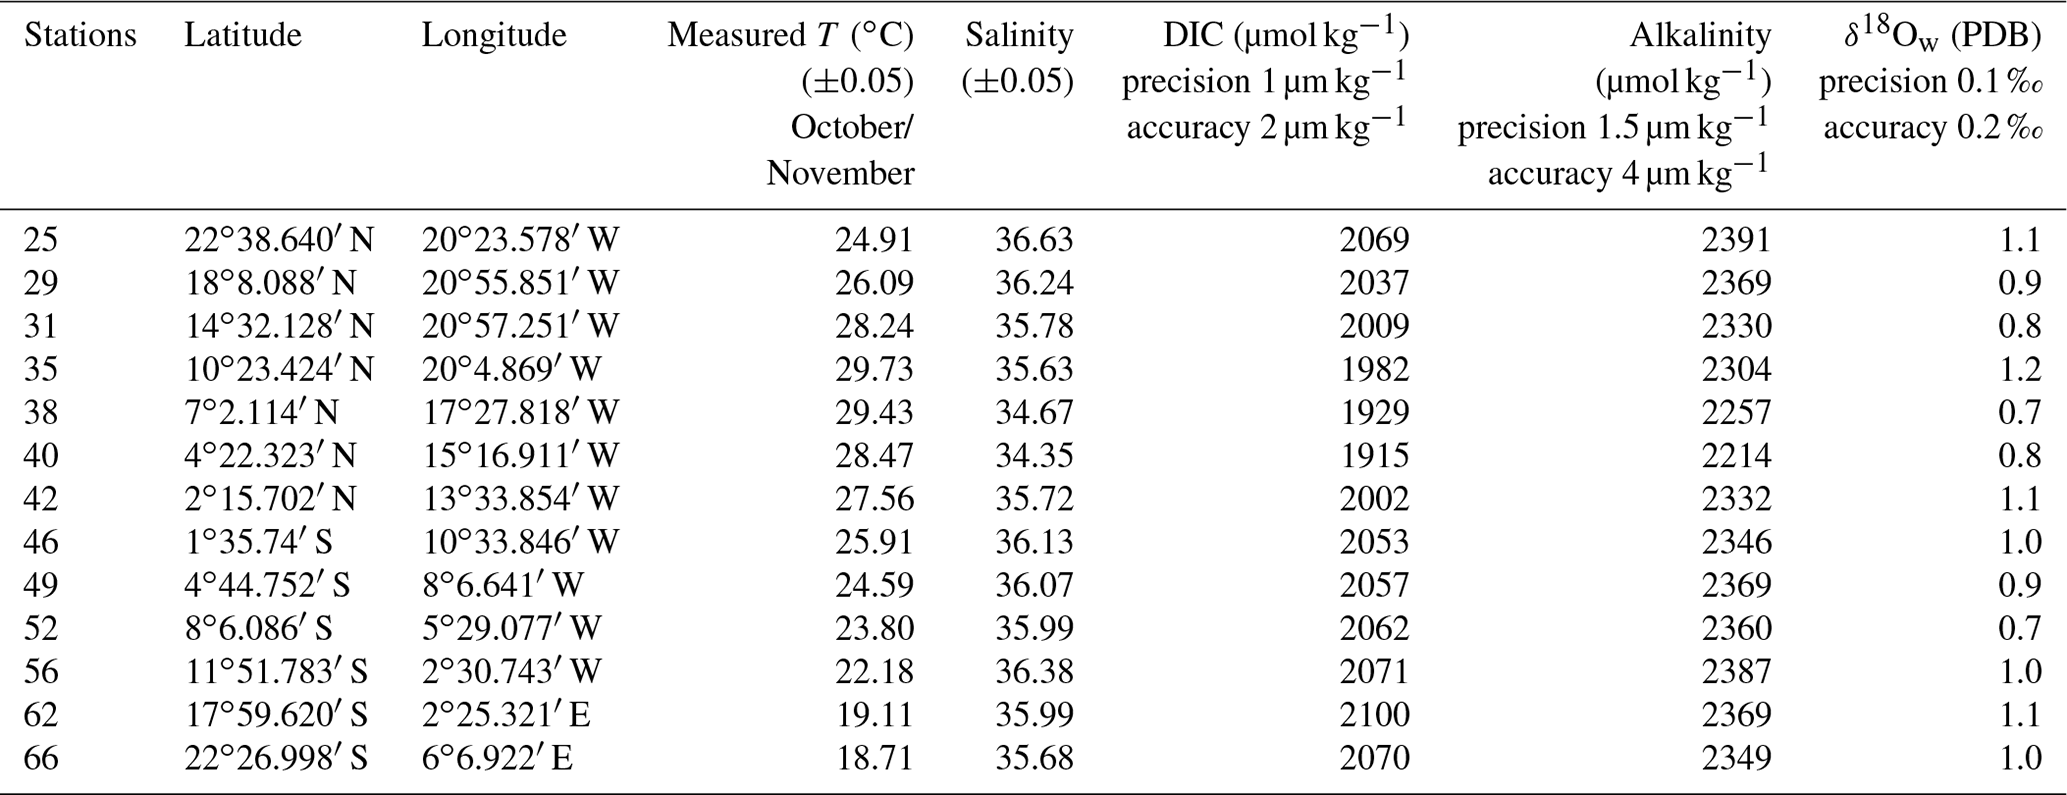
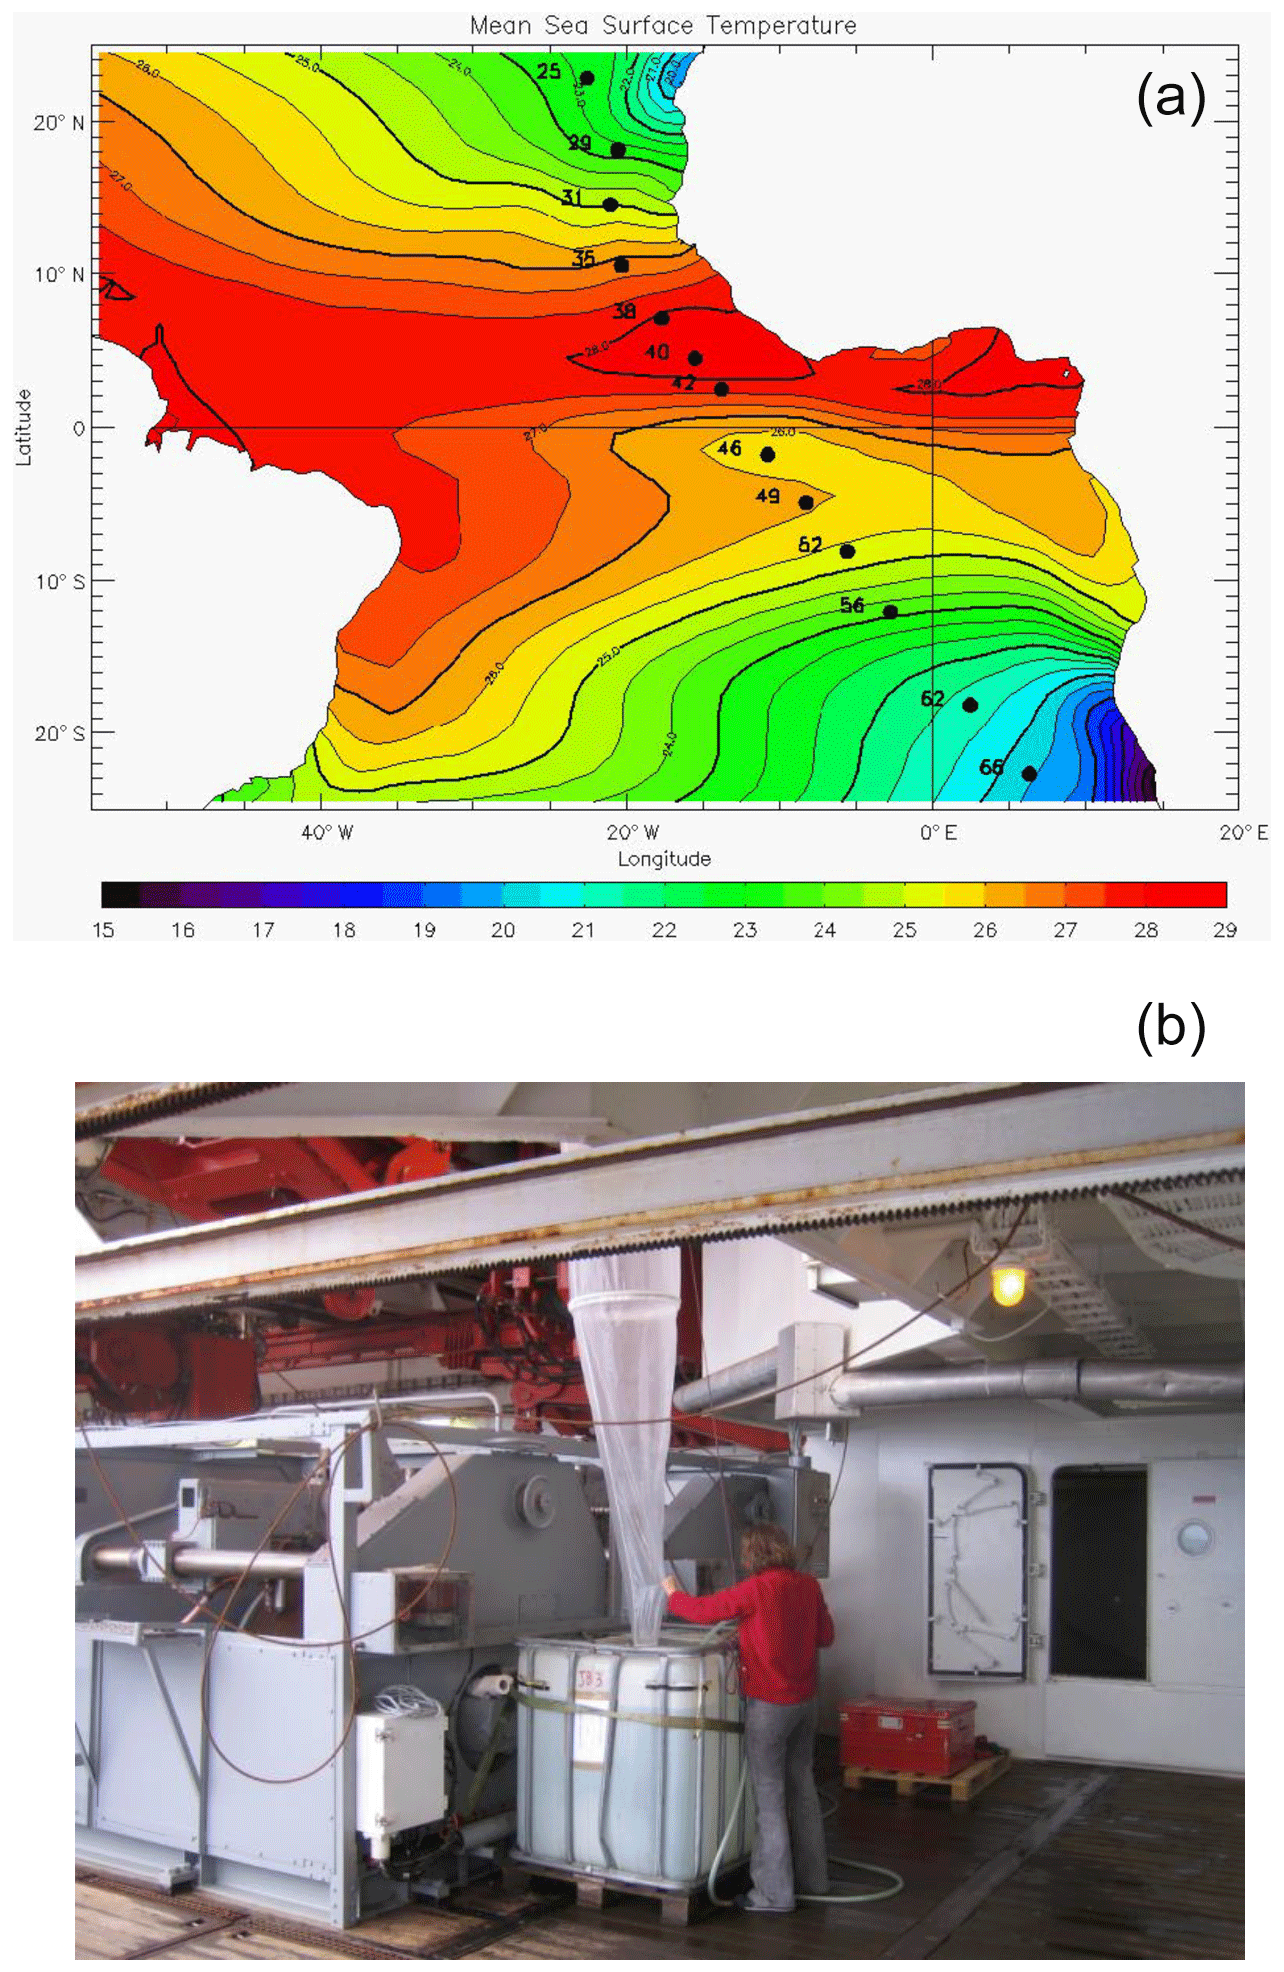
Figure 1Stations used in this study plotted on gridded data set (Reynolds et al., 2002) (a). Setup for planktonic foraminifera collections (b).
2.1 Collection procedure
Foraminifera were collected between October and November 2005 on board the research vessel Polarstern (ANT XXIII/1) during a meridional transect of the Atlantic Ocean (Bremerhaven, Germany, to Cape Town, South Africa; Fig. 1a). Foraminifera were continuously collected from a depth of ca. 10 m using the ship's membrane pump (3 m3 h−1). The water flowed into a plankton net (125 µm) that was fixed in a 1000 L plastic tank with an overflow (Fig. 1b). Every 8 h, the plankton accumulated in the net was collected. Temperature and salinity of surface seawaters were continuously recorded by the ship's systems, and discrete water samples were collected for later analyses of total ALK, DIC and δ18Ow (see Table 1). Plankton and water samples were poisoned with buffered formaldehyde solution (20 %) and HgCl2 (1.5 mL with 70 gL−1 HgCl2 for 1 L samples), respectively. In total, more than 70 plankton samples were collected during the transect, covering a large range in both temperature and salinity. Specimens of T. sacculifer from 13 selected stations, selected as to maximize temperature and salinity ranges, were picked and prepared for analyses. Salinity, temperature, DIC, ALK and δ18Ow data reported in this paper represent October/November values for the selected stations.
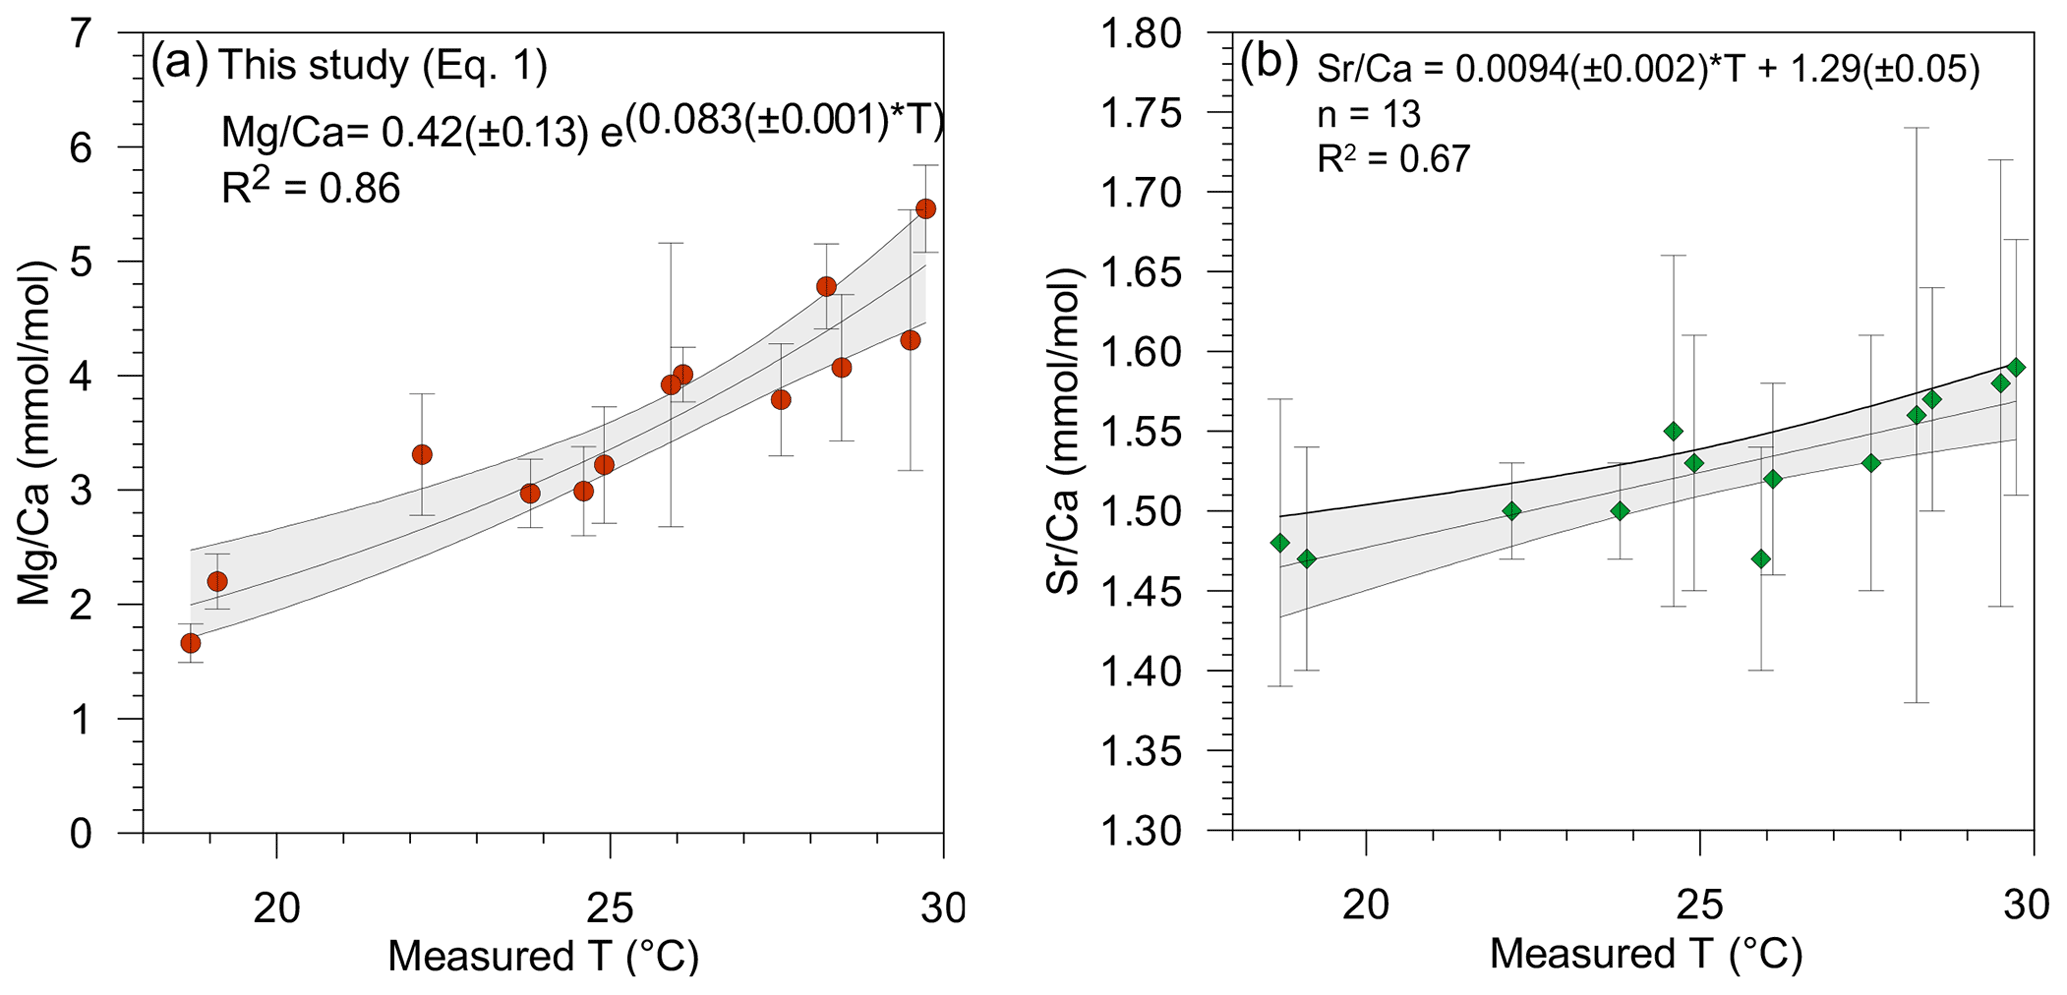
Figure 2(a) Mg∕Ca and (b) Sr∕Ca (mmol mol−1) and 95 % confidence intervals plotted versus measured surface temperature (∘C). Each point represents an average of the Mg∕Ca and Sr∕Ca per station.
2.2 Description of species
Trilobatus sacculifer is a spinose species with endosymbiotic dinoflagellates inhabiting the shallow (0–80 m deep) tropical and subtropical regions of the world's oceans. This species displays a large tolerance to temperature (14–32 ∘C) and salinity (24–47) (Hemleben et al., 1989; Bijma et al., 1990). Based on differences in the shape of the last chamber of adult specimens, various morphotypes can be distinguished. Among others the last chamber can be smaller than the penultimate chamber, in which case it is called kummerform (kf). This species shows an ontogenetic depth migration and predominantly reproduces at depth around full moon (Bijma and Hemleben, 1994). Just prior to reproduction, a secondary calcite layer, called gametogenic (GAM) calcite, is added (Bé et al., 1982; Bijma and Hemleben, 1994; Bijma et al., 1994). Juveniles (< 100 µm) ascend in the water column and reach the surface after less than approximately 2 weeks. Pre-adult stages then slowly descend within 9–10 d to the reproductive depth. In our samples (collected between 0 and 10 m depth), T. sacculifer specimens have not yet added the Mg-enriched gametogenic calcite which generally occurs deeper in the water column just prior to reproduction. Therefore, only the trilobus morphotype without GAM calcite is considered in this study, which limits the environmental, ontogenetic and physiological variability between samples even if a rather wide size fraction (230 to 500 µm) was selected due to sample size limitation. This should be taken into account when compared with other calibrations based on core top and/or sediment-trap-collected specimens.
2.3 Seawater analysis
The DIC and ALK analyses of the sea water were carried out at the Leibniz Institute of Marine Sciences at the Christian-Albrechts University of Kiel (IFM-GEOMAR), Germany. Analyses were performed by extraction and subsequent coulometric titration of evolved CO2 for DIC (Johnson et al., 1993) and by open-cell potentiometric seawater titration for ALK (Mintrop et al., 2000). Precision/accuracy of DIC and ALK measurements are 1 µmol kg−1/2 µmol kg−1 and 1.5 µmol kg−1/3 µmol kg−1, respectively. Accuracy of both DIC and ALK was assured by the analyses of certified reference material (CRM) provided by Andrew Dickson from Scripps Institution of Oceanography, La Jolla, USA. Measurements of δ18Ow were carried out at the Faculty of Geosciences, Utrecht University, the Netherlands. Samples were measured using a GasBench II – Delta plus XP combination. Results were corrected for drift with an in-house standard (RMW) and are reported on V-SMOW scale with a precision of 0.1 ‰ and accuracy verified against NBS-19 of 0.2 ‰, respectively. For reconstruction calculations, δ18Ow data were corrected to the PDB scale by subtracting 0.27 ‰ (Hut, 1987).
2.4 Carbonate analysis
2.4.1 Foraminiferal sample preparation
Under a binocular microscope, the maximum test diameter of each specimen was measured, and individual tests were weighed on a microbalance (METTLER TOLEDO, precision ± 0.1 µg). Since the foraminifera were never in contact with sediments, the rigorous cleaning procedure required for specimens collected from sediment cores was not necessary. Prior to analysis, the tests were cleaned following a simplified cleaning procedure: all specimens were soaked for 30 min in a 3 %–7 % NaOCl solution (Gaffey and Brönniman, 1993). A stereomicroscope was used during cleaning, and specimens were removed from the reagent directly after complete bleaching. The samples were immediately and thoroughly rinsed with deionized water to ensure complete removal of the reagent. After cleaning, specimens were inspected with scanning electron microscopy and showed no visible signs of dissolution. This cleaning procedure preserves original shell thickness and thus maximizes data acquisition during laser ablation. Foraminifera were fixed on a double-sided adhesive tape and mounted on plastic stubs for LA-ICP-MS analyses.
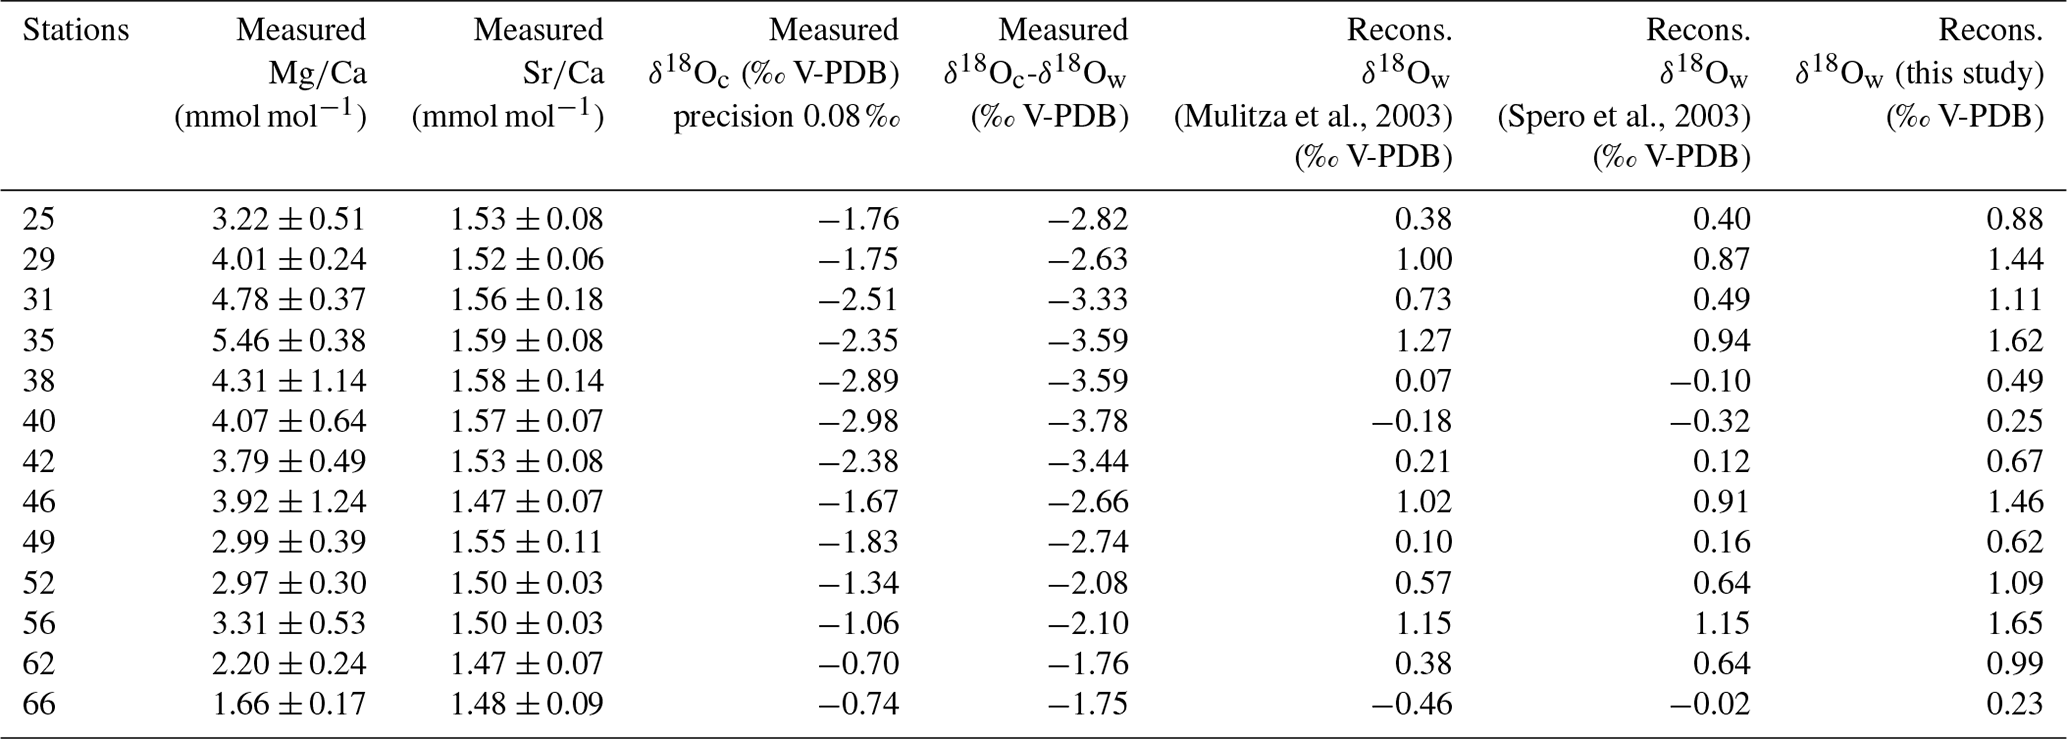
Table 2Mean elemental (Mg∕Ca and Sr∕Ca) and isotopic (δ18Oc) composition per station measured in foraminiferal calcite in millimoles per mole (mmol mol−1) and per mille PDB (‰ PDB), respectively. Elemental and isotopic compositions were determined on the same material (n varying from 5 to 13 specimens per station). Isotopic analyses were done in duplicate for each station. Mean δ18Oc-δ18Ow were measured per stations in per mille PDB (‰ PDB).
2.4.2 Elemental composition analysis
For each station, 5–13 specimens were analyzed. Their last chambers were ablated using an excimer 193 nm deep ultraviolet laser (Lambda Physik) with GeoLas 200Q optics (Reichart et al., 2003), creating 80 µm diameter craters. The pulse repetition rate was set at 6 Hz with an energy density at the sample surface of 1 J cm−2. The ablated material was transported on a continuous helium flow into the argon plasma of a quadrupole ICP-MS instrument (Micromass Platform) and analyzed with respect to time. The ablation of calcite requires ultraviolet wavelengths as an uncontrolled disruption would result from higher wavelengths. By using a collision and reaction cell spectral interferences on the minor isotopes of Ca (42Ca, 43Ca and 44Ca) were reduced and interferences of clusters like 12C16O16O were prevented. Analyses were calibrated against NIST 610 glass using the concentration data of Jochum et al. (2011) with Ca as the internal standard. For Ca quantification, mass 44 was used while monitoring masses 42 and 43 as an internal check. In the calcite, the Ca concentration was set at 40 %, allowing direct comparison to trace metal/Ca from traditional wet-chemical studies. Mg concentrations were calculated using masses 24 and 26; Sr concentrations were calculated with mass 88. One big advantage in using LA-ICP-MS measurements is that single laser pulses remove only a few nanometers of material, which allows high-resolution trace element profiles to be acquired (e.g., Reichart et al., 2003; Regenberg et al., 2006; Dueñas-Bohórquez et al., 2009, 2011; Hathorne et al., 2009; Munsel et al., 2010; Dissard et al., 2009, 2010a, b; Evans et al., 2013, 2015; Steinhardt, 2014, 2015; Fehrenbacher et al., 2015; Langer et al., 2016; Koho et al., 2015, 2017; Fontanier et al., 2018; de Nooijer et al., 2007, 2014, 2017a, b; Jentzen et al., 2018; Schmitt et al., 2019; Levi et al., 2019). Element concentrations were calculated for the individual ablation profiles integrating the different isotopes (glitter software). Even though the use of a single or very few specimens can be criticized when determining foraminifera Mg∕Ca and δ18O in order to perform paleoclimate reconstructions instead of more traditional measurements, Groeneveld et al. (2019) recently demonstrated that for both proxies, single specimen variability is dominated by seawater temperatures during calcification, even if the presence of an ecological effect leading to site-specific seasonal and depth habitat changes is also noticeable.
2.5 Stable isotope analysis
The specimens used for elemental composition analyses using LA-ICP-MS were subsequently carefully removed from the plastic stubs and rinsed with deionized water before measuring their stable isotope composition. Depending on shell weight, two to three foraminifera were necessary to obtain the minimum of 20 µg of material required for each analysis. Analyses were carried out in duplicate for each station. The results, compiled in Table 2, represent average measurements. The analyses were carried out at the Department of Earth Sciences of Utrecht University (the Netherlands) using a Kiel III and Finnigan MAT 253 mass spectrometer combination. The δ18Oc results are reported in per mille PDB (‰ PDB). Calibration was made with NBS-19 (precision of 0.06 ‰–0.08 ‰ for sample sizes of 20–100 µg, accuracy better than 0.2 ‰).
2.6 Statistical analysis
Within this paper, all statistical analyses with regards to elemental and isotopic data were carried out using the program R with default values (R Development Core Team, 2019).
3.1 Elemental composition
Overall values of the Mg∕Ca and Sr∕Ca ratios in the tests of T. sacculifer varied from 1.78 to 5.86 mmol mol−1 (Fig. 2a) and 1.41 to 1.52 mmol mol−1 (Fig. 2b), respectively (Table 2). These Mg∕Ca concentrations compare well with results found in the literature for this species from either culture experiments, plankton tow or surface sediment, growing at the same temperatures (e.g., Nürnberg et al., 1996; Anand et al., 2003; Regenberg et al., 2009; Fig. 3). Similarly, the overall variation in Sr∕Ca values reported in this study is comparable to that observed in core top and cultured G. ruber and T. sacculifer combined for comparable salinity and temperature conditions, (varying between 1.27 to 1.51 mmol mol−1; e.g., Cleroux et al., 2008; Kisakürek et al., 2008; Dueñas-Bohórquez et al., 2009).
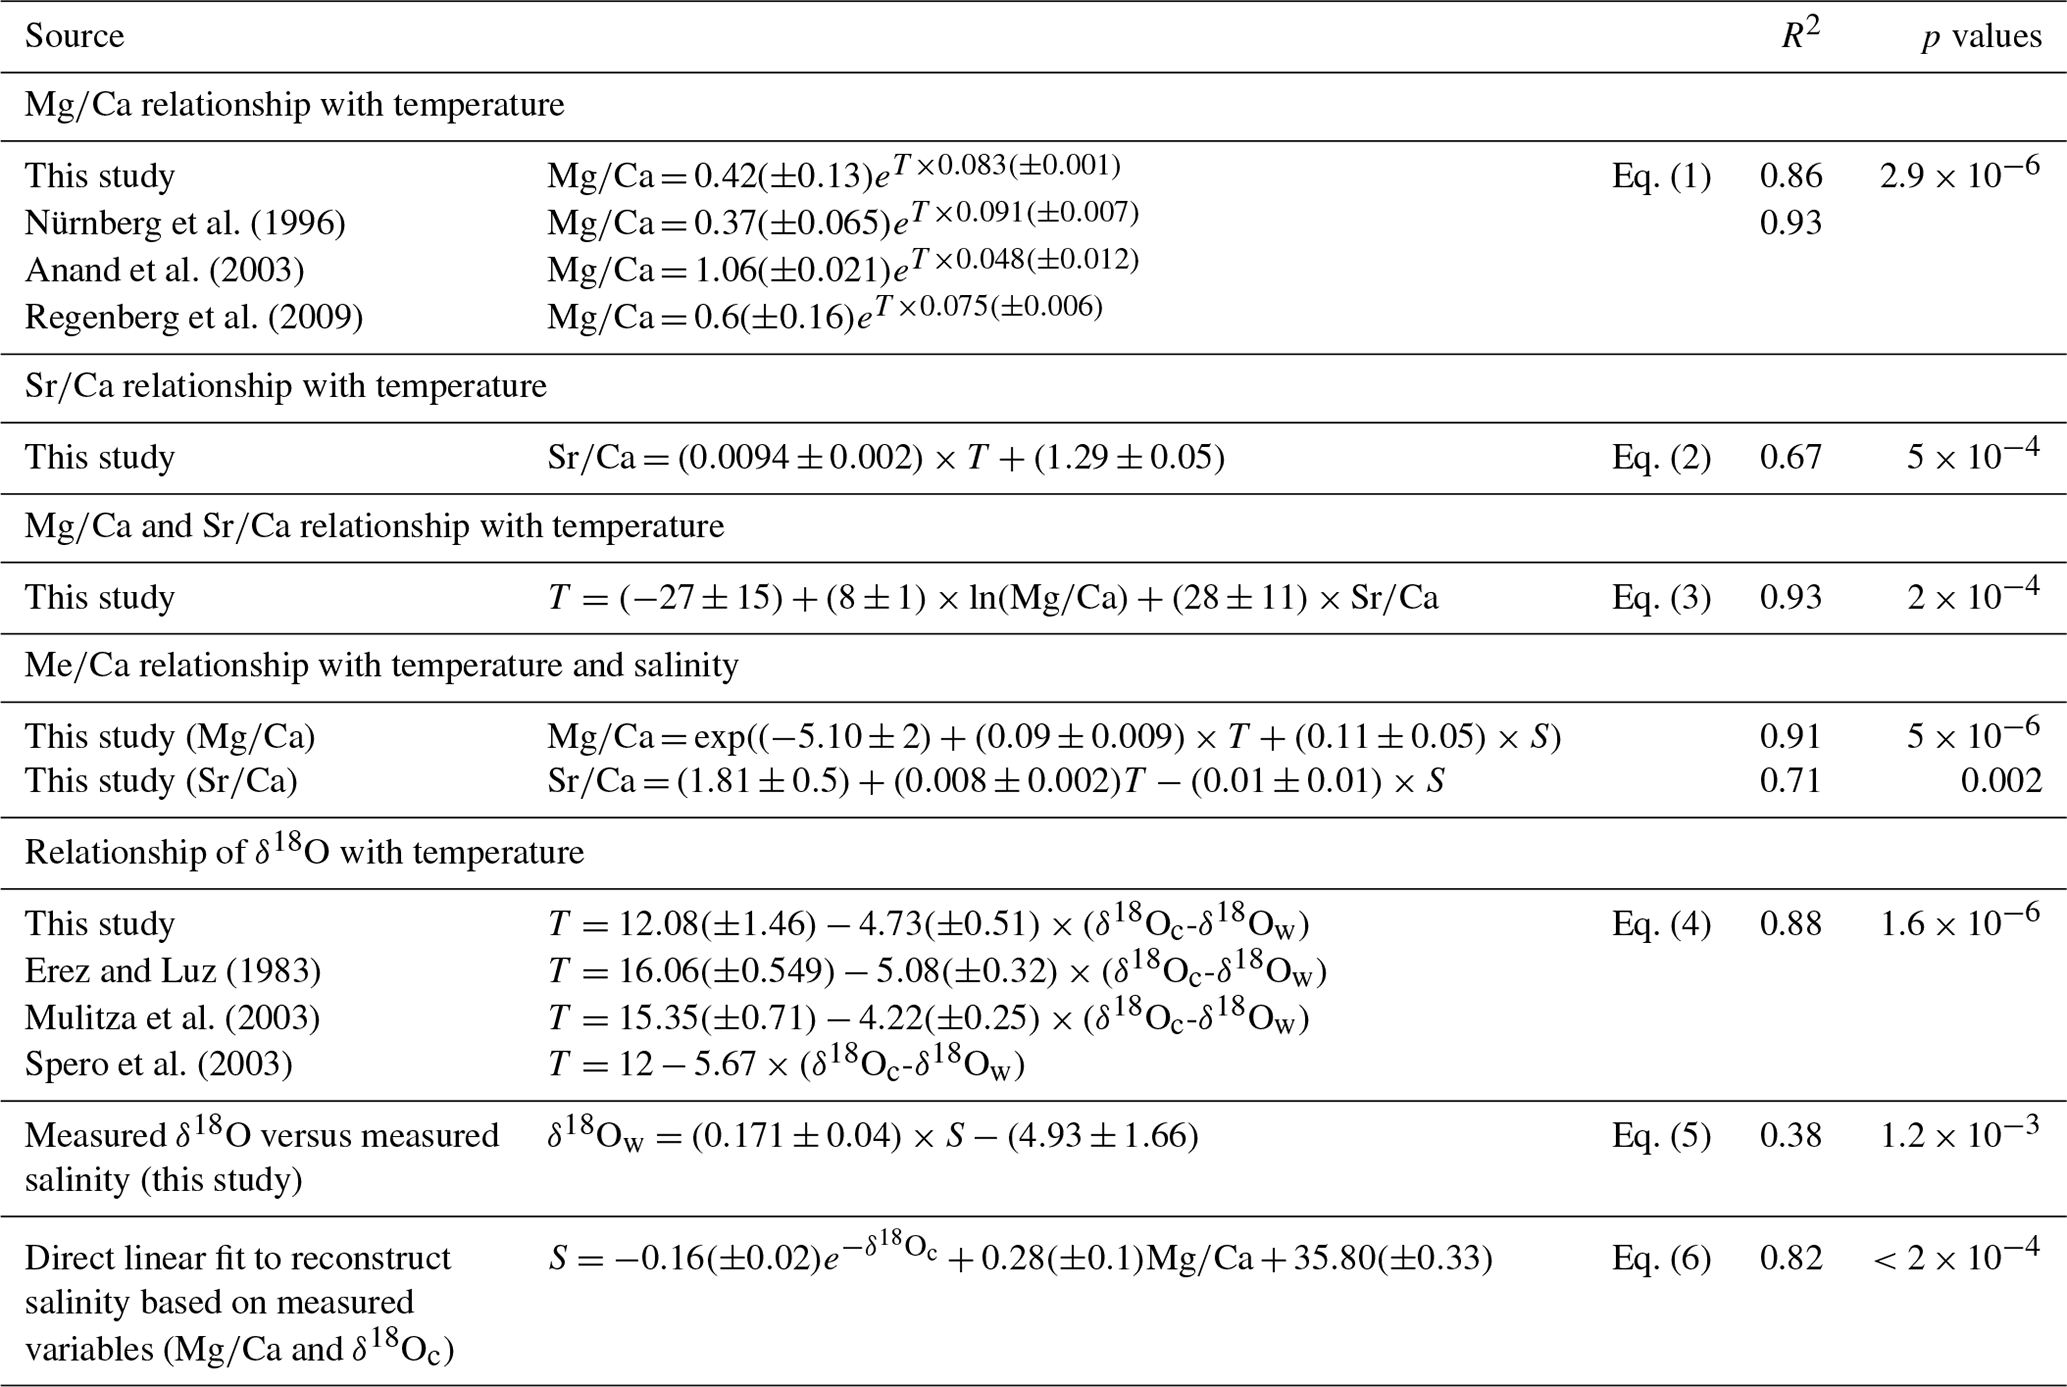
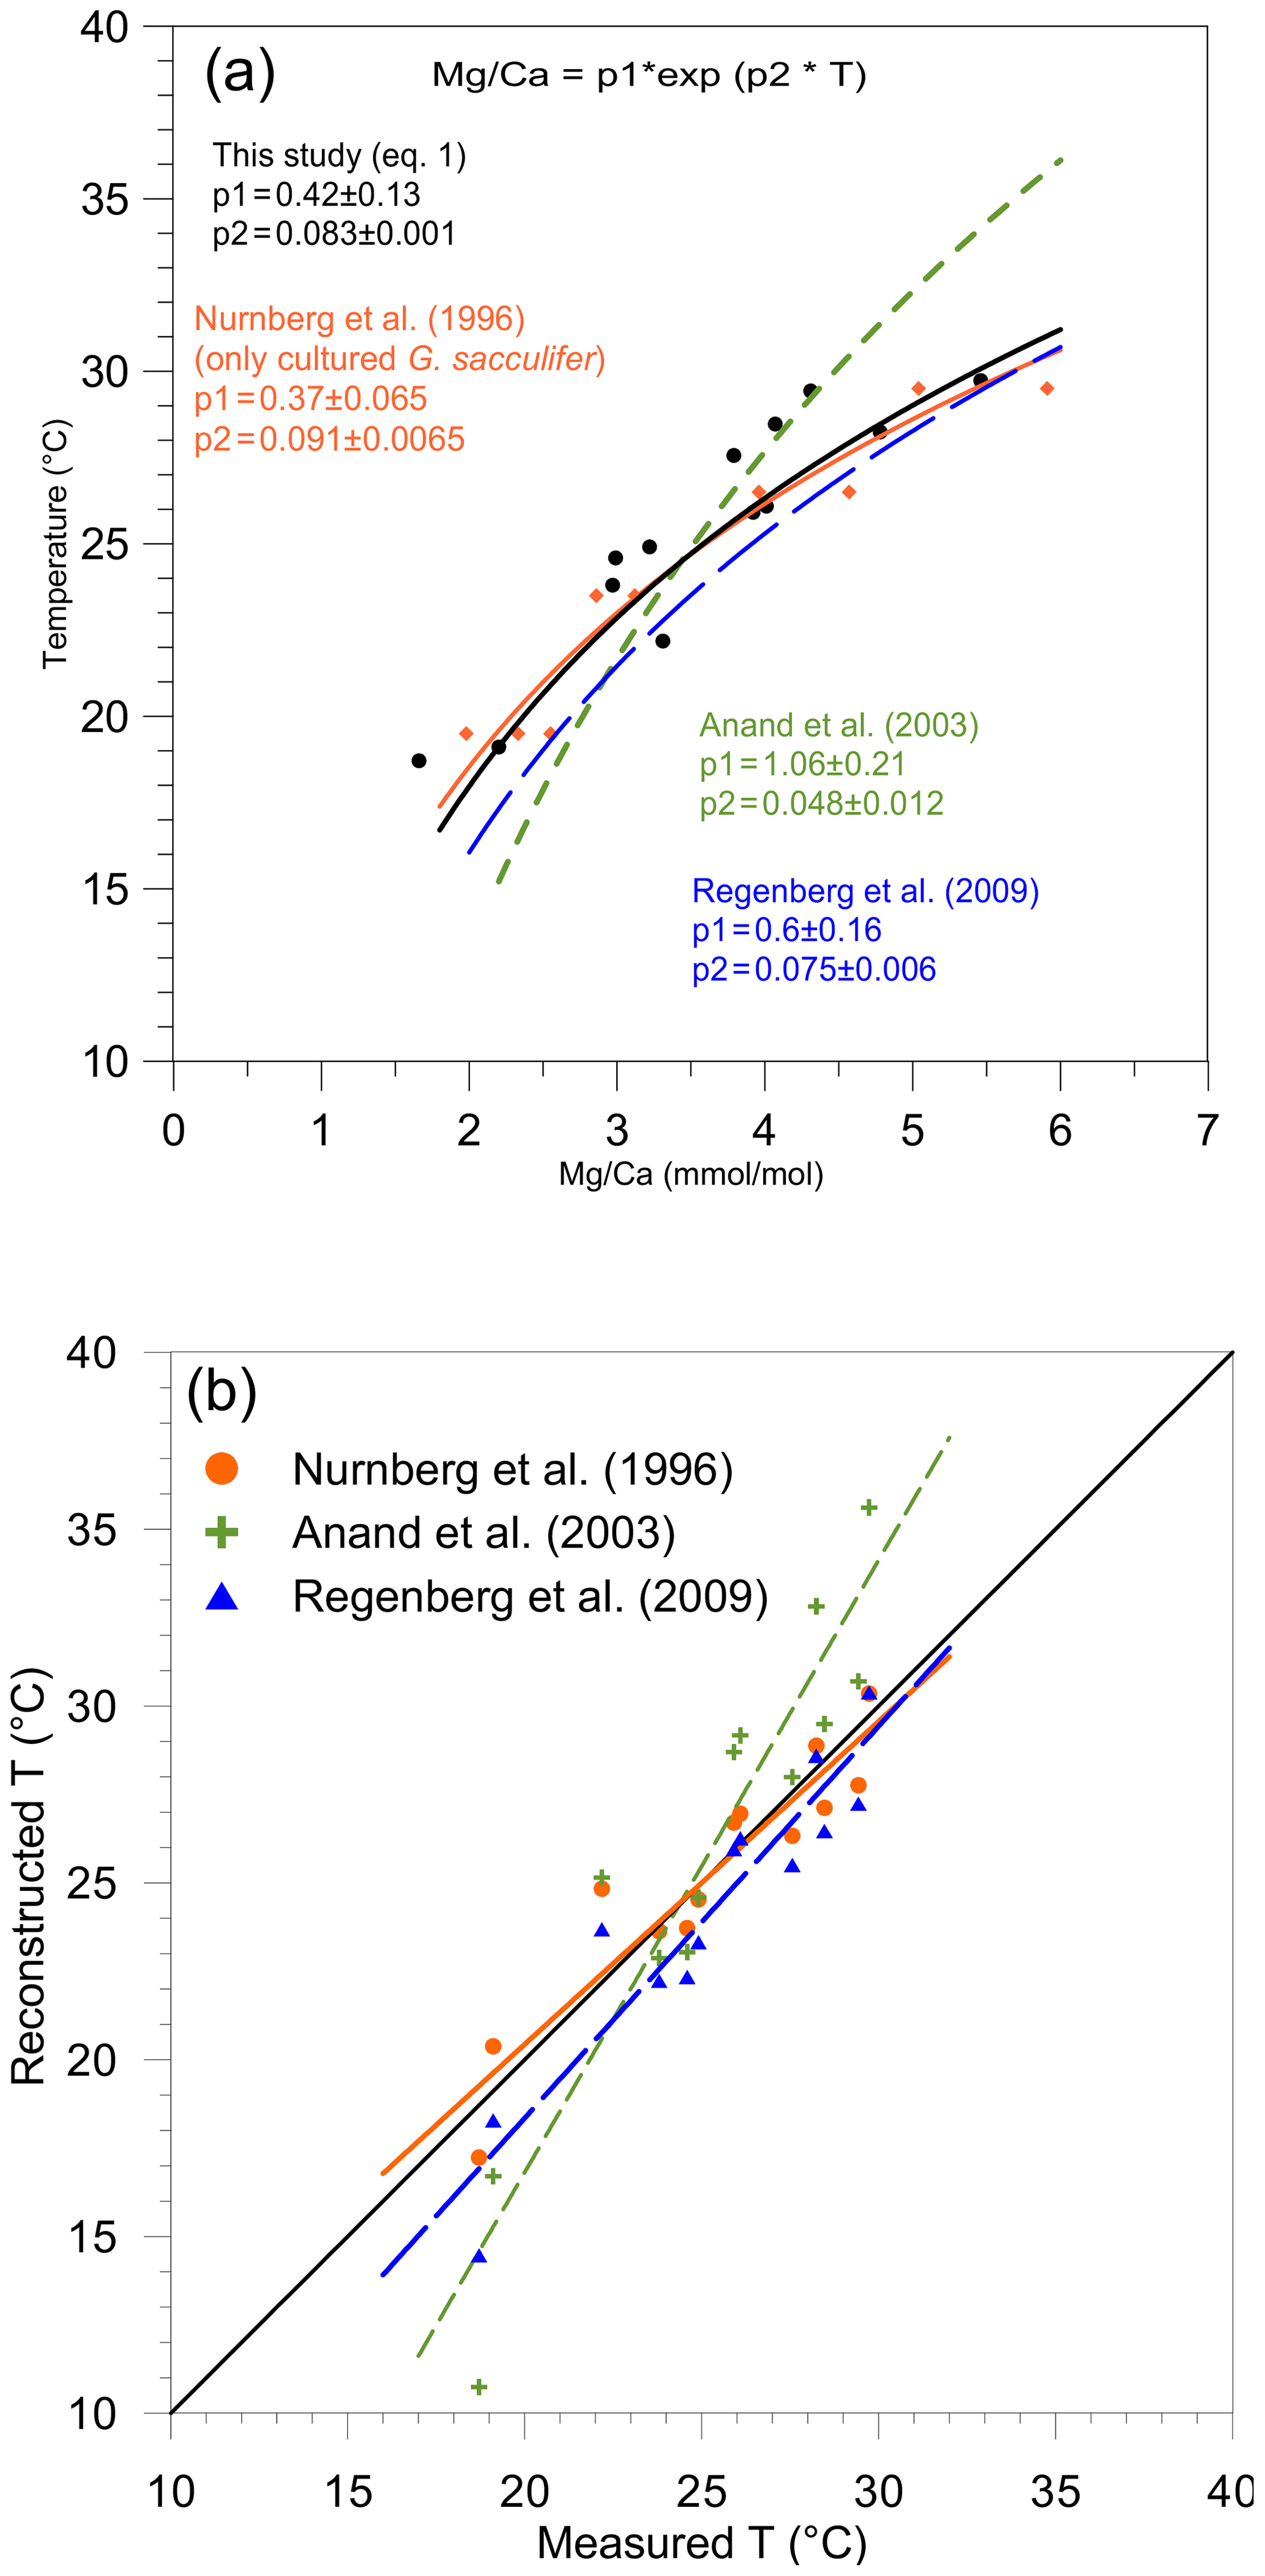
Figure 3(a) Mg/paleotemperature equations established in this study (Eq. 1) (black dots and full line); based on the data of Nürnberg et al. (1996) (orange diamonds and large, full orange line), Anand et al. (2003) (small dotted green lines), and Regenberg et al. (2009) (large dotted blue line). (b) Reconstructed Mg temperatures (October/November 2005) plotted versus measured temperatures (∘C) presented in Table 1. For each station, mean measured Mg∕Ca was inserted into the equation of Nürnberg et al. (1996) (only cultured specimens of T. sacculifer) (orange dots, full line), the equation of Anand et al. (2003) (green crosses, small dashed line), and the equation of Regenberg et al. (2009) (blue triangles, large dashed line).
The relationship between both Mg∕Ca and Sr∕Ca ratios and measured temperatures were calculated using least square differences. Both show a good correlation with surface water temperature (Fig. 2, Table 3). The Mg∕Ca ratio increases exponentially by 8.3 % per degree Celsius (best fit) (Mg∕Ca and Sr∕Ca ratios given in mmol mol−1):
whereas Sr∕Ca ratio increases linearly by 0.6 % per degree Celsius (Fig. 2a and b) (best fit):
Concerning the temperature reconstruction, by inverting the approach, univariate regressions yields the following:
and
Combining Mg and Sr data for a nonlinear multivariate regression allows for the improvement of the correlation with temperature (best fit):
For comparison with regression found in the literature, Mg∕Ca is estimated below as a function of temperature and Sr∕Ca:
Regression for the relationship between salinity and Mg∕Ca ratios does not show any clear correlation (R2=0.09, p value = 0.32). This is in good agreement with previous culture experiment studies which only report a minor sensitivity of Mg∕Ca to salinity in planktonic foraminifera (e.g., Dueñas-Bohórquez et al., 2009; Hönisch et al., 2013; Kisakürek et al., 2008; Nürnberg et al., 1996). The correlation observed between Sr∕Ca ratios and salinity (R2 = 0.29, p value = 0.053) is better compared to that between Mg∕Ca and salinity, but it remains relatively weak. Nevertheless, recalculated regressions of Mg∕Ca incorporating salinity show an improvement in the correlation with temperature (best fit):
This result is in good agreement with the recent study of Gray and Evans (2019), who reported the minor Mg∕Ca sensitivity of Trilobatus sacculifer to salinity (3.6 ± 0.01 % increase per salinity unit) and described, based on previously published culture experiments' data (Dueñas-Bohórquez et al., 2009; Hönisch et al., 2013; Kisakürek et al., 2008; Lea et al., 1999; Nürnberg et al., 1996), a similar fit allowing the assessment of the sensitivity of foraminiferal Mg∕Ca of T. sacculifer to temperature and salinity combined.
RSE = 0.51 (Gray and Evans, 2019).
Applying the equation of Gray and Evans (2019) to our data leads to a correlation of 0.90, which is identical to our findings. In order to further compare both equations, Mg∕Ca values from our study were used to reconstruct temperature and salinity using the fit established per Gray and Evans (2019) versus reconstructed temperature and salinity using our fit. The observed R2 values are then 0.99 and 0.48 for temperature and salinity, respectively. We can conclude that if the equation of Gray and Evans (2019) is in perfect agreement with our equation with regards to the temperature parameter, this is not the case for salinity, which shows a strong difference between the two equations and is most probably explained by the weak correlation of Mg∕Ca to salinity in our data. Subsequently, the Bayesian model of Tierney et al. (2019) considering the group-specific core-top model for T. sacculifer was applied to our data. With that aim, Ω−2 and pH were calculated using ALK and DIC data presented in Table 1. Because foraminifera in our studies were not submitted to cleaning protocols with a reductive step, the clean parameter was set to 0. It led to the following correlation:
Here we can conclude that despite the difference in sampling strategy and samples' geographical distribution, our regression models are in line with the previous work of Gray and Evans (2019) and Tierney et al. (2019).
3.2 Stable isotope concentration
The δ18O (PDB) values of the tests (δ18Oc) and of the seawater (δ18Ow) vary from −0.70 ‰ to −2.98 ‰ and from 0.74 ‰ to 1.25 ‰, respectively (Tables 1 and 2). The relationship between temperature and the foraminiferal δ18O (expressed as a difference to the δ18Ow of the ambient seawater) was estimated with a linear least squares regression:
The oxygen isotope fractionation (δ18Oc-δ18Ow) shows a strong correlation with in situ surface water temperature (linear increase of 0.17 ‰ per degree Celsius).
3.3 Comparison with previously established T. sacculifer temperature reconstruction equations
As mentioned above, average juvenile and pre-adult T. sacculifer specimens only spend between 9 to 10 d in surface waters. Therefore, measured in situ temperature is representative of the calcification temperatures. This is supported by the strong correlation between measured temperature and δ18O analyses (R2=0.90; Eq. 4) and measured temperature versus Mg∕Ca (R2=0.87; Eq. 1). Nevertheless, diurnal variations in temperatures cannot be discarded and may induce a slight offset between measured average temperature and mean calcification temperature.
For comparison, three Mg∕Ca temperature calibrations for T. sacculifer were considered in this paper: the equation of Nürnberg et al. (1996) based on laboratory cultures, the equation established by Anand et al. (2003) based on sediment trap samples, and the equation derived by Regenberg et al. (2009) based on surface sediment samples. In each of these studies, only T. sacculifer without SAC chamber were considered (Table 3).
Similarly, in addition to Eq. (4) established in this study, three δ18O-based paleotemperature equations for T. sacculifer were used for comparison with our data set: (1) Erez and Luz (1983) and (2) Spero et al. (2003), both based on cultured specimens, and (3) Mulitza et al. (2003), based on surface water samples (Fig. 4; Table 3).
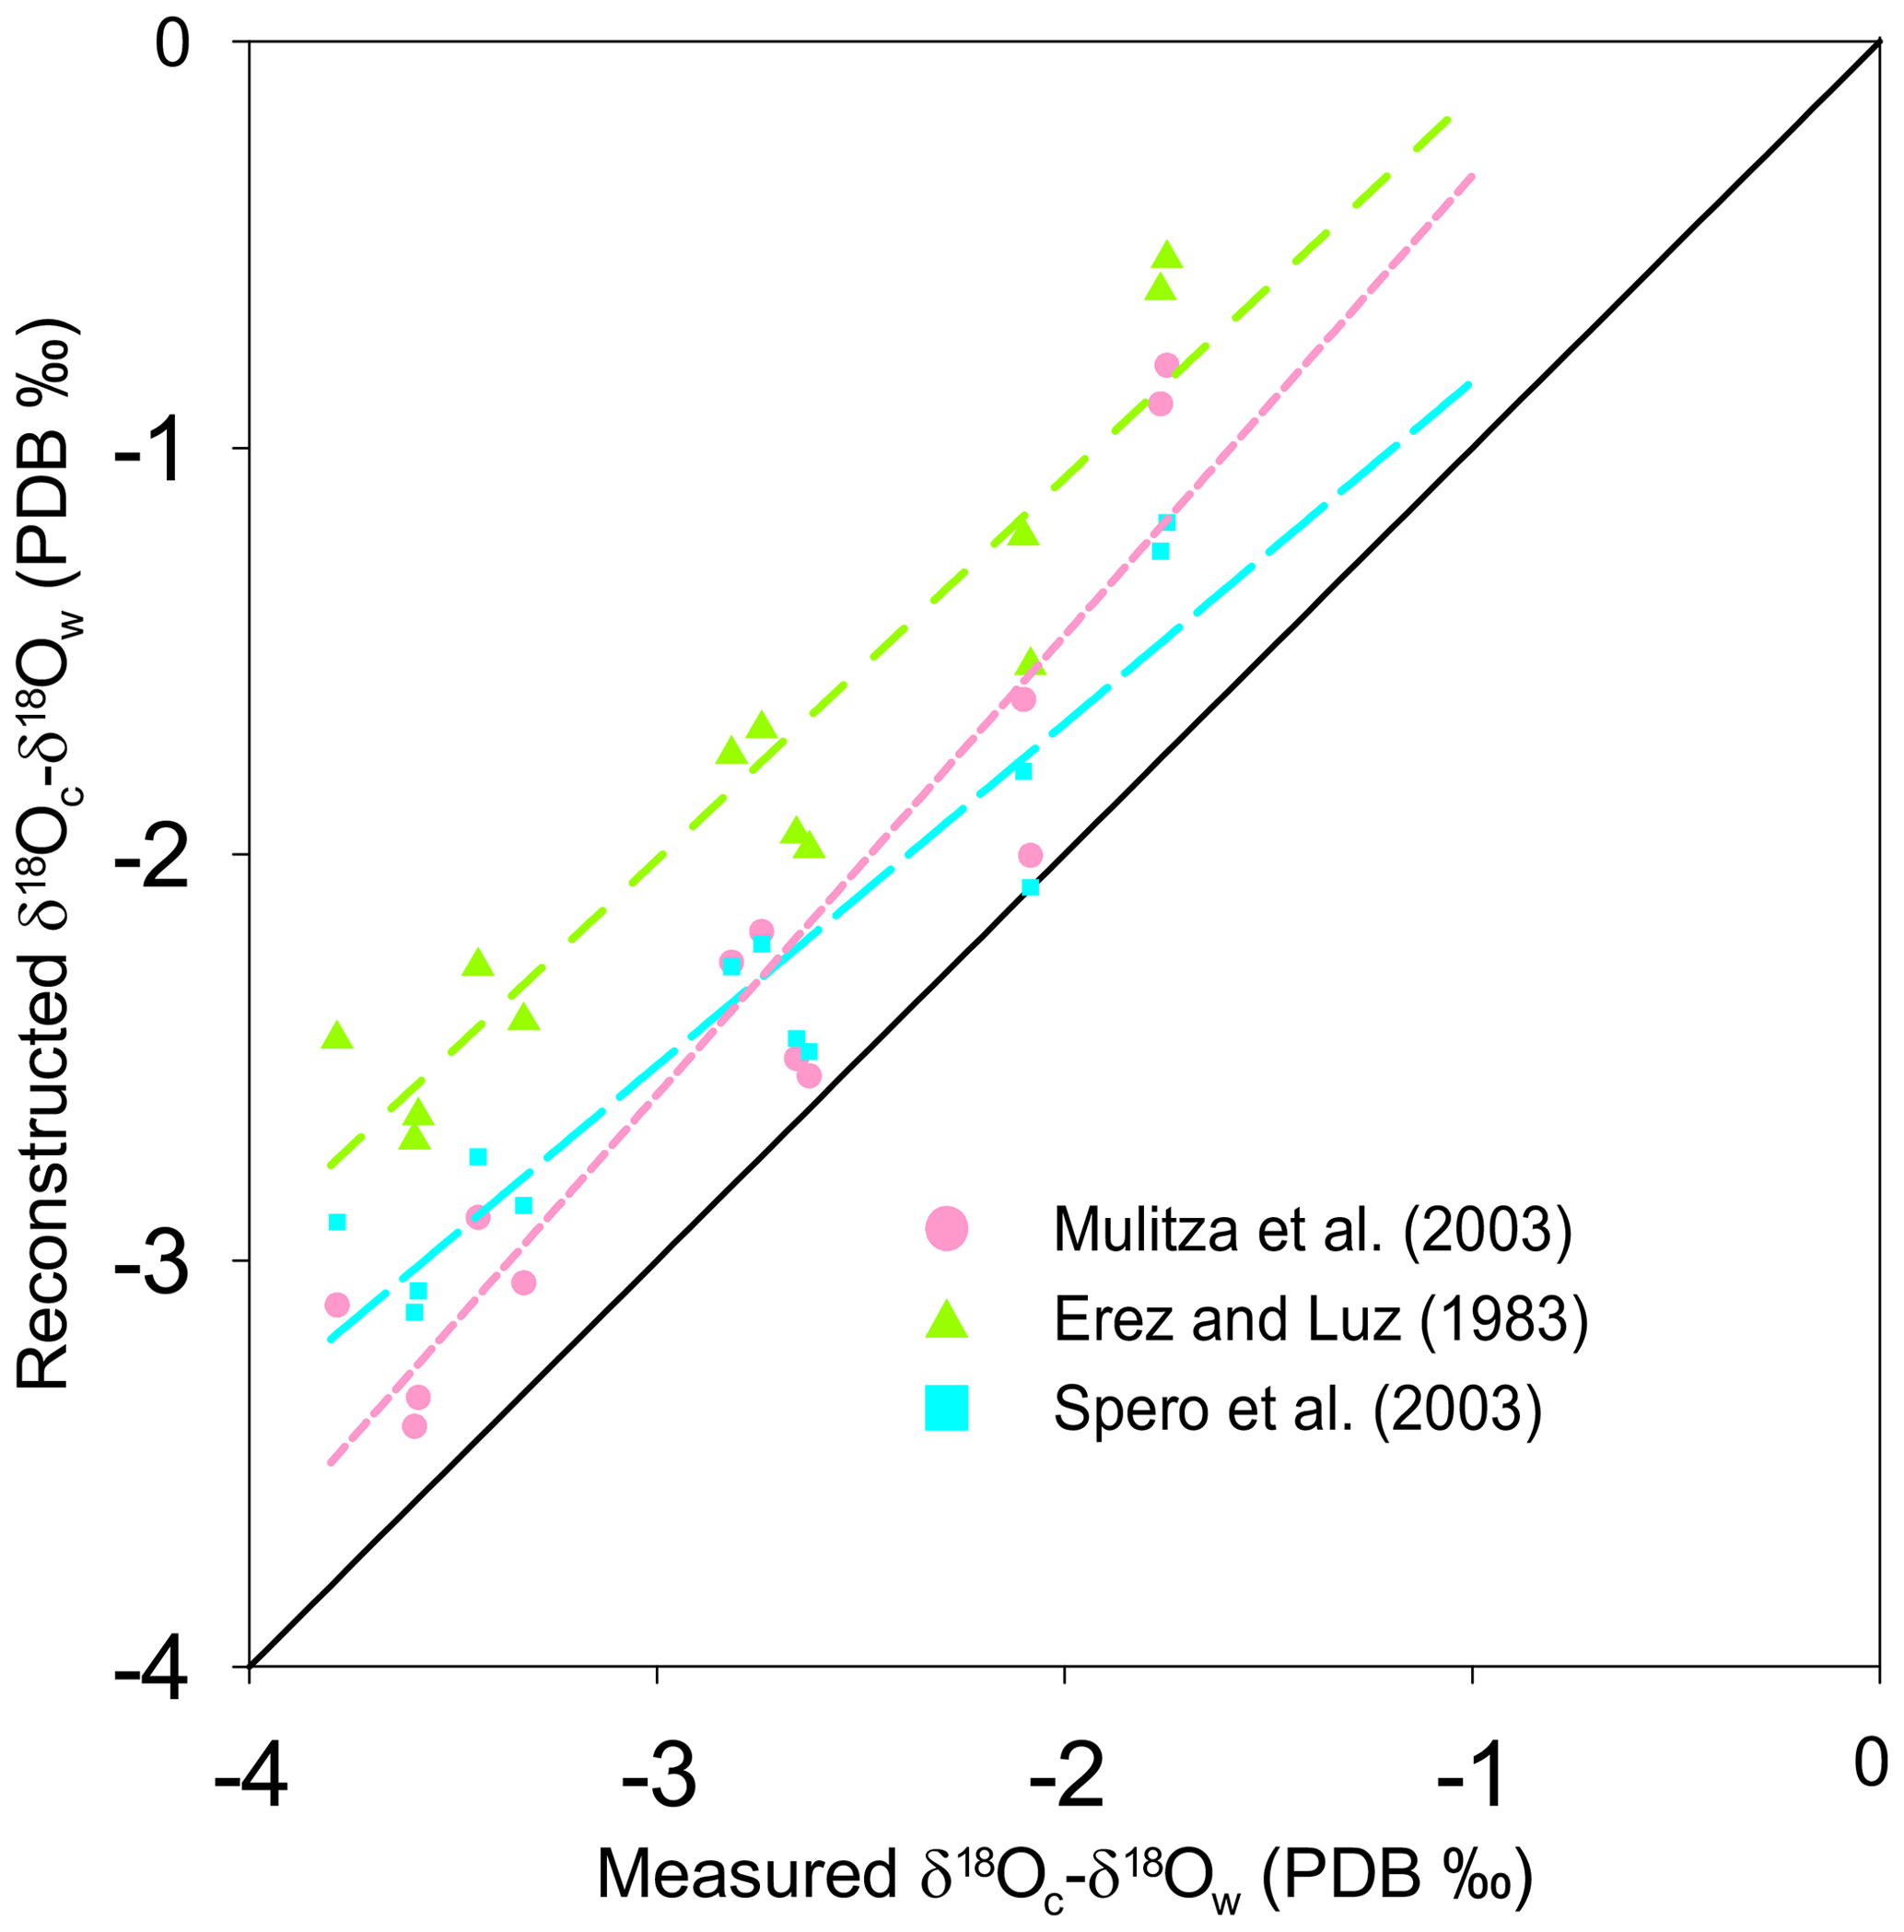
Figure 4Reconstruction of δ18Oc-δ18Ow by inserting the measured temperature into three δ18O-based paleotemperature equations: the equation of Spero et al. (2003) (light blue squares, large light dashed blue line), the equation of Mulitza et al. (2003) (pink dots, small dashed pink line), and the equation sorted by Erez and Luz (1983) (green triangles, dashed green line) plotted versus measured δ18Oc-δ18Ow (‰ PDB). The diagonal line represents the 1:1 regression.
Table 4Temperature, salinity and δ18Ow of the stations used to determine the salinity–δ18Ow relationship (Eq. 5).
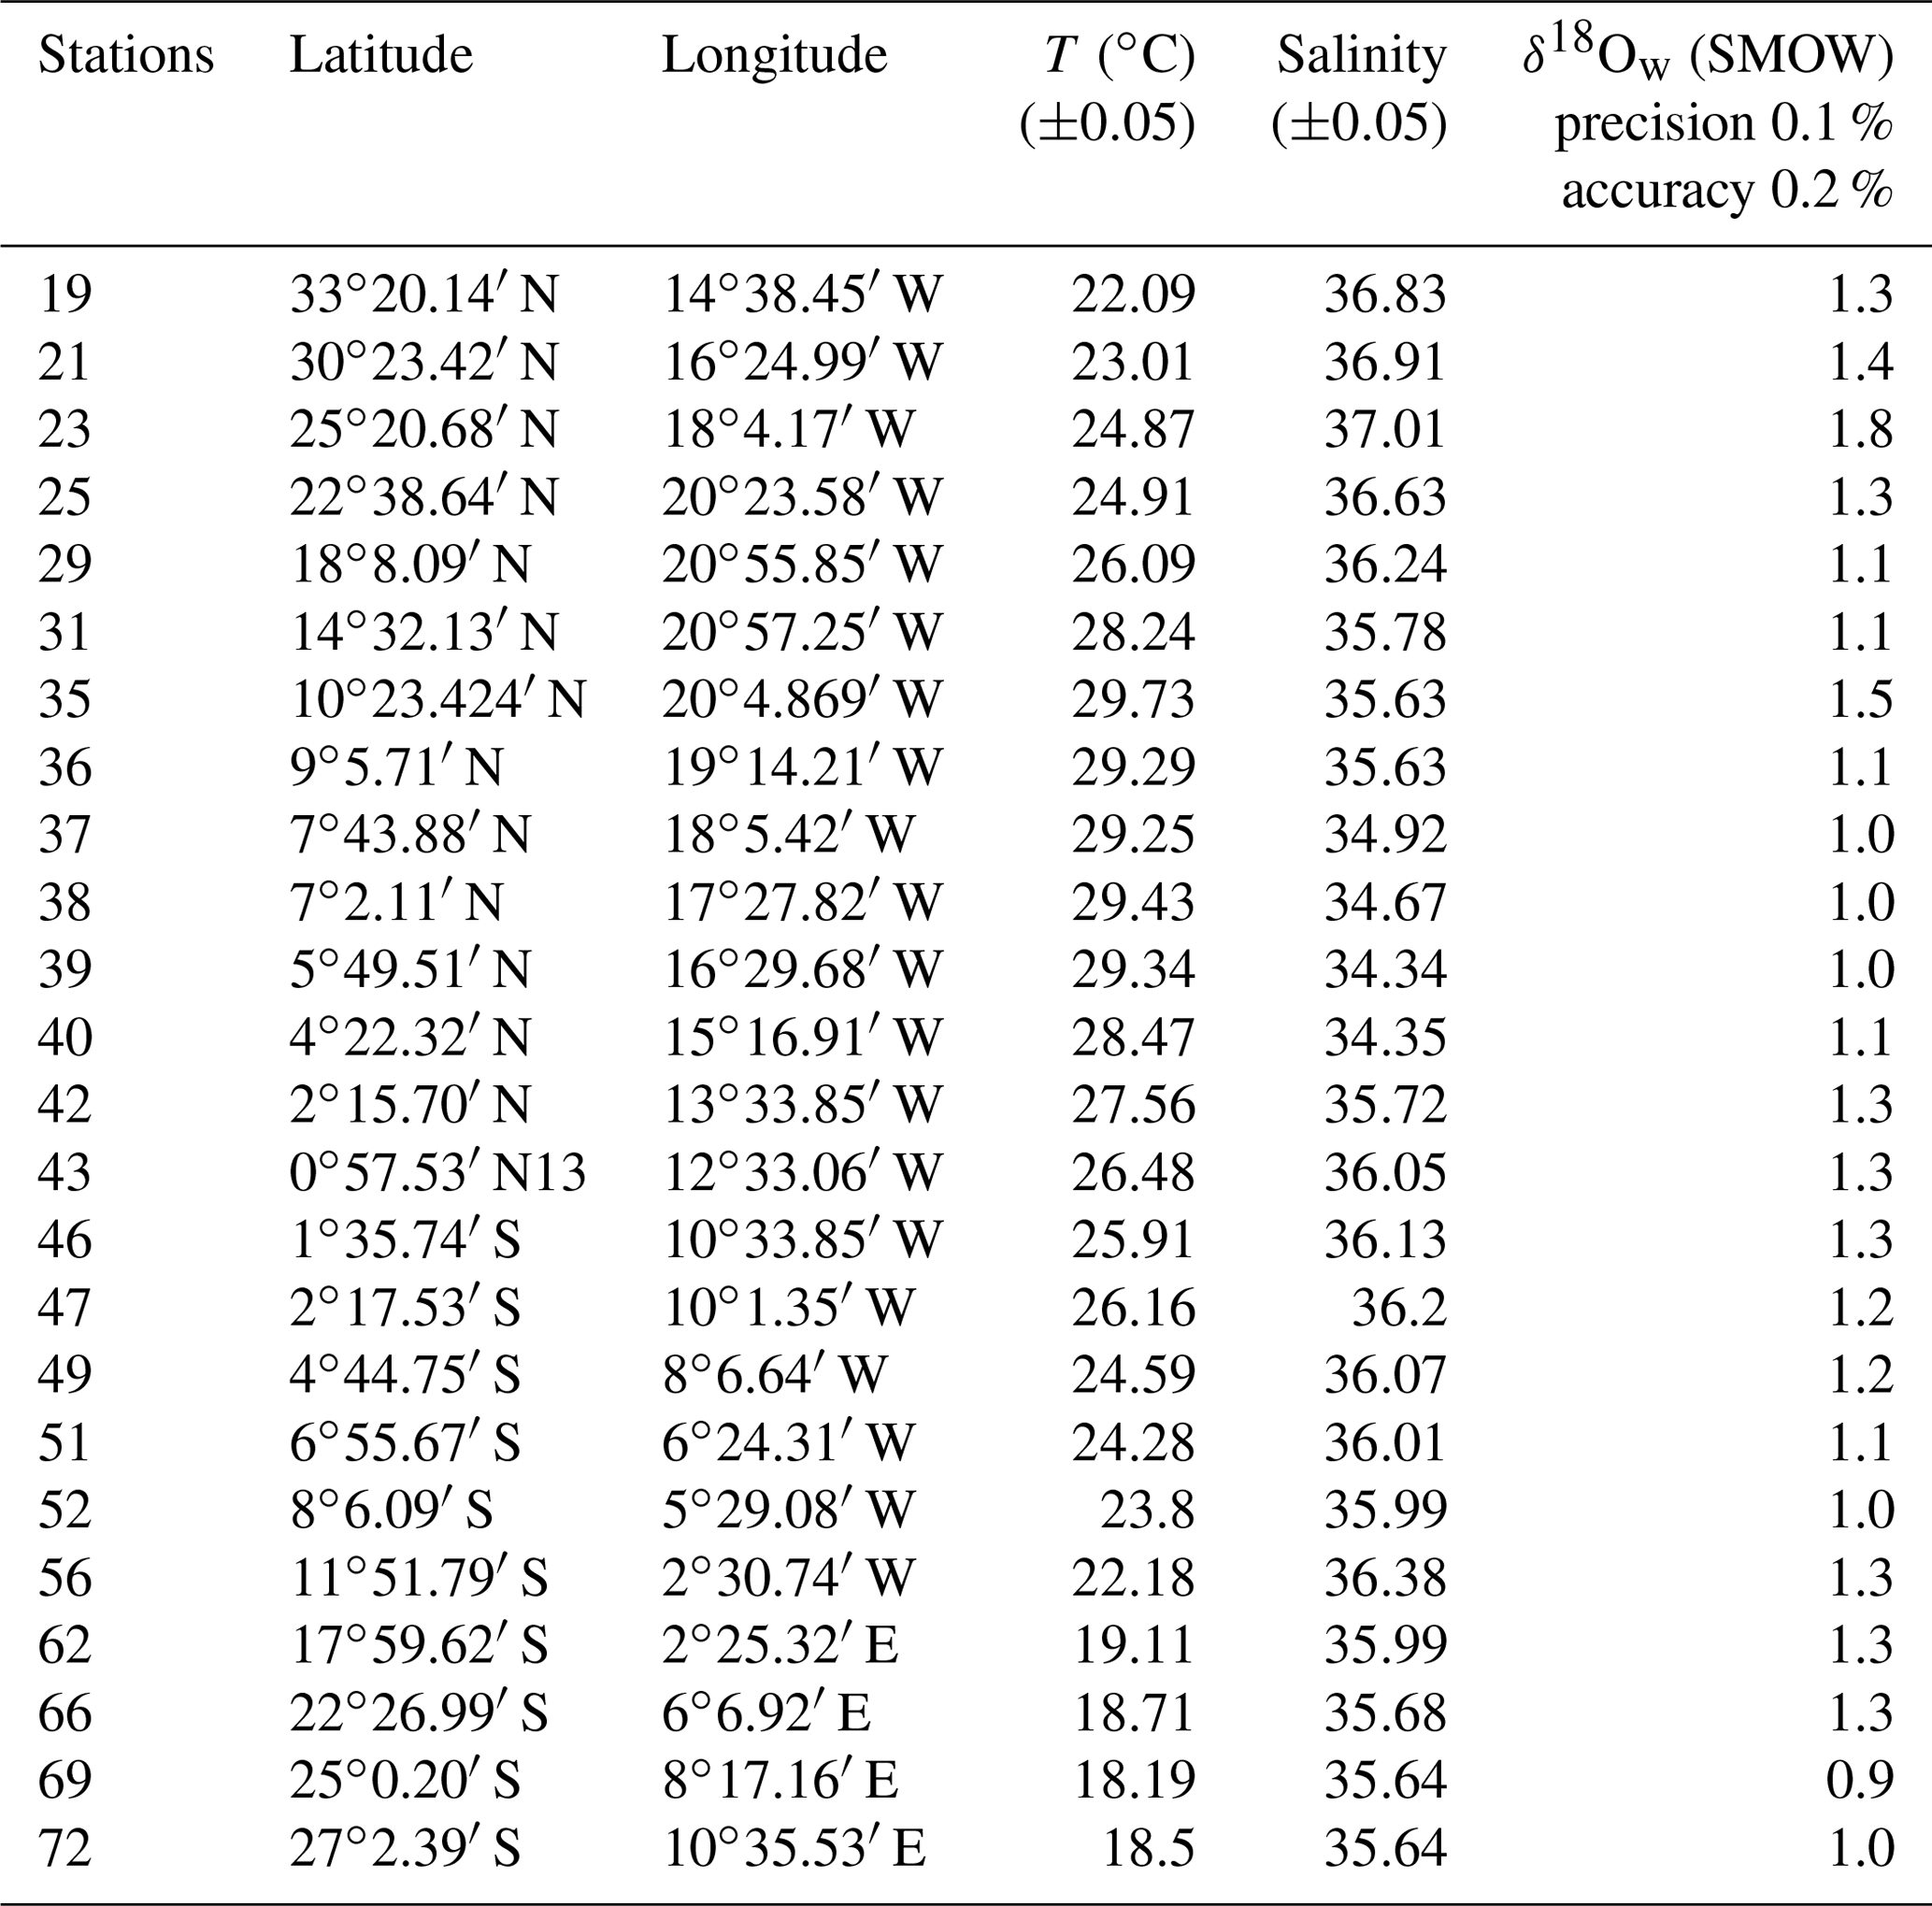
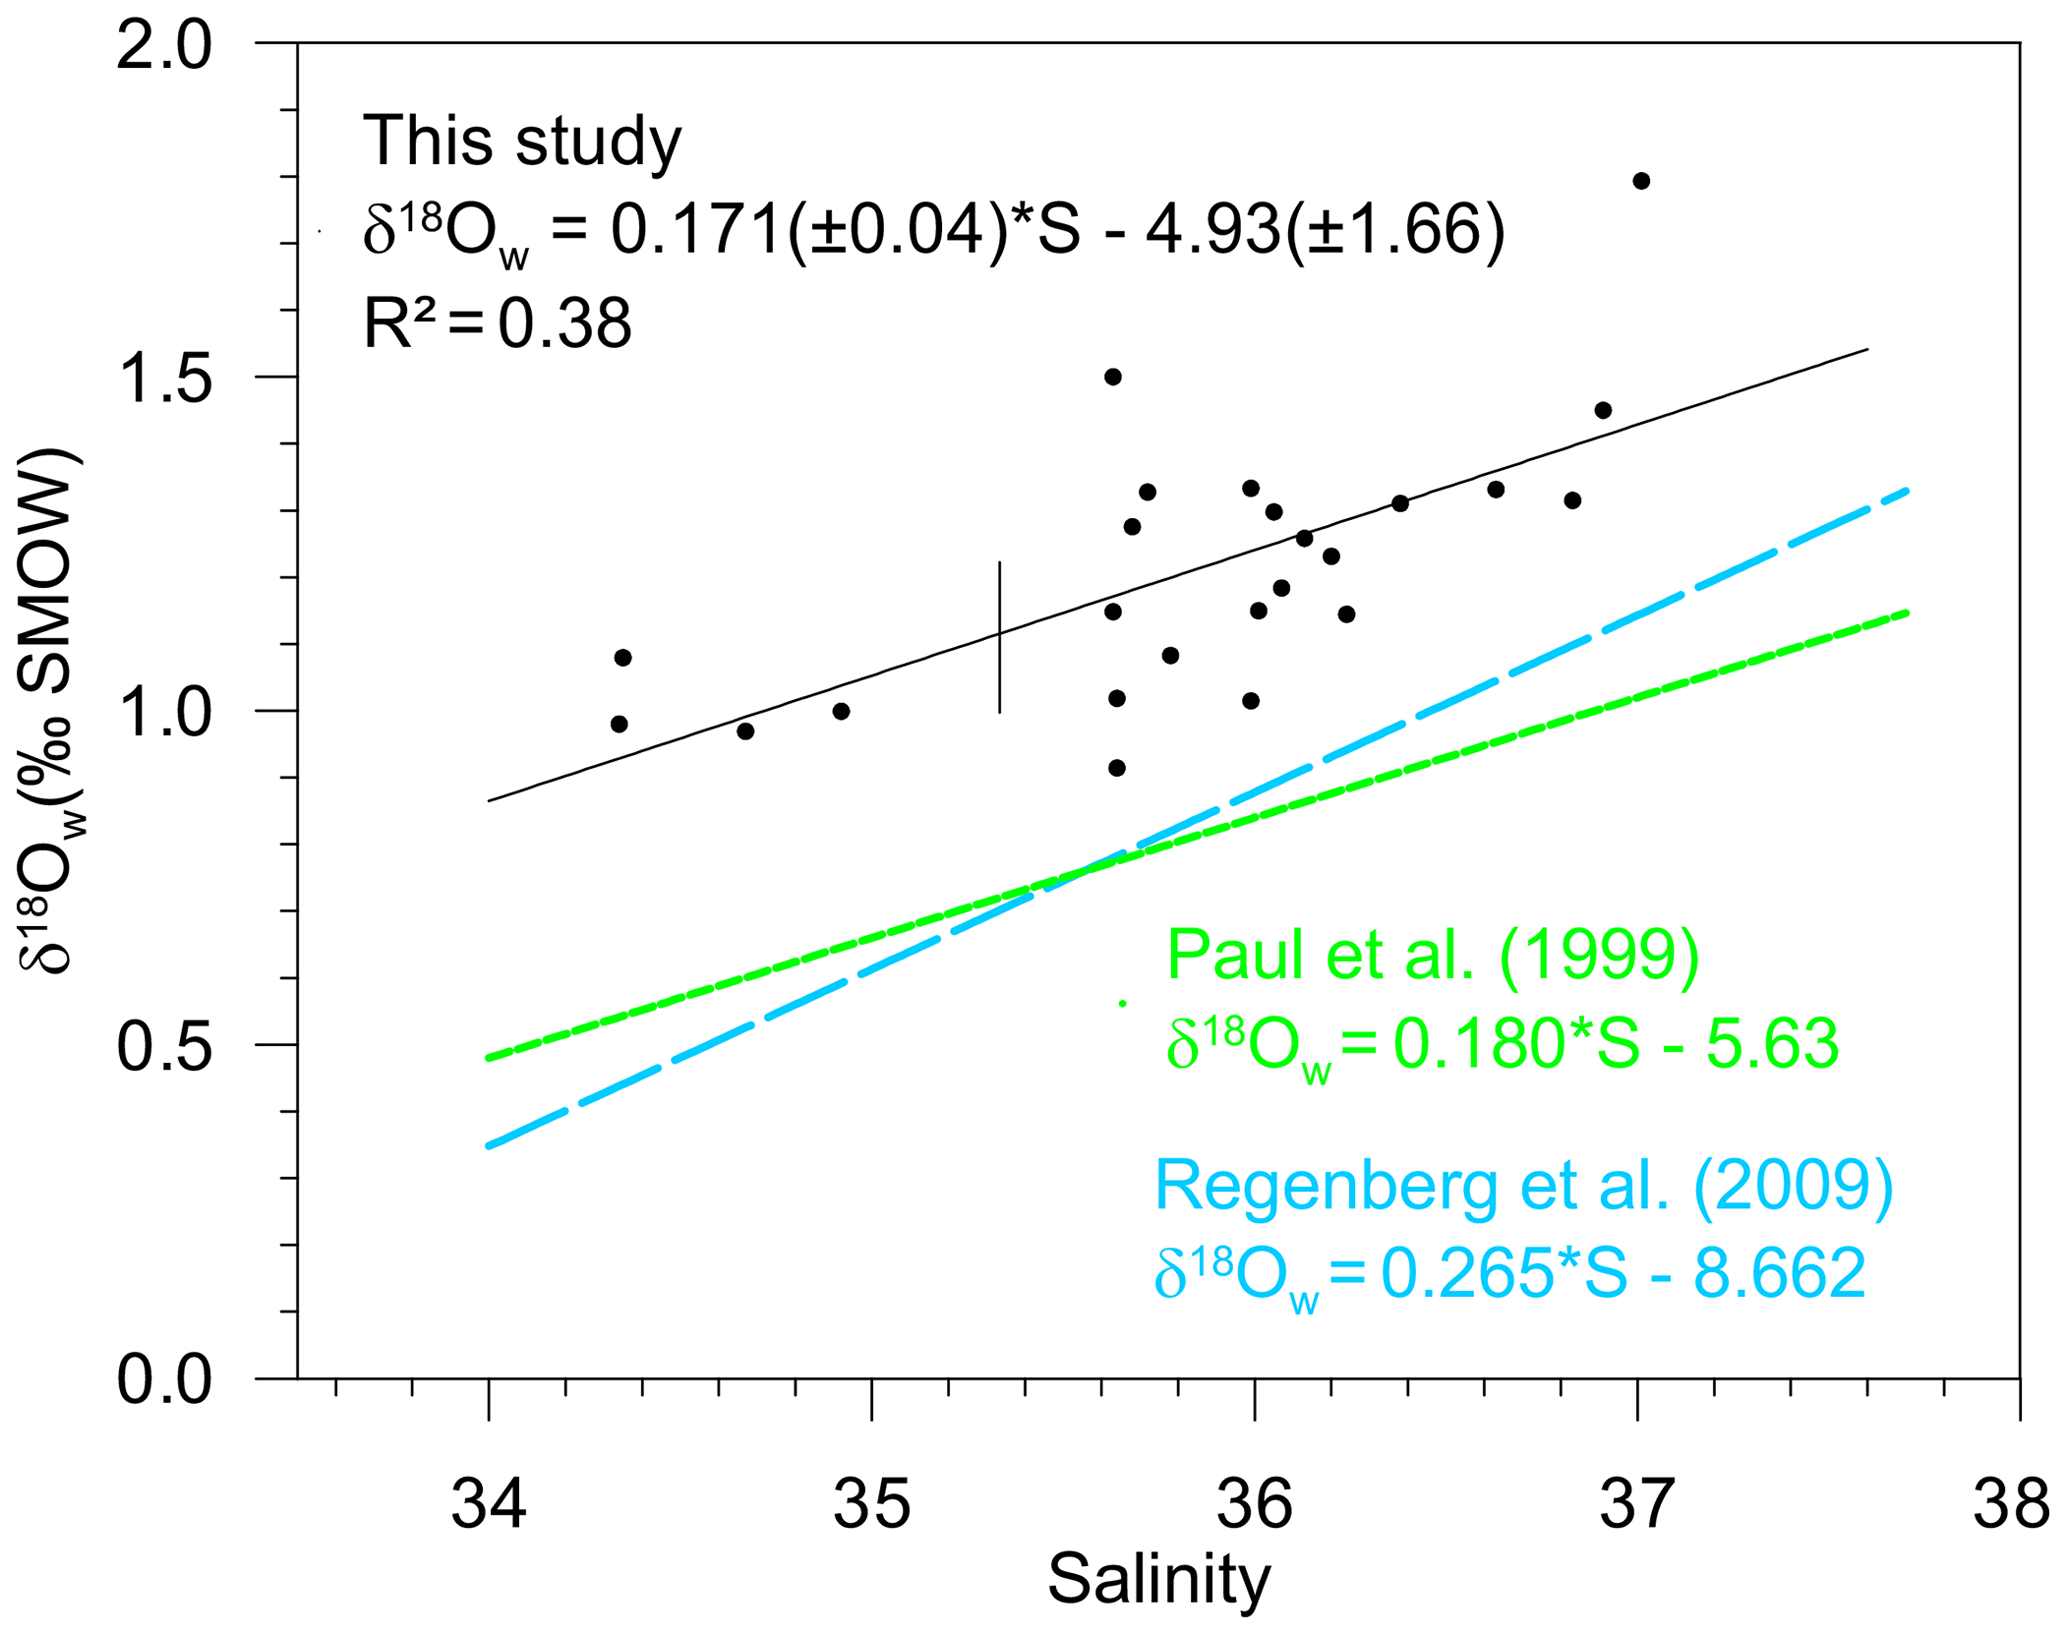
Figure 5Measured surface δ18Ow (‰ SMOW) plotted versus measured surface salinity (stations listed in Table 4) (black dots and full line). Regression lines of the δ18Ow–salinity relationship calculated by Paul et al. (1999) for the tropical Atlantic Ocean (from 25∘S to 25∘ N), based on GEOSECS data (green line), and by Regenberg et al. (2009) (dashed blue line), based on Schmidt (1999) data for the Atlantic Ocean for the water depth interval of 0–100 m.
3.4 Correlation between measured δ18O and salinity
Salinity and the oxygen isotope composition of surface seawater were measured at 23 stations located between 33∘ N and 27∘ S of the East Atlantic Ocean (Table 4), including the 13 stations represented in Fig. 1, where foraminifera were sampled. The δ18Ow–salinity relationship (Eq. 5) is plotted in Fig. 5.
For comparison, the δ18Ow–salinity relationships for the tropical Atlantic Ocean calculated by Paul et al. (1999) (from 25∘ S to 25∘ N), based on Geochemical Ocean Sections Study (GEOSECS) data, and by Regenberg et al. (2009), based on data from Schmidt (1999) (from 30∘ N–30∘ S), are plotted in the same figure. Temporal, geographical and depth differences in sampling, as well as analytical noise, are most probably responsible for the observed variations.
4.1 Intra-test variability
The Mg∕Ca and Sr∕Ca composition of foraminiferal calcium carbonate was determined using LA-ICP-MS of the final (F) chamber of size-selected specimen. Eggins et al. (2003) report that the Mg∕Ca composition of sequentially precipitated chambers of different species (including T. sacculifer) is consistent with temperature changes following habitat migration towards adult life-cycle stages. As described for T. sacculifer in the Red Sea (Bijma and Hemleben, 1994), juvenile specimens (< 100 µm) migrate to the surface where they stay for about 9–10 d before descending to the reproductive depth (80 m). The addition of GAM calcite proceeds immediately prior to gamete release (Hamilton et al., 2008). The specimens considered in this study were collected between 0 and 10 m depth, and in agreement with measurements on specimens from culture experiments (Dueñas-Bohórquez, 2009), Mg-rich external surfaces (GAM calcite) were not observed in our samples. This indicates limited vertical migration (see Sect. 2.2. for reproduction cycle), reducing therewith potential ontogenic vital effects responsible for inter-chamber elemental variations (Dueñas-Bohórquez, 2011) and limited, if any, GAM calcite precipitation (Nürnberg et al., 1996). If the exact calcification depth of the last chambers of our T. sacculifer specimen can still be questioned, the lack of GAM calcite, together with the strong correlation observed between measured surface temperature versus Mg∕Ca-reconstructed temperature, supports the idea that calcification of the last chamber of our specimen occurred at around 10 m depth. It should be noted that Lessa et al. (2020) recently confirmed that T. sacculifer calcifies in the upper 30 m. Because the diameter of the laser beam used in this study was 80 µm, it represents a reliable mean value of elemental concentration of the last chamber wall; for every analysis of a single shell, a full ablation of the wall chamber was performed (until perforation was completed). For comparison, results from traditional ICP-OES (optical emission spectrometry) Mg∕Ca analyses (Regenberg et al., 2009), electron microprobe (Nürnberg et al., 1996) and LA-ICP-MS (this study) are plotted in Fig. 3a and suggest comparable foraminiferal Mg∕Ca ratios for T. sacculifer at similar temperatures.
4.2 Incorporation of Sr into Mg∕Ca temperature calibrations
Combining Mg and Sr data to compute temperature was first suggested by Reichart et al. (2003) for the aragonitic species Hoeglundina elegans. It has been demonstrated that variables other than temperature, such as salinity and carbonate chemistry (possibly via their impact on growth rate), are factors influencing Sr incorporation into calcite (e.g., Lea et al., 1999; Dueñas-Bohórquez et al., 2009; Dissard et al., 2010a, b). The good correlation of Sr∕Ca with temperature in our results (R2=0.67, p value = ) (Fig. 2b) also suggests that temperature exerts a major control on the amount of Sr incorporated into T. sacculifer tests. However, Sr∕Ca concentration also shows a correlation with salinity (R2=0.29, p value = 0.053) which is not observed for Mg (R2=0.09, p value = 0.32). Therefore, the incorporation of Sr into the Mg–T reconstruction equation might improve temperature reconstruction by accounting for the impact of salinity. It has recently been suggested that the Sr incorporation in benthic foraminiferal tests is affected by their Mg contents (Mewes et al., 2015; Langer et al.; 2016). However, as pointed out in Mewes et al. (2015), calcite's Mg∕Ca needs to be over 30–50 mmol in order to noticeably affect Sr partitioning. There is no obvious reason to assume that planktonic foraminifera should have a different Mg∕Ca threshold. Therefore, with a concentration between 2 to 6 mmol mol−1 (Sadekov et al., 2008), the observed variation in Sr concentration in T. sacculifer tests can be safely considered to be independent of the Mg∕Ca concentrations. Hence, other environmental parameters such as temperature, salinity and/or carbonate chemistry, potentially via an impact on calcification rates, must control Sr∕Ca values.
The standard deviation of measured temperatures versus reconstructed temperature was calculated for each of the three Mg temperature equations established in this study: for Eq. (1), based on Mg∕Ca only, SD = 1.37; for Eq. (3), based on both Mg∕Ca and Sr∕Ca, SD = 0.98; and for Eq. (4), based on Mg∕Ca ratio and salinity, SD = 1.03. The incorporation of Sr into the Mg temperature reconstruction equation resulted in the standard deviation the closest to 1 (SD = 0.98), indicating that this statistically improved reconstructions possibly by attenuating the salinity effect, as well as potentially other environmental parameters such as variations in carbonate chemistry or the effect of temperature itself. Therefore, the combination of Mg∕Ca and Sr∕Ca should be considered to improve temperature reconstructions (Table 3). For the remainder of this discussion and in order to compare our data with previously established calibrations for T. sacculifer, the equation based on Mg∕Ca alone (Eq. 1) will be considered.
4.3 Comparison with previous T. sacculifer Mg∕Ca temperature calibrations
Mg∕Ca ratios measured on T. sacculifer from our study show a strong correlation with measured surface water temperature (R2=0.86, p value = ) (Fig. 2a), increasing exponentially by 8.3 % per degree Celsius. The relation with temperature (Eq. 1) is comparable to the one published by Nürnberg et al. (1996) and within the standard error of the calibration (Fig. 3a). This implies that the temperature-controlled Mg incorporation into T. sacculifer tests is similar under culture conditions as it is in natural surface waters. The equation established by Duenas-Bohorquez et al. (2011) based on T. sacculifer specimens from culture experiments integrates ontogenetic (chamber stage) effects. Even though incorporating the ontogenetic impact may improve temperature reconstructions based on Mg∕Ca ratios, this is not routinely done for paleotemperature reconstruction using T. sacculifer. Therefore, the equation of Nürnberg et al. (1996) is used in our study for the comparison of various reconstruction scenarios.
A comparable regression (similar slope) has been established for T. sacculifer from tropical Atlantic and Caribbean surface sediment samples by Regenberg et al. (2009) (Fig. 3a). This regression predicts Mg concentrations that are about 0.15 mmol mol−1 higher compared to our study. Because the Mg–T calibration from Regenberg et al. (2009) is based on surface sediment samples, Mg concentrations were correlated with reconstructed mean annual temperatures. This potentially leads to an over- or underestimation of temperatures depending on the seasonality of the growth period and might explain the observed difference between the two regressions. Due to sample limitation, we analyzed foraminifera from a wider size fraction (230 to 500 µm) compared to Regenberg et al. (2009) (355 to 400 µm), introducing an additional bias between the two data sets (Duenas-Bohorquez et al., 2011; Friedrich et al., 2012). Finally, Regenberg et al. (2009), compiled data of samples from the tropical Atlantic and Caribbean oceans, while we collected samples from the eastern tropical Atlantic. All of these potential biases can easily explain the small discrepancy observed between our regression and the one from Regenberg et al. (2009). Interestingly, Jentzen et al. (2018) were able to compare Mg∕Ca ratios measured on T. sacculifer from both surface sediment samples of the Caribbean sea and specimen sampled with a plankton net nearby. They observed a similar systematic increased Mg∕Ca ratio in fossil tests of T. sacculifer (+0.7 mmol mol−1) compared to living specimens, arguing that different seasonal signals were responsible for the observed difference. However, it is interesting to note that the Mg∕Ca differences observed between living T. sacculifer (e.g., this study and Jentzen et al., 2018) and fossil specimens (e.g., Regenberg et al., 2009; Jentzen et al., 2018) could also be explained by the presence of GAM calcite on T. sacculifer from sediment samples as GAM calcite is enriched with Mg compared to pre-gametogenic calcite precipitated at the same temperature (Nürnberg et al., 1996). If Jentzen et al. (2018) and Regenberg et al. (2009) do not describe the presence or absence of GAM calcite on T. sacculifer specimens analyzed in their studies, a study on the population dynamics of T. sacculifer from the central Red Sea (Bijma and Hemleben, 1994) concluded that the rate of gametogenesis increased exponentially between 300 and 400 µm to reach a maximum of more than 80 % at 355 µm (sieve size =500 µm real test length). It can therefore safely be assumed that the Mg∕Ca difference between living specimens from the plankton and empty shells from the sediment is due to GAM calcite.
The Mg temperature data obtained by Jentzen et al. (2018) are, however, in good agreement with the equation established by Regenberg et al. (2009) and will therefore not be considered separately in this study. The overall strong similarity observed between our regression and the one from Regenberg et al. (2009) indicates nevertheless that Mg temperature calibrations established on T. sacculifer specimens from plankton tow can be applied to T. sacculifer (without SAC chamber) from the surface sediment even if these applications have to be considered with care and only on sediment samples showing no sign of dissolution.
In contrast, the equation of Anand et al. (2003) based on sediment trap samples is appreciably different (Fig. 3b). This may be due to (1) difference in cleaning and analytical procedures, (2) addition of GAM calcite at greater depth, and (3) uncertainty in estimated temperature, as indeed mentioned in Gray et al. (2018): “Note the calibration line of Dekens et al. (2002) and Anand et al. (2003) does not fit the data of Anand et al. (2003) when climatological temperature, rather than the δ18Ocalcite−δ18Owater temperature, is used. As shown by Gray et al. (2018), we show the calibrations of Anand et al. (2003) are inaccurate due to seasonal changes in the δ18O of sea water at that site”.
Anand et al. (2003) fixed the intercept of the exponential regression for T. sacculifer to the value obtained for a multispecies regression and subsequently recalculated for each species the pre-exponential coefficients. Using this approach, their new equation for T. sacculifer is Mg∕Ca = 0.35exp (0.09×T), which is identical to Nürnberg et al. (1996) and Eq. (1) from our study. Still, this implicitly assumes a common temperature dependence exists for all species, which is not realistic. To avoid a priori assumptions, only the primary equation of Anand et al. (2003) (see Table 3) is considered in this study.
4.4 Comparison with previous δ18O temperature calibrations
As for Mg∕Ca, the oxygen isotope composition also shows a strong correlation with measured surface water temperature (R2=0.90). The T. sacculifer δ18O temperature equation of Spero et al. (2003), based on a culture experiment, is very similar to Eq. (4) in our study. However, sensitivity (slope) differs within the uncertainties calculated for Eq. (4). As no uncertainties are given for the Spero et al. (2003) equation, it is difficult to determine whether these equations are statistically different or not. In contrast, the equation of Mulitza et al. (2003) has a similar slope (within uncertainties) but a higher intercept (Fig. 4a). The equation of Erez and Luz (1983) differs considerably from Eq. (4) for both slope and intercept parameters. Bemis et al. (1998) suggested a bias in the calibration due to uncontrolled carbonate chemistry during the experiments of Erez and Luz (1983) (a decrease in pH, e.g., due to bacterial growth in the culture medium or to a higher CO2 concentration in the lab – air conditioners, numerous people working in the same room, etc. – would quickly lead to an increase in δ18O of culture-grown foraminifera). This could explain the observed effect between our study (Eq. 4) and the calibration from Erez and Luz (1983). Although the equation of Mulitza et al. (2003) is also based on T. sacculifer collected from surface waters, their equation is significantly different from Eq. (4). This deviation could possibly be due to a difference in size fractions considered in the two studies (230 to 500 µm and 150 to 700 µm for this study and Mulitza et al., 2003, respectively). Berger et al. (1979) already reported that large T. sacculifer tests are enriched in δ18O relative to smaller ones (variation of 0.5 ‰ between 177 and 590 µm). Similarly, in culture experiments, larger shells of Globigerina bulloides are isotopically heavier relative to smaller specimens (variation of approximatively 0.3 ‰ between 300 to 415 µm; Bemis et al., 1998). Jentzen et al. (2018) reported that “Enrichment of the heavier 18O isotope in living specimens below the mixed layer and in fossil tests is clearly related to lowered in situ temperatures and gametogenic calcification”. Gametogenic calcite has been shown to enrich δ18O signatures by about 1.0 ‰–1.4 ‰ relative to pre-gametogenic T. sacculifer (Wyceh et al., 2018). Finally, variation in light intensity (e.g., due to a different sampling period and/or sampling location) may have influenced the δ18O composition via an impact on symbiont activity (Spero and DeNiro, 1987). Bemis et al. (1998) demonstrated that in seawater with ambient [CO], Orbulina universa shells grown under high light levels (>380 µEinst m−2 s−1) are depleted in 18O on average by 0.33 ‰ relative to specimens grown under low light levels (20–30 µEinst m−2 s−1). The different correlation between δ18O and temperature reported by Mulitza et al. (2003) may be caused by size fraction differences, different sampling time, light intensity, differences in calcification depth or hydrography, or a combination of factors. These are all potential biases that could explain the steeper intercept observed by Mulitza et al. (2003) relative to our study.
A few scenarios are considered in the following section, in which one, two or three proxy equations are combined to solve for salinity.
Three Mg∕Ca–paleotemperature equations (Nürnberg et al., 1996; Regenberg et al., 2009; Anand et al., 2003) were used to compare “reconstructed” temperatures to the known in situ surface water temperatures. The mean foraminiferal Mg∕Ca ratio measured at each of our stations was inserted into each of the three equations and solved for temperature (Fig. 3b). The linear regression of reconstructed temperatures based on Nürnberg et al. (1996) overlaps almost perfectly with the theoretical best fit. This confirms that calibrations based on culture experiments (the primary geochemical signal recorded in the tests) are very well-suited for reconstructing surface water temperature. The regression from Regenberg et al. (2009) reconstructed surface temperatures that are too warm. This is in agreement with the fact that the Mg∕Ca ratios from surface sediment foraminifera are slightly higher than for living specimens (Jentzen et al., 2018). The offset increases with decreasing temperature (0.5 and 1.5 ∘C, respectively, at 30 and 16 ∘C). Finally, the reconstructed temperature using the equation from Anand et al. (2003) shows a strong systematic offset. Because the equation of Nürnberg et al. (1996) matched our measured temperatures almost perfectly, their equation will be used to analyze further reconstruction. Still, we acknowledge that downcore reconstructions will inevitably also involve GAM calcite, and hence other calibrations established using specimens collected deeper in the water column or in the sediment should be better suitable. Similarly, three δ18O–paleotemperature equations (Erez and Luz, 1983; Mulitza et al., 2003; Spero et al., 2003) were tested to reconstruct δ18Oc-δ18Ow. The equation of Erez and Luz (1983) shows a significant systematic overestimation of δ18Oc-δ18Ow and will therefore not be considered any further. Measured surface water temperatures at our 13 stations were inserted into the equations of Mulitza et al. (2003) and Spero et al. (2003) to derive δ18Oc-δ18Ow (Fig. 4). The δ18Oc-δ18Ow reconstructions based on the equation of Mulitza et al. (2003) and Spero et al. (2003) are both slightly more positive than the theoretical best fit. In order to test the robustness of δ18Ow reconstructions from the paleoceanographic literature (e.g., Nürnberg and Groeneveld, 2006; Bahr et al., 2011), we use the reconstructed temperatures based on the Mg∕Ca–paleotemperature equation from Nürnberg et al. (1996) to predict δ18Ow using measured δ18Oc and the equations from Mulitza et al. (2003) and Spero et al. (2003). The reconstructed δ18Oc-δ18Ow from inserting the Mg∕Ca temperature into these equations is slightly overestimated (0.5 ‰), but the offsets remain small enough to consider these as reasonable reconstructions.
When reconstructing δ18Ow by inserting the Mg∕Ca temperature and measured δ18Oc in both equations, the correlation coefficients of the linear regressions are weak (R2=0.19 and 0.13 for Spero et al., 2003, and Mulitza et al., 2003, respectively) demonstrating that the reconstructed δ18Ow is not very reliable; therefore, no reconstruction of salinity using these equations will be further tested in this paper.
Nevertheless, to test the robustness of theoretical and empirical salinity reconstructions, we have the perfect data set at hand as every parameter is known from in situ measurements or sampling. We will use Eqs. (1), (4) and (5) established in this study and presented in Table 3 for demonstration purposes.
with and ,
with and ,
with and .
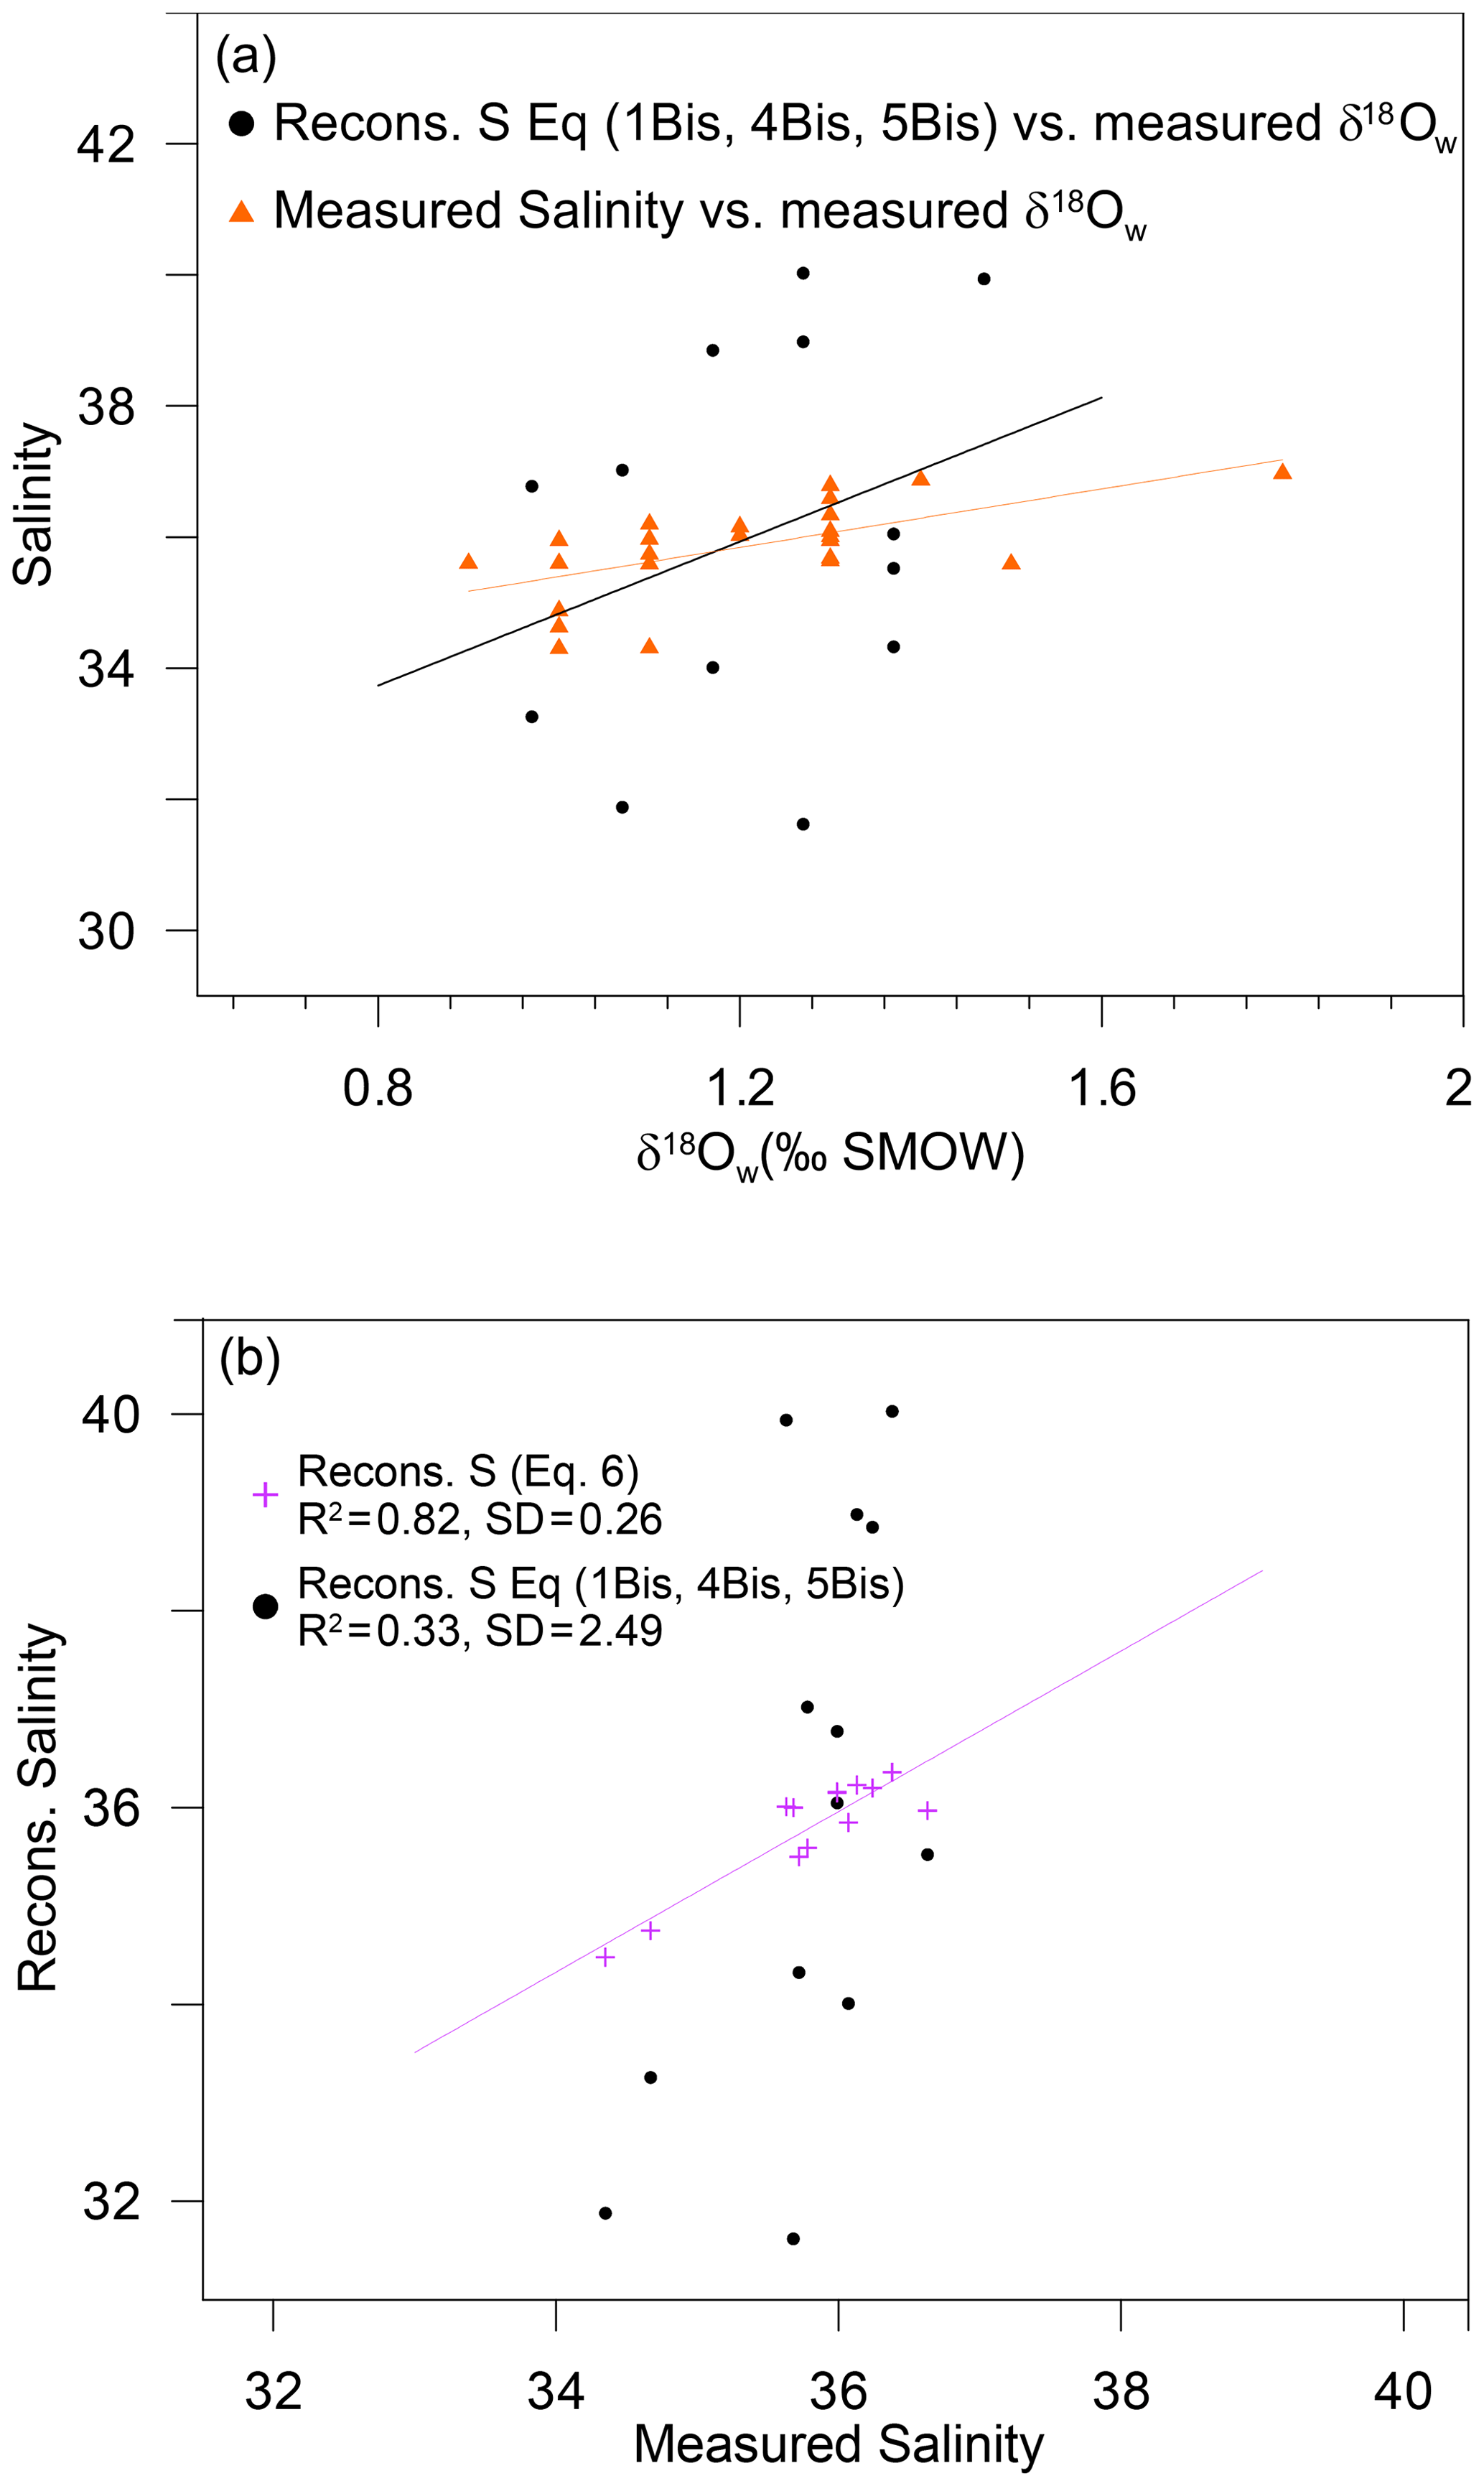
Figure 6(a) Measured salinity (orange triangles) and reconstructed salinity based on Eqs. (1Bis), (4Bis) and (5Bis) from the present study (black dots) plotted versus measured δ18Ow. (b) Reconstructed salinity based on (1) successive reconstructions using Eqs. (1Bis), (4Bis) and (5Bis) from the present study (black dots) and (2) direct linear fit (Eq. 6) based on the same measured variables (Mg∕Ca and δ18Oc) (purple crosses) plotted versus measured salinity.
Classically, from those equations, it is possible to extract variables estimated from the observation Mg∕Ca and δ18Oc through the following equations:
Given that is estimated from the fit from Eq. (1Bis) (Fig. 3a) and is estimated from Eq. (4Bis), is finally calculated from Eq. (5Bis) (Fig. 5). Hence, the error in is an accumulation of errors from successive fits. In this study, the standard deviation of the fit between and the measured salinity for the 13 stations is ±2.49, and the R2 is 0.33 (p value 0.04) (Fig. 6a and b). In conclusion, even the best possible salinity reconstruction based on locally calibrated Eqs. (1), (4) and (5) from the present study only allows salinity reconstructions with a precision of ±2.49. In the modern Atlantic Ocean, and based on recent sea surface salinity estimations (Vinogradova et al., 2019), such a variability would not allow the differentiation of water masses between 60∘ N to 60∘ S. Similarly, on a temporal timescale, given that the regional salinity variations expected in most of the ocean over glacial–interglacial cycles is less than ±1, 2σ (Gray and Evans, 2019), such an incertitude on salinity reconstruction would not even allow the differentiation between modern versus last glacial maximum water masses.
In the following steps, we quantify the error propagation more precisely. In simple cases, error accumulation in an equation can be assessed by calculating the partial derivatives and by propagating the uncertainties of the equation with respect to the predictors (Clifford, 1973). However, for complex functions, the calculation of partial derivatives can be tedious. Here, error propagation related to was computed by a Monte Carlo simulation, which is simple to implement (Anderson, 1976) and in line with the method applied by Thirumalai et al. (2019) on sediment samples of G. Ruber (W) specimens. It is important to note that the propagated error with a reconstructed salinity is a combination of fitting errors and errors associated with measurement inaccuracies (Mg∕Ca and ). First, we will only consider the error related to the fitting procedure, (Eqs. 1Bis, 4Bis and 5Bis, assuming that variables, i.e., the data, are perfectly known without uncertainties). For example, the fitting error related to Eq. (4Bis) is computed by fitting from measured and measured temperature; i.e., the data are known and not approximated. This is done by adding random Gaussian noise with standard deviation corresponding to the RMSE (root mean square error) of each fit (1.32 ∘C for Eq. 1Bis, 0.15 ‰ for Eq. 4Bis and 0.55 for Eq. 5Bis). The resulting standard deviation error for the reconstructed salinity based on 10 000 fits following the Monte Carlo approach amounted to ±1.69 (each fit using sampling from random distributions defined above). Hence, ±1.69 is the smallest possible error for salinity reconstructions, using the three steps above, only due to its mathematics. We can also estimate the error propagation at each step: ∘C (Eq. 1Bis), ‰ (Eq. 4Bis) and (Eq. 5Bis). Now we will include the uncertainties related to estimating the variables using proxy data. Hereto, some Gaussian noises simulating the uncertainties of measured variables (Mg∕Ca and ) were introduced with standard deviations taken from Table 2. The resulting standard deviation error increased to ±2.65. Therefore, it can be concluded that statistically speaking, cannot be reconstructed to a precision better than ±0.45 ‰, while salinity cannot be reconstructed to a precision better than ±1.69 (fitting errors only) and, in reality, hardly better than ±2.65 (full to error propagation).
Finally, to complete this analysis, a direct linear fit to estimate salinity using exp (−δ18Oc) and Mg∕Ca was performed and led to an error of ±0.26 and R2=0.82 (p value ):
This demonstrates that the direct reconstruction using the exact same variables as those initially measured (Mg∕Ca and δ18Oc) led to a much better estimation of salinity than the successive reconstruction.
We analyzed shell Mg∕Ca and Sr∕Ca ratios and δ18O in T. sacculifer collected from surface water along a north–south transect of the eastern tropical Atlantic Ocean. We find a strong correlation between Mg∕Ca ratios and surface water temperature, confirming the robustness of surface water temperature reconstructions based on T. sacculifer Mg∕Ca.
Insertion of the Sr∕Ca ratio into the paleotemperature equation improves the temperature reconstruction. We established a new calibration for a paleotemperature equation based on Mg∕Ca and Sr∕Ca ratios for live T. sacculifer collected from surface water (Eq. 3).
Scenarios were tested using previously published reconstructions. Results were compared to reconstructions performed using local calibrations established in this study and are therefore supposed to represent the best possible calibration for this data set.
-
Mg∕Ca ratios measured in T. sacculifer specimens collected from surface water allow accurate reconstructions of surface water temperature.
-
In addition, δ18Ow can be reconstructed with an uncertainty of ±0.45 ‰. Such δ18Ow reconstructions remain a helpful tool for paleo-reconstructions considering the global range of variation in surface δ18Ow (from about −7 ‰ to 2 ‰; LeGrande and Schmidt 2006).
-
In contrast, the best possible salinity reconstruction based on locally calibrated Eqs. (1), (4) and (5) from the present study only allowed reconstructions with an uncertainty of ±2.49. Such an uncertainty renders these reconstructions meaningless and does not allow for viable (paleo)salinity data.
This is confirmed by a Monte Carlo simulation applied to test successive reconstructions in an “ideal case”, in which explanatory variables are known. This simulation shows that from a purely statistical point of view, successive reconstructions involving Mg∕Ca and δ18Oc preclude salinity reconstructions with a precision better than ±1.69 and hardly better than ±2.65 due to error propagation.
Nevertheless, a direct linear fit to reconstruct salinity based on the same measured variables (Mg∕Ca and δ18Oc) was established (Eq. 6) and presented in Table 3. This direct reconstruction of salinity should lead to a much better estimation of salinity (±0.26) than the successive reconstructions.
All data generated or analyzed during this study are included in this published article.
JB, GJR and DD designed the research and initiated the original project. DD completed the foraminifera sampling, sample processing and data analysis and served as the primary author of this paper. GJR assisted DD in LA-ICP-MS analyses. SF assisted DD in statistical treatments associated with data interpretations. MM and CM completed the Monte Carlo simulation. All of the authors assisted in interpreting, editing and discussing the results and wrote the paper.
The authors declare that they have no conflict of interest.
We thank the captain and crew of the Polarstern cruise ANT XXIII/1, (Bremerhaven–Cape Town) who have been of great support during this unforgettable experience. We are grateful to Susann Grobe of the Marine Biogeochemistry group of the IFM-GEOMAR (Germany) for measuring DIC and ALK of water samples. We thank Arnold Van Dijk of the Department of Earth Sciences–Geochemistry of the University of Utrecht (the Netherlands) for measuring the oxygen isotope composition of water and foraminifera. We are thankful to Gijs Nobbe and Paul Mason for their support with LA-ICP-MS analyses. We would like to thank Beate Mueller (formerly Hollmann) for her technical support when handling foraminifera and Gernot Nehrke, Stephan Mulitza and Aurore Receveur for improving earlier versions of the paper. We thank Dieter Wolf Gladrow for his support during the initial draft of this paper.
This research has been supported by the DFG German Research Foundation (grant no. BI 432/4-2), the ESF under the EUROCORES Programme EuroCLIMATE (grant no. ERAS-CT-2003-980409 of the European Commission, DG Research, FP6) and the NESSC Netherlands Earth System Science (grant no. 024.002.001).
The article processing charges for this open-access
publication were covered by a Research
Centre of the Helmholtz Association.
This paper was edited by Markus Kienast and reviewed by two anonymous referees.
Anand, P., Elderfield, H., and Conte, M. H.: Calibration of Mg∕Ca thermometry in planktonic foraminifera from a sediment trap time series, Paleoceanography 18, 1050, https://doi.org/10.1029/2002PA000846, 2003.
Anderson, G. M.: Error propagation by the Monte Carlo method in geochemical calculations, Geochim. Cosmochim. Ac., 40, 1533–1538, https://doi.org/10.1016/0016-7037(76)90092-2, 1976.
Bahr, A., Nurnberg, D., Schonfeld, J., Garde-Schonberg, D.: Hydrological variability in Florida Straits during Marine Isotope Stage 5 cold events, Paleoceanography 26, PA2214, https://doi.org/10.1029/2010PA002015, 2011.
Bé, A. W. H., Spero, H. J., and Anderson, O. R.: Effects of symbiont elimination and reinfection on the life processes of the planktonic foraminifer Globigerinoides sacculifer Mar. Biol., 70, 73-86, https://doi.org/10.1007/bf00397298, 1982.
Bemis, B. E., Spero, H. J., Bijma, J., and Lea, D. W.: Reevaluation of the oxygen isotopic composition of planktonic foraminifera: Experimental results and revised paleotemperature equations, Paleoceanography, 13, 150–160, https://doi.org/10.1029/98PA00070, 1998.
Berger, W. H.: Oxygen and carbon isotopes in foraminifera: An introduction, Palaeogeogr. Palaeocl, 33, 3–7, https://doi.org/10.1016/0031-0182(81)90030-4, 1981.
Bijma, J. and Hemleben, C.: Population-dynamics of the planktic foraminifer Globigerinoides sacculifer (Brady) from the central red-sea, Deep-Sea Res. Pt. I, 41, 485510, https://doi.org/10.1016/0967-0637(94)90092-2, 1994.
Bijma, J., Faber, W. W., and Hemleben, C.: Temperature and Salinity Limits for Growth and Survival of Some Planktonic Foraminifers in Laboratory Cultures, J. Foramin. Res. 20, 95–116, https://doi.org/10.2113/gsjfr.20.2.95, 1990.
Bijma, J., Hemleben, C., and Wellnitz, K.: Lunar-Influenced Carbonate Flux of the Planktic Foraminifer Globigerinoides-Sacculifer (Brady) from the Central Red-Sea, Deep-Sea Res. Pt. I, 41, 511–530, https://doi.org/10.1016/0967-0637(94)90093-0, 1994.
Cleroux, C., Cortijo, E., Anand, P., Labeyrie, L., Bassinot, F., Caillon, N., and Duplessy, J. C.: Mg∕Ca and Sr∕Ca ratios in planktonic foraminifera: Proxies for upper water column temperature reconstruction, Paleoceanography, 23, https://doi.org/10.1029/2007PA001505, 2008.
Clifford, A.: Multivariate error analysis: a handbook of error propagation and calculation in many-parameter systems, John Wiley and Sons, ISBN 978-0470160558, 1973.
Dekens, P. S., Lea, D., W., Pak, D. K., and Spero, H. J.: Core top calibration of Mg∕Ca in tropical foraminifera: Refining paleotemperature estimation, Geochem. Geophy. Geosys., 3, 1022, https://doi.org/10.1029/2001GC000200, 2002.
de Nooijer, L. J., Reichart, G. J., Dueñas-Bohórquez, A., Wolthers, M., Ernst, S. R., Mason, P. R. D., and van der Zwaan, G. J.: Copper incorporation in foraminiferal calcite: results from culturing experiments, Biogeosciences, 4, 493–504, https://doi.org/10.5194/bg-4-493-2007, 2007.
de Nooijer, L. J., Hathorne, E. C., Reichart, G. J., Langer, G., and Bijma, J.: Variability in calcitic Mg∕Ca and Sr∕Ca ratios in clones of the benthic foraminifer Ammonia tepida, Mar. Micropaleontol., 107, 32–43, https://doi.org/10.1016/j.marmicro.2014.02.002, 2014.
de Nooijer, L. J., Brombacher, A., Mewes, A., Langer, G., Nehrke, G., Bijma, J., and Reichart, G.-J.: Ba incorporation in benthic foraminifera, Biogeosciences, 14, 3387–3400, https://doi.org/10.5194/bg-14-3387-2017, 2017a.
de Nooijer, L. J., van Dijk, I., Toyofuku, T., and Reichart, G. J.: The Impacts of Seawater Mg∕Ca and Temperature on Element Incorporation in Benthic Foraminiferal Calcite, Geochem. Geophy. Geosy., 18, 3617–3630, https://doi.org/10.1002/2017GC007183, 2017b.
Dissard, D., Nehrke, G., Reichart, G. J., Nouet, J., and Bijma, J.: Effect of the fluorescent indicator calcein on Mg and Sr incorporation into foraminiferal calcite, Geochem. Geophy. Geosy., 10, Q11001, https://doi.org/10.1029/2009GC002417, 2009.
Dissard, D., Nehrke, G., Reichart, G. J., Bijma, J.: The impact of salinity on the Mg∕Ca and Sr∕Ca ratio in the benthic foraminifera Ammonia tepida: Results from culture experiments, Geochim. Cosmochim. Ac., 74, 928–940, https://doi.org/10.1016/j.gca.2009.10.040, 2010a.
Dissard, D., Nehrke, G., Reichart, G. J., and Bijma, J.: Impact of seawater pCO2 on calcification and Mg∕Ca and Sr∕Ca ratios in benthic foraminifera calcite: results from culturing experiments with Ammonia tepida, Biogeosciences, 7, 81–93, https://doi.org/10.5194/bg-7-81-2010, 2010b.
Dueñas-Bohórquez, A., da Rocha, R. E., Kuroyanagi, A., Bijma, J., and Reichart, G. J.: Effect of salinity and seawater calcite saturation state on Mg and Sr incorporation in cultured planktonic foraminifera, Mar. Micropaleontol., 73, 178–189, doi10.1016/j.marmicro.2009.09.002, 2009.
Dueñas-Bohórquez, A., da Rocha, R. E., Kuroyanagi, A., de Nooijer, L. J., Bijma, J., and Reichart, G. J.: Interindividual variability and ontogenetic effects on Mg and Sr incorporation in the planktonic foraminifer Globigerinoides sacculifer, Geochem. Cosmochem. Ac., 75, 520–532, https://doi.org/10.1016/j.gca.2010.10.006, 2011.
Eggins, S., De Deckker, P., and Marshall, J.: Mg∕Ca variation in planktonic foraminifera tests: implications for reconstructing palaeo-seawater temperature and habitat migration, Earth Planet. Sci. Lett., 212, 291–306, https://doi.org/10.1016/S0012-821X(03)00283-8, 2003.
Elderfield, H. and Ganssen, G.: Past temperature and δ18O of surface ocean waters inferred from foraminiferal Mg/Ca ratios, Nature, 405, 442–445, https://doi.org/10.1038/35013033, 2000.
Emiliani, C.: Depth habitats of some species of pelagic foraminifera as indicated by oxygen isotope ratios, Amer. J. Sci., 252, 149–158, https://doi.org/10.2475/ajs.252.3.149, 1954.
Epstein, S., Buchsbaum, R., Lowenstam, H. A., and Urey, C. H.: Revised carbonate-water isotopic temperature scale, Geol. Soc. Am. Bull., 64, 1315–1326, https://doi.org/10.1130/0016-7606(1953)64[1315:RCITS]2.0.CO;2, 1953.
Erez, J. and Luz, B.: Experimental Paleotemperature Equation for Planktonic-Foraminifera, Geochim. Cosmochim. Ac., 47, 1025–1031, https://doi.org/10.1016/0016-7037(83)90232-6, 1983.
Evans, D. and Mueller, W.: LA-ICPMS elemental imaging of complex discontinuous carbonates: An example using large benthic foraminifera, J. Anal. Atom. Spec., 28, 10391044, https://doi.org/10.1039/c3ja50053e, 2013.
Evans, D., Erez, J., Oron, S., and Müller, W.: Mg/Ca-temperature and seawater-test chemistry relationships in the shallow-dwelling large benthic foraminifera Operculina ammonoides, Geochim. Cosmochim. Ac., 148, 325–342, https://doi.org/10.1016/j.gca.2014.09.039, 2015.
Fehrenbacher, J. S., Spero, H. J., Russell, A, D., Vetter, L., and Eggins, S.: Optimizing LA-ICP-MS analytical procedures for elemental depth profiling of foraminifera shells, Chem. Geol., 407, 29, https://doi.org/10.1016/j.chemgeo.2015.04.007, 2015.
Fontanier, C., Dissard, D., Ruffine, L., Mamo, B., Ponzevera, E., Pelleter, E., Baudin, F., Roubi, A., Cheron, S., Boissier, A., Gayet, N., Bernell-Fleury, S., Pitel, M., Guyader, V., Lesongeur, F., and Savignac, F.: Living (stained) deep-sea foraminifera from the Sea of Marmara: A preliminary study, Deep-Sea Res. Pt. II, 153, 61–78, https://doi.org/10.1016/j.dsr2.2017.12.011, 2018.
Friedrich, O., Schiebel, R., Wilson, P. A., Weldeab, S., Beer, C. J., Cooper, M. J., and Fiebig, J.: Influence of test size, water depth, and ecology on Mg∕Ca, Sr∕Ca, δ18O and δ13C in nine modern species of planktic foraminifers, Earth Planet. Sci. Lett., 319/320, 133–145, https://doi.org/10.1016/j.epsl.2011.12.002, 2012.
Gaffey, S. J. and Bronnimann, C. E.: Effects of Bleaching on Organic and Mineral Phases in Biogenic Carbonates, J. Sediment. Petrol., 63, 752–754, https://doi.org/10.1029/2018GC007575, 1993.
Gray, W. R., Rae, J. W. B., Wills, R. C. J., Shevenell, A. E., Taylor, B. J., Burke, A., Foster, G.L., and Lear, C. H.: Deglacial planktic foraminiferal boron isotope and Mg∕Ca data from sediment core MD01-2416 in the western North Pacific Ocean, Nat. Geosci., 11, 340–344, https://doi.org/10.1594/PANGAEA.887381. 2018.
Gray, W. R. and Evans, D.: Nonthermal influences on Mg∕Ca in planktonic foraminifera: A review of culture studies and application to the last glacial maximum, Paleoceanography and Paleoclimatology, 34, 306–315, https://doi.org/10.1029/2018PA003517, 2019.
Groeneveld, J., Ho, S. L., Mackensen, A., Mohtadi, M., Laepple, T.: Deciphering the variability in Mg∕Ca and Oxygen Isotopes of individual foraminifera, Paleoceanography and Paleoclimatology, 34, 755–773, https://doi.org/10.1029/2018PA003533, 2019.
Hamilton, C. P., Spero, H. J., Bijma, J., and Lea, D. W.: Geochemical investigation of gametogenic calcite addition in the planktonic foraminifera Orbulina universa, Mar. Micropaleontol., 68, 256–267, https://doi.org/10.1016/j.marmicro.2008.04.003, 2008.
Hastings, D. W., Russell, A. D., and Emerson, S. R.: Foraminiferal magnesium in Globeriginoides sacculifer as a paleotemperature proxy, Paleoceanography, 13, 161–169, https://doi.org/10.1029/97PA03147, 1998.
Hathorne, E. C., James, R. H., Lampitt, and Richard, S.: Environmental versus biomineralization controls on the intratest variation in the trace element composition of the planktonic foraminifera G. inflata and G. scitula, Paleoceanography, 24, PA4204, https://doi.org/10.1029/2009PA001742, 2009.
Hemleben, C., Spindler, M., and Anderson, O. R.: Modern planktonic foraminifera, Springer, Berlin, Germany, ISBN: 978-1-4612-3544-6, 1989.
Honisch, B., Allen, K. A., Lea, D. W., Spero, H. J., Eggins, S. M., Arbuszewski, J., deMenocal, P., Rosenthal, Y., Russell, A. D., and Elderfield, H.: The influence of salinity on Mg∕Ca in planktic foraminifers- Evidence from cultures, core-top sediments and complementary δ18O, Geochem. Cosmochem. Ac., 121, 196–213, https://doi.org/10.1016/j.gca.2013.07.028, 2013.
Hut, G.: Consultant's group meeting on stable isotope reference samples of geochemical and hydrological investigations, Report to the Director General, INIS-MF—10954, IAEA, Vienna, Austria, 42 pp., 1987.
Jentzen, A., Nürnberg, D., Hathorne, E. C., and Schönfeld, J.: Mg/Ca and δ18O in living planktic foraminifers from the Caribbean, Gulf of Mexico and Florida Straits, Biogeosciences, 15, 7077–7095, https://doi.org/10.5194/bg-15-7077-2018, 2018.
Jochum, K. P., Weis, U., Stoll, B., Kuzmin, D., Yang, Q., Raczek, I., Jacob, D. E., Stracke, A., Birbaum, K., Frick, D. A., Gunther, D., and Enzweiler, J.: Determination of reference values for NIST 610–617 glasses following ISO guidelines, Geostand. Geoanal. Res., 35, 397–429, https://doi.org/10.1111/j.1751-908X.2011.00120.x, 2011.
Johnson, K. M., Wills, K. D., Butler, D. B., Johnson, W. K., and Wong, C. S.: Coulometric Total Carbon-Dioxide Analysis for Marine Studies – Maximizing the Performance of an Automated Gas Extraction System and Coulometric Detector, Mar. Chem., 44, 167–187, https://doi.org/10.1016/0304-4203(93)90201-X, 1993.
Kisakurek, B., Eisenhauer, A., Bohm, F., Garbe-Schonberg, D., and Erez, J.: Controls on shell Mg∕Ca and Sr∕Ca in cultured planktonic foraminiferan, Globigerinoides ruber (white), Earth Planet. Sci. Lett., 273, 260–269, https://doi.org/10.1016/j.epsl.2008.06.026, 2008.
Koho, K. A., de Nooijer, L. J., and Reichart, G. J.: Combining benthic foraminiferal ecology and shell Mn∕Ca to deconvolve past bottom water oxygenation and paleoproductivity, Geochim. Cosmochim. Ac., 165, 294–306 https://doi.org/10.1016/j.gca.2015.06.003, 2015.
Koho, K. A., de Nooijer, L. J., Fontanier, C., Takashi, T., Oguri, K., Kitazato, H., and Reichart, G. J.: Benthic foraminiferal Mn∕Ca ratios reflect microhabitat preferences, Biogeosciences 14, 3067–3082, https://doi.org/10.5194/bg-14-3067, 2017.
Kontakiotis, G., Mortyn, G. P., Antonarakou, A., and Drinia, H.: Assessing the reliability of foraminiferal Mg∕Ca thermometry by comparing field-samples and culture experiments: a review, Geol. Q., 60, 547–560, https://doi.org/10.7306/gq.1272, 2016.
Langer, G., Sadekov, A., Thoms, S., Keul, N., Nehrke, G., Mewes, A., Greaves, M., Misra, S., Reichart, G. J., de Nooijer, L. J., Bijma, J., and Elderfield, H.: Sr partitioning in the benthic foraminifera Ammonia aomoriensis and Amphistegina lessonii, Chem. Geol., 440, 306–312, https://doi.org/10.1016/j.chemgeo.2016.07.018, 2016.
Lea, D. W., Mashiotta, T. A., and Spero, H. J.: Controls on magnesium and strontium uptake in planktonic foraminifera determined by live culturing, Geochim. Cosmochim. Ac., 63, 2369–2379, https://doi.org/10.1016/S0016-7037(99)00197-0, 1999.
Lear, C. H., Rosenthal, Y., and Slowey, N.: Benthic foraminiferal Mg∕Ca-paleothermometry: A revised core-top calibration, Geochim. Cosmochim. Ac., 66, 3375–3387, https://doi.org/10.1016/S0016-7037(99)00197-0, 2002.
LeGrande, A. N. and Schmidt, G. A.: Global gridded data set of the oxygen isotopic composition in seawater, Geophys. Res. Lett., 33, L12604, https://doi.org/10.1029/2006GL026011, 2006.
Lessa, D., Morard, R., Jonkers, L., Venancio, I. M., Reuter, R., Baumeister, A., Albuquerque, A. L., and Kucera, M.: Distribution of planktonic foraminifera in the subtropical South Atlantic: depth hierarchy of controlling factors, Biogeosciences, 17, 4313–4342, https://doi.org/10.5194/bg-17-4313-2020, 2020.
Levi, A., Mueller, W., and Erez, J.: Intrashell Variability of Trace Elements in Benthic Foraminifera Grown Under High CO2 Levels, Front. Earth Sci., 7, 247, https://doi.org/10.3389/feart.2019.00247, 2019.
Mewes, A., Langer, G., Reichart, G. J., de Nooijer, L. J., Nehrke, G., and Bijma, J.: The impact of Mg contents on Sr partitioning in benthic foraminifers, Chem. Geol., 412, 92–98, https://doi.org/10.1016/j.chemgeo.2015.06.026, 2015.
Mintrop, L., Perez, F. F., Gonzalez-Davila, M., Santana-Casiano, M. J., and Kortzinger, A.: Alkalinity determination by potentiometry: Intercalibration using three different methods, Cienc. Mar., 26, 23–37, https://doi.org/10.7773/cm.v26i1.573, 2000.
Mulitza, S., Boltovskoy, D., Donner, B., Meggers, H., Paul, A., and Wefer, G.: Temperature: δO18 relationships of planktonic foraminifera collected from surface waters, Palaeogeogr. Palaeocl., 202, 143–152, https://doi.org/10.1016/S0031-0182(03)00633-3, 2003.
Munsel, D., Kramar, U., Dissard, D., Nehrke, G., Berner, Z., Bijma, J., Reichart, G.-J., and Neumann, T.: Heavy metal incorporation in foraminiferal calcite: results from multi-element enrichment culture experiments with Ammonia tepida, Biogeosciences, 7, 2339–2350, https://doi.org/10.5194/bg-7-2339-2010, 2010.
Nürnberg, D., Bijma, J., and Hemleben, C.: Assessing the reliability of magnesium in foraminiferal calcite as a proxy for water mass temperatures, Geochim. Cosmochim. Ac., 60, 803–814, https://doi.org/10.1016/0016-7037(95)00446-7, 1996.
Nürnberg, D. and Groenveld, J.: Pleistocene variability of the Subtropical Convergence at East Tasman Plateau: Evidence from planktonic foraminifera Mg∕Ca (ODP Site 1172A), Geochem. Geophy. Geosy., 7, Q04P11, https://doi.org/10.1029/2005GC000984, 2006.
Paul, A., Mulitza, S., Pätzold, J., and Wolff, T.: Simulation of oxygen isotopes in a global ocean model, in: Use of Proxies in paleoceanography: Examples from the South Atlantic, edited by: Fisher, G and Wefer, G., Springer, Berlin and Heidelberg, Germany, 655-686, https://doi.org/10.1007/978-3-642-58646-0_27, 1999.
Rathburn, A. E. and DeDeckker, P.: Magnesium and strontium compositions of Recent benthic foraminifera from the Coral Sea, Australia and Prydz Bay, Antarctica, Mar. Micropaleontol., 32, 231–248, https://doi.org/10.1016/S0377-8398(97)00028-5, 1997.
R Development Core Team: A language and environment for statistical computing, R Foundation for Statistical Computing, Vienna, Austria, available at: https://www.R-project.org/ (last access: 29 September 2020), 2019.
Regenberg, M., Nurnberg, D., Steph, S., Groeneveld, J., Garbe-Schonberg, D., Tiedemann, R., and Dullo, W. C.: Assessing the effect of dissolution on planktonic foraminiferal Mg∕Ca ratios: Evidence from Caribbean core tops, Geochem. Geophy. Geosy., 7, Q07P15, https://doi.org/10.1029/2005GC001019, 2006.
Regenberg, M., Steph, S., Nurnberg, D., Tiedemann, R., and Garbe-Schonberg, D.: Calibrating Mg∕Ca ratios of multiple planktonic foraminiferal species with δO18-calcification temperatures: Paleothermometry for the upper water column, Earth Planet. Sci. Lett., 278, 324–336, https://doi.org/10.1016/j.epsl.2008.12.019, 2009.
Reichart, G. J., Jorissen, F., Anschutz, P., and Mason, P. R. D.: Single foraminiferal test chemistry records the marine environment, Geology, 31, 355–358, https://doi.org/10.1130/0091-7613(2003)031<0355:SFTCRT>2.0.CO;2, 2003.
Reynolds, R. W., Rayner, N. A., Smith, T. M., Stokes, D. C., and Wang, W.: An Improved In Situ and Satellite SST Analysis for Climate, J. Climate, 15, 1609–1625, https://doi.org/10.1175/1520-0442, 2002.
Rohling, E. J.: Paleosalinity: confidence limits and future applications, Mar. Geol., 163, 1–11, https://doi.org/10.1016/S0025-3227(99)00097-3, 2000.
Rosenthal, Y., Boyle, E. A., and Labeyrie, L.: Last glacial maximum paleochemistry and deepwater circulation in the Southern Ocean: Evidence from foraminiferal cadmium, Paleoceanography, 12, 787–796, https://doi.org/10.1029/97PA02508, 1997.
Sadekov, A., Eggins, S. M., De Deckker, P., and Kroon, D.: Uncertainties in seawater thermometry deriving from intratest and intertest Mg∕Ca variability in Globigerinoides ruber, Paleoceanography, 23, https://doi.org/10.1029/2007PA001452, 2008.
Schmidt, G. A.: Error analysis of paleosalinity calculations, Paleoceanography, 14, 422–429, https://doi.org/10.1029/1999PA900008, 1999.
Schmidt, M. W., Spero, H. J., and Lea, D. W.: Links between salinity variation in the Caribbean and North Atlantic thermohaline circulation, Nature, 428, 160–163, https://doi.org/10.1038/nature02346, 2004.
Schmitt, A., Elliot, M., Thirumalai, K., La, C., Bassinot, F., Petersen, J., Movellan, A., Jorry, S., and Borgomano, J.: Single foraminifera Mg∕Ca analyses of past glacial-interglacial temperatures derived from G. ruber sensu stricto and sensu lato morphotypes, Chem. Geol., 511, 510–520, https://doi.org/10.1016/j.chemgeo.2018.11.007, 2019.
Shackleton, N. J.: Oxygen isotope analyses and Pleistocene temperatures re-assessed, Nature, 215, 15–17, https://doi.org/10.1038/21015a0, 1967.
Shackleton, N. J.: Depth of Pelagic Foraminifera and Isotopic Changes in Pleistocene Oceans, Nature, 218, 79–80, https://doi.org/10.1038/218079a0, 1968.
Shackleton, N. J.: Attainment of isotopic equilibrium between ocean water and the benthonic foraminifera genus Uvigerina: isotopic changes in the ocean during the last glacial, Colloques Internationaux du Centre National du Recherche Scientifique, 219, 203–210, 1974.
Spero, H. J. and DeNiro, M. J.: The influence of symbiont photosynthesis on the δ18O and δ13C values of planktonic foraminiferal shell calcite, Symbiosis, 4, 213–228, 1987.
Spero, H. J., Mielke, K. M., Kalve, E. M., Lea, D. W., and Pak, D. K.: Multispecies approach to reconstructing eastern equatorial Pacific thermocline hydrography during the past 360 kyr, Paleoceanography, 18, 1022, https://doi.org/10.1029/2002PA000814, 2003.
Spezzaferri, S., Kucera, M., Pearson, P. N., Wade, B. S., Rappo, S., Poole, C. R., Morard, R., and Stalder, C.: Fossil and Genetic Evidence for the Polyphyletic Nature of the Planktonic Foraminifera “Globigerinoides”, and Description of the New Genus Trilobatus, PloS ONE, 10, e0128108, https://doi.org/10.1371/journal.pone.0128108, 2015.
Steinhardt, J., Cleroux, C., Ullgren, J., de Nooijer, L., Durgadoo, J. V., Brummer, G. J., and Reichart, G. J.: Anti-cyclonic eddy imprint on calcite geochemistry of several planktonic foraminiferal species in the Mozambique Channel, Mar. Micropaleontol., 113, 33–20, https://doi.org/10.1016/j.marmicro.2014.09.001, 2014.
Steinhardt, J., Cléroux, C., de Nooijer, L. J., Brummer, G.-J., Zahn, R., Ganssen, G., and Reichart, G.-J.: Reconciling single-chamber Mg∕Ca with whole-shell δ18O in surface to deep-dwelling planktonic foraminifera from the Mozambique Channel, Biogeosciences, 12, 2411–2429, https://doi.org/10.5194/bg-12-2411-2015, 2015.
Thirumalai, K., Quinn, T. M., and Marino, G.: Constraining past seawater δ18O and temperature records developed from foraminiferal geochemistry, Paleoceanography, 31, 1409–1422, https://doi.org/10.1002/2016PA002970, 2016.
Tierney, J. E., Haywood, A. M., Feng, R., Bhattacharya, T., and Otto-Bliesner, B. L.: Pliocene SSTs and alkenone saturation indices, Geophys. Res. Lett., 46, 9136–9144, https://doi.org/10.1594/PANGAEA.904916, 2019.
Toyofuku, T., Kitazato, H., Kawahata, H., Tsuchiya, M., and Nohara, M.: Evaluation of Mg∕Ca thermometry in foraminifera: Comparison of experimental results and measurements in nature, Paleoceanography, 15, 456–464, https://doi.org/10.1029/1999PA000460, 2000.
Urey, H. C.: The thermodynamic properties of isotopic substances, J. Chem. Soc., 562–581, https://doi.org/10.1039/jr9470000562, 1947.
Vinogradova, N., Lee, T., Boutin, J., Drushka, K., Fournier, S., Sabia, R., Stammer, D., Bayler, E., Reul, N., Gordon, A., Melnichenko, O., Li, L. F., Hackert, E., Martin, M., Kolodziejczyk, N., Hasson, A., Brown, S., Misra, S., and Lindstrom, E.: Satellite Salinity Observing System: Recent Discoveries and the Way Forward NASA, Front. Mar. Sci., 6, 243, https://doi.org/10.3389/fmars.2019.00243, 2019.
Weldeab, S., Schneider, R. R., Kölling, M., and Wefer, G.: Holocene African droughts relate to eastern equatorial Atlantic cooling, Geology, 33, 981–984, https://doi.org/10.1130/G21874.1, 2005.
Weldeab, S., Lea, D. W., Schneider, R. R., and Anderson, N.: 155,00 years of west African monsoon and ocean thermal evolution, Science, 316, 130301307, https://doi.org/10.1126/science.1140461, 2007.
Wyceh, J. B., Clay Kelly, D., Kitajima, K., Kozdon, R., Orland, I. J., and Valley, J. W.: Combined effects of gametogenic calcification and dissolution on δ18O measurements of the planktic foraminifer Trilobatus sacculifer, Geochem. Geophy. Geosy., 19, 4487–4501, https://doi.org/10.1029/2018GC007908, 2018.