the Creative Commons Attribution 4.0 License.
the Creative Commons Attribution 4.0 License.
 | 02 Aug 2021
Stable isotope ratios in seawater nitrate reflect the influence of Pacific water along the northwest Atlantic margin
Samuel H. Davin
Nadine Lehmann
Carolyn Buchwald
Evan N. Edinger
Moritz F. Lehmann
Markus Kienast
The flow of Pacific water to the North Atlantic exerts a globally significant control on nutrient balances between the two ocean basins and strongly influences biological productivity in the northwest Atlantic. Nutrient ratios of nitrate (NO) versus phosphate (PO) have previously been used to complement salinity characteristics in tracing the distribution of Pacific water in the North Atlantic. We expand on this premise and demonstrate that the fraction of Pacific water as determined by NO : PO ratios can be quantitatively predicted from the isotopic composition of sub-euphotic nitrate in the northwest Atlantic. Our linear model thus provides a critically important framework for interpreting δ15N signatures incorporated into both modern marine biomass and organic material in historical and paleoceanographic archives along the northwest Atlantic margin.
- Article
(4583 KB) - Full-text XML
-
Supplement
(3568 KB) - BibTeX
- EndNote


Pacific water from the Bering Strait constitutes a major fraction of the polar outflow to the northwest Atlantic Ocean (McLaughlin et al., 1996; Jones et al., 2003; Aksenov et al., 2010). Besides redistributing heat and freshwater (Tang et al., 2004; Carmack et al., 2016), it also plays a critical role in the transport of nutrients between the two ocean basins (Tremblay et al., 2015; Lehmann et al., 2019). Pacific water has relatively high nutrient concentrations (Macdonald et al., 2010). These nutrients support high productivity on the Bering and Chukchi shelves (Arrigo and van Dijken, 2011), which in turn fuels high rates of sedimentary denitrification both in the shelf regions and along the Bering continental slope (Devol et al., 1997; Lehmann et al., 2005, 2007; Chang and Devol, 2009; Granger et al., 2011; Brown et al., 2015). The resulting excess in silicate (Si(OH)4) and phosphate (PO) (relative to nitrate (NO)) is a significant source of these nutrients to the Atlantic (Torres-Valdés et al., 2013). In particular, the excess PO supports N2 fixation in the Atlantic, thereby helping to balance the global oceanic nitrogen budget (Yamamoto-Kawai et al., 2006).
Pacific-derived nutrients also influence biological productivity along the northwest Atlantic shelf complex. The NO deficit in Pacific water sets an upper limit on productivity, which otherwise would be higher in the presence of more NO-enriched Atlantic water (Harrison and Li, 2008). The Si(OH)4 and PO excess influences plankton community composition (Harrison et al., 2013; Fragoso et al., 2017). Interannual and decadal-scale variability in the circulation of Pacific water into the northwest Atlantic may help to explain recent observed changes in the magnitude and composition of primary productivity with potential bottom-up effects on ecosystem functioning (Drinkwater et al., 2003; Greene et al., 2013; Townsend et al., 2015).
Given its importance to downstream circulation, nutrient budgets, and productivity, it is useful to track the distribution of Pacific water using chemical tracers. Jones et al. (1998) characterized NO : PO relationships for “pure” Pacific and Atlantic endmember waters. They further demonstrated that the concentrations of NO and PO in a water sample relative to the endmember relationships may be used to quantify the contribution of Pacific water (i.e., “fraction Pacific water”, or fPW). With this approach, the spatial and depth distributions of fPW were used to map the flow of Pacific water through the Arctic and North Atlantic oceans (Jones et al., 1998, 2003). The same approach has also been used to deconvolute fluxes of freshwater originating from Pacific water from those of sea ice meltwater and meteoric water (Yamamoto-Kawai et al., 2008; Sutherland et al., 2009; Azetsu-Scott et al., 2012; Benetti et al., 2016). In another study, time-series nutrient data were used to track fPW and thereby infer changes in circulation patterns over a 30-year period in Disko Bay, Greenland (M. O. Hanson et al., 2012). The use of NO : PO as a proxy for Pacific water has, however, important limitations. For example, the approach requires an assumption of constant stoichiometry associated with the uptake and recycling of nutrients, which may not hold in all regions (Michel et al., 2002; Mills et al., 2015). Moreover, sensitivity to NO source and sink processes such as N2 fixation and denitrification may lead to an under- or overestimation of fPW, respectively. Finally, seawater NO : PO ratios are not preserved in organisms or sedimentary archives, thus limiting their use in establishing changing baselines in an ecological or paleoceanographic context.
The nitrogen (15N : 14N) and oxygen (18O : 16O) isotope ratios in NO (expressed as δ15N and δ18O) represent a complementary tool to trace the distribution and modification of Pacific water, possibly addressing shortcomings related to the use of stoichiometric nutrient tracers. Coupled N and O isotope ratios provide insights into the internal cycling of NO, as well as into input and removal processes. The preferential reaction of the lighter 14N and 16O during both phytoplankton uptake and denitrification results in an enrichment of δ15N and δ18O of the dissolved NO pool with a ratio of ∼ 1 (Casciotti et al., 2002; Granger et al., 2004, 2008; Sigman et al., 2005). Conversely, the recycling or regeneration of NO via nitrification (the oxidation of ammonium (NH) to nitrite (NO) and NO) leads to a decoupling of the N and O isotopic signature of NO (Sigman et al., 2005; Lehmann et al., 2005; Granger and Wankel, 2016). The δ15N of newly nitrified NO depends on the N isotopic composition of its source substrate and hence mirrors the isotopic signature of the organic matter exported from the surface. In contrast, the δ18O of newly nitrified NO remains independent from its N source and approaches the δ18O signature of seawater (δ18O +1.1 ‰; Casciotti et al., 2008; Sigman et al., 2009; Buchwald et al., 2012). The resulting NO isotope fingerprints of particular water masses have led to their increasing use as unique water mass tracers (e.g., Granger et al., 2018; Lehmann et al., 2018)
The goal of this paper is to establish the use of δ15N and δ18O as a new chemical oceanographic tracer for tracking the distribution of Pacific water to the northwest Atlantic. We present new data from Baffin Bay, the Davis Strait, and the Labrador Sea (Fig. 1), highlighting differences in NO isotopic ratios among the different water masses found in those regions. We evaluate the preservation of δ15N and δ18O signatures during southward advection of Pacific water from the Arctic Archipelago to the Labrador Shelf and present a linear relationship between δ15N and fPW for the northwest Atlantic margin. Lastly, we entertain implications of our findings for regional isotope ecological and paleoceanographic studies.
2.1 Sample collection and nutrient measurements
Seawater samples were collected opportunistically during four different expeditions that sampled 25 stations along the NW Atlantic margin from the mid-Labrador Shelf to northern Baffin Bay between the years 2005 and 2016 (Fig. 1). New and previously published data are presented. New data were collected during (1) expedition MSM45 of the Maria S. Merian in August 2015 and (2) an ArcticNet expedition (AMD-2016-002a) of the Canadian Coast Guard Ship (CCGS) Amundsen from July through September 2016. Previously published data are from (3) expedition HUD-2005-016 of CCGS Hudson in June 2005 and (4) a GEOTRACES (GN02) expedition aboard CCGS Amundsen in July and August 2015. Stations associated with each expedition are indicated in the Fig. 1 station legend. Sample collection and analytical protocols for the MSM45 and AMD-2016-002a expeditions are given below. Protocols for the HUD-2005-016 expedition are provided in Sherwood et al. (2011), and for the GEOTRACES expedition they are provided in Lehmann et al. (2019). Samples were collected under ice-free conditions during all expeditions. Station and bottle data are provided as a supplementary data file.
Samples from the MSM45 and AMD-2016-002a expeditions were collected with a rosette water sampler holding 24×10 L Niskin bottles mounted with a conductivity–temperature–depth (CTD) profiler equipped with sensors for dissolved oxygen and fluorescence. During the MSM45 expedition, samples for nutrient and NO isotope analysis were collected from the Niskin bottles into separate, triple-rinsed, 60 mL high-density polyethylene (HDPE) bottles with pre-filtration through 0.45 µm surfactant-free cellulose acetate (SFCA) membrane filters and stored at −20 ∘C. Concentrations of NO, NH, and Si(OH)4 were measured post-cruise at Dalhousie University according to standard protocols (Grasshoff, 1969) using a Bran+Luebbe autoanalyzer III. During the AMD-2016-002a expedition, samples for nutrient analysis were pre-filtered (0.2 µm) into 15 mL acid-rinsed centrifuge tubes. The samples were analyzed on board the ship for NO, NO, PO, and Si(OH)4 concentrations using a Bran+Luebbe autoanalyzer III following standard protocols (Grasshoff, 1969). Samples for NO isotope analysis were collected into acid-cleaned and triple-rinsed 60 mL HDPE bottles without pre-filtration and stored at −20 ∘C.
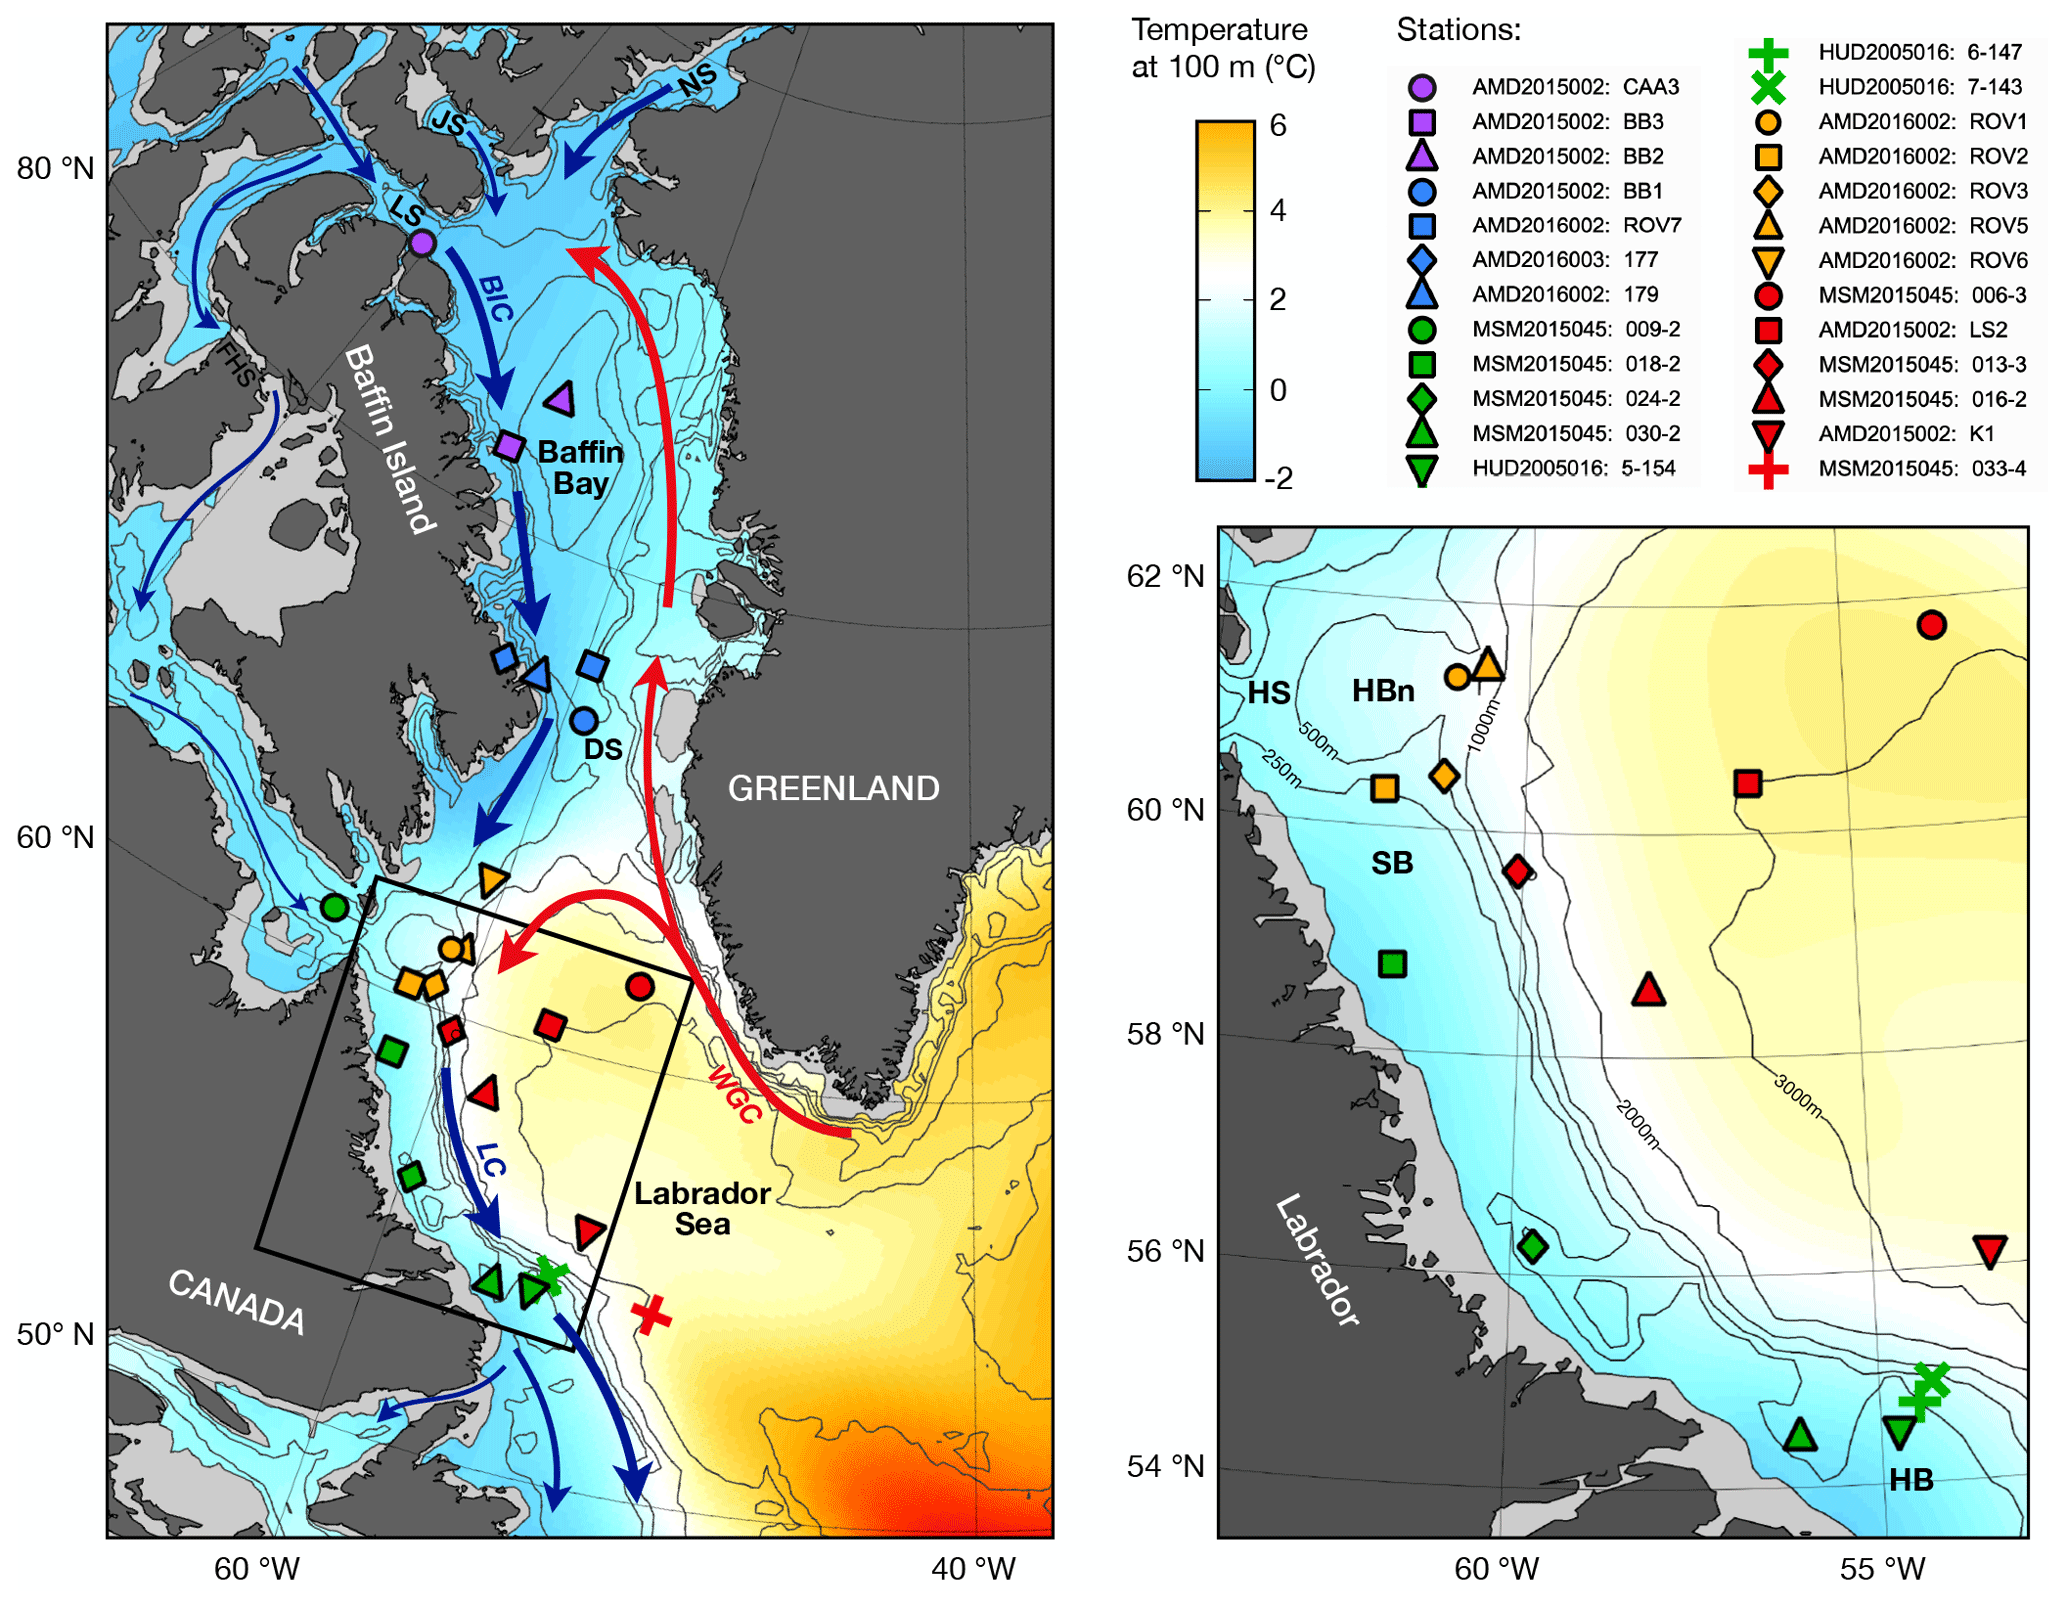
Figure 1Map and inset detail of study region with World Ocean Atlas (WOA18) climatological mean temperature at 100 m water depth (colour shading), bathymetry (black contours), major surface currents (arrows), and sampling stations. Abbreviations: West Greenland Current (WGC), Baffin Island Current (BIC), Labrador Current (LC), Nares Strait (NS), Jones Sound (JS), Lancaster Sound (LS), Fury and Hecla Strait (FHS), Hudson Strait (HS), Hatton Basin (HBn), Saglek Bank (SB), Hamilton Bank (HB).
2.2 NO isotope analyses
Seawater samples were prepared for the measurement of dual N and O isotope ratios in NO following the denitrifier method (Sigman et al., 2001; Casciotti et al., 2002). This method quantitatively converts NO present in the water samples to nitrous oxide (N2O) by introducing cultured denitrifying bacteria (Pseudomonas chlororaphis f. sp. aureofaciens, ATCC no. 13985) that lack N2O reductase activity. The resulting N2O gas is then analyzed by isotope ratio mass spectrometry. Isotopic ratios are reported in delta notation following Eq. (1):
where R represents either 15N : 14N or 18O : 16O, the standard is the N2 in the atmosphere (air) or the oxygen in Vienna Standard Mean Ocean Water (VSMOW), and the units are reported as per mille (‰) deviation from the standard ratios. Sample δ18O data were not corrected for the δ18O of seawater because the latter varies minimally, from −2.2 ‰ to 0.2 ‰ (Lehmann et al., 2019).
Samples from the MSM45 expedition were analyzed at Dalhousie University using a Thermo Scientific Delta V Plus isotope ratio mass spectrometer (IRMS) interfaced with a Thermo GasBench inlet. Data were calibrated using seawater-based reference material USGS32 (δ15N = +180 ‰ vs. air, δ18O = +25.7 ‰ vs. VSMOW), USGS34 (δ15N = −1.8 ‰ vs. air, δ18O = −27.9 ‰ vs. VSMOW), and IAEA-N3 (δ15N = +4.7 ‰ vs. air, δ18O = +25.6 ‰ vs. VSMOW) (Böhlke et al., 2003; Gonfiantini, 1984). NO concentrations were below the detection limit of 0.2 µM, so no prior NO removal was performed. The blank size constituted < 2 % of the overall sample size for the standard 20 nmol target N2O concentrations and < 5 % for the low-concentration samples from the biologically productive zone. Analytical reproducibility based on replicate measurements averaged 0.2 ‰ for δ15N and 0.4 ‰ for δ18O.
Samples from the AMD-2016-002a expedition were analyzed at the University of Basel using a Thermo Scientific Delta V Plus IRMS with a customized purge-and-trap system (modified after McIlvin and Casciotti, 2010, 2011). NO samples were analyzed in parallel to isotope reference material USGS34 and IAEA-N3. NO concentrations were < 0.36 µM, which is < 4 % of the corresponding NO concentrations, so no prior NO removal was performed. Blanks constituted < 1 % of the overall sample size. Analytical reproducibility based on replicate measurements averaged 0.2 ‰ for δ15N and 0.3 ‰ for δ18O.
2.3 Definitions and calculations
The seawater potential temperature (θ) and potential density anomaly referenced to surface pressure (σθ) were calculated from CTD data using the “oce” package in the R computing platform (Kelley and Richards, 2017). Water masses (Table 1) were operationally defined on the basis of θ and/or σθ thresholds following published conventions (Stramma et al., 2004; Fratantoni and Pickart, 2007; Azetsu-Scott et al., 2012). Note that Halocline Water (HW) and Labrador Shelf Water (LShW) are distinct water masses, despite overlapping θ and σθ characteristics. The latter is formed in the Hudson Strait area from mixing of HW with Irminger Water (IW) and Hudson Bay outflow water (Sutcliffe et al., 1983; Straneo and Saucier, 2008). The base of the biologically productive zone (zP) was determined from CTD profiles of chlorophyll fluorescence as the shallowest depth below the subsurface chlorophyll maximum where values < 0.1 mg m−3 were encountered. Apparent oxygen utilization (AOU) was calculated from CTD in situ dissolved oxygen profiles using equations in Weiss (1970). The N* parameter, quantifying NO to PO imbalances relative to Redfield stoichiometry, was calculated following Eq. (2):
where the constant 2.95 forces a global mean N* of zero (Gruber and Sarmiento, 1997; Deutsch et al., 2001). Regenerated PO4 (Preg) was calculated from AOU and the stoichiometric constant of Anderson and Sarmiento (1994) following Eq. (3):
The ratio of regenerated to measured PO is reported as .
Fraction Pacific water (fPW) was calculated from N and P concentration data in relation to N : P relationships for Pacific and Atlantic endmembers, following Jones et al. (1998). For the purposes of data representativity, accessibility, and propagation of error calculations, we derived new equations for Atlantic and Pacific waters using public domain data from the 2019 version of the Global Ocean Data Analysis Project (GLODAP; Olsen et al., 2019). The N : P relationships are sensitive to the choice of dissolved inorganic nitrogen (DIN) species (NO, NO, NH), particularly in highly productive shelf regions where a significant fraction of the total dissolved N may not be fully nitrified (Yamamoto-Kawai et al., 2008; Mills et al., 2015). The equations reported here use only NO concentrations, as the inclusion of NO and NH was found to have a negligible impact on fPW calculations (less than calculated uncertainties; see below).
Pacific endmember data were selected from a region encompassing the Canada Basin of the Beaufort Sea (Fig. S1a). The data were filtered (bottom depths > 500 m) to exclude shelf waters where NH accounts for a significant fraction of the DIN. Data were further filtered (S ≤ 33.5; NO > 2.5 µM) to exclude waters of Atlantic origin, as well as data from below a kink in the NO-vs.-PO relationship where NO is exhausted before PO (Yamamoto-Kawai et al., 2008). The resulting relationship for Pacific water (PW) was calculated following Eq. (4):
This relationship is within the error of the one reported in Yamamoto-Kawai et al. (2008), which was based on total DIN-vs.-PO data for a region also encompassing the Chukchi Sea (Fig. S1b). This indicates that the NH that accumulates on the Bering and Chukchi shelves in summer is largely nitrified by the time the Pacific-origin shelf waters reach the Canada Basin and Amundsen Gulf (Brown et al., 2015; Granger et al., 2018). In other words, the use of total DIN (instead of just NO) to define the Pacific N : P relationship would have a negligible effect on the derived Pacific endmember relationship in Eq. (4).
Atlantic endmember data were obtained from the Irminger Sea (Fig. S1a), which, based on drifter trajectories, represents the source region for waters entering the Labrador Sea via the Irminger Current (Cuny et al., 2002; Jakobsen et al., 2003). Data from the region were filtered (S ≥ 35; NO > 2.5 µM) to exclude polar waters entering the area through the Fram Strait (Sutherland et al., 2009), and waters affected by nutrient drawdown. The resulting relationship for Atlantic water (AW) entering the Labrador Sea was calculated following Eq. (5):
For any given sample PO concentration, Eqs. (4) and (5) define theoretical endmember NO and NO concentrations, respectively. The fPW was then calculated from the sample NO concentration in relation to NO and NO, following Eq. (6):
Negative values were considered devoid of Pacific water and were set to zero. Analytical error in NO and PO measurements averaged 1 % and 2 %, respectively. Errors propagated through Eqs. (4), (5), and (6) with statistical bootstrapping (n=10 000, with uniform distributions) resulted in uncertainties of ±3 % (at the 95 % confidence level) in fPW estimates.
Table 1Water mass definitions, depth ranges, and statistical summaries (mean ± 1 SD (or absolute difference where n< 3) and number of samples in parentheses) of physical and chemical properties by water mass. HW: Halocline Water; BBW: Baffin Bay Water; LShW: Labrador Shelf Water; IW: Irminger Water; LSW: Labrador Sea Water; NEADW: Northeast Atlantic Deep Water; DSOW: Denmark Strait Overflow Water. All properties were calculated for waters below the biologically productive zone (zp).
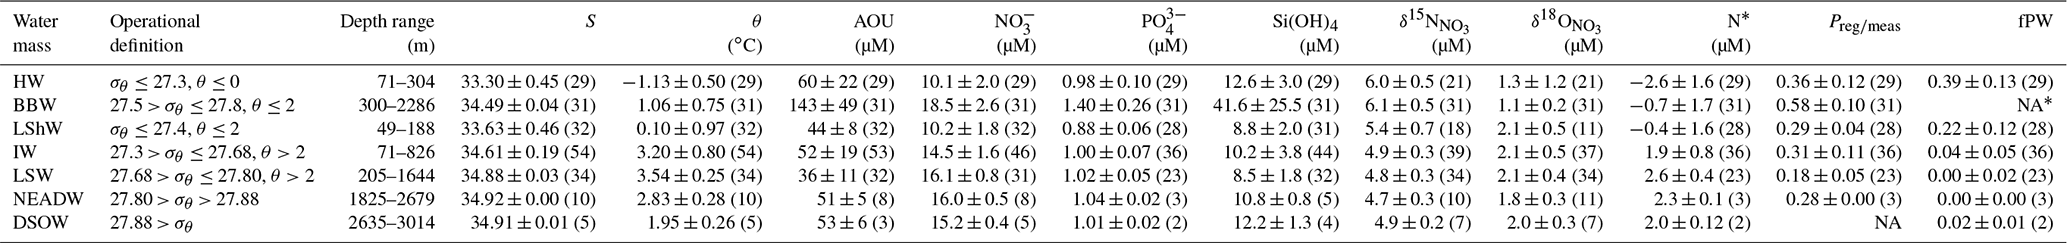
* It is not possible to calculate fPW for BBW. See Sect. 3.2.4 for details. NA: not available.
3.1 Hydrographic summary
Pacific water propagates as a halocline layer through the Canadian Arctic Archipelago, then through Baffin Bay, and into the Labrador Sea via the Davis and Hudson straits (Fig. 1; Tang et al., 2004; McLaughlin et al., 2004; Steele et al., 2004). The 25 stations that were sampled for this study are distributed along this net transport pathway of Pacific water and are therefore ideally situated for investigating the distribution of NO isotopic ratios with respect to fPW. The stations are grouped into five hydrographic regimes on the basis of common water column properties. A summary of hydrographic properties by regime follows below. To help with visualization, the data are colour-coded by hydrographic regime consistently throughout the subsequent figures. A diagram of θ–S data is shown in Fig. 2, with delineations for the different water masses. Depth profiles are shown for all stations in Fig. 3 and separately for each hydrographic regime in Figs. S1–S5.
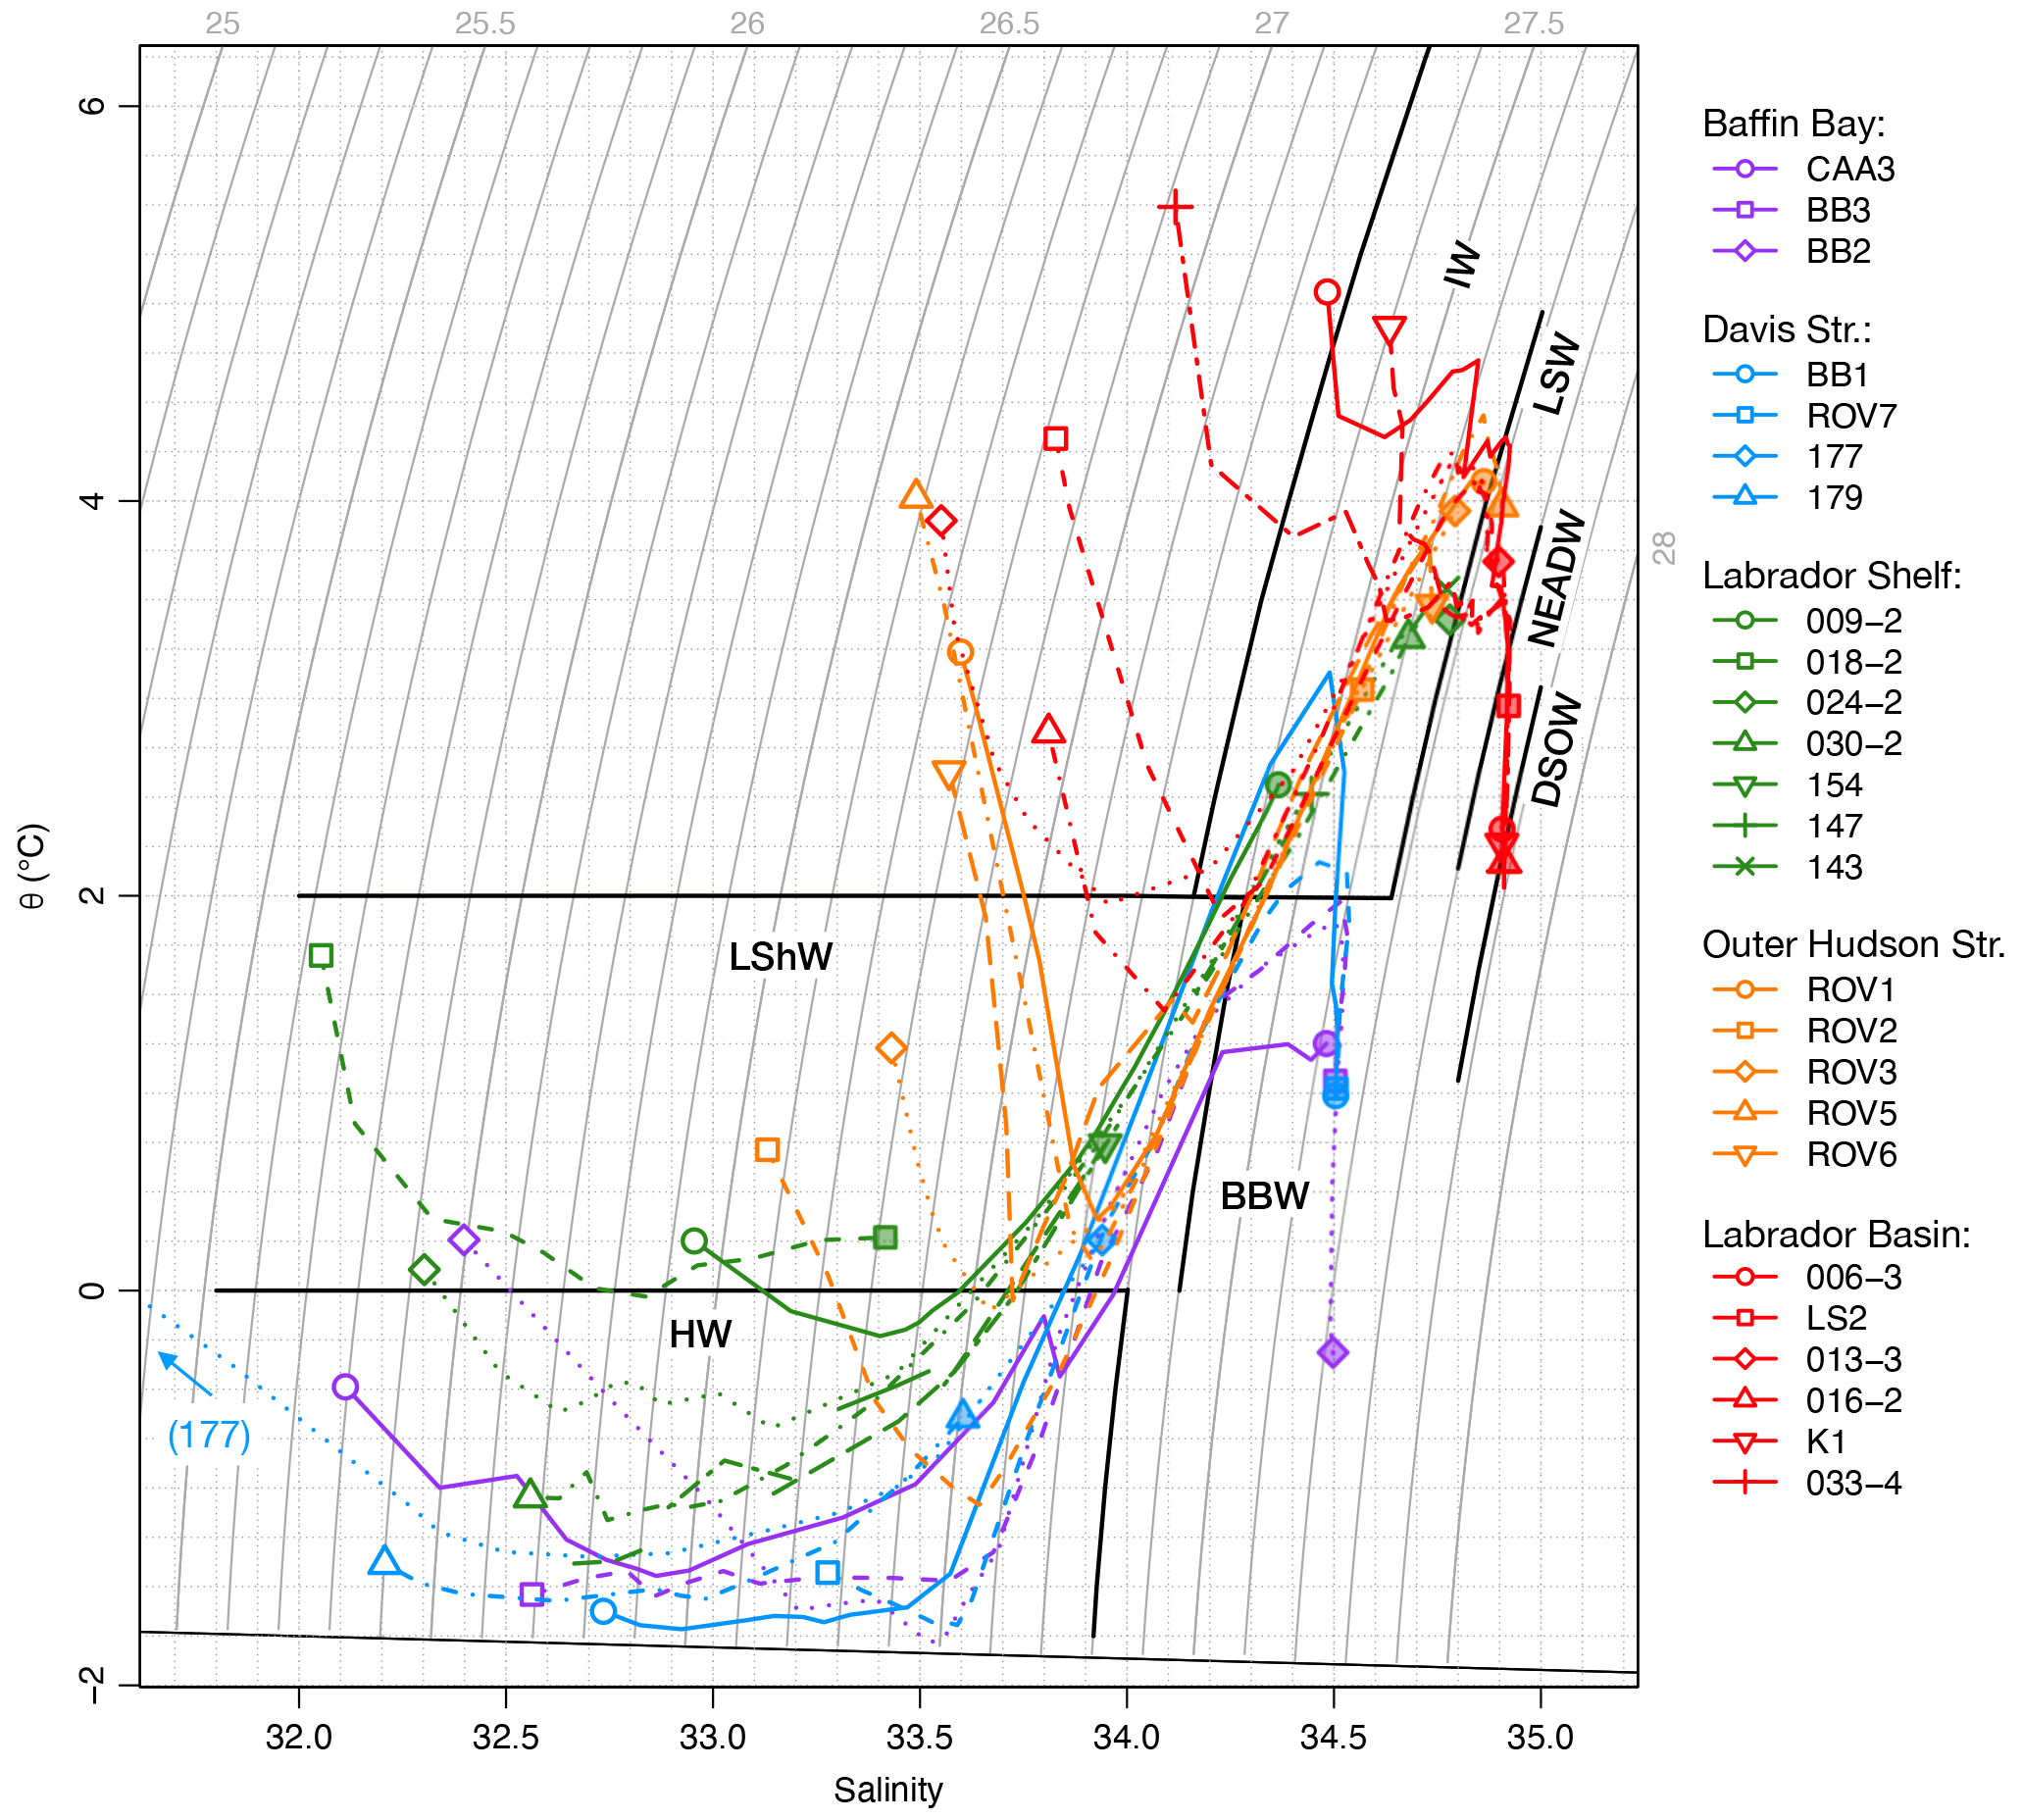
Figure 2Temperature–salinity diagram for individual stations. For each profile, the 30 m depth level is indicated by open symbols; the bottom level is indicated by shaded symbols. Data from < 30 m omitted for clarity. Bold black lines indicate temperature and σT limits for water masses discussed in text: HW, Halocline Water; LShW, Labrador Shelf Water; BBW, Baffin Bay Water; IW, Irminger Water; LSW, Labrador Sea Water; NEADW, Northeast Atlantic Deep Water; DSOW, Denmark Strait Overflow Water.
The Baffin Bay regime was represented by three stations (BB2, BB3, CAA3). Station BB2 was located inside the central Baffin gyre at a depth of 2300 m. BB3 was located along the path of the Baffin Island Current at a depth of 1243 m. CAA3 was located at the southern side of Lancaster Sound at a depth of 690 m. The three stations displayed similar θ and S profiles, characteristic of Baffin Bay more broadly (Fig. 3; Tang et al., 2004). A surface layer, formed by summer warming and melting extended down to 20–30 m. Below this, a layer of almost isothermal, cold (θ < −1.5 ∘C) water, increasing in salinity from < 32 to 34, extended down to 200 m. This layer represents the Pacific-sourced HW, which is formed in the Beaufort Sea and adjacent shelves and then modified by regional winter cooling and sea ice formation in northern Baffin Bay and along the northwestern Greenland coast (Bourke et al., 1989; Münchow et al., 2015; Rysgaard et al., 2020). Below the HW, a warmer (θ approaching +2 ∘C) and saltier (S> 34) layer extended down to 700 m. This layer represents the diluted remnants of Atlantic-sourced IW, often referred to as West Greenland Intermediate Water, which flows northward via the West Greenland Current and spreads throughout the entire Baffin Bay (Tang et al., 2004; Münchow et al., 2015). The θ and S data over this depth interval at CAA3 were more variable, reflecting the interleaving of different water masses by the complex tidal currents in Lancaster Sound (Fig. S3; Prinsenberg and Hamilton, 2005). At stations BB2 and BB3, the waters below 700 m form a distinct tail on the θ–S diagram (Fig. 2). We refer to this as “Baffin Bay Water” (BBW; θ < 2 ∘C; 27.5 > σθ ≤ 27.8), which, for convenience, groups waters generally referred to as Baffin Bay Deep Water for 1200 < z < 1800 m and Baffin Bay Bottom Water for z > 1800 m (Tang et al., 2004), as well as the shallower waters from 700 < z < 1200 m. The BBW is also distinguished by the rapid increase in AOU with depth (Fig. 3c).
The northern Davis Strait regime was represented by four stations (177, 179, BB1, ROV7). Station 177 was located within 2 km of coastal Baffin Island at a depth of 376 m. Despite the coastal location of station 177, it is hydrographically connected to more open water via a deep, northeast-trending cross-shelf trough (Broughton Trough). Station 179 was located on the Baffin shelf break at 186 m. Station BB1 was located on the northern flank of the Davis Strait sill at a depth of 1042 m. Station ROV7 was located over the Greenland slope (Disko Fan) at a depth of 932 m. Hydrographic profiles at these four stations were similar to those of the Baffin Bay regime, with the characteristic HW and IW layers (Fig. 3). A seemingly thicker surface layer extending down to > 50 m at station 177 is a result of the later sampling date (late September) than at the other three stations, which were sampled in late July or early August. The HW layer was thicker at stations 177 and 179, which are located in the path of the Baffin Island Current, and thinned out toward the more centrally located BB1 and ROV7, also evident from the shallowing isopycnals (Fig. S4 σθ profiles; Tang et al., 2004; Azetsu-Scott et al., 2012). Stations BB1 and ROV7 sampled the IW (θ > 2 ∘C; S> 34.4) from 300–500 m and BBW below about 700 m.
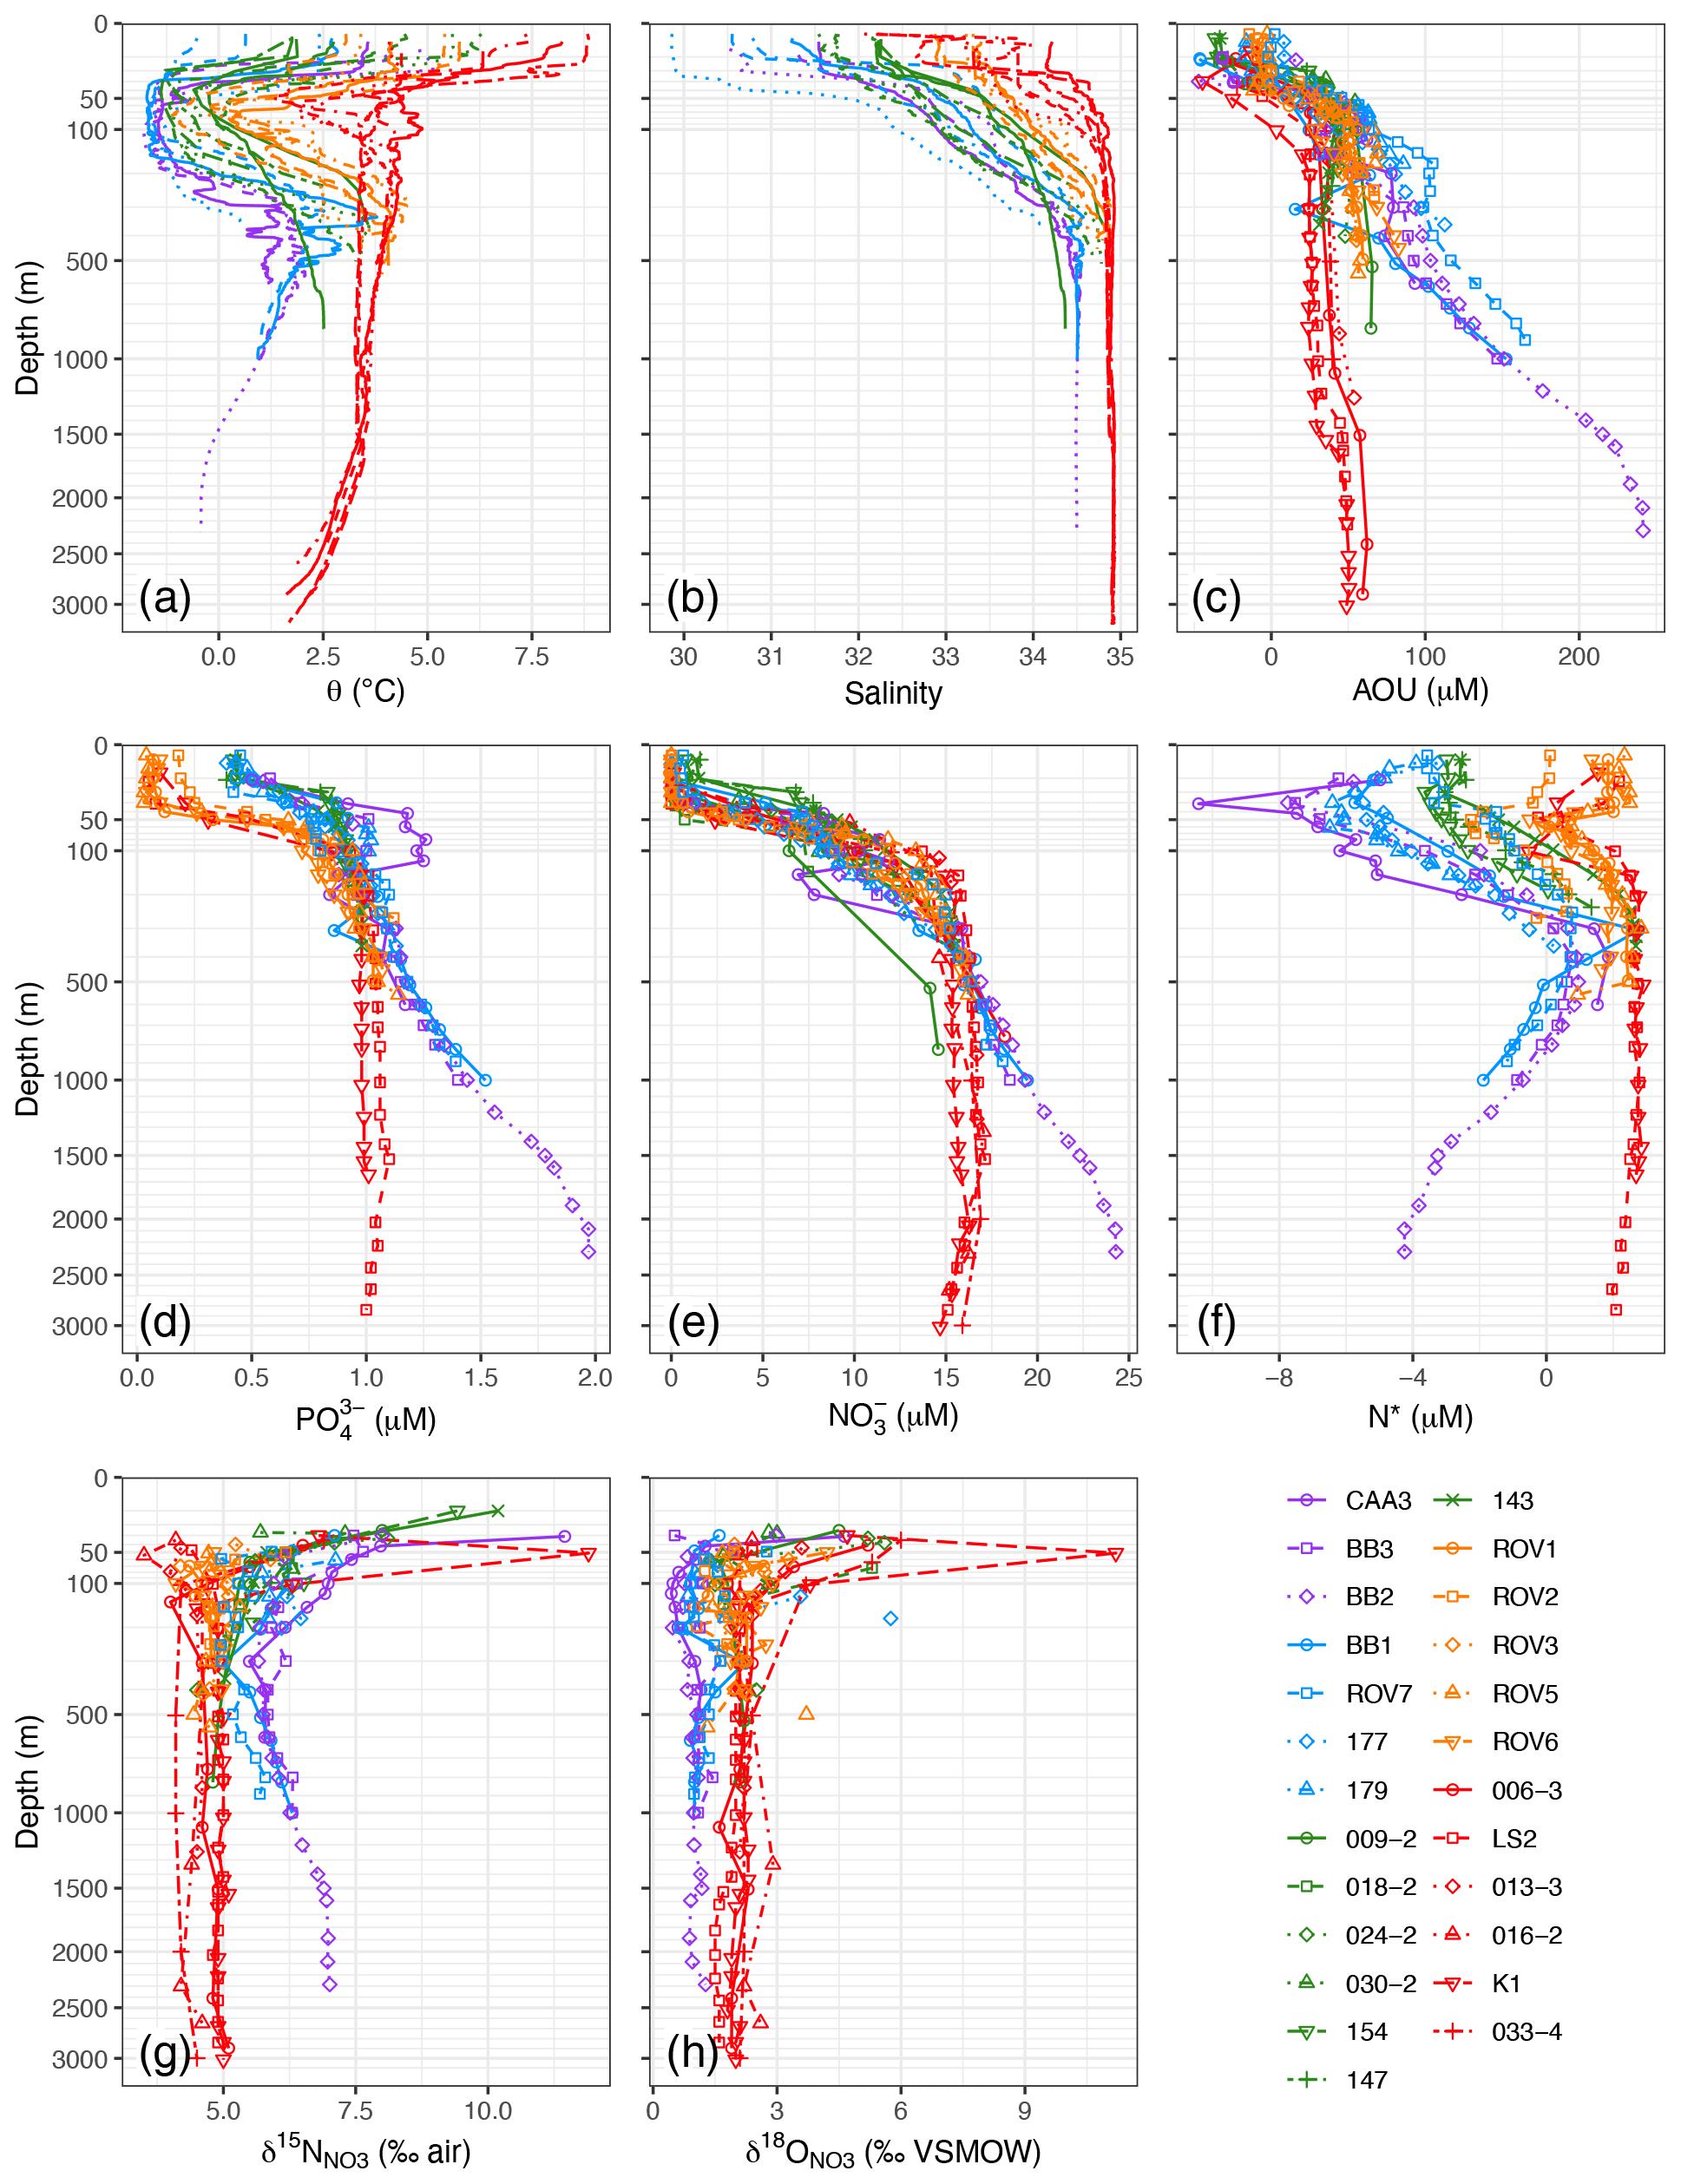
Figure 3Depth profiles for (a) potential temperature, (b) salinity, (c) apparent oxygen utilization (AOU), (d) PO, (e) NO, (f) N*, (g) δ15N of NO, and (h) δ18O of NO. Points not connected by lines in (h) are suspected analytical outliers.
The Labrador Shelf regime comprised seven stations (009, 018, 024, 030, 154, 147, 143). Station 009 was located over a > 900 m deep basin in the main channel of the Hudson Strait but had a similar hydrographic profile to the other stations on the Labrador Shelf. Stations 018, 024, and 030 were located on an along-shelf transect, located at depths of 200, 534, and 535 m, respectively. Stations 154, 147, and 143 were located along an outer cross-shelf transect of Hamilton Bank at depths of 202, 245, and 344 m, respectively. A surface layer extended down to about 30 m at all stations, underlain by the remnants of the HW, modified by tidal mixing and warming southward of the Davis Strait (Fig. 3; Tang et al., 2004). This layer is often called the “Cold Intermediate Layer” (Colbourne et al., 2016) but herein is referred to as “Labrador Shelf Water” (LShW; θ < 2 ∘C, S< 34.2) for ease of reference. LShW extended down to between 150–300 m and was underlain by IW where the bottom depth exceeded 300 m. The influence of IW increased from west to east, as becomes apparent from the cross-shelf increase in θ and S at stations 030, 154, 147, and 143 (Fig. S5; Fratantoni and Pickart, 2007).
The outer Hudson Strait regime comprised five stations (ROV1, ROV2, ROV3, ROV5, ROV6) concentrated around an area seaward of the Hudson Strait, around the shelf break (Fig. 1 inset). Stations ROV1 and ROV5 were located on the sill of an outer-shelf bathymetric depression (Hatton Basin) at an approximately 500 m water depth. Stations ROV2 and ROV3 were located along the northern flank of Saglek Bank at 279 and 436 m, respectively. Station ROV6 was located further north, at a 456 m depth, but had similar hydrography to the other four stations (Fig. 3). The surface and bottom currents in these areas are quite strong, up to 0.60 m s−1 at station ROV3, and generally flowing NW to SE but with a strong tidal influence linked to the macrotidal oscillation in Frobisher Bay (Zedel et al., unpublished bottom current meter data from NE Saglek Bank). The surface layer extended down to about 30 m at all stations. Nutrient data, specifically PO concentrations and N* values, discussed below, clearly distinguished the surface waters of this regime from the other regimes presented above. The water mass structure was overall similar to that of the Labrador Shelf regime but with a thinner, warmer, and saltier layer of LShW underlain by warmer and saltier IW (Fig. S6).
Finally, the Labrador Basin regime comprised six stations (006, 013, 016, 033, LS2, K1) located in the deep waters of the Labrador Sea, at depths of 1280 m (station 013) to 3292 m (station 033). Hydrographic profiles at these stations (Fig. 3) reflect the well-known water mass structure in the Labrador Sea (e.g., Yashayaev and Loder, 2016). Doming of isopycnals leads to the thinning and shoaling of the IW layer from the margins (e.g., station 013, IW, 70–500 m) to the center of the basin (e.g., station K1, IW, 30–150 m) (Fig. S7). Below the IW, a thick layer of Labrador Sea Water (LSW, 27.68 > σθ≤ 27.80, θ > 2 ∘C) extended down to 1500–2000 m, underlain by Northeast Atlantic Deep Water (NEADW, 27.80 > σθ > 27.88) to 2400–2700 m and then Denmark Strait Overflow Water (DSOW, σθ > 27.88).
3.2 Nutrients
3.2.1 Nutrient concentrations in the biologically productive zone
Sampling was conducted in the months of June–August, which follows the spring bloom throughout most of the study region (Tremblay et al., 2006; Frajka-Williams et al., 2010). Complete or near-complete utilization of NO, PO, and Si(OH)4 was observed in the upper 30 m of the water column at all sites, with evidence of partial nutrient utilization to < 120 m. Minima in NO in the surface waters averaged < 1 µM and did not vary by hydrographic region (Fig. 3e). Minima in PO, by contrast, exhibited a striking bimodal distribution with respect to region, with concentrations < 0.1 µM for most of the outer Hudson Strait and Labrador Basin stations and > 0.4 µM for all of the Baffin Bay, Davis Strait, and Labrador Shelf stations (Fig. 3d). Minima in Si(OH)4 exhibited a similar bimodality (< 1 µM and > 5 µM) with respect to hydrographic regions (Figs. S1–S5). Thus, NO was relatively more limiting to primary production than either PO or Si(OH)4 in the colder and fresher hydrographic regions, as observed previously (Tremblay et al., 2006; Harrison and Li, 2008; Martin et al., 2010; Ferland et al., 2011; Fragoso et al., 2017).
3.2.2 Nutrient concentrations below the biologically productive zone
Nutrient concentrations generally stabilized below the biologically productive zone (depth > zP), with the exception of BBW, in which concentrations increased rapidly with depth (Fig. 3d, e). The elevated concentrations result from in situ nutrient regeneration in Baffin Bay Deep Water and Baffin Bay Bottom Water (Jones et al., 1984; Tremblay et al., 2002; Lehmann et al., 2019). Baffin Bay is a 2300 m deep basin enclosed by < 700 m deep sills. The enclosed bathymetry and permanent halocline restrict circulation, thereby trapping particulate organic matter (POM) and remineralized nutrients. More precisely, given the long residence time of the deep and bottom waters (77–1450 years; Top et al., 1980; Wallace et al., 1985), high fluxes of POM originating from the productive northern Baffin Bay (Klein et al., 2002; Tremblay et al., 2002; Lalande et al., 2009) accumulate at depth. The subsequent in situ remineralization of this sinking POM leads to the observed increase in nutrients, seen as an increase in , and drawdown of oxygen (increase in AOU) in the deep basin (Fig. 3c–e). While O2 concentrations remain too high to support denitrification in the water column, dissimilatory NO consumption in the sediments is supported by the low oxygen concentrations in the water above and acts as a potential sink for dissolved NO in the lower water column (Lehmann et al., 2019). Indeed, BBW had PO concentrations almost 2-fold higher (1.4 ± 0.3 µM) and Si(OH)4 concentrations 3-fold higher (41 ± 25 µM) than any of the other water masses (Table 1) but only somewhat higher NO (19 ± 3 µM). For water masses other than BBW, there were significant differences in NO and PO but not Si(OH)4 (one-way ANOVA). HW and LShW had lower NO concentrations (∼ 10 µM) than IW, LSW, and NEADW (∼ 15 µM). The distribution of PO by water mass was similar, except that the concentration in HW (0.98 µM) was closer to that of IW, LSW, and NEADW (> 1 µM) than that of LShW (0.88 µM).
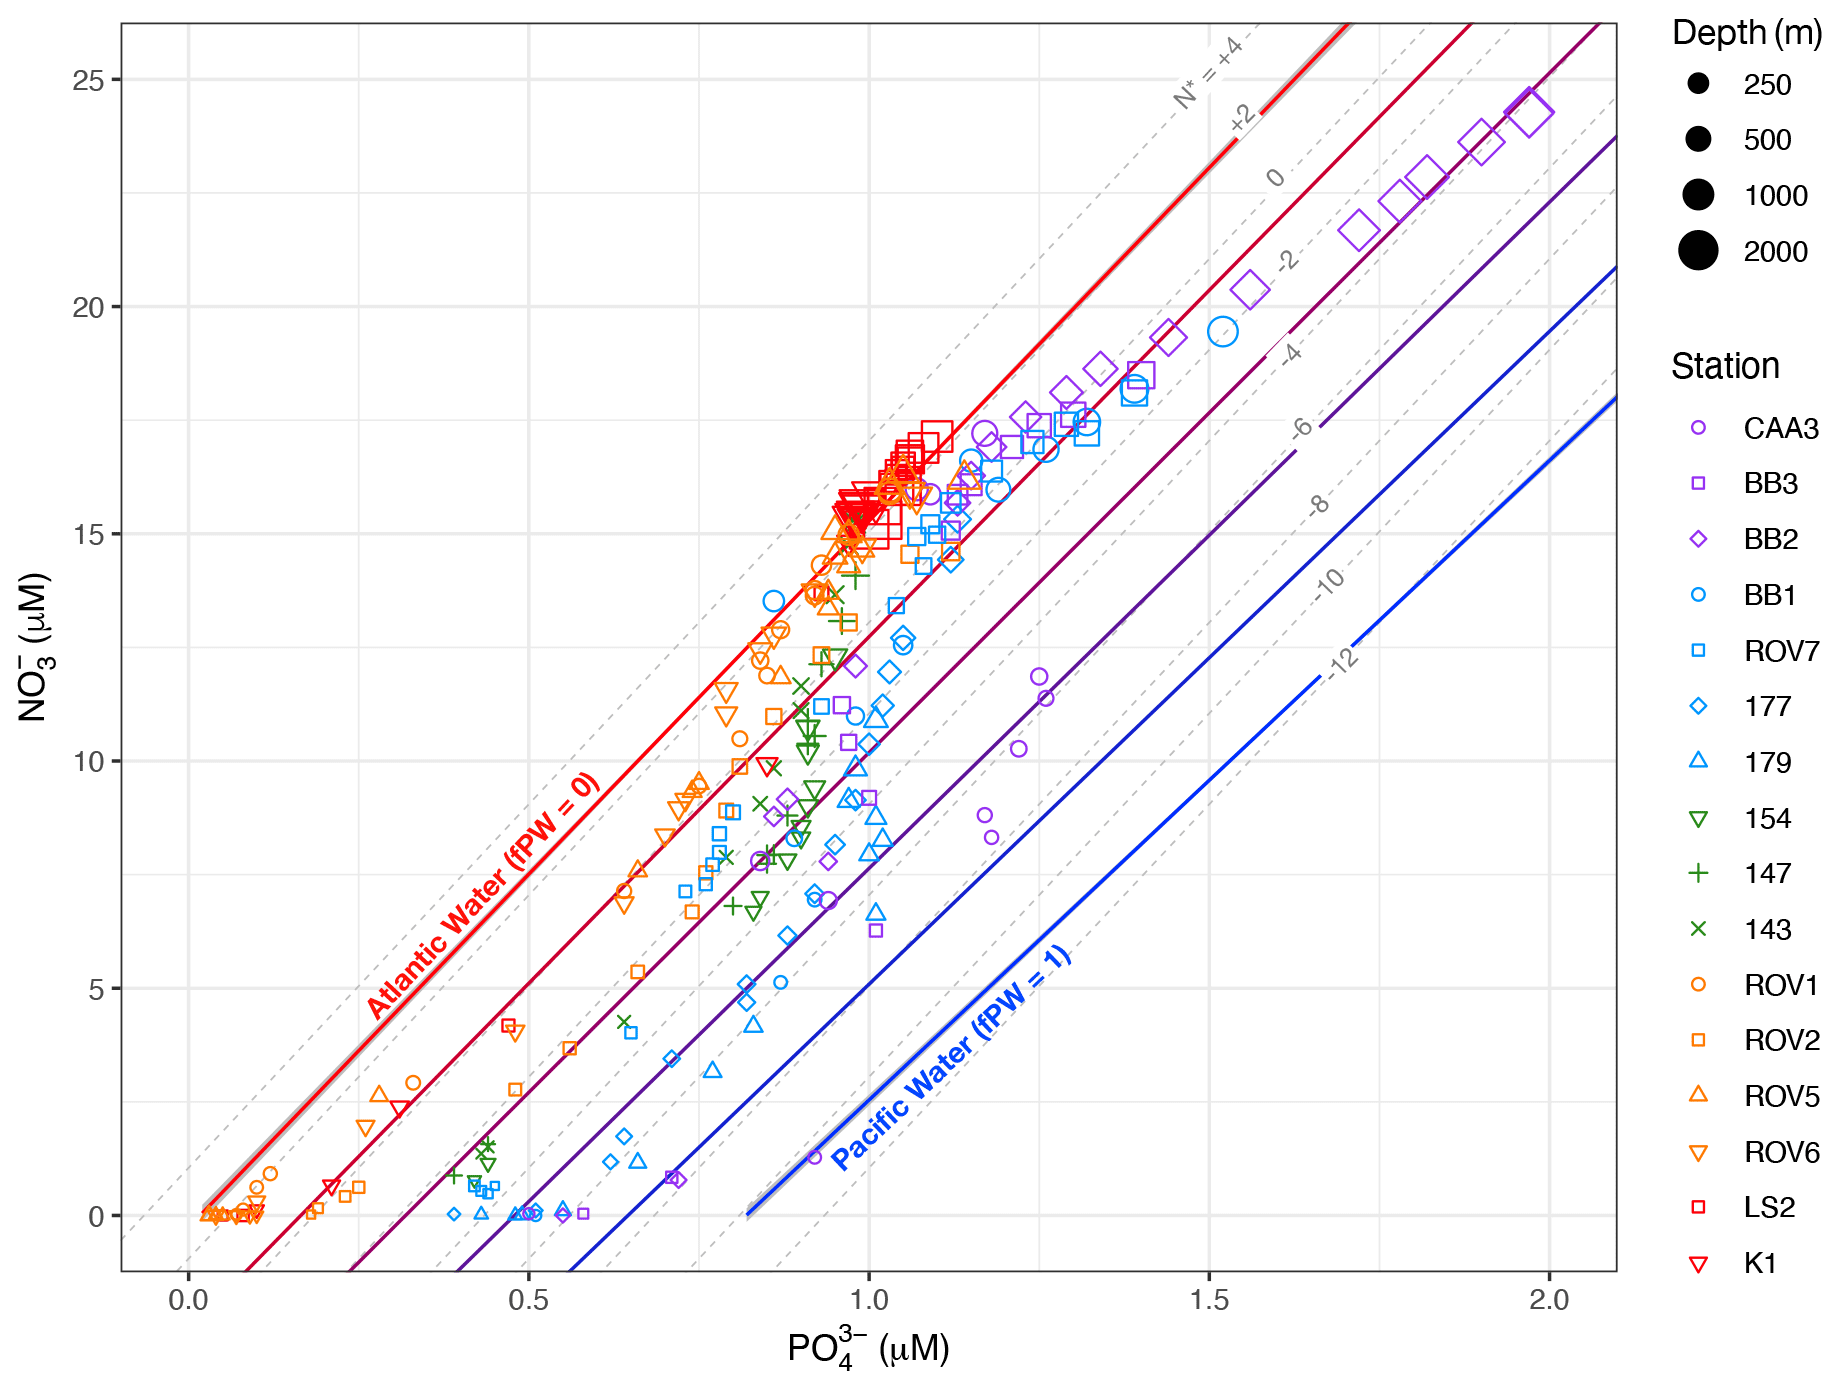
Figure 4NO vs. PO data for samples from all water depths in this study, with lines representing empirically derived Atlantic and Pacific water endmember N : P relationships. Endmember lines are enclosed by 95 % confidence intervals. Red- to blue-coloured lines between Atlantic and Pacific endmembers represent lines of constant fraction Pacific water (fPW), in increments of 0.2. Also shown are dashed grey lines of constant N*.
3.2.3 Nutrient ratios
NO-to-PO stoichiometry is expressed in profiles of N*, which were available for 19 of the 25 stations with paired NO and PO concentration data (Fig. 3f). Positive N* reflects a water mass history of excess fixed NO, e.g., by net N2 fixation; negative N* reflects a NO deficit, relative to the mean global ocean (Gruber and Sarmiento, 1997), induced by denitrification in the broadest sense (i.e., including other modes of suboxic DIN transformations to N such as anammox). N* signatures can be imported from other ocean regions or can be generated within a given water mass or region, depending on biogeochemical conditions. Positive N* occurred throughout most of the outer Hudson Strait and Labrador Basin profiles. The water masses LSW, NEADW, and DSOW (z> 200 m) all showed mean N* > 2 µM (Table 1), consistent with an Atlantic origin (Gruber and Sarmiento, 1997; Jenkins et al., 2015). The deflections to lower N* at z∼ 100 m (Fig. 3f) correspond to IW, which has lower N* due to mixing at the shelf–slope front (Cuny et al., 2002; Fratantoni and Pickart, 2007). Negative N* occurred through most of the Baffin Bay, Davis Strait, and Labrador Shelf profiles (Fig. 3f). As noted earlier, HW partially originates from the Bering and Chukchi shelf areas, where sedimentary denitrification fuelled by high water column productivity acts as a sink for dissolved NO. The resulting pronounced minimum in N* (< −10 µM; Yamamoto-Kawai et al., 2008; Mills et al., 2015) propagates via HW through the Canadian Arctic Archipelago and into Baffin Bay (Carmack and McLaughlin, 2011; Tremblay et al., 2015). This import of fixed-N-deficient waters explains the lowest N* values in HW (Table 1), with minima < 6 µM at stations CAA3, BB3, BB2, BB1, 177, and 179 (Fig. 3f). BBW had the next most negative N*, likely due to the upward propagation of partially denitrified bottom water nutrients (Tremblay et al., 2002; Lehmann et al., 2019). LShW had the most variable N* signatures, resulting from the mixing of HW and IW. The effect of this mixing is clearly evident in the cross-shelf increase in N* on the Labrador Shelf, from < −3 µM at station 154 to > 2 µM at station 143 (Fig. S5).
3.2.4 Fraction Pacific water
A cross plot of NO vs. PO concentrations helps to visualize the fraction of Pacific water among individual water samples relative to lines representing pure Atlantic and Pacific waters (Fig. 4). Note that the Atlantic line (fPW = 0) coincides with a line of constant N* = 2 µM (Fig. 4), which is also the average N* value for North Atlantic intermediate waters (Gruber and Sarmiento, 1997). The Pacific line (fPW = 1) falls between the lines where N* is −10 to −12 µM. Thus, depth profiles of fPW mirror those of N* (Figs. S3–S7). Data from the Labrador Basin regime fall on or close to the Atlantic line because the water masses at these stations (IW, LSW, NEADW, DSOW) are mostly Atlantic-sourced. Data from the other regimes plot increasingly toward the Pacific line in the order of the Hudson Strait, the Labrador Shelf, the Davis Strait, and Baffin Bay. Maxima in fPW (> 0.6) were found within the core of HW sampled at Lancaster Sound (CAA3) and along the path of the Baffin Island Current (BB2, BB3, BB1, 177, 179) (Figs. S3, S4).
Water samples with PO > 1.25 µM and NO > 17.5 µM correspond to BBW (Fig. 4). The data fall along a N : P trajectory with a slope of 9.6 ± 0.3. This slope is considerably lower than the slopes of either Atlantic or Pacific endmember waters. It arises from in situ remineralization of POM, as indicated by values > 0.5 (Figs. S3, S4), with a partial loss of NO via sedimentary denitrification (Lehmann et al., 2019). The denitrification generates N* values as low as −4.3 µM. Thus, the process that leads to low N* in BBW is separate and distinct from the processes that generate low N* in HW. As a result, it is not possible to calculate fPW for BBW, because remineralization and denitrification overprint the preformed N : P signatures (Jones et al., 2003).
Another complication with fPW estimates, as noted in Sect. 2.3, is that elevated concentrations of NO and NH may alter apparent N : P ratios with respect to the derived endmember relationships. Within the overall study region, NO and NH concentrations below the euphotic zone are generally < 1 µM (Harrison and Li, 2008; Martin et al., 2010; Azetsu-Scott et al., 2012). Where measured in the present study, NO concentrations were < 0.36 µM and NH concentrations were < 1 µM, except for six samples from the Labrador Basin regime with NH concentrations up to 2.5 µM (Figs. S3–S7). Thus, with the exception of those few samples, the overall low NO and NH concentrations should have little impact on fPW estimates.
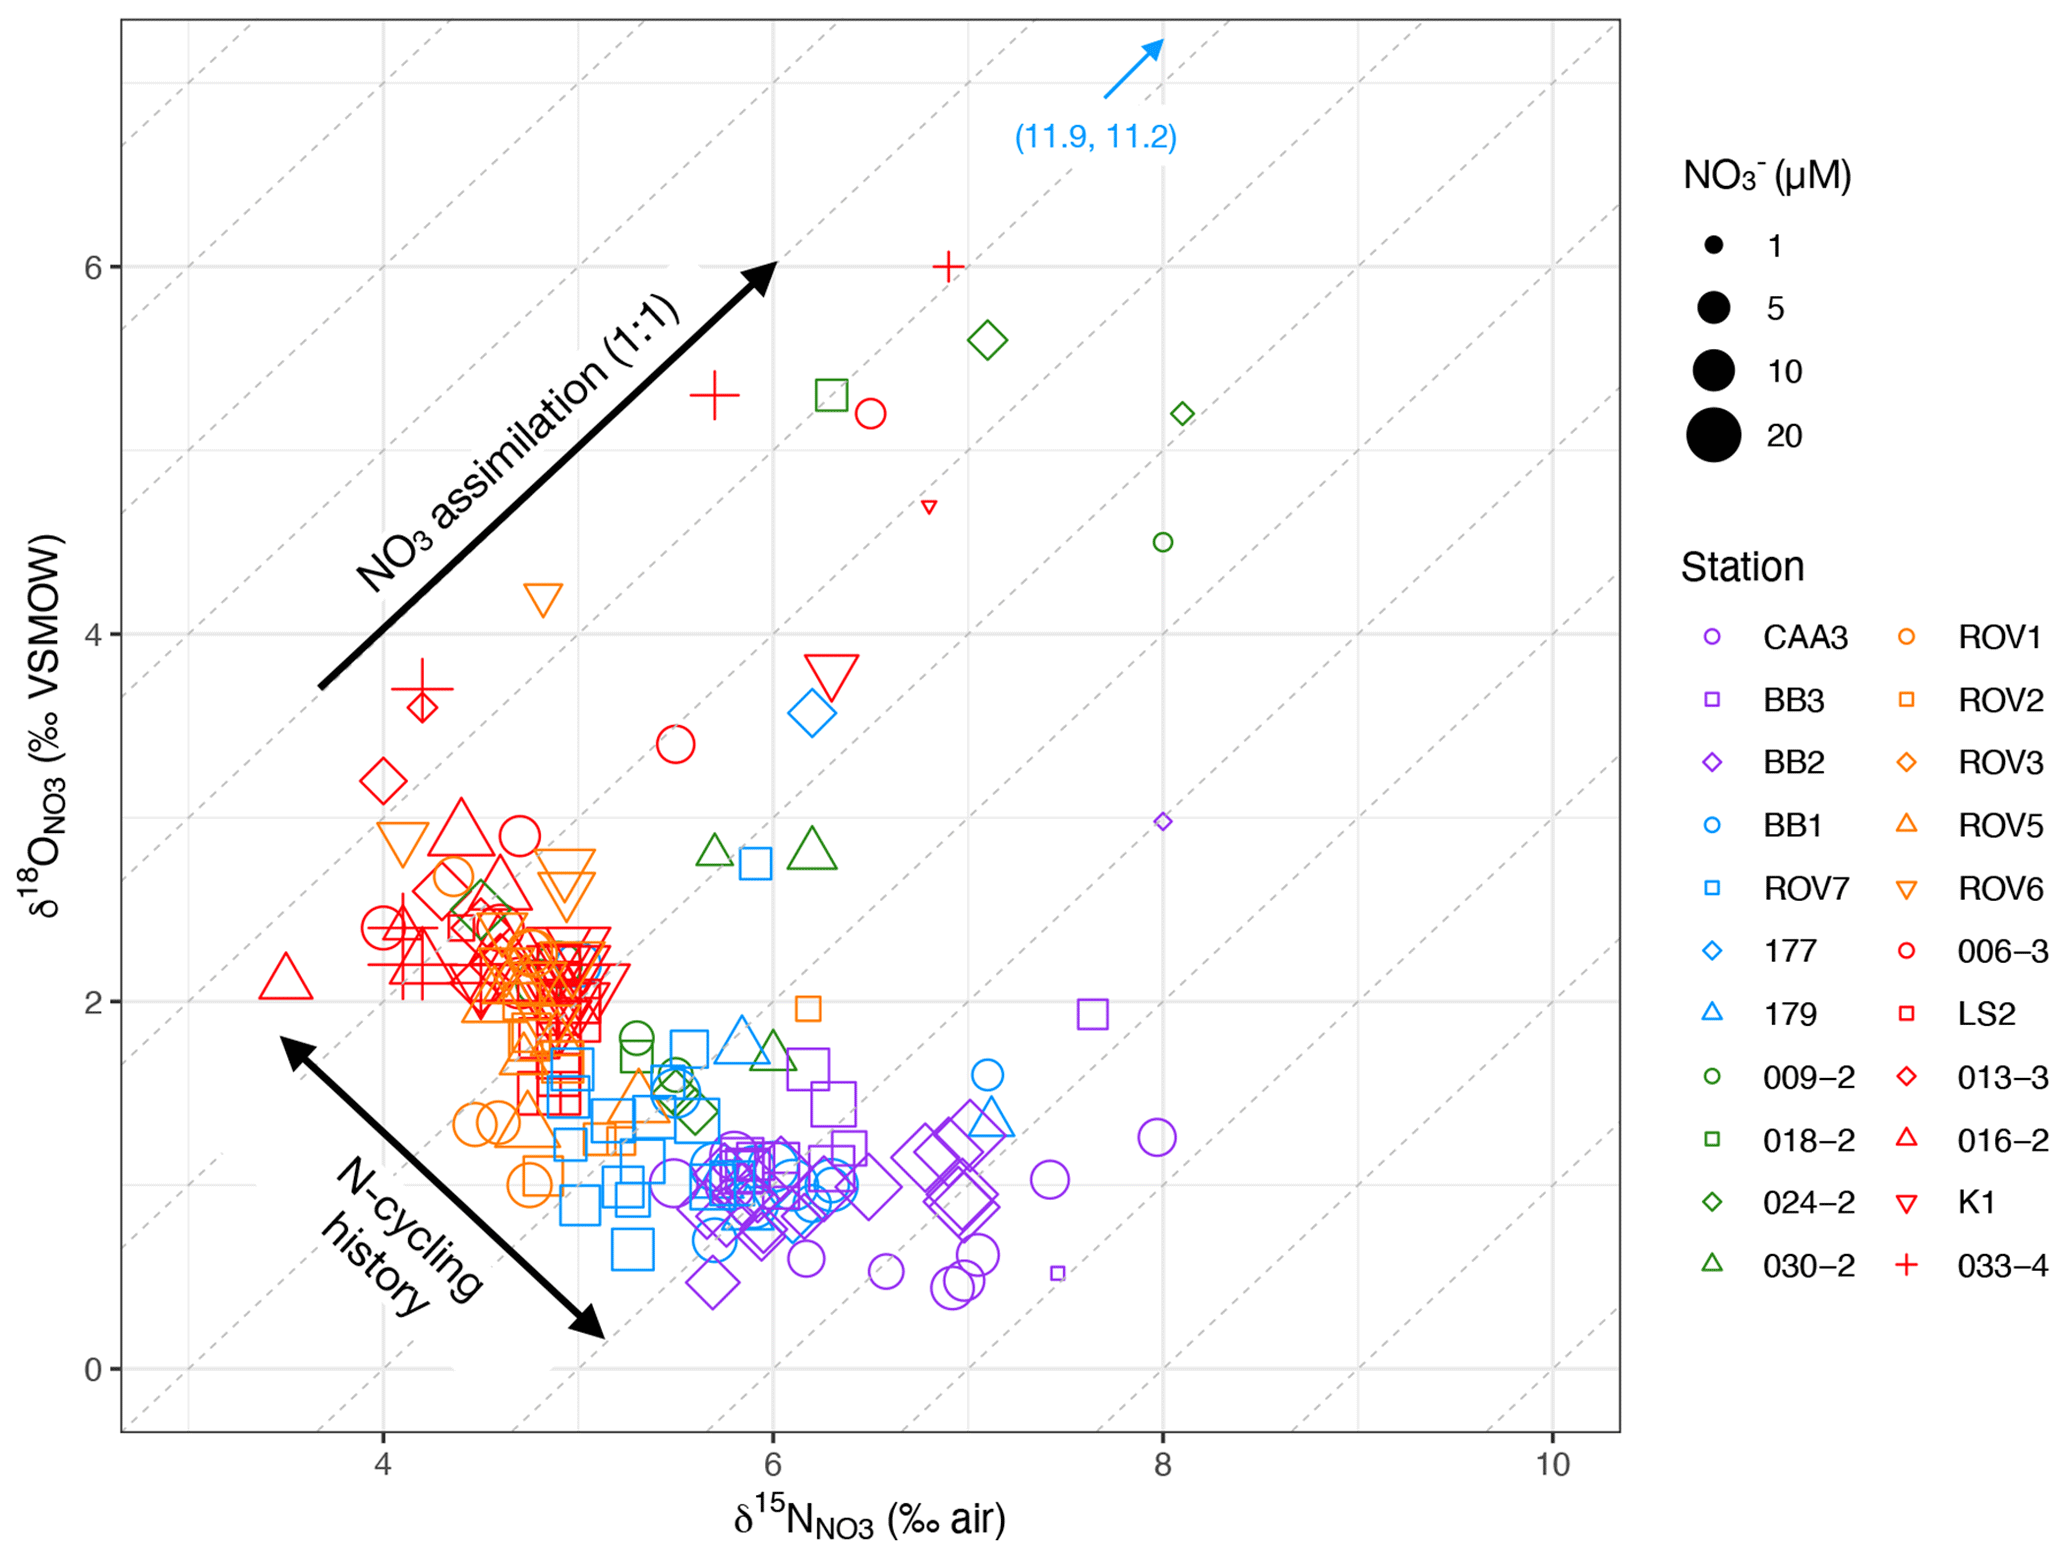
Figure 5δ18O vs. δ15N by station and NO concentration. The dense cluster of data centered at bottom left represents deep waters (> zp). Diagonal lines represent 1:1 isotopic fraction of 18O and 15N. Arrows denote isotopic fractionation associated with NO assimilation in the biologically productive zone and differences in water mass N-cycling histories.
3.3 NO isotope ratio variability
Isotope ratios of NO were measured at all 25 stations for δ15N and all but the three stations from the HUD-2005-016 expedition for δ18O. Patterns of isotopic variability are presented separately for waters in and below the base of the biologically productive zone (zP) in the following sub-sections.
3.3.1 Isotope ratios of NO in the biologically productive zone
For waters above zP, δ15N increased from values of around 5 ‰–6 ‰ to maxima of 12 ‰ toward the surface (Fig. 3g). The δ18O similarly increased from < 2 ‰–11 ‰ (Fig. 3h). In a cross plot of δ18O vs. δ15N, these isotopic enrichments extend approximately along lines of 1:1 (Fig. 5). The increase in isotopic ratios coincides with a decrease in NO concentrations and an increase in chlorophyll, as interpreted from fluorescence profiles (Figs. S1–S5). Together, these patterns are consistent with coupled (identical) fractionation of 15N and 18O during NO assimilation (Granger et al., 2004; Sigman et al., 2005).
To further demonstrate the effect of NO assimilation on isotopic ratios, δ15N and δ18O are plotted against the natural logarithm of NO concentrations, where the “kinks” in the relationships represent the base of the NO assimilation zone (Fig. 6). To the left of the kinks, both δ15N and δ18O increase with decreasing NO, again consistent with coupled fractionation of 15N and 18O during NO assimilation. Moreover, assuming a mainly vertical supply of nutrients to the euphotic zone, the isotopic composition of the NO used in assimilation may be approximated by the minima in δ15N and δ18O at the kinks (Fig. 6; Rafter and Sigman, 2016; Peters et al., 2018). In this respect, the δ15N of the assimilated NO increases from its lowest values at the Labrador Basin stations to its highest values at the Baffin Bay stations. The minima in δ18O data show the opposite trend, with the lowest values at the Baffin Bay stations and highest values in the Labrador Basin.
3.3.2 Isotope ratios of NO below the biologically productive zone
Below zP, δ15N ranged from 4.1 ‰–6.5 ‰ (Fig. 3) and varied significantly by water mass (one-way ANOVA; Table 1). The Atlantic-derived water masses (IW, LSW, NEADW, DSOW) sampled in the Hudson Strait and Labrador Basin regimes had the lowest mean δ15N (4.8 ± 0.3‰). This value is identical to the δ15N of North Atlantic intermediate-depth waters; it represents the basin-scale N isotopic mass balance between relatively 15N-depleted NO in Atlantic subtropical thermocline water and Mediterranean Overflow Water and relatively 15N-enriched NO in Antarctic Intermediate Water (Marconi et al., 2015). The Pacific-influenced HW, as well as BBW sampled in Baffin Bay and the Davis Strait, displayed the highest mean δ15N (> 6 ‰). The elevated δ15N in HW reflects its predominant origin in the western Arctic. At the entrance to the western Arctic, Pacific-origin NO propagating onto the Bering Shelf has an already-high δ15N (6.3 ‰; Lehmann et al., 2005). As Pacific waters flow across the productive Bering and Chukchi shelves, NO becomes further isotopically enriched due to benthic coupled nitrification–denitrification (CPND), which results in the removal of isotopically light NH from the system and the efflux of heavy NH into the overlying water column (Granger et al., 2011; Brown et al., 2015). Subsequent water column nitrification leads to the characteristically high δ15N signature of the western Arctic upper halocline (∼ 8.0 ‰; Brown et al., 2015; Granger et al., 2018; Fripiat et al., 2018). The δ15N signature in BBW, on the other hand, is consistent with in situ remineralization in deep Baffin Bay, as indicated by high AOU and nutrient concentrations. The high δ15N (> 7.0 ‰; Fig. 3g) indicates that the POM exported to the deep Baffin Bay is largely fuelled by Pacific-derived nutrients in northern Baffin Bay (Lehmann et al., 2019), given that the N isotopic composition of newly nitrified NO largely reflects the signature of its source substrate. The LShW sampled on the Labrador Shelf exhibited intermediate and more variable δ15N signatures (5.4 ± 0.7 ‰), which, as with the corresponding N* data, was consistent with mixing of HW and IW across the Labrador Shelf.
Values of δ18O also varied significantly by water mass (one-way ANOVA) but as a mirror image of δ15N (Table 1). The LSW, NEADW, and DSOW exhibited higher δ18O (> 1.8 ‰); HW and BBW had lower values (> 0.3 ‰). The low δ18O in HW is within the range of values previously reported for the western Arctic upper halocline layer (Brown et al., 2015; Granger et al., 2018; Fripiat et al., 2018), where values close to 0 ‰ are indicative of the highly remineralized NO pool, as nitrification introduces a low δ18O close to a value of ambient seawater (+1.1 ‰; Casciotti et al., 2008; Sigman et al., 2009; Buchwald et al., 2012). Low δ18O values associated with BBW similarly reflect the high proportion of remineralized nutrients in the deep Baffin Bay (Lehmann et al., 2019). The significantly higher δ18O in the Labrador Sea subsurface layer reflects the remote signal of partial assimilation in the Southern Ocean, as well as a higher δ18O of water oxygen atoms that are incorporated during remineralization in transit in the Atlantic versus the Arctic (Marconi et al., 2015; Granger et al., 2018). The differential NO isotope tagging of the various sub-euphotic water masses, which is a function of their different origin and N-cycling history, holds great potential to trace the distribution of these water masses in the northwest Atlantic and thus to assess the contribution from Pacific sources.
To explore the biogeochemical drivers of δ15N and δ18O in the different water masses further, a correlation matrix of physical and chemical variables was constructed (Fig. S8). The strongest covariates of δ15N were fPW (r=0.89) and N* (), followed by θ () and then variables associated with diatom and POM remineralization in BBW: Si(OH)4 (r=0.65), AOU (r=0.64), and PO (0.61). Upon recalculating the correlation matrix without BBW (see below), the correlations with fPW (r=0.91) and N* () became even stronger, followed by salinity (), θ (), and NO (). All five of these parameters exhibit multicollinearity; that is, waters with high fPW also have low N* and are colder, are fresher, and have less preformed NO than waters with low fPW. The same parameters were also correlated with δ18O but opposite in sign (Fig. S9).
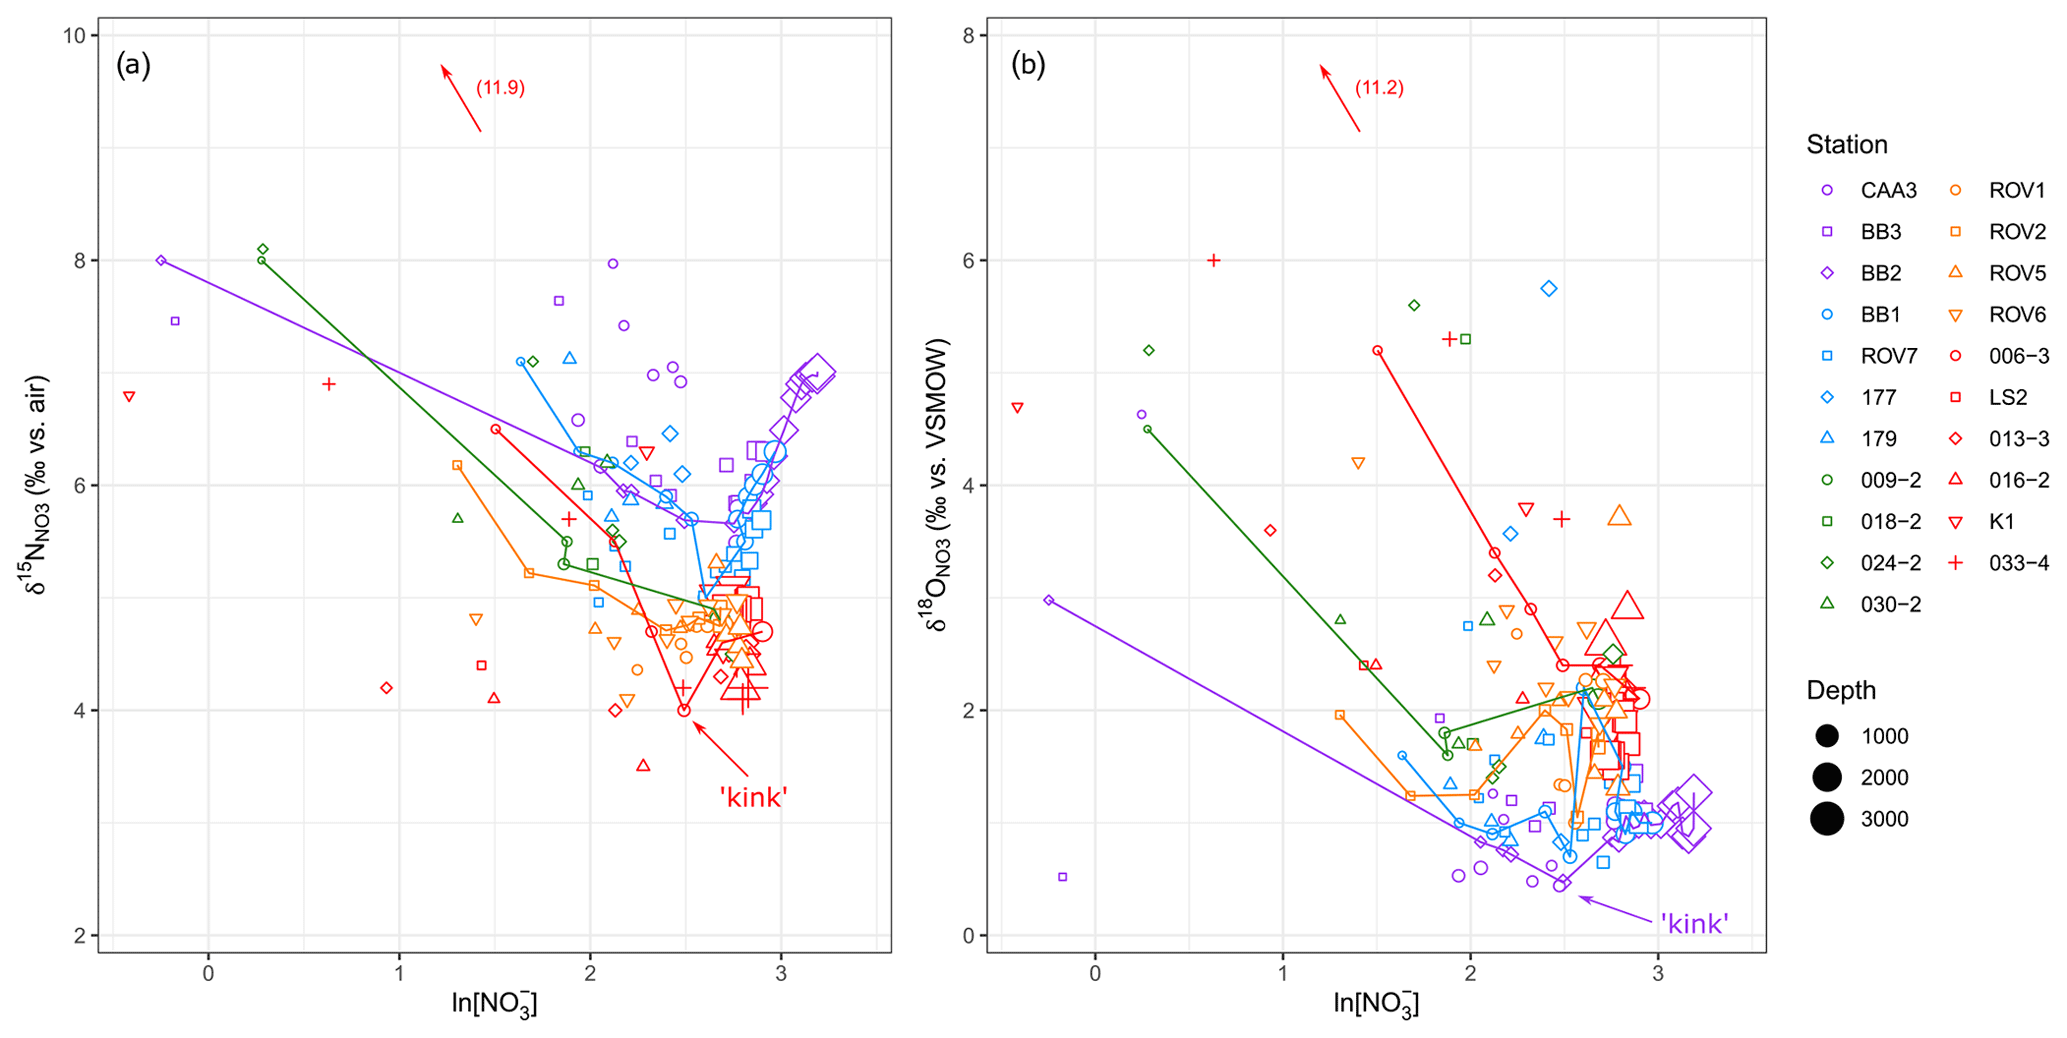
Figure 6(a) δ15N and (b) δ18O plotted against the natural logarithm of NO concentrations. The kink represents the base of the NO assimilation zone. For clarity, only some of the station data are connected by lines.
In a plot of δ15N versus N*, the regression line through the main group of data is highly significant (p ≪ 0.001) with an r2 value of 0.78 (Fig. 7a). Note that BBW data plot above and to the right of the rest of the data. We hypothesize that this shift arises from remineralization of PO and NO, followed by loss of the NO via sedimentary denitrification (Lehmann et al., 2019). A conceptual model of this two-step process is shown in the Fig. 7a inset. The source of preformed nutrients in the deep Baffin Bay is still debated (Tang et al., 2004), but, assuming a dominantly Atlantic source (Azetsu-Scott et al., 2012), the preformed nutrients would plot near the other Atlantic waters with N* values > 0 µM and δ15N ∼ +5 ‰ (e.g., Marconi et al., 2015; Granger et al., 2018; Fripiat et al., 2018). Under a simplifying assumption of near-Redfield stoichiometry, the N* would remain unchanged during remineralization. (We note, however, that lower-than-Redfield N : P uptake has been documented in Baffin Bay – Harrison et al., 1982 – which would shift the N* to lower values.) The POM originates in the overlying 15N-enriched HW, which would generate remineralized NO with relatively high δ15N in BBW. Subsequent sedimentary denitrification would shift the N* to lower values because the process acts as a sink for NO but not for PO. This process has a negligible effect on water column δ15N, as the NO is completely reduced in the sediments such that there is effectively no isotopically modified NO to diffuse back into the overlying water (Brandes and Devol, 1997; Lehmann et al., 2005, 2007). This again highlights that the processes affecting N* and δ15N in BBW are separate and distinct from those influencing HW or the other water masses (Lehmann et al., 2019).
The relationship between δ15N and fPW is also highly significant (p< < 0.001) with an r2 of 0.80 (Fig. 7b). The intercept, corresponding to 100 % Atlantic water, is 4.8 ± 0.04 ‰. This value coincides exactly with previous estimates of the mean δ15N (4.8 ‰) in North Atlantic intermediate and deep waters (Marconi et al., 2015). This is not surprising given that samples of 100 % Atlantic water are represented in the data distribution (Fig. 4). The regression also predicts the δ15N for 100 % Pacific water at 8.3 ± 0.2 ‰. This value likewise matches with previous measurements of the Pacific halocline water measured in the eastern Beaufort Sea, downstream of the centers of CPND (δ15N ± 0.1 ‰; Brown et al., 2015; Granger et al., 2018). Such accurate prediction of the Pacific endmember is remarkable, considering the degree of extrapolation beyond the limit (fPW ≤ 0.6) of sample data.
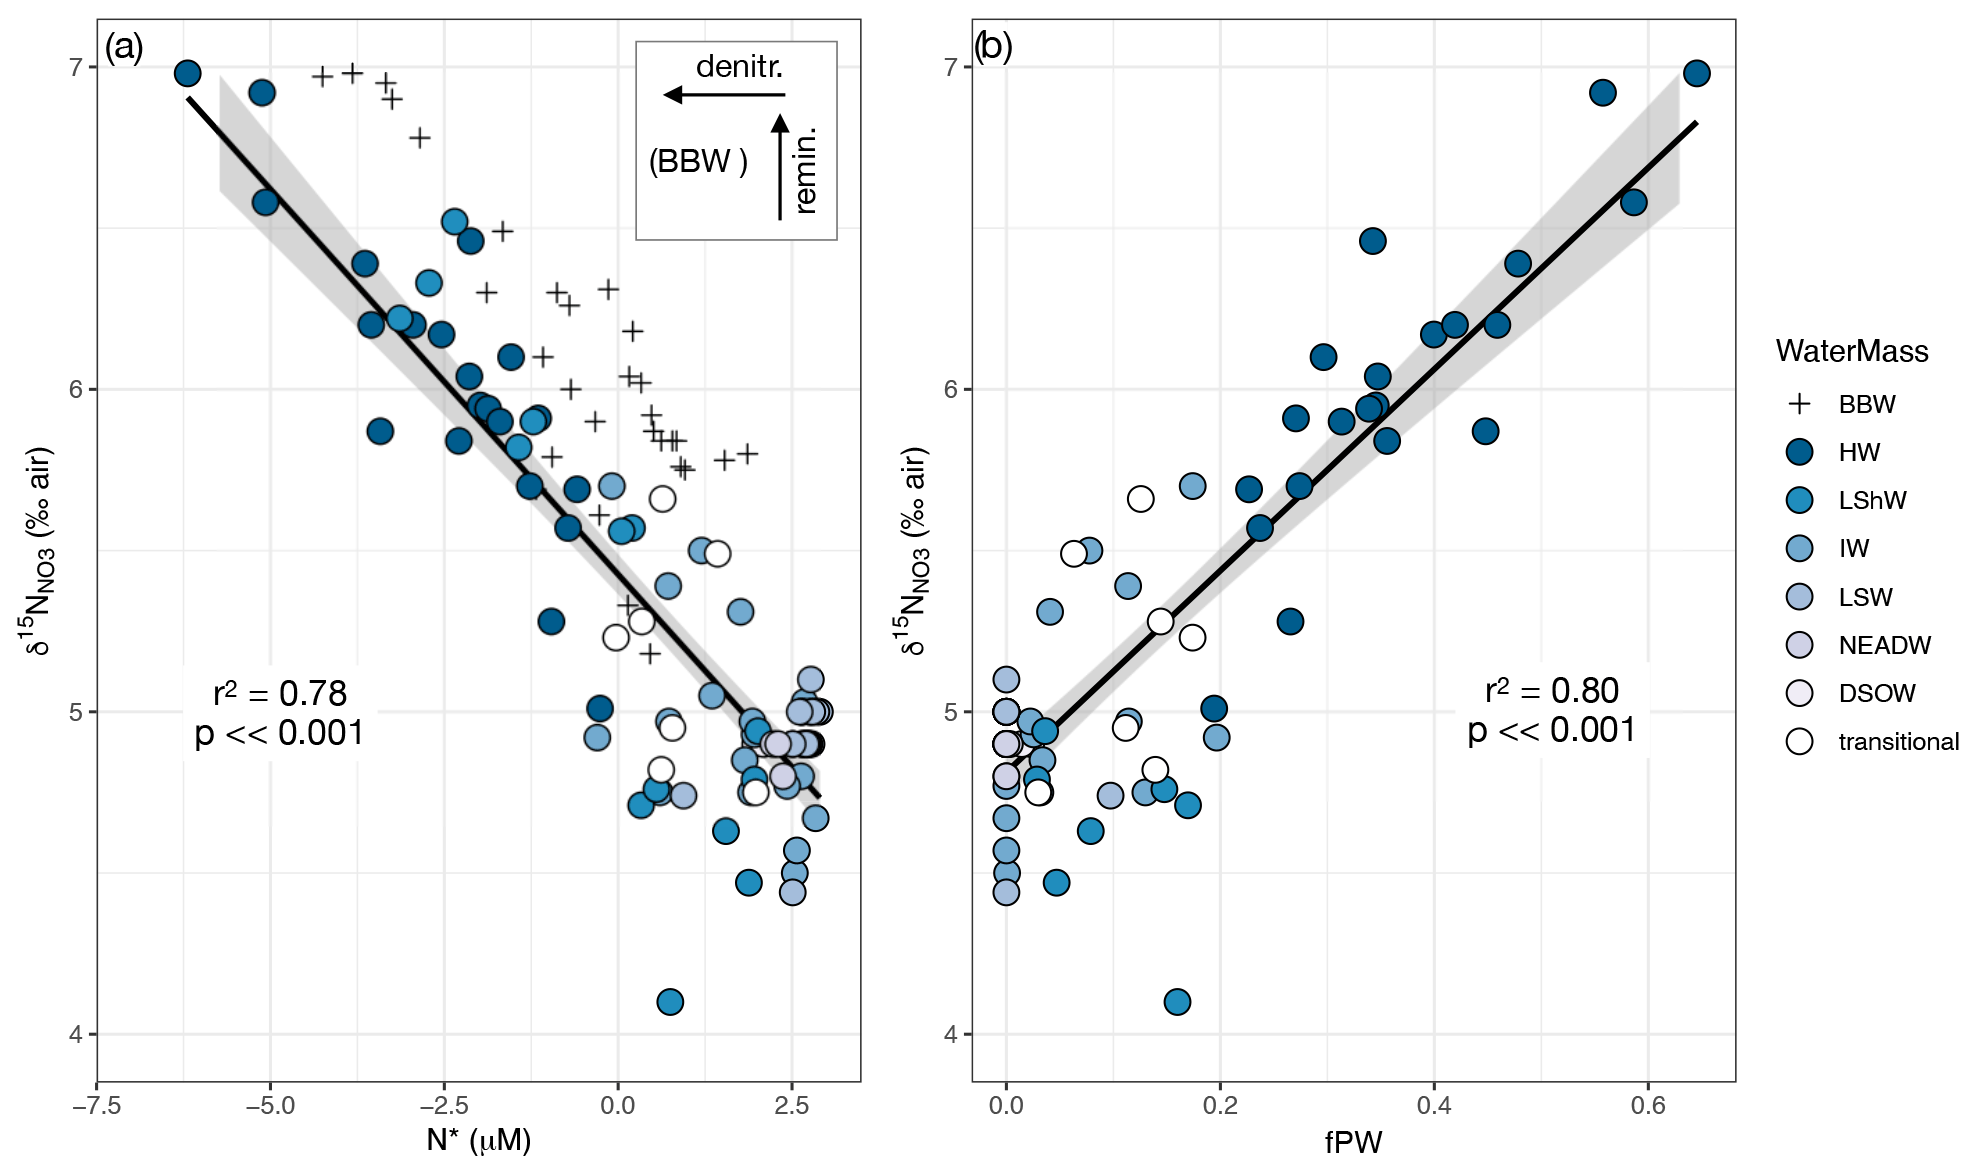
Figure 7(a) δ15N vs. N*. Regression line excludes BBW because these waters are affected by remineralization and denitrification as indicated by the inset conceptual schematic. See text for explanation. (b) δ15N vs. fPW, with BBW excluded because it is not possible to calculate fPW when NO and PO ratios are not conserved. Data in both plots are for depths > zp to avoid the effects of NO assimilation. Regression lines in both plots are bounded by 95 % confidence intervals.
Relationships for δ18O vs. N* and δ18O vs. fPW (Fig. S9) were also highly significant (p ≪ 0.001), although weaker, with r2 values of 0.38 and 0.35, respectively. The δ18O vs. fPW relationship predicts δ18O 1.9 ± 0.1 ‰ for 100 % Atlantic water and δ18O ± 0.3 ‰ for 100 % Pacific water, close to previous direct measurements of Atlantic and Pacific water in their respective source regions (Marconi et al., 2015; Brown et al., 2015; Granger et al., 2018).
4.1 Preservation of NO isotope signatures
One of the objectives of this paper is to assess the preservation of NO isotope signatures during transit of Pacific water from the Canadian Arctic Archipelago southward into the northwest Atlantic. Accurate prediction of δ15N and δ18O in Atlantic and Pacific source waters based on the relationships in Figs. 7b and S9b is perhaps the strongest indication that the signatures are well preserved. This preservation is likely facilitated by the oxic conditions in all water masses, as well as by the extreme vertical density gradient, which isolates the HW from vertical mixing as it propagates downstream from the Arctic (Tremblay et al., 2015). We also consider that N2 fixation would act to increase N* while decreasing δ15N, and while there is some evidence of diazotrophy in northern waters (Blais et al., 2012; Sipler et al., 2017; Harding et al., 2018), reported rates are small to negligible and are therefore unlikely to impact water column δ15N signatures, as suggested by the data in Fig. 7a.
4.2 Prediction of fraction Pacific water from δ15N
Another objective of this study is to evaluate the use of δ15N, specifically, as a water mass tracer because it is potentially reflected in the δ15N of living and detrital biomass. Based on the preceding results, sub-euphotic zone δ15N may be considered the product of two-endmember mixing of Atlantic and Pacific water (Fig. 7b). Thus, by inversion of the linear regression in Fig. 7b, fPW may be derived. To achieve normality of model residuals, it was necessary to remove data where fPW = 0, as well as three outliers identified in quantile–quantile plots. The resulting final model follows Eq. (7):
The 95 % confidence intervals of fPW predictions range from 0.02 to 0.1, which is roughly equal to the error associated with estimating fPW from NO vs. PO data (Sect. 3.3; see also Jones et al., 2003). In other words, δ15N may be used to estimate fPW about as well as nutrient data. Of course, it is less labour intensive to analyze and use N : P concentrations to estimate fPW, but there are scenarios in which a proxy δ15N approach is complementary or even essential. For example, δ15N of a water mass integrates the overall history of nutrient cycling, thereby smoothing out short-lived contingencies inherent to seawater chemistry data. N : P concentration data alone also cannot identify and/or distinguish between the various processes (i.e., remineralization, nitrification, denitrification, diazotrophy) affecting nutrient concentrations and stoichiometric ratios. As a case in point, the two-step process of remineralization followed by sedimentary denitrification in BBW would not be obvious without paired N : P and δ15N data (Fig. 7a) and invites further investigations to help clarify their proportional effects on bottom water N : P ratios (Lehmann et al., 2019). We also suggest that isotope data can be used to screen samples that deviate from a two-endmember mixing model for the calculation of fPW. Finally, the relationship in Eq. (7) provides, for the first time, a coherent framework for interpreting δ15N signatures incorporated into living and paleo-organic materials in the hydrographically complex northwest Atlantic marine ecosystem.
4.3 Incorporation of δ15N into baseline δ15N for food web and paleoceanographic studies
In isotope ecology and paleoceanography contexts, the term “baseline” δ15N usually refers to the δ15N of primary producer (phytoplankton) biomass. This baseline δ15N signature is propagated to organisms higher up in the food web, overprinted by trophic fractionation, which is often assumed to be about +3.4 ‰ per trophic level but is in fact widely variable (Minagawa and Wada, 1984; Vander Zanden and Rasmussen, 2001). The baseline signature may also be altered by bacterial degradation during sinking and sedimentation of particulate organic material (Lehmann et al., 2002; Robinson et al., 2012). In either instance, it is critical to know, or be able to approximate, baseline δ15N in order to interpret the environmental significance of δ15N variability recorded in organisms or sediments.
Phytoplankton fractionate against the heavier isotopes of N and O during growth on NO. Thus, under open-system conditions, the δ15N of the phytoplankton will be lower than that of the NO. The isotopic fractionation varies from about 2 ‰–10 ‰, depending on phytoplankton species and growth conditions (Needoba et al., 2003). Under the semi-closed conditions of NO drawdown in the ocean euphotic zone, the δ15N of both NO and phytoplankton increase, following Rayleigh fractionation kinetics (Fig. 6). If the NO is exhausted, the δ15N of phytoplankton will, by isotope mass balance, converge on that of the original, unassimilated NO. Hence, baseline δ15N reflects the combined influences of δ15N and the degree of NO utilization (Altabet et al., 1999; Trull et al., 2008). It is difficult to distinguish between these influences unless δ15N is measured on paired samples of phytoplankton and NO. This has not been performed anywhere in our study region, apart from in studies located in more inshore areas (Ostrom et al., 1997). Nevertheless, it is possible to make general inferences about nutrient drawdown and its effect on baseline δ15N from a consideration of regional nutrient–plankton bloom dynamics. In the Labrador Sea and Baffin Bay, light is the principal limiting factor to phytoplankton growth for most of the year; however, during the peak summer growth period, NO becomes co-limiting or limiting as concentrations within the mixed layer are depleted (Harrison and Li, 2008). This applies even in the more light limited Arctic, where productivity is tightly coupled to NO availability (Tremblay et al., 2006; Martin et al., 2010). Therefore, the δ15N of the accumulated phytoplankton biomass should approach that of the pre-assimilated NO, as identified by the kink in Fig. 6. This was confirmed in a study of spring bloom dynamics in the North Water Polynya in northern Baffin Bay, where the δ15N of phytoplankton converged on the δ15N of Arctic halocline water (8.3 ‰) as the fraction of unassimilated NO was drawn down to < 10 % of the pre-bloom concentrations (Tremblay et al., 2006). Considering that northern Baffin Bay is located at a latitude of maximum light limitation, we would predict that the patterns observed there also apply to Pacific-influenced waters of the more southerly Baffin Bay and continental shelves of eastern Canada, except perhaps to inshore and upwelling regions, where NO would be less limiting. For Atlantic-influenced waters, NO is already relatively less limiting than P and Si (Fig. 3). Under these conditions, phytoplankton will be more likely to fractionate against 15N (becoming “lighter”), thereby amplifying the existing differences in δ15N between the Atlantic- and Pacific-derived water masses (Fig. 6). Additional studies are needed to determine the effective fractionation, if any, over seasonal and longer timescales.
4.4 Implications for isotope ecology
Results presented here may help to explain previously documented spatial variability in organism δ15N in the northwest Atlantic and Baffin Bay regions. For example, Sherwood and Rose (2005) examined bulk δ15N in invertebrates and fish in waters off Newfoundland and Labrador. Organism δ15N within each feeding guild was consistently higher, by up to 2.7 ‰, at coastal sites compared to shelf break sites. Part of this offset may be explained by the cross-shelf gradient in fPW, which increases from < 0.02 at the shelf break to > 0.5 at the coast (Pepin et al., 2013; see also the fPW and δ15N profiles for stations 143, 147, and 154 – Fig. S5), and corresponds to an increase of 2.3 ‰ in δ15N based on Eq. (7). Similarly, in studies located off western Greenland, J. Hansen et al. (2012) and Hedeholm et al. (2012) reported that δ15N in primary consumers increased by 2 ‰–3 ‰ over a latitudinal gradient from 60–72∘ N. Subsurface fPW off southern Greenland is essentially zero (Sutherland et al., 2009; Azetsu-Scott et al., 2012) and increases northward as IW and West Greenland Shelf Water mixes with HW, reaching values > 0.4 based on sparse nearby data (e.g., station ROV7 profile, Fig. S4; J. Hansen et al., 2012). The corresponding increase in δ15N is > 2 ‰. This suggests that, in the examples above, the spatial variability in organism δ15N may be attributed largely to the differential water mass partitioning, rather than to spatial variations in the degree of NO utilization directly at the respective study sites. Finally, Sherwood et al. (2008) examined the bulk δ15N in the tissues of deep-sea corals collected along the continental slope from the Hudson Strait (62∘ N) to the southwest Grand Banks of Newfoundland (43∘ N). They found no overall change in δ15N with respect to latitude, but this is consistent with the minimal latitudinal change in fPW (< 0.1) along the path of the slope component of the Labrador Current (Jones et al., 2003). Overall, these examples reiterate the fundamental importance of accounting for variability in baseline δ15N in isotope ecology studies (e.g., de la Vega et al., 2021). It is not always feasible to measure δ15N in NO or primary producers directly; thus we suggest that baseline δ15N for the Canadian Arctic and northwest Atlantic region may be approximated, to a first degree, from nutrient concentrations and either of the N* or fPW relationships presented in Fig. 7.
4.5 Implications for paleoceanography
Our results also have important implications for regional paleoceanographic interpretations of δ15N as recorded in sedimentary organic matter and in long-lived biological archives. With respect to sediments, δ15N is confounded by site-to-site differences in sedimentation rates and diagenetic effects (Robinson et al., 2012). Nevertheless, known spatial patterns track the expected distribution of fPW, with lower values of 4 ‰–6 ‰ in the central Labrador Sea and Southwest Greenland margin and higher values of 6 ‰–9 ‰ on the Labrador Shelf and in northern Baffin Bay (Muzuka and Hillaire-Marcel, 2000; Cormier et al., 2016; Kienast et al., 2020; Limoges et al., 2020). Thus, by extension, downcore trends in δ15N should reflect advection-related temporal changes in fPW. Based on arguments in Sect. 3.6, this advection influence is likely to exceed the influence of surface water NO utilization, particularly where NO is limiting. This may help to explain why downcore variations in δ15N are positively correlated with other biomarker and micropaleontological proxies for Arctic throughflow to Baffin Bay (Cormier et al., 2016; Limoges et al., 2020), confirming the potential of sedimentary δ15N to quantitatively reconstruct changes in fPW in the past, at least in areas where local changes in nutrient utilization did not play a greater role. This also applies to records of δ15N recorded in biological archives such as deep-sea corals, which have been shown to track changes in the southward advection of the Labrador Current over the 20th century (Sherwood et al., 2011). We note that, as the N-cycling regimes in the source region and/or in the North Atlantic may have shifted in the past, long-term changes in downcore or archival δ15N may also be influenced by variability in endmember δ15N signatures (i.e., NO “inventory-altering” effects; Galbraith et al., 2013), particularly for the Pacific water endmember which is sensitive to primary productivity via sedimentary CPND on the western Arctic shelves. Thus, long-term variability in δ15N should be carefully interpreted in the context of all three influences – nutrient utilization, advection, and changes to endmember δ15N signatures – together with other lines of paleoceanographic evidence.
The flow of Pacific water through the Canadian Arctic Archipelago and into the northwest Atlantic plays a key role in global thermohaline circulation and biogeochemical cycling. The isotopic composition of NO presents a new way to track this influence, expanding on the existing N : P stoichiometry approach. Isotopically distinct Pacific water (δ15N ‰; δ18O = 0 ‰) travels as a subsurface halocline layer through the Canadian Arctic Archipelago and onward to Labrador Shelf, with little apparent alteration other than mixing with Atlantic water (δ15N ‰; δ18O = 2.0 ‰). The resulting two-endmember mixing of Pacific and Atlantic water is described by a new empirical relationship that may be used to estimate the fraction of Pacific water from δ15N. The deep waters of Baffin Bay are distinctly different, with nutrient inventories showing an imprint of both in situ remineralization and sedimentary denitrification. These deep waters are isolated below 500 m and therefore do not influence baseline δ15N incorporated into primary producer biomass. Rather, baseline δ15N throughout the Labrador–Baffin region should primarily reflect the fraction of Pacific water, particularly where NO is the limiting nutrient. Overall, these results provide a new framework for interpreting spatial and temporal patterns of δ15N in isotope ecology and paleoceanography contexts. In particular they highlight the potential of δ15N recorded in sedimentary and organic paleo-archives to quantitatively reconstruct changes in the fraction of Pacific water in the past.
R code used for data processing is available upon request from the corresponding author.
Data presented in this article may be accessed via the following link: https://doi.org/10.5281/zenodo.5129246 (Sherwood et al., 2021).
The supplement related to this article is available online at: https://doi.org/10.5194/bg-18-4491-2021-supplement.
OAS, SHD and MK conceptualized the research with input from all authors. OAS, SHD, and MK collected the samples. SHD and NL carried out nitrate isotope analyses. OAS, SHD, NL, CB, and MK analyzed the data. OAS, SHD, and NL prepared the manuscript with contributions from all authors.
The authors declare that they have no conflict of interest.
Publisher’s note: Copernicus Publications remains neutral with regard to jurisdictional claims in published maps and institutional affiliations.
We thank the captain, crew, and science staff of R/V Maria S. Merian MSM45 and CCGS Amundsen AMD-2016 expeditions. We also thank ArcticNet (a Canadian Network of Centres of Excellence) and Amundsen Science for their in-kind contributions to expedition logistics and scientific equipment. McKenzie Mandich (Dalhousie University) analyzed nutrient concentrations for the MSM45 samples. Jean-Éric Tremblay facilitated sample collection and nutrient analysis during the AMD-2016 expedition. Thomas Kuhn (University of Basel) analyzed nitrate isotopes for the AMD-2016 samples. Claude Hillaire-Marcel provided input on earlier drafts of the manuscript.
Funding for this project was provided by the Canadian Foundation for Innovation and by the Natural Sciences and Engineering Research Council (NSERC) of Canada through a Climate Change and Atmospheric Research grant to Paul Myers (RGPCC433898); a Ship Time Allocations Committee grant to Evan N. Edinger (515528-18); a Strategic Partnerships grant to Markus Kienast and Owen A. Sherwood (521427-18); and Discovery grants to Owen A. Sherwood (RGPIN-2018-05590) Carolyn Buchwald (RGPIN-2018-05568), Evan N. Edinger (RGPIN-2014-04826), Markus Kienast (RGPIN-2016-04885), and Claude Hillaire-Marcel (RGPIN-2018-05031).
This paper was edited by Marcel van der Meer and reviewed by two anonymous referees.
Aksenov, Y., Bacon, S., Coward, A. C., and Holliday, P.: Polar outflow from the Arctic Ocean: A high resolution model study, J. Mar. Syst. 83, 14–37, https://doi.org/10.1016/j.jmarsys.2010.06.007, 2010.
Altabet, M. A., Pilskaln, C., Thunell, R., Pride, C., Sigman, D. M., Chavez, F., and Francois, R.: The nitrogen isotope biogeochemistry of sinking particles from the margin of the eastern North Pacific, Deep.-Sea Res. Pt. I, 46, 655–679, https://doi.org/10.1016/S0967-0637(98)00084-3, 1999.
Anderson, L. A. and Sarmiento, J. L.: Redfield ratios of remineralization determined by nutrient data analysis, Global Biogeochem. Cy., 8, 65–80, https://doi.org/10.1029/93GB03318, 1994.
Arrigo, K. and van Dijken, G. L.: Secular trends in Arctic Ocean net primary production, J. Geophys. Res., 116, C09011, https://doi.org/10.1029/2011JC007151, 2011.
Azetsu-Scott, K., Petrie, B., Yeats, P., and Lee, C.: Composition and fluxes of freshwater through Davis Strait using multiple chemical tracers, J. Geophys. Res., 117, C12011, https://doi.org/10.1029/2012JC008172, 2012.
Benetti, M., Reverdin, G., Lique, C., Yashayaev, I., Holliday, N. P., Tynan, E., Torres-Valdes, S., Lherminier, P., Treguer, P., and Sarthou, G.: Composition of freshwater in the spring of 2014 on the southern Labrador shelf and slope, J. Geophys. Res.-Ocean., 122, 1102–1121, https://doi.org/10.1002/2016JC012244, 2017.
Blais, M., Tremblay, J.-É., Jungblut, A. D., Gagnon, J., Martin, J., Thaler, M., and Lovejoy, C.: Nitrogen fixation and identification of potential diazotrophs in the Canadian Arctic, Global Biogeochem. Cy., 26, GB3022, https://doi.org/10.1029/2011GB004096, 2012.
Böhlke, J. K., Mroczkowski, S. J., and Coplen, T. B.: Oxygen isotopes in nitrate: new reference materials for 18O : 17O : 16O measurements and observations on nitrate-water equilibration, Rapid Commun. Mass Sp., 17, 1835–1846, https://doi.org/10.1002/rcm.1123, 2003.
Bourke, R. H., Addison, V. G., and Paquette, R. G.: Oceanography of Nares Strait and northern Baffin Bay in 1986 with emphasis on deep and bottom water formation, J. Geophys. Res., 94, 8289–8302, https://doi.org/10.1029/JC094iC06p08289, 1989.
Brandes, J. A. and Devol, A. H.: Isotopic fractionation of oxygen and nitrogen in coastal marine sediments, Geochim. Cosmochim. Ac., 61, 1793–1801, https://doi.org/10.1016/S0016-7037(97)00041-0, 1997.
Brown, Z. W., Casciotti, K. L., Pickart, R. S., Swift, J. H., and Arrigo, K. R.: Aspects of the marine nitrogen cycle of the Chukchi Sea shelf and Canada Basin, Deep-Sea Res. Pt. II, 118, 73–87, https://doi.org/10.1016/j.dsr2.2015.02.009, 2015.
Buchwald, C., Santoro, A. E., McIlvin, M. R., and Casciotti, K. L.: Oxygen isotopic composition of nitrate and nitrite produced by nitrifying cocultures and natural marine assemblages, Limnol. Oceanogr., 57, 1361–1375, https://doi.org/10.4319/lo.2012.57.5.1361, 2012.
Carmack, E. C. and McLaughlin, F. A.: Towards recognition of physical and geochemical change in Subarctic and Arctic Seas, Prog. Oceanogr., 90, 90–104, https://doi.org/10.1016/j.pocean.2011.02.007, 2011.
Carmack, E. C., Yamamoto-Kawai, M., Haine, T. W. N., Bacon, S., Bluhm, B. A., Lique, C., Melling, H., Polyakov, I. V., Straneo, F., Timmermans, M. L., and Williams, W. J.: Freshwater and its role in the Arctic Marine System: Sources, disposition, storage, export, and physical and biogeochemical consequences in the Arctic and global oceans, J. Geophys. Res.-Biogeo., 121, 675–717, https://doi.org/10.1002/2015JG003140, 2016.
Casciotti, K. L., Sigman, D. M., Hastings, M. G., Böhlke, J. K., and Hilkert, A.: Measurement of the oxygen isotopic composition of nitrate in seawater and freshwater using the denitrifier method, Anal. Chem., 74, 4905–4912, https://doi.org/10.1021/ac020113w, 2002.
Casciotti, K. L., Trull, T. W., Glover, D. M., and Davies, D.: Constraints on nitrogen cycling at the subtropical North Pacific Station ALOHA from isotopic measurements of nitrate and particulate nitrogen, Deep-Sea Res. Pt. II, 55, 1661–1672, https://doi.org/10.1016/j.dsr2.2008.04.017, 2008.
Chang, B. X. and Devol, A. H.: Seasonal and spatial patterns of sedimentary denitrification rates in the Chukchi sea, Deep-Sea Res. Pt. II, 56, 1339–1350, https://doi.org/10.1016/j.dsr2.2008.10.024, 2009.
Colbourne, E., Holden, J., Senciall, D., Bailey, W., Snook, S., and Higdon, J.: Physical Oceanographic Conditions on the Newfoundland and Labrador Shelf during 2015, DFO Can. Sci. Advis. Sec. Res. Doc., 2016/079, v +40 p., 2016.
Cormier. M.-A., Rochon, A., de Vernal, A., and Gélinas, Y.: Multi-proxy study of primary production and paleoceanographical conditions in northern Baffin Bay during the last centuries, Mar. Micropaleontol., 127, 1–10, https://doi.org/10.1016/j.marmicro.2016.07.001, 2020.
Cuny, J., Rhines, P. B., Niiler, P. P., and Bacon, S.: Labrador Sea Boundary Currents and the Fate of the Irminger Sea Water, J. Phys. Oceanogr., 32, 627–647, https://doi.org/10.1175/1520-0485(2002)032{%}3C0627:LSBCAT{%}3E2.0.CO;2, 2002.
de la Vega, C., Mahaffey, C., Tuerena, R. E., Yurkowski, D. J., Ferguson, S. H., Stenson, G. B., Nordøy, E. S., Haug, T., Biuw, M., Smout, S., Hopkins, J., Tagliabue, A., and Jeffreys, R. M.: Arctic seals as tracers of environmental and ecological change, Limnol. Oceanogr. Lett., 6, 24–32, https://doi.org/10.5285/66AAF3C8-FA58-41DE-8EF1-480A2E125408, 2021.
Deutsch, C., Gruber, N., Key, R. M., Sarmiento, J. L., and Ganachaud, A.: Denitrification and N2 fixation in the Pacific Ocean, Global Biogeochem. Cy., 15, 483–506, https://doi.org/10.1029/2000GB001291, 2001.
Devol, A. H., Codispoti, L. A., and Christensen, J. P.: Summer and winter denitrification rates in western Arctic shelf sediments, Cont. Shelf Res., 17, 1029–1050, https://doi.org/10.1016/S0278-4343(97)00003-4, 1997.
Drinkwater, K. F., Belgrano, A., Borja, A., Conversi, A., Edwards, M., Greene, C. H., Otterson, G., Pershing, A. J., and Walker, H.: The Response of Marine Ecosystems to Climate Variability Associated With the North Atlantic Oscillation, Geophys. Monog.-Am. Geophys. Union, 134, 211–234, https://doi.org/10.1029/134GM10, 2003.
Ferland, J., Gosselin, M., and Starr, M.: Environmental control of summer primary production in the Hudson Bay system: The role of stratification, J. Mar. Syst., 88, 385–400, https://doi.org/10.1016/j.jmarsys.2011.03.015, 2011.
Fragoso, G. M., Poulton, A. J., Yashayaev, I. M., Head, E. J. H., and Purdie, D. A.: Spring phytoplankton communities of the Labrador Sea (2005–2014): pigment signatures, photophysiology and elemental ratios, Biogeosciences, 14, 1235–1259, https://doi.org/10.5194/bg-14-1235-2017, 2017.
Frajka-Williams, E. and Rhines, P. B.: Physical controls and interannual variability of the Labrador Sea spring phytoplankton bloom in distinct regions, Deep-Sea Res. Pt. I, 57, 541–552, https://doi.org/10.1016/j.dsr.2010.01.003, 2010.
Fratantoni, P. S. and Pickart, R. S.: The Western North Atlantic Shelfbreak Current System in Summer, J. Phys. Oceanogr., 37, 2509–2533, https://doi.org/10.1175/JPO3123.1, 2007.
Fripiat, F., Declercq, M., Sapart, C. J., Anderson, L. G., Bruechert, V., Deman, F., Fonseca-Batista, D., Humborg, C., Roukaerts, A., Semiletov, I. P., and Dehairs, F.: Influence of the bordering shelves on nutrient distribution in the Arctic halocline inferred from water column nitrate isotopes, Limnol. Oceanogr., 63, 2154–2170, https://doi.org/10.1002/lno.10930, 2018.
Galbraith, E. D. and Kienast, M.: The acceleration of oceanic denitrification during deglacial warming, Nat. Geosci., 6, 579–584, https://doi.org/10.1038/ngeo1832, 2013.
Gonfiantini, R.: Stable Isotope Reference Samples for Geochemical and Hydrological Investigations, Int. J. Appl. Radiat. Is., 35, 426, https://doi.org/10.1016/0020-708X(84)90059-0, 1984.
Granger, J. and Wankel, S. D.: Isotopic overprinting of nitrification on denitrification as a ubiquitous and unifying feature of environmental nitrogen cycling, P. Natl. Acad. Sci. USA, 113, E6391–E6400. https://doi.org/10.1073/pnas.1601383113, 2016
Granger, J., Sigman, D. M., Needoba, J. A., and Harrison, P. J.: Coupled nitrogen and oxygen isotope fractionation of nitrate during assimilation by cultures of marine phytoplankton, Limnol. Oceanogr., 49, 1763–1773, https://doi.org/10.4319/lo.2004.49.5.1763, 2004.
Granger, J., Sigman, D. M., Lehmann, M. F., and Tortell, P. D.: Nitrogen and oxygen isotope fractionation during dissimilatory nitrate reduction by denitrifying bacteria, Limnol. Oceanogr., 53, 2533–2545, https://doi.org/10.4319/lo.2008.53.6.2533, 2008.
Granger, J., Prokopenko, M. G., Sigman, D. M., Mordy, C. W., Morse, Z. M., Morales, L. V., Sambrotto, R. N., and Plessen, B.: Coupled nitrification-denitrification in sediment of the eastern Bering Sea shelf leads to 15N enrichment of fixed N in shelf waters, J. Geophys. Res.-Ocean., 116, C11006, https://doi.org/10.1029/2010JC006751, 2011.
Granger, J., Sigman, D. M., Gagnon, J., Tremblay, J.-E., and Mucci, A.: On the Properties of the Arctic Halocline and Deep Water Masses of the Canada Basin from Nitrate Isotope Ratios, J. Geophys. Res.-Ocean., 123, 5443–5458, https://doi.org/10.1029/2018JC014110, 2018.
Grasshoff, K.: A simultaneous multiple channel system for nutrient analysis in seawater with analog and digital analog record, Adv. Autom. Anal. Tech. Int. Conf., 11, 133–145, 1969.
Greene, C. H., Meyer-Gutbrod, E., Monger, B. C., McGarry, L. P., Pershing, A. J., Belkin, I. M., Fratantoni, P. S., Mountain, D. G., Pickart, R. S., Proshutinsky, A., Ji, R., Bisagni, J. J., Hakkinen, S. M. A., Haidvogel, D. B., Wang, J., Head, E., Smith, P., Reid, P. C., and Conversi, A.: Remote climate forcing of decadal-scale regime shifts in Northwest Atlantic shelf ecosystems, Limnol. Oceanogr., 58, 803–816, https://doi.org/10.4319/lo.2013.58.3.0803, 2013.
Gruber, N. and Sarmiento, J. L.: Global patterns of marine nitrogen fixation and denitrification, Global Biogeochem. Cy., 11, 235–266, https://doi.org/10.1029/97GB00077, 1997.
Hansen, J., H., Hedeholm, R. B., Sünksen, K., Christensen, J. T., and Grønkjær, P: Spatial variability of carbon (δ13C) and nitrogen (δ15N) stable isotope ratios in an Arctic marine food web, Mar. Ecol. Prog. Ser., 467, 47–57, https://doi.org/10.3354/meps09945, 2012.
Hansen, M. O., Nielsen, T. G., Stedmon, C. A., and Munkm, P.: Oceanographic regime shift during 1997 in Disko Bay, Western Greenland, Limnol. Oceanogr., 57, 634–644, https://doi.org/10.4319/lo.2012.57.2.0634, 2012.
Harding, K., Turk-Kubo, K. A., Sipler, R. E., Mills, M. M., Bronk, D. A., and Zehr, J. P.: Symbiotic unicellular cyanobacteria fix nitrogen in the Arctic Ocean, P. Natl. Acad. Sci. USA, 115, 13371–13375, https://doi.org/10.1073/pnas.1813658115, 2018.
Harrison, W. G. and Li, W. K. W.: Phytoplankton Growth and Regulation in the Labrador Sea: Light and Nutrient Limitation, J. Northw. Atl. Fish. Sci., 39, 71–82, https://doi.org/10.2960/J.v39.m592, 2008.
Harrison, W. G., Platt, T., and Irwin, B.: Primary Production and Nutrient Assimilation by Natural Phytoplankton Populations of the Eastern Canadian Arctic, Can. J. Fish. Aquat. Sci., 39, 335–345, https://doi.org/10.1139/f82-046, 1982.
Harrison, W. G., Børsheim, K. Y., Li, W. K., Maillet, G. L., Pepin, P., Sakshaug, E., Skogen, M. D., and Yeats, P. A.: Phytoplankton production and growth regulation in the Subarctic North Atlantic: A comparative study of the Labrador Sea-Labrador/Newfoundland shelves and Barents/Norwegian/Greenland seas and shelves, Prog. Oceanogr., 114, 26–45, https://doi.org/10.1016/j.pocean.2013.05.003, 2013.
Hedeholm, R., Grønkjær, P., and Rysgaard, S.: Feeding ecology of capelin (Mallotus villosus Muller) in West Greenland waters, Polar Biol., 35, 1533–1543, https://doi.org/10.1007/s00300-012-1193-4, 2012.
Jakobsen, P. K., Ribergaard, M. H., Quadfasel, D., Schmith, T., and Hughes, C. W.: Near-surface circulation in the northern North Atlantic as inferred from Lagrangian drifters: Variability from the mesoscale to interannual, J. Geophys. Res., 108, 3251, https://doi.org/10.1029/2002JC001554, 2003.
Jenkins, W. J., Smethie, W. M., Boyle, E. A., and Cutter, G. A.: Water mass analysis for the U.S. GEOTRACES (GA03) North Atlantic sections, Deep-Sea Res. Pt. II, 116, 6–20, https://doi.org/10.1016/j.dsr2.2014.11.018, 2015.
Jones, E. P.: Tracing Pacific water in the North Atlantic Ocean, J. Geophys. Res., 108, 3116, https://doi.org/10.1029/2001JC001141, 2003.
Jones, E. P., Anderson, L. G., and Swift, J. H.: Distribution of Atlantic and Pacific waters in the upper Arctic Ocean: Implications for circulation, Geophys. Res. Lett., 25, 765–768, https://doi.org/10.1029/98GL00464, 1998.
Kelley, D. and Richards, C.: oce: Analysis of Oceanographic Data, R package version 0.9-22, available at: https://cran.r-project.org/web/packages/oce/oce.pdf (last access: 20 July 2021), 2017.
Kienast, M., Davin, S., Doering, K., Hebbeln, D., Kienast, S., Lehmann, N., Schneider, R., Sherwood, O., and Weiser, J.: Isotopic evidence for changes in the origin and cycling of nitrogen in the Labrador Sea during the last 8,000 years, EGU General Assembly Online, 4–8 May 2020, EGU2020–12134, https://doi.org/10.5194/egusphere-egu2020-12134, 2020.
Klein, B., LeBlanc, B., Mei, Z.-P., Beret, R., Michaud, J., Mundy, C.-J., von Quillfeldt, C. H., Garneau, M.-È., Roy, S., and Gratton, Y.: Phytoplankton biomass, production and potential export in the North Water, Deep-Sea Res. Pt. II, 49, 4983–5002, https://doi.org/10.1016/S0967-0645(02)00174-1, 2002.
Lalande, C., Forest, A., Barber, D. G., Gratton, Y., and Fortier, L.: Variability in the annual cycle of vertical particulate organic carbon export on Arctic shelves: Contrasting the Laptev Sea, Northern Baffin Bay and the Beaufort Sea, Cont. Shelf Res., 29, 2157–2165, https://doi.org/10.1016/j.csr.2009.08.009, 2009.
Lehmann, M. F., Bernasconi, S. F., Barbieri, A., and McKenzie, J. A.: Preservation of organic matter and alteration of its carbon and nitrogen isotope composition during simulated and in situ early sedimentary diagenesis, Geochim. Cosmochim. Ac., 66, 3573–3584, https://doi.org/10.1016/S0016-7037(02)00968-7, 2002.
Lehmann, M. F., Sigman, D. M., McCorkle, D. C., Brunelle, B. G., Hoffmann, S., Kienast, M., Cane, G., and Clement, J.: Origin of the deep Bering Sea nitrate deficit: Constraints from the nitrogen and oxygen isotopic composition of water column nitrate and benthic nitrate fluxes, Global Biogeochem. Cy., 19, GB4005, https://doi.org/10.1029/2005GB002508, 2005.
Lehmann, M. F., Sigman, D. M., McCorkle, D. C., Granger, J., Hoffmann, S., Cane, G., and Brunelle, B. B.: The distribution of nitrate 15N : 14N in marine sediments and the impact of benthic nitrogen loss on the isotopic composition of oceanic nitrate, Geochim. Cosmochim. Ac., 71, 5384–5404, https://doi.org/10.1016/j.gca.2007.07.025, 2007.
Lehmann, N., Granger, J., Kienast, M., Brown, K. S., Rafter, P. A., Martinez Mendes, G. M., and Mohtadi, M.: Isotopic Evidence for the Evolution of Subsurface Nitrate in the Western Equatorial Pacific, Geophys. Res. Ocean., 123, https://doi.org/10.1002/2017JC013527, 2018.
Lehmann, N., Kienast, M., Granger, J., Bourbonnais, A., Altabet, M. A., and Tremblay, J.-É.: Remote western Arctic nutrients fuel remineralization in deep Baffin Bay, Global Biogeochem. Cy., 33, 649–667, https://doi.org/10.1029/2018GB006134, 2019.
Limoges, A., Weckström, K., Ribeiro, S., Georgiadis, E., Hansen, K. E., Martinez, P., Seidenkrantz, M.-S., Giraudeau, J., Crosta, X., and Massé, G.: Learning from the past: Impact of the Arctic Oscillation on sea ice and marine productivity off northwest Greenland over the last 9,000 years, Glob. Change Biol., 26, 6767–6786, https://doi.org/10.1111/gcb.15334, 2020.
Macdonald, R. W., Anderson, L. G., Christensen, J. P., Miller, L. A., Semiletov, I. P., and Stein, R.: Polar margins: the Arctic Ocean. Carbon and nutrient fluxes in continental margins: a global synthesis, 291–303, https://doi.org/10.1007/978-3-540-92735-8_6, 2010.
Marconi, D., Weigand, M. A., Rafter, P. A., McIlvin, M. R., Forbes, M., Casciotti, K. L., and Sigman, D. M.: Nitrate isotope distributions on the US GEOTRACES North Atlantic cross-basin section: Signals of polar nitrate sources and low latitude nitrogen cycling, Mar. Chem., 177, 143–156, https://doi.org/10.1016/j.marchem.2015.06.007, 2015.
Martin, J., Tremblay, J.-É., Gagnon, J., Tremblay, G., Lapoussière, A., Jose, C., Poulin, M., Gosselin, M., Gratton, Y., and Michel, C.: Prevalence, structure and properties of subsurface chlorophyll maxima in Canadian Arctic waters, Mar. Ecol. Prog. Ser., 412, 69–84, https://doi.org/10.3354/meps08666, 2010.
McIlvin, M. R. and Casciotti, K. L.: Fully automated system for stable isotopic analyses of dissolved nitrous oxide at natural abundance levels, Limnol. Oceanogr. Method., 8, 54–66, https://doi.org/10.4319/lom.2010.8.54, 2010.
McIlvin, M. R. and Casciotti, K. L.: Technical Updates to the Bacterial Method for Nitrate Isotopic Analyses, Anal. Chem., 83, 1850–1856, https://doi.org/10.1021/ac1028984, 2011.
McLaughlin, F. A., Carmack, E. C., Macdonald, R. W., and Bishop, J. K. B.: Physical and geochemical properties across the Atlantic/Pacific water mass front in the southern Canadian Basin, J. Geophys. Res.-Ocean., 101, 1183–1197, https://doi.org/10.1029/95JC02634, 1996.
McLaughlin, F. A., Carmack, E. C., Macdonald, R. W., Melling, H., Swift, J. H., Wheeler, P. A., Sherr, B. F., and Sherr, E. B.: The joint roles of Pacific and Atlantic-origin waters in the Canada Basin, 1997–1998, Deep-Sea Res. Pt. I, 51, 107–128, https://doi.org/10.1016/j.dsr.2003.09.010, 2004.
Michel, C., Gosselin, M., and Nozais, C.: Preferential sinking export of biogenic silica during the spring and summer in the North Water Polynya (northern Baffin Bay): Temperature or biological control?, J. Geophys. Res., 107, 3064, https://doi.org/10.1029/2000JC000408, 2002.
Mills, M. M., Brown, Z. W., Lowry, K. E., van Dijken, G. L., Becker, S., Pal,S., Benitez-Nelson, C. R., Downer, M. M., Strong, A. L., Swift, J. H., Pickart, R. S., and Arrigo, K. R.: Impacts of low phytoplankton NO : PO utilization ratios over the Chukchi Shelf, Arctic Ocean, Deep-Sea Res. Pt. II, 118, 105–121, https://doi.org/10.1016/j.dsr2.2015.02.007, 2015.
Minagawa, M. and Wada, E.: Stepwise enrichment of 15N along food chains: Further evidence and the relation between δ15N and animal age, Geochim. Cosmochim. Ac., 48, 1135–1140, https://doi.org/10.1016/0016-7037(84)90204-7, 1984.
Münchow, A., Falkner, K. K., and Melling, H.: Baffin island and west Greenland current systems in northern Baffin bay, Prog. Oceanogr., 132, 305–317, https://doi.org/10.1016/j.pocean.2014.04.001, 2015.
Muzuka, A. N. and Hillaire-Marcel, C.: Burial rates of organic matter along the eastern Canadian margin and stable isotope constraints on its origin and diagenetic evolution, Mar. Geol., 160, 251–270, https://doi.org/10.1016/S0025-3227(99)00022-5, 1999.
Needoba, J. A., Waser, N. A., Harrison, P. J., and Calvert, S. E.: Nitrogen isotope fractionation in 12 species of marine phytoplankton during growth on nitrate, Mar. Ecol. Prog. Ser., 255, 81–91 https://doi.org/10.3354/meps255081, 2003.
Olsen, A., Lange, N., Key, R. M., Tanhua, T., Álvarez, M., Becker, S., Bittig, H. C., Carter, B. R., Cotrim da Cunha, L., Feely, R. A., van Heuven, S., Hoppema, M., Ishii, M., Jeansson, E., Jones, S. D., Jutterström, S., Karlsen, M. K., Kozyr, A., Lauvset, S. K., Lo Monaco, C., Murata, A., Pérez, F. F., Pfeil, B., Schirnick, C., Steinfeldt, R., Suzuki, T., Telszewski, M., Tilbrook, B., Velo, A., and Wanninkhof, R.: GLODAPv2.2019 – an update of GLODAPv2, Earth Syst. Sci. Data, 11, 1437–1461, https://doi.org/10.5194/essd-11-1437-2019, 2019.
Ostrom, N. E., Macko, S. A., Deibel, D., and Thompson, R. J.: Seasonal variation in the stable carbon and nitrogen isotope biogeochemistry of a coastal cold ocean environment, Geochim. Cosmochim. A., 61, 2929–2942, https://doi.org/10.1016/S0016-7037(97)00131-2, 1997.
Pepin, P., Maillet, G., Fraser, S., Shears, T., and Redmond, G.: Optical, chemical, and biological oceanographic conditions on the Newfoundland and Labrador Shelf during 2011–2012, DFO Can. Sci. Advis. Sec. Res. Doc. 2013/051, v + 38 p., 2013.
Peters, B. D., Lam, P. J., and Casciotti, K. L.: Nitrogen and oxygen isotope measurements of nitrate along the US GEOTRACES Eastern Pacific Zonal Transect (GP16) yield insights into nitrate supply, remineralization, and water mass transport, Mar. Chem., 201, 137–150, https://doi.org/10.1016/j.marchem.2017.09.009, 2018.
Prinsenberg, S. J. and Hamilton, J.: Monitoring the volume, freshwater and heat fluxes passing through Lancaster sound in the Canadian arctic archipelago, Atmos. Ocean, 43, 1–22, https://doi.org/10.3137/ao.430101, 2005.
Rafter, P. A. and Sigman, D. M.: Spatial distribution and temporal variation of nitrate nitrogen and oxygen isotopes in the upper equatorial Pacific Ocean, Limnol. Oceanogr. 61, 14–31, https://doi.org/10.1002/lno.10152, 2016.
Robinson, R. S., Kienast, M., Luiza Albuquerque, A., Altabet, M., Contreras, S., De Pol Holz, R., Dubois, N., Francois, R., Galbraith, E., Hsu, T.-C., Ivanochko, T., Jaccard, S., Kao, S.-J., Kiefer, T., Kienast, S., Lehmann, M., Martinez, P., McCarthy, M., Möbius, J., Pedersen, T., Quan, T. M., Ryabenko, E., Schmittner, A., Schneider, R., Schneider-Mor, A., Shigemitsu, M., Sinclair, D., Somes, C., Studer, A., Thunell, R., and Yang, J.-Y: A review of nitrogen isotopic alteration in marine sediments, Paleoceanography, 27, PA4203, https://doi.org/10.1029/2012PA002321, 2012.
Rysgaard, S., Boone, W., Carlson, D., Sejr, M. K., Bendtsen, J., Juul-Pedersen, T., Lund, H., Meire, L., and Mortensen, J.: An Updated View on Water Masses on the pan-West Greenland Continental Shelf and Their Link to Proglacial Fjords, J. Geophys. Res.-Ocean., 125, e2019JC015564, https://doi.org/10.1029/2019JC015564, 2020.
Sherwood, G. D. and Rose, G. A.: Stable isotope analysis of some representative fish and invertebrates of the Newfoundland and Labrador continental shelf food web, Estuar. Coast. Shelf S., 63, 537–549, https://doi.org/10.1016/j.ecss.2004.12.010, 2005.
Sherwood, O. A., Jamieson, R. E., Edinger, E. N., and Wareham, V. E.: Stable C and N isotopic composition of cold-water corals from the Newfoundland and Labrador continental slope: Examination of trophic, depth and spatial effects, Deep-Sea Res. Pt. I, 55, 1392–1402, https://doi.org/10.1016/j.dsr.2008.05.013, 2008.
Sherwood, O. A., Lehmann, M. F., Schubert, C. J., Scott, D. B., and McCarthy, M. D.: Nutrient regime shift in the western North Atlantic indicated by compound-specific δ15N of deep-sea gorgonian corals, P. Natl. Acad. Sci. USA, 108, 1011–1015, https://doi.org/10.1073/pnas.1004904108, 2011.
Sherwood, O. A., Davin, S. H., Lehmann, N., Buchwald, C., Edinger, E. N., Lehmann, M. F., and Kienast, M.: Data to accompany “Stable isotope ratios in seawater nitrate reflect the influence of Pacific water along the northwest Atlantic margin”, (Version v1) [Data set], Biogeosciences, Zenodo [data set], https://doi.org/10.5281/zenodo.5129246, last access: 27 July 2021.
Sigman, D. M., Casciotti, K. L., Andreani, M., Barford, C., Galanter, M., and Böhlke, J. K.: A bacterial method for the nitrogen isotopic analysis of nitrate in seawater and freshwater, Anal. Chem., 73, 4145–4153, https://doi.org/10.1021/ac010088e, 2001.
Sigman, D. M., Granger, J., DiFiore, P. J., Lehmann, M. M., Ho, R., Cane, G., and van Geen, A.: Coupled nitrogen and oxygen isotope measurements of nitrate along the eastern North Pacific margin, Global Biogeochem. Cy., 19, GB4022, https://doi.org/10.1029/2005GB002458, 2005.
Sigman, D. M., DiFiore, P. J., Hain, M. P., Deutsch, C., Wang, Y., Karl, D. M., Knapp, A. N., Lehmann, M. F., and Pantoja, S.: The dual isotopes of deep nitrate as a constraint on the cycle and budget of oceanic fixed nitrogen, Deep-Sea Res. Pt. I, 56, 1419–1439, https://doi.org/10.1016/j.dsr.2009.04.007, 2009.
Sipler, R. E., Gong, D., Baer, S. E., Sanderson, M. P., Roberts, Q. N., Mulholland, M. R., and Bronk, D. A.: Preliminary estimates of the contribution of Arctic nitrogen fixation to the global nitrogen budget, Limnol. Oceanogr. Lett., 2, 159–166, https://doi.org/10.1002/lol2.10046, 2017.
Steele, M., Morison, J., Ermold, W., Rigor, I., Ortmeyer, M., and Shimada, K.: Circulation of summer Pacific halocline water in the Arctic Ocean, J. Geophys. Res.-Ocean., 109, C02027, https://doi.org/10.1029/2003JC002009, 2004.
Stramma, L., Kieke, D., Rhein, M., Schott, F., Yashayaev, I., and Koltermann, K. P.: Deep water changes at the western boundary of the subpolar North Atlantic during 1996 to 2001, Deep-Sea Res. Pt. I, 51, 1033–1056, https://doi.org/10.1016/j.dsr.2004.04.001, 2004.
Straneo, F. and Saucier, F.: The outflow from Hudson Strait and its contribution to the Labrador Current, Deep-Sea Res. Pt. I, 55, 926–946, https://doi.org/10.1016/j.dsr.2008.03.012, 2008.
Sutcliffe Jr., W. H., Loucks, R. H., Drinkwater, K. F., and Coote, A. R.: Nutrient Flex onto the Labrador Shelf from Hudson Strait and its Biological Consequences, Can. J. Fish. Aquat. Sci., 40, 1692–1701, https://doi.org/10.1139/f83-196, 1983.
Sutherland, D. A., Pickart, R. S., Peter Jones, E., Azetsu-Scott, K., Jane Eert, A., and Ólafsson, J.: Freshwater composition of the waters off southeast Greenland and their link to the Arctic Ocean, J. Geophys. Res., 114, C05020, https://doi.org/10.1029/2008JC004808, 2009.
Top, Z., Clarke, W. B., Eismont, W. C., and Jones, E. P.: Radiogenic helium in Baffin Bay bottom water, J. Mar. Res., 38, 435–452, 1980.
Tang, C. C., Ross, C. K., Yao, T., Petrie, B., DeTracey, B. M., and Dunlap, E.: The circulation, water masses and sea-ice of Baffin Bay, Prog. Oceanogr., 63, 183–228, https://doi.org/10.1016/j.pocean.2004.09.005, 2004.
Torres-Valdés, S., Tsubouchi, T., Bacon, S., Naveira-Garabato, A. C., Sanders, R., McLaughlin, F. A., Petrie, B., Kattner, G., Azetsu-Scott, K., and Whitledge, T. E.: Export of nutrients from the Arctic Ocean, J. Geophys. Res.-Ocean., 118, 1625–1644, https://doi.org/10.1002/jgrc.20063, 2013.
Townsend, D. W., Pettigrew, N. R., Thomas, M. A., Neary, M. G., McGillicuddy, D. J., and Donnell, J. O.: Water masses and nutrient sources to the Gulf of Maine, J. Mar. Res., 141, 93–122, https://doi.org/10.1357/002224015815848811, 2015.
Tremblay, J.-É., Gratton, Y., Carmack, E. C., Payne, C. D., and Price, N. M.: Impact of the large-scale Arctic circulation and the North Water Polynya on nutrient inventories in Baffin Bay, J. Geophys. Res., 107, https://doi.org/10.1029/2000JC000595, 2002.
Tremblay, J.-É., Anderson, L. G., Matrai, P., Coupel, P., Bélanger, S., Michel, C., and Reigstad, M.: Global and regional drivers of nutrient supply, primary production and CO2 drawdown in the changing Arctic Ocean, Prog. Oceanogr., 139, 171–196, https://doi.org/10.1016/j.pocean.2015.08.009, 2015.
Tremblay, J.-É., Hattori, H., Michel, C., Ringuette, M., Mei, Z. P., Lovejoy, C., Fortier, L., Hobson, K. A., Amiel, D., and Cochran, K.: Trophic structure and pathways of biogenic carbon flow in the eastern North Water Polynya, Prog. Oceanogr., 71, 402–425, https://doi.org/10.1016/j.pocean.2006.10.006, 2006.
Trull, T. W., Davies, D., and Casciotti, K.: Insights into nutrient assimilation and export in naturally iron-fertilized waters of the Southern Ocean from nitrogen, carbon and oxygen isotopes, Deep-Sea Res. Pt. II, 55, 820–840, https://doi.org/10.1016/j.dsr2.2007.12.035, 2008.
Vander Zanden, M. J. and Rasmussen, J. B.: Variation in δ15N and δ13C trophic fractionation: Implications for aquatic food web studies, Limnol. Oceanogr., 46, 2061–2066, https://doi.org/10.4319/lo.2001.46.8.2061, 2001.
Wallace, D. W. R.: A study of the ventilation of Arctic waters using chlorofluoromethanes as tracers, Dalhousie University, Halifax NS, Canada, 1985.
Weiss, R. F.: The solubility of nitrogen, oxygen and argon in water and seawater, Deep-Sea Res., 17, 721–735, https://doi.org/10.1016/0011-7471(70)90037-9, 1970.
Yamamoto-Kawai, M., Carmack, E., and McLaughlin, F.: Nitrogen balance and Arctic throughflow, Nature, 443, 43, https://doi.org/10.1038/443043a, 2006.
Yamamoto-Kawai, M., McLaughlin, F. A., Carmack, E. C., Nishino, S., and Shimada, K.: Freshwater budget of the Canada Basin, Arctic Ocean, from salinity, δ18O, and nutrients, J. Geophys. Res.-Ocean., 113, C01007, https://doi.org/10.1029/2006JC003858, 2008.
Yashayaev, I. and Loder, J. W.: Recurrent replenishment of Labrador Sea Water and associated decadal-scale variability, J. Geophys. Res.-Ocean., 121, 8095–8114, https://doi.org/10.1002/2016JC012046, 2016.